CSR 2013 Annual Results Announcement Apr. 2014. Page 1 This document has been prepared by China...
39
CSR 2013 Annual Results Announcement Apr. 2014
-
Upload
angel-walker -
Category
Documents
-
view
214 -
download
1
Transcript of CSR 2013 Annual Results Announcement Apr. 2014. Page 1 This document has been prepared by China...

CSR 2013 Annual Results
Announcement
Apr. 2014

Page 2
This document has been prepared by China South Locomotive & Rolling Stock Corporation Limited (the “Company”). The information contained in this document has not been independently verified. No representation or warranty express or implied is made as to, and no reliance should be placed on, the fairness, accuracy, completeness or correctness of the information or opinions contained herein. The information contained herein is subject to change, and the Company is under no obligation to correct or update any such forward-looking information or any other information contained in this document. The Company shall not have any liability whatsoever (in negligence or otherwise) for any loss howsoever arising from any use of this document or its contents or otherwise arising in connection with this document.
The information contained in this document related to the Company and other issues may contain forward-looking statements that reflect risks and uncertainties. The opinion and the forward-looking statements concerning China’s economy and transportation equipment manufacturing industry in China and around the world are based on a range of assumption, which are restricted by some known and unknown risks, including the factors that are beyond the Company’s control. Therefore, the actual results may significantly differ from the forward-looking statements or explicit or implicit opinions. None of the Company nor any of its respective affiliates, advisors or representatives shall have any liability to update the above-mentioned opinions or forward-looking statements based on the issues and matters happened after the date of completion of such document.
This presentation document is not intended to constitute an offer to, or a solicitation for offer to, sell, purchase, or subscribe the securities of the Company. This document, as a whole or in part, shall not constitute a basis for any contracts or commitments, which also shall not be used as a reliable source for any contracts or commitment. Any purchase or subscription will be made exclusively by means of the Company’s announcement.
Disclaimer

Table of Content
I 2013 Annual Results Summary
II 2013 Operation Review
III 2013 Financial Performance Review
IV 2014 Outlook

Page 4Page 4
2013 Annual Results Summary

Page 5
Summary of P/L Statement
FY2012 FY2013 Change YoY
Revenue (RMB mn) 89,019 96,525 +8.4%
Gross Profit (RMB mn) 15,755 16,629 +5.5%
Net Profit (RMB mn) 4,009 4,140 +3.3%
Gross Margin (%) 17.7 17.2 -0.5ppt
Operating Margin (%) 6.5 6.3 -0.2ppt
Net Margin (%) 4.5 4.3 -0.2ppt
EPS (RMB cent) 29.9 30.0 +0.3%
DPS (RMB cent) 9.0 9.0 0.0%

Page 6
Summary of B/S
FY2012 FY2013 Change YoY
Total Assets (RMB mn) 105,217 121,129 +15.1%
Total Liabilities (RMB mn) 65,707 74,975 +14.1%
Total Equity (RMB mn) 39,510 46,155 +16.8%
Shareholders’ Equity (RMB mn) 32,755 36,560 +11.6%
Cash (RMB mn) 14,497 14,905 +2.8%
Current Ratio (%) 117% 124% +7ppt
ROE(%) 14.5% 12.0% -2.5ppt
Net Asset Per share (RMB) 2.37 2.65 +11.6%

Page 7
Summary of C/F Statement
FY2012 FY2013 Change YoY
Operating Cash Flow (RMB mn) 2,395 5,412 +126.0%
Investing Cash Flow (RMB mn) -4,246 -7,245 +70.7%
Financing Cash Flow (RMB mn) -5,672 1,473 NA
Net Cash Flow (RMB mn) -7,523 -360 NA

Page 8Page 8
2013 Operation Review

New orders & backlog
Page 9
New OrdersNew Orders
2012 20130
30
60
90
120
150
82
135+65% YoY
RMB bn
Backlog as of Year EndBacklog as of Year End
2012 20130
30
60
90
120
150
78
111+42% YoY
RMB bn

Revenue growth of major segments
RMB MN
RMB MN
Locomotives Passenger Carriages
Freight Wagons
Multiple Units Rapid Transit VehiclesNew Business
YoY +64% YoY -2% YoY +28% YoY +83% YoY +7% YoY -13%YoY +22%
Others
RMB mn
Page 10
RMB MNYOY +38% YOY -15% YOY -5% YOY -11% YOY +4% YOY +22%YOY +20%
Revenue FY13 vs. FY12Revenue FY13 vs. FY12
RMB mn
2012 2013 2012 2013 2012 2013 2012 2013 2012 2013 2012 2013 2012 20134,000 7,000
10,000 13,000 16,000 19,000 22,000
14,396
19,846
7,753
6,590
10,420 9,932
21,524 19,189
7,947 8,251
10,902 13,053
16,079
19,664
Locomotives Passenger Carriages Freight Wag-ons
Multiple Units Rapid Transit Vehicles New Business Others
Revenue 2H13 vs. 2H12Revenue 2H13 vs. 2H12
2H12 2H13 2H12 2H13 2H12 2H13 2H12 2H13 2H12 2H13 2H12 2H13 2H12 2H130
3,000
6,000
9,000
12,000
15,000
8,187
13,441
4,691 4,587 4,611
5,925 7,737
14,143
4,857 5,218 5,494 6,719
11,593 10,051

2011 2012 20130
5,000
10,000
15,000
20,000
25,000
30,000
20,981 21,52419,189
Chart Title
RMBmnUnits
Page 11
Multiple Units RevenueMultiple Units Sales Volume
Multiple Units
MU new orders surged to 269 trains / RMB40.6 billion in China in 2013, market share over
50%.
2013 MU sales 880 units, -8.3%YoY; MU revenue -10.9% YoY, due to low delivery in 1H13.
2H13 MU revenue +82.8%YoY driven by strong orders in 2H13.
Improved platform for inter-city MU trains.
Complete the first prototype car of intelligent HS train in China.
CSR “experimental train of higher speed” attained the laboratory speed of 605km per hour.
Strong new orders in 2013 will support decent growth in 2014.
2011 2012 20130
300
600
900
1,200
904 960 880Chart Title

2011 2012 20130
5,000
10,000
15,000
20,000
25,000
30,000
17,80314,396
19,846
Chart Title
RMBmnUnits
Page 12
Locomotives RevenueLocomotives Sales Volume
Locomotives
2011 2012 20130
300
600
900
1,200
1,500
969
558650
Chart Title
CSR inked orders and delivered high-powered AC locomotives of 459 units, market share >50%.
CSR obtained all the orders from non-railway high-powered AC locomotives In China in 2013.
Locomotives sales 650 units, +16.5%YoY; revenue from locomotives +37.9%YoY in 2013.
Locomotives export to South Africa were produced and delivered in 2013.
Made progress in railway heavy loading capacity, high-speed and AC transmission technology.

2011 2012 20136,000
7,000
8,000
9,000
8,2177,947
8,251Chart Title +3.8%YoY
RMBmn
Page 13
Rapid Transit Vehicles Revenue
Rapid Transit Vehicles
RTV 2013 sales 1,441 units, +7.9%YoY; revenue from RTV +3.8%YoY.
CSR won 20 RTV projects among total 34 RTV projects in 20 cities in China in 2013.
As of YE13, among RTV projects in 28 cities, CSR entered into 21 cities; of which 12 cities
offered CSR exclusive contracts; CSR won 13 out of 27 projects in the RTV traction system
market, leading the market.
R&D focus was on future-oriented and environmental friendly products.

2011 2012 20130
2,000
4,000
6,000
8,000
10,000
12,0009,692
10,420 9,932Chart Title
RMBmnRMBmn
Page 14
Freight Wagons RevenuePassenger Carriages Revenue
Passenger Carriages & Freight Wagons
2011 2012 20130
2,000
4,000
6,000
8,0006,354
7,7536,590Chart Title
CSR passenger carriages 2013 sales 1,366
units; revenue RMB6.59bn, -15.0%YoY.
CSR passenger carriage 2013 new orders
1,418 units.
CSR freight wagons 2013 sales 18,015
units; revenue RMB9.93bn, -4.7%YoY.
In 2013, over 300,000 freight wagons
produced by CSR were running on
China major railway lines.

RMBmn
Page 15
New Business Breakdown in FY13Revenue from New Business
New Business
2011 2012 20130
3,000
6,000
9,000
12,000
15,000
11,637 10,902
13,053Chart Title
New business 2013 revenue RMB13.05bn, +19.7%YoY. CSR delivered c.100 units of wind turbines totaling RMB2bn in 2013, and signed RMB2.09bn contract of wind
power generation motor with Goldwind Science. Annual sales of new energy vehicles exceeded 1,000 units for the first time. Photovoltaic inverter and electric system new contract exceeded RMB200mn in 2013. IGBT product packaging line completed, the first self-developed high-power IGBT product line in China. CSR completed a cross-border acquisition for 55% stake in E+M Drilling Technologies in Germany in August
2013 for truck-mounted drilling rig business. A subsidiary of CSR entered into a purchase agreement in Dec 2013 to acquire the entire rubber and plastic
business of ZF Friedrichshafen AG (the “BOGE”).
Business Revenue (RMB mn)
Chang YoY
Wind Power equipment 2,693 +31%
Construction Machinery 2,648 +10%
Composite materials 2,020 +5%
Auto equipment 2,214 +51%
Others 3,478 +14%
+19.7%YoY

Page 16
Export
CSR inked overseas orders of US$2.23 billion in 2013, record high, with 40 countries
or regions including Argentina, Malaysia, Australia, Kazakhstan and etc. CSR received nearly US$1.0bn MU orders from Argentina, the largest export order of
inter-city MUs in China. In 2013 only, CSR obtained 3 orders from Malaysia market, total US$400mn. Improved overseas marketing network and localized operation.
CSR’s Major Overseas Orders Since 2013
Contract Time Country Customer Type Contract Value (RMBmn)
13-Jan Argentina Ministry of Interior and Transport Inter-city MU 3,43013-Jan Australia Roy Hill Infrastructure Wagon 90013-Jan Mauritania Societe Nationale Industrielle et Miniere Wagon 16013-Jan Nigeria Kintech Nigeria Ltd DMU 10013-May Argentina Ministry of Interior and Transport Inter-city MU 2,24013-Jul Thailand Santi Forestry Co. Ltd Locomotive 37013-Jul Singapore Land Transport Authority Locomotive 17013-Oct Malaysia Ministry of Transport Inter-city MU 96014-Mar South Africa Transnet Locomotive 12,800

Rapid Enhancement in R&D
Total Technology InvestmentTotal Technology Investment
Page 17
Period R&D investment (RMB mn) Chg YoY As % of revenue
2008 1,810 5.1%
2009 2,620 +44.8% 5.7%
2010 3,550 +35.5% 5.5%
2011 4,480 +26.2% 5.6%
2012 4,700 +4.9% 5.2%
2013 5,220 +11.1% 5.3%

Page 18
Major R&D breakthroughs in 2013
Multiple Units: - Completed the first prototype of intelligent high-speed train - “Experimental train of higher speed” attained the lab speed of 605km/hr
Locomotives: - Significant progress in heavy loading capacity, high-speed and AC transmission technology - Launched high-power locomotives with varying axle arrangement and traction powers
Rapid transit vehicles: - Focus on future-oriented and environmentally friendly products development - New technologies for maglev system, super-capacitor storage, permanent magnet motor drive, the articulated bogie technology etc.
Freight wagons: - Trial-produced 27t axle load vehicles outperformed peers in dynamic and compatibility test - Adopted world leading integrated braking device technology in 30t axle load aluminum alloy coal hopper wagon
New business: - Independently developed China’s first EBZ260 vertical axis hard rock boring machine - Completed the first full-load hybrid electric bus and first super-capacitor trolley bus - CSR’s electric business vehicles listed in 2014 national science and technology plan

Maintenance Business
Page 19
Multiple Units: - Taking CRH380A MU for example, in its full life circle of 20 years, it needs 8 times of level III overhaul, 4 times of level IV overhaul and 3 times of level V overhaul. - In 2013, MU maintenance orders obtained by CSR involved 328 MU trains.
Locomotives: - 3 categories locomotive maintenance: overhaul (every 6 years), medium maintenance (every 2 years), and aided repair; - Overhauls and certain medium maintenance should be conducted by manufacturers. - In 2013, CSR obtained repair orders for 1,195 units of locomotives.
Rapid transit vehicles: - Inspection and repair scheme combines scheduled inspection and repair with improvised maintenance.
Passenger Carriages: - Type 25G passenger carriage inspection and repair comprises three categories: A1, A3 (depot repair) and A4 (shop repair); - The cycle of A4 repair: 2.4±0.6 mn km or 10 years operation.
Freight wagons: - Follow the “preventive maintenance plan”, supplemented with condition-based repair.

Page 20Page 20
2013 Financial Performance Review
Revenue GrowthRevenue Growth Product MixProduct Mix
YoY Growth = 8.4%RMB mn
Page 21
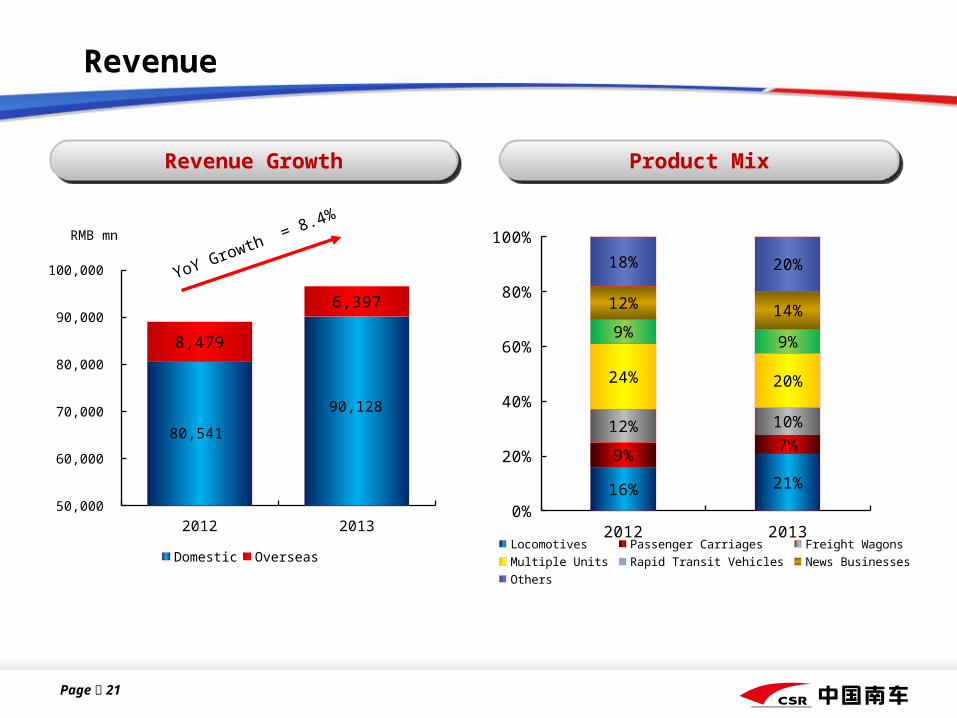
Revenue
2012 201350,000
60,000
70,000
80,000
90,000
100,000
80,541
90,128
8,479
6,397
Domestic Overseas
2012 20130%
20%
40%
60%
80%
100%
16% 21%
9%7%
12% 10%
24% 20%
9%9%
12% 14%
18% 20%
Locomotives Passenger Carriages Freight WagonsMultiple Units Rapid Transit Vehicles News BusinessesOthers

RMB MN
Gross Profit & Gross MarginGross Profit & Gross Margin Net Profit & Net MarginNet Profit & Net Margin
Page 22
RMB mn RMB mn
Profit & Margin Trend
2012 20130
4,000
8,000
12,000
16,000
20,000
0.0%
5.0%
10.0%
15.0%
20.0%
25.0%
15,75516,629
17.7% 17.2%
Gross Profit Gross Margin
2012 20130
1,500
3,000
4,500
6,000
0.0%
2.0%
4.0%
6.0%
8.0%
10.0%
4,010 4,140
4.5% 4.3%
Net Profit Net Margin

2012 201328
29
30
31
29.9 30.0
EPS
EPSEPS Return on EquityReturn on Equity
YoY Growth = 0.3%
RMB cent
Page 23
2012 20130%
4%
8%
12%
16%
20%
14.5%
ROE
12.0%
EPS & ROE

Dividend Distribution
Page 24
RMB mn
Cash DividendCash Dividend
2012 20130
3
6
9
12
15
9 9
DPS
RMB cent
DPSDPS
2012 20130
300
600
900
1,200
1,500
0%
10%
20%
30%
40%
50%
1,242 1,242
31% 30%
Cash dividend Dividend Payout Ratio

Improving Ability of Cost Control
Improving Ability Of Cost Control Improving Ability Of Cost Control
Page 25
2012 20130
3,000
6,000
9,000
12,000
15,000
0.0%
3.0%
6.0%
9.0%
12.0%
15.0%
3,153 3,085
3,042 3,602
4,6464,960
764546
13.0%12.6%
Sales Cost R&D cost Administrative cost Financial Cost % of Total Revenue
RMB mn
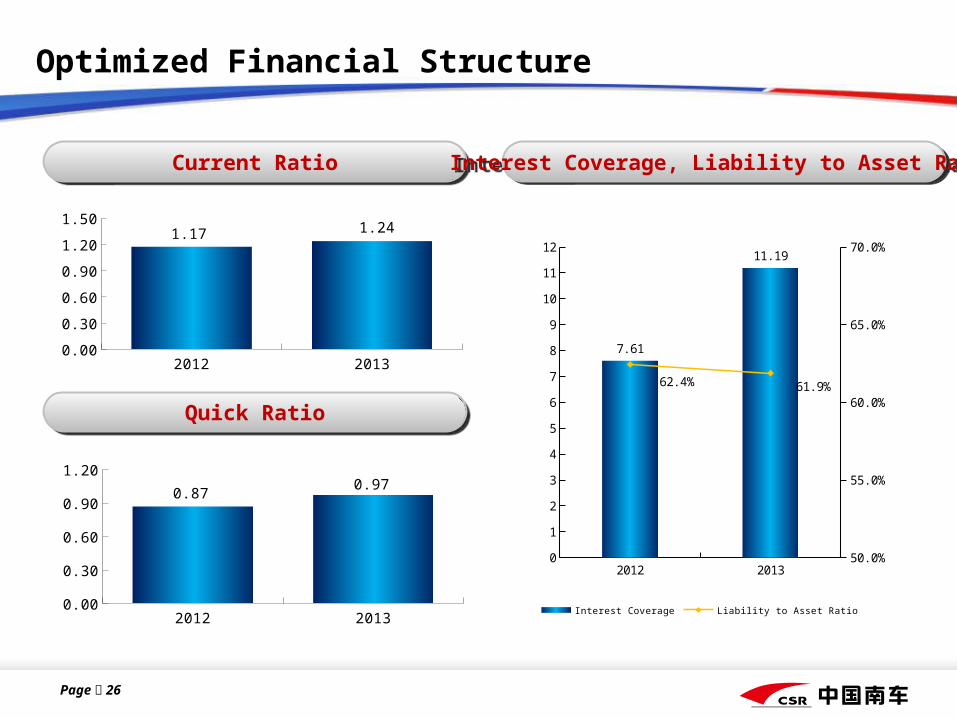
Optimized Financial Structure
Page 26
2012 20130.00
0.30
0.60
0.90
1.20
0.870.97
2012 20130.00
0.30
0.60
0.90
1.20
1.501.17 1.24
Current RatioCurrent Ratio
Quick RatioQuick Ratio
Interest Coverage, Liability to Asset RatioInterest Coverage, Liability to Asset Ratio
2012 20130
1
2
3
4
5
6
7
8
9
10
11
12
50.0%
55.0%
60.0%
65.0%
70.0%
7.61
11.19
62.4% 61.9%
Interest Coverage Liability to Asset Ratio

Turnover Ratio
Page 27
Account ReceivableAccount Receivable InventoryInventory
Note: Sales and delivery of MUs and locomotives to CRC surged in 4Q13, causing
higher receivable and lower inventory as of YE13.
YE12 YE130
10,000
20,000
30,000
40,000
0
40
80
120
160
200
26,619
34,121
109129
Account Receivables
Account Receivables days
DaysRMB mn
YE12 YE130
5,000
10,000
15,000
20,000
25,000
0
40
80
120
160
200
18,770
17,721
94
81
Inventory Inventory Days
DaysRMB mn

Page 28Page 28
2014 Outlook
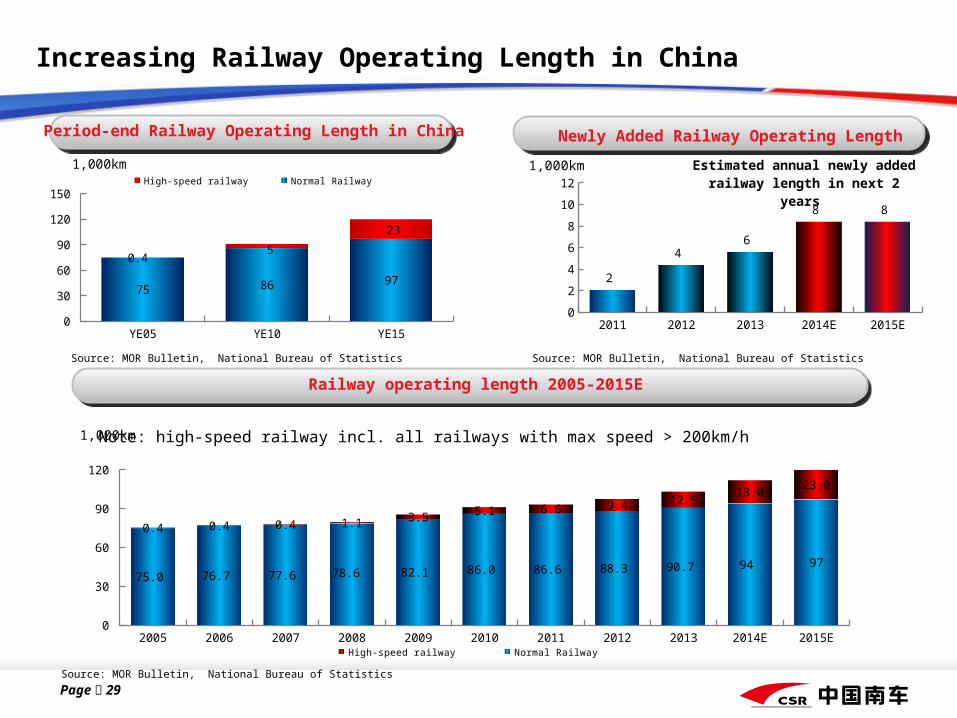
Increasing Railway Operating Length in China
Period-end Railway Operating Length in China
Railway operating length 2005-2015E
1,000km
Source: MOR Bulletin, National Bureau of Statistics
Source: MOR Bulletin, National Bureau of Statistics
Page 29
Newly Added Railway Operating Length
2011 2012 2013 2014E 2015E0
2
4
6
8
10
12
2
4 6
8 8
Estimated annual newly added railway length in next 2 years
1,000km
Source: MOR Bulletin, National Bureau of Statistics
Note: high-speed railway incl. all railways with max speed > 200km/h
YE05 YE10 YE150
30
60
90
120
150
75 86 97
0.45
23
High-speed railway Normal Railway
1,000km
2005 2006 2007 2008 2009 2010 2011 2012 2013 2014E 2015E0
30
60
90
120
75.0 76.7 77.6 78.6 82.1 86.0 86.6 88.3 90.7 94 97
0.4 0.4 0.4 1.1 3.5 5.1 6.6 9.4 12.518.0
23.0
High-speed railway Normal Railway

Investment in Railway Equipment Growing
Railway Basic Construction FAI Railway Upgrading and Vehicle Procurement FAI
Source: MOR/CRC
Page 30
2008 2009 2010 2011 2012 2013E0
200
400
600
800
-40%
-20%
0%
20%
40%
60%
80%
338
600
707
460
519 529
61%
69%
20%
-29%
7% 5%
Railway Basic Construction FAI Chg YoY
2008 2009 2010 2011 2012 2013E0
50
100
150
200
-20%
-10%
0%
10%
20%
30%
40%
79
104
135 135
115
135
0%
31% 30%
0%
-14%
17%
Railway upgrading and vehicle procurement FAI Chg YoY
RMB bnnRMB bnn

Page 31
High-speed Railway (incl. all railways with max speed >200km/h)
YE High-speed Railway Length Newly Added High-speed Railway Length
Source: MOR/CRC
EMU Units in Operation
Source: MoR/CRC
Source: CRC, NBS Source: CRC, NBS
2008 2009 2010 2011 2012 2013 2014E0
3
6
9
12
15
18
0
0.5
1
1.5
2
2.5
1
35
7
9
13
18
205%
48%29%
42% 34% 43%
YE high-speed railway length Chg YoY
1,000 km
High-speed Railway Transport Volume
2008 2009 2010 2011 2012 2013 2014E0
1
2
3
4
5
6
-0.5
0
0.5
1
1.5
2
2.5
0.7
2.3 1.6 1.4
2.7 3.2
5 219%
-33% -9%
92%
17%
58%
Newly-added high-speed railway length Chg YoY
1,000 km
2007 2008 2009 2010 2011 2012 20130
2
4
6
8
10
12
0.00.20.40.60.81.01.21.41.61.82.0
0.7 1.4 2.3
4.4
6.8
8.6 10 1.78
1.24
0.670.86
1.030.92
0.80
EMU units in operation Density of EMU
1,000 Units Units/km
2008 2009 2010 2011 2012 20130
40
80
120
160
200
0%20%40%60%80%100%120%140%160%180%200%
216
46
106
145
1951.8557336621455
1.28497409326425
0.3663076341647770.35
High-speed railway bn passenger.km Chg YoY
bn passenger.km

Page 32
Railway Global Comparison
A gap between China and developed countries for per-capita railway lengthThe second longest railway length in the world
As of YE13 the length of railways in operation of China amounted to around 103,000km, ranking No. 2 in the world. 1.67
0.73 0.59
0.51 0.50 0.41
0.08 0.05 0.0
0.5
1.0
1.5
2.0
Canada US Russia France UK Germany China India
m/per capita
Source: the World Bank, MOR, data above excluding HK, Macau and Taiwan
Source: the World Bank, MOR, data above excluding HK, Macau and Taiwan
1,000km
229
103 85
64 58 34 34 31
0
50
100
150
200
250
US China Russia India Canada Germany France UK

Page 33
Rapid Transit Vehicles Enjoy Unprecedented Development Opportunity
Delivery of rapid transit vehicles in China
Source: Local gov plans, CEIC
Length of MTR in China
2005 2006 2007 2008 2009 2010 2011 2012 20130
1,000
2,000
3,000
4,000
5,000
-40%
-20%
0%
20%
40%
60%
80%
Delivery of rapid transit vehicles in China units YoY Chg %
Units
2000
2001
2002
2003
2004
2005
2006
2007
2008
2009
2010
2011
2012
2013
2020E
0
2,000
4,000
6,000
8,000
10,000
-10%
0%
10%
20%
30%
40%
50%
60%
Length of MTR in China km YoY Chg %
km

Page 34
MTR Global Comparison
Global major cities’ MTR length
Per-capita MTR length
Km/mn person
533
442 402 368 327
305 260
220
0
100
200
300
400
500
600
Shanghai Beij ing London New York Seoul Tokyo Guangzhou Par is
km
48
32 25
23 22 21 20 19
0
10
20
30
40
50
London Seoul Hong Kong Tokyo Shanghai Bei j ing Guangzhou New York
Source: World Metro Database

Page 35
Export Outlook
Highlights:
CSR inked an RMB12.8bn locomotives order from South Africa Transnet in
March 14, China’s historical largest rolling stock export
CRH380A, as a fist product in the Premier’s promotion of China’s high-speed
railway, has become a spectacular card in China’s high-speed railway
diplomacy and also a major model of the high-speed railways of China in
overseas display.
Under the favorable situation brought about by the “high-speed railway
diplomacy” promoted by the PRC government, CSR will achieve more
breakthroughs in high-speed MU export.

Page 36
China’s Railway Diplomacy
Date Country Promoter Progress
13-Oct Thailand Premier LiSigned the Memorandum of Understanding on Deepening Railway Cooperation between China and Thailand
13-Oct Australia Premier LiPromoted China high-speed rail's advanced technology, reliability and cost advantageChina interested in participating in the construction of Australia's first high-speed railway
13-Oct Malaysia President XiEncouraged Chinese companies to participate in Malaysia's high-speed railway construction
13-Nov Hungary/Serbia Premier Li3 countries to cooperate in Belgrade-Budapest railway construction
13-Nov Romania Premier Li China likely to export high-speed rail technology to Romania
13-Dec UK Premier Li China likely to invest GBP50bn in UK's HS2 high-speed railway
14-Mar Europe President Xi Promoted China high-speed rail technology export

Page 37
2014 Business Plan
Promote enterprise reform and development
Step up innovation
Reinforce scientific management
Expand the market and development area
Strengthen the soft power of the enterprise
2014 revenue
growth target: over 10%
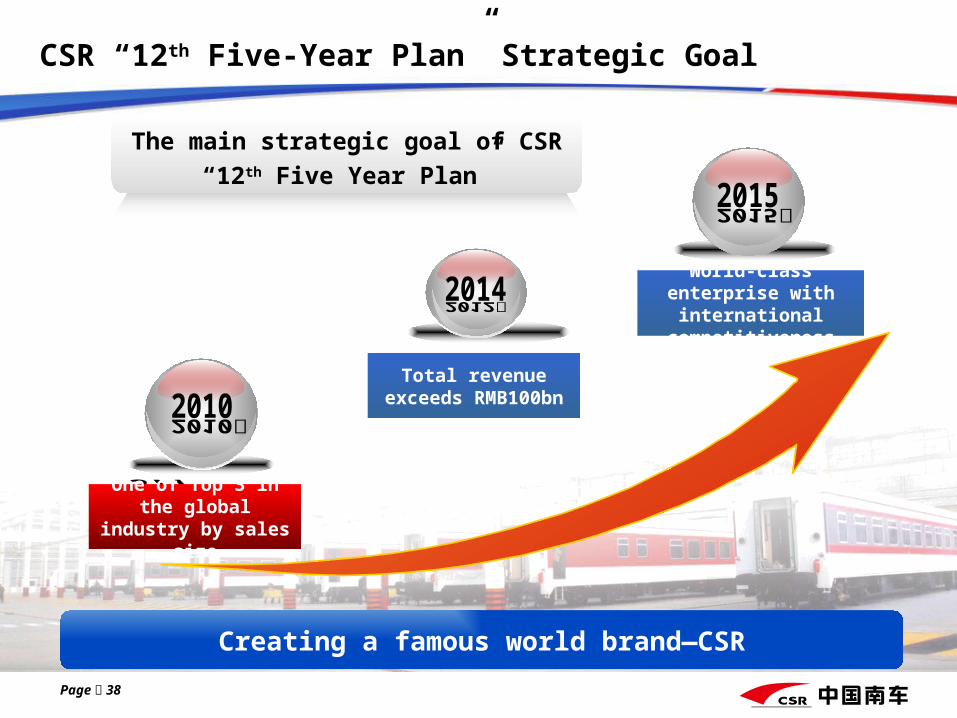
Page 38
The main strategic goal of CSR “12th Five Year Plan”
One of Top 3 in the global
industry by sales size
Total revenue exceeds
RMB100bn
World-class enterprise with international
competitiveness
CSR “12th Five-Year Plan” Strategic Goal
Creating a famous world brand—CSR

Page 39Page 39
Thank You