


CSA’s Growing Pains
31
description
CSA’s Growing Pains. Analysis by Steve Bryan [email protected]. Crash Accountability. Analysis by Steve Bryan [email protected]. DOT Reportable. State Disparity – Enforcement . Analysis by Steve Bryan [email protected]. RETURN. RETURN. RETURN. RETURN. - PowerPoint PPT Presentation
Transcript of CSA’s Growing Pains

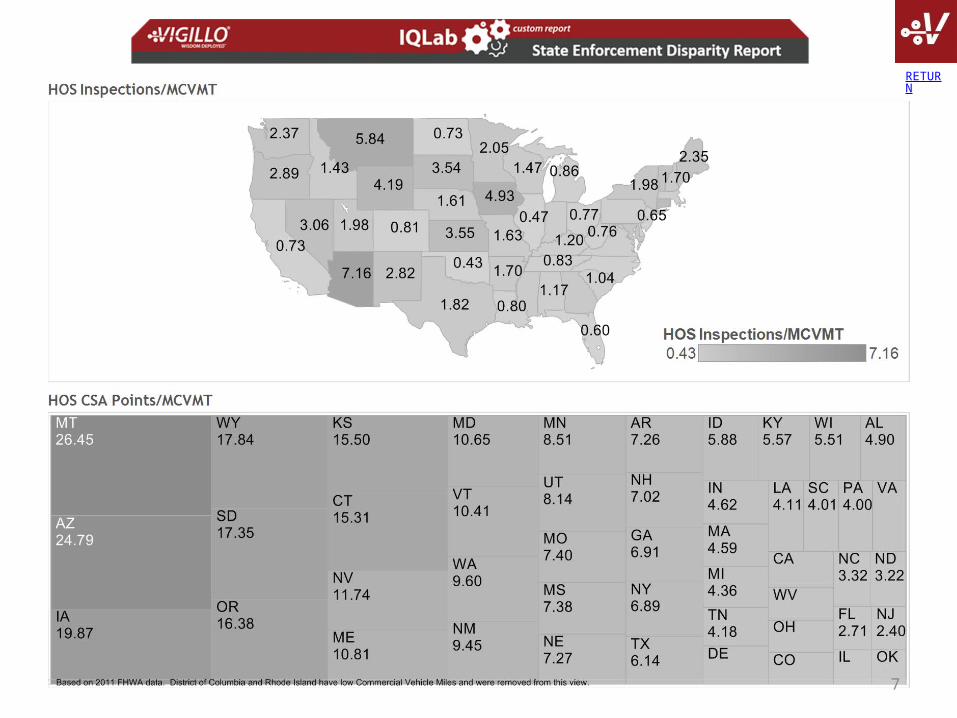
DOT Reportable
RETURN
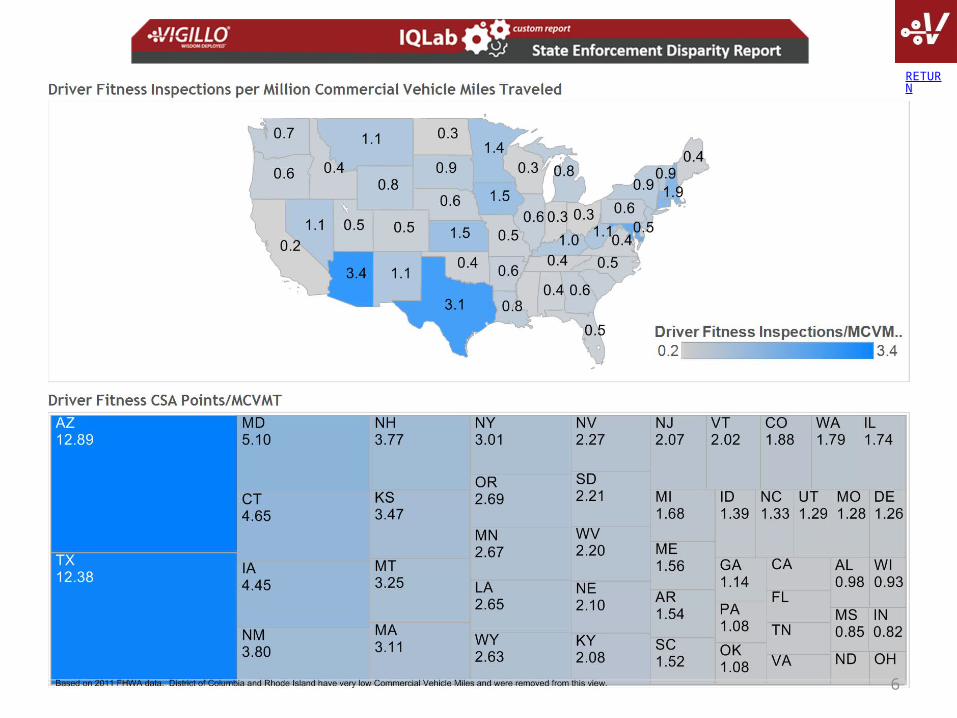
6
RETURN
7
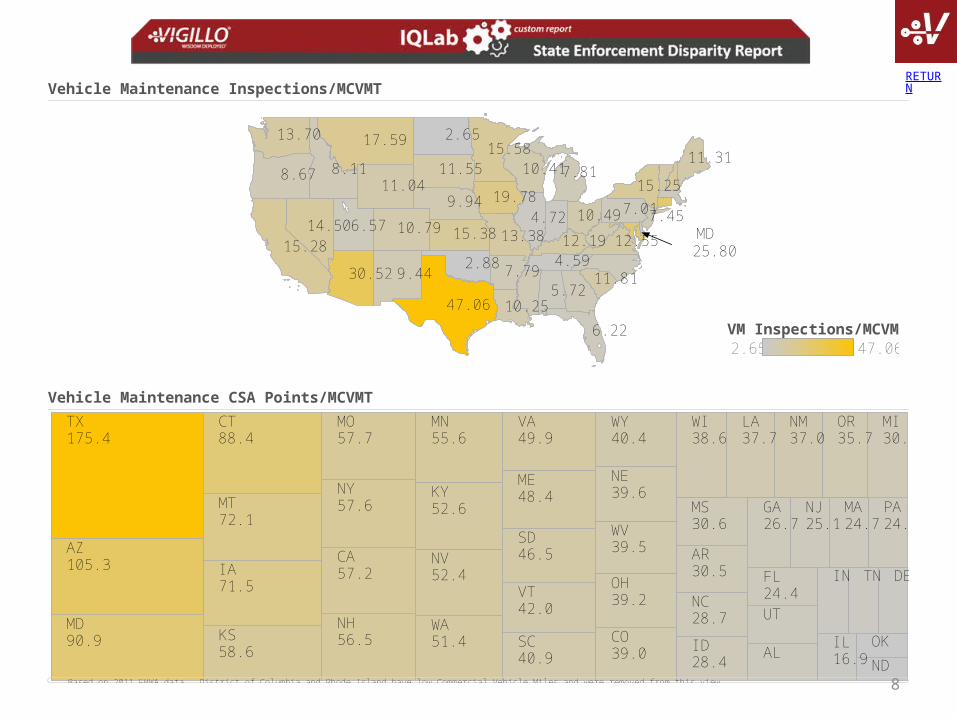
About Tableau maps: www.tableausoftware.com/mapdata
11.55
12.55
10.25
15.25
15.2810.79
19.7810.49
15.38 12.19
17.59 15.58
13.38
47.06
11.04
13.70
14.50
30.52 11.81
11.3110.41
7.45
2.65
7.792.88 4.59
8.67
6.57
9.94
9.44
4.72
5.72
6.22
7.81
7.01
8.11
MD25.80
Vehicle Maintenance Inspections/MCVMT
WY40.4
WV39.5
WI38.6
WA51.4
VT42.0
VA49.9
UT
TX175.4
TN
SD46.5
SC40.9
PA24.6
OR35.7
OK
OH39.2
NY57.6
NV52.4
NM37.0
NJ25.1
NH56.5
NE39.6
ND
NC28.7
MT72.1
MS30.6
MO57.7
MN55.6
MI30.8
ME48.4
MD90.9
MA24.7
LA37.7
KY52.6
KS58.6
IN
IL16.9
ID28.4
IA71.5
GA26.7
FL24.4
DE
CT88.4
CO39.0
CA57.2
AZ105.3
AR30.5
AL
Based on 2011 FHWA data. District of Columbia and Rhode Island have low Commercial Vehicle Miles and were removed from this view.
Vehicle Maintenance CSA Points/MCVMT
2.65 47.06VM Inspections/MCVMT
RETURN
8
WY0.88
WV0.47
WI0.54
WA0.37
VT1.63
VA0.63
UT0.51
TX1.46
TN
SD0.51
SC0.66
PA
OR0.49
OH0.73
NY2.01
NV1.10
NM
NJ0.80
NH0.99
NE0.90
ND0.22
NC
MT0.79
MS0.21
MO0.33
MN1.96
MI0.51
ME0.70
MD0.77
MA2.29
LA0.46
KY
KS0.82
IN
IL0.48
ID0.89
IA1.49
GA0.63
FL0.53
CT0.96 CO
0.72
CA0.34
AZ1.03
AR
Based on 2011 FHWA data. District of Columbia and Rhode Island have low Commercial Vehicle Miles and were removed from this view.
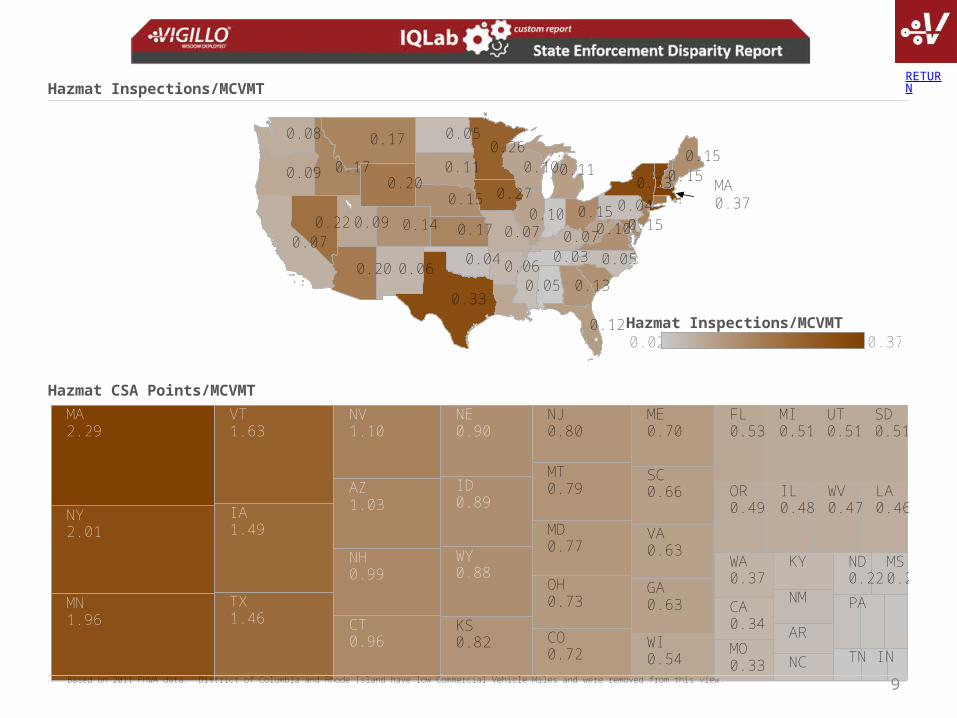
Hazmat CSA Points/MCVMTAbout Tableau maps: www.tableausoftware.com/mapdata
0.05
0.15
0.05
0.05
0.15
0.150.15
0.15
0.09
0.09
0.08
0.17
0.06
0.07
0.260.17
0.07
0.13
0.27
0.17 0.07
0.06
0.33
0.03
0.33
0.20
0.040.14
0.10
0.04
0.10
0.10
0.20
0.12
0.22
0.11 0.11MA0.37
Hazmat Inspections/MCVMT
0.02 0.37Hazmat Inspections/MCVMT
RETURN
9
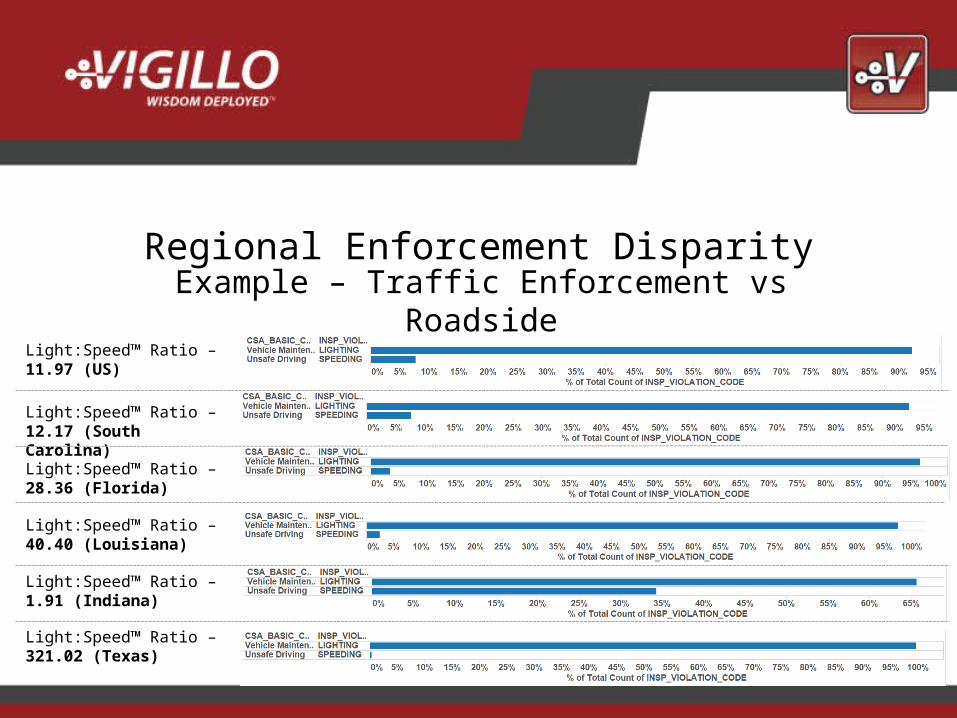
Regional Enforcement DisparityExample – Traffic Enforcement vs Roadside
Light:Speed™ Ratio – 28.36 (Florida)
Light:Speed™ Ratio – 12.17 (South Carolina)
Light:Speed™ Ratio – 40.40 (Louisiana)
Light:Speed™ Ratio – 1.91 (Indiana)
Light:Speed™ Ratio – 11.97 (US)
Light:Speed™ Ratio – 321.02 (Texas)

The following slides are the result of my first look at the make-up of the 29 Safety Event Groups based on the Public CSA BASICs
242,199 carriers across 29 safety event groups15 Safety Event Groups are not represented (private) because FMCSA does not make them available in the SMS preview.
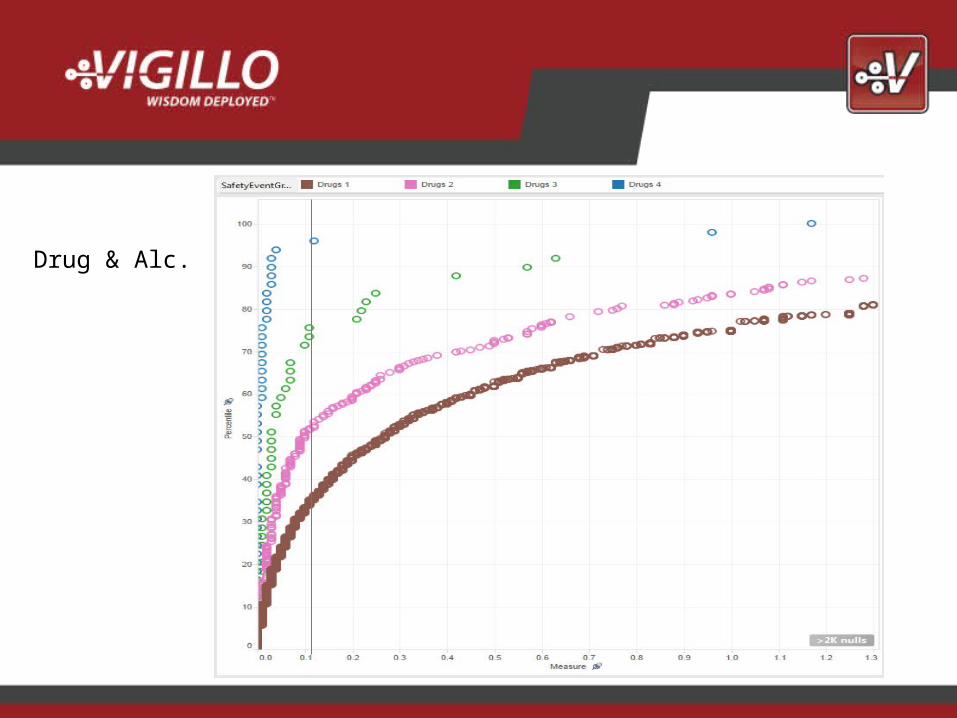
Drug & Alc.
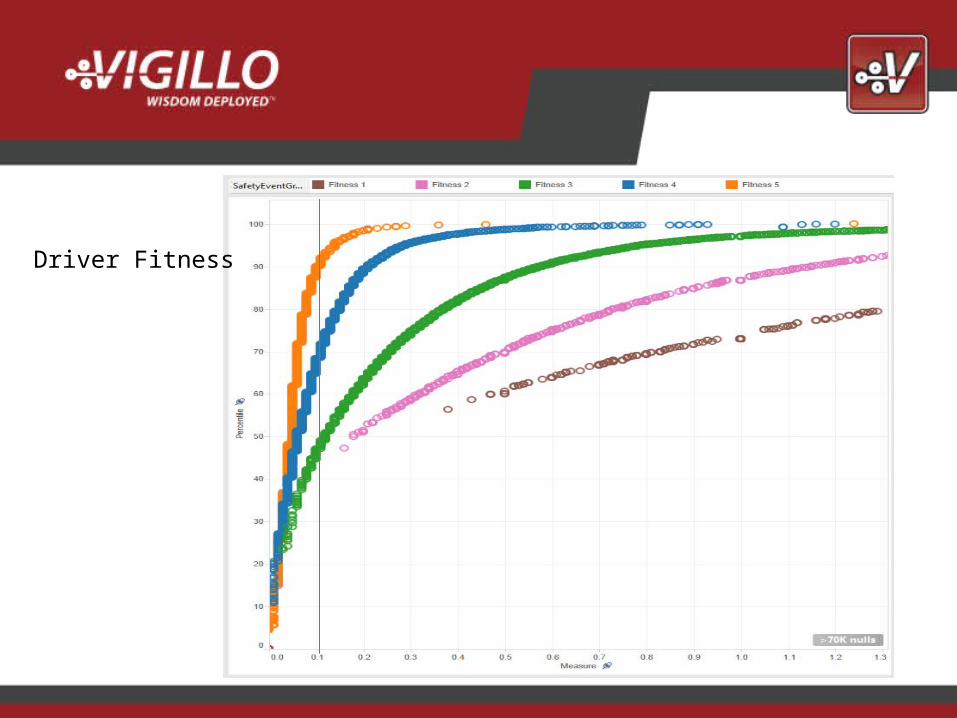
Driver Fitness
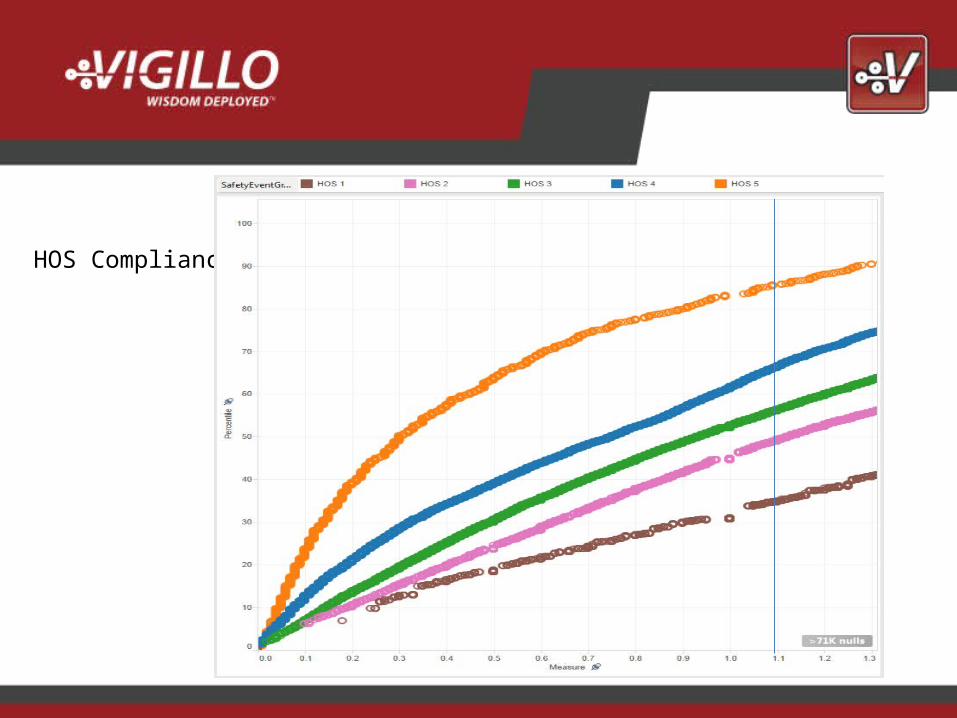
HOS Compliance
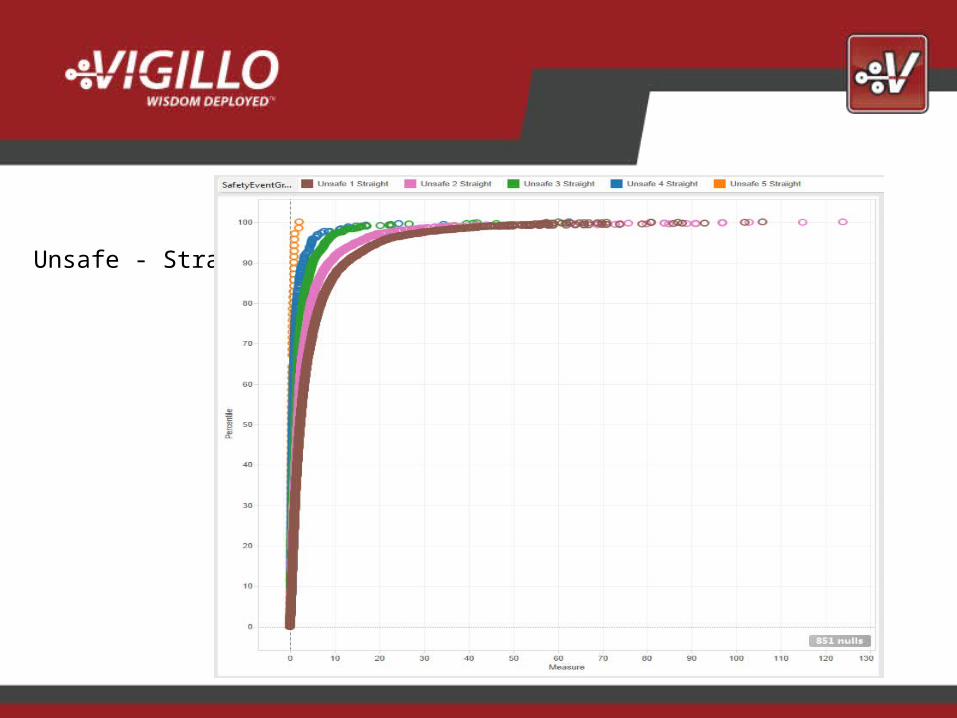
Unsafe - Straight
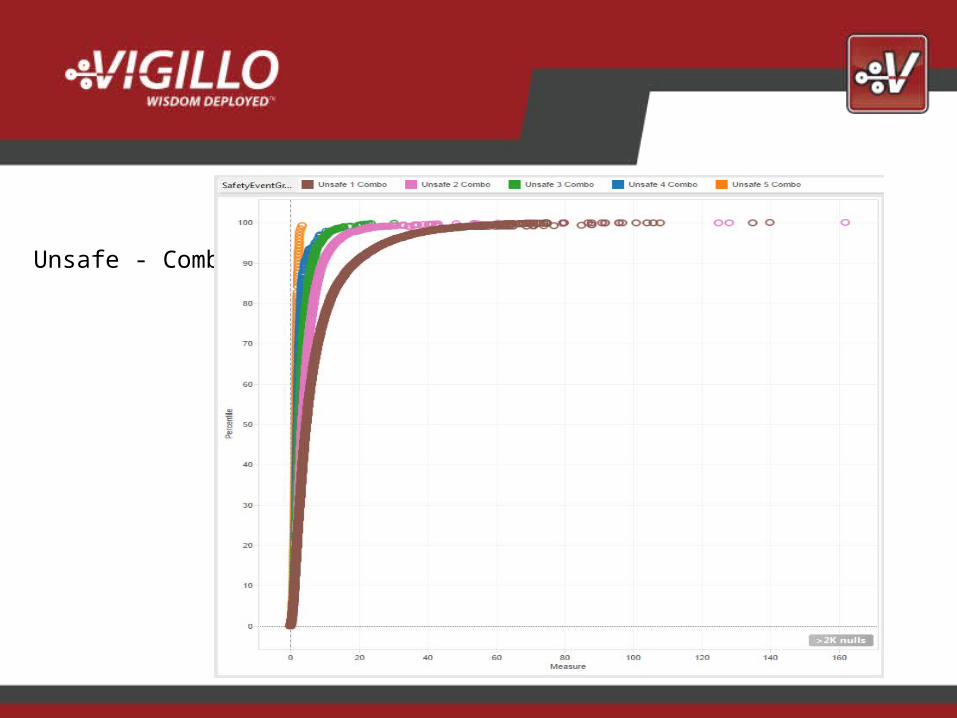
Unsafe - Combo
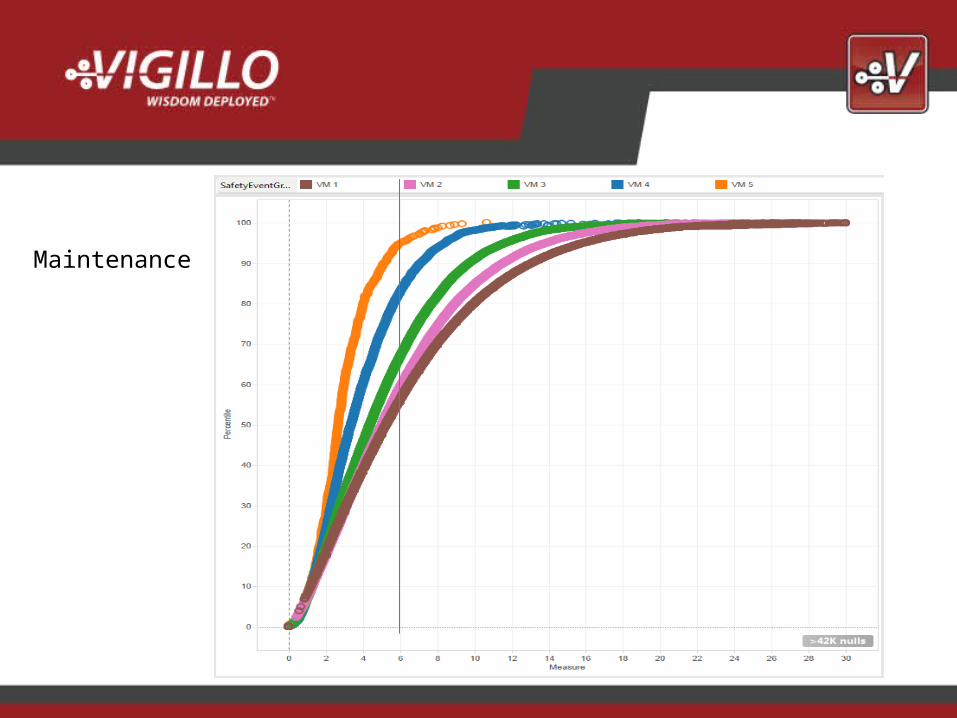
Maintenance
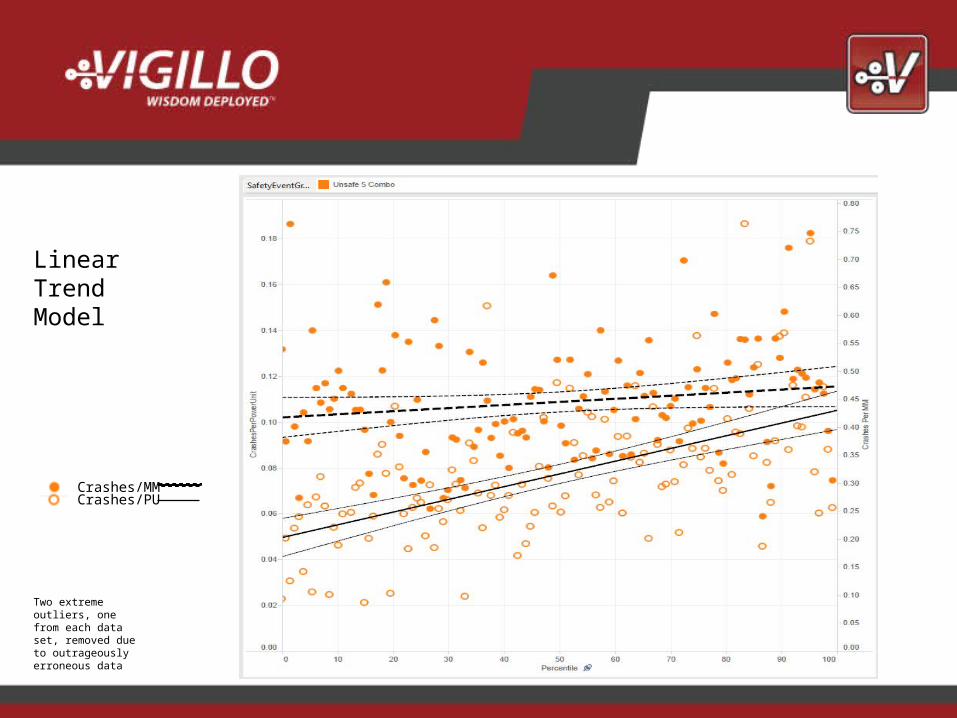
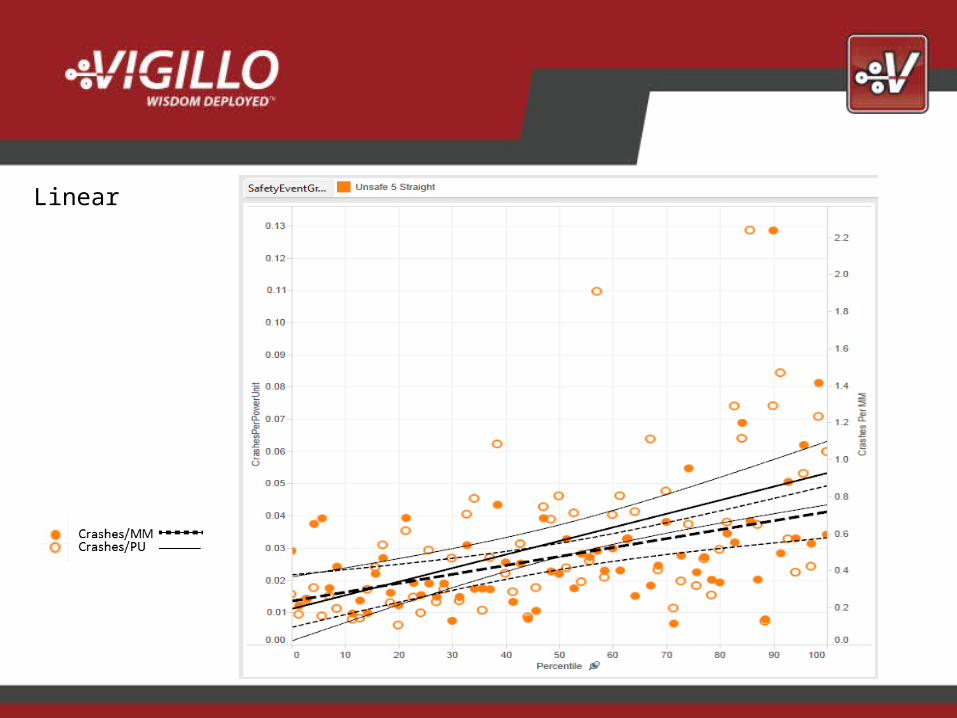
Linear Trend Model
Two extreme outliers, one from each data set, removed due to outrageously erroneous data
Crashes/MMCrashes/PU
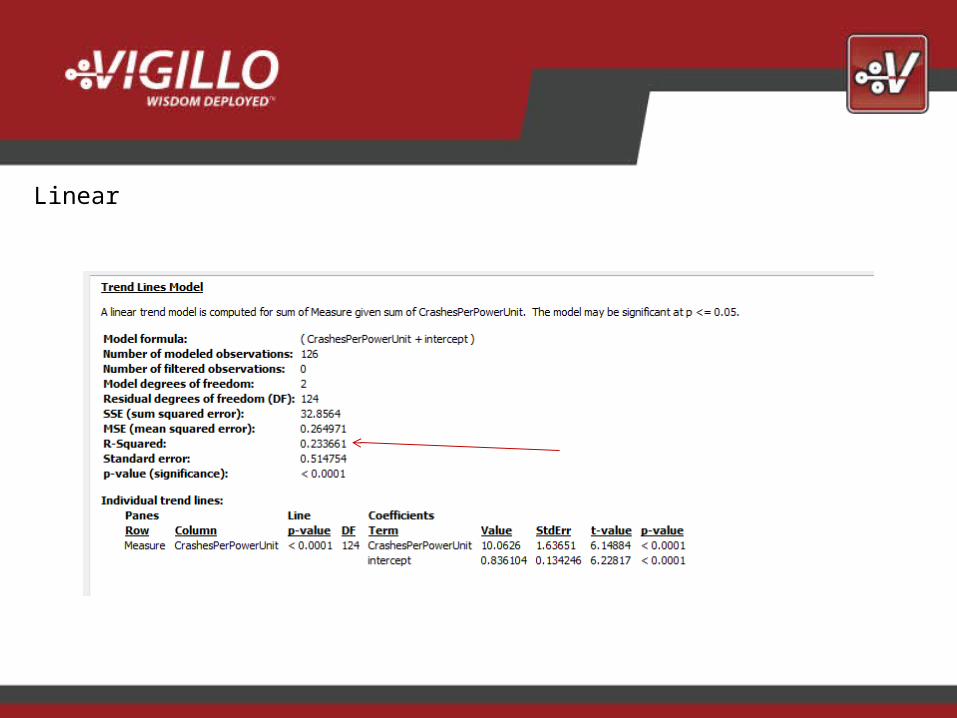
Linear

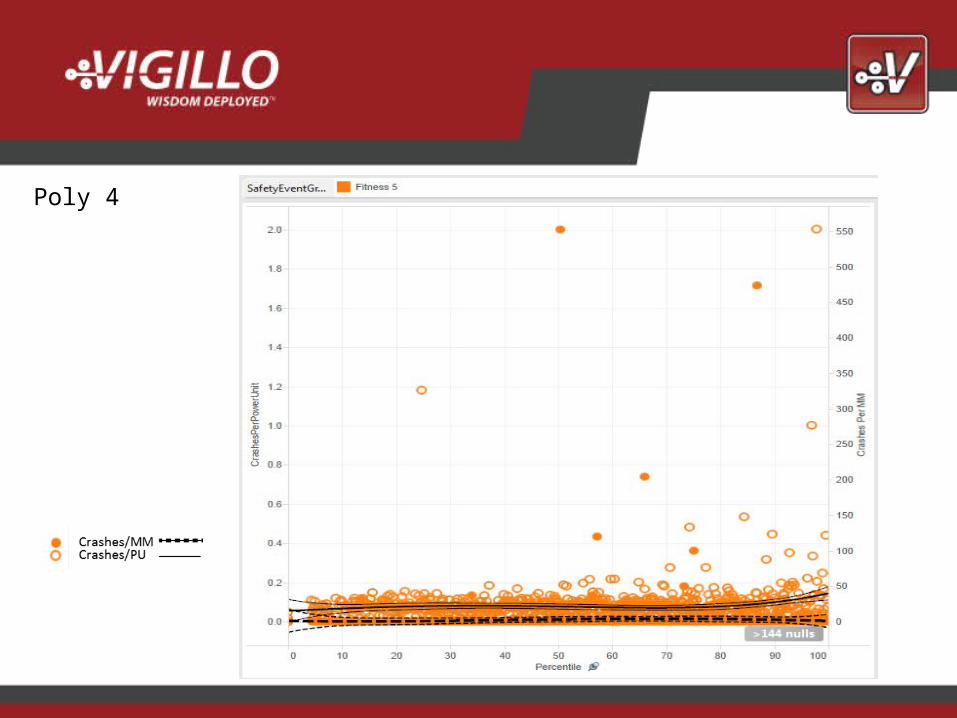
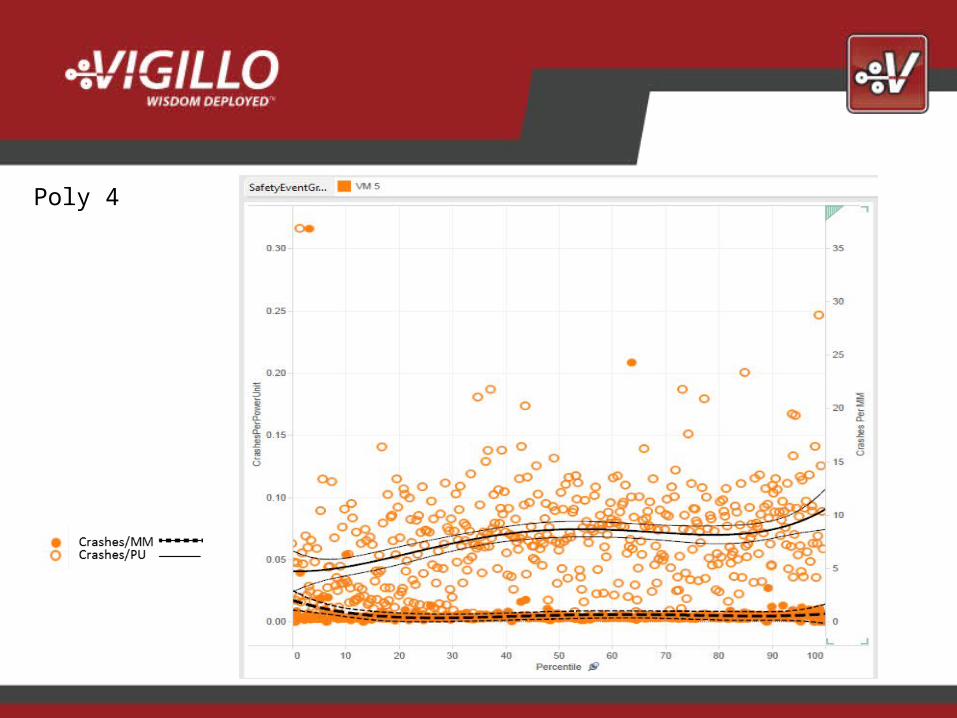
4th Degree Polynomial Trend Model
Two extreme outliers, one from each data set, removed due to outrageously erroneous data
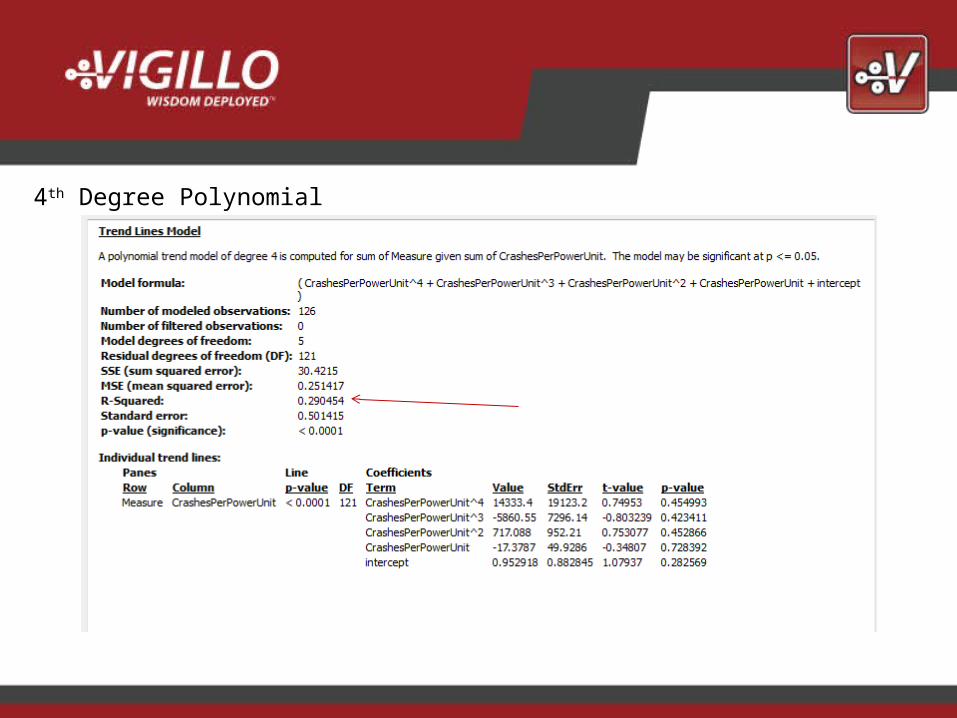
4th Degree Polynomial
Linear
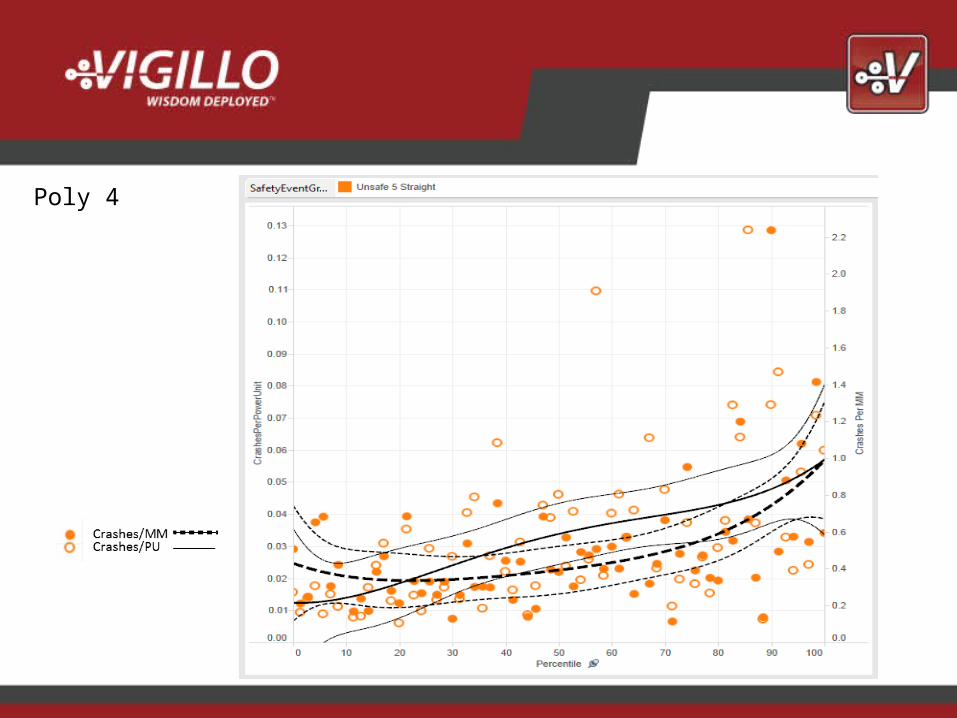
Poly 4
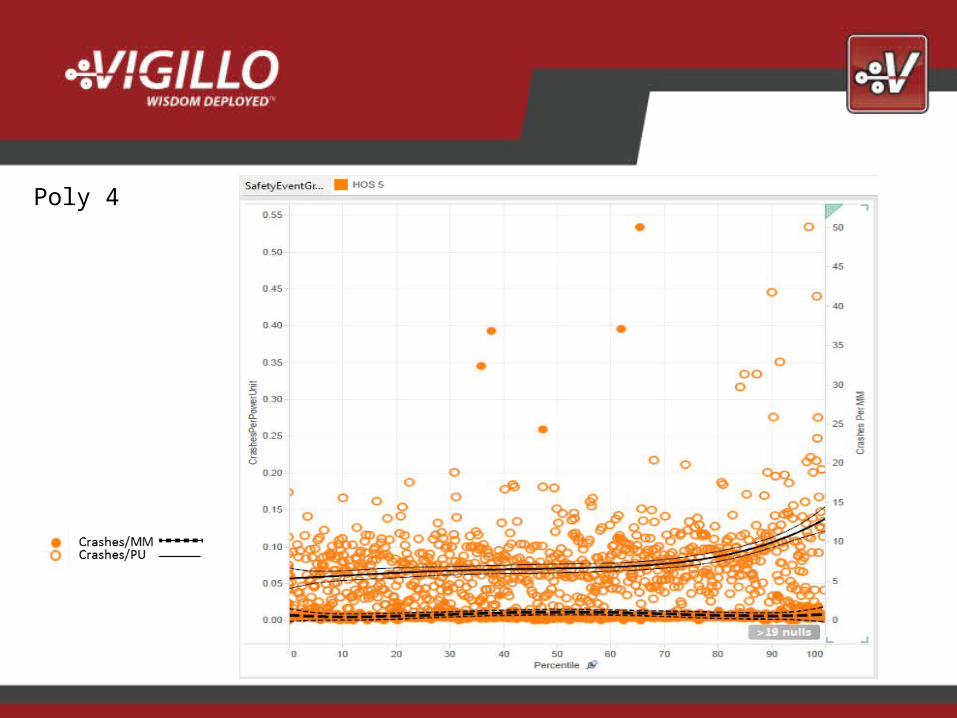
Poly 4
Poly 4
Poly 4
…
1. Measure to Percentile relationship is consistently skewed across all BASICs2. Using Power Units as the basis for crash rate makes little sense3. A linear trend model is not appropriate on the surface, nor is it borne out as useful when applied4. A 4th order polynomial regression trend model fits the data better, but still does not result in meaningful predictive value (low R2)5. Crashes/MM is a better measure of activity and presumably controllable behavior6. When regression analysis is applied to Percentiles:Crashes/MM, there is still no meaningful predictive value (R2 never gets beyond approx .3)