CS263 ProgramProfiling - cs.ucsb.educs263/lectures/profiling.pdf · The difference between a...
52
CS263 Program Profiling
Transcript of CS263 ProgramProfiling - cs.ucsb.educs263/lectures/profiling.pdf · The difference between a...

CS263Program Profiling

Profiling• “the formal summary or analysis of data representing distinctive
features or characteristics” (American Heritage Dictionary)– Program profiling: analyzing the execution characteristics of code
to extract and summarize its behavior
• Offline vs online– Offline – Collection time doesn’t matter– Online – Slow-down is an important factor
• Exhaustive vs sample-based– Sampling is estimation. The difference between a sampled profile
and an exhaustive profile is the accuracy/error measure– Sampling is commonly used online where time matters
• Can be used offline if inaccuracy can be tolerated

Why Profile?• To characterize program behavior
– Understand how programs behave– Guide tool, runtime, system (hw/sw) design– Program test generation
• To capture specific or unusual behavior– Security attacks, intrusion detection, bugs, test coverage– Logging
• Track performance regressions

Why Profile?
• To improve performance– Time different parts of the program to find out where time is
being spent• 80/20 rule – identify the 20 and focus your optimization energy • By hand optimization• Automatic (compiler or runtime) feedback-directed optimization
– Target hot code– Inlining and unrolling– Code scheduling and register allocation
– Increasingly important for speculative optimization• Hardware trends à simplicity & multiple contexts• Less speculation in hardware, more in software

What to Profile• Individual instructions
– Memory accesses (allocations/deletions, loads/stores)• Lends insight into caching, paging, garbage collection, bugs & more
– If individual instruction detail isn’t needed: capture basic blocks• Estimate bb’s by recording branches and their direction• Lends insight into branch miss overhead

What to Profile• Individual instructions
– Memory accesses (allocations/deletions, loads/stores)• Lends insight into caching, paging, GC, races, bugs & more
– If individual instruction detail isn’t needed: capture basic blocks• Estimate bb’s by recording branches and their direction• E.g: lends insight into branch miss overhead
• Paths• Function invocations and call sites• Memory allocation, GC time• Interfaces (ABI, APIs to other components, foreign function)• Resource use
– CPU, Network, disk, other I/O– Runtime services (compiler/interp, GC, runtime, OS)
• User interactivity

Instrumentation vs Event Monitoring• Instrumentation: Insert code into the code of a program
– The additional code executes interleaved with program code– To collect information about the program code activity
• Can perturb the behavior that it is trying to measure

Instrumentation vs Event Monitoring• Instrumentation: Insert code into the code of a program
– The additional code executes interleaved with program code– To collect information about the program code activity
• Event monitoring– Profiling external to the executing program– Output timestamps, upon OS or runtime activity, around program– Record of operations (timings, counts) in runtime that execute
concurrently with the executing program, yet independent of it• Garbage collection activity• Accesses to the OS• Accesses to libraries (e.g. GUI, cloud SDK, web services)
– Hardware performance counters/monitors (HPMs)
• Can perturb the behavior that it is trying to measure

Adaptive Optimization• Sample the system (lightweight)• Predict future behavior based on past behavior
– Does the past predict the future?• Determine if prediction can amortize the cost of applying more
optimization overhead

Adaptive Optimization• Sample the system (lightweight)• Predict future behavior based on past behavior
– Does the past predict the future?• Determine if prediction can amortize the cost of applying more
optimization overhead
• Sampling to find hotspots or problem methods– Periodically record the top N methods on the runtime stack
• Finding the right period and a value for N is tricky!– Use HPMs to identify methods that are causing stalls in the
hardware… Careful, calling HPM services increments counters• Branch mispredictions• Cache misses
– Very low overhead (< 2%)

Hardware Performance Monitors/Counters
• Libraries provide access to hardware collected HPMs
• Other types of sampling– Random– Periodic– Phase

13
Time Varying Behavior of Programs
– Different behavior during different parts of execution
– Many programs execute as a series of phasespossibly with recurringpatterns
– Capture via basic block profiles for fixed number of instructions=vector• Compare counts across
vectors for similarity
Program Behavior changes over time

14
Phase Aware Remote Profiling• Extant approaches
(random/periodic sampling)– Do not consider time-varying
and repeating behavior– Collect redundant information
I-656--
I-1312--
I-984--
I-328--
Periodic samples

15
Phase Aware Remote Profiling• Extant approaches
(random/periodic sampling)– Do not consider time-varying
and repeating behavior– Collect redundant information
• Our approach: Sample according to phase behavior
I-656--
I-1312--
I-984--
I-328--
Phasesamples
Periodic samples

16
Results• 50-75% reduction in overhead (over periodic and random
sampling)
0 5 10 15 20 25
% ProgramSampled
0
10
20
30
40
%ErrorinBlockCou
nts
avg randommax randomperiodicphaseaware

17
Sampling Interactive Sessions• A period of user interaction: Each application has a specific
patternInteractivitySession- Tetrix

18
Interactive Sessions• A period of user interaction: Each application has a specific
patternInteractivitySession- Solitaire

Exhaustive Path Profiling (Instrumentation)
• Processors need long instruction sequences• Programs have branches
A
C
E
B
D
ThankstoMikeBond(OhioState)forhispresentationsofPEPandContinuousPath/EdgeProfilingfortheseslides[CGO/MICRO2005]onpathprofilinganditsoptimization.

Why path profiling?
• Compiler identifies hot paths across multiple basic blocks
A
C
E
B
D

Why path profiling?
A
C
E
B
A
C
E
B
D
• Compiler identifies hot paths across multiple basic blocks– Forms and optimizes “traces” -- like superinstructions!

Why path profiling?
A
C
E
B
A
C
E
B
D
Oops!
Oops!
• Compiler identifies hot paths across multiple basic blocks– Speculative in that control may exit the trace early
• Requires special case handling/overhead

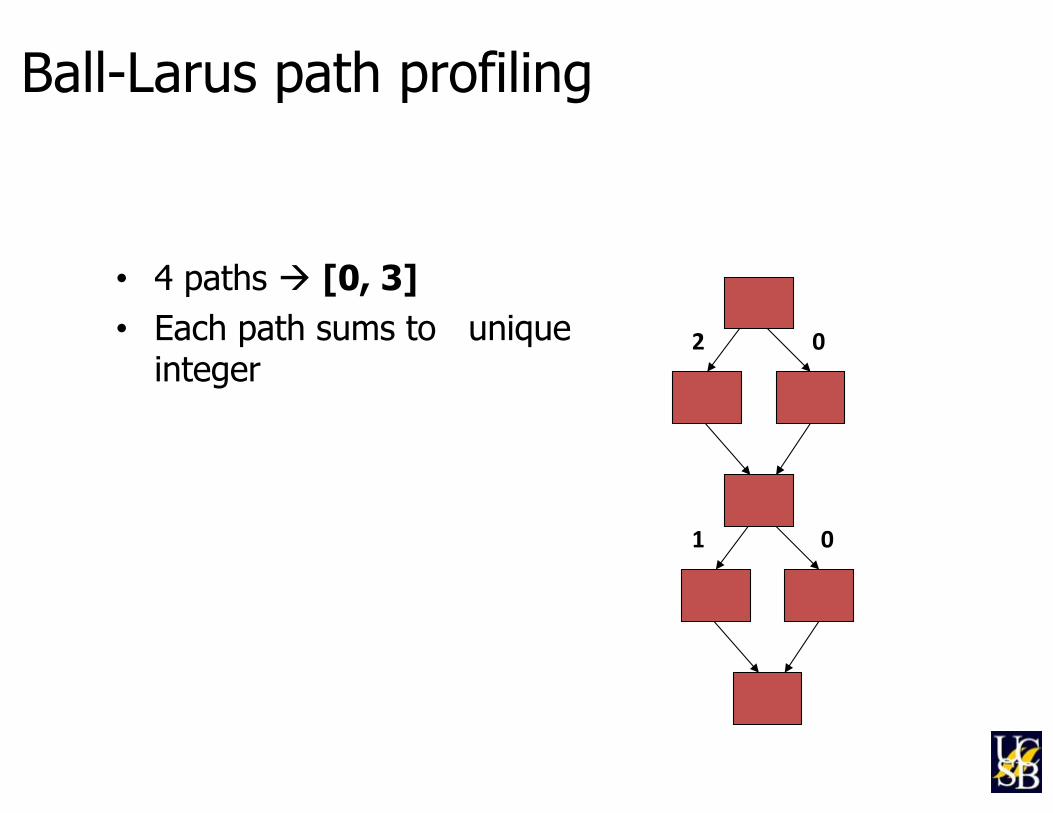
Ball-Larus path profiling
• 4 paths à [0, 3]
Ball-Larus path profiling
2
1
• 4 paths à [0, 3]• Each path sums to unique
integer
0
0

Ball-Larus path profiling
2
• 4 paths à [0, 3]• Each path sums to unique
integer
Path 0
1 0
0

Ball-Larus path profiling
2
• 4 paths à [0, 3]• Each path sums to unique
integer
Path 0Path 1
1 0
0

Ball-Larus path profiling
2
• 4 paths à [0, 3]• Each path sums to unique
integer
Path 0Path 1Path 2
1 0
0

Ball-Larus path profiling
2
• 4 paths à [0, 3]• Each path sums to unique
integer
Path 0Path 1Path 2Path 3
1 0
0
Ball-Larus path profiling
r=r+2
r=0
r=r+1
count[r]++
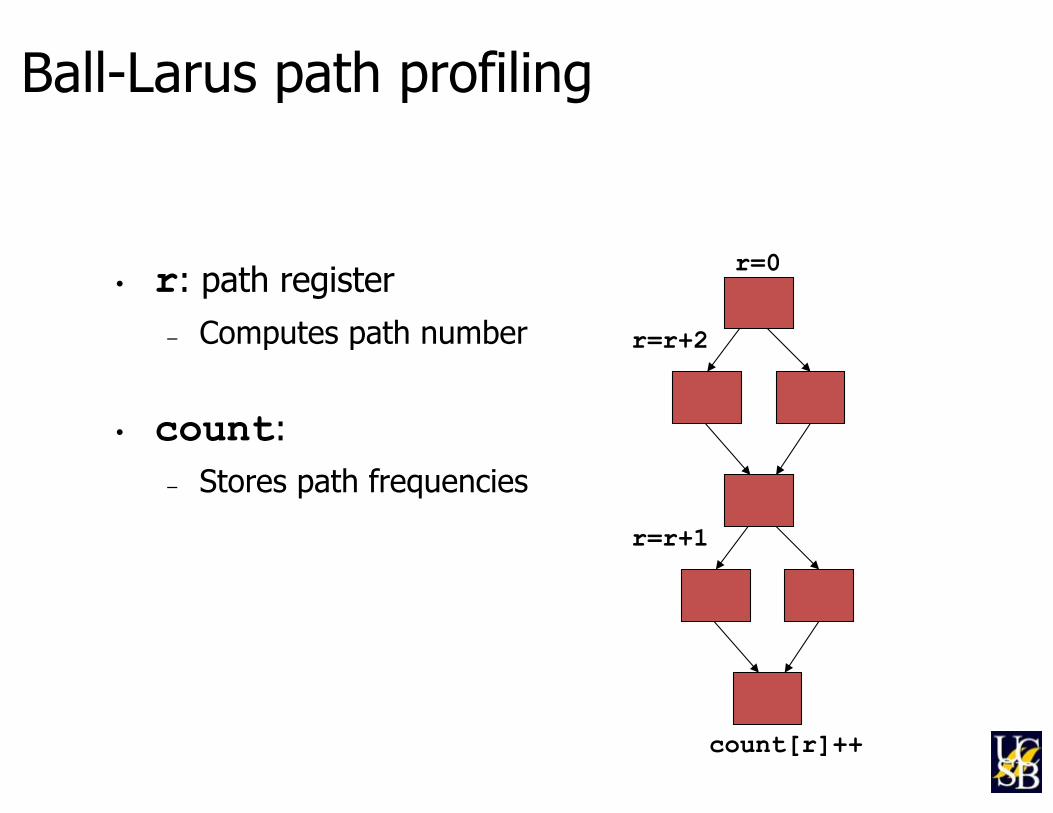
• r: path register– Computes path number
• count:– Stores path frequencies

Ball-Larus path profiling
r=r+2
r=0
count[r]++
• r: path register– Computes path number
• count:– Stores path frequencies– Array by default– Too many paths?
• Hash table• High overhead
r=r+1

r=r+2
r=0
count[r]++
r=r+1
Optimizing Path Profiling
Computespath
Updatespathprofile

r=r+2
r=0
count[r]++
r=r+1
Optimizing Path Profiling
cheap<10%
expensive>90%
• Where have all the cycles gone?

r=r+2
r=0
r=r+1
Optimizing Path Profiling
All-the-timeinstrumentation
Sampling(piggybacksonexisting
mechanism) SAMPLE r

r=r+2
r=0
r=r+1
Optimizing Path Profiling
All-the-timeinstrumentation
Sampling(piggybacksonexisting
mechanism)
Overhead: 30% à 2%[Bond et al. 2005]
SAMPLE r

freq =30
freq =90 freq =10
freq =70
Profile-guided profiling
• Existing edge profile informs path profiling– Profile some initially
• Quite fast to profile edges• Can be sample based• Just need to determine which branch
edges are taken more frequently

r=r+2
r=0
SAMPLE r
r=r+1
Profile-guided profiling
• Existing edge profile informs path profiling
• Assign zero to hotter edges– No instrumentation

Calling Context Profiling
A calls B calls C calls D calls EVersusA calls D calls E
Two different contexts for EMay provide insight into errors/bugs in E
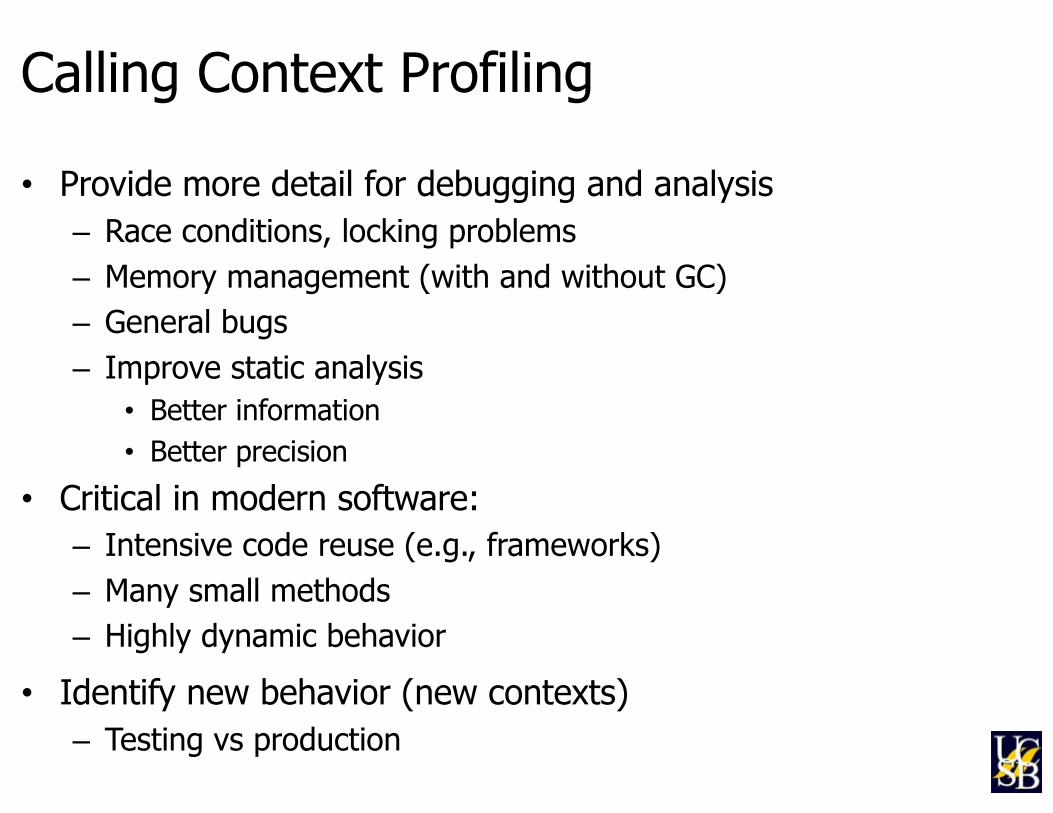
Calling Context Profiling
• Provide more detail for debugging and analysis– Race conditions, locking problems– Memory management (with and without GC)– General bugs– Improve static analysis
• Better information• Better precision
• Critical in modern software:– Intensive code reuse (e.g., frameworks)– Many small methods– Highly dynamic behavior
• Identify new behavior (new contexts)– Testing vs production
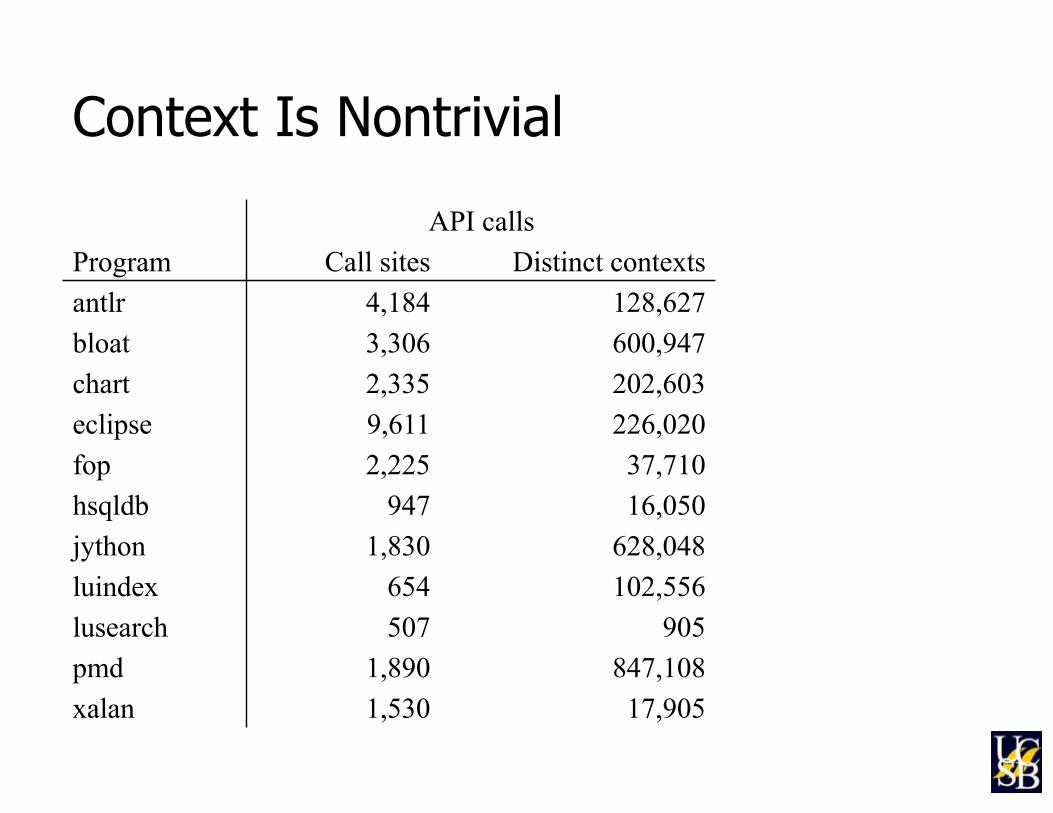
Context Is NontrivialAPI calls
Program Call sites Distinct contextsantlr 4,184 128,627bloat 3,306 600,947chart 2,335 202,603eclipse 9,611 226,020fop 2,225 37,710hsqldb 947 16,050jython 1,830 628,048luindex 654 102,556lusearch 507 905pmd 1,890 847,108xalan 1,530 17,905

Example: Dynamic data race detector
ThreadA ThreadB
writex
unlockmlockm
writex
readx

Example: dynamic data race detector
ThreadA ThreadB
writex
unlockmlockm
writex
readx

Reporting a race
ThreadA ThreadB
writex
unlockmlockm
writex
readx
T@A
T’@B
T’’@A
loc1
loc2
loc3

Reporting a race
ThreadA ThreadB
writex
readxT’@B
T’’@A
writex
unlockmlockm
T@A loc1
loc2
loc3
AbstractDataTreeNode.indexOfChild():426
AbstractDataTreeNode.storeStrings():536

Full stack traces
ThreadA ThreadB
writex
readxT’@B
T’’@A
writex
unlockmlockm
T@A loc1
loc2
loc3
AbstractDataTreeNode.indexOfChild():426AbstractDataTreeNode.childAtOrNull():212DeltaDataTree.lookup():666 ElementTree.includes():528 Workspace.getResourceInfo():1135Resource.getResourceInfo():973Project.hasNature():479 JavaProject.hasJavaNature():224JavaProject.computeExpandedClasspath():430JavaProject.getExpandedClasspath():1444... EclipseStarter.run():376...
AbstractDataTreeNode.storeStrings():536DataTreeNode.storeStrings():343AbstractDataTreeNode.storeStrings():541DataTreeNode.storeStrings():343...ElementTree.shareStrings():706SaveManager.shareStrings():1154...StringPoolJob.shareStrings():124...Worker.run():76...
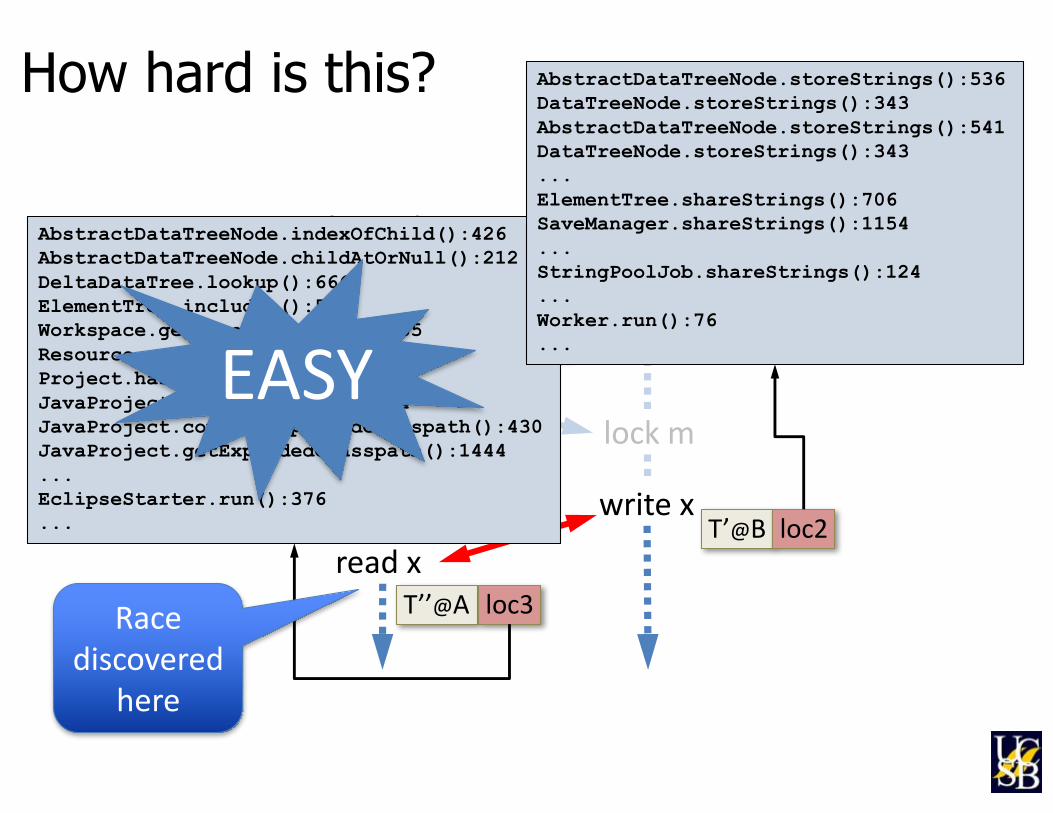
How hard is this?
ThreadA ThreadB
writex
readxT’@B
T’’@A
writex
unlockmlockm
T@A loc1
loc2
loc3
AbstractDataTreeNode.indexOfChild():426AbstractDataTreeNode.childAtOrNull():212DeltaDataTree.lookup():666 ElementTree.includes():528 Workspace.getResourceInfo():1135Resource.getResourceInfo():973Project.hasNature():479 JavaProject.hasJavaNature():224JavaProject.computeExpandedClasspath():430JavaProject.getExpandedClasspath():1444... EclipseStarter.run():376...
AbstractDataTreeNode.storeStrings():536DataTreeNode.storeStrings():343AbstractDataTreeNode.storeStrings():541DataTreeNode.storeStrings():343...ElementTree.shareStrings():706SaveManager.shareStrings():1154...StringPoolJob.shareStrings():124...Worker.run():76...EASY
Racediscovered
here

How hard is this?
ThreadA ThreadB
writex
readxT’@B
T’’@A
writex
unlockmlockm
T@A loc1
loc2
loc3
AbstractDataTreeNode.indexOfChild():426AbstractDataTreeNode.childAtOrNull():212DeltaDataTree.lookup():666 ElementTree.includes():528 Workspace.getResourceInfo():1135Resource.getResourceInfo():973Project.hasNature():479 JavaProject.hasJavaNature():224JavaProject.computeExpandedClasspath():430JavaProject.getExpandedClasspath():1444... EclipseStarter.run():376...
AbstractDataTreeNode.storeStrings():536DataTreeNode.storeStrings():343AbstractDataTreeNode.storeStrings():541DataTreeNode.storeStrings():343...ElementTree.shareStrings():706SaveManager.shareStrings():1154...StringPoolJob.shareStrings():124...Worker.run():76...EASY
HARD
Previouslyrecorded
information

Challenge
• Many events might need context informatione.g., race detector: every read and write (!)
• Existing approaches– Walk the stack: up to 100X slowdown– Build calling context tree: 2-3X, plus space
Context
Context
Context Context
Context
Context
Context
Context
Context
Context
Context
BUG

Goal
Compact representation of calling contexts
Fast correct execution
Print out stack trace when bug detected
Efficientcontextsensitivityfordynamicbugdetectors

Calling Context Profiling
Represent a calling context in 1 word ⎯ PCC value
Computed online, low overhead ⎯ <5%
Efficiently decode a PCC value when needed - 10-20%--- make any dynamic bug detector context sensitive--- threshold/sample based (focus on cold contexts)
ProbabilisticCallingContextBondandMcKinleyOOPSLA07
✓
✓
✓
Breadcrumbs:EfficientContextSensitivityforDynamicBugDetectionAnalysesBond, Baker,andGuyer PLDI10

Sample-based Instrumentation• Turn on and off instrumentation dynamically
• Challenge: when to turn instrumentation on and off

Sample-based Instrumentation• Turn on and off instrumentation dynamically
– Challenge: when to turn instrumentation on and off
– Why is this important to do?
– How: Switching between (un-)instrumented versions• Via code patching: Ephemeral Instrumentation, DynInst, IBM Java
Developer Kit– Have two versions of the methods (or code blocks) you want to
instrument– In the uninstrumented version, put a patch point at entry
» Dummy instruction large enough to hold a jump– Overwrite (patch) the entry point to instrument– “Undo” patch to turn off instrumentation
• Via recompilation and on-stack replacement– Via code copying (today’s paper)

55

Profiling Tools• Of binaries (independent of language)
– Pin, Dynamo– Valgrind– gprof (call graph and function timings)
• Of programs (language specific)– Java – JVMPI/TI, JProfiler, many others, GCSpy– Ruby – ruby-prof– Python – cprofile
• HPMs– Library support: PAPI– OS Integration: PerfMon, OProfile, XenOProf