CS Ch 1 Sampling
38
Chapter 1 Sampling and Data 1.1 Sampling and Data 1 1.1.1 Student Learning Objectives By the end of this chapter, the student should be able to: • Recognize and differentiate between key terms. • Apply various types of sampling methods to data collection. • Create and interpret frequency tables. 1.1.2 Introduction You are probably asking yourself the question, "When and where will I use statistics?". If you read any newspaper or watch television, or use the Internet, you will see statistical information. There are statistics about crime, sports, education, politics, and real estate. Typically, when you read a newspaper article or watch a news program on television, you are given sample information. With this information, you may make a decision about the correctness of a statement, claim, or "fact." Statistical methods can help you make the "best educated guess." Since you will undoubtedly be given statistical information at some point in your life, you need to know some techniques to analyze the information thoughtfully. Think about buying a house or managing a budget. Think about your chosen profession. The fields of economics, business, psychology, education, biology, law, computer science, police science, and early childhood development require at least one course in statistics. Included in this chapter are the basic ideas and words of probability and statistics. You will soon under- stand that statistics and probability work together. You will also learn how data are gathered and what "good" data are. 1.2 Statistics 2 The science of statistics deals with the collection, analysis, interpretation, and presentation of data. We see and use data in our everyday lives. To be able to use data correctly is essential to many professions and in your own best self-interest. 1 This content is available online at <http://cnx.org/content/m16008/1.8/>. 2 This content is available online at <http://cnx.org/content/m16020/1.12/>. 11
-
Upload
dgregory426 -
Category
Documents
-
view
101 -
download
7
Transcript of CS Ch 1 Sampling
Chapter 1
Sampling and Data
1.1 Sampling and Data1
1.1.1 Student Learning Objectives
By the end of this chapter, the student should be able to:
• Recognize and differentiate between key terms.• Apply various types of sampling methods to data collection.• Create and interpret frequency tables.
1.1.2 Introduction
You are probably asking yourself the question, "When and where will I use statistics?". If you read anynewspaper or watch television, or use the Internet, you will see statistical information. There are statisticsabout crime, sports, education, politics, and real estate. Typically, when you read a newspaper article orwatch a news program on television, you are given sample information. With this information, you maymake a decision about the correctness of a statement, claim, or "fact." Statistical methods can help you makethe "best educated guess."
Since you will undoubtedly be given statistical information at some point in your life, you need to knowsome techniques to analyze the information thoughtfully. Think about buying a house or managing abudget. Think about your chosen profession. The fields of economics, business, psychology, education,biology, law, computer science, police science, and early childhood development require at least one coursein statistics.
Included in this chapter are the basic ideas and words of probability and statistics. You will soon under-stand that statistics and probability work together. You will also learn how data are gathered and what"good" data are.
1.2 Statistics2
The science of statistics deals with the collection, analysis, interpretation, and presentation of data. We seeand use data in our everyday lives. To be able to use data correctly is essential to many professions and inyour own best self-interest.
1This content is available online at <http://cnx.org/content/m16008/1.8/>.2This content is available online at <http://cnx.org/content/m16020/1.12/>.
11
12 CHAPTER 1. SAMPLING AND DATA
1.2.1 Optional Collaborative Classroom Exercise
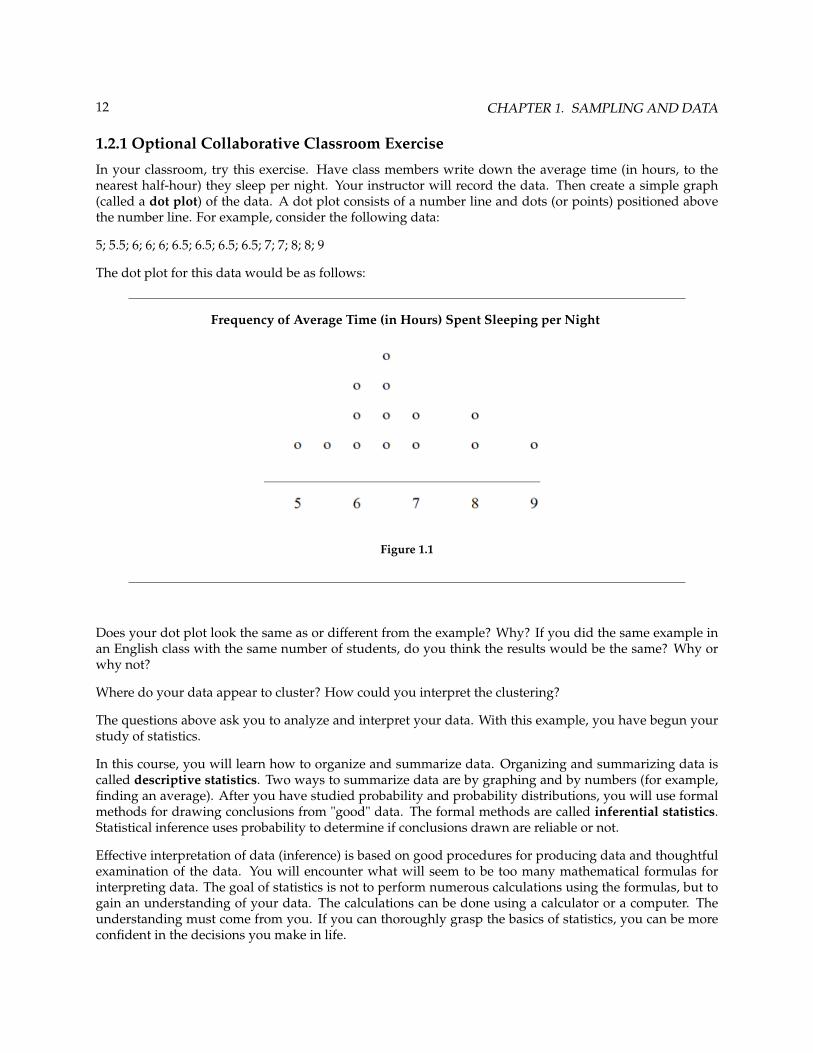
In your classroom, try this exercise. Have class members write down the average time (in hours, to thenearest half-hour) they sleep per night. Your instructor will record the data. Then create a simple graph(called a dot plot) of the data. A dot plot consists of a number line and dots (or points) positioned abovethe number line. For example, consider the following data:
5; 5.5; 6; 6; 6; 6.5; 6.5; 6.5; 6.5; 7; 7; 8; 8; 9
The dot plot for this data would be as follows:
Frequency of Average Time (in Hours) Spent Sleeping per Night
Figure 1.1
Does your dot plot look the same as or different from the example? Why? If you did the same example inan English class with the same number of students, do you think the results would be the same? Why orwhy not?
Where do your data appear to cluster? How could you interpret the clustering?
The questions above ask you to analyze and interpret your data. With this example, you have begun yourstudy of statistics.
In this course, you will learn how to organize and summarize data. Organizing and summarizing data iscalled descriptive statistics. Two ways to summarize data are by graphing and by numbers (for example,finding an average). After you have studied probability and probability distributions, you will use formalmethods for drawing conclusions from "good" data. The formal methods are called inferential statistics.Statistical inference uses probability to determine if conclusions drawn are reliable or not.
Effective interpretation of data (inference) is based on good procedures for producing data and thoughtfulexamination of the data. You will encounter what will seem to be too many mathematical formulas forinterpreting data. The goal of statistics is not to perform numerous calculations using the formulas, but togain an understanding of your data. The calculations can be done using a calculator or a computer. Theunderstanding must come from you. If you can thoroughly grasp the basics of statistics, you can be moreconfident in the decisions you make in life.
13
1.3 Probability3
Probability is the mathematical tool used to study randomness. It deals with the chance of an event occur-ring. For example, if you toss a fair coin 4 times, the outcomes may not be 2 heads and 2 tails. However, ifyou toss the same coin 4,000 times, the outcomes will be close to 2,000 heads and 2,000 tails. The expectedtheoretical probability of heads in any one toss is 1
2 or 0.5. Even though the outcomes of a few repetitionsare uncertain, there is a regular pattern of outcomes when there are many repetitions. After reading aboutthe English statistician Karl Pearson who tossed a coin 24,000 times with a result of 12,012 heads, one of theauthors tossed a coin 2,000 times. The results were 996 heads. The fraction 996
2000 is equal to 0.498 which isvery close to 0.5, the expected probability.
The theory of probability began with the study of games of chance such as poker. Today, probability isused to predict the likelihood of an earthquake, of rain, or whether you will get a A in this course. Doctorsuse probability to determine the chance of a vaccination causing the disease the vaccination is supposed toprevent. A stockbroker uses probability to determine the rate of return on a client’s investments. You mightuse probability to decide to buy a lottery ticket or not. In your study of statistics, you will use the power ofmathematics through probability calculations to analyze and interpret your data.
1.4 Key Terms4
In statistics, we generally want to study a population. You can think of a population as an entire collectionof persons, things, or objects under study. To study the larger population, we select a sample. The idea ofsampling is to select a portion (or subset) of the larger population and study that portion (the sample) togain information about the population. Data are the result of sampling from a population.
Because it takes a lot of time and money to examine an entire population, sampling is a very practicaltechnique. If you wished to compute the overall grade point average at your school, it would make senseto select a sample of students who attend the school. The data collected from the sample would be thestudents’ grade point averages. In presidential elections, opinion poll samples of 1,000 to 2,000 people aretaken. The opinion poll is supposed to represent the views of the people in the entire country. Manu-facturers of canned carbonated drinks take samples to determine if a 16 ounce can contains 16 ounces ofcarbonated drink.
From the sample data, we can calculate a statistic. A statistic is a number that is a property of the sample.For example, if we consider one math class to be a sample of the population of all math classes, then theaverage number of points earned by students in that one math class at the end of the term is an example ofa statistic. The statistic is an estimate of a population parameter. A parameter is a number that is a propertyof the population. Since we considered all math classes to be the population, then the average number ofpoints earned per student over all the math classes is an example of a parameter.
One of the main concerns in the field of statistics is how accurately a statistic estimates a parameter. Theaccuracy really depends on how well the sample represents the population. The sample must contain thecharacteristics of the population in order to be a representative sample. We are interested in both thesample statistic and the population parameter in inferential statistics. In a later chapter, we will use thesample statistic to test the validity of the established population parameter.
A variable, notated by capital letters like X and Y, is a characteristic of interest for each person or thing ina population. Variables may be numerical or categorical. Numerical variables take on values with equalunits such as weight in pounds and time in hours. Categorical variables place the person or thing into a
3This content is available online at <http://cnx.org/content/m16015/1.9/>.4This content is available online at <http://cnx.org/content/m16007/1.14/>.

14 CHAPTER 1. SAMPLING AND DATA
category. If we let X equal the number of points earned by one math student at the end of a term, then Xis a numerical variable. If we let Y be a person’s party affiliation, then examples of Y include Republican,Democrat, and Independent. Y is a categorical variable. We could do some math with values of X (calculatethe average number of points earned, for example), but it makes no sense to do math with values of Y(calculating an average party affiliation makes no sense).
Data are the actual values of the variable. They may be numbers or they may be words. Datum is a singlevalue.
Two words that come up often in statistics are average and proportion. If you were to take three examsin your math classes and obtained scores of 86, 75, and 92, you calculate your average score by adding thethree exam scores and dividing by three (your average score would be 84.3 to one decimal place). If, in yourmath class, there are 40 students and 22 are men and 18 are women, then the proportion of men studentsis 22
40 and the proportion of women students is 1840 . Average and proportion are discussed in more detail in
later chapters.
Example 1.1Define the key terms from the following study: We want to know the average amount of money
first year college students spend at ABC College on school supplies that do not include books. Werandomly survey 100 first year students at the college. Three of those students spent $150, $200,and $225, respectively.
SolutionThe population is all first year students attending ABC College this term.
The sample could be all students enrolled in one section of a beginning statistics course at ABCCollege (although this sample may not represent the entire population).
The parameter is the average amount of money spent (excluding books) by first year college stu-dents at ABC College this term.
The statistic is the average amount of money spent (excluding books) by first year college studentsin the sample.
The variable could be the amount of money spent (excluding books) by one first year student.Let X = the amount of money spent (excluding books) by one first year student attending ABCCollege.
The data are the dollar amounts spent by the first year students. Examples of the data are $150,$200, and $225.
1.4.1 Optional Collaborative Classroom Exercise
Do the following exercise collaboratively with up to four people per group. Find a population, a sample,the parameter, the statistic, a variable, and data for the following study: You want to determine the averagenumber of glasses of milk college students drink per day. Suppose yesterday, in your English class, youasked five students how many glasses of milk they drank the day before. The answers were 1, 0, 1, 3, and 4glasses of milk.
15
1.5 Data5
Data may come from a population or from a sample. Small letters like x or y generally are used to representdata values. Most data can be put into the following categories:
• Qualitative• Quantitative
Qualitative data are the result of categorizing or describing attributes of a population. Hair color, bloodtype, ethnic group, the car a person drives, and the street a person lives on are examples of qualitative data.Qualitative data are generally described by words or letters. For instance, hair color might be black, darkbrown, light brown, blonde, gray, or red. Blood type might be AB+, O-, or B+. Qualitative data are not aswidely used as quantitative data because many numerical techniques do not apply to the qualitative data.For example, it does not make sense to find an average hair color or blood type.
Quantitative data are always numbers and are usually the data of choice because there are many methodsavailable for analyzing the data. Quantitative data are the result of counting or measuring attributes of apopulation. Amount of money, pulse rate, weight, number of people living in your town, and the numberof students who take statistics are examples of quantitative data. Quantitative data may be either discreteor continuous.
All data that are the result of counting are called quantitative discrete data. These data take on only certainnumerical values. If you count the number of phone calls you receive for each day of the week, you mightget 0, 1, 2, 3, etc.
All data that are the result of measuring are quantitative continuous data assuming that we can measureaccurately. Measuring angles in radians might result in the numbers π
6 , π3 , π
2 , π , 3π4 , etc. If you and your
friends carry backpacks with books in them to school, the numbers of books in the backpacks are discretedata and the weights of the backpacks are continuous data.
Example 1.2: Data Sample of Quantitative Discrete DataThe data are the number of books students carry in their backpacks. You sample five students.Two students carry 3 books, one student carries 4 books, one student carries 2 books, and onestudent carries 1 book. The numbers of books (3, 4, 2, and 1) are the quantitative discrete data.
Example 1.3: Data Sample of Quantitative Continuous DataThe data are the weights of the backpacks with the books in it. You sample the same five students.The weights (in pounds) of their backpacks are 6.2, 7, 6.8, 9.1, 4.3. Notice that backpacks carryingthree books can have different weights. Weights are quantitative continuous data because weightsare measured.
Example 1.4: Data Sample of Qualitative DataThe data are the colors of backpacks. Again, you sample the same five students. One student hasa red backpack, two students have black backpacks, one student has a green backpack, and onestudent has a gray backpack. The colors red, black, black, green, and gray are qualitative data.
NOTE: You may collect data as numbers and report it categorically. For example, the quiz scoresfor each student are recorded throughout the term. At the end of the term, the quiz scores arereported as A, B, C, D, or F.
Example 1.5Work collaboratively to determine the correct data type (quantitative or qualitative). Indicate
whether quantitative data are continuous or discrete. Hint: Data that are discrete often start withthe words "the number of."
5This content is available online at <http://cnx.org/content/m16005/1.12/>.
16 CHAPTER 1. SAMPLING AND DATA
1. The number of pairs of shoes you own.2. The type of car you drive.3. Where you go on vacation.4. The distance it is from your home to the nearest grocery store.5. The number of classes you take per school year.6. The tuition for your classes7. The type of calculator you use.8. Movie ratings.9. Political party preferences.
10. Weight of sumo wrestlers.11. Amount of money (in dollars) won playing poker.12. Number of correct answers on a quiz.13. Peoples’ attitudes toward the government.14. IQ scores. (This may cause some discussion.)
1.6 Sampling6
Gathering information about an entire population often costs too much or is virtually impossible. Instead,we use a sample of the population. A sample should have the same characteristics as the population itis representing. Most statisticians use various methods of random sampling in an attempt to achieve thisgoal. This section will describe a few of the most common methods.
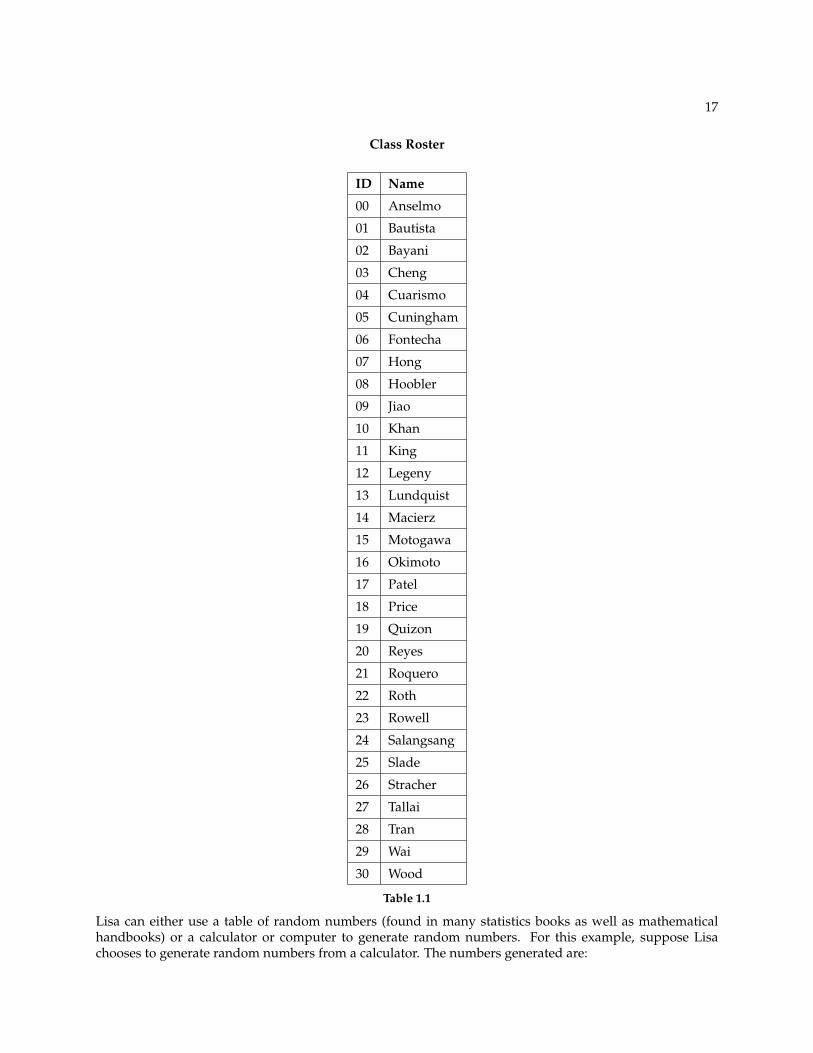
There are several different methods of random sampling. In each form of random sampling, each memberof a population initially has an equal chance of being selected for the sample. Each method has pros andcons. The easiest method to describe is called a simple random sample. Two simple random samplescontain members equally representative of the entire population. In other words, each sample of the samesize has an equal chance of being selected. For example, suppose Lisa wants to form a four-person studygroup (herself and three other people) from her pre-calculus class, which has 32 members including Lisa.To choose a simple random sample of size 3 from the other members of her class, Lisa could put all 32names in a hat, shake the hat, close her eyes, and pick out 3 names. A more technological way is for Lisa tofirst list the last names of the members of her class together with a two-digit number as shown below.
6This content is available online at <http://cnx.org/content/m16014/1.13/>.
17
Class Roster
ID Name
00 Anselmo
01 Bautista
02 Bayani
03 Cheng
04 Cuarismo
05 Cuningham
06 Fontecha
07 Hong
08 Hoobler
09 Jiao
10 Khan
11 King
12 Legeny
13 Lundquist
14 Macierz
15 Motogawa
16 Okimoto
17 Patel
18 Price
19 Quizon
20 Reyes
21 Roquero
22 Roth
23 Rowell
24 Salangsang
25 Slade
26 Stracher
27 Tallai
28 Tran
29 Wai
30 Wood
Table 1.1
Lisa can either use a table of random numbers (found in many statistics books as well as mathematicalhandbooks) or a calculator or computer to generate random numbers. For this example, suppose Lisachooses to generate random numbers from a calculator. The numbers generated are:
18 CHAPTER 1. SAMPLING AND DATA
.94360; .99832; .14669; .51470; .40581; .73381; .04399
Lisa reads two-digit groups until she has chosen three class members (that is, she reads .94360 as the groups94, 43, 36, 60). Each random number may only contribute one class member. If she needed to, Lisa couldhave generated more random numbers.
The random numbers .94360 and .99832 do not contain appropriate two digit numbers. However the thirdrandom number, .14669, contains 14 (the fourth random number also contains 14), the fifth random numbercontains 05, and the seventh random number contains 04. The two-digit number 14 corresponds to Macierz,05 corresponds to Cunningham, and 04 corresponds to Cuarismo. Besides herself, Lisa’s group will consistof Marcierz, and Cunningham, and Cuarismo.
Sometimes, it is difficult or impossible to obtain a simple random sample because populations are toolarge. Then we choose other forms of sampling methods that involve a chance process for getting thesample. Other well-known random sampling methods are the stratified sample, the cluster sample, andthe systematic sample.
To choose a stratified sample, divide the population into groups called strata and then take a sample fromeach stratum. For example, you could stratify (group) your college population by department and thenchoose a simple random sample from each stratum (each department) to get a stratified random sample.To choose a simple random sample from each department, number each member of the first department,number each member of the second department and do the same for the remaining departments. Thenuse simple random sampling to choose numbers from the first department and do the same for each ofthe remaining departments. Those numbers picked from the first department, picked from the seconddepartment and so on represent the members who make up the stratified sample.
To choose a cluster sample, divide the population into strata and then randomly select some of the strata.All the members from these strata are in the cluster sample. For example, if you randomly sample fourdepartments from your stratified college population, the four departments make up the cluster sample.You could do this by numbering the different departments and then choose four different numbers usingsimple random sampling. All members of the four departments with those numbers are the cluster sample.
To choose a systematic sample, randomly select a starting point and take every nth piece of data from alisting of the population. For example, suppose you have to do a phone survey. Your phone book contains20,000 residence listings. You must choose 400 names for the sample. Number the population 1 - 20,000and then use a simple random sample to pick a number that represents the first name of the sample. Thenchoose every 50th name thereafter until you have a total of 400 names (you might have to go back to the ofyour phone list). Systematic sampling is frequently chosen because it is a simple method.
A type of sampling that is nonrandom is convenience sampling. Convenience sampling involves usingresults that are readily available. For example, a computer software store conducts a marketing study byinterviewing potential customers who happen to be in the store browsing through the available software.The results of convenience sampling may be very good in some cases and highly biased (favors certainoutcomes) in others.
Sampling data should be done very carefully. Collecting data carelessly can have devastating results. Sur-veys mailed to households and then returned may be very biased (for example, they may favor a certaingroup). It is better for the person conducting the survey to select the sample respondents.
When you analyze data, it is important to be aware of sampling errors and nonsampling errors. Theactual process of sampling causes sampling errors. For example, the sample may not be large enough orrepresentative of the population. Factors not related to the sampling process cause nonsampling errors. Adefective counting device can cause a nonsampling error.
19
Example 1.6Determine the type of sampling used (simple random, stratified, systematic, cluster, or conve-
nience).
1. A soccer coach selects 6 players from a group of boys aged 8 to 10, 7 players from a group ofboys aged 11 to 12, and 3 players from a group of boys aged 13 to 14 to form a recreationalsoccer team.
2. A pollster interviews all human resource personnel in five different high tech companies.3. An engineering researcher interviews 50 women engineers and 50 men engineers.4. A medical researcher interviews every third cancer patient from a list of cancer patients at a
local hospital.5. A high school counselor uses a computer to generate 50 random numbers and then picks
students whose names correspond to the numbers.6. A student interviews classmates in his algebra class to determine how many pairs of jeans a
student owns, on the average.
Solution
1. stratified2. cluster3. stratified4. systematic5. simple random6. convenience
If we were to examine two samples representing the same population, they would, more than likely, notbe the same. Just as there is variation in data, there is variation in samples. As you become accustomed tosampling, the variability will seem natural.
Example 1.7Suppose ABC College has 10,000 part-time students (the population). We are interested in the
average amount of money a part-time student spends on books in the fall term. Asking all 10,000students is an almost impossible task.
Suppose we take two different samples.
First, we use convenience sampling and survey 10 students from a first term organic chemistryclass. Many of these students are taking first term calculus in addition to the organic chemistryclass . The amount of money they spend is as follows:
$128; $87; $173; $116; $130; $204; $147; $189; $93; $153
The second sample is taken by using a list from the P.E. department of senior citizens who takeP.E. classes and taking every 5th senior citizen on the list, for a total of 10 senior citizens. Theyspend:
$50; $40; $36; $15; $50; $100; $40; $53; $22; $22Problem 1Do you think that either of these samples is representative of (or is characteristic of) the entire
10,000 part-time student population?
20 CHAPTER 1. SAMPLING AND DATA
SolutionNo. The first sample probably consists of science-oriented students. Besides the chemistry course,some of them are taking first-term calculus. Books for these classes tend to be expensive. Mostof these students are, more than likely, paying more than the average part-time student for theirbooks. The second sample is a group of senior citizens who are, more than likely, taking coursesfor health and interest. The amount of money they spend on books is probably much less than theaverage part-time student. Both samples are biased. Also, in both cases, not all students have achance to be in either sample.
Problem 2Since these samples are not representative of the entire population, is it wise to use the results to
describe the entire population?
SolutionNo. Never use a sample that is not representative or does not have the characteristics of the
population.
Now, suppose we take a third sample. We choose ten different part-time students from the disci-plines of chemistry, math, English, psychology, sociology, history, nursing, physical education, art,and early childhood development. Each student is chosen using simple random sampling. Usinga calculator, random numbers are generated and a student from a particular discipline is selectedif he/she has a corresponding number. The students spend:
$180; $50; $150; $85; $260; $75; $180; $200; $200; $150Problem 3Do you think this sample is representative of the population?
SolutionYes. It is chosen from different disciplines across the population.
Students often ask if it is "good enough" to take a sample, instead of surveying the entire popula-tion. If the survey is done well, the answer is yes.
1.6.1 Optional Collaborative Classroom Exercise
Exercise 1.6.1As a class, determine whether or not the following samples are representative. If they are not,
discuss the reasons.
1. To find the average GPA of all students in a university, use all honor students at the univer-sity as the sample.
2. To find out the most popular cereal among young people under the age of 10, stand outsidea large supermarket for three hours and speak to every 20th child under age 10 who entersthe supermarket.
3. To find the average annual income of all adults in the United States, sample U.S. congress-men. Create a cluster sample by considering each state as a stratum (group). By using simplerandom sampling, select states to be part of the cluster. Then survey every U.S. congressmanin the cluster.
21
4. To determine the proportion of people taking public transportation to work, survey 20 peo-ple in New York City. Conduct the survey by sitting in Central Park on a bench and inter-viewing every person who sits next to you.
5. To determine the average cost of a two day stay in a hospital in Massachusetts, survey 100hospitals across the state using simple random sampling.
1.7 Variation7
1.7.1 Variation in Data
Variation is present in any set of data. For example, 16-ounce cans of beverage may contain more or lessthan 16 ounces of liquid. In one study, eight 16 ounce cans were measured and produced the followingamount (in ounces) of beverage:
15.8; 16.1; 15.2; 14.8; 15.8; 15.9; 16.0; 15.5
Measurements of the amount of beverage in a 16-ounce can may vary because different people make themeasurements or because the exact amount, 16 ounces of liquid, was not put into the cans. Manufacturersregularly run tests to determine if the amount of beverage in a 16-ounce can falls within the desired range.
Be aware that as you take data, your data may vary somewhat from the data someone else is taking for thesame purpose. This is completely natural. However, if two or more of you are taking the same data andget very different results, it is time for you and the others to reevaluate your data-taking methods and youraccuracy.
1.7.2 Variation in Samples
It was mentioned previously that two or more samples from the same population and having the samecharacteristics as the population may be different from each other. Suppose Doreen and Jung both decideto study the average amount of time students sleep each night and use all students at their college as thepopulation. Doreen uses systematic sampling and Jung uses cluster sampling. Doreen’s sample will bedifferent from Jung’s sample even though both samples have the characteristics of the population. Evenif Doreen and Jung used the same sampling method, in all likelihood their samples would be different.Neither would be wrong, however.
Think about what contributes to making Doreen’s and Jung’s samples different.
If Doreen and Jung took larger samples (i.e. the number of data values is increased), their sample results(the average amount of time a student sleeps) would be closer to the actual population average. But still,their samples would be, in all likelihood, different from each other. This variability in samples cannot bestressed enough.
1.7.2.1 Size of a Sample
The size of a sample (often called the number of observations) is important. The examples you have seenin this book so far have been small. Samples of only a few hundred observations, or even smaller, aresufficient for many purposes. In polling, samples that are from 1200 to 1500 observations are consideredlarge enough and good enough if the survey is random and is well done. You will learn why when youstudy confidence intervals.
7This content is available online at <http://cnx.org/content/m16021/1.14/>.
22 CHAPTER 1. SAMPLING AND DATA
1.7.2.2 Optional Collaborative Classroom Exercise
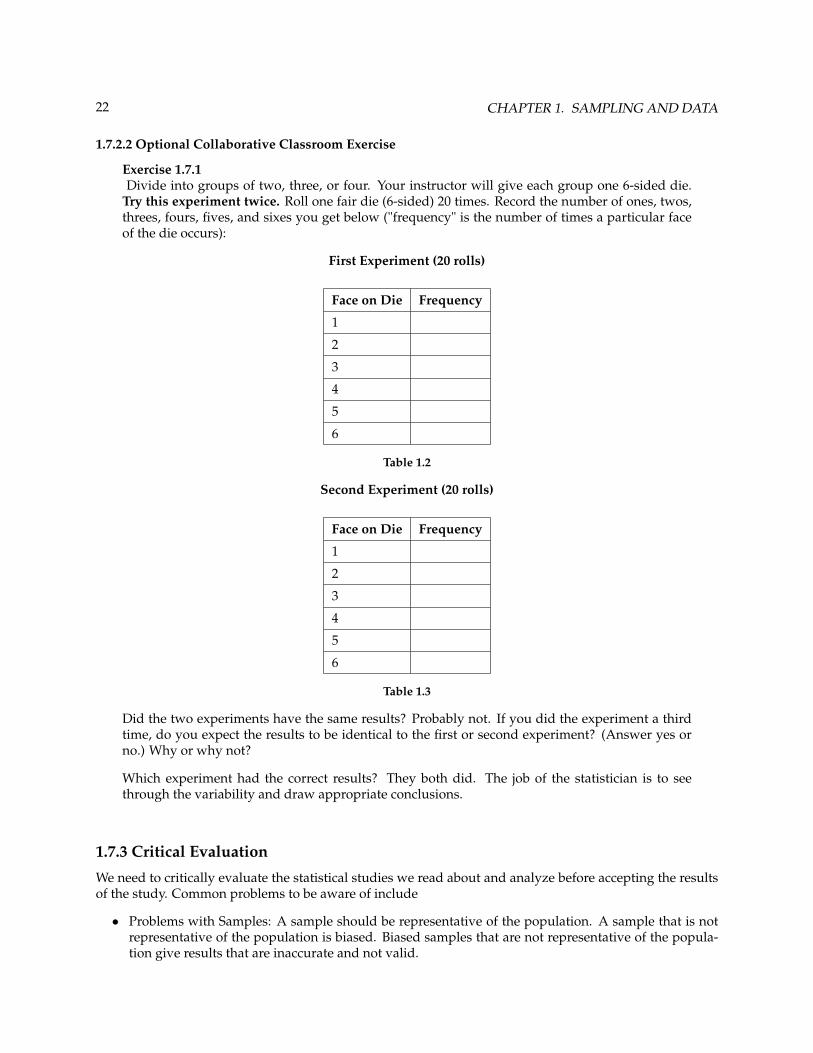
Exercise 1.7.1Divide into groups of two, three, or four. Your instructor will give each group one 6-sided die.
Try this experiment twice. Roll one fair die (6-sided) 20 times. Record the number of ones, twos,threes, fours, fives, and sixes you get below ("frequency" is the number of times a particular faceof the die occurs):
First Experiment (20 rolls)
Face on Die Frequency
1
2
3
4
5
6
Table 1.2
Second Experiment (20 rolls)
Face on Die Frequency
1
2
3
4
5
6
Table 1.3
Did the two experiments have the same results? Probably not. If you did the experiment a thirdtime, do you expect the results to be identical to the first or second experiment? (Answer yes orno.) Why or why not?
Which experiment had the correct results? They both did. The job of the statistician is to seethrough the variability and draw appropriate conclusions.
1.7.3 Critical Evaluation
We need to critically evaluate the statistical studies we read about and analyze before accepting the resultsof the study. Common problems to be aware of include
• Problems with Samples: A sample should be representative of the population. A sample that is notrepresentative of the population is biased. Biased samples that are not representative of the popula-tion give results that are inaccurate and not valid.

23
• Self-Selected Samples: Responses only by people who choose to respond, such as call-in surveys areoften unreliable.
• Sample Size Issues: Samples that are too small may be unreliable. Larger samples are better if possible.In some situations, small samples are unavoidable and can still be used to draw conclusions, eventhough larger samples are better. Examples: Crash testing cars, medical testing for rare conditions.
• Undue influence: Collecting data or asking questions in a way that influences the response.• Non-response or refusal of subject to participate: The collected responses may no longer be represen-
tative of the population. Often, people with strong positive or negative opinions may answer surveys,which can affect the results.
• Causality: A relationship between two variables does not mean that one causes the other to occur.They may both be related (correlated) because of their relationship through a different variable.
• Self-Funded or Self-Interest Studies: A study performed by a person or organization in order to sup-port their claim. Is the study impartial? Read the study carefully to evaluate the work. Do notautomatically assume that the study is good but do not automatically assume the study is bad either.Evaluate it on its merits and the work done.
• Misleading Use of Data: Improperly displayed graphs, incomplete data, lack of context.• Confounding: When the effects of multiple factors on a response cannot be separated. Confounding
makes it difficult or impossible to draw valid conclusions about the effect of each factor.
1.8 Answers and Rounding Off8
A simple way to round off answers is to carry your final answer one more decimal place than was presentin the original data. Round only the final answer. Do not round any intermediate results, if possible. If itbecomes necessary to round intermediate results, carry them to at least twice as many decimal places as thefinal answer. For example, the average of the three quiz scores 4, 6, 9 is 6.3, rounded to the nearest tenth,because the data are whole numbers. Most answers will be rounded in this manner.
It is not necessary to reduce most fractions in this course. Especially in Probability Topics (Section 3.1), thechapter on probability, it is more helpful to leave an answer as an unreduced fraction.
1.9 Frequency9
Twenty students were asked how many hours they worked per day. Their responses, in hours, are listedbelow:
5; 6; 3; 3; 2; 4; 7; 5; 2; 3; 5; 6; 5; 4; 4; 3; 5; 2; 5; 3
Below is a frequency table listing the different data values in ascending order and their frequencies.
8This content is available online at <http://cnx.org/content/m16006/1.7/>.9This content is available online at <http://cnx.org/content/m16012/1.15/>.
24 CHAPTER 1. SAMPLING AND DATA
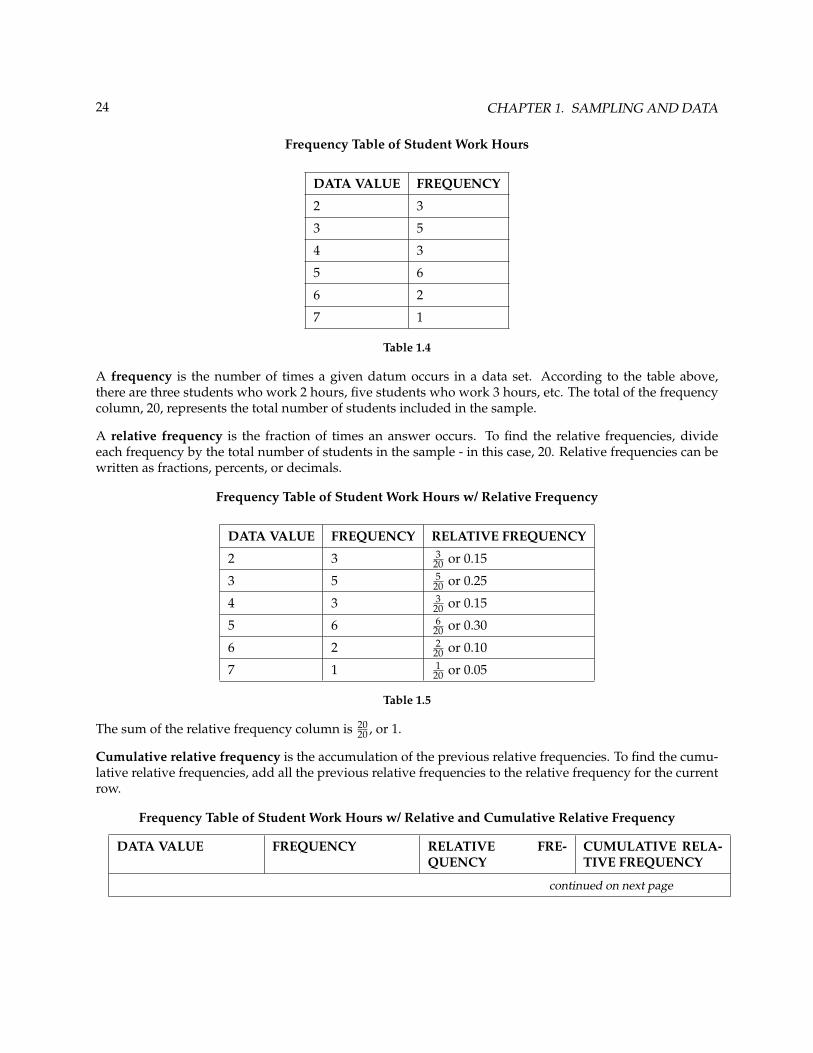
Frequency Table of Student Work Hours
DATA VALUE FREQUENCY
2 3
3 5
4 3
5 6
6 2
7 1
Table 1.4
A frequency is the number of times a given datum occurs in a data set. According to the table above,there are three students who work 2 hours, five students who work 3 hours, etc. The total of the frequencycolumn, 20, represents the total number of students included in the sample.
A relative frequency is the fraction of times an answer occurs. To find the relative frequencies, divideeach frequency by the total number of students in the sample - in this case, 20. Relative frequencies can bewritten as fractions, percents, or decimals.
Frequency Table of Student Work Hours w/ Relative Frequency
DATA VALUE FREQUENCY RELATIVE FREQUENCY
2 3 320 or 0.15
3 5 520 or 0.25
4 3 320 or 0.15
5 6 620 or 0.30
6 2 220 or 0.10
7 1 120 or 0.05
Table 1.5
The sum of the relative frequency column is 2020 , or 1.
Cumulative relative frequency is the accumulation of the previous relative frequencies. To find the cumu-lative relative frequencies, add all the previous relative frequencies to the relative frequency for the currentrow.
Frequency Table of Student Work Hours w/ Relative and Cumulative Relative Frequency
DATA VALUE FREQUENCY RELATIVE FRE-QUENCY
CUMULATIVE RELA-TIVE FREQUENCY
continued on next page
25
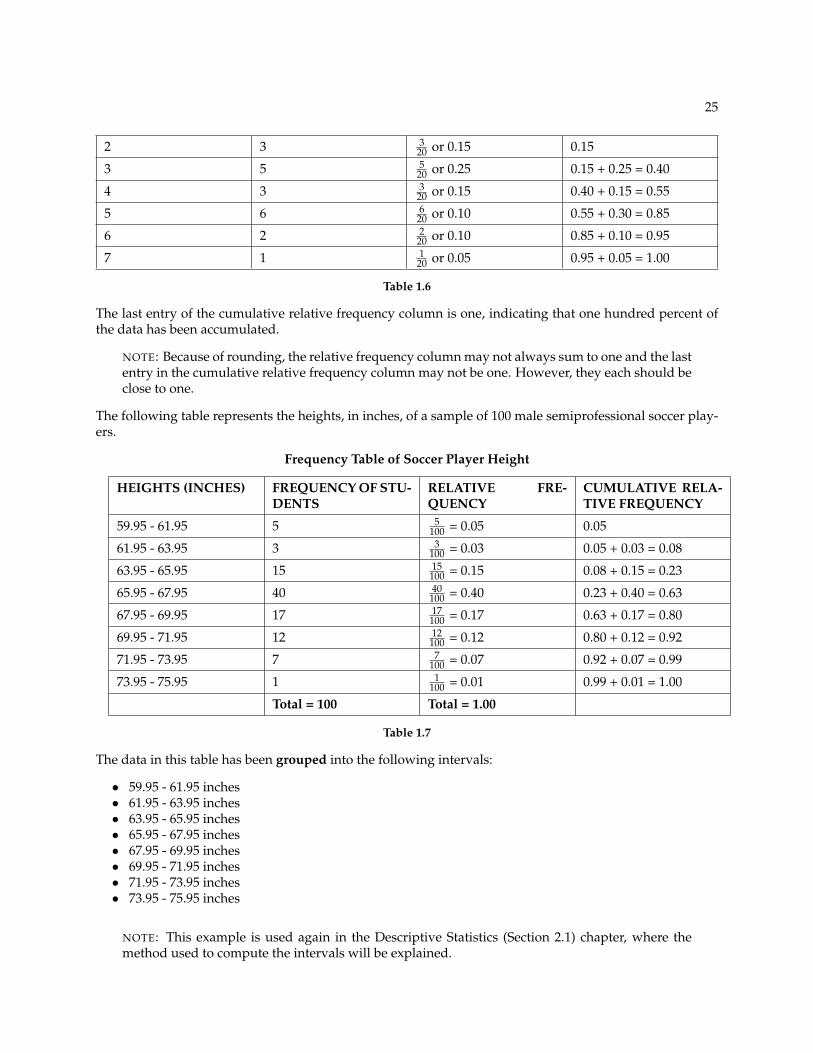
2 3 320 or 0.15 0.15
3 5 520 or 0.25 0.15 + 0.25 = 0.40
4 3 320 or 0.15 0.40 + 0.15 = 0.55
5 6 620 or 0.10 0.55 + 0.30 = 0.85
6 2 220 or 0.10 0.85 + 0.10 = 0.95
7 1 120 or 0.05 0.95 + 0.05 = 1.00
Table 1.6
The last entry of the cumulative relative frequency column is one, indicating that one hundred percent ofthe data has been accumulated.
NOTE: Because of rounding, the relative frequency column may not always sum to one and the lastentry in the cumulative relative frequency column may not be one. However, they each should beclose to one.
The following table represents the heights, in inches, of a sample of 100 male semiprofessional soccer play-ers.
Frequency Table of Soccer Player Height
HEIGHTS (INCHES) FREQUENCY OF STU-DENTS
RELATIVE FRE-QUENCY
CUMULATIVE RELA-TIVE FREQUENCY
59.95 - 61.95 5 5100 = 0.05 0.05
61.95 - 63.95 3 3100 = 0.03 0.05 + 0.03 = 0.08
63.95 - 65.95 15 15100 = 0.15 0.08 + 0.15 = 0.23
65.95 - 67.95 40 40100 = 0.40 0.23 + 0.40 = 0.63
67.95 - 69.95 17 17100 = 0.17 0.63 + 0.17 = 0.80
69.95 - 71.95 12 12100 = 0.12 0.80 + 0.12 = 0.92
71.95 - 73.95 7 7100 = 0.07 0.92 + 0.07 = 0.99
73.95 - 75.95 1 1100 = 0.01 0.99 + 0.01 = 1.00
Total = 100 Total = 1.00
Table 1.7
The data in this table has been grouped into the following intervals:
• 59.95 - 61.95 inches• 61.95 - 63.95 inches• 63.95 - 65.95 inches• 65.95 - 67.95 inches• 67.95 - 69.95 inches• 69.95 - 71.95 inches• 71.95 - 73.95 inches• 73.95 - 75.95 inches
NOTE: This example is used again in the Descriptive Statistics (Section 2.1) chapter, where themethod used to compute the intervals will be explained.
26 CHAPTER 1. SAMPLING AND DATA
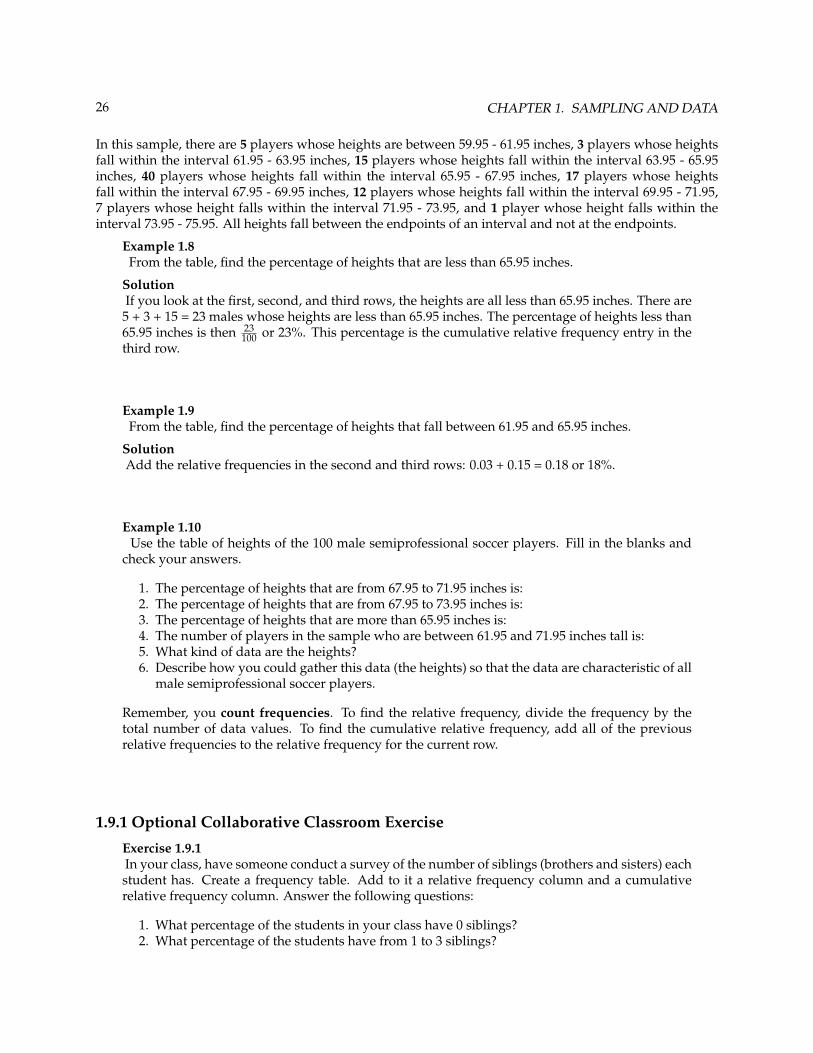
In this sample, there are 5 players whose heights are between 59.95 - 61.95 inches, 3 players whose heightsfall within the interval 61.95 - 63.95 inches, 15 players whose heights fall within the interval 63.95 - 65.95inches, 40 players whose heights fall within the interval 65.95 - 67.95 inches, 17 players whose heightsfall within the interval 67.95 - 69.95 inches, 12 players whose heights fall within the interval 69.95 - 71.95,7 players whose height falls within the interval 71.95 - 73.95, and 1 player whose height falls within theinterval 73.95 - 75.95. All heights fall between the endpoints of an interval and not at the endpoints.
Example 1.8From the table, find the percentage of heights that are less than 65.95 inches.
SolutionIf you look at the first, second, and third rows, the heights are all less than 65.95 inches. There are5 + 3 + 15 = 23 males whose heights are less than 65.95 inches. The percentage of heights less than65.95 inches is then 23
100 or 23%. This percentage is the cumulative relative frequency entry in thethird row.
Example 1.9From the table, find the percentage of heights that fall between 61.95 and 65.95 inches.
SolutionAdd the relative frequencies in the second and third rows: 0.03 + 0.15 = 0.18 or 18%.
Example 1.10Use the table of heights of the 100 male semiprofessional soccer players. Fill in the blanks and
check your answers.
1. The percentage of heights that are from 67.95 to 71.95 inches is:2. The percentage of heights that are from 67.95 to 73.95 inches is:3. The percentage of heights that are more than 65.95 inches is:4. The number of players in the sample who are between 61.95 and 71.95 inches tall is:5. What kind of data are the heights?6. Describe how you could gather this data (the heights) so that the data are characteristic of all
male semiprofessional soccer players.
Remember, you count frequencies. To find the relative frequency, divide the frequency by thetotal number of data values. To find the cumulative relative frequency, add all of the previousrelative frequencies to the relative frequency for the current row.
1.9.1 Optional Collaborative Classroom Exercise
Exercise 1.9.1In your class, have someone conduct a survey of the number of siblings (brothers and sisters) eachstudent has. Create a frequency table. Add to it a relative frequency column and a cumulativerelative frequency column. Answer the following questions:
1. What percentage of the students in your class have 0 siblings?2. What percentage of the students have from 1 to 3 siblings?
27
3. What percentage of the students have fewer than 3 siblings?
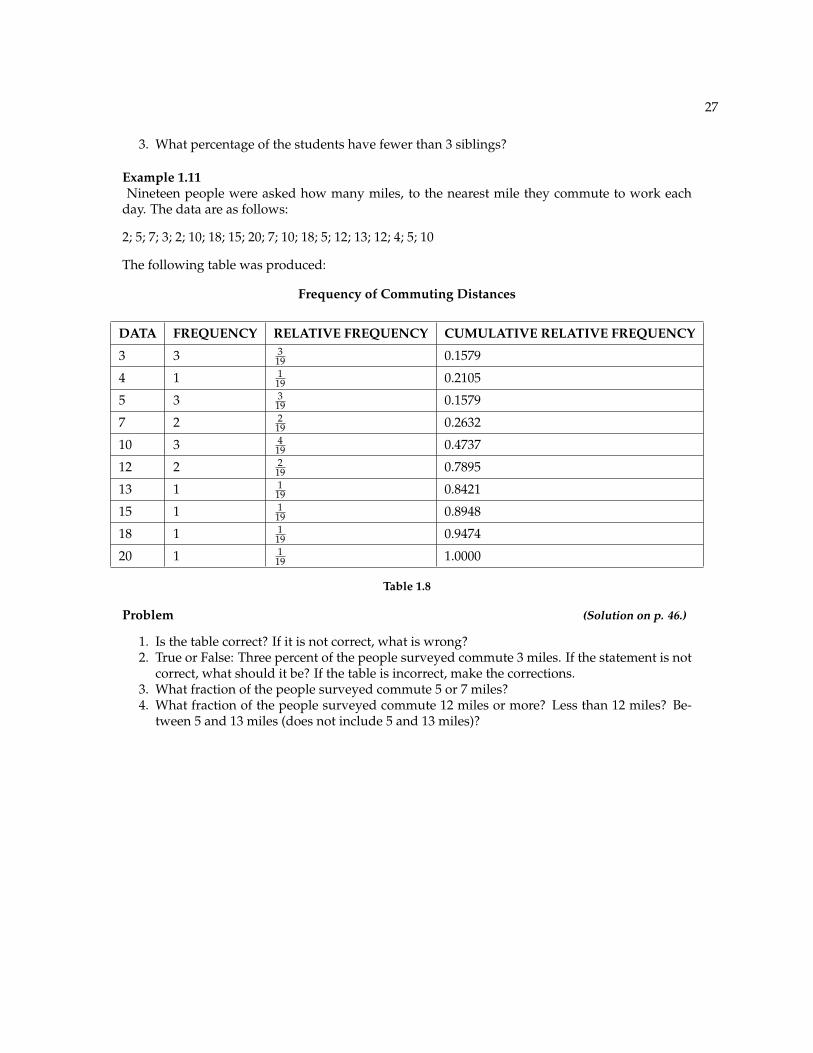
Example 1.11Nineteen people were asked how many miles, to the nearest mile they commute to work each
day. The data are as follows:
2; 5; 7; 3; 2; 10; 18; 15; 20; 7; 10; 18; 5; 12; 13; 12; 4; 5; 10
The following table was produced:
Frequency of Commuting Distances
DATA FREQUENCY RELATIVE FREQUENCY CUMULATIVE RELATIVE FREQUENCY
3 3 319 0.1579
4 1 119 0.2105
5 3 319 0.1579
7 2 219 0.2632
10 3 419 0.4737
12 2 219 0.7895
13 1 119 0.8421
15 1 119 0.8948
18 1 119 0.9474
20 1 119 1.0000
Table 1.8
Problem (Solution on p. 46.)
1. Is the table correct? If it is not correct, what is wrong?2. True or False: Three percent of the people surveyed commute 3 miles. If the statement is not
correct, what should it be? If the table is incorrect, make the corrections.3. What fraction of the people surveyed commute 5 or 7 miles?4. What fraction of the people surveyed commute 12 miles or more? Less than 12 miles? Be-
tween 5 and 13 miles (does not include 5 and 13 miles)?
28 CHAPTER 1. SAMPLING AND DATA
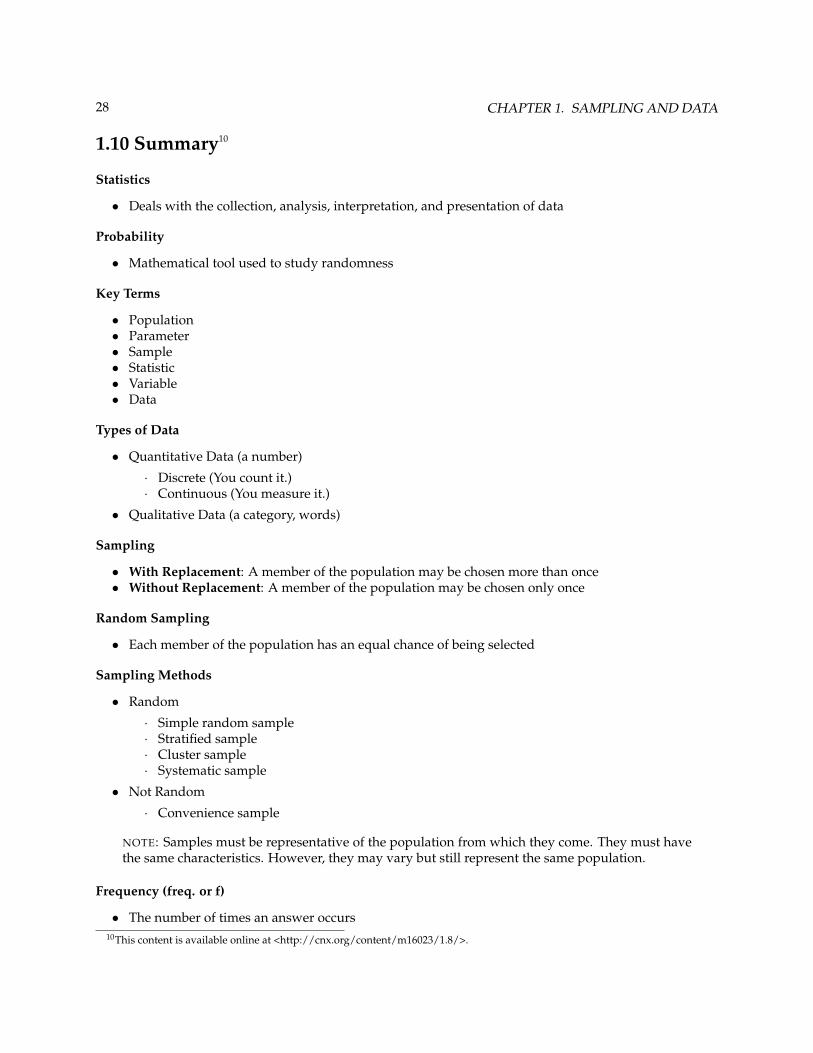
1.10 Summary10
Statistics
• Deals with the collection, analysis, interpretation, and presentation of data
Probability
• Mathematical tool used to study randomness
Key Terms
• Population• Parameter• Sample• Statistic• Variable• Data
Types of Data
• Quantitative Data (a number)
· Discrete (You count it.)· Continuous (You measure it.)
• Qualitative Data (a category, words)
Sampling
• With Replacement: A member of the population may be chosen more than once• Without Replacement: A member of the population may be chosen only once
Random Sampling
• Each member of the population has an equal chance of being selected
Sampling Methods
• Random
· Simple random sample· Stratified sample· Cluster sample· Systematic sample
• Not Random
· Convenience sample
NOTE: Samples must be representative of the population from which they come. They must havethe same characteristics. However, they may vary but still represent the same population.
Frequency (freq. or f)
• The number of times an answer occurs10This content is available online at <http://cnx.org/content/m16023/1.8/>.
29
Relative Frequency (rel. freq. or RF)
• The proportion of times an answer occurs• Can be interpreted as a fraction, decimal, or percent
Cumulative Relative Frequencies (cum. rel. freq. or cum RF)
• An accumulation of the previous relative frequencies
30 CHAPTER 1. SAMPLING AND DATA
1.11 Practice: Sampling and Data11
1.11.1 Student Learning Outcomes
• The student will practice constructing frequency tables.• The student will differentiate between key terms.• The student will compare sampling techniques.
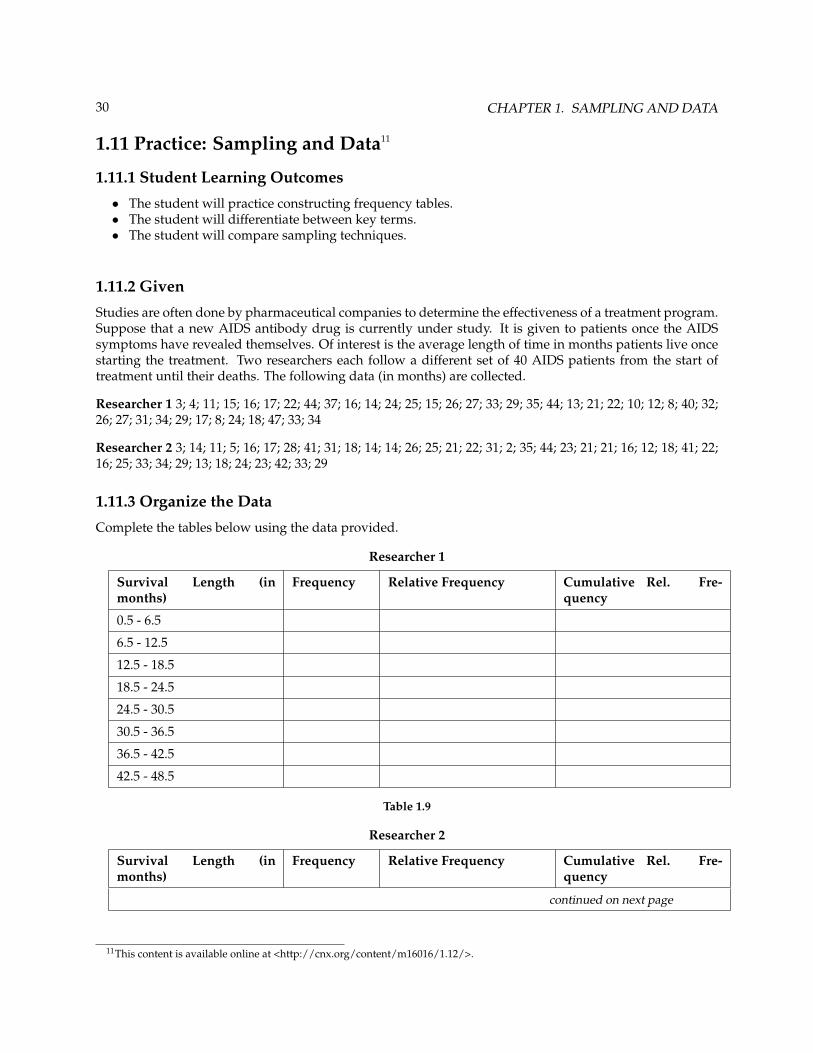
1.11.2 Given
Studies are often done by pharmaceutical companies to determine the effectiveness of a treatment program.Suppose that a new AIDS antibody drug is currently under study. It is given to patients once the AIDSsymptoms have revealed themselves. Of interest is the average length of time in months patients live oncestarting the treatment. Two researchers each follow a different set of 40 AIDS patients from the start oftreatment until their deaths. The following data (in months) are collected.
Researcher 1 3; 4; 11; 15; 16; 17; 22; 44; 37; 16; 14; 24; 25; 15; 26; 27; 33; 29; 35; 44; 13; 21; 22; 10; 12; 8; 40; 32;26; 27; 31; 34; 29; 17; 8; 24; 18; 47; 33; 34
Researcher 2 3; 14; 11; 5; 16; 17; 28; 41; 31; 18; 14; 14; 26; 25; 21; 22; 31; 2; 35; 44; 23; 21; 21; 16; 12; 18; 41; 22;16; 25; 33; 34; 29; 13; 18; 24; 23; 42; 33; 29
1.11.3 Organize the Data
Complete the tables below using the data provided.
Researcher 1
Survival Length (inmonths)
Frequency Relative Frequency Cumulative Rel. Fre-quency
0.5 - 6.5
6.5 - 12.5
12.5 - 18.5
18.5 - 24.5
24.5 - 30.5
30.5 - 36.5
36.5 - 42.5
42.5 - 48.5
Table 1.9
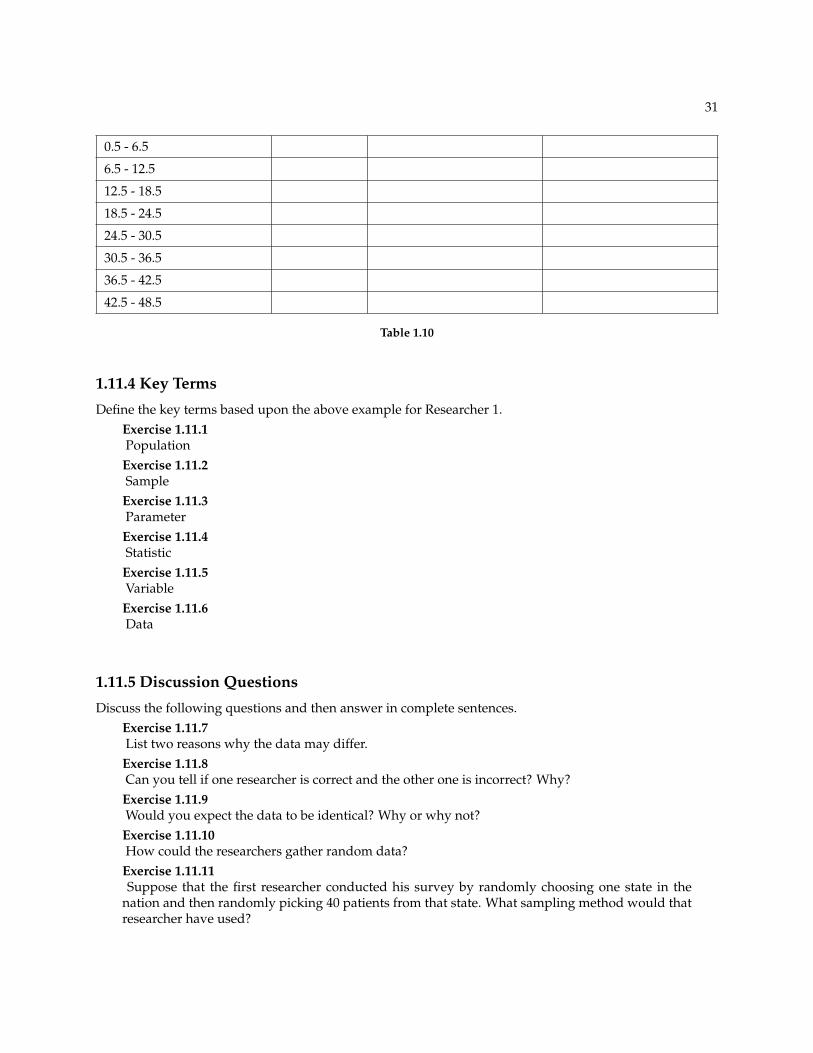
Researcher 2
Survival Length (inmonths)
Frequency Relative Frequency Cumulative Rel. Fre-quency
continued on next page
11This content is available online at <http://cnx.org/content/m16016/1.12/>.
31
0.5 - 6.5
6.5 - 12.5
12.5 - 18.5
18.5 - 24.5
24.5 - 30.5
30.5 - 36.5
36.5 - 42.5
42.5 - 48.5
Table 1.10
1.11.4 Key Terms
Define the key terms based upon the above example for Researcher 1.Exercise 1.11.1Population
Exercise 1.11.2Sample
Exercise 1.11.3Parameter
Exercise 1.11.4Statistic
Exercise 1.11.5Variable
Exercise 1.11.6Data
1.11.5 Discussion Questions
Discuss the following questions and then answer in complete sentences.Exercise 1.11.7List two reasons why the data may differ.
Exercise 1.11.8Can you tell if one researcher is correct and the other one is incorrect? Why?
Exercise 1.11.9Would you expect the data to be identical? Why or why not?
Exercise 1.11.10How could the researchers gather random data?
Exercise 1.11.11Suppose that the first researcher conducted his survey by randomly choosing one state in the
nation and then randomly picking 40 patients from that state. What sampling method would thatresearcher have used?
32 CHAPTER 1. SAMPLING AND DATA
Exercise 1.11.12Suppose that the second researcher conducted his survey by choosing 40 patients he knew. Whatsampling method would that researcher have used? What concerns would you have about thisdata set, based upon the data collection method?
33
1.12 Homework12
Exercise 1.12.1 (Solution on p. 46.)For each item below:
i. Identify the type of data (quantitative - discrete, quantitative - continuous, or qualitative)that would be used to describe a response.
ii. Give an example of the data.
a. Number of tickets sold to a concertb. Amount of body fatc. Favorite baseball teamd. Time in line to buy groceriese. Number of students enrolled at Evergreen Valley Collegef. Most–watched television showg. Brand of toothpasteh. Distance to the closest movie theatrei. Age of executives in Fortune 500 companiesj. Number of competing computer spreadsheet software packages
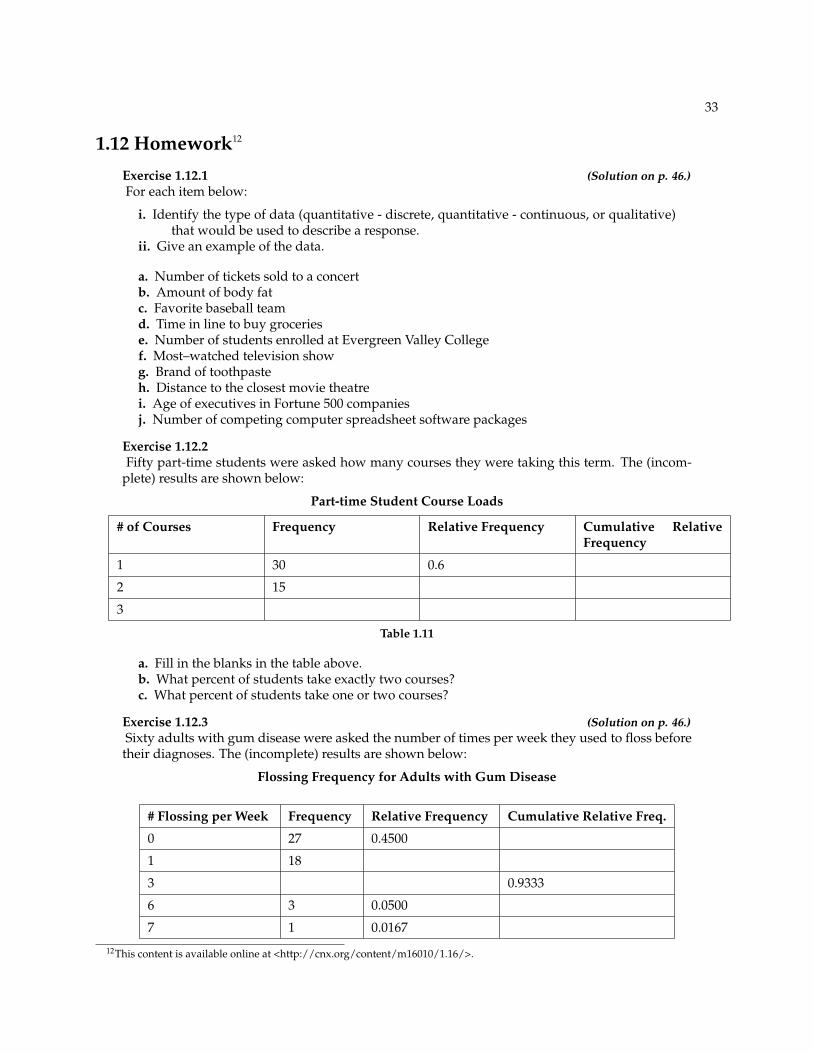
Exercise 1.12.2Fifty part-time students were asked how many courses they were taking this term. The (incom-
plete) results are shown below:
Part-time Student Course Loads
# of Courses Frequency Relative Frequency Cumulative RelativeFrequency
1 30 0.6
2 15
3
Table 1.11
a. Fill in the blanks in the table above.b. What percent of students take exactly two courses?c. What percent of students take one or two courses?
Exercise 1.12.3 (Solution on p. 46.)Sixty adults with gum disease were asked the number of times per week they used to floss beforetheir diagnoses. The (incomplete) results are shown below:
Flossing Frequency for Adults with Gum Disease
# Flossing per Week Frequency Relative Frequency Cumulative Relative Freq.
0 27 0.4500
1 18
3 0.9333
6 3 0.0500
7 1 0.0167
12This content is available online at <http://cnx.org/content/m16010/1.16/>.
34 CHAPTER 1. SAMPLING AND DATA
Table 1.12
a. Fill in the blanks in the table above.b. What percent of adults flossed six times per week?c. What percent flossed at most three times per week?
Exercise 1.12.4A fitness center is interested in the average amount of time a client exercises in the center each
week. Define the following in terms of the study. Give examples where appropriate.
a. Populationb. Samplec. Parameterd. Statistice. Variablef. Data
Exercise 1.12.5 (Solution on p. 46.)Ski resorts are interested in the average age that children take their first ski and snowboard
lessons. They need this information to optimally plan their ski classes. Define the following interms of the study. Give examples where appropriate.
a. Populationb. Samplec. Parameterd. Statistice. Variablef. Data
Exercise 1.12.6A cardiologist is interested in the average recovery period for her patients who have had heart
attacks. Define the following in terms of the study. Give examples where appropriate.
a. Populationb. Samplec. Parameterd. Statistice. Variablef. Data
Exercise 1.12.7 (Solution on p. 46.)Insurance companies are interested in the average health costs each year for their clients, so that
they can determine the costs of health insurance. Define the following in terms of the study. Giveexamples where appropriate.
a. Populationb. Samplec. Parameterd. Statistice. Variablef. Data

35
Exercise 1.12.8A politician is interested in the proportion of voters in his district that think he is doing a good
job. Define the following in terms of the study. Give examples where appropriate.
a. Populationb. Samplec. Parameterd. Statistice. Variablef. Data
Exercise 1.12.9 (Solution on p. 47.)A marriage counselor is interested in the proportion the clients she counsels that stay married.
Define the following in terms of the study. Give examples where appropriate.
a. Populationb. Samplec. Parameterd. Statistice. Variablef. Data
Exercise 1.12.10Political pollsters may be interested in the proportion of people that will vote for a particular
cause. Define the following in terms of the study. Give examples where appropriate.
a. Populationb. Samplec. Parameterd. Statistice. Variablef. Data
Exercise 1.12.11 (Solution on p. 47.)A marketing company is interested in the proportion of people that will buy a particular product.Define the following in terms of the study. Give examples where appropriate.
a. Populationb. Samplec. Parameterd. Statistice. Variablef. Data
Exercise 1.12.12Airline companies are interested in the consistency of the number of babies on each flight, so thatthey have adequate safety equipment. Suppose an airline conducts a survey. Over Thanksgivingweekend, it surveys 6 flights from Boston to Salt Lake City to determine the number of babies onthe flights. It determines the amount of safety equipment needed by the result of that study.
a. Using complete sentences, list three things wrong with the way the survey was conducted.b. Using complete sentences, list three ways that you would improve the survey if it were to
be repeated.
36 CHAPTER 1. SAMPLING AND DATA
Exercise 1.12.13Suppose you want to determine the average number of students per statistics class in your state.
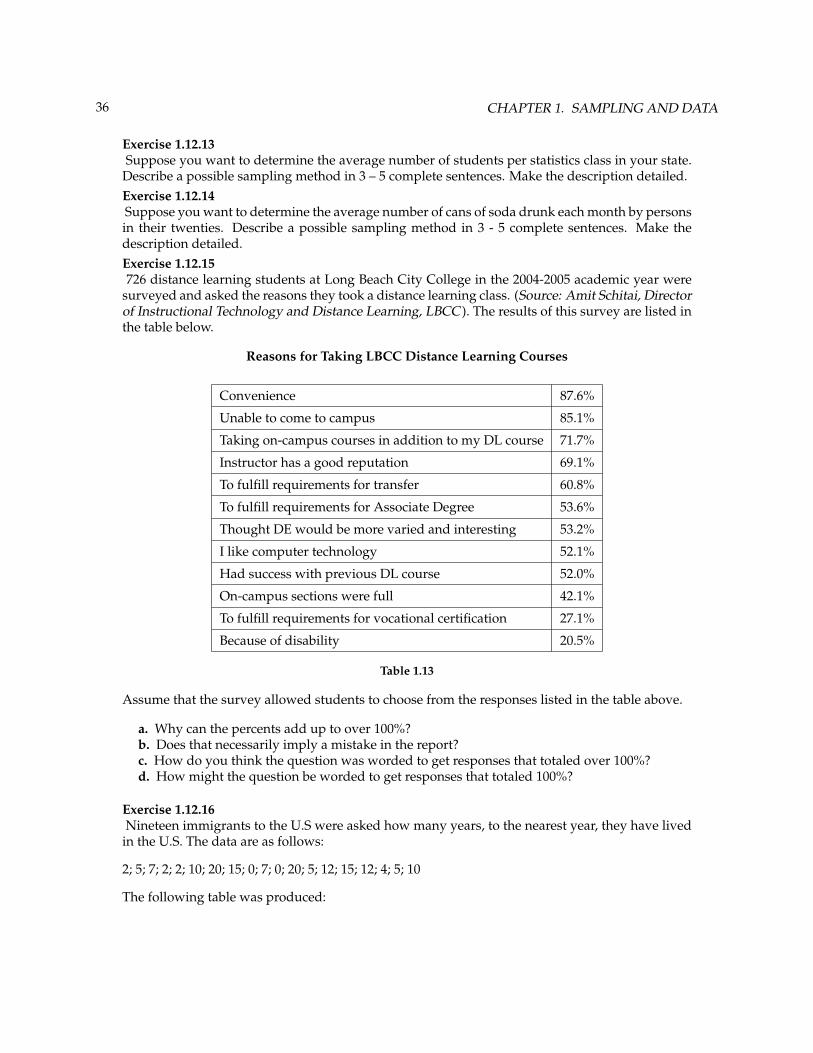
Describe a possible sampling method in 3 – 5 complete sentences. Make the description detailed.Exercise 1.12.14Suppose you want to determine the average number of cans of soda drunk each month by personsin their twenties. Describe a possible sampling method in 3 - 5 complete sentences. Make thedescription detailed.Exercise 1.12.15726 distance learning students at Long Beach City College in the 2004-2005 academic year were
surveyed and asked the reasons they took a distance learning class. (Source: Amit Schitai, Directorof Instructional Technology and Distance Learning, LBCC ). The results of this survey are listed inthe table below.
Reasons for Taking LBCC Distance Learning Courses
Convenience 87.6%
Unable to come to campus 85.1%
Taking on-campus courses in addition to my DL course 71.7%
Instructor has a good reputation 69.1%
To fulfill requirements for transfer 60.8%
To fulfill requirements for Associate Degree 53.6%
Thought DE would be more varied and interesting 53.2%
I like computer technology 52.1%
Had success with previous DL course 52.0%
On-campus sections were full 42.1%
To fulfill requirements for vocational certification 27.1%
Because of disability 20.5%
Table 1.13
Assume that the survey allowed students to choose from the responses listed in the table above.
a. Why can the percents add up to over 100%?b. Does that necessarily imply a mistake in the report?c. How do you think the question was worded to get responses that totaled over 100%?d. How might the question be worded to get responses that totaled 100%?
Exercise 1.12.16Nineteen immigrants to the U.S were asked how many years, to the nearest year, they have lived
in the U.S. The data are as follows:
2; 5; 7; 2; 2; 10; 20; 15; 0; 7; 0; 20; 5; 12; 15; 12; 4; 5; 10
The following table was produced:
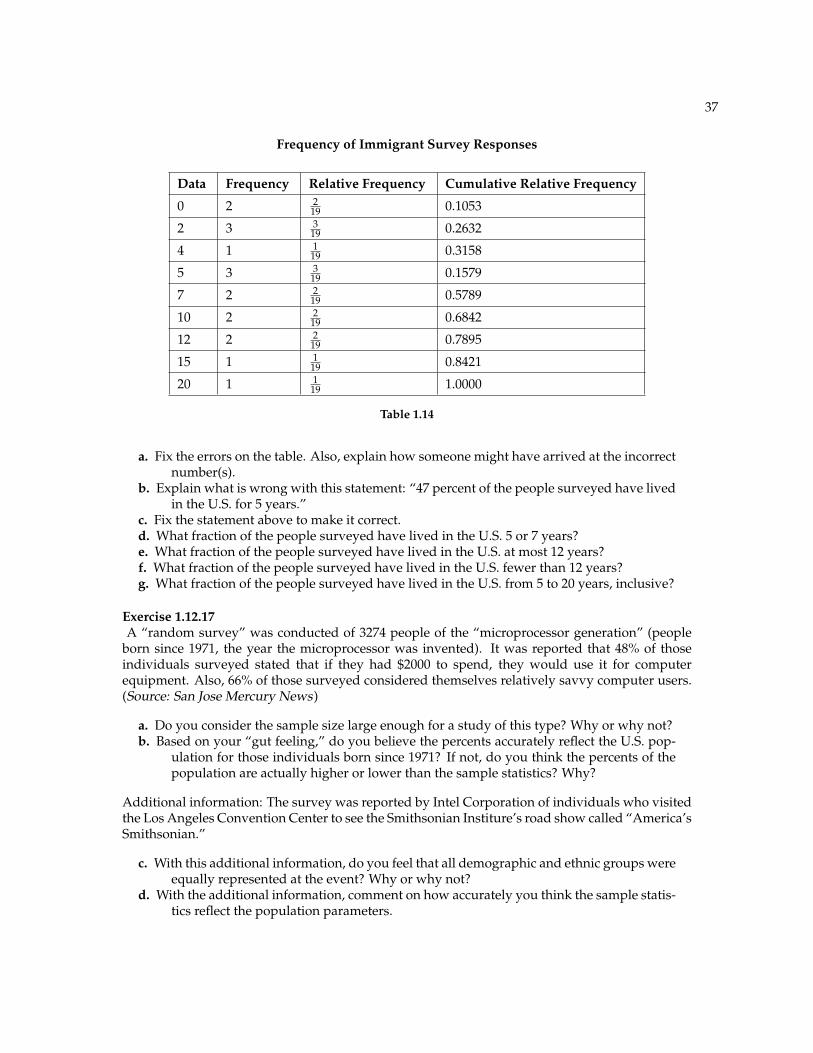
37
Frequency of Immigrant Survey Responses
Data Frequency Relative Frequency Cumulative Relative Frequency
0 2 219 0.1053
2 3 319 0.2632
4 1 119 0.3158
5 3 319 0.1579
7 2 219 0.5789
10 2 219 0.6842
12 2 219 0.7895
15 1 119 0.8421
20 1 119 1.0000
Table 1.14
a. Fix the errors on the table. Also, explain how someone might have arrived at the incorrectnumber(s).
b. Explain what is wrong with this statement: “47 percent of the people surveyed have livedin the U.S. for 5 years.”
c. Fix the statement above to make it correct.d. What fraction of the people surveyed have lived in the U.S. 5 or 7 years?e. What fraction of the people surveyed have lived in the U.S. at most 12 years?f. What fraction of the people surveyed have lived in the U.S. fewer than 12 years?g. What fraction of the people surveyed have lived in the U.S. from 5 to 20 years, inclusive?
Exercise 1.12.17A “random survey” was conducted of 3274 people of the “microprocessor generation” (people
born since 1971, the year the microprocessor was invented). It was reported that 48% of thoseindividuals surveyed stated that if they had $2000 to spend, they would use it for computerequipment. Also, 66% of those surveyed considered themselves relatively savvy computer users.(Source: San Jose Mercury News)
a. Do you consider the sample size large enough for a study of this type? Why or why not?b. Based on your “gut feeling,” do you believe the percents accurately reflect the U.S. pop-
ulation for those individuals born since 1971? If not, do you think the percents of thepopulation are actually higher or lower than the sample statistics? Why?
Additional information: The survey was reported by Intel Corporation of individuals who visitedthe Los Angeles Convention Center to see the Smithsonian Institure’s road show called “America’sSmithsonian.”
c. With this additional information, do you feel that all demographic and ethnic groups wereequally represented at the event? Why or why not?
d. With the additional information, comment on how accurately you think the sample statis-tics reflect the population parameters.
38 CHAPTER 1. SAMPLING AND DATA
Exercise 1.12.18
a. List some practical difficulties involved in getting accurate results from a telephone sur-vey.
b. List some practical difficulties involved in getting accurate results from a mailed survey.c. With your classmates, brainstorm some ways to overcome these problems if you needed
to conduct a phone or mail survey.
1.12.1 Try these multiple choice questions
The next four questions refer to the following: A Lake Tahoe Community College instructor is interestedin the average number of days Lake Tahoe Community College math students are absent from class duringa quarter.
Exercise 1.12.19 (Solution on p. 47.)What is the population she is interested in?
A. All Lake Tahoe Community College studentsB. All Lake Tahoe Community College English studentsC. All Lake Tahoe Community College students in her classesD. All Lake Tahoe Community College math students
Exercise 1.12.20 (Solution on p. 47.)Consider the following:
X = number of days a Lake Tahoe Community College math student is absent
In this case, X is an example of a:
A. VariableB. PopulationC. StatisticD. Data
Exercise 1.12.21 (Solution on p. 47.)The instructor takes her sample by gathering data on 5 randomly selected students from each
Lake Tahoe Community College math class. The type of sampling she used is
A. Cluster samplingB. Stratified samplingC. Simple random samplingD. Convenience sampling
Exercise 1.12.22 (Solution on p. 47.)The instructor’s sample produces an average number of days absent of 3.5 days. This value is an
example of a
A. ParameterB. DataC. StatisticD. Variable
39
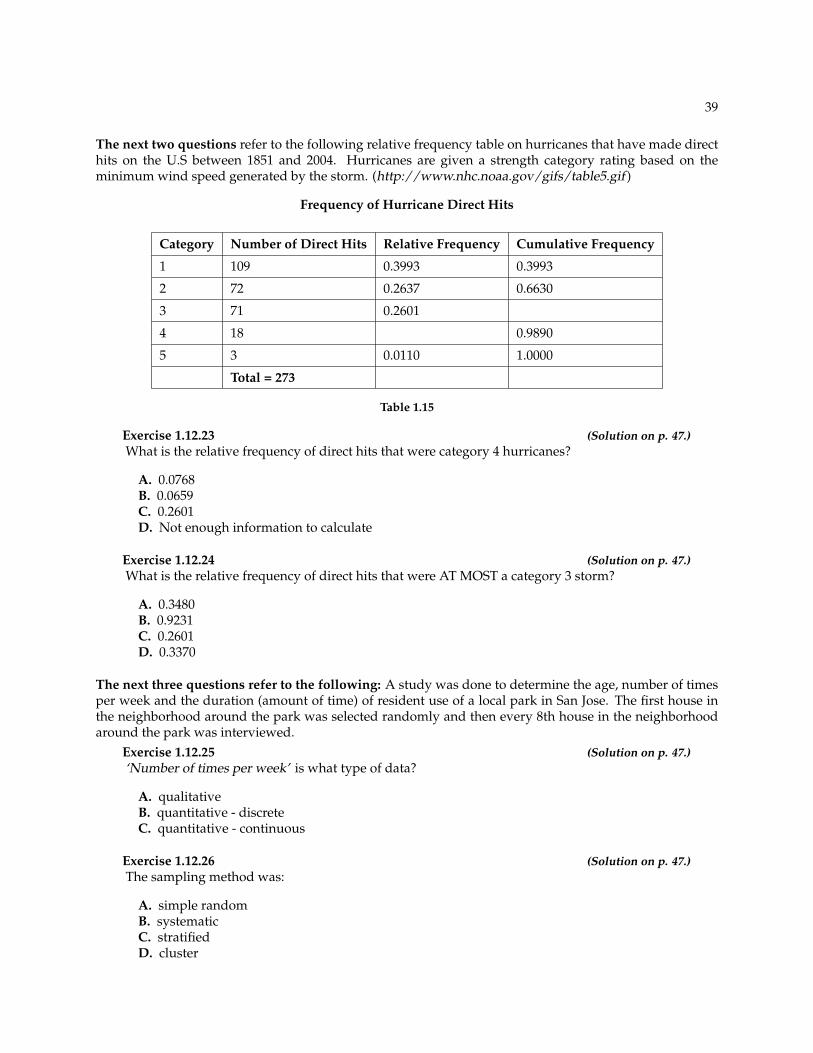
The next two questions refer to the following relative frequency table on hurricanes that have made directhits on the U.S between 1851 and 2004. Hurricanes are given a strength category rating based on theminimum wind speed generated by the storm. (http://www.nhc.noaa.gov/gifs/table5.gif )
Frequency of Hurricane Direct Hits
Category Number of Direct Hits Relative Frequency Cumulative Frequency
1 109 0.3993 0.3993
2 72 0.2637 0.6630
3 71 0.2601
4 18 0.9890
5 3 0.0110 1.0000
Total = 273
Table 1.15
Exercise 1.12.23 (Solution on p. 47.)What is the relative frequency of direct hits that were category 4 hurricanes?
A. 0.0768B. 0.0659C. 0.2601D. Not enough information to calculate
Exercise 1.12.24 (Solution on p. 47.)What is the relative frequency of direct hits that were AT MOST a category 3 storm?
A. 0.3480B. 0.9231C. 0.2601D. 0.3370
The next three questions refer to the following: A study was done to determine the age, number of timesper week and the duration (amount of time) of resident use of a local park in San Jose. The first house inthe neighborhood around the park was selected randomly and then every 8th house in the neighborhoodaround the park was interviewed.
Exercise 1.12.25 (Solution on p. 47.)‘Number of times per week’ is what type of data?
A. qualitativeB. quantitative - discreteC. quantitative - continuous
Exercise 1.12.26 (Solution on p. 47.)The sampling method was:
A. simple randomB. systematicC. stratifiedD. cluster

40 CHAPTER 1. SAMPLING AND DATA
Exercise 1.12.27 (Solution on p. 47.)‘Duration (amount of time)’ is what type of data?
A. qualitativeB. quantitative - discreteC. quantitative - continuous
41
1.13 Lab 1: Data Collection13
Class Time:
Names:
1.13.1 Student Learning Outcomes
• The student will demonstrate the systematic sampling technique.• The student will construct Relative Frequency Tables.• The student will interpret results and their differences from different data groupings.
1.13.2 Movie Survey
Ask five classmates from a different class how many movies they saw last month at the theater. Do notinclude rented movies.
1. Record the data2. In class, randomly pick one person. On the class list, mark that person’s name. Move down four
people’s names on the class list. Mark that person’s name. Continue doing this until you have marked12 people’s names. You may need to go back to the start of the list. For each marked name recordbelow the five data values. You now have a total of 60 data values.
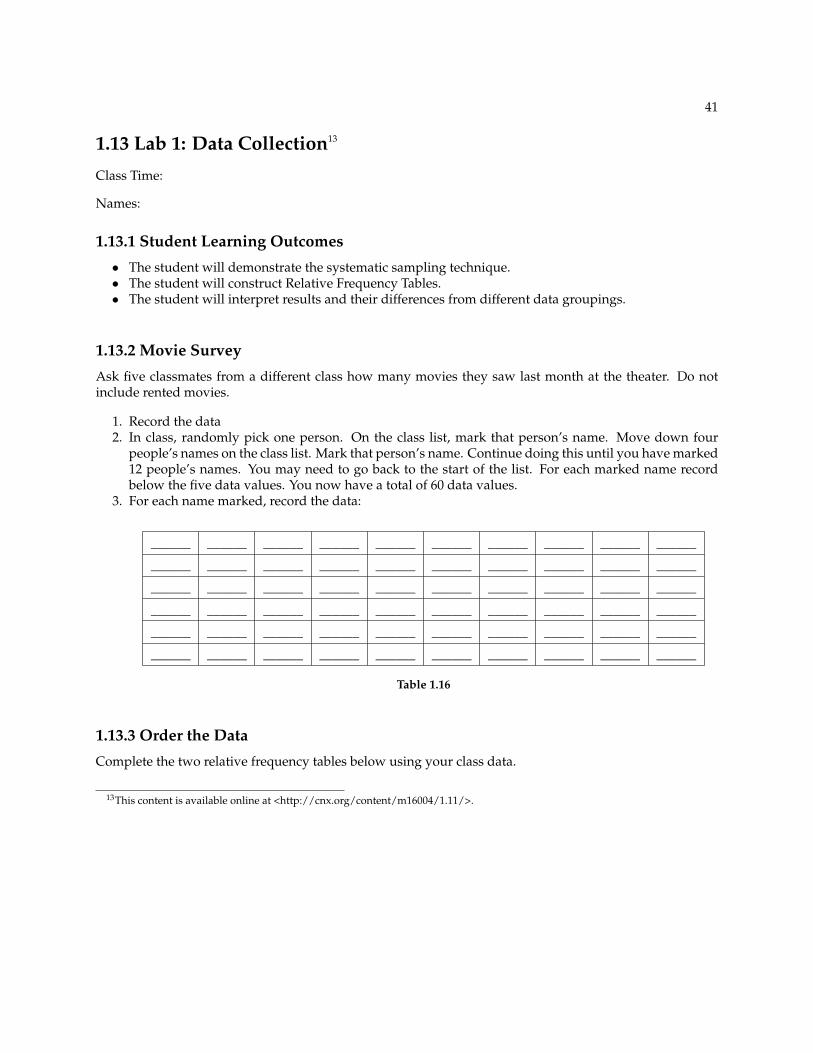
3. For each name marked, record the data:
______ ______ ______ ______ ______ ______ ______ ______ ______ ______
______ ______ ______ ______ ______ ______ ______ ______ ______ ______
______ ______ ______ ______ ______ ______ ______ ______ ______ ______
______ ______ ______ ______ ______ ______ ______ ______ ______ ______
______ ______ ______ ______ ______ ______ ______ ______ ______ ______
______ ______ ______ ______ ______ ______ ______ ______ ______ ______
Table 1.16
1.13.3 Order the Data
Complete the two relative frequency tables below using your class data.
13This content is available online at <http://cnx.org/content/m16004/1.11/>.
42 CHAPTER 1. SAMPLING AND DATA
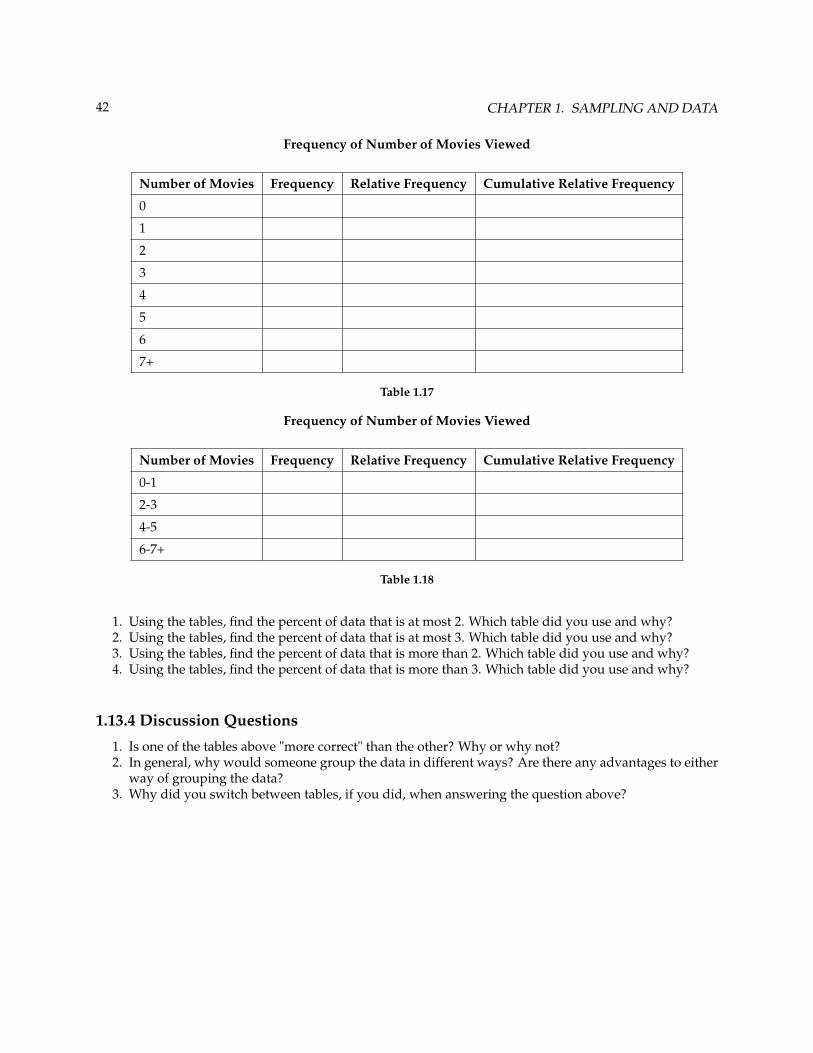
Frequency of Number of Movies Viewed
Number of Movies Frequency Relative Frequency Cumulative Relative Frequency
0
1
2
3
4
5
6
7+
Table 1.17
Frequency of Number of Movies Viewed
Number of Movies Frequency Relative Frequency Cumulative Relative Frequency
0-1
2-3
4-5
6-7+
Table 1.18
1. Using the tables, find the percent of data that is at most 2. Which table did you use and why?2. Using the tables, find the percent of data that is at most 3. Which table did you use and why?3. Using the tables, find the percent of data that is more than 2. Which table did you use and why?4. Using the tables, find the percent of data that is more than 3. Which table did you use and why?
1.13.4 Discussion Questions
1. Is one of the tables above "more correct" than the other? Why or why not?2. In general, why would someone group the data in different ways? Are there any advantages to either
way of grouping the data?3. Why did you switch between tables, if you did, when answering the question above?
43
1.14 Lab 2: Sampling Experiment14
Class Time:
Names:
1.14.1 Student Learning Outcomes
• The student will demonstrate the simple random, systematic, stratified, and cluster sampling tech-niques.
• The student will explain each of the details of each procedure used.
In this lab, you will be asked to pick several random samples. In each case, describe your procedure briefly,including how you might have used the random number generator, and then list the restaurants in thesample you obtained
NOTE: The following section contains restaurants stratified by city into columns and groupedhorizontally by entree cost (clusters).
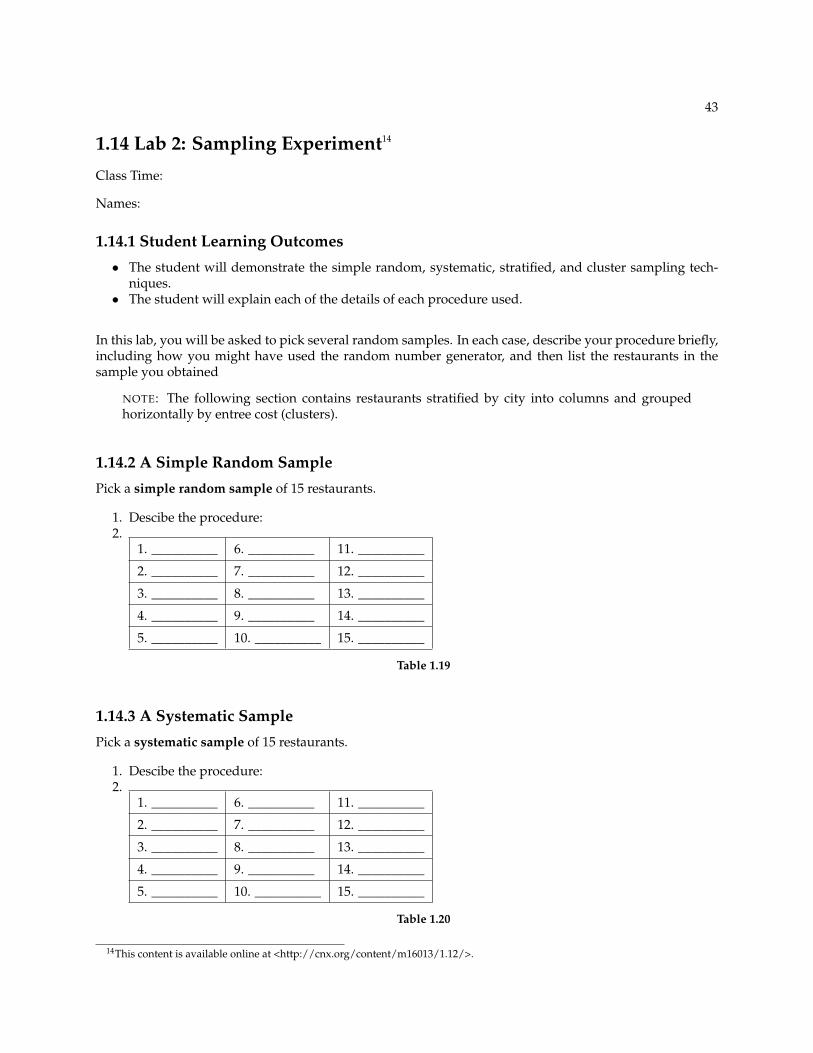
1.14.2 A Simple Random Sample
Pick a simple random sample of 15 restaurants.
1. Descibe the procedure:2.
1. __________ 6. __________ 11. __________
2. __________ 7. __________ 12. __________
3. __________ 8. __________ 13. __________
4. __________ 9. __________ 14. __________
5. __________ 10. __________ 15. __________
Table 1.19
1.14.3 A Systematic Sample
Pick a systematic sample of 15 restaurants.
1. Descibe the procedure:2.
1. __________ 6. __________ 11. __________
2. __________ 7. __________ 12. __________
3. __________ 8. __________ 13. __________
4. __________ 9. __________ 14. __________
5. __________ 10. __________ 15. __________
Table 1.20
14This content is available online at <http://cnx.org/content/m16013/1.12/>.
44 CHAPTER 1. SAMPLING AND DATA
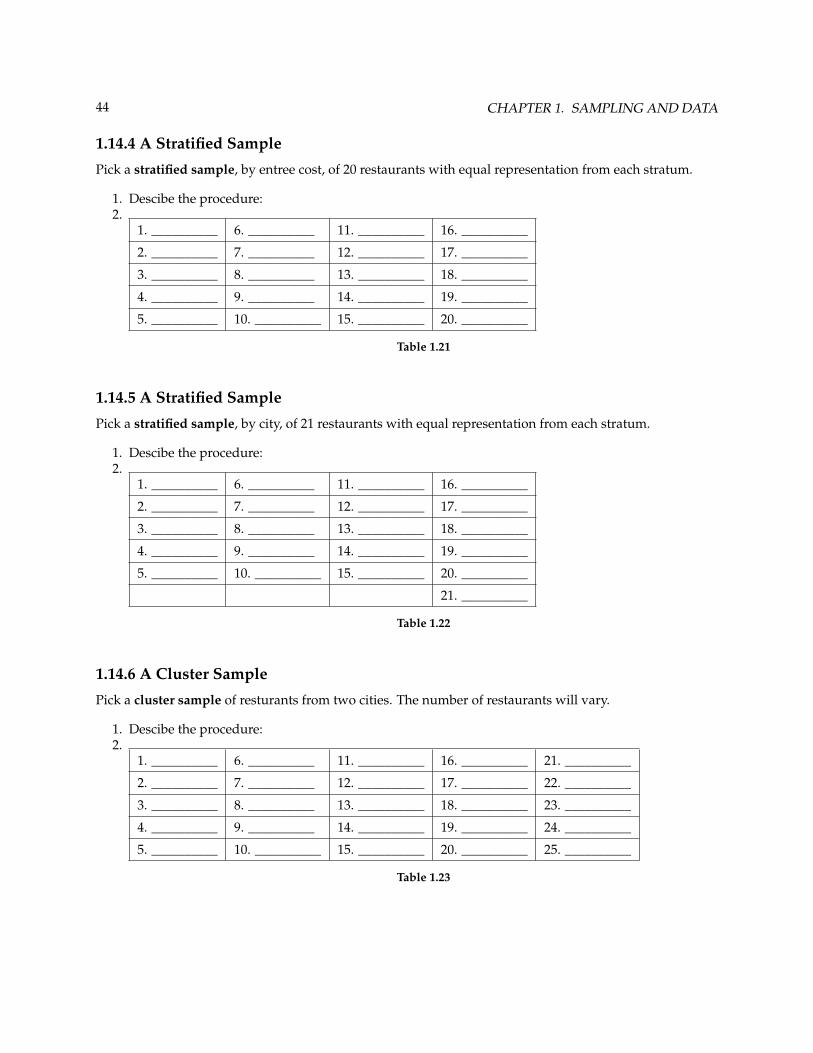
1.14.4 A Stratified Sample
Pick a stratified sample, by entree cost, of 20 restaurants with equal representation from each stratum.
1. Descibe the procedure:2.
1. __________ 6. __________ 11. __________ 16. __________
2. __________ 7. __________ 12. __________ 17. __________
3. __________ 8. __________ 13. __________ 18. __________
4. __________ 9. __________ 14. __________ 19. __________
5. __________ 10. __________ 15. __________ 20. __________
Table 1.21
1.14.5 A Stratified Sample
Pick a stratified sample, by city, of 21 restaurants with equal representation from each stratum.
1. Descibe the procedure:2.
1. __________ 6. __________ 11. __________ 16. __________
2. __________ 7. __________ 12. __________ 17. __________
3. __________ 8. __________ 13. __________ 18. __________
4. __________ 9. __________ 14. __________ 19. __________
5. __________ 10. __________ 15. __________ 20. __________
21. __________
Table 1.22
1.14.6 A Cluster Sample
Pick a cluster sample of resturants from two cities. The number of restaurants will vary.
1. Descibe the procedure:2.
1. __________ 6. __________ 11. __________ 16. __________ 21. __________
2. __________ 7. __________ 12. __________ 17. __________ 22. __________
3. __________ 8. __________ 13. __________ 18. __________ 23. __________
4. __________ 9. __________ 14. __________ 19. __________ 24. __________
5. __________ 10. __________ 15. __________ 20. __________ 25. __________
Table 1.23
45
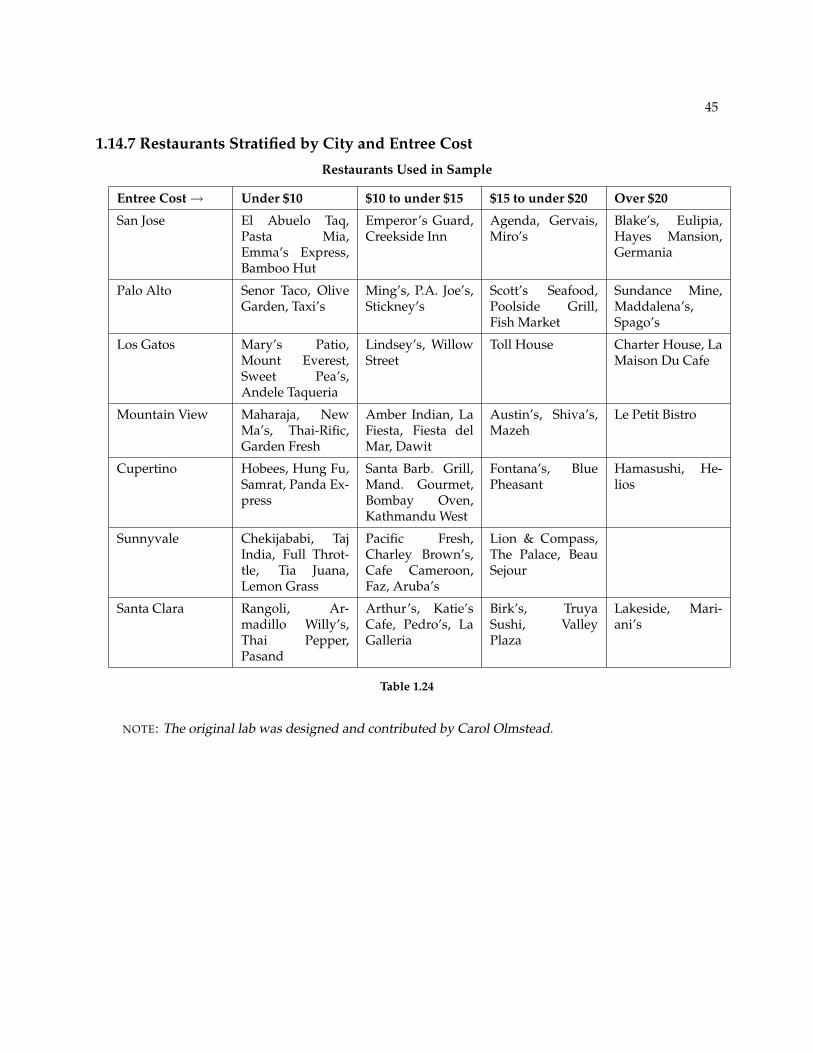
1.14.7 Restaurants Stratified by City and Entree Cost
Restaurants Used in Sample
Entree Cost→ Under $10 $10 to under $15 $15 to under $20 Over $20
San Jose El Abuelo Taq,Pasta Mia,Emma’s Express,Bamboo Hut
Emperor’s Guard,Creekside Inn
Agenda, Gervais,Miro’s
Blake’s, Eulipia,Hayes Mansion,Germania
Palo Alto Senor Taco, OliveGarden, Taxi’s
Ming’s, P.A. Joe’s,Stickney’s
Scott’s Seafood,Poolside Grill,Fish Market
Sundance Mine,Maddalena’s,Spago’s
Los Gatos Mary’s Patio,Mount Everest,Sweet Pea’s,Andele Taqueria
Lindsey’s, WillowStreet
Toll House Charter House, LaMaison Du Cafe
Mountain View Maharaja, NewMa’s, Thai-Rific,Garden Fresh
Amber Indian, LaFiesta, Fiesta delMar, Dawit
Austin’s, Shiva’s,Mazeh
Le Petit Bistro
Cupertino Hobees, Hung Fu,Samrat, Panda Ex-press
Santa Barb. Grill,Mand. Gourmet,Bombay Oven,Kathmandu West
Fontana’s, BluePheasant
Hamasushi, He-lios
Sunnyvale Chekijababi, TajIndia, Full Throt-tle, Tia Juana,Lemon Grass
Pacific Fresh,Charley Brown’s,Cafe Cameroon,Faz, Aruba’s
Lion & Compass,The Palace, BeauSejour
Santa Clara Rangoli, Ar-madillo Willy’s,Thai Pepper,Pasand
Arthur’s, Katie’sCafe, Pedro’s, LaGalleria
Birk’s, TruyaSushi, ValleyPlaza
Lakeside, Mari-ani’s
Table 1.24
NOTE: The original lab was designed and contributed by Carol Olmstead.

46 CHAPTER 1. SAMPLING AND DATA
Solutions to Exercises in Chapter 1
Solution to Example 1.5 (p. 15)Items 1, 5, 11, and 12 are quantitative discrete; items 4, 6, 10, and 14 are quantitative continuous; and items2, 3, 7, 8, 9, and 13 are qualitative.Solution to Example 1.10 (p. 26)
1. 29%2. 36%3. 77%4. 875. quantitative continuous6. get rosters from each team and choose a simple random sample from each
Solution to Example 1.11 (p. 27)
1. No. Frequency column sums to 18, not 19. Not all cumulative relative frequencies are correct.2. False. Frequency for 3 miles should be 1; for 2 miles (left out), 2. Cumulative relative frequency
column should read: 0.1052, 0.1579, 0.2105, 0.3684, 0.4737, 0.6316, 0.7368, 0.7895, 0.8421, 0.9474, 1.3. 5
194. 7
19 , 1219 , 7
19
Solutions to Homework
Solution to Exercise 1.12.1 (p. 33)
a. quantitative - discreteb. quantitative - continuousc. qualitatived. quantitative - continuouse. quantitative - discretef. qualitativeg. qualitativeh. quantitative - continuousi. quantitative - continuousj. quantitative - discrete
Solution to Exercise 1.12.3 (p. 33)
b. 5.00%c. 93.33%
Solution to Exercise 1.12.5 (p. 34)
a. Children who take ski or snowboard lessonsb. A group of these childrenc. The population averaged. The sample averagee. X = the age of one child who takes the first ski or snowboard lessonf. A value for X, such as 3, 7, etc.
Solution to Exercise 1.12.7 (p. 34)
a. The clients of the insurance companiesb. A group of the clients
47
c. The average health costs of the clientsd. The average health costs of the samplee. X = the health costs of one clientf. A value for X, such as 34, 9, 82, etc.
Solution to Exercise 1.12.9 (p. 35)
a. All the clients of the counselorb. A group of the clientsc. The proportion of all her clients who stay marriedd. The proportion of the sample who stay marriede. X = the number of couples who stay marriedf. yes, no
Solution to Exercise 1.12.11 (p. 35)
a. All people (maybe in a certain geographic area, such as the United States)b. A group of the peoplec. The proportion of all people who will buy the productd. The proportion of the sample who will buy the producte. X = the number of people who will buy itf. buy, not buy
Solution to Exercise 1.12.19 (p. 38)DSolution to Exercise 1.12.20 (p. 38)ASolution to Exercise 1.12.21 (p. 38)BSolution to Exercise 1.12.22 (p. 38)CSolution to Exercise 1.12.23 (p. 39)BSolution to Exercise 1.12.24 (p. 39)BSolution to Exercise 1.12.25 (p. 39)BSolution to Exercise 1.12.26 (p. 39)BSolution to Exercise 1.12.27 (p. 40)C

48 CHAPTER 1. SAMPLING AND DATA