Crystallography in Four Dimensionsuu.diva-portal.org/smash/get/diva2:164787/FULLTEXT01.pdf ·...
58
Comprehensive Summaries of Uppsala Dissertations from the Faculty of Science and Technology 990 Crystallography in Four Dimensions Methods and Applications BY GUNILLA CARLSSON ACTA UNIVERSITATIS UPSALIENSIS UPPSALA 2004
Transcript of Crystallography in Four Dimensionsuu.diva-portal.org/smash/get/diva2:164787/FULLTEXT01.pdf ·...

Comprehensive Summaries of Uppsala Dissertationsfrom the Faculty of Science and Technology 990
Crystallography in FourDimensions
Methods and Applications
BY
GUNILLA CARLSSON
ACTA UNIVERSITATIS UPSALIENSISUPPSALA 2004


List of Papers
This thesis is based on the following papers, which will be referred to in the text by their Roman numerals:
I Tove Sjögren, Gunilla Carlsson, Gisela Larsson, Andras Hajdu, Christer Andersson, Hans Pettersson and Janos Hajdu: Protein crystallography in a vapour stream: data collection, reaction initiation and intermediate trapping in naked hydrated protein crystals J. Appl. Cryst. (2002), 35, 113–116
II Carrie M. Wilmot, Tove Sjögren, Gunilla H. Carlsson, Gunnar I. Berglund and Janos Hajdu: Defining redox state of X-ray crystal structures by single-crystal ultraviolet visible Microspectrophotometry Methods in Enzymology (2002), 353, 301–318
III Gunnar I. Berglund*, Gunilla H. Carlsson*, Andrew T. Smith, Hanna Szöke, Anette Henriksen and Janos Hajdu: The catalytic pathway of horseradish peroxidase at high resolution Nature (2002), 417, 463–468
IV Gunilla H. Carlsson, Peter Nicholls, Dimitri Svistunenko, Gunnar I. Berglund and Janos Hajdu: Complexes of horseradish peroxidase with formate, acetate and carbon monoxide. Submitted
* Joint 1st author
Articles are reprinted with the permission from the copyright holders

Contents
1 Introduction................................................................................................1
2 Crystallography in Four Dimensions .........................................................32.1.1 The interaction of X-rays with biomaterials ...............................3
2.1.1.1 Elastic scattering .................................................................32.1.1.2 Inelastic scattering...............................................................42.1.1.3 The photoelectric effect and Auger electrons .....................42.1.1.4 Secondary electron cascades ...............................................6
2.1.2 X-ray absorption results in a redistribution of electrons in the sample....................................................................................................7
2.1.2.1 A multi-crystal data collection strategy developed to follow X-ray induced structural changes......................................................8
2.2 Methods for capturing the structures of transient reaction intermediates ..............................................................................................9
2.2.1 Reaction initiation and techniques for capturing transient reaction intermediates in catalysis .......................................................10
2.2.1.1 Methods for capturing catalytic intermediates in crystallography................................................................................10
2.2.2 Validation: What is that density in the map?............................132.2.2.1 Single crystal microspectrophotometry.............................14
3 Applications .............................................................................................163.1 Reduction of dioxygen to water in horseradish peroxidase..............16
3.1.1 Introduction...............................................................................163.1.1.1 Reactions of horseradish peroxidase .................................18
3.1.2 Now you have it, now you don’t: Attempts to capture Compound III in crystals of HRP ........................................................20
3.1.2.1 Trapping Compound III ....................................................203.1.2.2 X-ray data collection .........................................................21
3.1.3 High resolution structures of HRP intermediates .....................253.1.3.1 High resolution structure of Compound I .........................25

3.1.3.2 High resolution structure of Compound II ........................263.1.3.3 High resolution structure of Compound III.......................28
3.1.4 Acetate, formate and CO complexes of HRP ...........................283.1.4.1 High resolution structure of HRP in complex with acetate.........................................................................................................283.1.4.2 High resolution structure of HRP in complex with formate.........................................................................................................293.1.4.3 High resolution structure of ferrous HRP in complex with carbon monoxide.............................................................................30
3.1.5 The proposed mechanism of ferryl formation ..........................333.1.5.1 Binding of acetate and formate suggest a possible mechanism for formation of compound I........................................333.1.5.2 Implications of the mechanism to explain the catalase activity of HRP................................................................................34
3.2 Bacteriorhodopsin ............................................................................363.2.1 Introduction...............................................................................36
3.2.1.1 Rhodopsins from Halobacterium salinarium.....................363.2.1.2 Bacteriorhodopsin and the photocycle ..............................36
3.2.2 The M1-intermediate and the Asp38Arg mutant of BR ............373.2.2.1 Crystallisation of the BRD38R mutant .............................383.2.2.2 Development of a protocol for trapping an M-intermediate in crystals of the BR Asp38Arg mutant ..........................................383.2.2.3 Diffraction of BR Asp38R crystals ...................................41
Acknowledgements.......................................................................................43
Sammanfattning ............................................................................................44
References.....................................................................................................46
Abbreviations
BR bacteriorhodopsin bR bacteriorhodopsin in the ground state CO carbon monoxide HP Helicobacter pylori HRP horseradish peroxidase HRPC horseradish peroxidase isoenzyme C IR infrared MO 1-monooleoyl-racemic glycerol MPD 2-methyl-2,4-pentanediol
-OG -octyl glucoside PM purple membrane PMi Proteus mirabilis UV-VIS ultraviolet-visible XAS X-ray absorption spectroscopy EXAFS extended X-ray absorption fine structure

1
1 Introduction
It is easier to understand how something works if one knows what it looks like, and this is true also for proteins. The most frequently used method for determining the three dimensional structure of proteins is X-ray crystallography.
X-rays interact with electrons in the sample through scattering and absorption. Photons scattered from molecules in a crystal give rise to a characteristic diffraction pattern from which the structure of the protein can be determined. For an understanding of an enzyme, we need to know its native structure, the structures of the various intermediates on the reaction pathway, the kinetic mechanism and the physical organic chemistry of the reaction catalysed. Protein crystals contain a large amount of water (30-95%) giving rise to an environment similar to that of the cytosol (about 80% water on average). Many proteins retain their activity in the crystalline state (Makinen 1977). The three-dimensional network of the crystal lattice allows for some flexibility, and proteins can undergo limited conformational changes in the crystal. A network of channels provides access for diffusing substrates to the active site, but in some cases, restriction in the motion of the substrate or the protein, imposed by the lattice, may result in a reduction (or even absence) of activity. The two proteins studied in this thesis (horseradish peroxidase and bacteriorhodopsin) are active in the crystalline state.
Most catalytic intermediates have short lifetimes. Various strategies can be used for determining their structure by X-ray crystallography. For instance, one can use fast X-ray data collection methods (one such method is Laue diffraction) to follow a reaction as it proceeds in the crystal, or else one could try to stabilise (i.e. trap) the intermediate of interest for subsequent structure determination to the highest possible resolution by monochromatic data collection methods. In both cases it is important to confirm by independent means the presence and concentration of the intermediate in the crystal. With intermediates showing a characteristic spectral signals, this can be done by spectral measurements on the crystal.
Reaction intermediates of horseradish peroxidase and bacteriorhodopsin are coloured, and a combination of spectroscopic methods with X-ray diffraction

2
can be used to correlate electronic transitions with structural transitions in their crystals. Bacteriorhodopsin (BR) is the simplest photon-driven proton pump and as such provides a paradigm for the study of a basic function in bioenergetics. The protein contains a covalently bound retinal molecule which absorbs light, and the energy of the absorbed photon is used to pump a proton across the cell membrane. This reaction involves at least seven spectrally distinct intermediates. Horseradish peroxidase (HRP) is a haem enzyme, and it has a broad catalytic specificity. The most common reaction catalysed by HRP is one in which a molecule of hydrogen peroxide is reduced to two molecules of water while two organic substrate molecules are oxidised. HRP can also perform other redox reactions, and these will be described in some detail later. Known redox reactions of HRP proceed through four distinct steps, involving intermediates with different spectral signatures. A key contribution to these spectral changes comes from the haem group (containing an iron atom) which changes its oxidation state during the catalytic cycle.
The principal aim of the work described in this thesis was to develop methods to characterise and trap catalytic reaction intermediates in crystals of HRP and BR for subsequent structure determination. Like any work in science, these projects came to their own life, leading us into other, unexpected territories like utilising X-rays to drive catalysis, or making us give up on some of our initial aims (but not until after some time) due to poorly diffracting crystals of a BR mutant.

3
2 Crystallography in Four Dimensions
2.1.1 The interaction of X-rays with biomaterials X-rays interact with matter through scattering and absorption (fig. 2.1). These interactions can be summarised as follows:
2.1.1.1 Elastic scattering Elastic scattering carries easily accessible information about the structure, and is routinely used for structural studies. It is a relatively rare form of X-ray-matter interactions, and at 12 keV (~1 Å) photon energy less than one-tenth of X-ray interactions with carbon is elastic scattering. During this process, an in-coming photon excites an electron. When the electron returns to the ground state, it re-emits the photon with unchanged photon energy and phase (fig. 2.2a).
Figure 2.1 Atomic cross-sections for carbon as a function of X-ray wavelength (based on Henderson, 1995)

4
2.1.1.2 Inelastic scattering Inelastic scattering (a.k.a. Compton scattering) is a relatively rare event at X-ray frequencies although it is the main source of energy deposition with hydrogen, and represents about 3% of all interactions between X-rays and a biological sample at 1 Å wavelength. During inelastic scattering (Fig. 2.2b), the in-coming photon excites an electron but when the electron relaxes it emits a photon with smaller energy and does not come back to the ground state. Alternatively, the excited system may relax to a lower energy level than the initial state, in which case the energy of the photon emitted will be increased.
Figure 2.2 Elastic and inelastic scattering. The absorbed photon excites an electron. The atom can relax either through a. re-emitting the photon with unchanged properties (elastic scattering) or b. emitting a photon of different wavelength than the in-coming photon (inelastic scattering).
2.1.1.3 The photoelectric effect and Auger electrons At 1 Å wavelength (~12 keV), about nine-tenth of the interacting photons will deposit energy into a biological sample, causing damage mainly through the photoelectric effect. The photoelectric effect causes an X-ray photon to be absorbed and a tightly bound electron ejected from an inner shell of the atom (Figure 2.3). Note, that weakly bound outer shell electrons may also be ejected in the photoelectric processes, but this happens with a decreasing probability with increasing photon energies (e.g. with X-rays).
The energy of the departing photoelectron depends on the difference between the energy of the X-ray photon and the binding energy of the
a b

5
electron. The binding energy of an inner shell electron in carbon is about 0.25 keV.
The departing photoelectron leaves a hole in a low lying orbital, and an upper shell electron falls into it. This electron may either emit an X-ray photon to produce X-ray fluorescence (dominant process with heavy elements) or may give up its energy to another electron within the atom, which is then ejected from the ion as an Auger electron (dominant process with light elements). The probability of fluorescence emission or Auger emission depends on the binding energy of the electron, and through this, on the atomic number of the element. In carbon, nitrogen, oxygen and sulphur practically every photo-emission is accompanied by the emission of a secondary Auger electron, doubling the number of electrons liberated from these atoms per absorbed photon. The energy of the Auger electrons is usually in the order of about 0.1–0.3 keV, and depends on the difference between the shell binding energies.
Figure 2.3 The photoelectric effect and atomic relaxations. When an inner shell electron is ejected, a hollow ion is formed in which a K-shell electron is missing. The hollow ion is unstable, ant it can relax by moving an electron from a higher level down to the K-shell to fill the hole. This process can result in the emission of an Auger electron in light elements, or in the emission of a fluorescent X-ray photon in heavy elements.
The departing photoelectron can interact with the electrons left behind, depositing some of it's energy into the atom (a process called shake-up). This extra energy can be added to the energy of the Auger electron. Another possibility is that the excess energy causes ejection of outer shell electrons (a

6
process called shake-off), sometimes also accompanied with the emission of more Auger electrons.
2.1.1.4 Secondary electron cascades In a macroscopic protein crystal, all emitted electrons become thermalised and trapped in the sample. Thermalisation is mainly caused by inelastic electron-electron interactions. Thermalisation produces secondary "cascade electrons", the total number of these is roughly proportional to the energy of the impact electron triggering the cascade. An Auger electron liberates about 2–20 cascade electrons, while a photoelectron of 12keV liberates about 1000 cascade electrons before reaching thermal equilibrium. This process is over within about 100 femtoseconds. The consequence of these processes is that for each elastically scattered photons there are about 10 000 electrons which will be redistributed in the sample (fig. 2.4).
Figure 2.4 Yield of cascade electrons in a in a carbon sample at 12keV photon energy. For each elastically scattered photon 10 000 electrons are released (based on Ziaja et al., 2001, 2002 & 2004)
As figure 2.1 indicates, going to shorter wavelengths improves the ratio between the elastic and the photoelectric effect. This improvement, however, does not result in a corresponding decrease in the ratio between electrons released and elastic scattering events (fig. 2.5). The discrepancy is due to the fact that at higher X-ray energies, the energy of the photoelectrons will also be higher, and this will then result in proportionally more cascade electrons during the thermalisation process. The effect is shown in Fig. 2.5.

7
Figure 2.5 X-ray cross sections and the relative number of electrons released in a macroscopic sample per useful elastic scattering event. a. Photoelectric an elastic cross sections for carbon as a function of X-ray enery. b. The relative number of electrons liberated per elastic scattering event in of amorphous carbon as a function of X-ray energy, where 100% is the ratio with 1 Å wavelength. The estimates are based on the size of secondary electron cascades (Ziaja et al., 2001, 2002).
2.1.2 X-ray absorption results in a redistribution of electrons in the sample When X-rays relevant to protein crystallography (about 12 keV energy or 1 Å wavelength) interact with a biological sample only a small fraction of the photons are scattered elastically giving rise to a diffraction pattern. The larger fraction deposits energy into the sample and redistributes the electrons in the sample by the mechanisms described above. The dominant factor in the release of electrons is the photoelectric effect (fig. 2.1) and the subsequent electron cascades triggered by the energetic photoelectron as it slows down in the sample through inelastic scattering. This process is called thermalisation, and plays a dominant role in sample ionisation.
Atoms from which electrons are released become oxidised, while electrons liberated from these atoms cause reductions elsewhere in the sample. The process of liberating electrons is very fast (femtoseconds), while the subsequent redox and radical processes, leading to chemical damage caused by the redistribution of electrons takes place on a longer time scale.
The slower redox processes can be described in terms of the Marcus theory (Marcus 1956 & 1964), which s tates that the rate of electron transfer between two redox centres (e.g. an oxidized redox centre and a hydrated electron) is dependent on:
the ambient temperature. the distance between the two centres. the medium between the two centres the difference in redox potentials of the two centres.
ab

8
and the reorganisation energy associated with the conformational change needed to adopt the new redox state.
The mechanism of charge redistribution involves hole migration (positive charges) and electron migration (negative charges). In water, the main reactive species formed upon photo-absorption are hydrated electrons (eaq
–)and hydroxyl radicals. Hydrated electrons cause reduction while hydroxyl radicals are strongly oxidising. Both electrons and electron holes can migrate along the protein backbone, while the route of electron transfer involving hydrated electrons mainly proceeds through hydrogen bonds. It has been suggested that diffusion processes are involved in X-ray induced redox processes in the sample. In the protein, one can observe changes at disulphide bridges, carboxylates and also at redox centers (see Ravelli & McSweeney 2000, and references therein).
2.1.2.1 A multi-crystal data collection strategy developed to follow X-ray induced structural changes A molecular description of oxygen and peroxide activation in biological systems is problematic because electrons liberated during X-ray data collection easily reduce the active centres of the redox enzymes catalysing these reactions. X-rays leave a fingerprint on structures, especially when high doses are needed to collect a data set (Chance et al. 1980, Logan et al. 1996, Weik et al. 2000, Ravelli & McSweeney 2000, Burmeister 2000, Sjögren & Hajdu 2001). This is an increasingly serious problem with high-resolution crystal structures where large X-ray doses are needed to reach desired resolutions. Attempts to minimise X-ray-induced interference with redox centres in crystallography include soaking the crystals in excess electron scavengers (see, e.g. Lancaster et al. 1999) and working with shorter wavelength X-rays (e.g. Schlichting at al. 2000). Cooling can also slow down sample deterioration but it cannot eliminate X-ray-induced ionisation in the sample. However, X-ray data collection at low temperatures can minimize the chemical contribution to X-ray-induced damage (see Garman 2003 for a review), but the number of electrons liberated and redistributed in the sample remains practically unaffected upon cooling.
So what can we do? Figure 2.6 shows a novel data collection strategy developed in our project to deal with these problems more effectively. The method is based on damage distribution over many crystals followed by the assembly of composite data sets from small chunks of these data (Figure 2.6). Composite data sets obtained this way report on structures which received different X-ray doses, and in which a different numbers of electrons were liberated during data collection. This strategy offers the possibility to control and monitor X-ray-induced redox processes at any given X-ray

9
wavelength. The technique permits experiments similar to redox titrations so that redox processes can be followed this way in the crystal.
Figure 2.6 The data collection strategy used to control X-ray induced reduction in HRP. Each data set covers 90 degrees of rotation. a. The distribution of the X-ray dose in the crystals. b. The assembly of composite data sets from small chunks of the data sets in a.. Each composite data set represents structures that received different X-ray doses.
2.2 Methods for capturing the structures of transient reaction intermediates
Diffraction methods can be used for the analysis of short lived structures which accumulate transiently in the crystal during a reaction (see e.g. Hajdu et al. 1988, Petsko & Ringe 2000, Schlichting, 2000, Wilmot & Pearson 2002 for reviews). The lower limit for structure determination is around 20% of the species of interest but of course, the higher its occupancy, the better. The quality of the results depends on the resolution and on the quality and
a b

10
completeness of the diffraction data. Other requirements include a uniform reaction triggering throughout the body of the crystal. This must be fast relative to the lifetime of the intermediate whose structure we intend to capture. The speed of data collection must also be faster than the decay of the intermediate.
2.2.1 Reaction initiation and techniques for capturing transient reaction intermediates in catalysis Recent structural studies on reaction intermediates have fallen into two main categories. One of these involves photo-sensitive compounds where photon-induced reaction initiation is possible. In such cases (laser) illumination can be used to initiate a light sensitive reaction, like for instance proton pumping in bacteriorhodopsin (for review see e.g. Neutze et al. 2002). Photo-activation can also be used to liberate a light sensitive protecting group (a “cage”) from the substrate or the enzyme. In addition to these techniques, X-rays can also be used to start and sustain certain redox reactions through the photoelectric effect and the resulting collisional electron cascades in the sample (see previous chapter).
The huge majority of biochemical processes are non-photochemical. Almost all enzymes participate in processes in which diffusion provides the link between reaction partners. Thus the second category of experiments targets these processes and combines diffusion-based reaction initiation with various trapping methods.
The work described in this thesis utilised both of these techniques.
2.2.1.1 Methods for capturing catalytic intermediates in crystallographyAn enzymatic reaction can be described as a set of consecutive reactions, starting with the binding of the substrate(s) to the enzyme, and finishing with the release of the product(s) from the active site. Rate limiting steps in this process can be anywhere along the reaction path. If diffusion and substrate binding are not rate limiting, some catalytic intermediates will always accumulate during single or multiple turnovers.
Uniform catalysis can often be triggered by diffusing reagents into crystals. This is the most straightforward way of initiating a reaction in a protein crystal. The generally lower activity of crystalline enzymes is helpful in this type of studies. However, the speed of diffusion and ligand binding sets an upper limit to the speed of reactions which can be analysed this way. In fortunate cases, one can collect the data very rapidly on a timescale faster than the turnover of the enzyme (e.g. Schotte et al. 2003). This approach is

11
named time-resolved crystallography. Unfortunately, the methods is not universally applicable.
Another approach is to manipulate somehow the ratio of the rate constants along the reaction pathway to create a bottle neck in the reaction sequence, and thus build up the concentration of the intermediate to be analysed. In fortunate cases one can actually stop the reaction at a desired point by using physical or chemical trapping methods, and thus achieve a nearly 100% concentration of the intermediate in the crystal. Tricks and techniques here include changing the temperature, pressure, pH, using non-aqueous solvents, various mutant enzymes, modified substrates – or anything else that can upset a reaction in a well controlled fashion.
Cryogenic techniques are the most widely used “physical tools” to preserve an intermediate, or increase its concentration. The rate of chemical processes characteristically depends on temperature. For a reaction to occur, the reacting molecules must have enough energy to get across the activation energy barrier, so certain intermediates may be trapped by triggering the reaction at a lower temperature, where there is not enough thermal energy for the reaction to proceed beyond a certain step. In this way one can accumulate intermediates for which the next reaction step has a higher activation energy than the barrier in any of the previous reaction steps (e.g. Edman et al. 1999). In addition, the rate of different chemical reactions can show different temperature dependencies, and by changing the temperature, it may thus be possible to achieve the accumulation of different intermediates.
Steady state kinetic methods can also be used to build up and maintain the concentration of an intermediate over some period of time. This can be done if the rate of substrate binding is fast relative to the rate of some subsequent step in the reaction. Under such conditions, a steady supply of the substrate (e.g. a solution of substrates flowing past the crystal in a flow cell) can produce a significant steady state concentration for the intermediate before the rate-limiting step. Of course, one could also freeze the crystal at this point (a method called cryotrapping) – so there are many combinations and possibilities, and with some perseverance and stubbornness, a protocol can be designed to obtain a structure for an intermediate in the reaction.
2.2.1.1.1 Reaction initiation and intermediate trapping in naked protein crystals placed in a controlled humidity vapour stream. The vapour stream system (Figures 2.7 and 2.8), which has been developed during this project, is a tool for reaction triggering, monitoring and intermediate trapping above the freezing point of the mother liquor (paper

12
II). Traditionally, room-temperature studies on protein crystals are performed by mounting the crystal in a capillary which is sealed to prevent the crystal from drying out. In our set up the crystal is mounted in a standard loop which is held in a humid gas stream to prevent the crystal from drying out.
Figure 2.7 Schematic arrangement of the vapour stream system.
The gas stream is humidified by bubbling the gas through a liquid. It can be used either in connection with a microspectrophotometer to monitor the reaction in the crystal (fig. 2.8) or when collecting X-ray diffraction data above the freezing point of the crystal/mother liquor, it can be used in the X-ray camera. Reaction initiation can be done by introducing a gaseous or volatile substrate in the humid gas stream, or by triggering a pH jump using volatile acids, bases and buffers, or by adding a micro droplet of substrates directly into the loop.
Combining the vapour stream with a cryostream a reaction intermediate can be trapped by switching to the cryostream when the spectrum of the intermediate is observed. The vapour stream system offers reduced absorption and background as compared to the flow-cell set up. It also offers the possibility to trap intermediates in the crystal by flash freezing. We note that a careful calibration of the humid gas stream is necessary to prevent the crystal from drying out.

13
Figure 2.8 The vapour stream system attached to the microspectrophotometer.
2.2.2 Validation: What is that density in the map?When obtaining a structure for an intermediate to dissect a mechanism it is obviously important to know what is really present in the crystal and in what concentration. In many papers in the literature, only the electron density has been used as an indicator to which species the structure represents. However, it is always preferable to have additional independent information about the nature and the concentration of the intermediate in the crystal. Ideally this should be checked during data collection (or at least before and after) as the stability of the intermediate might be low in general, or could be influenced by exposure to X-rays as will be shown here in our studies on HRP.
Chemical reactions involve the shuffling of electrons between ions, atoms and molecules, and the transfer of electrons is accompanied by changes in the electromagnetic spectrum of the reactants. Spectral changes associated with chemical reactions cover a very broad spectral domain. Several spectroscopic methods have been used on single crystals in combination with X-ray crystallography. The most frequently used technique is UV-VIS absorption spectroscopy. Other methods include fluorescence spectroscopy (e.g. Bourgeois et al. 2002), FTIR spectroscopy (e.g. Gerwert et al. 1988), single crystal EPR/ESR (e.g. Foerster et al. 2003), single crystal EXAFS and polarized single crystal XAS (Flank et al. 1986), and single-crystal micro-Raman spectroscopy (Smulevitch & Spiro 1993). This list is far from complete, and only indicates the range of methods that can be used to obtain independent information on the nature and concentration of catalytic intermediates in a crystal. Yet another possibility is to dissolve the crystal
a b

14
and use tools in analytical chemistry to determine what was in the crystal provided conditions can be found to preserve that intermediate.
In the present work, we used UV-VIS microspectrophotometry to obtain independent spectral information on the state and the contents of the crystals.
2.2.2.1 Single crystal microspectrophotometry Microspectrophotometry can be used to correlate electronic transitions with structural transitions in crystals, and the spectral data can be used to follow reactions and to distinguish between different states of the protein and/or the substrates. Note however that spectral work on crystalline proteins is a different game from spectral studies on the same proteins in solution in some important aspects:
(1) Proteins dissolved in dilute aqueous solutions take up independent and random orientations, while proteins in a crystal lattice are fixed relative to each other. Molecules fixed in space absorb plane-polarised light differently from different directions. Linear dichroism refers to differences in the absorption of plane-polarised light as a function of the orientation of the molecule (or condensate) relative to the plane of polarisation of the incident light. Linear dichroism can thus be observed for most single molecules and also for condensed matter with symmetry lower than cubic (for a review see Hofrichter & Eaton, 1976). This is a feature of optical measurements on crystalline samples. If one wants to get something similar to a solution spectrum, one needs to integrate the spectra over different measurement angles. Even then one may find some differences due to packing interactions within the crystal. Absorption of plane-polarised light with the electric vector parallel to the principal optical directions of the crystal obeys the Lambert-Beer law and can be used for straightforward spectral measurements.
(2) Another factor is the effect of refraction and reflection on the measured spectrum. When recording a solution spectrum in a spectrophotometer one usually uses a cuvette with its transparent parallel faces normal to the incident beam. In this case there is very little reflection or refraction from the sample. So the best case one can hope for in measurements on crystals is a crystal surface perpendicular to the incident light beam and a parallel crystal face on the exit side. Experience shows that parallel crystal faces mainly exist in text books. Real crystals have odd prism shapes. The crystal is usually also surrounded by additional surfaces (the droplet, the capillary tube), which are usually curved. The combined geometry will give rise to refraction and reflection at all possible interfaces. Reflection and refraction depend on the wavelength and on the angle of incidence. These factors will give us different base lines, depending on the orientation of the crystal (the

15
droplet and the capillary) in the light beam. This effect is the smallest when the crystal has parallel faces, and it is located in the middle of a thin droplet, with faces perpendicular to the light beam. In the case of crystals mounted in capillaries, care should be taken to make sure the light passes through the centre of a capillary and is normal to the axis of the capillary tube.
(3) Changes in the temperature will also influence the spectrum. At low temperatures fewer vibrational states are occupied, and this can lead to a sharpening of certain peaks. Temperature will also influence the occupancy of certain molecular orbitals, and this can produce changes in the spin state of the sample, which will give an altered spectrum. Finally, temperature dependent distortions to the chromophores may occur as the protein is cooled in the lattice, and this can also affect the spectral properties of the sample.
An obvious way around most of these problems is to measure spectral changes in a reaction under identical measurement conditions (fixed geometry, stable crystal orientation, controlled temperature, etc.). In most of the studies described here we used air as a reference. This arrangement removes half of the problems associated with the reproducibility of spectral measurements.

16
3 Applications
3.1 Reduction of dioxygen to water in horseradish peroxidase
3.1.1 Introduction Haem enzymes have a pivotal role in biology. The diversity of the chemistry catalysed by these enzymes is striking, and yet all biological oxidation reactions catalysed by haem enzymes involve similar high oxidation state intermediates whose reactivities are modulated by the protein environment. Many of these enzymes catalyse reactions that have a very high activation energy barrier, and may require a flame in the laboratory, yet proceed effectively at the active sites of these enzymes. Figure 3.1 shows the five principal redox intermediates of HRP with the corresponding absorption spectra of the enzyme in these states.
Horseradish peroxidase (HRP) is a monomeric haem enzyme of 308 amino acids (fig. 3.2). It contains two calcium ions and is glycosylated in the wild type. It is one of the first enzymes on which the study of biological catalysis started. In 1810 Planche reported that soaking a piece of fresh horseradish root in a tincture of guaiacum gave a blue colour. Planche’s paper is the first record of a peroxidase reaction. Though HRP was purified already in the 1920:s (Willstätter & Pollinger 1923), the structure was not solved until 1997 (Gajhede, et al. 1997) using crystals (Henriksen et al. 1995) of a recombinant, non-glycosylated protein (Smith et al. 1990). There are well over ten thousand papers on horseradish peroxidase (for reviews see Dunford 1991, Veitch & Smith 2000, Veitch 2004), but the exact physiological role of this enzyme in the roots of horseradish remains unknown. HRP belongs to the plant peroxidase superfamily. Horseradish peroxidase isoenzyme C (HRPC) is the major isoenzyme in horseradish roots and most of the published work has been done with it. Other members of the plant peroxidase superfamily are involved in lignin degradation, biosynthesis of cell walls or the metabolism of hormones.

17
Figure 3.1 Principal redox intermediates of horseradish peroxidase and their absorption spectra (as measured in crystals).

18
Figure 3.2 Schematic structure of horseradish peroxidase (PDB ID 1ATJ).
Horseradish peroxidase is relatively stable. It shows a wide substrate specificity and can be easily coupled to e.g. antibodies or the surface of electrodes. It is therefore widely used in commercial applications, e.g. in organic synthesis, clinical diagnostic kits and waste water treatment.
Figure 3.3 The different oxidation states of horseradish peroxidase and some of the reactions that connects them. The reactions are referred to by the letters a–h at each arrow. The peroxidase reaction cycle comprise of reactions a–c, the catalatic (catalase like) reaction of a&d and the oxidase reaction cycle of f–h.
3.1.1.1 Reactions of horseradish peroxidase HRP contains a haem group (iron protoporphyrin IX). The iron is ferric (3+) in the resting state, but the oxidation state changes during catalysis. In figure 3.3 the different oxidation states and some reactions which connect them are shown. HRP catalyses many different reactions (for reviews see Dunford

19
1991, Veitch & Smith 2000, Veitch 2004). The reaction characteristic for peroxidases is called the peroxidatic reaction:
H2O2 + 2AH 2 H2O + 2A* in which AH represents a reducing substrate, and A* a free radical product. In this reaction, the enzyme removes a hydrogen atom (i.e. proton and electron) from each molecule of the substrate. This happens in the following steps (fig 3.3 reactions a–c): First the resting state reacts with a molecule of hydrogen peroxide (or an other hydroperoxide) to form a hydroperoxy complex (Baek & van Wart 1989 & 1992, Denisov et al 2002) which can decompose to a water molecule (or an alcohol) and to the so called compound I form of the enzyme, which contains an oxyferryl species and a
-cationic radical located on the haem group. Compound I can be reduced by aromatic hydrogen donors, e.g. phenols, phenolic acids and indoles. These substrates do not have direct access to the oxyferryl group on the haem, but are oxidized at the ‘exposed’ haem edge, a region comprising the haem methyl C18H3 and haem meso proton C20H. The first electron donated by a hydrogen donor reduces the porphyrin -cation radical-, yielding compound II (still with an oxyferryl). A second hydrogen donor molecule reduces compound II back to the resting state and a water molecule.
HRP also has a “catalatic” activity, though with much lower reactivity than the related enzyme catalase (Nakajima & Yamazaki 1987, Hernandez-Ruiz et al 2001):
2 H2O2 2 H2O + O2The first step in the catalatic reaction is the same as in the peroxidatic reaction (fig 3.3 reaction a), the formation of compound I and one water molecule. The next step is the two-electron reduction of compound I by a second hydrogen peroxide molecule to form the resting state enzyme, dioxygen and another water (fig 3.3 reaction d). It has been suggested that the catalatic reaction is a defence mechanism against inactivation of the enzyme (Hernandez-Ruiz, et al. 2001). In the absence of reducing substrates, excess of hydrogen peroxide can lead to the formation of an inactive verdohemeperoxidase called P670. In this form of the enzyme, the haem ring is cleaved.
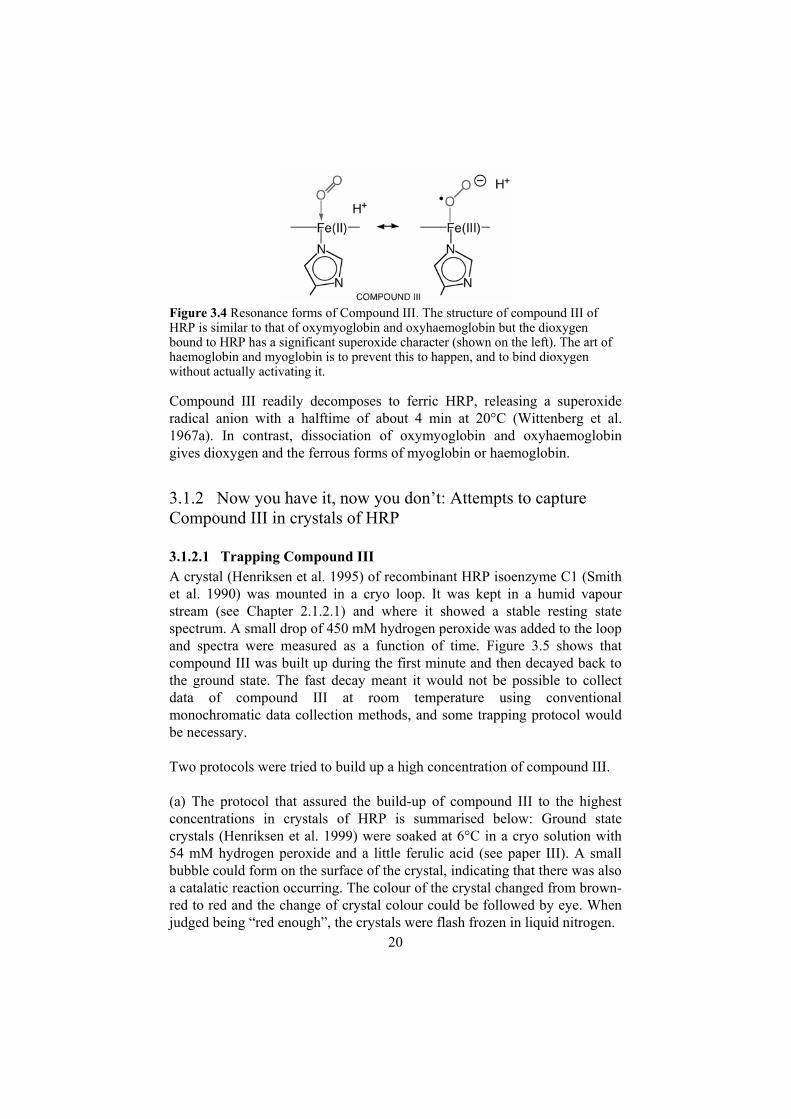
The compound III form of HRP contains a bound dioxygen species on the haem iron. Compound III is assumed to participate in a defence mechanism against inactivation. It can be formed either by adding excess hydrogen peroxide to the ferric enzyme when a small amount of aromatic hydrogen donors are present (fig. 3.3 reactions a, b & e), or by adding dioxygen to the reduced, ferrous enzyme (fig. 3.3 reactions f–h.). Compound III is similar to oxymyoglobin and oxyhaemoglobin but the dioxygen bound to the haem iron in compound III has a significant superoxide character (Figure 3.4).
20
Figure 3.4 Resonance forms of Compound III. The structure of compound III of HRP is similar to that of oxymyoglobin and oxyhaemoglobin but the dioxygen bound to HRP has a significant superoxide character (shown on the left). The art of haemoglobin and myoglobin is to prevent this to happen, and to bind dioxygen without actually activating it.
Compound III readily decomposes to ferric HRP, releasing a superoxide radical anion with a halftime of about 4 min at 20°C (Wittenberg et al. 1967a). In contrast, dissociation of oxymyoglobin and oxyhaemoglobin gives dioxygen and the ferrous forms of myoglobin or haemoglobin.
3.1.2 Now you have it, now you don’t: Attempts to capture Compound III in crystals of HRP
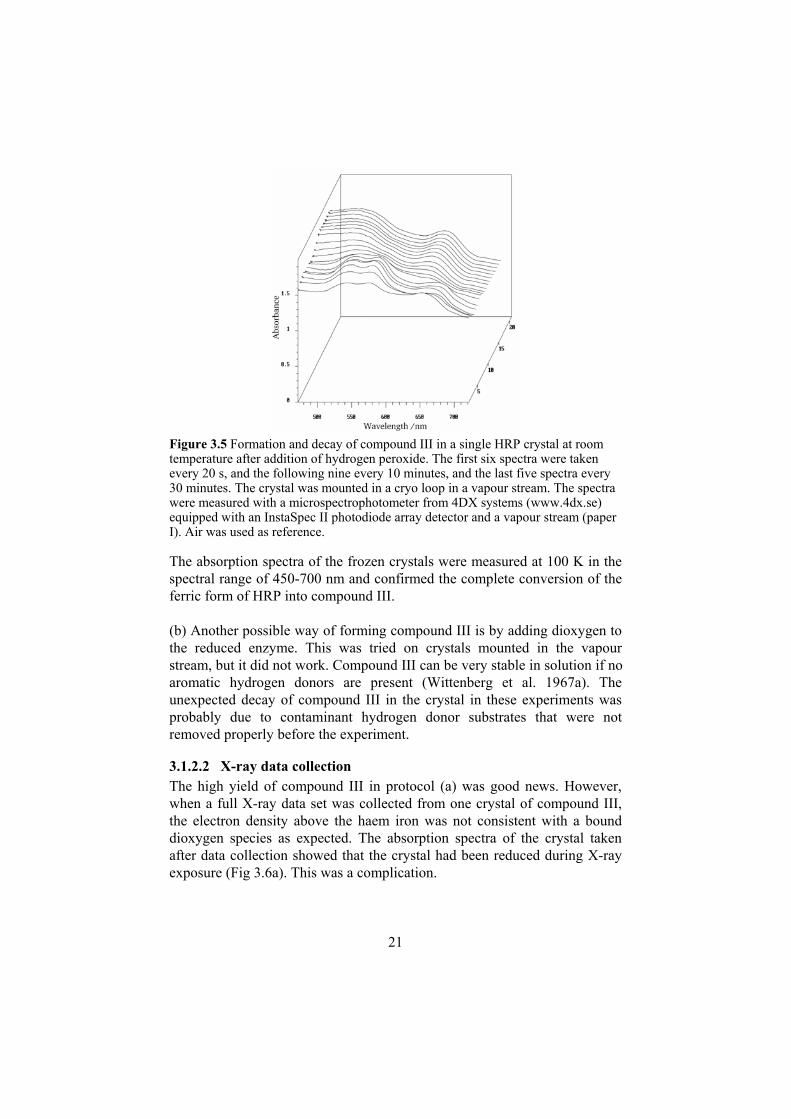
3.1.2.1 Trapping Compound III A crystal (Henriksen et al. 1995) of recombinant HRP isoenzyme C1 (Smith et al. 1990) was mounted in a cryo loop. It was kept in a humid vapour stream (see Chapter 2.1.2.1) and where it showed a stable resting state spectrum. A small drop of 450 mM hydrogen peroxide was added to the loop and spectra were measured as a function of time. Figure 3.5 shows that compound III was built up during the first minute and then decayed back to the ground state. The fast decay meant it would not be possible to collect data of compound III at room temperature using conventional monochromatic data collection methods, and some trapping protocol would be necessary.
Two protocols were tried to build up a high concentration of compound III.
(a) The protocol that assured the build-up of compound III to the highest concentrations in crystals of HRP is summarised below: Ground state crystals (Henriksen et al. 1999) were soaked at 6°C in a cryo solution with 54 mM hydrogen peroxide and a little ferulic acid (see paper III). A small bubble could form on the surface of the crystal, indicating that there was also a catalatic reaction occurring. The colour of the crystal changed from brown-red to red and the change of crystal colour could be followed by eye. When judged being “red enough”, the crystals were flash frozen in liquid nitrogen.
21
Figure 3.5 Formation and decay of compound III in a single HRP crystal at room temperature after addition of hydrogen peroxide. The first six spectra were taken every 20 s, and the following nine every 10 minutes, and the last five spectra every 30 minutes. The crystal was mounted in a cryo loop in a vapour stream. The spectra were measured with a microspectrophotometer from 4DX systems (www.4dx.se) equipped with an InstaSpec II photodiode array detector and a vapour stream (paper I). Air was used as reference.
The absorption spectra of the frozen crystals were measured at 100 K in the spectral range of 450-700 nm and confirmed the complete conversion of the ferric form of HRP into compound III.
(b) Another possible way of forming compound III is by adding dioxygen to the reduced enzyme. This was tried on crystals mounted in the vapour stream, but it did not work. Compound III can be very stable in solution if no aromatic hydrogen donors are present (Wittenberg et al. 1967a). The unexpected decay of compound III in the crystal in these experiments was probably due to contaminant hydrogen donor substrates that were not removed properly before the experiment.
3.1.2.2 X-ray data collection The high yield of compound III in protocol (a) was good news. However, when a full X-ray data set was collected from one crystal of compound III, the electron density above the haem iron was not consistent with a bound dioxygen species as expected. The absorption spectra of the crystal taken after data collection showed that the crystal had been reduced during X-ray exposure (Fig 3.6a). This was a complication.

22
Figure 3.6 The disappearance of the bound dioxygen species from compound III during data collection. a. The spectra before (above) and after (below) collecting a full X-ray diffraction data set. The bottom spectrum shows that compound III was reduced during data collection. b. The electron density calculated from the data does not show the expected dioxygen species on the haem iron. The figure shows a SigmaA-weighted 2mFo-DFc electron density map contoured at 1 sigma, where sigma represents the root mean square electron density for the unit cell.
The spectral data after X-ray exposure and the electron density pointed to the possibility that the enzyme used electrons liberated by X-rays during data collection to perform a full four-electron reduction of the bound dioxygen species, creating two molecules of waters from it during this process. To study the X-ray induced reduction of compound III, X-ray diffraction data were collected systematically using the multi-crystal data collection strategy described in section 2.1.2.1. In our case the crystals were rod shaped and one crystal axis could be distinguished from the others and aligned along the spindle axis. This let us use an especially efficient way of collecting the data sets, using as few crystals as possible without loosing time during data collection on scaling, and still being sure that the composite data sets would be complete (fig 2.6). The crystals belonged to spacegroup P212121, which meant 90° rotation would be needed to obtain a reasonably complete data set (table 1). We had determined based on absorbance spectra that we should split the individual data sets into 10° chunks, which meant 9 crystals would be needed.
First one image was collected and autoindexed to get the orientation of the other axises. Then the crystal was rotated so that the data collection on the first crystal could be started shooting down one axis. The next crystal was autoindexed and rotated so data collection started 10° off the axis collecting 80°, then rotating back to the axis to collect the last 10° of data. On the next crystal data collection started 20° off the axis, and so on until data covering the oscillation range needed for a full data set had been gathered (fig 2.6a). After processing the images, each data set was split into 10° chunks. The chunks with the first 10° data from each crystal were merged into one new data set, the next 10° chunks into an other, and so on to yield 9 composite data sets (fig 2.6b), each having received a different X-ray dose. Another
a b

23
data set was collected from a single crystal on which a full data set already had been collected. The change in observed electron density could be followed as a function of the X-ray dose (see fig 3.7).
Table 1. Individual data sets used to study the X-ray induced reduction of compound III. The data were collected at ESRF BM14 (wavelength 0.979 Å) using the strategy described in figure 2.6. Crystal 1 2 4 5 6 7 8
Angular range 0-90 10-90, 0-10
30-90, 0-30
40-90, 0-40
50-90, 0-50
60-90, 0-60
70-90, 0-70
Resolution 38.1-1.60
29.2-1.60
38.1-1.60
23.7-1.60
33.9-1.68
33.9-1.60
34.5-1.60
Reflections 127,819 107,308 133,734 115,940 128,501 103,747 108,331
Unique reflect. 41,855 38,768 42,509 38,926 30,184 40,019 38,047
Completeness 97.4 % 89.3 % 98.0 % 90.1 % 80.5 % 92.6 % 89.0 %
Rmerge * 0.061 0.028 0.041 0.05 0.043 0.043 0.037
Cell a, b, c (Å) 40.3 67.2 117.4
40.4 67.5 117.8
40.4 67.5 117.4
40.3 67.2 117.2
40.3 67.4 117.7
40.3 67.4 117.6
40.2 67.1 117.0
*Rmerge= | I-Iaverage|/ I, where I is the observed intensity of a reflection and Iaverage is the average intensity obtained from multiple observations of symmetry related reflections.
Table 2. Data sets used to study the X-ray induced reduction of compound III. Composite data sets obtained from the individual data sets in table 1 and – in the last row – from a crystal collecting a second full data set.
Dat
a se
t
X-r
ay d
ose
(%)
Tota
l re
flect
ions
Uni
que
refle
ctio
ns
Com
plet
e.
(%)
I/sig
ma(
I)
Rm
erge
(%)*
Num
ber o
f at
oms
R cry
st (%
)†
R fre
e (%
)†
PDB
ID
1 0-11 93,741 38,382 89.4 8.8 8.7 2,862 19.2 22.0 1h5d
2 11-22 91,268 38,108 87.3 8.8 9.1 2,883 19.4 22.4 1h5e
3 22-33 93,076 38,419 88.9 8.5 8.5 2,900 19.3 22.0 1h5f
4 33-44 92,978 38,323 89.5 8.6 9.2 2,880 19.3 22.3 1h5g
5 44-56 94,423 36,710 85.1 8.8 8.4 2,881 19.3 21.8 1h5h
6 56-67 95,385 38,857 90.2 8.8 8.3 2,889 19.1 21.6 1h5i
7 67-78 90,457 38,197 88.4 9.2 8.4 2,882 19.1 22.1 1h5j
8 78-89 93,590 37,027 85.5 9.5 8.4 2,868 19.0 21.3 1h5k
9 89-100 91,949 37,703 86.9 8.8 8.6 2,855 19.1 21.9 1h5l
10 100-200 157,482 41,017 99,8 15.5 6.6 2,906 17.8 19.8 1h5c
*Rmerge= | I-Iaverage|/ I, where I is the observed intensity of a reflection and Iaverage is the average intensity obtained from multiple observations of symmetry related reflections. †Rcryst= ||Fobs|-|Fcalc||/ |Fobs|. 5% of the data were excluded from refinement and used to calculate Rfree (Brünger 1992).

24
Figure 3.7 Changes in the electron density during X-ray data collection at 100K. X-ray data from nine crystals were scaled into 9 composite data sets, each corresponding to a different X-ray dose. The percentage values on the left show the X-ray dose (100% corresponds to the X-ray dose received at the end of 90 degrees of data). The figure shows SigmaA-weighted 2mFo-DFc electron density maps contoured at 1 sigma, where sigma represents the root mean square electron density for the unit cell. The PDB ID is given next to each structure.
The difference densities obtained from the six composite data sets (fig. 3.7) show that the distal oxygen dissociates first, staying in hydrogen bonding distance to the remaining oxygen as well as to Arg38 before disappearing from the active site. The oxygen directly bound to the iron also disappears, but more slowly. The results suggest an X-ray induced reduction of
a
b
c
d
e

25
dioxygen on the iron and that this proceeds through some intermediate structures. As a control, we checked if the intermediate density could be reproduced by artificially mixing the density of the starting structure and the final structure (fig. 3.7a and e respectively). If the intermediate structures were mixtures of compound III and ferrous HRP they should be reproduced by mixing the first and the last composite data sets, which was not the case. We therefore suggest that these changes in electron density correspond to formation of specific species, rather then being a mixture of Compound III and ferrous enzyme in different proportions (fig. 3.8).
Figure 3.8 A possible mechanism for the X-ray driven conversion of compound III to ferrous horseradish peroxidase in crystals.
3.1.3 High resolution structures of HRP intermediatesStructural changes were limited to the active site with no measurable changes in the structures of disulphide bridges, suggesting that the active site is significantly more sensitive to reduction than the protein itself. One can question whether this is all that happens in terms of movements during catalysis in the crystal or if it is an artifact of the low temperature. We performed a separate set of experiments where each of the five expected intermediates was built up to high concentrations in crystals of unfrozen HRP. Each of these intermediates was then preserved for subsequent structure determination by quenching the crystals in liquid nitrogen. The data collection strategy described above was then used to obtain high resolution structures for these intermediates with preserved oxidation state.
3.1.3.1 High resolution structure of Compound I To get a high yield of compound I it was important not to have any aromatic hydrogen donor substrate present in the crystal. Instead of crystallising HRP with the hydrogen donor substrate ferulic acid, the substrate analogue trans-3-methoxycinnamic acid was used. In all other respects the crystallisation

26
was done as in the other experiments. Before trapping compound I, the crystals were washed in reservoir solution over night to remove the substrate analogue. Since hydrogen peroxide can react with compound I, peracetic acid was used. The crystals were soaked in 1-2 mM peracetic acid until they appeared green (2-10 minutes). Then they were dipped in a cryo solution and flash frozen in liquid nitrogen. Absorption spectra measured at 100K (see Fig. 3.9) showed that the crystals contained mainly compound I with a little compound II present. X-ray diffraction data were collected at 100K with 0.78 Å wavelength according to the strategy outlined above yielding a composite data set of the first 8° collected from each of 11 crystals. Spectra measured after data collection showed that compound I had been reduced during data collection. Only about 50% compound I was left after collecting 8° data, the other half had turned into compound II. This means the compound I data set contains about 25 % compound II. The iron-oxygen distance is 1.7Å, which is in agreement with the EXAFS measurement (1.64Å) (Chance et al. 1984). The ferryl oxygen is connected to the surface of the molecule via the hydrogen binding waters Z427, Z240, Z33, Z133, Z131 and Z140, each 2.6–2.8 Å apart.
Figure 3.9 Structure of compound I. a. Absorption spectrum before data collection consistent with mainly compound I, and the spectrum after collecting 8° X-ray data showing that compound I has partially been reduced to compound II during exposure. b. The refined structure of compound I. The figure shows SigmaA-weighted 2mFo-DFc electron density map contoured at 1 sigma, where sigma represents the root mean square electron density for the unit cell.
3.1.3.2 High resolution structure of Compound II To get compound II crystals from which the ferulic acid had been washed out, were soaked in reservoir solution with peracetic acid and 10% PEG400.
a
b

27
The crystals first turned green and when the green colour had disappeared the crystals were flash frozen in liquid nitrogen. Absorption spectra measured at 100K showed compound II with a some compound I present (fig. 3.10a). Data were collected as described for compound I. Spectra after data collection (fig. 3.10 b) showed that the small amount of compound I present before X-ray exposure had disappeared and some ferrous HRP had appeared. The structure corresponds to at least 80% compound II. The iron-oxygen distance is 1.8Å, which is comparable to the EXAFS measurement (1.93Å) (Chance et al. 1984). The water chain connecting the ferryl oxygen of compound I to the surface is also observed in compound II (waters Z403, Z227, Z36, Z131, Z129 and Z135).
The binding site for ferulic acid in the presence of cyanide (PDB ID 7atj, Henriksen, et al. 1999) coincides with part of the water chain in compounds I and II. Only one water molecule can be seen in the active site of the ferulic acid complex. It is 3.6 Å away from where the ferryl oxygen in compound I would be. It seems likely that the transfer of a proton from the hydrogen donor to the oxyferryl would involve a water at a different location than in either of these structures.
Figure 3.10 Structure of compound II. a. Absorbance spectrum before and after data collection. The spectrum on the left is consistent with nearly 80% compound II and about 20% compound I in the crystal. The spectrum on the right shows that after collecting 15° of data, the reactive compound I form had been reduced to compound II during data collection. At this stage, the crystal contained more compound II (about 90%) than at the start of the data collection. b. The refined structure of compound II, showing a SigmaA-weighted 2mFo-DFc electron density map contoured at 1 sigma, where sigma represents the root mean square electron density for the unit cell.
a
b

28
3.1.3.3 High resolution structure of Compound III Compound III was formed as described in section 3.1.2.1. X-ray diffraction data were collected systematically using the data collection strategy described in section 2.1.2.1 Only the first 8° of data were used from each of several crystals to yield a complete data set on the unreduced compound III. Spectral deconvolution of the spectrum measured after X-ray exposure was performed with SigmaPlot 3.0 (Jandel Scientific). The structure corresponds to 95% pure compound III.
Figure 3.11 Structure of compound III. a. Absorbance spectrum before data collection consistent with compound III, and the spectrum after collecting 10° X-ray data showing mainly compound III, but with a hint ferrous enzyme. b. The refined structure of compound III. The figure shows a SigmaA-weighted 2mFo-DFcelectron density map contoured at 1 sigma, where sigma represents the root mean square electron density for the unit cell.
3.1.4 Acetate, formate and CO complexes of HRP Acetate, formate and carbon monoxide (CO) interfere with the activity of HRP. We performed high resolution structural studies on these complexes to shed light on the binding mode of these ligands in the enzyme.
3.1.4.1 High resolution structure of HRP in complex with acetate Crystals (Henriksen et al. 1999) were grown in hanging drops, with 0.2 M calcium acetate, 20 % polyethylen glycol (PEG) 8000, 0.1 M sodium cacodylate, pH 6.5 as reservoir solution, and ferulic acid as additive. To remove the ferulic acid, the crystals were soaked in reservoir solution without ferulic acid. Composite data sets were collected at 100K as described (section 2.1.2.1) using the first 15° collected from each crystal.
a
b

29
Spectra before and after data collection (fig. 3.12) are consistent with the resting state enzyme that was slightly reduced during data collection. After data processing and model refinement (paper III and Table 3) the electron density map showed that an acetate molecule was bound in the active site.
Figure 3.12 The refined structure of the acetate complex. a. Absorbance spectra from crystals of resting state in complex with acetate before and after collecting 20° data. b. The figure shows a SigmaA-weighted 2mFo-DFc electron density map contoured at 1 sigma, where sigma represents the root mean square electron density for the unit cell. The figure was prepared with Molscript (Kraulis 1991, Merritt & Murphy 1994, Esnouf 1997 & 1999) and The Gimp (www.gimp.org).
3.1.4.2 High resolution structure of HRP in complex with formate Crystals were grown as described above and transferred to 10 l droplets of 20 % PEG8000, 0.2 M magnesium formate and 0.1 M sodium cacodylate, pH 6.5 and left for more than 3 hours at room temperature before flash freezing them in liquid nitrogen. X-ray diffraction data were collected at MaxLab BL 711 (Lund, Sweden) at 90K using 1.089 Å wavelength. A multi crystal strategy was used to minimize the radiation damage known to occur. 15° of data were collected systematically from each of seven crystals. The data were merged to give a composite data set corresponding to 90° oscillation (fig 2.6). The data were processed and scaled using the HKL-package (Otwinowski 1993) and programs in the CCP4 suite (Collaborative Computational Project Number 4. 1994). Initial rounds of refinement were done with CNS (Brünger et al. 1998) using 1H5A.pdb without water, calcium and acetate as starting model. In the last rounds of refinement rebuilding was done in maps calculated from ARP/wARP version 5.0
a
b

30
(Lamzin & Wilson 1993 &1997, Pignol, et al. 1996 & Perrakis et al. 1997) in the CCP4 suite, and as a last step the position of the formate was refined as a rigid body using only X-ray terms. 4.9% of the reflections were in the test set (see Table 3).
Figure 3.13 The refined structure of the HRP formate complex. The SigmaA-weighted 2mFo-DFc electron density map contoured at 1 sigma, where sigma represents the root mean square electron density for the unit cell. The figure was prepared with Molscript (Kraulis 1991, Merritt & Murphy 1994, Esnouf 1997 & 1999) and The Gimp (www.gimp.org).
Figure 3.13 shows that formate binds much closer to the iron then the acetate molecule does. One oxygen atom is 2.3 Å from the iron and hydrogen binding to Arg38NE. The other oxygen atom forms hydrogen bonds to His42 and Arg38N.
3.1.4.3 High resolution structure of ferrous HRP in complex with carbon monoxide The crystal grown with ferulic acid was transferred to 10 l droplets of 20 % PEG8000, 10 % PEG300, 0.2 M calcium acetate and 0.1 M sodium cacodylate, pH 6.5. The droplet was put in a glove box with nitrogen atmosphere and left overnight to equilibrate. 1 l 100 mM sodium dithionite was added to the droplet. After at least 1 hour in the reducing solution the crystal was fished out in a cryoloop and put in a pressure cell (4DX-ray Systems AB) where it was exposed to 10 bar carbon monoxide for 10 minutes. The pressure cell was taken out of the glove box and the crystal was immediately flash frozen in liquid nitrogen. Absorption spectrum of the crystal at 100K was consistent with a carbon monoxide-ferrous HRP complex (fig. 3.14a). X-ray diffraction data were collected at MaxLab BL 711 (Lund, Sweden). 100° of data were collected at cryogenic temperature with 1.089 Å wavelength. Absorption spectrum recorded after data collection still showed the features of the carbon monoxide complex. The data were processed and scaled using the HKL-package and programs in the
b

31
CCP4 suite. The structure was refined the same way as the formate complex above, using 1H58.pdb without water or calcium as starting model (Table 3).
Carbon monoxide binds slightly bent (171°) to the iron at a distance of 1.8 Å (fig. 3.14). This is very similar to binding geometries of carbon monoxide reported in other haem proteins diffracting to better than 2 Å (158–174°, distance 1.7–2.1 Å in PDB IDs 1JFC [Shimizu et al. 2002], 1A6G [Vojtechovsky et al. 1999], 1BZR [Kachalova et al. 1999], 1DWR [Chu et al. 2000], 3CCP [Wang et al. 1990], 1E86 [Lawson et al 2000], 1DY7 [Sjögren et al. 2000]).
Figure 3.14 The refined structure of the carbon monoxide complex. a. Spectra of the carbon monoxide complex before and after the collection of 90° data. b. Structure of the acetate complex. The figure shows a SigmaA-weighted 2mFo-DFc electron density map contoured at 1 sigma, where sigma represents the root mean square electron density for the unit cell. The figure was prepared with Molscript and The Gimp.
Infrared spectral data indicate two different binding modes for CO in ferrous HRP (Evangelista-Kirkup et al. 1986, and references therein) with stretching frequency 1904 cm-1 and 1932 cm-1 respectively. The 1932 cm-1 mode is believed to represent binding normal to the heme plane, while the other mode is tilted. The main species at lower pH is the 1904 cm-1 form, while the 1932 cm-1 species is present at high pH, with a transition pK of 8.8 (Barlow et al. 1976). At low pH there appeared to be an equilibrium between the two forms dependent upon the CO concentration and Evangelista-Kirkup et al. speculated that
a
b

32
"the heme pocket has an additional weak-binding CO site (not coordinated to the Fe) whose occupancy changes the conformation of the distal residues in a manner that favors the formation of an H bond from the protonated distal histidine to the Fe-bound CO".
In our experiment the crystals were exposed to excess CO and the bound CO is binding almost normal to the heme plane. No other CO molecule was observed in the structure. The reported tight binding of CO (Wittenberg et al. 1967b) is in part explained by the possible existence of at least two hydrogen bonds to both distal residues, His42 and Arg38. The pK of 8.25 identified by Hayashi et al. (1976) is presumably that of His42. At a more alkaline pH the bound CO may still be stabilized by a hydrogen-bond to the distal Arg38.
Table 3. Data collection and refinement statistics for HRP in complex with acetate, formate and carbon monoxide. Structure Acetate-ferric
HRP complex Formate-ferric HRP complex
CO-ferrous HRP complex
PDB ID 1H5A 1W4W 1W4Y Number of crystals used 7 7 1 Degrees collected/crystal 15 15 90 X-ray wavelength (Å) 0.93 1.089 1.089 P212121 cell a,b,c (Å) 40.3, 67.8, 117.3 40.3, 68.3, 117.0 40.4, 67.6, 117.2 Resolution range (Å) 19.7–1.60 26.8–1.55 25.9–1.60 Unique reflections 42,167 46,753 39,205 Completeness (%) 97.7 97.8 90.6 Data redundancy 4.4 3.7 2.9 I/ ) 18.2 12.1 8.3
Average B factor (Å2) 16.7 14.8 16.3 Number of atoms 2,906 2,802 2,764 of which waters 404 354 341 Rmerge (%)* 5.8 (20.3) 9.0 (23.4) 7.0 (30.1) Rcryst (%)† 17.8 19.8 19.9 Rfree (%)¶ 20.2 21.5 21.1 Coordinate error, A (Å) # 0.19 0.19 0.20 Iron-ligand distance – 2.3 Å 1.8 Å* Rmerge= | I-Iaverage|/ I, where I is the observed intensity of a reflection and Iaverage is the average intensity obtained from multiple observations of symmetry related reflections. † Rcryst= ||Fobs|-|Fcalc||/ |Fobs|.¶ 5% of the data were excluded from refinement and used to calculate Rfree (Brünger 1992). # Cross-validated estimated coordinate error from Luzzati plot

33
3.1.5 The proposed mechanism of ferryl formation It is striking how little the structure of the enzyme changes during catalysis. The enzyme acts as a rigid cage keeping the reactive oxyferryl group from doing damage to the protein or the cell. Despite the rigidity, the active site offers a flexibility in binding patterns. Several hydrogen bonding possibilities are offered by Arg38 and His42, suitable for several different binding modes which can be utilised under different stages of catalysis.
3.1.5.1 Binding of acetate and formate suggest a possible mechanism for formation of compound I Studies on the R38L mutant of HRP (Rodriguez-Lopez et al. 1996) and on polyethylene glycolated HRP in organic solvent (Ozaki, et al. 1998) suggest involvement of a hydrogen peroxide complex in the catalytic cycle, and experiments at cryogenic temperatures identified a peroxoanion–iron III complex, compound 0, as a compound I precursor (Baek & van Wart 1989 & 1992, Denisov et al. 2002). At present we have no direct structural data on how hydrogen peroxide binds at the active site. Based on the structures of compounds I and III, and the acetate and formate complexes, it is however possible to propose a mechanism for the binding of hydrogen peroxide and the subsequent formation of compound I (Figure 3.15). Access to the haem iron passes through sites where acetate and formate bind (Figures 3.12 and 3.13) in the ferric enzyme. Model building shows (Fig. 3.15a) that hydrogen peroxide can readily be accommodated in both of these sites, and can form hydrogen bonds to Arg38 and His42. A proton needs to be removed from hydrogen peroxide before binding to the iron, and transferred to another group in the active site. A number of authors (cf. Wittenberg et al. 1967b, Hayashi et al. 1976, Rodriguez-Lopez et al. 2001) have suggested that this proton acceptor is His42. The proposed model is in agreement with this requirement (Figures 3.15a and b). In the HRP-acetate and HRP-formate complexes, His42 forms direct hydrogen bonds to the carboxylate oxygens of these ligands. If hydrogen peroxide were to bind a similar fashion as acetate, His42 would be ideally poised to pick up a proton from the peroxide oxygen nearest to the iron. The hydroperoxo anion could be stabilised at this position (Fig. 3.15b) by hydrogen bonds from Arg38N and Arg38N . In the next step, the hydroperoxo anion could slide down to the iron via the formate binding site (Fig. 3.13b). At this position it could still have hydrogen bonds to Arg38, but the hydrogen bond from His42 would be transferred to the other oxygen atom of the hydroperoxoanion. As the hydroperoxo anion settles on the iron, the proton on His42 could be transferred to the hydroperoxo-ferric haem complex, leading to the heterolytic cleavage of the peroxide bond to give water and compound I.

34
Figure 3.15 Proposed mechanism for the formation of compound I in HRP.
3.1.5.2 Implications of the mechanism to explain the catalase activity of HRPHRP has a slow catalase-like activity (Nakajima & Yamazaki 1987; Hernandez-Ruiz et al. 2001). In this "catalatic" reaction of the enzyme, a second hydrogen peroxide molecule reacts with compound I to form a water molecule and dioxygen. Labelling studies show that in heme catalases, the dioxygen comes from the second hydrogen peroxide (Jarnagin and Wang 1958, and reference therein) while the water is formed from the ferryl-oxygen by the transfer of two protons and two electrons. Based on the assumption that hydrogen peroxide would bind similar to formate and acetate the low catalatic activity of HRP can be explained.
Very recently, structures have been published for two catalases in complex with formate: from Proteus mirabilis (PMi) to 2.3 Å resolution (pdb-entry 1nm0, Andreoletti et al. 2003) and from Helicobacter pylori (HP) to 1.6 Å (pdb-entry 1qwm, Loewen et al. 2004). HP catalase crystallised with two molecules in the asymmetric unit (molecules A and B), each exhibiting a different orientation of the formate adjacent to the heme. The formate in molecule A is bound in the same orientation as the the formate in PMi catalase, interacting with the heme iron at 2.7 Å distance. The formate in B is 3 Å above the heme plane, with the closest oxygen at 3.9 Å away from the iron.
Modelling a hydrogen peroxide molecule after the distal formate binding mode in HP catalase (Loewen et al. 2004) and comparing it with the structure of PMi catalase compound I (Andreoletti et al. 2003) shows how the two protons can be abstracted from the hydrogen peroxide. The proximal (closest to the iron) oxygen atom in the hydrogen peroxide molecule would be within hydrogen binding distance to the ferryl oxygen while the distal
a b
c d

35
oxygen atom is in hydrogen bonding distance to His54 and Asn127 (approx. 2.8 Å and 2.6 Å respectively). The protons are therefore positioned to be transferred to the ferryl oxygen and His54 as two electrons are transferred to the oxyferryl, leaving a dioxygen molecule.
For the catalatic reaction to occur in HRP, interaction between the ferryl oxygen and a hydrogen peroxide bound at the acetate site would be needed. Superposition of the haem nitrogens in the two structures gives a distance of 1.9 Å between the oxyferryl oxygen and the carboxylate oxygen closest to the iron in the acetate complex. This is to close for hydrogen binding interactions, indicating that an interaction between the oxyferryl and an hydrogenperoxide molecule would be unfavourable.
The catalase reaction is likely to be influenced by bound water molecules in the active site. It has been suggested by Jones (2001) that the absence or presence of a water in the active site decides whether compound I reacts in a one-electron reduction (which is the normal reaction for peroxidases), or in a two-electron reduction (as catalases do). The structure of the HRP-acetate complex suggests that if the second hydrogen peroxide would bind similarly to acetate, the binding would interfere with these waters. Our findings are in accordance with Jones’ theory.

36
3.2 Bacteriorhodopsin
3.2.1 Introduction
3.2.1.1 Rhodopsins from Halobacterium salinarium Halobacterium salinarum is an archaeon living in salt brines, under saturated salt conditions. This microorganism has four different rhodopsins, which are helping the bacterium to survive under these extreme conditions:
Bacteriorhodopsin (BR) is a photon driven proton pump. The proton gradient created by this pump across the cell membrane is used as energy source for the synthesis of ATP. Halorhodopsin is a photon driven chloride pump, which keeps the osmotic balance during cell growth. Sensory rhodopsins I and II make the archaeon swim towards orange light, but away from UV-light. Sensory rhodopsins help the bacterium to find a location/depth where it can use sun light as an energy source while avoiding damage by UV-light.
These four rhodopsins are membrane proteins with seven transmembrane helices and a bound retinal molecule covalently linked to a lysine side chain. Despite their different functions, rhodopsins work with a similar basic mechanism and a single point mutation is, for instance, enough to turn bacteriorhodopsin into a chloride pump. Only proton pumping by bacteriorhodopsin will be discussed here.
3.2.1.2 Bacteriorhodopsin and the photocycle Bacteriorhodopsin (BR) is found in the cell membrane of Halobacterium salinarum, where it spontaneously forms patches of two-dimensional crystals, called the purple membrane. It is one of the simplest proton pumps discovered, and since it is also very stable and can be purified in large quantities, it has been used as a model system to study the mechanisms of proton pumping. BR uses one photon to pump one proton from the cytoplasm to the extracellular side of the cell membrane. BR contains one molecule of retinal bound to the -amino group of lysine216, forming a Schiff base at the approximate centre of the molecule. The absorption of a photon starts a reaction sequence called the photocycle (see fig. 3.16). The intermediates in the photocycle were first investigated by spectroscopy and were called J-O, where each intermediate has a different visible spectrum. The crystal structure has been determined for some of the intermediates using different trapping protocols.

37
Figure 3.16 The photocycle of BR. The absorbance maxima of the intermediates are shown in subscript.
3.2.2 The M1-intermediate and the Asp38Arg mutant of BR The M-intermediate is formed when a proton is transferred from the Schiff base to Asp85. The M-intermediate was defined as the intermediate having an absorbance peak at 410 nm. The big shift of the absorbance peak is due to the deprotonation of the Schiff base. It was later discovered that the M-intermediate is really at least two different intermediates, M1 and M2, with similar UV-VIS spectra that follow after each other in the photocycle. The formation of M2 in wild type BR is associated with large conformational changes in the protein structure (Sass et al. 1997).
Residue Asp38 is located some 12 Å away from the Schiff base, close to the surface at the cytoplasmic side of BR and is thought to be a part of the reprotonation pathway (Riesle et al. 1996). Replacing Asp38 by arginine has a dramatic effect on the decay of the M-intermediate. Though the first half of the photocycle is unaffected, the decay of the M-intermediate is slowed down by a factor of 20 (pH 7, 20°C). Sass et al. (1998) showed that at pH 6.7 it is the M1-intermediate which is accumulated in the Asp38Arg mutant, while the M2-intermediate can be accumulated at pH 9.8. This suggested that Asp38 or at least the charge distribution in that region, is important for the conformational change associated with the M2 formation. Despite this the Asp38Arg mutant can still pump protons. That the Asp38Arg mutant could be homologously expressed with a high yield, was another factor making BRD38R a good candidate for structure determination of the M1-intermediate.

38
3.2.2.1 Crystallisation of the BRD38R mutant The protein was purified as described (Oesterhelt & Stoeckenius 1974): The cells were lysed by dialysis against water, the membrane fraction was spinned down, rinsed, homogenized and put on a 25–45% sucrose gradient and ultra centrifuged. The purple membrane (PM) fraction was dialysed against water, spinned down and homogenized.
For crystallisation in lipid cubic phase (Landau et al. 1996, Rummel et al. 1998) the PM was solubilised in -octyl glucoside (20mg -OG/mg BR) and concentrated. 1-monooleoyl-rac-glycerol (MO) and salt were added to the glass vial as solids before pipetting the solutions. BRD38R was not stable in the lipid cubic phase unless the salt was added before adding the protein. The vials were mixed by centrifugation at 22°C. Nice hexagonal crystals appeared under two conditions: 62% MO, 3.7mg/ml BR Asp38Arg and corresponding to 2 M Sorenson salt pH 5.8 (fig. 3.17a.), and in similar conditions but with MPD added.
In bicelle crystallisation (Faham&Bowie, 2002) the PM is mixed with a lipid mixture which is pipettable at low temperatures and forms a gel at higher temperatures. The experiments are done as vapour diffusion experiment in a hanging drop setup. Crystals appeared under two different conditions. Nice hexagonal crystals (fig. 3.17b.) were grown at 30°C with 2.2–2.4 M NaH2PO4 (pH 3.3) as reservoir solution and a droplet of 6 l protein-lipid mixture, 2.5 l reservoir solution and 1 l 2.5% -OG. Large stacked plates (fig. 3.17c.) appeared at high salt (3.2 M NaH2PO4) incubated at 42°C.
Figure 3.17 Crystals of BR Asp38Arg. a. Crystals grown in lipid cubic phase. b.from bicelle crystallisation in low salt at 30°C, and c, in high salt at 42°C.
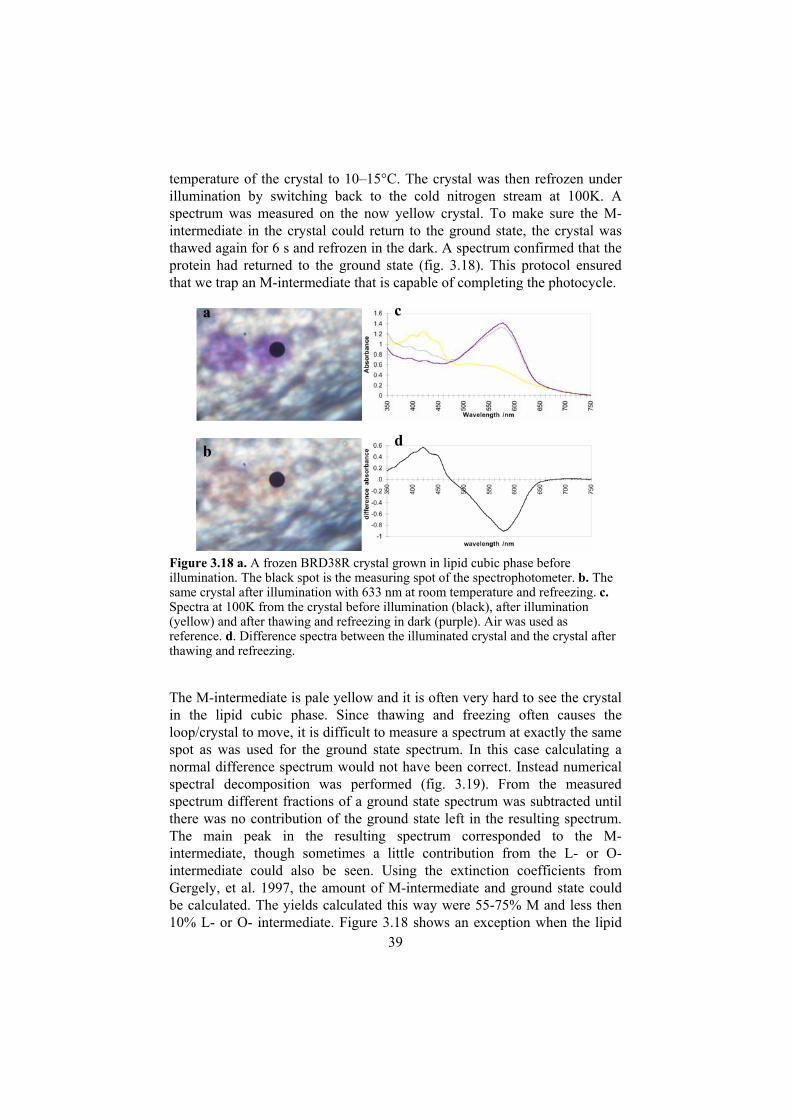
3.2.2.2 Development of a protocol for trapping an M-intermediate in crystals of the BR Asp38Arg mutant A high yield of M-state could be achieved by the following protocol: First a ground state spectrum was measured on a purple BR Asp38Arg crystal in a nylon loop at 100K, using an adapted Universal-Mikroskop-Spektral-Photometer UMSP 80. While illuminating the crystal with 633 nm from a HeNe laser, the stream of cold nitrogen was blocked for 10 s to raise the
a b c
39
temperature of the crystal to 10–15°C. The crystal was then refrozen under illumination by switching back to the cold nitrogen stream at 100K. A spectrum was measured on the now yellow crystal. To make sure the M-intermediate in the crystal could return to the ground state, the crystal was thawed again for 6 s and refrozen in the dark. A spectrum confirmed that the protein had returned to the ground state (fig. 3.18). This protocol ensured that we trap an M-intermediate that is capable of completing the photocycle.
Figure 3.18 a. A frozen BRD38R crystal grown in lipid cubic phase before illumination. The black spot is the measuring spot of the spectrophotometer. b. The same crystal after illumination with 633 nm at room temperature and refreezing. c.Spectra at 100K from the crystal before illumination (black), after illumination (yellow) and after thawing and refreezing in dark (purple). Air was used as reference. d. Difference spectra between the illuminated crystal and the crystal after thawing and refreezing.
The M-intermediate is pale yellow and it is often very hard to see the crystal in the lipid cubic phase. Since thawing and freezing often causes the loop/crystal to move, it is difficult to measure a spectrum at exactly the same spot as was used for the ground state spectrum. In this case calculating a normal difference spectrum would not have been correct. Instead numerical spectral decomposition was performed (fig. 3.19). From the measured spectrum different fractions of a ground state spectrum was subtracted until there was no contribution of the ground state left in the resulting spectrum. The main peak in the resulting spectrum corresponded to the M-intermediate, though sometimes a little contribution from the L- or O-intermediate could also be seen. Using the extinction coefficients from Gergely, et al. 1997, the amount of M-intermediate and ground state could be calculated. The yields calculated this way were 55-75% M and less then 10% L- or O- intermediate. Figure 3.18 shows an exception when the lipid
a
b
c
d

40
cubic phase was very thin so the crystal was visible also in the M-state. In this case the difference spectrum could be used to calculate the yield of the M-intermediate as well as the decomposition. It showed that the amount of the M-intermediate was underestimated by the numerical decomposition method (in this case 60-75% compared to 80-90%). The possibility of crystal contacts or temperature influencing the extinctions coefficients were not taken into account, though it was obvious that the low temperature changed the spectrum of the M-intermediate from a smooth peak to a peak with two distinct shoulders. Comparing the M-build-up peak with the bR-depletion peak in the difference spectrum in figure 3.18 suggests that the ratio between the extinction coefficients does not differ much from the ratio between the extinction coefficients at room temperature in solution. The yield of the M-intermediate calculated should therefore be correct.
Figure 3.19 Illustration of numerical decomposition of spectra. From the spectrum of the illuminated crystal (thick black) the spectrum of a ground state crystal times a constant (thin black) was subtracted. The resulting spectrum (grey) mainly consists of M-state. A constant has been subtracted from each spectrum to bring down the absorbance at 750 nm to 0. a. Crystal grown by bicell method at pH 3.3 soaked 15min at pH 5.8 before illumination with 633 nm at room temperature (50–65%M, <5%O, <20%L). b. The crystal was grown in LQP pH 5.8, spectra from lipid cubic phase (thin grey line) was first subtracted to decrease the background (65–70%M).
To determine if the trapped M-intermediate in BR Asp38Arg crystals was stable enough for data collection, an illuminated crystal was kept at 100K and spectra were measured at different time points (fig. 3.20). The difference spectra show an M-depletion peak with a spectral minimum at 420 nm and a
a
b

41
build-up peak with a spectral maximum at 620 nm corresponding to the formation of the O-state. There are three isobestic points at approximately 365 nm, 455 nm and 690 nm. The decay of the M-intermediate was rather slow: in 50 minutes the amount M-intermediate present in the crystal decreased from 60 % to 50 %.
Figure 3.20 Decay of the M-intermediate at 100K. A crystal grown using the bicelle method at pH 3.3 was soaked 15 min at pH 5.8 before use. The crystal was illuminated with 633 nm from a He-Ne laser at room temperature and while flash freezing. The crystal was kept at 100K in the cryostream and spectra were taken at different time points. a. Spectra directly after illumination (thick black) after waiting 2 min (black), 5 min (grey), 10 min (dashed grey), 50 min (dashed black) and 147 min (thick grey) at 100K. After 50 min the background changed. b. Difference spectra after waiting different time minus the spectrum directly after illumination. The difference spectra after 2 min (black), 5 min, 10 min and 50 min shows the decay of the M-intermediate (410 nm) and the build-up of the O-intermediate at 610 nm.
3.2.2.3 Diffraction of BR Asp38R crystals Crystals grown in the lipid cubic phase were 70 m in diameter and 10 mthick. The crystals diffracted to 3.2 Å resolution (fig. 3.21a). They crystallised in space group P63 (as wild type) and were highly twinned. I also obtained crystals from the lipid cubic phase in the presence of MPD. These crystals did not diffract in one direction. Plate-like crystals grown with the bicelle method did not diffract at all. The hexagonal crystals from bicelles diffracted well in one direction, but not at all in the direction of stacking (fig. 3.21b).
a
b

42
Figure 3.21 a. X-ray diffraction to 3.2 Å from a BR Asp38Arg crystal grown in lipid cubic phase. b. X-ray diffraction from a BR Asp38Arg crystal from bicelles collected with 1° oscillation. The extreme mosaicity in the direction of the beam causes many reflections to be seen in the image.
To be useful for studying reaction intermediates, crystals should diffract at least to about 2 Å. So while the intermediate of interest could be trapped successfully in these experiments, the end was a failure due to the lack of good quality diffraction from these crystals. This highlights one of the key problems with X-ray crystallography studies today, i.e. the need for good quality crystals. Unfortunately, these crystals let me down.
a b

43
AcknowledgementsA double (at least) thank you Janos for accepting me as a student, and many more for all help and support and interesting ideas on various topics. It has been exciting being in your group. Thank you Gunnar for nice collaboration on HRP and always being nice and helpful, Norway can be happy to have you back. I’d also like to thank Andy Smith for being such a nice guy and for sending us purified HRP whenever needed. Visits to the synchrotrons ESRF and MaxLab were vital for these studies and help from the local contacts there are gratefully acknowledged. The trapping and data collection of the CO complex done by students at the molecular biophysics course 2003, it was very nice working with you. I’d like to thank the past and present members of Janos and Ingers group for help with science, practical details and having fun. Considering how many nice, intelligent, funny people who have left for e.g. Gothenburg or London, one would think the lab would be drained by now, but it is amazing how the supply of such people never ends.
I’d like to thank Dieter Oesterhelt for letting me join his group at the Max-Planck institute for Biochemistry and work on a potentially very interesting project. I’d also like to thank all the people who helped me with various things, especially Jörg Tittor, Walter Gmelin and Brigitte Kessler. My time in Munich included both ups and downs, and I’d like to thank all those nice people who made the ups so many, the many nice persons in the lab, at the lunch and dinner table, going to excursions and of course sharing my office. A very important part of my life in Munich was my ‘leg throwing’ friends in Die Haxnschmeisser and other dance-oholics. I’m looking forward to dancing some Zwiefacher with you again and hope you will come and visit me.
There is no place like home, and I’d like to thank my friends here in Uppsala who make Uppsala my home. Maria Forslund, who had the lab bench behind me at the first course here in Uppsala, Ola Arwidsson and Anna Hellström, who I met through dancing – without you Uppsala and life in general would be much duller. All the other members of Philochoros and Cambalache with whom I’ve danced, talked, etc., have also had a great influence on my wellbeing. I’d also like to thank my friend stationed in Eskilstuna, Lisa Walterfelt for all fun we’ve had through the years.
Jag skulle också vilja tacka mina kemilärare, Marion (Fröslunda) och Irene och Gerd (Rinman) för att ni fick mig att inse att kemi är kul.
Slutligen ett stort tack till min släkt och familj. Lillebror Dennis, mamma och pappa, tack för allt stöd genom åren och för att ni alltid finns där.

44
Sammanfattning
Genom att bestämma proteiners struktur kan man få kunskap om hur de fungerar, kunskap som bland annat kan användas för att få fram nya mediciner. Den mest använda metoden för att få detaljerad kunskap om hur proteiner ser ut är röntgenkristallografi. För att få mer detaljerad information om reaktionsmekanismer kan man bestämma strukturen på reaktionsintermediat. I allmänhet är intermediat mycket kort livade medan kristallisation kräver flera dagar. Därför försöker man generera intermediaten i de färdig växta protein kristallerna. Protein kristaller består av en hög andel vatten (30–80%). Det gör dem känsliga för uttorkning, men gör det också möjligt att låta substrat diffundera in i kristallen. För att bestämma strukturen krävs att endast ett intermediat bildats i hög koncentration i kristallen och att det är stabilt tillräckligt länge för att samla röntgendiffraktionsdata. Sökandet efter förhållanden där reaktionen kan initieras så att ett intermediat ackumuleras görs ofta vid rumstemperatur. Traditionellt hanteras kristaller vid rumstemperatur sittande i en glas- eller kvartskapillär för att förhindra uttorkning, vilket är besvärligt och det är risk att skada kristallen. För att förenkla hanteringen av kristaller vid rumstemperatur har en ”Vapour stream” tagits fram (Artikel I). Kristallen sitter ’naken’ i en vanlig nylonögla i en ström av fuktig gas för att inte torka ut. Flyktiga substrat och substrat i gasform introduceras enkelt via gasströmmen. Substrat i lösning kan tillsättas direkt till nylonöglan. Det går utmärkt att kombinera den med en mikrospektrofotometer för att följa reaktionen i kristallen. Vår ”Vapour stream” har dessutom fördelen att det är möjligt att frysa kristallen för att stabilisera intermediatet så snart det önskade intermediatet observerats i kristallen, vilket inte går om kristallen sitter i en kapillär.
Ett annat problem när man bestämmer strukturen av t.ex. redoxenzymers reaktionsintermediat, är att atomer med ett högt oxidationstillstånd ofta blir reducerade när de utsätts för röntgenstrålning. När röntgenstrålning interagerar med biomolekyler utgör elastisk spridning som innehåller information om proteinets struktur och ger upphov till röntgen diffraktionsmönstret, bara en liten andel av alla interaktioner. Den större andelen av interaktionerna resulterar i absorbtion av energin genom den fotoelektriska effekten. Den orsakar att elektroner frigörs från atomer och omdistribueras i kristallen. Vi har utvecklat en strategi som kan användas för

45
att studera vad som händer i proteinet under insamlandet av röntgendiffraktionsdata (Artikel III). Den går ut på att samla flera hela dataset på olika kristaller, dela upp varje dataset i delar och sätta ihop de delar från varje kristall som motsvarar samma strålningsdos och på så sätt få nya dataset som motsvarar olika tidpunkter under datasamlingen.
Pepparrotsperoxidas är ett hem-enzym som bl.a. katalyserar en reaktion där en väteperoxid molekyl reduceras till vatten och två aromatiska vätedonatorer oxideras till radikaler. Reaktionen sker enligt en ping-pong mekanism med två stabila reaktionsintermediat, kallade compound I och compound II. Dessutom finns compound III som kan bildas genom att utsätta pepparrotsperoxidas för mycket väteperoxid eller genom att tillsätta syrgas till det reducerade (Fe2+) enzymet.
Alla dessa intermediat, liksom enzymet i grundtillstånd (Fe3+) blev reducerade när de utsattes för röntgenstrålning under datasamling (Artikel III). Ovan beskrivna metoder användes på kristaller av pepparrotsperoxidas för att få en sekvens av tredimensionella bilder som visar reduktionen av compound III under datasamlingen. Genom att samla data på ett systematiskt sätt med flera kristaller, kunde vi bestämma strukturerna på compound I, II och III, samt enzymet i komplex med acetat, format resp. kolmonooxid (Artikel III & IV). Absorptionsspectra från kristallerna både före och efter exponering med röntgenstrålning bekräftade att strukturerna motsvarar de oreducerade intermediaten och komplexen. Det var förmodligen den första gången den typen av intermediat blivit strukturbestämda med verifierade oxidationstillstånd.

46
References
Andreoletti, P., Pernoud, A., Sainz, G., Gouet, P. & Jouve, H.M. (2003) “Structural studies of Proteus mirabilis catalase in its ground state, oxidized state and in complex with formic acid”Acta Cryst. D59, 2163–2168
Baek, H. K. & van Wart, H. E. (1989) “Elementary steps in the formation of horseradish peroxidase compound I: Direct observation of compound 0, a new intermediate with a hyperporphyrin spectrum” Biochemistry 28, 5714–5719
Baek, H. K. & van Wart, H. E. (1992) “Elementary steps in the reaction of horseradish peroxidase with several peroxides: kinetics and thermodynamics of formation of compound 0 and compound I” J. Am. Chem. Soc. 114, 718–725
Barlow, C. H., Ohlsson, P.-I. & Paul, K.-G. (1976) “Infrared spectroscopic studies of carbonyl horseradish peroxidases,” Biochemistry 15, 2225–2229
Bourgeois, D., Vernede, X., Adam, V., Fioravanti, E. & Ursby, T. (2002) “A microspectrophotometer for UV-visible absorption and fluorescence studies of protein crystals” J. Appl. Cryst. 35, 319–326
Brünger, A.T. (1992 )“The free R value: a novel statistical quantity for assessing the accuracy of crystal structures” Nature 355, 472–472
Brünger, A.T., Adams, P., Clore, G., Delano, W., Gros, P., Grosse-Kunstleve, R., Jiang, J-S., Kuszewski, J., Nilges, N., Pannu,N., Read, R., Rice, L., Simonson, T., & Warren , G. (1998) “Crystallography and NMR system (CNS): A new software system for macromolecular structure determination” Acta Cryst. D53,905–921
Burmeister W. P., (2000) “Structural changes in a cryo-cooled protein crystal owing to radiation damage” Acta Cryst. D 56, 328-341
Chance, B., Angiolillo, P., Yang, E. K. & Powers, L. (1980) “Identification and assay of synchrotron radiation-induced alterations on Met-alloenzymes and Proteins” FEBS Lett. 112, 178-182
Chance, B., Powers, L, Ching, Y., Poulos, T., Schonbaum, G.R., Yamazaki, I. & Paul, K.G. (1984) “X-ray absorption studies of intermediates in peroxidase activity.” Arch. Biochem. Biophys. 235, 596–611
Chu, K., Vojtchovsky, J., McMahon, B.H., Sweet, R.M., Berendzen, J. & Schlichting, I. (2000) “Structure of a ligand-binding intermediate in wild-type carbonmonoxy myoglobin” Nature 403, 921–923
Collaborative Computational Project, Number 4. (1994) “The CCP4 suite: programs for protein crystallography” Acta Cryst. D 50, 760–763
Denisov, I.G., Markis, T.M. & Sligar, S.G. (2002) “Formation and decay of hydroperoxo-ferric heme complex in horseradish peroxidase studied by cryoradiolysis” J. Biol. Chem. 277, 42706–42710
Dunford, H.B. (1991) “Horseradish peroxidase: Structure and kinetic properties” in Peroxidases in Chemistry and Biology, Vol 2, (eds Everse, I., Everse, K.E. & Grishem, M.B.), 1–24, CRC Press, Boca Raton

47
Edman, K., Nollert, P., Royant, A., Belrhali, H., Pebay-Peyroula, E., Hajdu, J. Neutze, R. & Landau, E. M. High-resolution X-ray structure of an early intermediate in the bacteriorhodopsin photocycle. Nature, 401, 822-826 (1999).
Esnouf, R. M. (1997) “An extensively modified version of MolScript that includes greatly enhanced coloring capabilities" Journal of Molecular Graphics and Modelling 15, 132–134
Esnouf, R. M. (1999) “Further additions to MolScript version 1.4, including reading and contouring of electron-density maps” Acta Cryst. D55, 938–940
Evangelista-Kirkup, R., Smulevich, G. & Spiro, T. G. (1986) “Alternative carbon monoxide binding modes for horseradish peroxidase studied by Resonance Raman spectroscopy” Biochemistry 25, 4420–4425
Faham, S. & Bowie, J. U. (2002) “Bicelle crystallization: a new method for crystallizing membrane proteins yields a monomeric bacteriorhodopsin structure” J Mol Biol. 316(1), 1–6
Flank, A. M., Weininger, M., Mortenson, L. E. and Cramer, S. P. (1986)” Single crystal EXAFS of nitrogenase” J. Am. Chem. Soc. 108, 1049–1055
Foerster, S., Stein, M., Brecht, M., Ogata, H., Higuchi, Y. & Lubitz, W. (2003) “Single crystal EPR studies of the reduced active site of [NiFe] hydrogenase from Desulfovibrio vulgaris Miyazaki F.” J Am Chem Soc. 125(1), 83-93
Gajhede, M., Schuller, D.J., Henriksen, A., Smith, A.T. and Poulos, T.L. (1997) “Crystal structure of horseradish peroxidase C at 2.15 Å resolution” Nat. Struct. Biol. 4 (12), 1032–1038
Garman, E. (2003) “’Cool’ crystals: macromolecular cryocrystallography and radiation damage” Current Opinion in Structural biology, 13, 545-551
Gergely, C., et al, (1997) "Bacteriorhodopsin Intermediate Spectra Determined over a Wide pH Range" J. Phys. Chem. B 101, 9390–935
Gerwert, K., Hess, B., Michel, H. & Buchanan, S. (1988) "FTIR studies on crystals of photosynthetic reaction centers" FEBS LETTERS 232 (2), 303-307
Hajdu, J., Acharya, K.R., Stuart, E.I., Barford , D. & Johnson, L.N. (1988) “Catalysis in enzyme crystals” TIBS 13, 104–109
Hayashi, Y., Yamada, H. & Yamazaki, I. (1976) “Heme-linked proton dissociation of carbon monoxide complexes of myoglobin and peroxidase” Biochim. Biophys. Acta 427, 608–616
Henderson, R. (1995) “The potential and limitations of neutrons, electrons and X-rays for atomic resolution microscopy of unstained biological molecules” Q. Rev. Biophys. 28, 171–193
Henriksen, A., Gajhede, M., Baker, P., Smith, A.T. & Burke, J.F. (1995) “Crystallization and preliminary X-ray studies of recombinant horseradish peroxidase” Acta Cryst. D51, 121–123
Henriksen, A., Smith, A.T. & Gajhede, M. (1999) “The structures of the horseradish peroxidase C-ferulic acid complex and the ternary complex with cyanide suggest how peroxidases oxidize small phenolic substrates” J.Biol.Chem. 274,35005-35011
Hernandez-Ruiz, J., Arnao, M.B., Hiner, A.N.P., Garcia-Canovas, F. & Acosta, M. (2001) “Catalase-like activity of horseradish peroxidase: relationship to enzyme inactivation by H2O2” Biochem. J. 354, 107–114
Hofrichter, J., Eaton, W.A.: Linear dichroism of biological chromophores. Annu. Rev. Biophys. Bioeng. 5, 511–560 (1976).
Jarnagin, R. C. & Wang, J. H. (1958) “Investigation of the catalytic mechanism of catalase and other ferric compounds with doubly O18-labeled hydrogen peroxide” J. Am. Chem. Soc. 80, 786–787

48
Jones, P. (2001) “Roles of water in heme peroxidase and catalase mechanisms” J.Biol. Chem. 276, 13791–13796
Kachalova, G. S., Popov, A. N. & Bartunik, H. D. (1999) “A steric mechanism for inhibition of CO binding to heme proteins” Science 284, 473
Kraulis, P. J. (1991) “Molscript - a program to produce both detailed and schematic plots of protein structures” J. Appl. Cryst. 24, 946–950
Lamzin, V. S., & Wilson, K. S. (1993) “Automated refinement of protein models” Acta Cryst. D49, 129–149
Lamzin, V. S., & Wilson, K. S. (1997) “Automated refinement for protein crystallography” Methods in Enzymology 277, 269–305
Landau, E.M. & Rosenbusch, J.P. (1996 ) “Lipidic cubic phases: a novel concept for the crystallization of membrane proteins.” Proc Natl Acad Sci U S A. 93(25), 14532–14535.
Lawson, D. M., Stevenson, C. E., Andrew, C. R. & Eady, R. R. (2000) “Unprecedented Proximal Binding of Nitric Oxide to Heme: Implications for Guanylate Cyclase” Embo J. 19, 5661
Loewen, P.C., Carpena, X., Rovira, C., Ivancich, A., Perez-Luque, R., Haas, R., Odenbreit, S., Nicholls, P. & Fita, I. (2004) “Structure of Helicobacter pylori catalase, with and without formic acid bound, at 1.6 Å resolution” Biochemistry 43, 3089–3103
Logan, D.T., Su, X.D., Åberg, A., Regnström, K., Hajdu, J., Eklund, H., Nordlund, P. (1996) “Crystal-structure of reduced protein R2 of ribonucleotide reductase - the structural basis for oxygen activation at a dinuclear iron site” Structure, 4,1053-1064.
Makinen, M.W. (1977) “Reactivity and cryoenzymology of enzymes in the crystalline state” Ann. Rev. Bioeng. 6, 301-343
Marcus, R. A. (1956) “On the theory of Oxidation-reduction reactions involving electron transfer. I” J. Chem.Phys. 24, 966
Marcus, R. A. (1964) “Chemical and Electrochemical Electron-Transfer Theory” Ann. Rev. Phys. Chem. 15, 155–196
Merritt, E., & Murphy M. E. P. (1994) “Raster3d version-2.0 - a program for photorealistic molecular graphics” Acta Cryst. D50, 869–873
Nakajima, R. & Yamazaki, I. (1987) “The mechanism of oxyperoxidase formation from ferryl peroxidase and hydrogen peroxide” J. Biol. Chem. 262, 2576-2581
Neutze, R., Pebay-Peyroula, E., Edman, E., Royant, A., Navarro, J. &Landau, E.M. (2002) “Bacteriorhodopsin: a high-reolution structural view of vectorial proton transport” Biochim. Biophys. Acta 1565, 144–167
Oesterhelt, D., & Stoeckenius. W. (1974) “Isolation of the cell membrane of Halobacterium halobium and its fractionation into red and purple membrane” Methods Enzymol. 31, 667-678
Otwinowski, Z. (1993) “Oscillation data reduction program” in “Data Collection and Processing” (eds. Sawyer, L., Isaacs, N.W. & Bailey, S.) 55–62 (SERC Daresbury Laboratory, Warrington, UK)
Ozaki, S., Inada, Y. & Watanabe, Y. (1998) “Characterization of Polyethylene Glycolated Horseradish Peroxidase in Organic Solvents: Generation and Stabilization of Transient Catalytic Intermediates at Low Temperature” J. Am. Chem. Soc. 120, 8020–8025
Perrakis, A., Sixma, T. K., Wilson, K.S., & Lamzin, V. S. (1997) “wARP: improvement and extension of crystallographic phases by weighted averaging of multiple refined dummy atomic models” Acta Cryst. D53, 448–455

49
Petsko, G. & Ringe, D. (2000) “Observation of unstable species in enzyme-catalyzed transformations using protein crystallography” Curr. Opin. Chem. Biol. 4, 89-94
Pignol, D., Gaboriaud, C., Fontecilla-Camps, J. C., Lamzin, V. S., and Wilson, K. S. (1996) “How to escape from model bias with a high resolution native data set - structure determination of the PcpA-S6 subunit III” Acta Cryst. D52, 345–355
Planche, L.A. (1810) “Note sur la sophistication de la résine de jalap et sur les moyens de la reconnaître, etc.” Bulletin de Pharmacie 2, 578-580
Ravelli, R.B.G. & McSweeney, S.M. (2000) “The’fingerprint’ that X-rays can leave on structures” Structure 8, 315–328
Riesle, J., Oesterhelt, D., Dencher, H. A. & Heberle, J. (1996) “D38 is an essential part of the proton translocation pathway in bacteriothodopsin” Biochemistry 35,6635–6643
Rodriguez-Lopez, J. N., Smith A. T. & Thorneley, R. N. F. (1996) “Role of arginine 38 in horseradish peroxidase” J. Biol. Chem 271, 4023–4030
Rodriguez-Lopez, J. N., Lowe, D. J., Hernandez-Ruiz, J., Hiner, A. N. P., Garcia-Canovas, F. & Thorneley, R. N. F. (2001) “Mechanism of reaction of hydrogen peroxide with horseradish peroxidase: Identification of intermediates in the catalytic cycle” J. Am. Chem. Soc. 123, 11838–11847
Rummel, G., Hardmeyer, A., Widmer, C., Chiu, M.L., Nollert, P., Locher, K.P., Pedruzzi, I., Landau, E.M.& Rosenbusch, J.P. (1998) “Lipidic Cubic Phases: New Matrices for the Three-Dimensional Crystallization of Membrane Proteins.” J Struct Biol. 121(2), 82–91
Sass H. J., Schachowa I. W., Rapp G., Koch M. H. J., Oesterhelt D., Dencher N. A. & Buldt G. (1997) “The tertiary structural changes in bacteriorhodopsin occur between M states: X-ray diffraction and Fourier transform infrared spectroscopy” Biophys. J. 72, MAMJ2-MAMJ2
Sass, H.J., Gessenich, R., Koch, M. H. J., Oesterhelt, D., Dencher, N. A., Büldt, G. & Rapp, G. (1998) “Evidence for charge-controlled conformational changes in the photocycle of bacteriorhodopsin” Biophys. J. 75, 399–405
Schlichting, I. (2000) “Crystallographic Structure Determination of unstable Species” Acc. Chem. Res. 33, 532–536
Schlichting, I., Berendzen, J., Chu, K., Stock, A. M., Maves, S. A., Benson, D. E., Sweet, R. M., Ringe, D., Petsko, G. A., and Sligar, S. G. (2000) “The catalytic pathway of cytochrome P450cam at atomic resolution” Science 287(5458), 1615–1622
Schotte, F., Lim, M., Jackson, T.A., Smirnov, A.V., Soman, J., Olson, J.S., Phillips, G.N., Wulff, M. & Anfinrud, P.A. (2003) "Watching a protein as it functions with 150-ps time-resolved X-ray crystallography" Science 300, 1944-1947
Shimizu, H., Park, S. Y., Shiro, Y. & Adachi, S. (2002) “X-Ray Structure of Nitric Oxide Reductase (Cytochrome P450Nor) at Atomic Resolution” ActaCrystallogr. D 58, 81
Sjögren, T., Svensson-Ek, M., Hajdu, J. & Brzezinski, P. (2000) “Proton-Coupled structural changes upon binding of carbon monoxide to cytochrome cd1: a combined flash photolysis and X-ray crystallography study” Biochemistry 39,10967–10974
Sjögren, T. & Hajdu, J. (2001) “Structure of the bound dioxygen species in the cytochrome oxidase reaction of cytochrome cd1 nitrite reductase.” J. Biol.Chem.
Smith, A.T., Santama, N., Dacey, S., Edwards, M., Bray, R.C., Thorneley, R.N.F. & Burke, J.F. (1990) “Expression of a synthetic gene for horseradish peroxidase C in Escherichia coli and folding and activation of the recombinant enzyme with Ca2+ and heme” J. Biol. Chem. 265, 13335-13343

50
Smulevitch, G. & Spiro, T.G. (1993) "Single-crystal micro-Raman spectroscopy" Methods Enzymol 226, 397-408
Veitch, N.C. & Smith A.T. (2000) “Horseradish peroxidase” Advances in Inorganic Chemistry, 51, 107–162
Veitch, N.C. (2004) “Horseradish peroxidase: a modern view of a classic enzyme” Phytochemistry 65, 249–259
Vojtechovsky, J., Berendzen, J., Chu, K., Schlichting, I. & Sweet, R. M. (1999) “Implications for the Mechanism of Ligand Discrimination and Identification of Substates Derived from Crystal Structures of Myoglobin-Ligand Complexes at Atomic Resolution” Biophys J 77, 2153-2174
Wang, J. M., Mauro, M., Edwards, S. L., Oatley, S. J., Fishel, L. A., Ashford, V. A., Xuong, N. H. & Kraut, J. (1990) “X-ray structures of recombinant yeast cytochrome c peroxidase and three heme-cleft mutants prepared by site-directed mutagenesis” Biochemistry 29, 7160
Weik M., Ravelli R.B.G., Kryger G., McSweeney S., Raves M.L., Harel M., Gros P., Silman I., Kroon J. & Sussman J.L. (2000) “Specific chemical and structural damage to proteins produced by synchrotron radiation” Proc. Natl. Acad. Sci. USA, 97, 623-628
Willstätter,R. & Pollinger, A. (1923) Liebigs Ann. 430, 269–319 Wilmot, C.M. & Pearson, A.P. (2002) “Cryocrystallography of metalloprotein
reaction intermediates” Curr. Opin. Chem. Biol. 6, 202-207 Wittenberg, J.B., Noble, R.W., Wittenberg, B.A., Antonini, E., Brunori, M. &
Wyman, J. (1967a)“Studies on the equilibria and kinetics of the reactions of peroxidase with ligands. II .the reaction of ferroperoxidase with oxygen” J. Biol. Chem. 242, 626-634
Wittenberg, B. A., Antonini, E., Brunori, M., Noble, R. W., Wittenberg, J. B., & Wyman, J. (1967b) “Studies on the equilibria and kinetics of the reactions of peroxidases with ligands. III .The dissociation of carbon monoxide from carbon monoxide ferro-horseradish peroxidase” Biochemistry 6,1970–1974
Ziaja, B., van der Spoel, D., Szoeke, A. & Hajdu, J. (2001) “Auger-electron cascades in diamond and amorphous cabon” Physical Review B 64, 214104–214111
Ziaja, B., Szoke, A., van der Spoel, D. & Hajdu, J (2002) “Space-time evolution of electron cascades in diamond” Physical Review B 66, 024116
Ziaja, B., Szoke, A., London, R.A., Hajdu, J. (2004) “A unified model of secondary electron cascades in diamond” Submitted


Acta Universitatis UpsaliensisComprehensive Summaries of Uppsala Dissertations
from the Faculty of Science and TechnologyEditor: The Dean of the Faculty of Science and Technology
Distribution:Uppsala University Library
Box 510, SE-751 20 Uppsala, Swedenwww.uu.se, [email protected]
ISSN 1104-232XISBN 91-554-5994-3
A doctoral dissertation from the Faculty of Science and Technology, UppsalaUniversity, is usually a summary of a number of papers. A few copies of thecomplete dissertation are kept at major Swedish research libraries, while thesummary alone is distributed internationally through the series ComprehensiveSummaries of Uppsala Dissertations from the Faculty of Science and Technology.(Prior to October, 1993, the series was published under the title “ComprehensiveSummaries of Uppsala Dissertations from the Faculty of Science”.)