![Constitutive modelling and numerical simulation of ...phase transformation in superelastic shape-memory alloys ... [2,6–8]. In parallel, numerical ... where S is the second Piola–Kirchhoff](https://static.fdocuments.net/doc/165x107/5f881d7dc62fff4a4f21b7fc/constitutive-modelling-and-numerical-simulation-of-phase-transformation-in-superelastic.jpg)
Crystallographic texture for tube and plate of the ... · superelastic/shape-memory alloy Nitinol...
10
Crystallographic texture for tube and plate of the superelastic/shape-memory alloy Nitinol used for endovascular stents S. W. Robertson, 1 V. Imbeni, 2 H.-R. Wenk, 3 R. O. Ritchie 1 1 Department of Materials Science and Engineering, University of California, Berkeley, California 94720 2 SRI International, Menlo Park, California 94025 3 Department of Earth and Planetary Science, University of California, Berkeley, California 94720 Received 4 June 2004; revised 23 August 2004; accepted 25 August 2004 Published online 14 December 2004 in Wiley InterScience (www.interscience.wiley.com). DOI: 10.1002/jbm.a.30214 Abstract: The superelastic/shape-memory material, Niti- nol, an approximately equiatomic alloy of Ni and Ti, is rapidly becoming one of the most important metallic im- plant materials in the biomedical industry, in particular for the manufacture of endovascular stents. As such stents are invariably laser-machined from Nitinol tubes or sheets rolled into tubes, it is important to fully understand the physical phenomena that may affect the mechanical behav- ior of this material. With tubing and plate, one major issue is crystallographic texture, which can play a key role in influ- encing the mechanical properties of Nitinol. In this article, we present a study on how geometry and heat treatment can affect the texture of Nitinol, with specific quantification of the texture of Nitinol tube used for the production of endo- vascular stents. © 2004 Wiley Periodicals, Inc. J Biomed Mater Res 72A: 190 –199, 2005 Key words: Nitinol; texture; stents INTRODUCTION Nitinol, a nearly equiatomic nickel–titanium alloy known for its shape memory, superelastic properties, and biocompatibility, has proved particularly success- ful in biomedical applications, including endovascular stents, vena cava filters, dental files, and guidewires for noninvasive surgery. Both superelasticity and shape memory are associated with a stress- or temper- ature-induced phase transformation of its crystalline structure. When conventional engineering materials (like stainless steel) are mechanically loaded, they undergo elastic deformation (which is completely recoverable), followed by plastic deformation (which is permanent), and ultimately fail. Nitinol responds differently: its elastic response is followed by a stress-induced phase transformation from a cubic (austenite) phase to an orthorhombic (R-phase) to a monoclinic (martensite) phase 1 that can result in fully recoverable macroscopic strains as high as 8% or more. On unloading, the martensite becomes unstable and transforms back to austenite, with a concomitant macroscopic strain re- covery. Nitinol exhibits superelasticity over a temperature range compatible with body temperature, 2,3 and has generally good corrosion resistance in physiological environments. It has been widely adopted in the med- ical community as physicians seek to use fewer inva- sive procedures in order to reduce unnecessary pa- tient trauma. These procedures require instruments and devices that can pass through small openings and then elastically spring back into the desired shapes. Nitinol has a flexibility that is 10 to 20 times greater than that of stainless steel and has a biocompatibility close to titanium, and is thus being widely used to fabricate self-expanding cardiovascular stents. Al- though the superelastic and shape-memory properties are ideally suited for such biomedical applications, they add substantial complexity to the design and modeling of Nitinol devices. The production of Nitinol biomedical devices can involve several processing procedures, such as tube drawing, plate rolling, and heat treatment, in order to modify microstructure, transformation temperatures, and mechanical properties. These procedures can lead to texturing (crystallographic alignment) of the mate- rial. Because Nitinol derives its unique nonlinear and anisotropic mechanical behavior from stress-induced Correspondence to: R. O. Ritchie; e-mail: [email protected] Contract grant sponsor: Nitinol Devices and Components, Inc. Contract grant sponsor: National Science Foundation; contract grant number: CMS-0409294 © 2004 Wiley Periodicals, Inc.
Transcript of Crystallographic texture for tube and plate of the ... · superelastic/shape-memory alloy Nitinol...

Crystallographic texture for tube and plate of thesuperelastic/shape-memory alloy Nitinol used forendovascular stents
S. W. Robertson,1 V. Imbeni,2 H.-R. Wenk,3 R. O. Ritchie1
1Department of Materials Science and Engineering, University of California, Berkeley, California 947202SRI International, Menlo Park, California 940253Department of Earth and Planetary Science, University of California, Berkeley, California 94720
Received 4 June 2004; revised 23 August 2004; accepted 25 August 2004Published online 14 December 2004 in Wiley InterScience (www.interscience.wiley.com). DOI: 10.1002/jbm.a.30214
Abstract: The superelastic/shape-memory material, Niti-nol, an approximately equiatomic alloy of Ni and Ti, israpidly becoming one of the most important metallic im-plant materials in the biomedical industry, in particular forthe manufacture of endovascular stents. As such stents areinvariably laser-machined from Nitinol tubes or sheetsrolled into tubes, it is important to fully understand thephysical phenomena that may affect the mechanical behav-ior of this material. With tubing and plate, one major issue is
crystallographic texture, which can play a key role in influ-encing the mechanical properties of Nitinol. In this article,we present a study on how geometry and heat treatment canaffect the texture of Nitinol, with specific quantification ofthe texture of Nitinol tube used for the production of endo-vascular stents. © 2004 Wiley Periodicals, Inc. J BiomedMater Res 72A: 190–199, 2005
Key words: Nitinol; texture; stents
INTRODUCTION
Nitinol, a nearly equiatomic nickel–titanium alloyknown for its shape memory, superelastic properties,and biocompatibility, has proved particularly success-ful in biomedical applications, including endovascularstents, vena cava filters, dental files, and guidewiresfor noninvasive surgery. Both superelasticity andshape memory are associated with a stress- or temper-ature-induced phase transformation of its crystallinestructure.
When conventional engineering materials (likestainless steel) are mechanically loaded, they undergoelastic deformation (which is completely recoverable),followed by plastic deformation (which is permanent),and ultimately fail. Nitinol responds differently: itselastic response is followed by a stress-induced phasetransformation from a cubic (austenite) phase to anorthorhombic (R-phase) to a monoclinic (martensite)phase1 that can result in fully recoverable macroscopicstrains as high as 8% or more. On unloading, the
martensite becomes unstable and transforms back toaustenite, with a concomitant macroscopic strain re-covery.
Nitinol exhibits superelasticity over a temperaturerange compatible with body temperature,2,3 and hasgenerally good corrosion resistance in physiologicalenvironments. It has been widely adopted in the med-ical community as physicians seek to use fewer inva-sive procedures in order to reduce unnecessary pa-tient trauma. These procedures require instrumentsand devices that can pass through small openings andthen elastically spring back into the desired shapes.Nitinol has a flexibility that is 10 to 20 times greaterthan that of stainless steel and has a biocompatibilityclose to titanium, and is thus being widely used tofabricate self-expanding cardiovascular stents. Al-though the superelastic and shape-memory propertiesare ideally suited for such biomedical applications,they add substantial complexity to the design andmodeling of Nitinol devices.
The production of Nitinol biomedical devices caninvolve several processing procedures, such as tubedrawing, plate rolling, and heat treatment, in order tomodify microstructure, transformation temperatures,and mechanical properties. These procedures can leadto texturing (crystallographic alignment) of the mate-rial. Because Nitinol derives its unique nonlinear andanisotropic mechanical behavior from stress-induced
Correspondence to: R. O. Ritchie; e-mail: [email protected] grant sponsor: Nitinol Devices and Components,
Inc.Contract grant sponsor: National Science Foundation;
contract grant number: CMS-0409294
© 2004 Wiley Periodicals, Inc.

martensitic transformations, where the resultingstrains are affected by crystallographic orientation, itis clear that texture can have a marked influence on itsmechanical properties. However, there have only beena few, mainly qualitative, studies on texture in Nitinolsheets and plates4–11 and no corresponding informa-tion for Nitinol tubes, the starting material for manyendovascular stents.
Of the work that has been performed, Gall andSehitoglu12 concluded that texture, and consequentlythe martensite variants active during the transforma-tion, are the source of the compression–tension asym-metry of Nitinol. Furthermore, Vaidyanathan and col-leagues13 suggest that texturing can occur in Nitinolwhen martensite is stress-induced from austenite viasuch compression loading. That texture may also beresponsible for the anisotropy in the mechanical be-havior of Nitinol in tension and torsion, as demon-strated by McNaney and colleagues.14
Accordingly, it is the objective of the present studyto seek further understanding of how processing andheat treatment can affect the texture in Nitinol, specif-ically by quantifying the texture of drawn tubes incomparison to rolled plates. The motivation for thiscomparison is to provide the first characterization ofthe texture of the Nitinol tubes that are used in thefabrication of many stent devices, and to determine ifsuch tubes can be simply modeled as plates rolled intoa cylindrical form. The latter can be important wherethe flat geometry of plate specimens is preferred overa curved geometry for certain testing conditions, suchas for microscopy studies which require a flat surfacefor resolution.
EXPERIMENTAL PROCEDURES
Nitinol (50.8 at. % Ni, 49.2 at. % Ti) in the form ofboth tubing and plate was received from Nitinol De-vices & Components, Inc. (NDC, Fremont, CA); thetube dimensions were 4.6 mm outer diameter and 3.9mm inner diameter, whereas the plate sections were15 mm square by 1 mm thick. The sample geometries(tube vs plate) were chosen to determine if the pro-cessing (drawing vs rolling) and general geometricconstraint has a significant effect on the texture. Theas-processed structures were further compared to cor-responding annealed structures; specifically, the fol-lowing conditions were examined:
• as-drawn or as-rolled condition: as-drawn tube oras-rolled plate was reheated for 5 min at 485°C inan air furnace, followed by an ice-water quench.Although this is not truly an as-drawn/rolledcondition, we use this label because the heattreatment is relatively mild and serves only tostress relieve and slightly lower the tensilestrength.
• annealed condition: as-drawn/rolled Nitinol wasannealed in vacuo at 850°C for 30 min followed bya slow cool of �10°C per min. This heat treat-ment does not fully normalize the microstruc-ture, but is used here as it represents a typicalindustry anneal.
Textures were measured at room temperaturewith an X-ray pole figure goniometer, as sampleswere too deformed (from the prior processing) forscanning electron microscopy– electron backscatterprobe measurements. To provide large enough flatsamples, the tube was sliced into sections, as shownin Figure 1; the sections were then lined up side-by-side, cold-mounted in epoxy, and polished flat. Af-ter combining the multiple tube slices into two sam-ples (as-drawn and annealed), their sizes wereapproximately 10-mm square, which is the mini-mum sample size for quantitative texture analysiswith an X-ray pole figure goniometer in reflectiongeometry. All samples were mechanically groundand polished to a 0.05�m finish to permit optimalreflective X-ray diffraction and establish consistencyamong the samples.
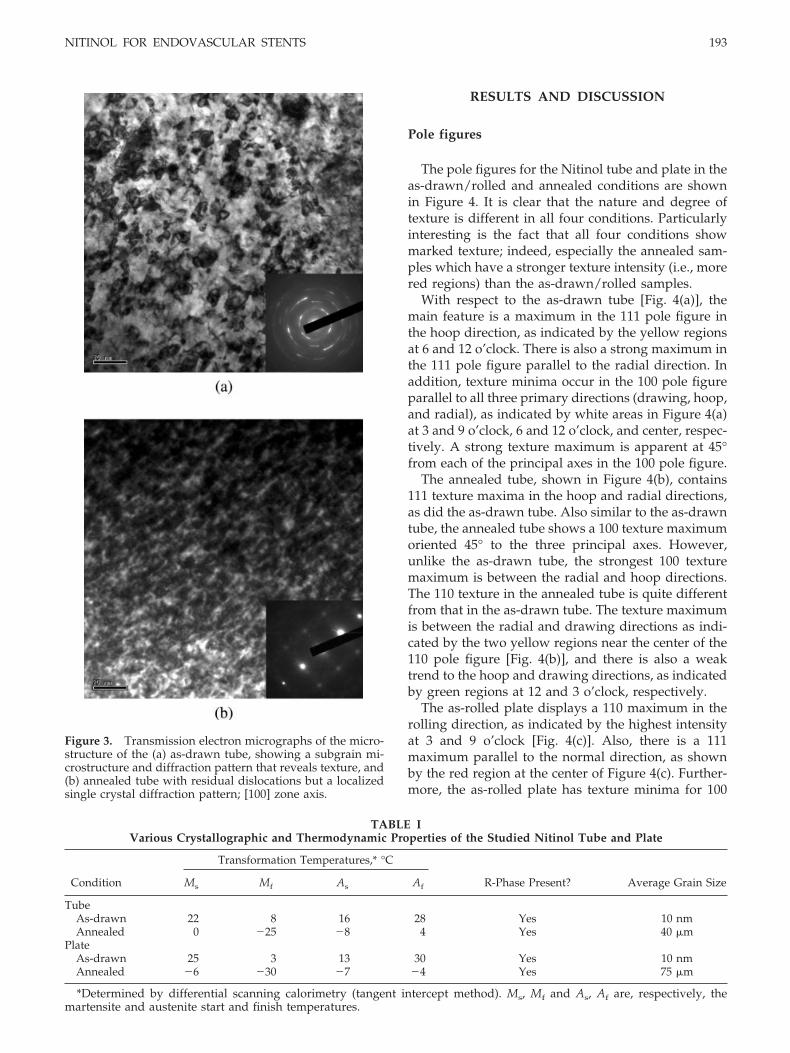
Optical micrographs of the microstructures areshown in Figure 2. All samples were heated to ap-proximately 50°C prior to testing, and were main-tained above the austenite finish temperature, Af,temperature to ensure they were fully austeniticthroughout the test. The micrographs show marten-sitic grains in the as-drawn/rolled samples; how-ever, these are polishing artifacts as the stressesfrom grinding and polishing cause transformationin the exposed grains which leaves residual surfacerelief on etching. Moreover, the apparent grain sizesof �20 �m observed with optical microscopy for theas-drawn conditions in Figure 2(a,c) also give a falseimpression; the actual grain sizes are much smaller,specifically on a submicrometer scale, and can onlybe revealed by transmission electron microscopy, asshown in Figure 3(a). Table I gives a list of proper-ties for the four Nitinol sample types that wereanalyzed in this study.
Pole figures were measured with a Huber X-raypole figure goniometer, with Cu-K� radiation
Figure 1. Schematic diagram of slices from tube taken fortexture measurements.
NITINOL FOR ENDOVASCULAR STENTS 191

source at 40 kV and 14 mA, and a graphite mono-chromator. The crystallographic texture of the Niti-nol was determined from three incomplete mea-sured pole figures, namely the 110, 200, and 211poles, at � values of, respectively, 21.3°, 30.8°, and38.9° for Cu-K� radiation, where � is half of theangle between the X-ray source and the detector.The raw intensities were corrected for backgroundand defocusing and only data out to a maximumpole distance of 65° were used. The Williams–Imhof–Matthies–Vinel (WIMV)15 algorithm, whichcalculates orientation distributions from pole fig-ures, was used in the BEARTEX software packagefor quantitative texture analysis in order to obtainthe orientation distribution functions (ODF).16 From
the ODF, pole figures for 100, 110 and 111 were recal-culated following standard smoothing and rotationoperations. The smoothing operation was performedmainly to reduce the effects (if any) of highly orientedsingle crystals in the bulk sample. Rotation was nec-essary to orient each pole figure in the same referenceorientation for comparison among the samples. Theexperimental pole figures and inverse pole figures forNitinol tube presented in this article represent theaverage of three separate tests. For the Nitinol plate,only one test was used in the texture analysis becauseof limited sample supply; however, the Nitinol platetexture has been characterized previously in the liter-ature4–7 and the current results were found to conformclosely to these prior data.
Figure 2. Optical micrographs of the microstructure of the (a) as-drawn tube, (b) annealed tube, (c) as-rolled plate, and (d)annealed plate. Etchant: 3.2% HF, 14.6% HNO3, balance deionized water. The drawing/rolling direction is vertical in eachmicrograph.
192 ROBERTSON ET AL.
RESULTS AND DISCUSSION
Pole figures
The pole figures for the Nitinol tube and plate in theas-drawn/rolled and annealed conditions are shownin Figure 4. It is clear that the nature and degree oftexture is different in all four conditions. Particularlyinteresting is the fact that all four conditions showmarked texture; indeed, especially the annealed sam-ples which have a stronger texture intensity (i.e., morered regions) than the as-drawn/rolled samples.
With respect to the as-drawn tube [Fig. 4(a)], themain feature is a maximum in the 111 pole figure inthe hoop direction, as indicated by the yellow regionsat 6 and 12 o’clock. There is also a strong maximum inthe 111 pole figure parallel to the radial direction. Inaddition, texture minima occur in the 100 pole figureparallel to all three primary directions (drawing, hoop,and radial), as indicated by white areas in Figure 4(a)at 3 and 9 o’clock, 6 and 12 o’clock, and center, respec-tively. A strong texture maximum is apparent at 45°from each of the principal axes in the 100 pole figure.
The annealed tube, shown in Figure 4(b), contains111 texture maxima in the hoop and radial directions,as did the as-drawn tube. Also similar to the as-drawntube, the annealed tube shows a 100 texture maximumoriented 45° to the three principal axes. However,unlike the as-drawn tube, the strongest 100 texturemaximum is between the radial and hoop directions.The 110 texture in the annealed tube is quite differentfrom that in the as-drawn tube. The texture maximumis between the radial and drawing directions as indi-cated by the two yellow regions near the center of the110 pole figure [Fig. 4(b)], and there is also a weaktrend to the hoop and drawing directions, as indicatedby green regions at 12 and 3 o’clock, respectively.
The as-rolled plate displays a 110 maximum in therolling direction, as indicated by the highest intensityat 3 and 9 o’clock [Fig. 4(c)]. Also, there is a 111maximum parallel to the normal direction, as shownby the red region at the center of Figure 4(c). Further-more, the as-rolled plate has texture minima for 100
Figure 3. Transmission electron micrographs of the micro-structure of the (a) as-drawn tube, showing a subgrain mi-crostructure and diffraction pattern that reveals texture, and(b) annealed tube with residual dislocations but a localizedsingle crystal diffraction pattern; [100] zone axis.
TABLE IVarious Crystallographic and Thermodynamic Properties of the Studied Nitinol Tube and Plate
Condition
Transformation Temperatures,* °C
R-Phase Present? Average Grain SizeMs Mf As Af
TubeAs-drawn 22 8 16 28 Yes 10 nmAnnealed 0 �25 �8 4 Yes 40 �m
PlateAs-drawn 25 3 13 30 Yes 10 nmAnnealed �6 �30 �7 �4 Yes 75 �m
*Determined by differential scanning calorimetry (tangent intercept method). Ms, Mf and As, Af are, respectively, themartensite and austenite start and finish temperatures.
NITINOL FOR ENDOVASCULAR STENTS 193
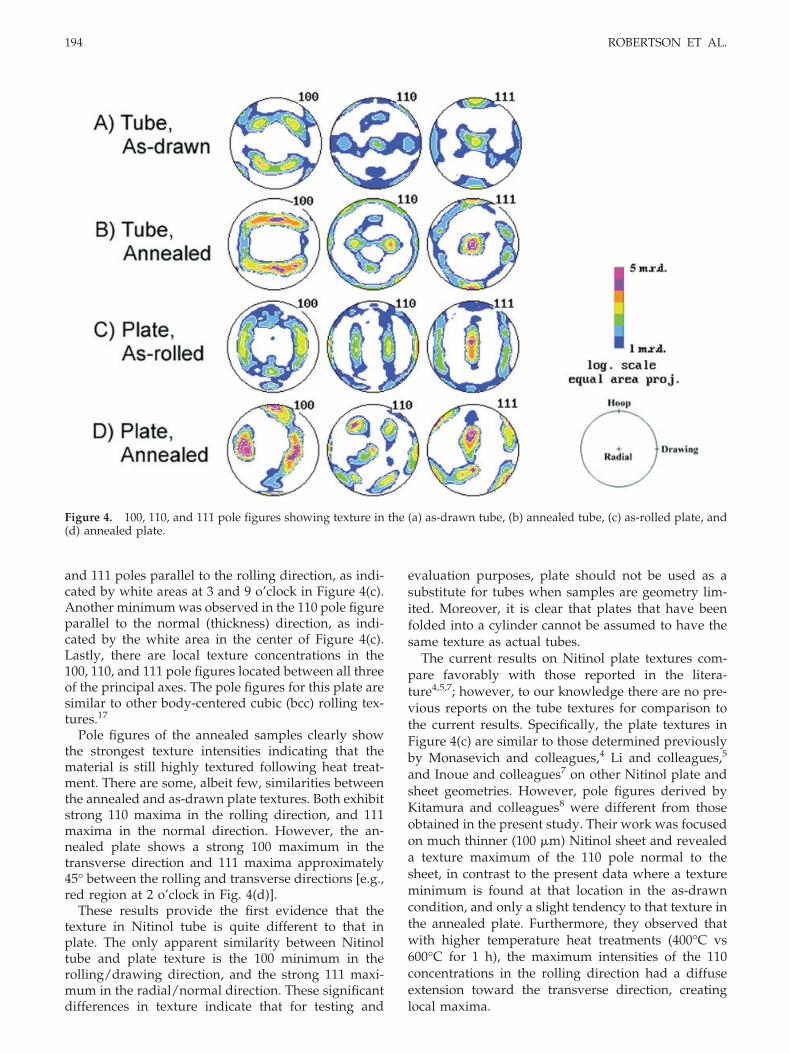
and 111 poles parallel to the rolling direction, as indi-cated by white areas at 3 and 9 o’clock in Figure 4(c).Another minimum was observed in the 110 pole figureparallel to the normal (thickness) direction, as indi-cated by the white area in the center of Figure 4(c).Lastly, there are local texture concentrations in the100, 110, and 111 pole figures located between all threeof the principal axes. The pole figures for this plate aresimilar to other body-centered cubic (bcc) rolling tex-tures.17
Pole figures of the annealed samples clearly showthe strongest texture intensities indicating that thematerial is still highly textured following heat treat-ment. There are some, albeit few, similarities betweenthe annealed and as-drawn plate textures. Both exhibitstrong 110 maxima in the rolling direction, and 111maxima in the normal direction. However, the an-nealed plate shows a strong 100 maximum in thetransverse direction and 111 maxima approximately45° between the rolling and transverse directions [e.g.,red region at 2 o’clock in Fig. 4(d)].
These results provide the first evidence that thetexture in Nitinol tube is quite different to that inplate. The only apparent similarity between Nitinoltube and plate texture is the 100 minimum in therolling/drawing direction, and the strong 111 maxi-mum in the radial/normal direction. These significantdifferences in texture indicate that for testing and
evaluation purposes, plate should not be used as asubstitute for tubes when samples are geometry lim-ited. Moreover, it is clear that plates that have beenfolded into a cylinder cannot be assumed to have thesame texture as actual tubes.
The current results on Nitinol plate textures com-pare favorably with those reported in the litera-ture4,5,7; however, to our knowledge there are no pre-vious reports on the tube textures for comparison tothe current results. Specifically, the plate textures inFigure 4(c) are similar to those determined previouslyby Monasevich and colleagues,4 Li and colleagues,5
and Inoue and colleagues7 on other Nitinol plate andsheet geometries. However, pole figures derived byKitamura and colleagues8 were different from thoseobtained in the present study. Their work was focusedon much thinner (100 �m) Nitinol sheet and revealeda texture maximum of the 110 pole normal to thesheet, in contrast to the present data where a textureminimum is found at that location in the as-drawncondition, and only a slight tendency to that texture inthe annealed plate. Furthermore, they observed thatwith higher temperature heat treatments (400°C vs600°C for 1 h), the maximum intensities of the 110concentrations in the rolling direction had a diffuseextension toward the transverse direction, creatinglocal maxima.
Figure 4. 100, 110, and 111 pole figures showing texture in the (a) as-drawn tube, (b) annealed tube, (c) as-rolled plate, and(d) annealed plate.
194 ROBERTSON ET AL.

Inverse pole figures
In light of materials scientists’ familiarity with ste-reographic projections (Wulff nets) of crystal direc-tions, it is perhaps more illuminating to visualize tex-ture using inverse pole figures (IPF), which arerepresentations of a sample direction relative to crys-tal coordinates and are calculated from the ODF. Fig-ure 5 shows the section of the stereographic projectionthat is used in the inverse pole figures. Using theseprocedures, inverse pole figures for the annealed and
as-rolled/drawn tube and plate are given in Figure 6.This figure plots pole distributions in the radial/nor-mal direction (leftmost IPF) and in the drawing/roll-ing direction (rightmost IPF). Although the radial/normal IPFs represent pole directions, because ofcubic symmetry they can also describe a plane whichis parallel to the rolling direction; see Figure 7 for agraphical representation of these planes. The texturedescribed in the following section is in the form{hkl}�uvw�, where {hkl} is the crystallographic planeoriented parallel to the rolling direction (or alterna-tively the pole oriented radially as discussed above),and �uvw� is the crystallographic direction vectorwhich is parallel to the rolling direction. The intensityof such plane and direction pairs is calculated fromtexture analysis and is presented in wt % in Table II.
Drawing direction orientations in the as-drawn tube
Figure 5. [100] Wulff net stereographic projection showingthe segment viewed in the inverse pole figures. [Color figurecan be viewed in the online issue, which is available atwww.interscience.wiley.com.]
Figure 6. Inverse pole figures showing the radial/normal direction (left) and drawing/rolling direction (right) crystallo-graphic populations for the (a) as-drawn tube, (b) annealed tube, (c) as-rolled plate, and (d) annealed plate.
Figure 7. Diagram of the orientation of the crystallographicplanes which are can be derived from the radial/normalpole directions given by the inverse pole figures in Figure 6.
NITINOL FOR ENDOVASCULAR STENTS 195

[Fig. 6(a)] are relatively delocalized; this is also appar-ent when quantifying the texture (see discussion be-low). The primary texture in the drawing directionforms a ring containing the �223� and �110� directionfamilies. The radial poles, and thus planes parallel tothe drawing direction, were primarily 111 and 110type.
Annealed tubes have strong 111 type and nearbycrystallographic radial direction textures [Fig. 6(b)].The drawing directions are more defined in the an-nealed tubes than the as-drawn tubes, and show amaximum near �110�. However, the drawing direc-tions are distributed over a range of orientations in-cluding �123�, �112�, and �120�, as discussed in the nextsection where the results are quantified.
The as-rolled plate inverse pole figures show astrong tendency of �110� texture in the rolling direc-tions [Fig. 6(c)] with broadening similar to the an-nealed tube texture. For the normal direction there arestrong maxima near 111, with broadening towards 223and 122.
Figure 6(d) shows that, following annealing, theplate normal direction significantly shifts from the 111position in the as-drawn condition toward 110. Inaddition, the rolling direction is much more centeredabout �110�.
Crystal orientation distribution (COD)
The relative weight of each orientation componentin the samples was quantified by making use of crystalorientation distribution (COD) sections.18 Because ofcubic crystal symmetry for austenitic Nitinol, onlyCOD sections through � 45° were needed for a
complete component analysis which is accomplishedby a simple addition of component intensities from theODF (see Fig. 8 for Euler angle convention). To deter-mine the component weight percentages, the center ofeach component was described by a triplet of Eulerangles around the strongest orientation concentrationson the COD maps. Next, the edge of each componentwas described by another Euler triplet by holding �and � constant such the radius could be defined interms of � (Table II). Using the center and radius, asphere was defined around each component whichwas subtracted from the ODF using BEARTEX quan-
TABLE IIQuantified Texture Component-Weight (in-percentage)
Condition Component
Euler Angle†, DegreesRadius, Degrees
(�)Miller Index{hk1}�uvw� Wt %� � �
Tube, As-Drawn 1 45 45 0 20 {110}�223�*1 262 30 56 45 15 {111}�110� 103 0 57 45 10 {111}�112� 4
Tube, Annealed 1 45 58 45 12 {111}�123� 202 55 45 0 15 {110}�112� 103 90 45 45 10 {223}�110� 84 275 40 25 10 {123}�120� 5
Plate, As-Drawn 1 60 45 45 15 {111}�112� 152 270 45 45 15 {223}�110�*2 133 270 75 45 15 {122}�110� 11
Plate, Annealed 1 313 45 35 25 {435}�312� 452 0 45 0 20 {110}�110� 30
*Because of the close proximity of certain crystallographic orientations on a stereographic projection, the followingorientations could not be excluded: (1) {110}�334� or {110}�557�, and (2) {334}�110� or {557}�110�. Due to the high symmetry ofthe simple cubic structure, the lower ordered orientations (presented in the table) are most likely the correct identification.
†Angles defined in Figure 8.
Figure 8. Euler angles (Roe/Matthies convention) definedaround the sample axes (x drawing, y circumferential,z radial); � is the angle formed when the x axis is rotatedto x� around z; � is the angle between x� and x as the x� axisis rotated around y�; � is the angle between y� and y (or z�and z ) formed when the y�z� plane is rotated around x .[Color figure can be viewed in the online issue, which isavailable at www.interscience.wiley.com.]
196 ROBERTSON ET AL.

tification software. The quantification algorithm re-corded how many orientations fell into each sphere andcompared that value with all orientations to arrive at acomponent weight percentage. Positions [in Euler anglesand {hkl}�uvw� description], sphere radius, and orienta-tion volume (in percentage) are listed in Table II.
Crystal orientation distribution plots are providedas reference in Figures 9 through 12, with the corre-sponding quantified component volumes shown inTable II. Only textures representing 4% or more of thetotal volume are tabulated. Just as with the pole fig-ures, the CODs of the as-drawn and annealed tubeappear reasonably similar. However, slight shifts inthe texture resulted from the annealing process andare apparent when quantified (see Table II). Specifi-cally, the {110}�223� dominant texture in the as-drawntube (component 1, Fig. 9) reoriented into a {110}�112�in the annealed condition (component 2, Fig. 10). Inaddition, the {111}�110� (Fig. 9, component 2) rotatedinto a {111}�123� configuration and became the pre-ferred orientation upon annealing. These quantifiedresults demonstrate that although the texture remains
similar, heat treatment clearly has an effect on modi-fying the crystallographic texture of Nitinol tube.
The plate CODs appear entirely different betweenthe as-drawn and annealed condition indicating awidely different texture following the heat treatment.Whereas the as-rolled plate contained an evenly dis-tributed texture among three components ({111}�112�,{223}�110�, and {122}�110�), which represented only40% of the total volume, the annealed plate showedthat the 75% of the crystallites are oriented in one ofonly two orientations, either {435}�312�* or the{110}�110�, perhaps from grain-growth and/or recrys-tallization.
CLOSING REMARKS
Because Nitinol depends on coordinated atomicmovements for phase transformations, which defines
*This plane/direction pair is not perfectly co-planar, butrepresents the approximate low-index description.
Figure 9. As-drawn tube crystal orientation distribution in 5° Euler � space increments. Note the principal componentlocations which are labeled 1–3. See Table II for quantification of these principal components.
Figure 10. Annealed tube crystal orientation distribution in 5° Euler � space increments. Note the principal componentlocations which are labeled 1–4. See Table II for quantification of these principal components.
NITINOL FOR ENDOVASCULAR STENTS 197
its unique mechanical behavior, any significant align-ment of the atomic planes from texture in the poly-crystalline material can have a marked influence onthe mechanical response by either limiting or promot-ing that phase transformation. Previous work hasshown that in sheet or bar Nitinol, nearly all mechan-ical properties are influenced by the texture. Gao andYi19 demonstrated the marked influence of texture onthe tensile Young’s modulus, transformation stressand transformation strain. Other studies by Gall andSehitoglu,12 and McNaney and colleagues,14 suggestthat the anisotropy associated with various loadingconditions (tension, compression, and torsion) canalso be attributed to the texture of polycrystalline Niti-nol. Interestingly, Yuan and Yi20 show that the exper-imentally observed tensile stress–strain response canbe accurately predicted, through the Taylor factor,from theoretical strains obtained through inverse polefigure data.
Although some studies have been performed whichquantify the texture of Nitinol plate and rod, to ourknowledge this work is the first to quantify the textureof Nitinol tubing. This is of importance to the biomed-
ical companies who use Nitinol tubes as the startingmaterial for their products, for example, endovascularstents, as the tube has very different texture than otherNitinol product forms, such as sheet and rod; more-over, it differs from the expected �-�110� fiber textureparallel to the rolling direction and �-[111] fiber tex-ture parallel to the normal direction of rolled body-centered-cubic materials.17 Additionally, it is clear thathigh-temperature annealing has little effect in Nitinolin removing this texture.
CONCLUSION
Austenitic Nitinol tube and plate (0.35 mm wallthickness and 1 mm thick, respectively) have beenshown to be highly susceptible to crystallographictexturing following mechanical processing (drawingor rolling) and heat treatment. As-drawn Nitinoltubes, which are the starting material for the fabrica-tion of many endovascular stents, have a preferredorientation of {110}�223� representing 26% of the com-
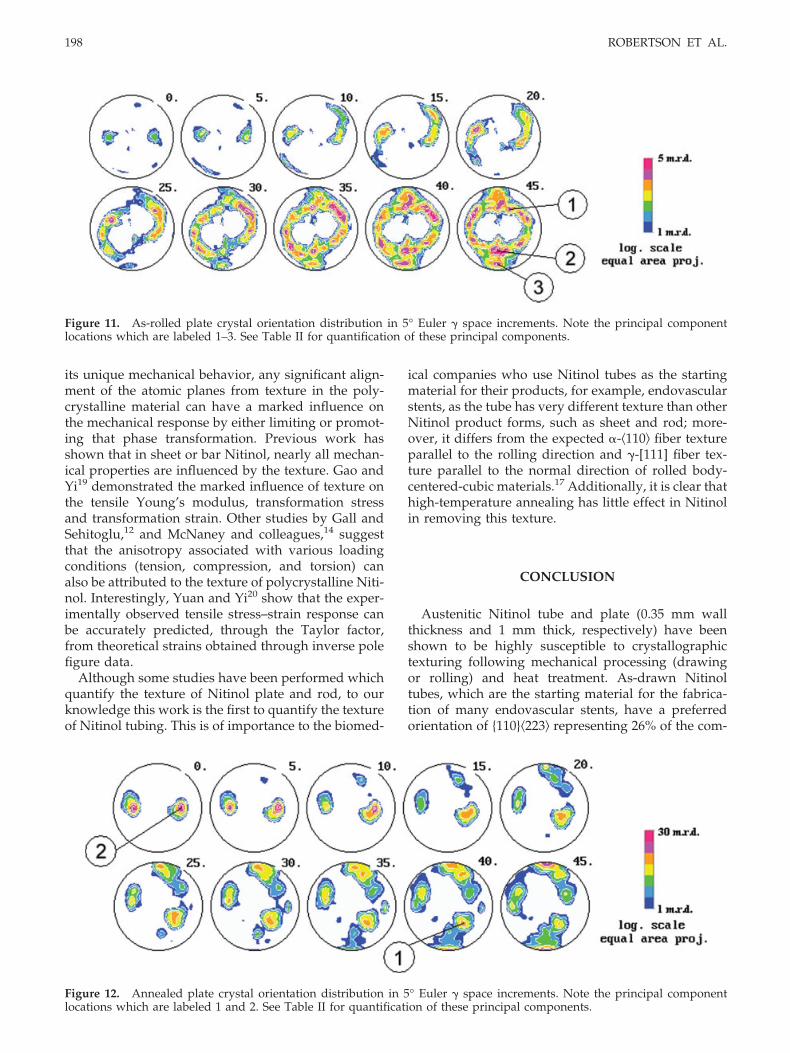
Figure 11. As-rolled plate crystal orientation distribution in 5° Euler � space increments. Note the principal componentlocations which are labeled 1–3. See Table II for quantification of these principal components.
Figure 12. Annealed plate crystal orientation distribution in 5° Euler � space increments. Note the principal componentlocations which are labeled 1 and 2. See Table II for quantification of these principal components.
198 ROBERTSON ET AL.
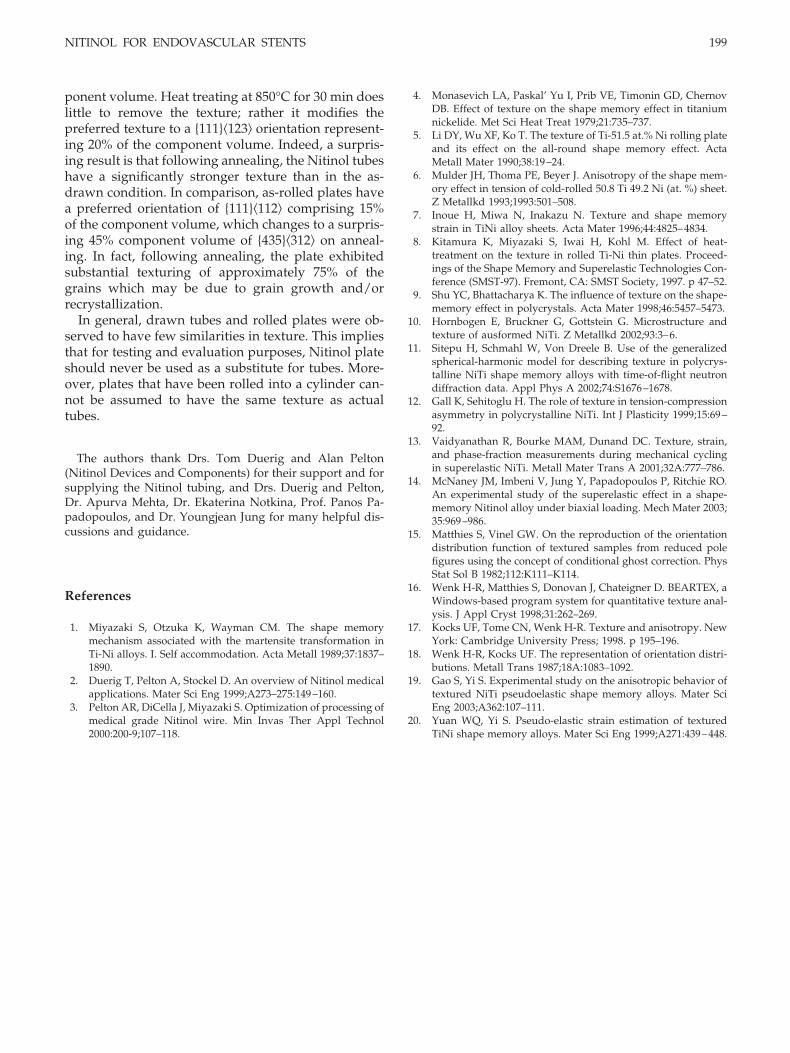
ponent volume. Heat treating at 850°C for 30 min doeslittle to remove the texture; rather it modifies thepreferred texture to a {111}�123� orientation represent-ing 20% of the component volume. Indeed, a surpris-ing result is that following annealing, the Nitinol tubeshave a significantly stronger texture than in the as-drawn condition. In comparison, as-rolled plates havea preferred orientation of {111}�112� comprising 15%of the component volume, which changes to a surpris-ing 45% component volume of {435}�312� on anneal-ing. In fact, following annealing, the plate exhibitedsubstantial texturing of approximately 75% of thegrains which may be due to grain growth and/orrecrystallization.
In general, drawn tubes and rolled plates were ob-served to have few similarities in texture. This impliesthat for testing and evaluation purposes, Nitinol plateshould never be used as a substitute for tubes. More-over, plates that have been rolled into a cylinder can-not be assumed to have the same texture as actualtubes.
The authors thank Drs. Tom Duerig and Alan Pelton(Nitinol Devices and Components) for their support and forsupplying the Nitinol tubing, and Drs. Duerig and Pelton,Dr. Apurva Mehta, Dr. Ekaterina Notkina, Prof. Panos Pa-padopoulos, and Dr. Youngjean Jung for many helpful dis-cussions and guidance.
References
1. Miyazaki S, Otzuka K, Wayman CM. The shape memorymechanism associated with the martensite transformation inTi-Ni alloys. I. Self accommodation. Acta Metall 1989;37:1837–1890.
2. Duerig T, Pelton A, Stockel D. An overview of Nitinol medicalapplications. Mater Sci Eng 1999;A273–275:149–160.
3. Pelton AR, DiCella J, Miyazaki S. Optimization of processing ofmedical grade Nitinol wire. Min Invas Ther Appl Technol2000:200-9;107–118.
4. Monasevich LA, Paskal’ Yu I, Prib VE, Timonin GD, ChernovDB. Effect of texture on the shape memory effect in titaniumnickelide. Met Sci Heat Treat 1979;21:735–737.
5. Li DY, Wu XF, Ko T. The texture of Ti-51.5 at.% Ni rolling plateand its effect on the all-round shape memory effect. ActaMetall Mater 1990;38:19–24.
6. Mulder JH, Thoma PE, Beyer J. Anisotropy of the shape mem-ory effect in tension of cold-rolled 50.8 Ti 49.2 Ni (at. %) sheet.Z Metallkd 1993;1993:501–508.
7. Inoue H, Miwa N, Inakazu N. Texture and shape memorystrain in TiNi alloy sheets. Acta Mater 1996;44:4825–4834.
8. Kitamura K, Miyazaki S, Iwai H, Kohl M. Effect of heat-treatment on the texture in rolled Ti-Ni thin plates. Proceed-ings of the Shape Memory and Superelastic Technologies Con-ference (SMST-97). Fremont, CA: SMST Society, 1997. p 47–52.
9. Shu YC, Bhattacharya K. The influence of texture on the shape-memory effect in polycrystals. Acta Mater 1998;46:5457–5473.
10. Hornbogen E, Bruckner G, Gottstein G. Microstructure andtexture of ausformed NiTi. Z Metallkd 2002;93:3–6.
11. Sitepu H, Schmahl W, Von Dreele B. Use of the generalizedspherical-harmonic model for describing texture in polycrys-talline NiTi shape memory alloys with time-of-flight neutrondiffraction data. Appl Phys A 2002;74:S1676–1678.
12. Gall K, Sehitoglu H. The role of texture in tension-compressionasymmetry in polycrystalline NiTi. Int J Plasticity 1999;15:69–92.
13. Vaidyanathan R, Bourke MAM, Dunand DC. Texture, strain,and phase-fraction measurements during mechanical cyclingin superelastic NiTi. Metall Mater Trans A 2001;32A:777–786.
14. McNaney JM, Imbeni V, Jung Y, Papadopoulos P, Ritchie RO.An experimental study of the superelastic effect in a shape-memory Nitinol alloy under biaxial loading. Mech Mater 2003;35:969–986.
15. Matthies S, Vinel GW. On the reproduction of the orientationdistribution function of textured samples from reduced polefigures using the concept of conditional ghost correction. PhysStat Sol B 1982;112:K111–K114.
16. Wenk H-R, Matthies S, Donovan J, Chateigner D. BEARTEX, aWindows-based program system for quantitative texture anal-ysis. J Appl Cryst 1998;31:262–269.
17. Kocks UF, Tome CN, Wenk H-R. Texture and anisotropy. NewYork: Cambridge University Press; 1998. p 195–196.
18. Wenk H-R, Kocks UF. The representation of orientation distri-butions. Metall Trans 1987;18A:1083–1092.
19. Gao S, Yi S. Experimental study on the anisotropic behavior oftextured NiTi pseudoelastic shape memory alloys. Mater SciEng 2003;A362:107–111.
20. Yuan WQ, Yi S. Pseudo-elastic strain estimation of texturedTiNi shape memory alloys. Mater Sci Eng 1999;A271:439–448.
NITINOL FOR ENDOVASCULAR STENTS 199


![· 2016-12-14 · 112 Fatigue behaviour has also been studied extensively on both shape memory and superelastic NiTi [8-14]. Surprisingly, however, there is a dearth of published](https://static.fdocuments.net/doc/165x107/5e9844c346969c729b1bff25/2016-12-14-112-fatigue-behaviour-has-also-been-studied-extensively-on-both-shape.jpg)