Crystal Reports Server 2008 - Cornerstone...
30
Revision Date: July 2009 Crystal Reports Server 2008 Sizing Guide Overview Crystal Reports Server system sizing involves the process of determining how many resources are required to support a given workload. As input in the sizing process we often have: x The number of users x A description or understanding of types and percentage of usage types (how many users are doing what) x The frequency of user activity As output in the sizing process we want to understand: x The number of processors (CPUs) required to support a load x The amount of memory required to support a load x The appropriate configuration for a load type (number of services) The general assumption through this document is that each main service or component can be assessed independently through its capacity to respond to simultaneous requests from users in a time period with a certain amount of hardware resources (CPU and memory). Caution is advised when utilizing this document because the results derived are approximate based on the input data and the configuration of the system used by Crystal Reports Server 2008. We recommend that you gauge your company’s deployment hardware against information in the base system configuration section of this document.
Transcript of Crystal Reports Server 2008 - Cornerstone...

Revision Date: July 2009
Crystal Reports Server 2008
Sizing Guide
OverviewCrystal Reports Server system sizing involves the process of determining how many resources arerequired to support a given workload.
As input in the sizing process we often have:
The number of users
A description or understanding of types and percentage of usage types (how many usersare doing what)
The frequency of user activity
As output in the sizing process we want to understand:
The number of processors (CPUs) required to support a load
The amount of memory required to support a load
The appropriate configuration for a load type (number of services)
The general assumption through this document is that each main service or component can beassessed independently through its capacity to respond to simultaneous requests from users in atime period with a certain amount of hardware resources (CPU and memory).
Caution is advised when utilizing this document because the results derived are approximate basedon the input data and the configuration of the system used by Crystal Reports Server 2008. Werecommend that you gauge your company’s deployment hardware against information in thebase system configuration section of this document.

Copyright © 2009 SAP BusinessObjects. All rights reserved. Page 2
OVERVIEW ................................................................................................................................................ 1
INTRODUCTION ....................................................................................................................................... 4
STEP 1 - LOAD...................................................................................................................................... 4STEP 2 - SERVICE THRESHOLDS, CPU AND MEMORY .......................................................................... 4STEP 3 - SINGLE MACHINE CONFIGURATION ....................................................................................... 4STEP 4 - CMS SYSTEM DATABASE TUNING .......................................................................................... 4
HOW TO USE THIS GUIDE FOR WINDOWS AND LINUX ENVIRONMENTS ................................. 5
STEP 1: LOAD ........................................................................................................................................ 6
WHAT IS LOAD? .................................................................................................................................. 6Estimating Potential Users ............................................................................................................... 6Estimating Concurrent Active Users ................................................................................................. 6Estimating Simultaneous Requests.................................................................................................... 7Estimation Example ......................................................................................................................... 7
STEP 2: SERVICES ................................................................................................................................ 9
CORE SERVICES ................................................................................................................................... 9Server Intelligence Agent (SIA) ........................................................................................................ 9Central Management Server (CMS).................................................................................................. 9Crystal Reports Cache Server ........................................................................................................ 10File Repository Servers (FRS) ........................................................................................................ 12Repository location ........................................................................................................................ 12Adaptive ........................................................................................................................................ 13Job Servers .................................................................................................................................... 13Search Service ............................................................................................................................... 13Event Server .................................................................................................................................. 13
PROCESSING TIER ............................................................................................................................. 13Crystal Reports Page Server .......................................................................................................... 13Shared Page Server machine .......................................................................................................... 15Crystal Reports Job Server ............................................................................................................. 18Report Application Server .............................................................................................................. 20List of Values Job Server ................................................................................................................ 21
APPLICATION TIER ............................................................................................................................ 22Web Application Server.................................................................................................................. 22
APPLICATION TIER ............................................................................................................................ 23LiveOffice – Special Settings .......................................................................................................... 23
STEP 3: SINGLE MACHINE CONFIGURATION ............................................................................. 25
STEP 4: SYSTEM DATABASE TUNING ............................................................................................ 25
SYSTEM DATABASE BACKEND PERFORMANCE .................................................................................. 25CONNECTION BETWEEN CRYSTAL REPORTS SERVER AND THE DATABASE SYSTEM ........................... 25PERFORMANCE CRITERIA ................................................................................................................. 25
1. 90% or higher cache hit rates… ................................................................................................ 262. up-to-date optimizer statistics… ................................................................................................ 263. lock granularity is row locking… ............................................................................................... 274. no lock escalations… ................................................................................................................. 28

Copyright © 2009 SAP BusinessObjects. All rights reserved. Page 3
5. no log write waits… ................................................................................................................... 28CALCULATING THE DATABASE FILE SIZE .......................................................................................... 29
Estimate ........................................................................................................................................ 29USEFUL RESOURCES .......................................................................................................................... 29
FINDING MORE INFORMATION ......................................................................................................... 30

Copyright © 2009 SAP BusinessObjects. All rights reserved. Page 4
IntroductionThere are three aspects to consider when designing a scalable enterprise reporting application: theapplication itself, the security and system data, and the actual hardware and configuration. It’simportant to recognize the set of factors that can influence these three aspects of scalability. Thisdocument will focus on the major aspects that influence sizing decisions including information onactual hardware and configuration of a Crystal Reports Server 2008 deployment.
A step-based methodology for sizing is used in this guide. The following four steps will help youplan and estimate the size of a deployment:
Step 1 - LoadLoad is determined in step 1. Load defines the amount and types of user/client activity, andtransactions that will interact with the Crystal Reports Server system. The results obtained in thisstep are a pre-requisite for step 2.
Step 2 - Service Thresholds, CPU and MemoryIn Step 2 of the sizing process the thresholds of each required service in the system is analyzed.Services are the software components required to provide the functionality and support theanticipated load. The number of CPUs and amount of memory required is also determined. CPUsand memory are incorporated in the supporting infrastructure that must support the services andload.
Step 3 - Single Machine ConfigurationStep 3 of the sizing process helps determine the appropriate configuration of machines. SinceCrystal Reports Server is licensed as a single server reporting solution, only a single machineconfiguration is considered.
Step 4 - CMS System Database TuningStep 4 addresses tuning of the database server. Tuning the database server and network to takefull advantage of Crystal Reports Server will help to provide optimal performance and reliability.

Copyright © 2009 SAP BusinessObjects. All rights reserved. Page 5
How to use this guide for Windows and LinuxenvironmentsThis document is a guide. Crystal Reports Server is a flexible system and numerous variables maycontribute to an optimal configuration. This guide offers conceptual information and measurementsthat reflect observed Crystal Reports Server system and component behavior. Sizing formulas inStep 2 can assist in understanding the nature of relationships between user interactions andservices functionality as well as how these relate to CPU utilization, memory and/or diskconsumption. For the purposes of this guide, most system and performance testing was conductedon machines averaging at 2.5 GHz clock speed with 2GB Memory per CPU.
Use this guide to better understand how each applicable service behaves, including relativecapacities and thresholds within the overall Crystal Reports Server system.
This guide can be used for both Windows and Linux environments. There are many variables(inherent CPU differences, hyper threading, operating system, network, report design, functionality,SDK, etc) that impact sizing and performance. While this guide cannot account for all of thesevariables, the concepts, formulas, configurations and observations can be used universally. Thesizing guide is a living document and may be updated as new sizing and configuration informationbecome available.

Copyright © 2009 SAP BusinessObjects. All rights reserved. Page 6
Step 1: LoadWhat is Load?Load defines the amount and types of use and activity that will interact with the Crystal ReportsServer system. Load can be broken down into various types of user interactions and user types:
Potential users is the number of users that have the ability to logon to the system.
Concurrent active users is an estimate of the number of users who are concurrently logged on tothe system and are actively interacting with the system (selecting folders, viewing reports,scheduling reports, etc.). There is a distinction between “concurrent active users” and “concurrentusers” as concurrent active users are actively interacting with the system at various rates, ratherthan simply logged on but inactive.
Simultaneous requests is an estimate of the total number of simultaneous requests being made byconcurrent active users to the system (logging on, selecting folders, viewing a report, scheduling,refreshing, etc.). The number of simultaneous requests is generally dependent on the usage typeand rate.
Concurrent active users and simultaneous requests are the two load types that will be heavilyweighted in determining the required resources and the appropriate configuration to support aperformant and reliable system. The number of potential users is useful in determining these threemeasurements.
Estimating Potential UsersThis is the easiest number to calculate as this is the total population of users who have the ability toaccess the Crystal Reports Server environment.
Estimating Concurrent Active UsersWhen calculating the size and configuration of a deployment, it is important to determine theexpected concurrent system usage.
In our experience, many customers find that their concurrency ratios are on average from 10% to20% of their total potential user base (e.g., 500 total potential users = 50 to 100 concurrent activeusers). This can vary depending on the nature of the deployment, but is a reasonable rule of thumbfor planning purposes. If your estimated concurrency rate is higher or lower, you can use that valueto complete the rest of the calculations in this document.
A guideline for estimating concurrent active users: concurrent active users = 10% to 20% of totalpotential users
@ 10%: 1000 potential users = 100 estimated concurrent active users

Copyright © 2009 SAP BusinessObjects. All rights reserved. Page 7
Estimating Simultaneous RequestsThe quickest method for estimating the number of simultaneous requests is to calculate 10% ofconcurrent active users:
100 concurrent active users x 10% = 10 simultaneous requests
Estimation ExampleThe following process is an example of one methodology that might be used to estimate this numberin more detail. If we divide the users into sets of types of users, based on how they use the system,we can more accurately assume a number. The percentages used in this example can be adjustedto match the profile of a particular environment.
For the purposes of this calculation we will divide users into 4 types:
Heavy Users – users who will be persistently logged onto the system and viewing reports.
Active Users – users who will log into the system frequently throughout the day averagingone request every 4 seconds.
Moderate Users – users who will log into the system from time to time throughout the dayaveraging one request every 8 seconds
Light Users – users who will log into the system infrequently to view reports with anestimate of one request every 16 seconds.
Divide concurrent active users into these 4 defined categories and then calculate the percentage ofeach type:
@ 10%: 1000 potential users = 100 concurrent active users
Heavy Users 15 concurrent active users 15%Active Users 45 concurrent active users 45%Moderate Users 25 concurrent active users 25%Light Users 15 concurrent active users 15%Total 100 concurrent active users 100%
Now that we have determined the percentage breakdown for each user type, we can estimate thetotal simultaneous requests based on the estimated user type request frequency (i.e. How wedefine what a "heavy concurrent active user" means in terms of request frequency or rate).
The following percentages are only assumptions that have been made relating to the rate ofsimultaneous use based on user group type:
For every 100 Heavy concurrent active users assume 100 simultaneous requests could bemade or a 100% rate

Copyright © 2009 SAP BusinessObjects. All rights reserved. Page 8
For every 100 Active concurrent active users assume that 25 simultaneous request could bemade or a 25% rate
For every 100 Moderate concurrent active users assume that 12 simultaneous requestscould be made or a 12% rate
For every 100 Light concurrent active users assume that 6 simultaneous requests could bemade or a 6% rate
Formula to calculate simultaneous user requests:
(((Concurrent active users × % of Heavy Users) / 100) * (1)) + (((Concurrent activeusers × % of Active Users) / 100) * (0.25)) +
(((Concurrent active users × % of Moderate Users )/ 100) * (0.12)) + (((Concurrentactive users × % of Light Users) / 100) * (0.06)) = Calculated Simultaneous Users(rounded up)
- or –
(((100 × 15) / 100) * (1))) + (((100 × 45) / 100) * (0.25)) + (((100 × 25) / 100) * (0.12)) +(((100 × 15) / 100) * (0.06)) = 31
Based on the assumption of 100 concurrent active users and the types of activities each user islikely to perform, we calculate that there will be an average of 31 simultaneous user requests.

Copyright © 2009 SAP BusinessObjects. All rights reserved. Page 9
Step 2: Services
Step 2 will help you estimate the number of Crystal Reports Server services required to support theload (user activity) estimated in Step 1. This section of the sizing and configuration guide outlinesthe specific nature of each Crystal Reporst Server service as determined through various internaltesting and benchmarking activities.
The Crystal Reports Server suite consists of many core services. It is during this step that you willdetermine which services are required and how many are needed to provide optimal performance.
Crystal Reports Server 2008 architecture differs from previous versions. Server Intelligence Agent(SIA) is introduced to simplify the management of other services in the web-based CentralManagement Console (CMC). The SIA is configurable by the Windows client Central ConfigurationManager (CCM). Adaptive Job Server and Adaptive Processing Server are host servers ofpublishing and program services.
Core Services
Server Intelligence Agent (SIA)The SIA maintains server status according to the settings you specify in the CMC. It processes theCMC's requests to start, stop, monitor, and manage all servers on the node, and it also monitorspotential problems and automatically restarts servers that have shut down unexpectedly. The SIAensures optimal performance by continually monitoring server status information, which is stored inthe CMS database. When you change a server's settings or add a new server in the CMC, the CMSnotifies the SIA, and the SIA performs the task.
The SIA is automatically configured during installation, but you can change these settings throughthe CCM.
Memory Requirement:
Only RAM memory consideration is required to maintain the execution of SIA. The recommendedRAM memory is 350MB.
Central Management Server (CMS)The principle component of the Crystal Reports Server system is the Central Management Server .Its primary responsibilities include, but are not limited to:

Copyright © 2009 SAP BusinessObjects. All rights reserved. Page 10
Management of users & user groups
Management of object security
Central system configuration
Management of scheduled tasks
Management of historical tasks. (e.g., success or failed instances)
Management of system objects (i.e., Info Objects)
License management
System database management
Name service
Only one CMS is permitted per Crystal Reports Server environment. This service is expected tosupport the maximum number of concurrent active users currently available by license.
Processor Requirement:
1 CPU for the CMS service is sufficient to accommodate up to the current Crystal Reports Serverlicense limitations (250 CAL + 250 NUL).
Memory Requirement:
Memory usage is controlled (roughly) by the number of objects stored in the object cache. This iscontrolled by the Windows registry key called “MaximumObjectsToKeepInMemory” and specifies themaximum number of objects that the CMS stores in its memory cache. Increasing the number ofobjects reduces the number of database calls required and greatly improves CMS performance.However, placing too many objects in memory may result in the CMS having too little memoryremaining to process queries. The upper limit is 100,000 and the default setting is 10,000.
For CMS System Database memory requirements please refer to Step 4: System Database Tuning.
Crystal Reports Cache ServerThe Cache Server stores report pages generated by the Page Server. By storing report pages incache, the Page Server and/or database server does not need to be accessed each time the reportis requested. The Cache Server is used for the viewing of Crystal Reports only, and when the user’spreference is set to any viewer other than Interactive DHTML.
When a report is requested for viewing, the system will first check the Cache Server to see if thereare any current available cache pages generated for that report. If there are pages, the CacheServer will send available report pages to the Web Application Server. If there are no cached pages,the Cache Server will request a Page Server to generate these pages.

Copyright © 2009 SAP BusinessObjects. All rights reserved. Page 11
The threshold that determines the number of Cache Server services required is the “maximumsimultaneous processing threads” per Cache Server service. The number of “simultaneousprocessing threads” is equal to the number of simultaneous requests. A guideline for the maximumsimultaneous processing threads per Cache Server service is 400
400 “maximum simultaneous processing threads” per Cache Server service
Processor Requirement:
1 CPU is required for every estimated 200 maximum simultaneous processing threads
Example 1:
If an environment must service 200 simultaneous Cache Server requests, based on the 400maximum per Cache Server service one would require only one Cache Server service. And basedon the 200 “maximum simultaneous processing threads” per processor, one would require a singleprocessor.
1 CPU machine with one Cache Server service
Example 2:
If an environment must service 800 simultaneous Cache Server requests, based on the 400maximum per Cache Server service one would require at least two Cache Server services. Andbased on the 200 “maximum simultaneous processing threads” per processor, one would require atleast 4 available processors.
1 quad machine with 2 Cache Server services
Memory Requirement:
Estimate 1MB per simultaneous processing thread + 17MB base
Disk Requirements:
For the Cache Server service, sufficient hard drive disk space should be available for the generationof cache files as well as in the temp directory for the creation of temp files (C:\ProgramFiles\Business Objects\BusinessObjects Enterprise 11\Data\machinename.cacheserver\). Thelocation of Cache Server cache files can be specified from the Central Management Console. Thehighest volume of cache files will likely be the “encapsulated page file” or “.epf.” A single .epf filerepresents one page of a Crystal report and the size of the individual file is variable dependent onthe complexity of the report page (e.g., a single .epf file from the sample “Statement of Account”report is 88kb in size). A sufficient amount of disk space should be made available to support allpotential cache pages generated at a given period.

Copyright © 2009 SAP BusinessObjects. All rights reserved. Page 12
File Repository Servers (FRS)There is an Input and an Output File Repository Server in every Crystal Reports Serverimplementation.
The Input File Repository Server manages objects (Crystal Reports, program objects, MicrosoftExcel files, Microsoft Word files, Microsoft PowerPoint files, Adobe Acrobat PDFs, rich text formatfiles, text files, hyperlinks, object packages) that have been published to the system byadministrators or end users (using the Publishing Wizard, the Central Management Console, theImport Wizard, or a Business Objects designer component such as Crystal Reports).
The Output FRS maintains all the instances that have been produced from reports, programs, andobject packages that have been scheduled.
Repository location
NOTETo optimize system performance on the File Repository Servers, network settings onWindows 2000 Server could be set to "Maximize Throughput for File Sharing". This willgive a higher priority to file sharing applications.
One of each - an Input and and Output File Repository Server - is required. In larger deployments,there may be multiple Input and Output File Repository Servers, for redundancy. In this case, allInput File Repository Servers must share the same directory. Likewise, all Output File RepositoryServers must share a directory.
Processor Requirements
The File Repository Servers require higher I/O resources (faster disk, network) and fewer CPUresources. When estimating the number of CPUs in the Crystal Reports Server system, the FileRepository Servers are not considered.
Memory Requirements
The File Repository Servers will have little impact on system memory.
Disk Requirements
Enough disk space must be available to store files. Typically the Output FRS will require more diskspace than the Input FRS. The Output FRS maintains all the instances (with saved data) that havebeen produced from reports, programs, and object packages that have been scheduled, and assuch will require proportionately more disk space. For both the Input and Output FRS, the amountof space required will vary from system to system, however, knowing the average file size andmultiplying this by the number of projected instances will assist in estimating total disk needs.

Copyright © 2009 SAP BusinessObjects. All rights reserved. Page 13
Adaptive Job ServersEvent Server
The Event Server manages file-based events. When you set up a file-based event within CrystalReports Server, the Event Server monitors the directory that you specified. When the appropriate fileappears in the monitored directory, the Event Server triggers your file-based event; the Event Servernotifies the CMS that the file-based event has occurred. The CMS then starts any jobs that aredependent upon your file-based event.
Processor and Memory Requirements:
The Event Server under normal enterprise usage is not a processing or memory intensive serverand as such will not be weighted in the sizing process. If Event Server functionality is required,allocate this service into the system but do not estimate any additional CPUs for this service.
Processing Tier
Crystal Reports Page Server
The Page Server is primarily responsible for responding to page requests by processing Crystalreports and generating Encapsulated Page Format (EPF) pages. A single .epf file represents onepage of a Crystal report. The Page Server retrieves data for the report from the latest instance ordirectly from the database (depending on the user’s request and user’s security level).
Specifically, the Page Server responds to page requests made by the Cache Server. The PageServer and Cache Server interact closely, so cached EPF (encapsulated page files) pages arereused as frequently as possible, and new pages are generated as soon as they are required. TheInfoView portal takes advantage of this behavior by ensuring that the majority of report-viewingrequests are made to the Cache Server and Page Server.
The Crystal Reports Page Server creates Page Server sub-processes. Each sub-process loads theCrystal Reports engine and then instantiates threads or print jobs as needed. With the Page Server,if an individual print job were to fail for any reason, only those threads contained in the Page Serversub-process would be affected. All other sub-processes within the Page Server service would beunaffected. In addition, individual sub-processes are shut down after so many requests and anew sub-process is started, if required, so as to maximize resource management.
Definitions used in this section:
Page Server Service – service that manages sub-processes
Page Server Service Sub Process – process responsible for managing report jobs
Report Job – thread responsible for generating report pages requested by report viewers

Copyright © 2009 SAP BusinessObjects. All rights reserved. Page 14
Maximum Simultaneous Report Jobs – the total number of report jobs that can becontained in a Page Server service
For the Page Server service, the number of Page Server sub-processes and the total MaximumSimultaneous Report Jobs are determined by the following default algorithm:
Max Simultaneous Report Jobs (threads) = (# CPU's) * (25) [minimum of 50 on asingle CPU]
Max # of Sub Processes = (Max Simultaneous Report Jobs) / 10 report jobs per sub-process (rounded up)Max # of Processes = (Max # of Sub Processes) + 1 Parent Process
(The maximum report jobs per sub-process is set at 10)
By default, the above algorithm is used to determine the Maximum Number of Simultaneous ReportJobs on a particular machine. The algorithm has been purposely tuned conservatively to favorreliability (lower number of Simultaneous Report Jobs per CPU) so as to work optimally in mostreporting environments and configurations. The default can be overridden in the CMC (under PageServer properties) by changing the radio button from “Unlimited Jobs” to “Jobs limited to:”
The “Jobs limited to:” option gives the administrator the ability to increase or decrease the MaximumNumber of Simultaneous Report Jobs that can run on a single Page Server service (parent process).Based on our internal testing, broad guidelines for this setting are outlined below within this section.
IMPORTANT
In Crystal Reports Server, only one Page Server service is required to runon the single machine. The Crystal Reports Server Page Server createsand stops new Page Server sub-processes on an as-needed basis. ThePage Server detects the number of processors on the machine and willscale accordingly.
For this reason, it is important to not install, and is not necessary to installmore than one Page Server if the default setting of "Unlimited" is kept.

Copyright © 2009 SAP BusinessObjects. All rights reserved. Page 15
The newly designed Page Server improves performance, reliability and manageability and willdynamically adapt to different loads (by creating and stopping Page Server sub processes asneeded) within its available resources.
When using the default setting of “Unlimited”, the Crystal Reports Page Server’s Maximum Numberof Simultaneous Report Jobs* maximum will be calculated as 25 x Number of CPUs, with aminimum of 50 (25 by calculation, but minimum is always 50)
1 CPU - Maximum Simultaneous Report Jobs = 50
2 CPUs - Maximum Simultaneous Report Jobs = 50
4 CPUs - Maximum Simultaneous Report Jobs = 100
8 CPUs - Maximum Simultaneous Report Jobs = 200
* Maximum Number of Simultaneous Report Jobs is equal to the amount of usersimultaneous requests
Shared Page Server machineThere may be limited cases where it is advisable to change the default setting from unlimited so asto throttle back the maximum number of Page Server Jobs created on a single machine.
The Page Server service can be changed from the default setting of "Unlimited" to a recommendedrange of 25 - 75 "Maximum Simultaneous Report Jobs" per available CPU. The setting of 25 - 75can be adjusted higher or lower depending on the environment (e.g. report complexity, size, etc.)Values below 25 per CPU may be appropriate since other processes such as CMS, Job Server,etc are present on the machine and are sharing the same CPUs.
On-Demand (Live Data) vs. Saved Data Viewing (Pre-Scheduled Instance)
Live Data
On-demand reporting gives users real-time access to live data, straight from the database server.Use live data to keep users up-to-date on constantly changing data, so they can access informationthat's accurate to the second. For instance, if the managers of a large distribution center need tokeep track of inventory shipped on a continual basis, then live reporting is the way to give them theinformation they need.
Before providing live data for all your reports, however, consider whether or not you want all of yourusers hitting the database server on a continual basis. If the data isn't rapidly or constantly changing,then all those requests to the database do little more than increase network traffic and consumeserver resources. In such cases, you may prefer to schedule reports on a recurrent basis so thatusers can always view recent data (report instances) without hitting the database server.
Saved Data

Copyright © 2009 SAP BusinessObjects. All rights reserved. Page 16
To reduce the amount of network traffic and the number of hits on your database servers, you canschedule reports to be run at specified times. When the report has been run, users can view thatreport instance as needed, without triggering additional hits on the database.
Report instances are useful for dealing with data that isn't continually updated. When users navigatethrough report instances, and drill down for details on columns or charts, they don't access thedatabase server directly; instead, they access the saved data. Consequently, reports with saveddata not only minimize data transfer over the network, but also lighten the database server'sworkload.
For example, if your sales database is updated once a day, you can run the report on a similarschedule. Sales representatives then always have access to current sales data, but they are nothitting the database every time they open a report.
CPU utilization and memory consumption will be relatively comparable between Live Data viewingand Saved data viewing, however; viewing Save Data reports on average will decrease viewingresponse times and increase throughput and system efficiency.
Crystal Page Server Data Sharing
The "Oldest On-Demand Data Given To a Client (in minutes):" setting controls how long the PageServer uses previously processed data to meet requests. If the Page Server receives a request thatcan be met using data that was generated to meet a previous request and the time elapsed sincethat data was generated is less than the value set here, then the Page Server will reuse this data tomeet the subsequent request.
Reusing data in this way significantly improves system performance when multiple users need thesame information. When setting the value of the "oldest processed data given to a client" considerhow important it is that your users receive up-to-date data. If it is very important that all users receivefresh data (perhaps because important data changes very frequently) you may need to disallow thiskind of data reuse by setting the value to 0. The default is always set to 0 meaning that all userswill, by default, receive fresh data.
If Data Sharing can be used in a system, this can decrease the number of CPUs required to process(view) a report.
When to use Crystal Reports Job Server vs. Crystal Reports Page Server
The Crystal Report Page Server is designed to process a large set of smaller reports whereas theCrystal Reports Job Server is designed to process a smaller set of very large reports. Smallerreports are less complex and contain a smaller set of data. They are suitable for a large group ofusers to view as “on demand” reports (Live Data). Larger complex reports that must retrieve andprocess a very large set of data should be scheduled (Saved Data)

Copyright © 2009 SAP BusinessObjects. All rights reserved. Page 17
Processor Requirements
For sizing estimates based on number of simultaneous jobs per CPU it is recommended to use arange starting from the default 25 to a recommended maximum of 75
1 Processor = 25 - 75 Maximum Simultaneous Report Jobs
Memory Requirements
Depending on the design of a report, the number of records retrieved from the database, memoryrequirements may vary. When a report is viewed and loaded into memory the report isdecompressed and expanded up to as much as 40 times the original report file size (with saveddata/retrieved records).
Example (minimum memory requirements on Page Server machine):
500KB Report File Size (contains saved data) = 500KB * 40 (decompression ratio) =20MB
25 Reports * 20MB = 500MB of minimum memory required
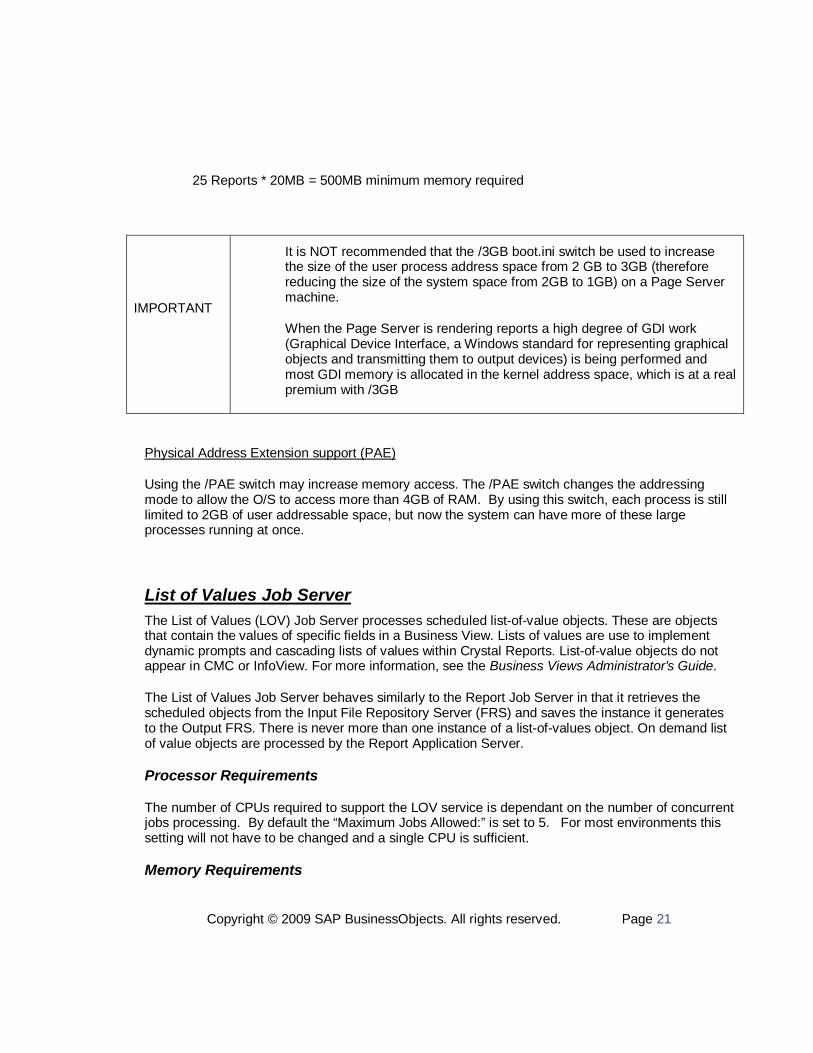
IMPORTANT
It is NOT recommended that the /3GB boot.ini switch be used to increasethe size of the user process address space from 2 GB to 3GB (thereforereducing the size of the system space from 2GB to 1GB) on a Page Servermachine.
When the Page Server is rendering reports a high degree of GDI work(Graphical Device Interface, a Windows standard for representing graphicalobjects and transmitting them to output devices) is being performed andmost GDI memory is allocated in the kernel address space, which is at a realpremium with /3GB
Physical Address Extension support (PAE)
Using the /PAE switch may increase memory access. The /PAE switch changes the addressingmode to allow the O/S to access more than 4GB of RAM. By using this switch, each process is stilllimited to 2GB of user addressable space, but now the system can have more of these largeprocesses running at once.
Disk Requirements
For the Crystal Reports Page Server service, sufficient hard drive disk space should be available inthe temp directory for the creation of temp files during report processing (C:\Program Files\Business

Copyright © 2009 SAP BusinessObjects. All rights reserved. Page 18
Objects\BusinessObjects Enterprise 11\Data\machinename.pageserver\). The data from thedatabase server is stored in these files until it can be saved and compressed in the report.
Hard drive access speed to the temp directory may have an impact on the speed at which a reportprocesses
Optimize disk performances on: C:\Program Files\Business Objects\BusinessObjects Enterprise11.5\Data\procSched\<machinename>.pageserver
or the equivalent directory path on a Unix system
Crystal Reports Job ServerThe Crystal Reports Job Server processes report files (.rpt) as requested by the CMS and generatesreport instances (versions of the report that contain saved data). To generate a report instance, theJob Server communicates with the database to retrieve the current data. Multiple Job Servers canfacilitate larger scale deployments.
The Job Server has the ability to process both report files and packaged objects. Object packagesare simply collections of Crystal Reports Server objects (e.g. report files) that can be groupedtogether and managed by the Crystal Reports Server system as a single object.
When you are scheduling reports, the reports are run through the Job Server. The Job Serverservice launches a Job Server child process so each report is run in its own process. A single JobServer service with 1 available CPU can optimally support 5 maximum jobs (processes). Also, asingle Job Server service can be used to support up to 20 jobs across 4 CPUs. The default settingsfor maximum jobs will vary based on the complexity and size of reports, but the conservative settingof five simultaneous jobs per available CPU should handle any kind of report.
Processor Requirements
1 available CPU can optimally support 5 maximum jobs (processes) – higher or lower depending onreport complexity and size
For batch schedule reporting, the number of CPUs required to support the Crystal Reports JobServer service is dependant on the number of concurrent Jobs processing, the complexity and sizeof reports, and the time window available to execute reports.
(# of reports) X (Average Report Process Time)
______________________________________ = number of required CPUs
(Time Window) X (# of simultaneous jobs per CPU)
Example:

Copyright © 2009 SAP BusinessObjects. All rights reserved. Page 19
How many CPUs are required to process 1000 reports taking 10 minutes each on average, thatmust be processed in a four-hour (240 min) time window?
(1000 reports) X (10 minutes)
_________________________ = 8.4 CPUs (round up to 9 CPUs - i.e. 2 Quad and 1Single box)
(240 minutes) X (5 simultaneous jobs per CPU)
Memory Requirements
Depending on the design of a report and the number of records retrieved from the database,memory requirements may vary. When a report is executing and loaded into memory, the report isdecompressed and expanded up to as much as 40 times the original report file size (with saveddata/retrieved records).
Example (minimum memory requirements on Crystal Report Job Server machine):
2MB Report File Size (contains saved data) = 2MB * 40 (decompression ratio) = 80MB
5 Reports * 80MB = 400MB minimum memory required
IMPORTANT
It is NOT recommended that the /3GB boot.ini switch be used to increasethe size of the user process address space from 2 GB to 3GB (thereforereducing the size of the system space from 2GB to 1GB) on a Page Servermachine.
When the Page Server is rendering reports a high degree of GDI work(Graphical Device Interface, a Windows standard for representing graphicalobjects and transmitting them to output devices) is being performed andmost GDI memory is allocated in the kernel address space, which is at a realpremium with /3GB
Physical Address Extension support (PAE)
Using the /PAE switch may increase memory access. The /PAE switch changes the addressingmode to allow the O/S to access more than 4GB of RAM. By using this switch, each process is stilllimited to 2GB of user addressable space, but now the system can have more of these largeprocesses running at once.

Copyright © 2009 SAP BusinessObjects. All rights reserved. Page 20
Disk Requirements
For the Crystal Reports Job Server service, sufficient hard drive disk space should be available inthe temp directory for the creation of temp files during report processing (C:\Program Files\BusinessObjects\BusinessObjects Enterprise 11\Data\procSched\machinename.reportjobserver\). The datafrom the database server is stored in these files until it can be saved and compressed in the report.
Hard drive access speed to the temp directory may have an impact on the speed at which a reportprocesses.
Report Application ServerThe Report Application Server (RAS) is very similar to the Page Server. It, too, is primarilyresponsible for responding to page requests by processing reports and generating EPF pages.However, the RAS uses an internal caching mechanism that involves no interaction with the CacheServer. The RAS also provides the API services to enable the creation and modification of Crystalvia custom code. Additionally, RAS is used at the time of viewing or submitting schedule requestsfor reports containing dynamic prompts and cascading lists of values.
The default Maximum Simultaneous Report Jobs is set at 75 for each RAS service. This value, aswith the Crystal Reports Page Server, may be adjusted according to anticipated load and availablehardware resources. The guideline of 25 to 75 (default) Simultaneous Report Jobs per CPU isrecommended. The ideal setting for your reporting environment however, is highly dependent uponyour hardware configuration, your database software, and your reporting requirements. Additionally,a recommended guideline is to run 1 Report Application Server per CPU.
Example:
For each available CPU, run 1 RAS service with a setting of 25 to 75 MaximumSimultaneous Report Jobs (use 25 for Optimal Performance)
Processor Requirements
1 Processor = 25 to 75 Maximum Simultaneous Processing Jobs (use 25 for Optimal Performance)
Memory Requirements
Depending on the design of a report, the number of records retrieved from the database, memoryrequirements may vary. When a report is viewed and loaded into memory the report isdecompressed and expanded up to as much as 40 times the original report file size (with saveddata/retrieved records).
Example (minimum memory requirements on RAS machine):
500KB Report File Size (contains saved data) = 500KB * 40 (decompression ratio) = 20MB
Copyright © 2009 SAP BusinessObjects. All rights reserved. Page 21
25 Reports * 20MB = 500MB minimum memory required
IMPORTANT
It is NOT recommended that the /3GB boot.ini switch be used to increasethe size of the user process address space from 2 GB to 3GB (thereforereducing the size of the system space from 2GB to 1GB) on a Page Servermachine.
When the Page Server is rendering reports a high degree of GDI work(Graphical Device Interface, a Windows standard for representing graphicalobjects and transmitting them to output devices) is being performed andmost GDI memory is allocated in the kernel address space, which is at a realpremium with /3GB
Physical Address Extension support (PAE)
Using the /PAE switch may increase memory access. The /PAE switch changes the addressingmode to allow the O/S to access more than 4GB of RAM. By using this switch, each process is stilllimited to 2GB of user addressable space, but now the system can have more of these largeprocesses running at once.
List of Values Job ServerThe List of Values (LOV) Job Server processes scheduled list-of-value objects. These are objectsthat contain the values of specific fields in a Business View. Lists of values are use to implementdynamic prompts and cascading lists of values within Crystal Reports. List-of-value objects do notappear in CMC or InfoView. For more information, see the Business Views Administrator's Guide.
The List of Values Job Server behaves similarly to the Report Job Server in that it retrieves thescheduled objects from the Input File Repository Server (FRS) and saves the instance it generatesto the Output FRS. There is never more than one instance of a list-of-values object. On demand listof value objects are processed by the Report Application Server.
Processor Requirements
The number of CPUs required to support the LOV service is dependant on the number of concurrentjobs processing. By default the “Maximum Jobs Allowed:” is set to 5. For most environments thissetting will not have to be changed and a single CPU is sufficient.
Memory Requirements

Copyright © 2009 SAP BusinessObjects. All rights reserved. Page 22
This list of values objects are “Group by” Crystal Reports. The file size of the list of values objects(stored in the output FRS) can be used to calculate memory requirements. When a report isprocessed and loaded into memory the report is decompressed and expanded up to as much as 40times the original report file size (with saved data/retrieved records).
Example (minimum memory requirements LOV machine):
100KB Report File Size (contains saved data) = 100KB * 40 (decompression ratio) = 4MB
5 LOV Reports * 4MB = 20MB minimum memory required
Application Tier
Web Application ServerDepending on how the system is being utilized, the web application server (IIS, Apache Tomcat,BEA WebLogic, IBM WebSphere) can manage differing number of concurrent user sessions andsimultaneous requests. The main functions of the web application server within the Crystal ReportsServer system are:
Processing the .NET/Java script
Translating the Encapsulated Page Files (page on demand) to DHTML pages.
Communicating with Cache Server for report view requests
Managing session state information for the users
Processor Requirements
NOTEProcessor Requirement guidance is generalized and relative requirementsmay change based on the individual characteristics of different webapplication server types. To better understand specific web application servercharacteristics, please consult with the specific vendor.
One web application server is estimated to manage approximately 400 concurrent user sessions(user session = 1 logged on user) per processor. And, generally, a service can efficiently manage100 simultaneous requests (request = e.g., a user clicking on a folder). Under normalcircumstances, it is improbable that all concurrent users would make a request simultaneously;therefore, the following numbers allow for and differentiate between “concurrent user sessions” and

Copyright © 2009 SAP BusinessObjects. All rights reserved. Page 23
“simultaneous requests.” Because the service deals with two thresholds (Maximum number ofConcurrent User Sessions and Maximum number of Simultaneous Requests), it is important toconsider both when determining the required hardware.
This can be illustrated in the following examples:
Example 1
1 single available processor (1 processor) with 1 web application server service running couldefficiently service 400 concurrent user sessions and can handle 100 simultaneous user requests.
Example 2
1 dual processor machine (2 processors) with 2 web application server services running couldefficiently service the maximum permitted 500 concurrent user sessions and handle 200simultaneous user requests.
Rule of Thumb
1 web application server = 400 concurrent user sessions (user session = 1 logged on user).
1 web application server = 100 simultaneous requests per processor (request = e.g., a user clickingon a folder)
As a base guideline, it is recommended to estimate 1 web application server per 100 simultaneousrequests, however each viewer type will have its own characteristics that will impact the capacity forconcurrent users or simultaneous requests and as such this number can be higher and lower.
Viewing in ActiveX or Java Viewers
1 web application server = 100 simultaneous requests per processor (request = e.g. a userinteracting with the report)
Viewing in HTML Viewer
1 web application server = 50 simultaneous requests per processor (request = e.g. a user interactingwith the report)
Application Tier
LiveOffice – Special SettingsDepending on the usage that is made of LiveOffice, the settings of the given services should beapplied as described in the previous sections. For instances:

Copyright © 2009 SAP BusinessObjects. All rights reserved. Page 24
Where LiveOffice is used with Crystal Reports, one should follow the section on RAS.
Recommendations
Add one Report Application Server instance for every 50 to 75 LiveOffice/Crystal users.
The Report Application Server connection timeout should be optimally adjusted in order to preventunused sessions remaining open too long a time. When the timeout value is too large the maxconnection may be overflowed. The timeout value, however, should be long enough to avoid activesessions being interrupted.
In a LiveOffice document, using a filter rather than an interactive prompt will provide betterperformance due to fewer interactions with the database.

Copyright © 2009 SAP BusinessObjects. All rights reserved. Page 25
Step 3: Single Machine Configuration
Crystal Reports Server is licensed as a single server reporting solution. This basic configurationseparates the Crystal Reports Server servers from the rest of your reporting environment and fromyour web server, and installs all Crystal Reports Server servers on a single machine. This grants theservers their own set of processing resources, which they do not have to share with database andweb server processes.
Step 4: System Database Tuning
System Database Backend Performance
To provide optimal overall performance the network and the database system need to be adequatelysized and configured. Tuning a database system for peak performance is a complex task andinvolves hundreds of database parameters. Different tuning methodologies have been developedand comprehensive performance tuning guides are available.
Connection between Crystal Reports Server and the databasesystem
For data storage and retrieval, Crystal Reports Server exchanges messages with the databasesystem over the network. The data caches ensure minimal network traffic between Crystal ReportsServer and the database system. Nevertheless good network performance is critical, for examplesome operations cannot use Crystal Reports Server’s data caches.
The database client software uses the underlying network system. There is no tuning required forthe database client software.
Make sure network response times are adequate and network throughput is sufficient.
Performance CriteriaMeeting the following 5 criteria helps to avoid the most common performance bottlenecks.
1. The database system’s cache hit rates are over 90%.
2. The optimizer statistics are not older than 24 hours.

Copyright © 2009 SAP BusinessObjects. All rights reserved. Page 26
3. Lock granularity is row locking.
4. There are no lock escalations.
5. There are no log write waits. The average disk write queue length to the disk drives whichcontain the database log files is smaller than 5.
1. 90% or higher cache hit rates…give us
Relative low number of physical disk reads and writes
Relative low number of SQL compiler executions
are important to avoid
the disk subsystem is unable to keep up with the level of I/O that the database serverrequests
long disk read or disk write queues
unnecessary SQL statement compilations or long SQL statement compilation times
are achieved by
providing sufficient physical memory
configuration of sufficient cache sizes
2. up-to-date optimizer statistics…give us
the Query Optimizer chooses the Query Execution Plan with the minimal cost
good selectivity estimates of predicates in SQL expressions specially for expressionsincluding columns with unequal or skewed distribution of column values
are important to avoid
long response times and low throughput

Copyright © 2009 SAP BusinessObjects. All rights reserved. Page 27
long execution times for queries specially for queries predicate has high selectivity
full table scans
lock escalations
lock waits or deadlocks
significant differences between the estimated number of rows for each operator in the queryplan from the actual number of rows
are achieved by
implementing a procedure to periodically update the statistics or to update the statistics afterfrequent changes to the database.
creating all statistics (table, column, index) and the statistics are not stale (underlying objecthas not been modified significantly … more than 10% of the rows)
setting the sample size (percentage of data that got analyzed to gather statisticalinformation) to a value which is sufficient for the skewed data distribution
setting the number of histogram buckets to a value which is sufficient for the skewed datadistribution
3. lock granularity is row locking…give us
increased concurrent execution of transactions
reduced transaction processing time due to less lock waits
is important to avoid
lock waits or deadlocks
is achieved by
setting the lock granularity of your database to row level.

Copyright © 2009 SAP BusinessObjects. All rights reserved. Page 28
4. no lock escalations…gives us
increased concurrent execution of transactions
is important to avoid
lock waits or deadlocks
are achieved by
configuration of a sufficient size of the lock list
setting the lock escalation threshold to an appropriate value
keeping the optimizer statistics up-to-date
5. no log write waits…gives us
increased concurrent execution of transactions
reduced transaction processing time due to no I/O waits
is important to avoid
lock waits or deadlocks
is achieved by
providing an I/O subsystem with sufficient throughput
providing a Disk Controller Cache and setting the Disk Controller cache to 100% write cache

Copyright © 2009 SAP BusinessObjects. All rights reserved. Page 29
Calculating the Database File Size
EstimateEach row stores one BOE XI object. The average size of a BOE XI object is 1024 Byte.
(Size Data + Size Indexes) * (1 + (1 – page fill factor))= ((Number Rows * 1024) + Number Indexes * (32 * number of rows * 2)) * 1.3= 1.3 * number rows * (1024 + number indexes * 64)= 1.3 * number rows * 2624
Number of Objects Database Size Unit10,000 33,312 KB100,000 333,125 KB1,000,000 3,331,250 KB10,000,000 33,312,500 KB
Sybase (per one lob one data page is allocated)
= ((number rows * 844) + (number rows * page size) + Number Indexes * (32 * numberof rows * 2)) * 1.3= 1.3 * number rows * (2624 + page size)
Number of Objects Database Size (page size 4K) Unit10,000 87,360 KB100,000 873,600 KB1,000,000 8,736,000 KB10,000,000 87,360,000 KB
Useful Resources
IBM DB2 8.1 Manuals “Administration Guide: Performance”
IBM Redbook “DB2 UDB ESE V8 non-DPF Performance Guide for High Performance OLTPand BI”
Oracle Manual “Performance Tuning Guide and Reference”
Oracle Manual “Supplied PL/SQL Packages and Types Reference”

Copyright © 2009 SAP BusinessObjects. All rights reserved. Page 30
www.businessobjects.com
Business Objects owns the following U.S. patents, which maycover products that are offered and sold by Business Objects:5,555,403, 6,247,008 B1, 6,578,027 B2, 6,490,593 and6,289,352. Business Objects, the Business Objects logo, CrystalReports, and Crystal Enterprise are trademarks or registeredtrademarks of Business Objects SA or its affiliated companies in
Finding More InformationFor more information and resources, refer to the product documentation and visit the support area ofthe web site at: http://www.businessobjects.com/