CRUISE REPORT1 VESSEL: Hi’ialakai CRUISE PERIOD: AREA OF ... · CRUISE REPORT1 VESSEL:...
36
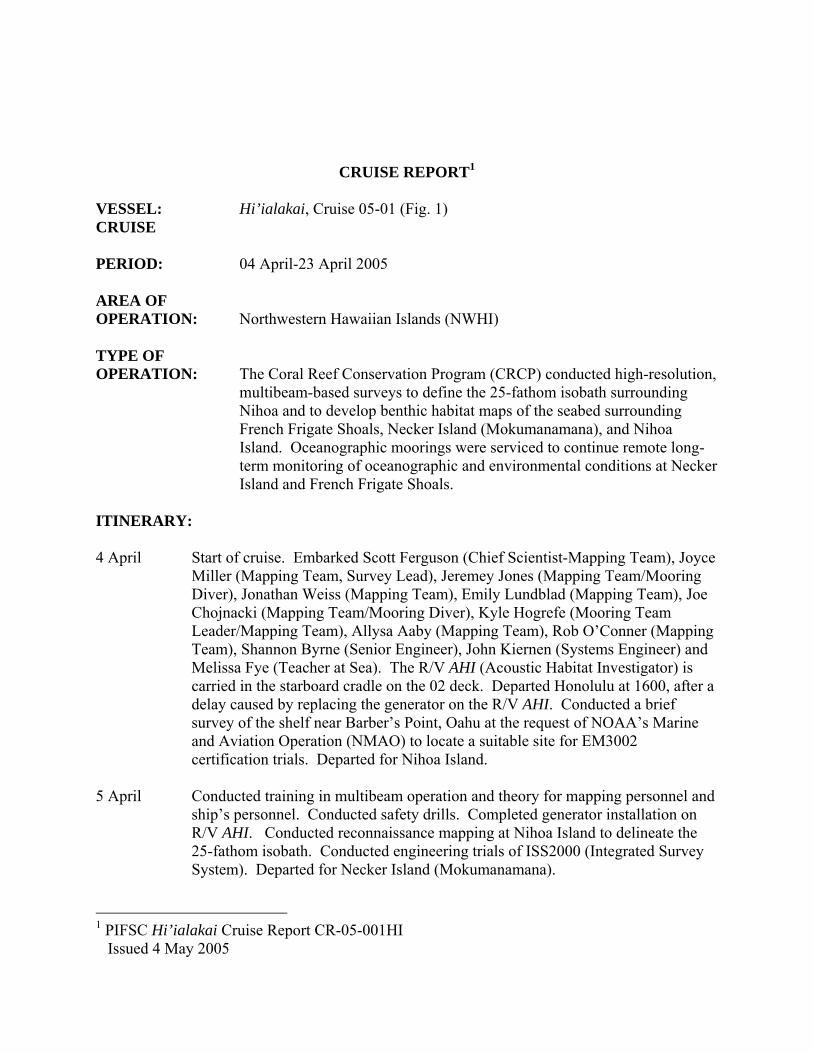
CRUISE REPORT 1 VESSEL: Hi’ialakai, Cruise 05-01 (Fig. 1) CRUISE PERIOD: 04 April-23 April 2005 AREA OF OPERATION: Northwestern Hawaiian Islands (NWHI) TYPE OF OPERATION: The Coral Reef Conservation Program (CRCP) conducted high-resolution, multibeam-based surveys to define the 25-fathom isobath surrounding Nihoa and to develop benthic habitat maps of the seabed surrounding French Frigate Shoals, Necker Island (Mokumanamana), and Nihoa Island. Oceanographic moorings were serviced to continue remote long- term monitoring of oceanographic and environmental conditions at Necker Island and French Frigate Shoals. ITINERARY: 4 April Start of cruise. Embarked Scott Ferguson (Chief Scientist-Mapping Team), Joyce Miller (Mapping Team, Survey Lead), Jeremey Jones (Mapping Team/Mooring Diver), Jonathan Weiss (Mapping Team), Emily Lundblad (Mapping Team), Joe Chojnacki (Mapping Team/Mooring Diver), Kyle Hogrefe (Mooring Team Leader/Mapping Team), Allysa Aaby (Mapping Team), Rob O’Conner (Mapping Team), Shannon Byrne (Senior Engineer), John Kiernen (Systems Engineer) and Melissa Fye (Teacher at Sea). The R/V AHI (Acoustic Habitat Investigator) is carried in the starboard cradle on the 02 deck. Departed Honolulu at 1600, after a delay caused by replacing the generator on the R/V AHI. Conducted a brief survey of the shelf near Barber’s Point, Oahu at the request of NOAA’s Marine and Aviation Operation (NMAO) to locate a suitable site for EM3002 certification trials. Departed for Nihoa Island. 5 April Conducted training in multibeam operation and theory for mapping personnel and ship’s personnel. Conducted safety drills. Completed generator installation on R/V AHI. Conducted reconnaissance mapping at Nihoa Island to delineate the 25-fathom isobath. Conducted engineering trials of ISS2000 (Integrated Survey System). Departed for Necker Island (Mokumanamana). 1 PIFSC Hi’ialakai Cruise Report CR-05-001HI Issued 4 May 2005
Transcript of CRUISE REPORT1 VESSEL: Hi’ialakai CRUISE PERIOD: AREA OF ... · CRUISE REPORT1 VESSEL:...
CRUISE REPORT1 VESSEL: Hi’ialakai, Cruise 05-01 (Fig. 1) CRUISE PERIOD: 04 April-23 April 2005 AREA OF OPERATION: Northwestern Hawaiian Islands (NWHI) TYPE OF OPERATION: The Coral Reef Conservation Program (CRCP) conducted high-resolution,
multibeam-based surveys to define the 25-fathom isobath surrounding Nihoa and to develop benthic habitat maps of the seabed surrounding French Frigate Shoals, Necker Island (Mokumanamana), and Nihoa Island. Oceanographic moorings were serviced to continue remote long-term monitoring of oceanographic and environmental conditions at Necker Island and French Frigate Shoals.
ITINERARY: 4 April Start of cruise. Embarked Scott Ferguson (Chief Scientist-Mapping Team), Joyce
Miller (Mapping Team, Survey Lead), Jeremey Jones (Mapping Team/Mooring Diver), Jonathan Weiss (Mapping Team), Emily Lundblad (Mapping Team), Joe Chojnacki (Mapping Team/Mooring Diver), Kyle Hogrefe (Mooring Team Leader/Mapping Team), Allysa Aaby (Mapping Team), Rob O’Conner (Mapping Team), Shannon Byrne (Senior Engineer), John Kiernen (Systems Engineer) and Melissa Fye (Teacher at Sea). The R/V AHI (Acoustic Habitat Investigator) is carried in the starboard cradle on the 02 deck. Departed Honolulu at 1600, after a delay caused by replacing the generator on the R/V AHI. Conducted a brief survey of the shelf near Barber’s Point, Oahu at the request of NOAA’s Marine and Aviation Operation (NMAO) to locate a suitable site for EM3002 certification trials. Departed for Nihoa Island.
5 April Conducted training in multibeam operation and theory for mapping personnel and
ship’s personnel. Conducted safety drills. Completed generator installation on R/V AHI. Conducted reconnaissance mapping at Nihoa Island to delineate the 25-fathom isobath. Conducted engineering trials of ISS2000 (Integrated Survey System). Departed for Necker Island (Mokumanamana).
1 PIFSC Hi’ialakai Cruise Report CR-05-001HI Issued 4 May 2005
2
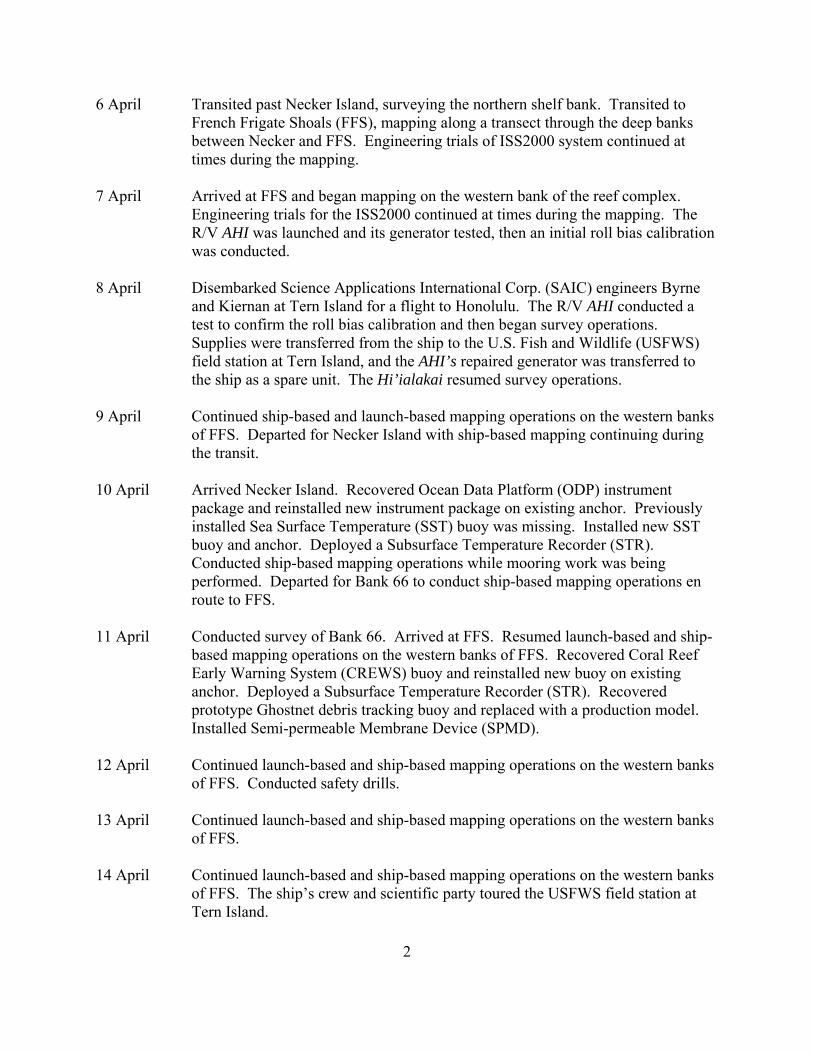
6 April Transited past Necker Island, surveying the northern shelf bank. Transited to
French Frigate Shoals (FFS), mapping along a transect through the deep banks between Necker and FFS. Engineering trials of ISS2000 system continued at times during the mapping.
7 April Arrived at FFS and began mapping on the western bank of the reef complex.
Engineering trials for the ISS2000 continued at times during the mapping. The R/V AHI was launched and its generator tested, then an initial roll bias calibration was conducted.
8 April Disembarked Science Applications International Corp. (SAIC) engineers Byrne
and Kiernan at Tern Island for a flight to Honolulu. The R/V AHI conducted a test to confirm the roll bias calibration and then began survey operations. Supplies were transferred from the ship to the U.S. Fish and Wildlife (USFWS) field station at Tern Island, and the AHI’s repaired generator was transferred to the ship as a spare unit. The Hi’ialakai resumed survey operations.
9 April Continued ship-based and launch-based mapping operations on the western banks
of FFS. Departed for Necker Island with ship-based mapping continuing during the transit.
10 April Arrived Necker Island. Recovered Ocean Data Platform (ODP) instrument
package and reinstalled new instrument package on existing anchor. Previously installed Sea Surface Temperature (SST) buoy was missing. Installed new SST buoy and anchor. Deployed a Subsurface Temperature Recorder (STR). Conducted ship-based mapping operations while mooring work was being performed. Departed for Bank 66 to conduct ship-based mapping operations en route to FFS.
11 April Conducted survey of Bank 66. Arrived at FFS. Resumed launch-based and ship-
based mapping operations on the western banks of FFS. Recovered Coral Reef Early Warning System (CREWS) buoy and reinstalled new buoy on existing anchor. Deployed a Subsurface Temperature Recorder (STR). Recovered prototype Ghostnet debris tracking buoy and replaced with a production model. Installed Semi-permeable Membrane Device (SPMD).
12 April Continued launch-based and ship-based mapping operations on the western banks
of FFS. Conducted safety drills. 13 April Continued launch-based and ship-based mapping operations on the western banks
of FFS. 14 April Continued launch-based and ship-based mapping operations on the western banks
of FFS. The ship’s crew and scientific party toured the USFWS field station at Tern Island.
3
15 April Continued launch-based and ship-based mapping operations on the western banks of FFS. Continued ship-based mapping operations on the east side of FFS during night hours. Conducted comparisons between all sources of sound velocity being used on the cruise. Began testing of ship’s Trackpoint II Plus underwater navigation system. Conducted engineering trials with the Tethered Optical Assessment Device (TOAD) camera sled to test new lighting systems and positioning of the camera sled using the Trackpoint II.
16 April Continued launch-based and ship-based mapping operations on the western banks
of FFS. Continued ship-based mapping operations on the east side of FFS during night hours. Conducted engineering trials with the TOAD camera sled to test the ability of the Trackpoint II navigation system to track a vehicle being towed from the A-frame. Tested the abililty of the Trackpoint II system to track the conductivity-temperature-depth (CTD) sensor when deployed to 300 meters.
17 April Continued launch-based and ship-based mapping operations on the western banks
of FFS. Conducted a dive on the ship’s hull to verify the installation of the Trackpoint II transducer and document the condition of the other transducers. Commenced ship-based mapping of Brooks Bank.
18 April Continued ship-based mapping of Brooks Bank. Conducted safety drills.
Continued launch-based and ship-based mapping operations on the western banks of FFS. Conducted a TOAD deployment to test using Trackpoint II and Hypack to provide geo-referenced track tows. Departed for Necker Island with ship-based mapping en route.
19 April Conducted ship-based mapping of the northern and eastern banks of Necker
Island. Poor weather precluded collection of good multibeam data when headed into the seas, so mapping at Necker was halted early. Departed for Nihoa with limited ship-based mapping en route.
20 April Arrived Nihoa. Conducted ship-based mapping to delineate the 25-fathom isobath
on the banks surrounding Nihoa. 21 April Conducted ship-based mapping to delineate the 25-fathom isobath on the banks
surrounding Nihoa. 22 April Conducted ship-based mapping to delineate the 25-fathom isobath on the banks
surrounding Nihoa. Departed for Honolulu. 23 April Arrived Honolulu. Disembarked Ferguson, Miller, Jones, Weiss, Lundblad,
Chojnacki, Hogrefe, Aaby, O’Conner, and Fye.
4
CRUISE STATISTICS:
Nihoa Necker FFS
Transits Totals Comments SST buoys deployed 0 1 1 2 FFS buoy is a moored ATI
Drifter replacement. SST buoys recovered 0 0 1 1 Necker SST not present.
STR deployed 0 1 1 2 Deployments associated with Necker SST and FFS CREWS.
CREWS deployed 0 0 1 1
CREWS recovered 0 0 1 1
ODP deployed 0 1 0 1
ODP recovered 0 1 0 1
SPMD deployed 0 0 2 2 Both deployed at one site.
Shallow water CTDs 0 1 1 2
TOAD transects 0 0 4 4
Multibeam Coverage, sq. km
78.5 8.6 284.5* not yet totaled
370.7
Hi’ialakai: Multibeam survey days.
3 2 11 3 19
Hi’ialakai: CTDs
R/V AHI: Multibeam survey days.
0 0 11 11
R/VAHI: CTDs 0 0
* Includes East Brooks Bank MISSIONS AND RESULTS: A. Delineate the 25-fathom isobath of the banks surrounding Nihoa Island.
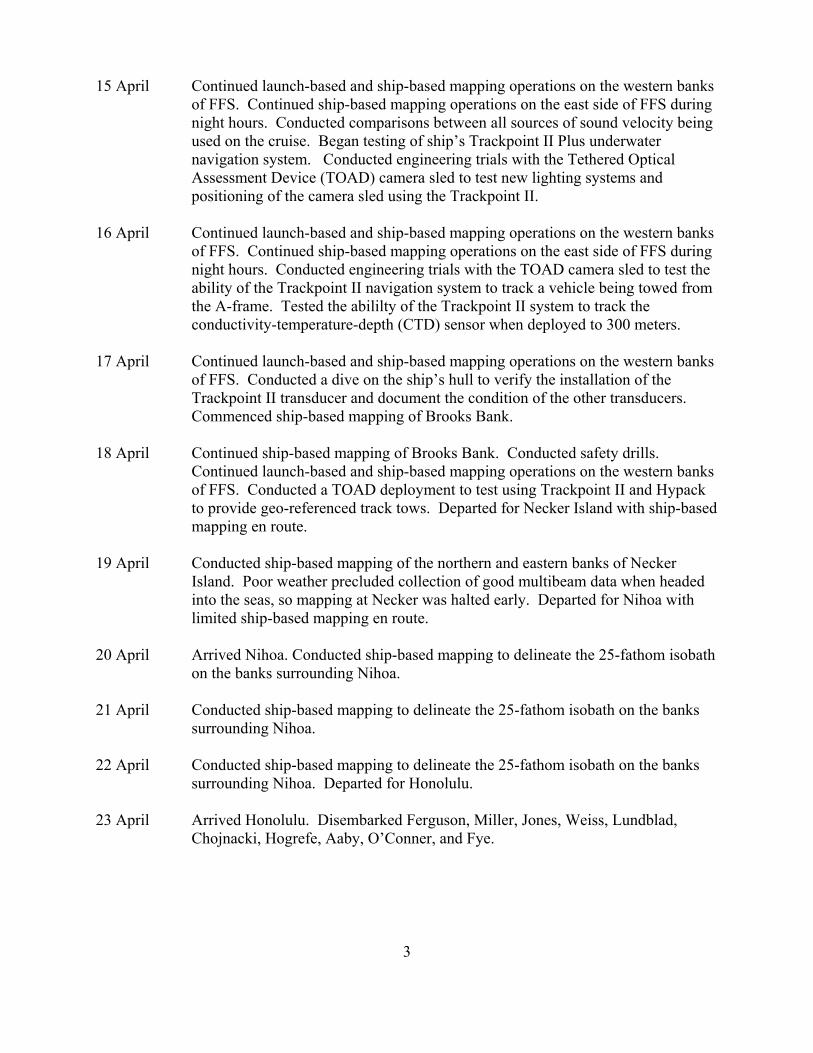
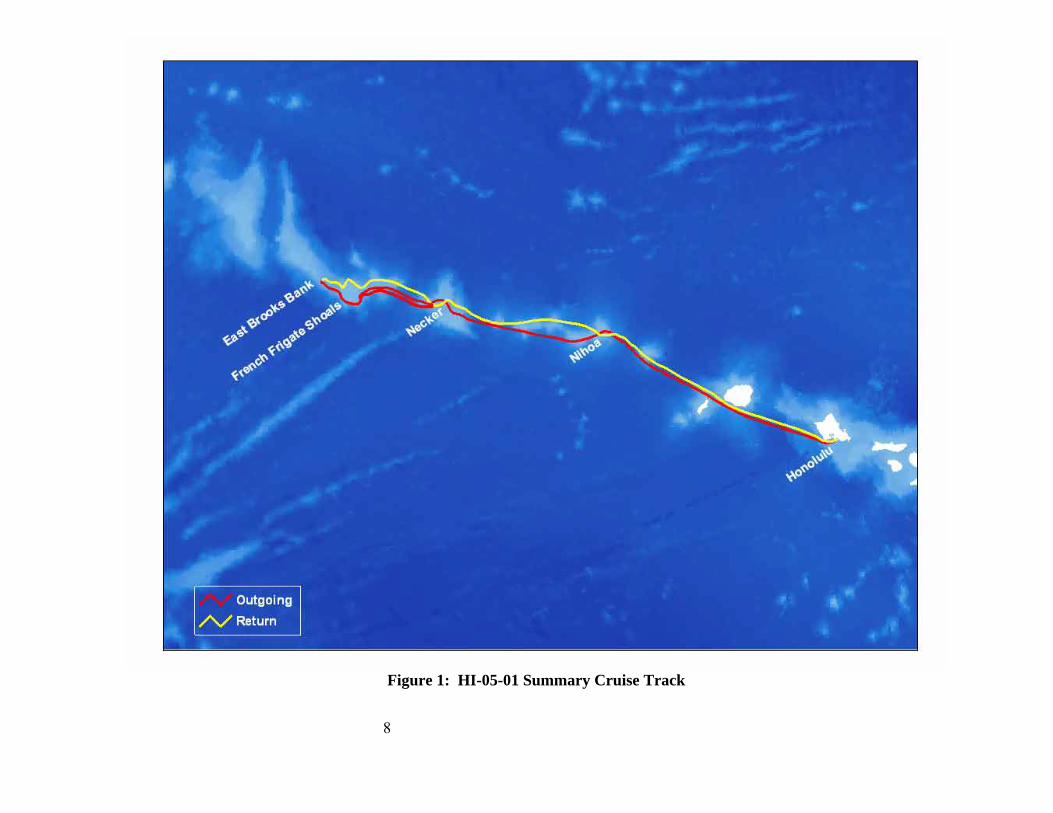
1. Two days of surveys were conducted at Nihoa to delineate the 25-fathom isobath. In addition to the isobath surrounding Nihoa, one area shoaler than 25 fathoms was identified to the north of Nihoa and one small pinnacle shoaler than 25 fathoms was identified on the eastern portion of the bank. The size of the bank precluded surveying the entire area, but soundings on the existing nautical charts were used to guide work performed and all areas with charted soundings shoaler than 28 fathoms were investigated. Two hundred thirty-eight sq. km of bank top was surveyed with approximately one-third of the area being covered by the multibeam swath, yielding survey coverage of 78.5 sq. km. Figure 2 shows the multibeam coverage and the approximate location of the 25-fathom (45.7 meter) isobath at Nihoa.
5
B. Conduct benthic habitat mapping of the reefs and submerged banks surrounding French Frigate Shoals and Necker Island using ship-based and launch-based multibeam echosounders and underwater towed cameras.
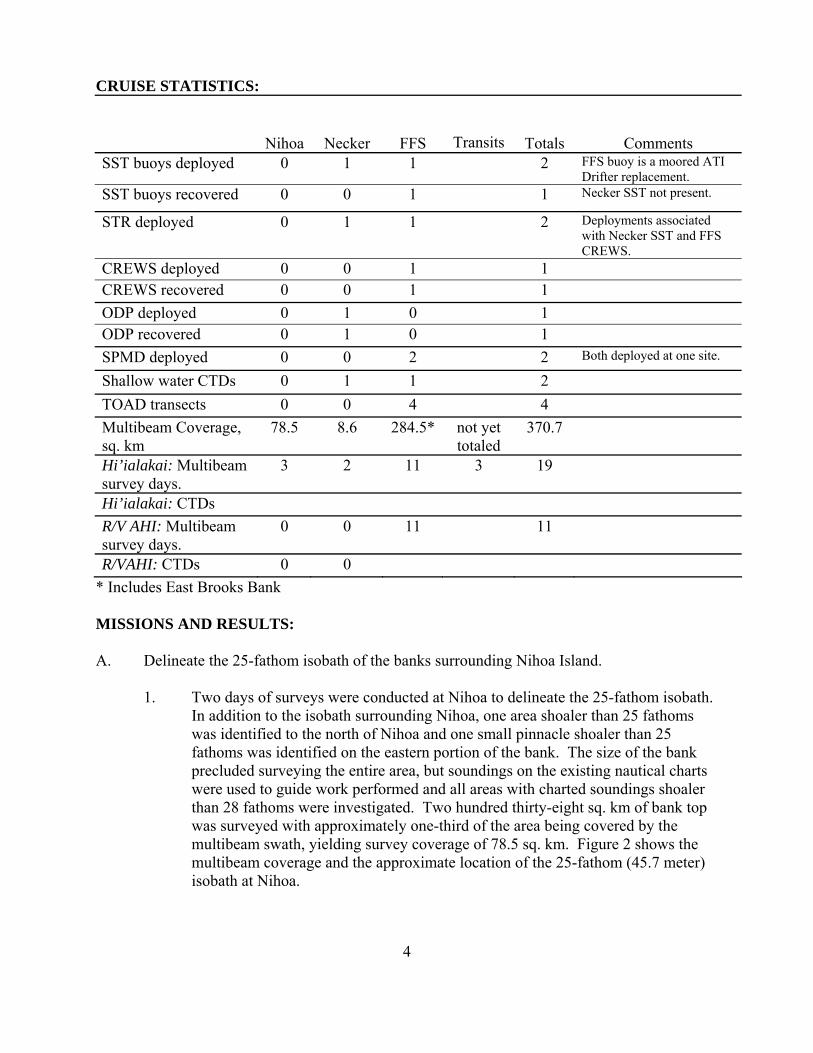
1. Eleven days of surveys were conducted on the banks surrounding FFS. Almost
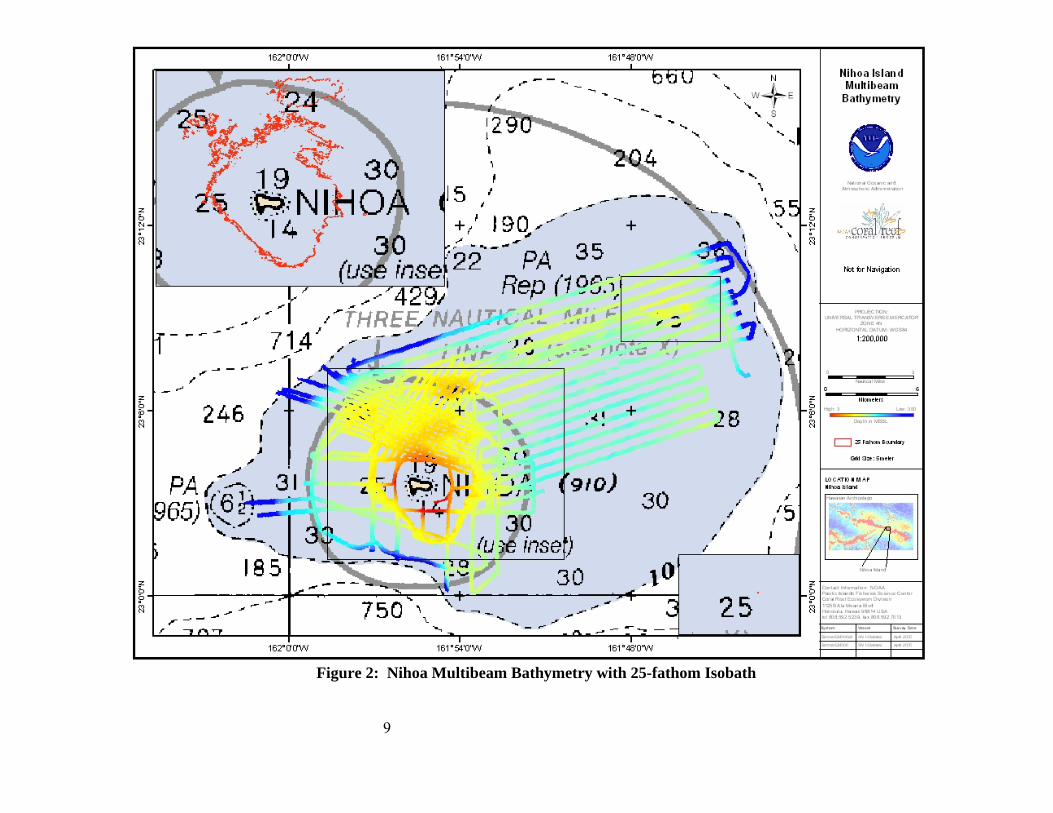
complete coverage was achieved in a 207-sq. km area on the western bank in water depths between 20 and 100 meters. In addition, data were acquired to fill most of the gaps between data acquired at 25 and 100 fathoms by the Kilo Moana in 2002. Figure 3 shows the multibeam coverage of the western bank of French Frigate Shoals. Other survey work was conducted to complete coverage between 100 and 500 meters.
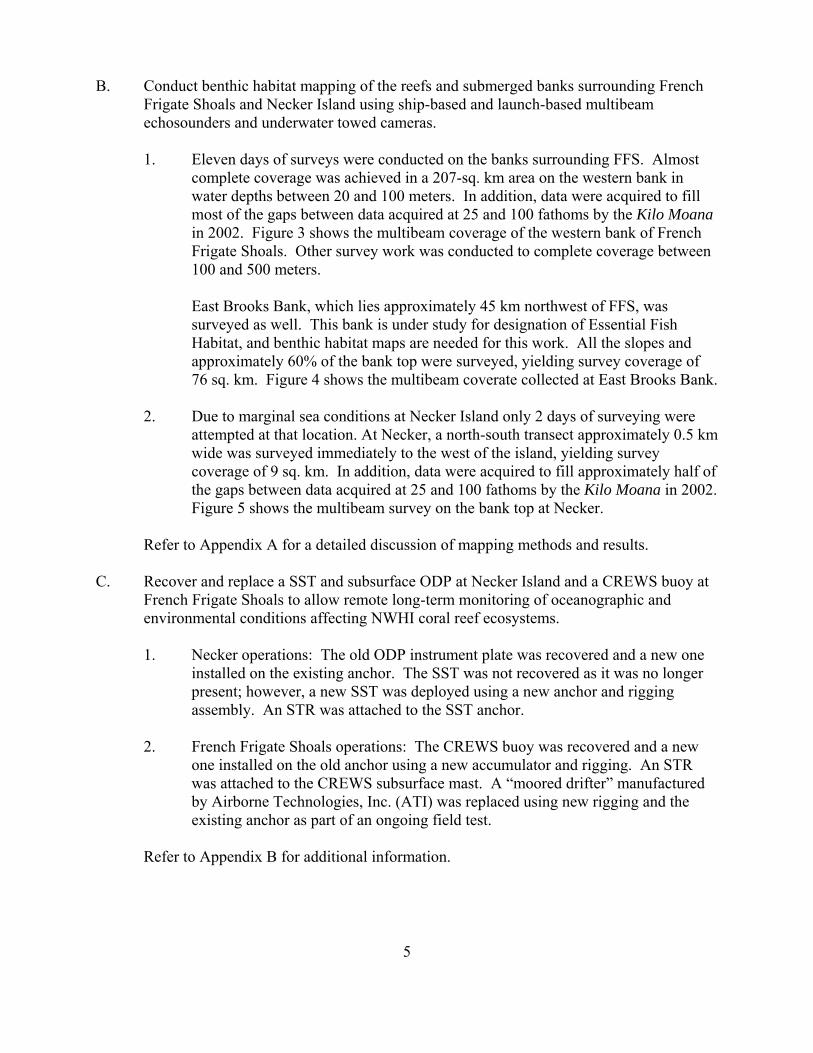
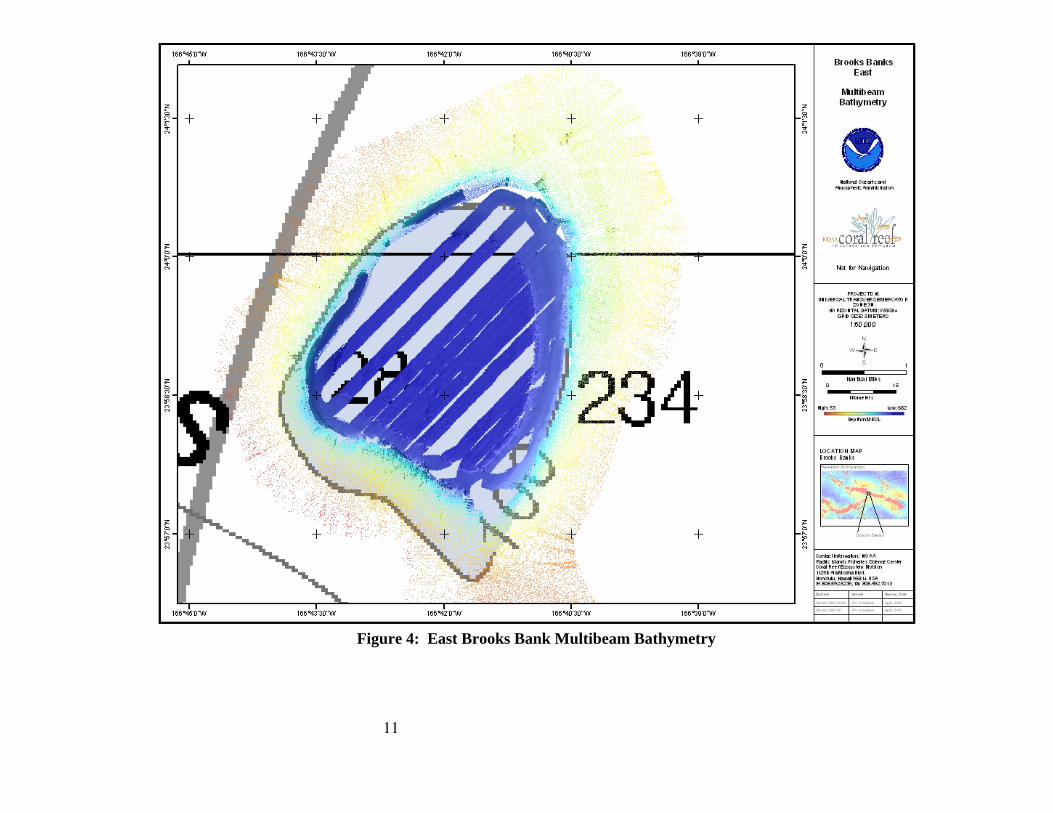
East Brooks Bank, which lies approximately 45 km northwest of FFS, was surveyed as well. This bank is under study for designation of Essential Fish Habitat, and benthic habitat maps are needed for this work. All the slopes and approximately 60% of the bank top were surveyed, yielding survey coverage of 76 sq. km. Figure 4 shows the multibeam coverate collected at East Brooks Bank.
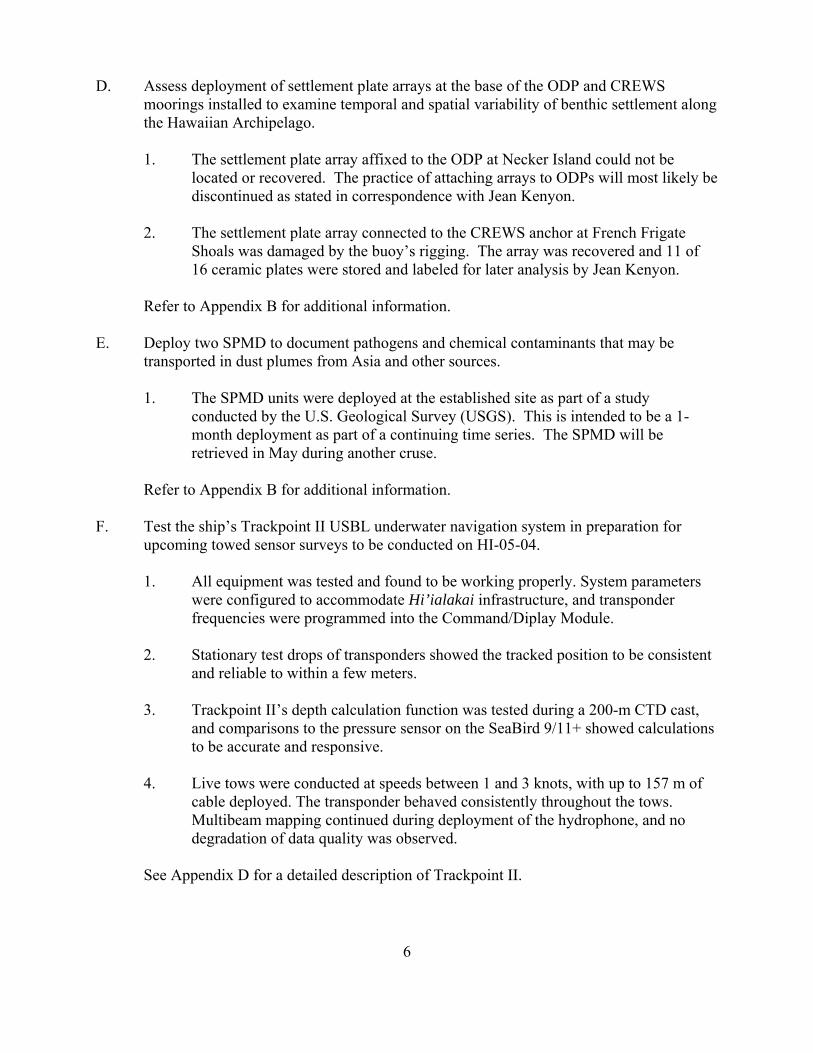
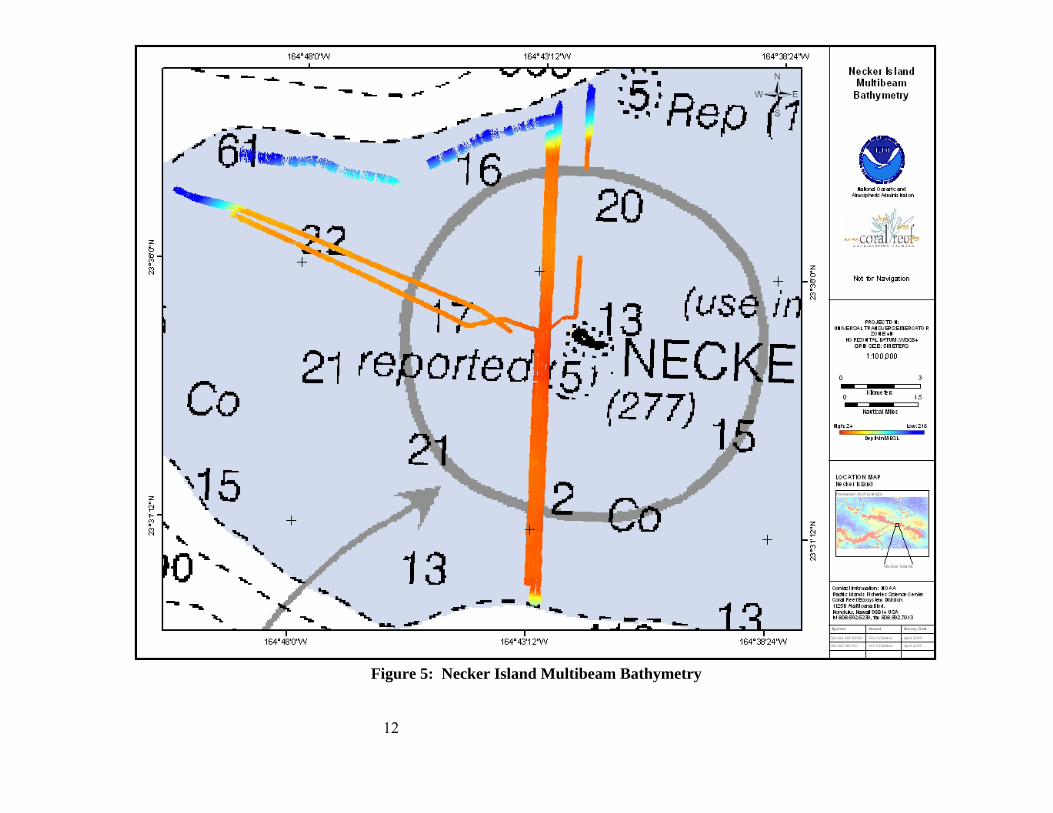
2. Due to marginal sea conditions at Necker Island only 2 days of surveying were attempted at that location. At Necker, a north-south transect approximately 0.5 km wide was surveyed immediately to the west of the island, yielding survey coverage of 9 sq. km. In addition, data were acquired to fill approximately half of the gaps between data acquired at 25 and 100 fathoms by the Kilo Moana in 2002. Figure 5 shows the multibeam survey on the bank top at Necker.
Refer to Appendix A for a detailed discussion of mapping methods and results.
C. Recover and replace a SST and subsurface ODP at Necker Island and a CREWS buoy at
French Frigate Shoals to allow remote long-term monitoring of oceanographic and environmental conditions affecting NWHI coral reef ecosystems.
1. Necker operations: The old ODP instrument plate was recovered and a new one
installed on the existing anchor. The SST was not recovered as it was no longer present; however, a new SST was deployed using a new anchor and rigging assembly. An STR was attached to the SST anchor.
2. French Frigate Shoals operations: The CREWS buoy was recovered and a new
one installed on the old anchor using a new accumulator and rigging. An STR was attached to the CREWS subsurface mast. A “moored drifter” manufactured by Airborne Technologies, Inc. (ATI) was replaced using new rigging and the existing anchor as part of an ongoing field test.
Refer to Appendix B for additional information.
6
D. Assess deployment of settlement plate arrays at the base of the ODP and CREWS moorings installed to examine temporal and spatial variability of benthic settlement along the Hawaiian Archipelago.
1. The settlement plate array affixed to the ODP at Necker Island could not be
located or recovered. The practice of attaching arrays to ODPs will most likely be discontinued as stated in correspondence with Jean Kenyon.
2. The settlement plate array connected to the CREWS anchor at French Frigate
Shoals was damaged by the buoy’s rigging. The array was recovered and 11 of 16 ceramic plates were stored and labeled for later analysis by Jean Kenyon.
Refer to Appendix B for additional information. E. Deploy two SPMD to document pathogens and chemical contaminants that may be
transported in dust plumes from Asia and other sources.
1. The SPMD units were deployed at the established site as part of a study conducted by the U.S. Geological Survey (USGS). This is intended to be a 1- month deployment as part of a continuing time series. The SPMD will be retrieved in May during another cruse.
Refer to Appendix B for additional information. F. Test the ship’s Trackpoint II USBL underwater navigation system in preparation for
upcoming towed sensor surveys to be conducted on HI-05-04.
1. All equipment was tested and found to be working properly. System parameters were configured to accommodate Hi’ialakai infrastructure, and transponder frequencies were programmed into the Command/Diplay Module.
2. Stationary test drops of transponders showed the tracked position to be consistent
and reliable to within a few meters. 3. Trackpoint II’s depth calculation function was tested during a 200-m CTD cast,
and comparisons to the pressure sensor on the SeaBird 9/11+ showed calculations to be accurate and responsive.
4. Live tows were conducted at speeds between 1 and 3 knots, with up to 157 m of
cable deployed. The transponder behaved consistently throughout the tows. Multibeam mapping continued during deployment of the hydrophone, and no
degradation of data quality was observed.
See Appendix D for a detailed description of Trackpoint II.
7
SCIENTIFIC PERSONNEL: Scott Ferguson, Engineer/Manager, Joint Institute for Marine and Atmospheric Research (JIMAR), University of Hawaii (UH), Pacific Islands Fishery Science Center (PIFSC), Coral Reef Ecosystem Division (CRED) Joyce Miller, Oceanographer, JIMAR, UH, PIFSC, CRED Jeremey Jones, Marine Ecosytstem Specialist, JIMAR, UH, PIFSC, CRED Joe Chojnacki, Marine Ecosystem Specialist, JIMAR, UH, PIFSC, CRED Kyle Hogrefe, Marine Ecosystem Specialist, JIMAR, UH, PIFSC, CRED Jonathan Weiss, Seabed Mapping Specialist, JIMAR, UH, PIFSC, CRED Emily Lundblad, GIS Specialist, JIMAR, UH, PIFSC, CRED Allie Aaby, Mapping Specialist, JIMAR, UH, Hawaii Mapping Research Group Rob O’Conner, GIS Specialist, JIMAR, UH, Pacific Islands Regional Office Andrew Rapp, Survey Technician, NOAA Ship Hi’ialakai Jeremy Taylor, Ordinary Seaman, NOAA Ship Hi’ialakai John Shannon Byrne, Senior Engineer, SAIC John Kiernan, Systems Engineer, SAIC DATA COLLECTED: High-resolution multibeam bathymetry and acoustic backscatter imagery from ship-based
Kongsberg EM300 and EM3002D sonars High-resolution multibeam bathymetry and acoustic backscatter imagery from launch-based
RESON 8101 sonar Acoustic Doppler Current Profile (ADCP) data Videos of the seafloor from TOAD operations CTD profiles of varying depths Conductivity and temperature data from Seabird SBE37s retrieved from French Frigate Shoals
CREWS and Necker ODP Submitted by: _______________________________________ J. Scott Ferguson Chief Scientist Approved by: _______________________________________
David Kennedy CRCP Matrix Manager
Attachments
8
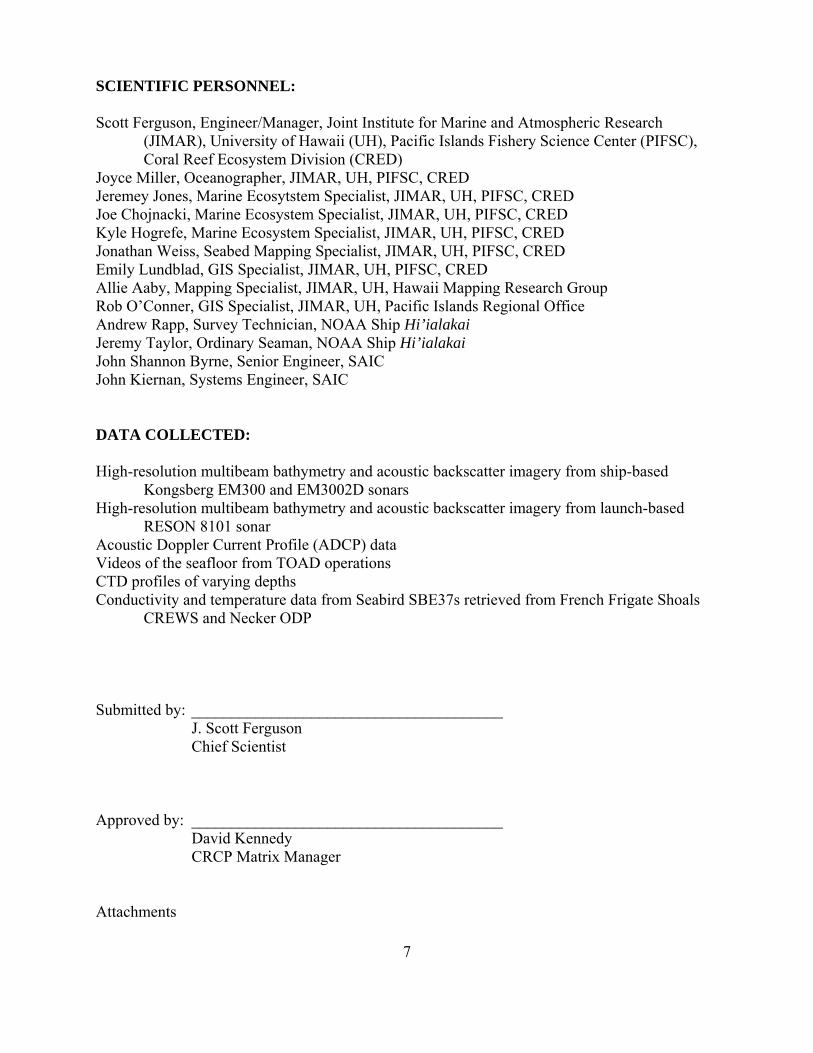
Figure 1: HI-05-01 Summary Cruise Track
9
Figure 2: Nihoa Multibeam Bathymetry with 25-fathom Isobath
10
Figure 3: French Frigate Shoals Multibeam Bathymetry
11
Figure 4: East Brooks Bank Multibeam Bathymetry
12
Figure 5: Necker Island Multibeam Bathymetry
13
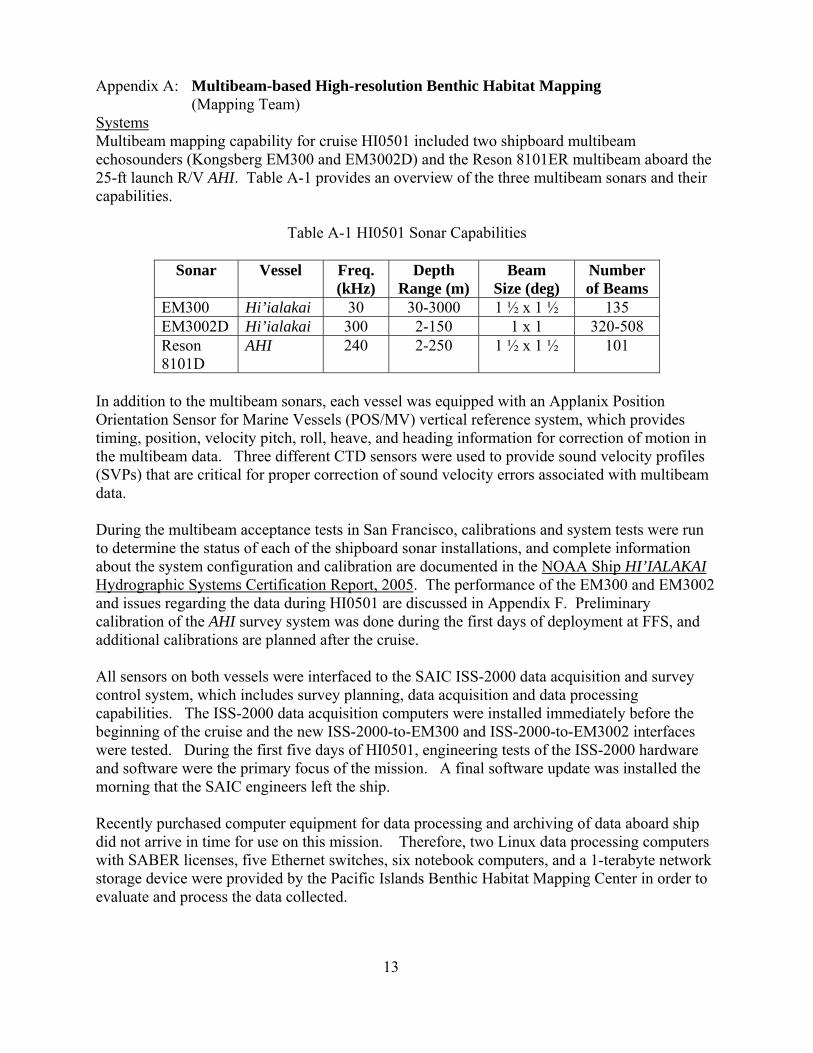
Appendix A: Multibeam-based High-resolution Benthic Habitat Mapping (Mapping Team) Systems Multibeam mapping capability for cruise HI0501 included two shipboard multibeam echosounders (Kongsberg EM300 and EM3002D) and the Reson 8101ER multibeam aboard the 25-ft launch R/V AHI. Table A-1 provides an overview of the three multibeam sonars and their capabilities.
Table A-1 HI0501 Sonar Capabilities
Sonar Vessel Freq. (kHz)
Depth Range (m)
Beam Size (deg)
Number of Beams
EM300 Hi’ialakai 30 30-3000 1 ½ x 1 ½ 135 EM3002D Hi’ialakai 300 2-150 1 x 1 320-508 Reson 8101D
AHI 240 2-250 1 ½ x 1 ½ 101
In addition to the multibeam sonars, each vessel was equipped with an Applanix Position Orientation Sensor for Marine Vessels (POS/MV) vertical reference system, which provides timing, position, velocity pitch, roll, heave, and heading information for correction of motion in the multibeam data. Three different CTD sensors were used to provide sound velocity profiles (SVPs) that are critical for proper correction of sound velocity errors associated with multibeam data. During the multibeam acceptance tests in San Francisco, calibrations and system tests were run to determine the status of each of the shipboard sonar installations, and complete information about the system configuration and calibration are documented in the NOAA Ship HI’IALAKAI Hydrographic Systems Certification Report, 2005. The performance of the EM300 and EM3002 and issues regarding the data during HI0501 are discussed in Appendix F. Preliminary calibration of the AHI survey system was done during the first days of deployment at FFS, and additional calibrations are planned after the cruise. All sensors on both vessels were interfaced to the SAIC ISS-2000 data acquisition and survey control system, which includes survey planning, data acquisition and data processing capabilities. The ISS-2000 data acquisition computers were installed immediately before the beginning of the cruise and the new ISS-2000-to-EM300 and ISS-2000-to-EM3002 interfaces were tested. During the first five days of HI0501, engineering tests of the ISS-2000 hardware and software were the primary focus of the mission. A final software update was installed the morning that the SAIC engineers left the ship. Recently purchased computer equipment for data processing and archiving of data aboard ship did not arrive in time for use on this mission. Therefore, two Linux data processing computers with SABER licenses, five Ethernet switches, six notebook computers, and a 1-terabyte network storage device were provided by the Pacific Islands Benthic Habitat Mapping Center in order to evaluate and process the data collected.
14
Methods Prior to the HI0501, data were assembled to provide a baseline for acquisition of multibeam data. These data included: grids of multibeam bathymetry data from previous cruises to the NWHI from the Bathymetric Atlas of the NWHI; IKONOS imagery and derived depths; predicted tides from Midway and Nawiliwili, Kauai; tide zones (provided by NOAA Center for Operational Oceanographic Products and Services); and preliminary survey plans. These data were integrated into the ISS-2000 software either before or during the first part of the cruise. In addition, existing grids, bottom photographic and tow location data from 2001-2004 cruises were assembled and integrated into the Arc 9 Geographic Information System (GIS). The ISS-2000 survey system is used on both the ship and the launch, enabling seamless sharing of data between the two vessels. The Generic Sensor Format (GSF), which is implemented in the ISS-2000 system, allows logging of multibeam data from a variety of multibeam sonars into a single, standardized format; the GSF also provides integrated metadata within the real-time multibeam files. In addition, the ISS-2000 creates digital message logs that allow full traceability of software and real-time events. During system configuration, all vessel offsets are entered into either the POS/MV, the sonar, or into the ISS-2000. In addition, predicted tides are calculated for all tide zones to be surveyed and then recorded into the data in real time. Survey plans can be loaded into the real-time system on both vessels; coverage grids that are generated in real time during data acquisition can be viewed during planning, acquisition, and processing phases. SVPs are taken at least every 12 hours on the ship and every 4 hours on the AHI. Standardized survey procedures, including a 2-minute warm up on deck and a 2-minute surface equilibration, are used on every cast. After the sound velocity cast is done, the data are downloaded with VelocWin software on the ship and with the SeaBird software on the launch. Sound velocity profiles are loaded using the ISS-2000 download utility; the downloaded profiles are sent to the two Kongsberg sonars on the ship and to the Reson sonar on the AHI, and the sound velocity information is logged as a part of the GSF. A real-time probe is used on the ship to monitor the surface sound velocity; if a difference between the SSV and the SVP at the surface is greater than 3 m/sec, an alarm is generated. The sonar on the AHI is less susceptible to SSV errors, and the 4-hour casts are generally sufficient to correct for sound velocity. In all cases, the data are carefully monitored for sound velocity artifacts using the real-time displays. During real-time operations, the ISS-2000 operator starts the ISS-2000 software, making sure to load the appropriate system configuration file. The System Control and Message windows are loaded at that time. The operator creates a dataset for the entire cruise that is named with the corresponding cruise delineator; Hi’ialakai and AHI data were logged into separate datasets (HI0501 and AHI0501) for file management purposes. After the dataset is created and all configurations are checked, “Start Survey” is selected and the Navigation Manager, Multibeam Manager, and Helm Display windows are opened. Text icons for all programs appear in the System Control window; the icons can be colored white, yellow, red, or green. White means that the program is selected but not activated; yellow means the program is activated but not logging; red means that there is a problem with the program; and green means that the program is operating and data are being logged. Files are automatically created for all multibeam sensors, for navigation inputs, for the POS/MV vertical reference, and for the messages generated by the
15
system. Predicted tide files that can be used throughout 2005 were prepared before the cruise and were applied to the multibeam data in real time. (Note, real-time tides were implemented a few days into the cruise, but all data collected prior to the implementation were corrected for tides in post-processing.) After the ISS-2000 Navigation Manager is started, a survey plan created is chosen and one or more surveys are selected for execution. Tide zones, existing coverage grids, and navigational charts can be loaded into the display, if desired. The navigated ship icon appears on the screen. Survey lines are then selected from the survey file and loaded into a Survey Schedule; lines can be selected in any order and their azimuth can be reversed; these lines appear on the screen when loaded into the schedule. When survey lines are being run in Survey Mode, the multibeam data is almost always logged (if logging is activated), but may be flagged as either “on-line” or “off-line.” During transits, survey can be done in the “Underway Mode,” but a flag must be set to not flag the off-line data during transits. If a coverage grid is loaded using the Coverage Monitor program and enabled for real-time logging, multibeam data is added to the coverage grid in real-time. The Helm Display is also activated when the survey is started. This Helm Display appears both on the survey lab screens and on a screen on the bridge, and screen display parameters can be manipulated at either location. The same coverage grids, navigation charts, and survey lines selected in the Navigation Manager interface appear on the Helm Display as well; however, the display of these grids, charts, and lines can be turned on and off in the Helm Display independently of the Navigation Manager. The Helm Display can also be changed to different scales and color schemes than what is displayed on the Navigation Manager. The new ISS-2000 feature, display of the coverage grids on the Helm Manager, enabled the bridge to steer lines in underway mode based upon existing coverage rather than always needing to create a formal survey line for the bridge to follow. The Multibeam Manager is used to monitor the status of data files, to view and apply SVPs, and to view the multibeam bathymetry and backscatter data in real time. Many problems with the data can be detected immediately using feedback from these real-time displays. The Kongsberg SIS interfaces for the EM300 and the EM3002 are mounted above the two ISS-2000 screens and other multibeam displays that provide different views of the data are available through SIS. Backscatter displays for all systems showed distinct and intriguing bottom types, but the ultimate quality of the data from the different sonars cannot be evaluated until data processing is complete. During HI0501 aboard ship, multibeam data were collected continuously, except during transits when the water depths were greater than the 3000-m range of the EM3000. In general EM3002 data were collected in water depths less than 100 m and the EM300 was used for depths greater than 100 m; however, both sonars were often run in shallow water. The AHI was deployed for 11 days at FFS and operated from 0730 to 1630, and data collection was concentrated in depths between 20 and 100 m; some depths shallower than 20 m were also mapped.
16
HI0501 data were logged to two disks simultaneously in real time; these disks will be cleared after each cruise. The ISS-2000 AutoArchive program, which copies the data to a third permanent archive disk was run at least twice daily. The AHI0501 dataset was logged on the real-time computer in the launch, and a second copy of the data was manually made on a portable disk; the disk was then moved to the ship and connected to the shipboard computers, and the data were read to the permanent archive disk. A final copy of all data was made to the PIBHMC network disks (ahi10), and data processing was done on only this copy of the data. The SABER data processing package, which provides full multibeam processing capability, was primarily used to manually edit the multibeam data in GSF, to plot tracklines, to update SVPs and tide data when necessary, and to create gridded data sets using the Pure File Magic (PFM) format that enables editing the integrated data set within the grid as well as reading any edits made in the grid back to the GSF multibeam files. Daily tape backups of all processed data were made. Backscatter data are logged as part of the GSF multibeam file and will be processed at PIBHMC after return to Honolulu. Results Multibeam data were collected in ~15 to 3000-m water depths between Nihoa Island and Brooks Banks E. Areas mapped include Nihoa, transit data between Nihoa and Necker, Necker, transit data between Necker and FFS including “Bank 66,” FFS, and Brooks Banks E including transit data. Table A-1 provides an approximate estimate of area mapped.
Table A-2
Area Mapped Depths (m) Survey Days
Coverage (sq. km)
Nihoa 30 to 150 2.0 78.5 Necker 20 to 150 1.0 8.6 FFS 15 to 200 11.0 207.1 Brooks Banks East 60 to 200 0.5 76.4 Total 14.5 370.7 Mapping during Transits 200 to 3000 3.5 not yet totaled A top priority for the cruise was to delineate the 25-fm (45.7 m) isobath at Nihoa Island; this boundary is important for managers of the Northwestern Hawaiian Islands Coral Reef Ecosystem Reserve (NWHICRER) as part of the ongoing sanctuary designation process. Figure 2 shows the multibeam coverage collected during HI0501 and the approximate 25-fm isobath as calculated from these data. There are several reasons that FFS was selected for detailed mapping during this first Hi’ialakai mapping cruise: (1) FFS is an important center for several protected species, including the Hawaiian monk seal and the green sea turtle; (2) it is considered to be a genetic “gateway” within the NWHI, and extensive genetic studies are underway; (3) excellent IKONOS imagery exists in the shallow northern FFS bank, and this imagery and resulting benthic habitat
17
interpretations can be compared with the multibeam data; (4) FFS is visited for 3-4 days on annual or biannual NWHI-RAMP cruises; (5) since 2001, bottom photographs have been collected annually and these bottom photographs provide ground-truth information that will help to interpret bathymetric and backscatter maps. The bottom at FFS was varied and interesting with numerous 5-10-m high pinnacles, distinct backscatter signatures, and an apparent wide variety of bottom types. Coverage of the FFS bank in 20-100 m is approximately 95% complete south of La Perouse Pinnacle. A small area north of La Perouse Pinnacle could still be mapped, but only using the AHI due to restricted maneuvering and some shoal depths. Figure 3 shows multibeam coverage on the shallow bank surrounding FFS. Data were also collected around the sides of the FFS bank to fill in gaps between 25- and 100-fm multibeam lines from a previous multibeam boundary mapping cruise. A secondary priority for mapping was the bank surrounding Necker Island. A previous multibeam mapping cruise had completely delineated the 25- and 100-fm boundaries for the NWHI CRER, but gaps between the boundaries remained and the extensive bank shallower than 25 fm has not been mapped. During transits we were able to fill approximately 50% of the gap between the 25- and 100-fm boundaries, but poor sea conditions limited our operations there during the transits. During the daylight buoy operations at Necker when better conditions prevailed, the ship needed to stay within 3 miles of the dive boat; thus several short north-south lines in the vicinity of the dive site were run. During transits and night-time operations, we were also able to map two small seamounts, Seamount 66 and Brooks Banks E, where several submersible dives have been conducted in the past several years. Both banks are being studied by a number of management agencies to designate Essential Fish Habitat and benthic habitat maps needed for this work. Multibeam bathymetry but not backscatter data were available, but these data are from an older multibeam system that is not designed for operation on shallow banks such as these, and the data are not of high enough quality to allow generation of a benthic habitat map. Thus we decided to collect higher resolution bathymetric and backscatter data as time allowed to enable collaborating scientists to produce benthic habitat maps of these important fishing banks. Excellent data were collected on Brooks Bank but the weather was inclement during the Bank 66 survey, resulting in an incomplete survey.
18
Appendix B: Mooring Deployments and Oceanographic Data Collection (Kyle Hogrefe, Joe Chojnacki, Jeremey Jones)
Monitoring and Assessment Methods The Coral Reef Ecosystem Division has been conducting multidisciplinary research cruises in the Northwest Hawaiian Islands (NWHI) since the NOWRAMP 2000 in an ongoing effort to monitor long-term ecological trends and assess oceanographic conditions. On HI0501, the mooring team efforts focused on the maintenance of the oceanographic instrumentation system established to accomplish this goal. Long-term oceanographic monitoring and assessment is accomplished by deployment and retrieval of a variety of internally recording and telemetered instrument platforms. These instruments include:
1. Coral Reef Early Warning System (CREWS) buoys: Surface buoys which measure solar radiation, air temperature, wind speed and direction, sea surface temperature, salinity, turbidity, and (on enhanced models) photosynethtically active chlorophyll. CREWS buoys telemeter a portion of their collected data in near real time.
2. Sea Surface Temperature (SST) buoys: Surface buoys which measure high resolution water temperature telemeter their data in near real time.
3. Wave and Tide Recorders (WTR): Moored instruments which measure spectral wave energy, precision tidal elevation, and subsurface water temperature.
4. Ocean Data Platforms (ODP): Moored instruments which measure subsurface temperature, salinity, directional spectral wave energy, precision tidal elevation, and current profiles.
5. Subsurface Temperature Recorders (STR): Moored instruments which measure high resolution subsurface temperatures.
6. Satellite Drifters: Free floating, drogued (Lagrangian) devices which provide surface layer circulation and water temperature data. Satellite drifters telemeter their data in near real time.
NOTE: Satellite Drifters were not deployed on this cruise.
7. Recruitment Plate Arrays: An arrangement of ceramic tiles embedded in a PVC framework and affixed to both CREWS buoy and ODP anchors. These arrays are deployed to support studies by Jean Kenyon and are intended to monitor the recruitment patterns of coral species.
Oceanographic assessments in the NWHI are accomplished by:
1. Shallow Water CTD casts (max 100 feet), including turbidity measurements, are performed using a SBE 19+ at regularly spaced intervals around each island/atoll/shoal.
19
These casts sample vertical water profiles of water properties providing indications for water mass movement and local sea water chemistry changes.
2. Shallow Water Radiometer casts are performed as a subset of the shallow-water CTD casts using a Biospherical PRR2600 profiling unit and PRR2610 deck unit. The PRR 2600 measures both downwelling irradiance and upwelling radiance which infers the concentration of photosynthetically active chlorophyll in the water column. The PRR 2610 measures the ambient solar radiation, which can vary depending on cloud cover, at the time of the cast.
3. Water sample collection casts are conducted as a subset of the shallow water CTD/Radiometer casts. Water samples are collected using a hand deployed Niskin bottle at depths of 90, 60, 30 and 5 feet as allowed by the depth at each cast site. Water is collected for color decomposed organic matter (CDOM) and/or chlorophyll concentration sampling at each depth depending on the samples type(s) desired from each site.
4. Deep Water CTD casts (max 500 m) including fluorometry measurements are performed at evenly spaced intervals around each island/atoll/shoal and along an established transect running the length of the NWHI Archipelago. Water samples are collected at 150 m, 125 m, 100 m, 80 m and at the surface during each cast. These casts sample vertical water profiles of water properties providing indications for water mass movement, local sea water chemistry changes, and chlorophyll concentration.
Note: No shallow water radiometer casts or water sampling activities were conducted on this cruise. Both shallow water and deep water CTD casts were performed, but not to the depth or sampling density seen on NOWRAMP cruises. The primary purpose of these casts was to provide Surface Velocity Profiles (SVP) for sonar mapping activities and monitor for “salinity drift” in conductivity sensors on CREWS buoys and ODP arrays. However, these data may also be used for oceanographic assessment.
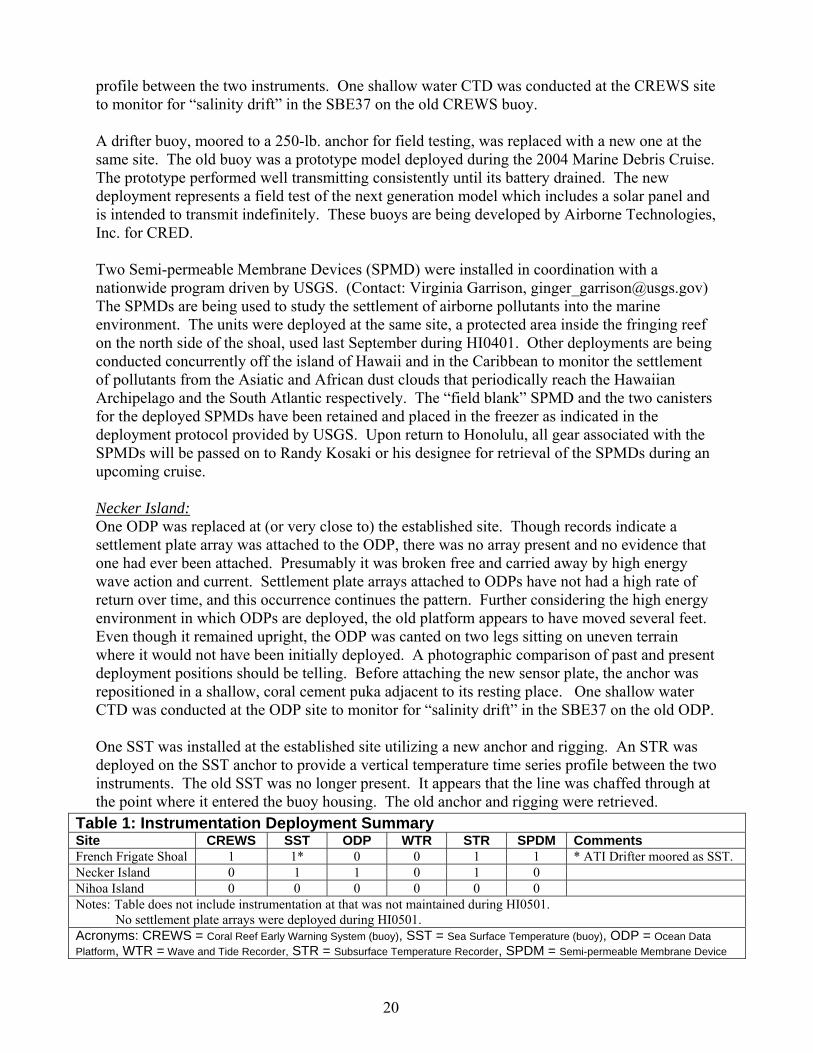
Oceanographic Data Collection and Instrumentation Results French Frigate Shoals: One CREWS buoy was replaced at the established site utilizing a new accumulator and the old anchor. The old CREWS buoy quit transmitting approximately 2 months previouly. The settlement plate array that was affixed to the CREWS anchor was damaged to the extent that it could not be reattached, as intended, after the buoy swap. Presumably, the damage was caused by movement of the accumulator as the buoy was subjected to wave action. Approximately 1 foot of chain was incorporated into the accumulator system even though the buoy is in ~ 26 feet of water (depending on tide) which is the design depth for the accumulator. This may have introduced too much slack into the system leading to more movement than intended. A new settlement plate array was not attached to the anchor. The plates that could be recovered have been labeled and stored in the ship’s freezer according to instructions provided by Jean Kenyon and they will be returned to her upon arrival in Honolulu. The STR that was present on the anchor was left in place and an additional STR was deployed on the CREWS subsurface mast to both assure a continuous temperature time series and provide a vertical temperature time series
20
profile between the two instruments. One shallow water CTD was conducted at the CREWS site to monitor for “salinity drift” in the SBE37 on the old CREWS buoy. A drifter buoy, moored to a 250-lb. anchor for field testing, was replaced with a new one at the same site. The old buoy was a prototype model deployed during the 2004 Marine Debris Cruise. The prototype performed well transmitting consistently until its battery drained. The new deployment represents a field test of the next generation model which includes a solar panel and is intended to transmit indefinitely. These buoys are being developed by Airborne Technologies, Inc. for CRED. Two Semi-permeable Membrane Devices (SPMD) were installed in coordination with a nationwide program driven by USGS. (Contact: Virginia Garrison, [email protected]) The SPMDs are being used to study the settlement of airborne pollutants into the marine environment. The units were deployed at the same site, a protected area inside the fringing reef on the north side of the shoal, used last September during HI0401. Other deployments are being conducted concurrently off the island of Hawaii and in the Caribbean to monitor the settlement of pollutants from the Asiatic and African dust clouds that periodically reach the Hawaiian Archipelago and the South Atlantic respectively. The “field blank” SPMD and the two canisters for the deployed SPMDs have been retained and placed in the freezer as indicated in the deployment protocol provided by USGS. Upon return to Honolulu, all gear associated with the SPMDs will be passed on to Randy Kosaki or his designee for retrieval of the SPMDs during an upcoming cruise. Necker Island: One ODP was replaced at (or very close to) the established site. Though records indicate a settlement plate array was attached to the ODP, there was no array present and no evidence that one had ever been attached. Presumably it was broken free and carried away by high energy wave action and current. Settlement plate arrays attached to ODPs have not had a high rate of return over time, and this occurrence continues the pattern. Further considering the high energy environment in which ODPs are deployed, the old platform appears to have moved several feet. Even though it remained upright, the ODP was canted on two legs sitting on uneven terrain where it would not have been initially deployed. A photographic comparison of past and present deployment positions should be telling. Before attaching the new sensor plate, the anchor was repositioned in a shallow, coral cement puka adjacent to its resting place. One shallow water CTD was conducted at the ODP site to monitor for “salinity drift” in the SBE37 on the old ODP. One SST was installed at the established site utilizing a new anchor and rigging. An STR was deployed on the SST anchor to provide a vertical temperature time series profile between the two instruments. The old SST was no longer present. It appears that the line was chaffed through at the point where it entered the buoy housing. The old anchor and rigging were retrieved.
Table 1: Instrumentation Deployment Summary Site CREWS SST ODP WTR STR SPDM Comments French Frigate Shoal 1 1* 0 0 1 1 * ATI Drifter moored as SST. Necker Island 0 1 1 0 1 0 Nihoa Island 0 0 0 0 0 0 Notes: Table does not include instrumentation at that was not maintained during HI0501. No settlement plate arrays were deployed during HI0501. Acronyms: CREWS = Coral Reef Early Warning System (buoy), SST = Sea Surface Temperature (buoy), ODP = Ocean Data Platform, WTR = Wave and Tide Recorder, STR = Subsurface Temperature Recorder, SPDM = Semi-permeable Membrane Device
21
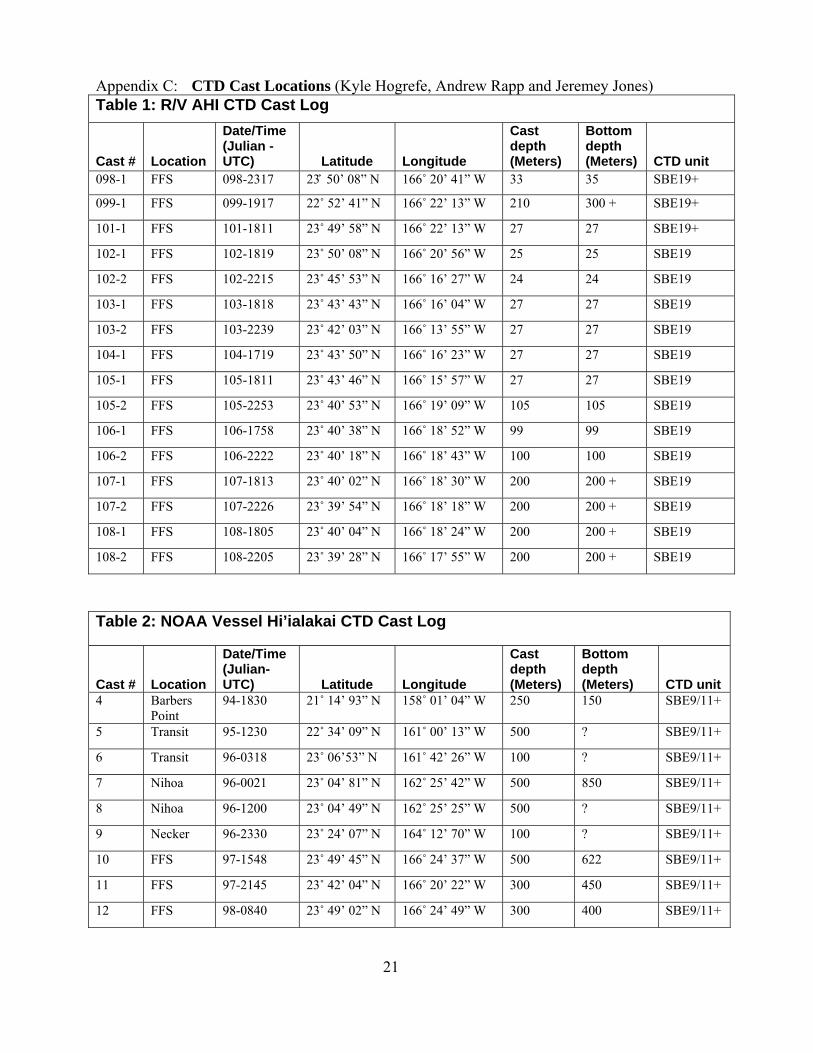
Appendix C: CTD Cast Locations (Kyle Hogrefe, Andrew Rapp and Jeremey Jones) Table 1: R/V AHI CTD Cast Log Cast #
Location
Date/Time (Julian - UTC)
Latitude
Longitude
Cast depth (Meters)
Bottom depth (Meters)
CTD unit
098-1 FFS 098-2317 23۫۫ 50’ 08” N 166˚ 20’ 41” W 33 35 SBE19+
099-1 FFS 099-1917 22˚ 52’ 41” N 166˚ 22’ 13” W 210 300 + SBE19+
101-1 FFS 101-1811 23˚ 49’ 58” N 166˚ 22’ 13” W 27 27 SBE19+
102-1 FFS 102-1819 23˚ 50’ 08” N 166˚ 20’ 56” W 25 25 SBE19
102-2 FFS 102-2215 23˚ 45’ 53” N 166˚ 16’ 27” W 24 24 SBE19
103-1 FFS 103-1818 23˚ 43’ 43” N 166˚ 16’ 04” W 27 27 SBE19
103-2 FFS 103-2239 23˚ 42’ 03” N 166˚ 13’ 55” W 27 27 SBE19
104-1 FFS 104-1719 23˚ 43’ 50” N 166˚ 16’ 23” W 27 27 SBE19
105-1 FFS 105-1811 23˚ 43’ 46” N 166˚ 15’ 57” W 27 27 SBE19
105-2 FFS 105-2253 23˚ 40’ 53” N 166˚ 19’ 09” W 105 105 SBE19
106-1 FFS 106-1758 23˚ 40’ 38” N 166˚ 18’ 52” W 99 99 SBE19
106-2 FFS 106-2222 23˚ 40’ 18” N 166˚ 18’ 43” W 100 100 SBE19
107-1 FFS 107-1813 23˚ 40’ 02” N 166˚ 18’ 30” W 200 200 + SBE19
107-2 FFS 107-2226 23˚ 39’ 54” N 166˚ 18’ 18” W 200 200 + SBE19
108-1 FFS 108-1805 23˚ 40’ 04” N 166˚ 18’ 24” W 200 200 + SBE19
108-2 FFS 108-2205 23˚ 39’ 28” N 166˚ 17’ 55” W 200 200 + SBE19
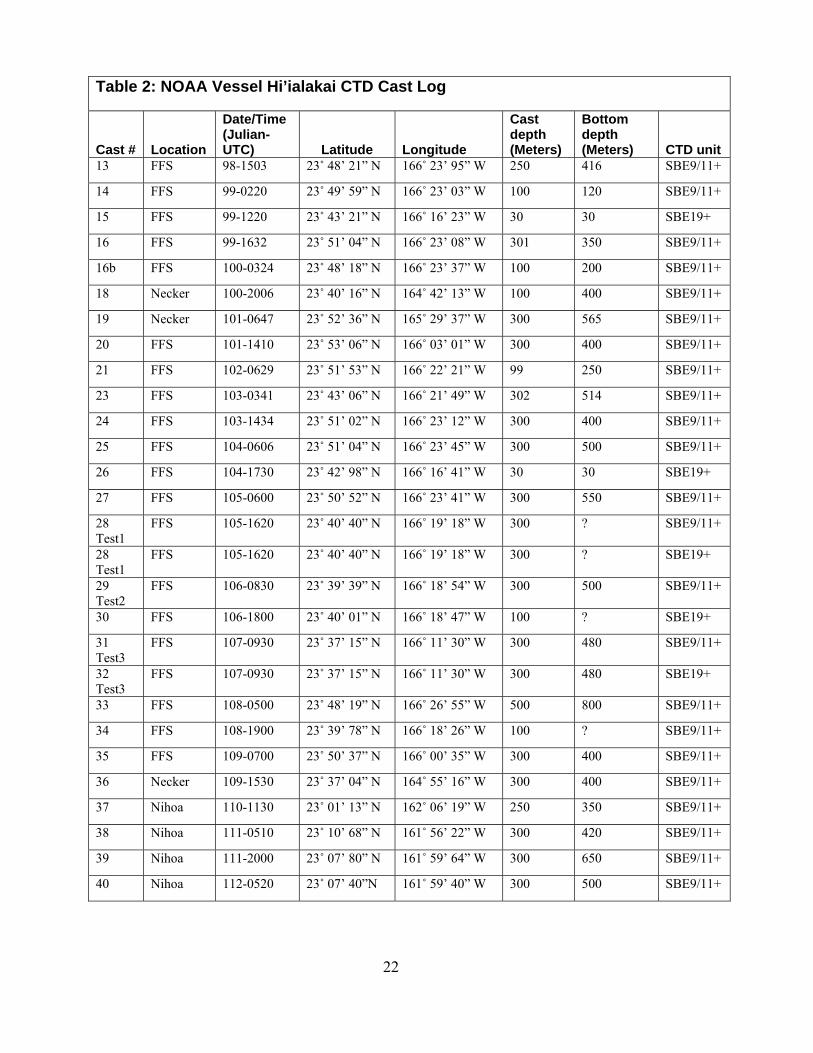
Table 2: NOAA Vessel Hi’ialakai CTD Cast Log Cast #
Location
Date/Time (Julian-UTC)
Latitude
Longitude
Cast depth (Meters)
Bottom depth (Meters)
CTD unit
4 Barbers Point
94-1830 21˚ 14’ 93” N 158˚ 01’ 04” W 250 150 SBE9/11+
5 Transit 95-1230 22˚ 34’ 09” N 161˚ 00’ 13” W 500 ? SBE9/11+ 6 Transit 96-0318 23˚ 06’53” N 161˚ 42’ 26” W 100 ? SBE9/11+ 7 Nihoa 96-0021 23˚ 04’ 81” N 162˚ 25’ 42” W 500 850 SBE9/11+ 8 Nihoa 96-1200 23˚ 04’ 49” N 162˚ 25’ 25” W 500 ? SBE9/11+ 9 Necker 96-2330 23˚ 24’ 07” N 164˚ 12’ 70” W 100 ? SBE9/11+ 10 FFS 97-1548 23˚ 49’ 45” N 166˚ 24’ 37” W 500 622 SBE9/11+ 11 FFS 97-2145 23˚ 42’ 04” N 166˚ 20’ 22” W 300 450 SBE9/11+ 12 FFS 98-0840 23˚ 49’ 02” N 166˚ 24’ 49” W 300 400 SBE9/11+
22
Table 2: NOAA Vessel Hi’ialakai CTD Cast Log Cast #
Location
Date/Time (Julian-UTC)
Latitude
Longitude
Cast depth (Meters)
Bottom depth (Meters)
CTD unit
13 FFS 98-1503 23˚ 48’ 21” N 166˚ 23’ 95” W 250 416 SBE9/11+ 14 FFS 99-0220 23˚ 49’ 59” N 166˚ 23’ 03” W 100 120 SBE9/11+ 15 FFS 99-1220 23˚ 43’ 21” N 166˚ 16’ 23” W 30 30 SBE19+
16 FFS 99-1632 23˚ 51’ 04” N 166˚ 23’ 08” W 301 350 SBE9/11+ 16b FFS 100-0324 23˚ 48’ 18” N 166˚ 23’ 37” W 100 200 SBE9/11+ 18 Necker 100-2006 23˚ 40’ 16” N 164˚ 42’ 13” W 100 400 SBE9/11+ 19 Necker 101-0647 23˚ 52’ 36” N 165˚ 29’ 37” W 300 565 SBE9/11+ 20 FFS 101-1410 23˚ 53’ 06” N 166˚ 03’ 01” W 300 400 SBE9/11+ 21 FFS 102-0629 23˚ 51’ 53” N 166˚ 22’ 21” W 99 250 SBE9/11+ 23 FFS 103-0341 23˚ 43’ 06” N 166˚ 21’ 49” W 302 514 SBE9/11+ 24 FFS 103-1434 23˚ 51’ 02” N 166˚ 23’ 12” W 300 400 SBE9/11+ 25 FFS 104-0606 23˚ 51’ 04” N 166˚ 23’ 45” W 300 500 SBE9/11+ 26 FFS 104-1730 23˚ 42’ 98” N 166˚ 16’ 41” W 30 30 SBE19+
27 FFS 105-0600 23˚ 50’ 52” N 166˚ 23’ 41” W 300 550 SBE9/11+ 28 Test1
FFS 105-1620 23˚ 40’ 40” N 166˚ 19’ 18” W 300 ? SBE9/11+
28 Test1
FFS 105-1620 23˚ 40’ 40” N 166˚ 19’ 18” W 300 ? SBE19+
29 Test2
FFS 106-0830 23˚ 39’ 39” N 166˚ 18’ 54” W 300 500 SBE9/11+
30 FFS 106-1800 23˚ 40’ 01” N 166˚ 18’ 47” W 100 ? SBE19+
31 Test3
FFS 107-0930 23˚ 37’ 15” N 166˚ 11’ 30” W 300 480 SBE9/11+
32 Test3
FFS 107-0930 23˚ 37’ 15” N 166˚ 11’ 30” W 300 480 SBE19+
33 FFS 108-0500 23˚ 48’ 19” N 166˚ 26’ 55” W 500 800 SBE9/11+ 34 FFS 108-1900 23˚ 39’ 78” N 166˚ 18’ 26” W 100 ? SBE9/11+ 35 FFS 109-0700 23˚ 50’ 37” N 166˚ 00’ 35” W 300 400 SBE9/11+ 36 Necker 109-1530 23˚ 37’ 04” N 164˚ 55’ 16” W 300 400 SBE9/11+ 37 Nihoa 110-1130 23˚ 01’ 13” N 162˚ 06’ 19” W 250 350 SBE9/11+ 38 Nihoa 111-0510 23˚ 10’ 68” N 161˚ 56’ 22” W 300 420 SBE9/11+ 39 Nihoa 111-2000 23˚ 07’ 80” N 161˚ 59’ 64” W 300 650 SBE9/11+ 40 Nihoa 112-0520 23˚ 07’ 40”N 161˚ 59’ 40” W 300 500 SBE9/11+
23
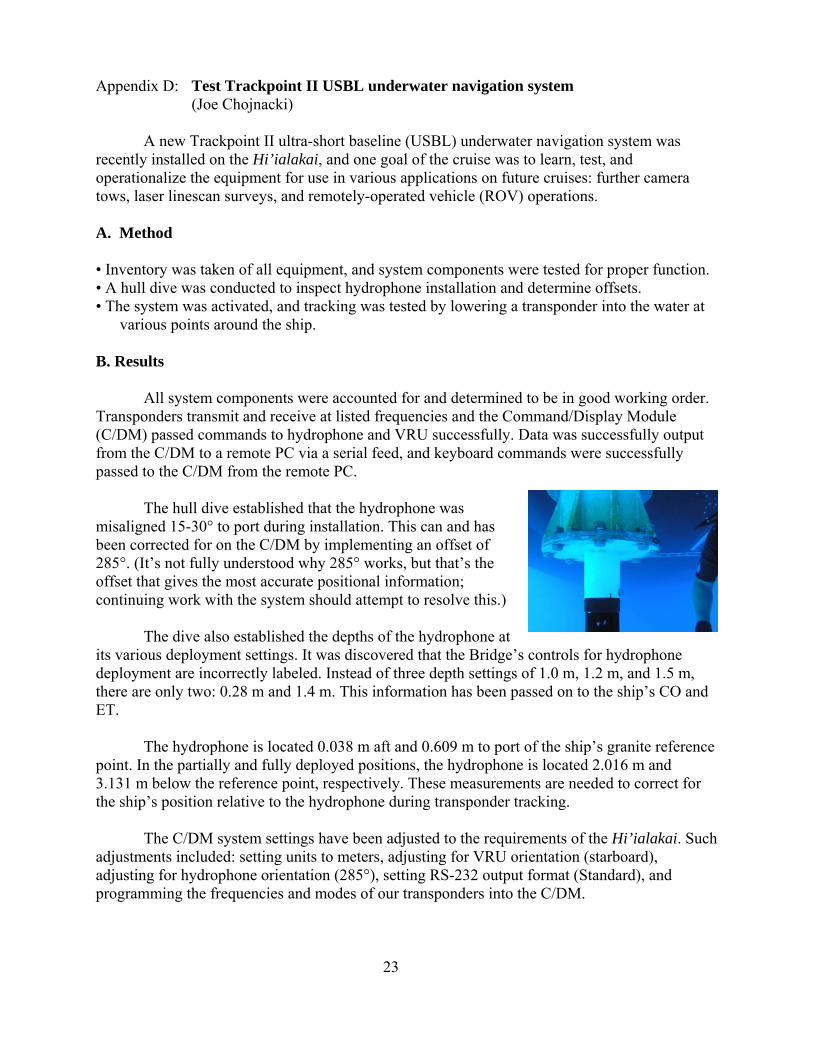
Appendix D: Test Trackpoint II USBL underwater navigation system (Joe Chojnacki) A new Trackpoint II ultra-short baseline (USBL) underwater navigation system was recently installed on the Hi’ialakai, and one goal of the cruise was to learn, test, and operationalize the equipment for use in various applications on future cruises: further camera tows, laser linescan surveys, and remotely-operated vehicle (ROV) operations. A. Method • Inventory was taken of all equipment, and system components were tested for proper function. • A hull dive was conducted to inspect hydrophone installation and determine offsets. • The system was activated, and tracking was tested by lowering a transponder into the water at
various points around the ship. B. Results All system components were accounted for and determined to be in good working order. Transponders transmit and receive at listed frequencies and the Command/Display Module (C/DM) passed commands to hydrophone and VRU successfully. Data was successfully output from the C/DM to a remote PC via a serial feed, and keyboard commands were successfully passed to the C/DM from the remote PC. The hull dive established that the hydrophone was misaligned 15-30° to port during installation. This can and has been corrected for on the C/DM by implementing an offset of 285°. (It’s not fully understood why 285° works, but that’s the offset that gives the most accurate positional information; continuing work with the system should attempt to resolve this.) The dive also established the depths of the hydrophone at its various deployment settings. It was discovered that the Bridge’s controls for hydrophone deployment are incorrectly labeled. Instead of three depth settings of 1.0 m, 1.2 m, and 1.5 m, there are only two: 0.28 m and 1.4 m. This information has been passed on to the ship’s CO and ET. The hydrophone is located 0.038 m aft and 0.609 m to port of the ship’s granite reference point. In the partially and fully deployed positions, the hydrophone is located 2.016 m and 3.131 m below the reference point, respectively. These measurements are needed to correct for the ship’s position relative to the hydrophone during transponder tracking. The C/DM system settings have been adjusted to the requirements of the Hi’ialakai. Such adjustments included: setting units to meters, adjusting for VRU orientation (starboard), adjusting for hydrophone orientation (285°), setting RS-232 output format (Standard), and programming the frequencies and modes of our transponders into the C/DM.
24
C. Notes Trackpoint II has the ability to calculate the depth of the transponder, but only when the transponder is within 45° of vertical from the hydrophone. As such this function will probably only be of use during drift tows, not active tows. Depth calculations were accurate and responsive during our tests. Over depth changes greater than about 70 m, however, the user is required to provide the C/DM with a new estimated depth. If no new depth is input manually, depth calculation capability will be lost unless the transponder returns to a depth close to the previous manual entry. The Trackpoint II C/DM is currently housed inside the ship’s computer server room, fairly inaccessible to the operator. Plans to lengthen the standard issue cable before the next cruise will allow relocation of the unit into a rack mount in the Dry Lab. This is not an exhaustive list of system requirements. For further information, refer to the manual which was produced during this cruise: Setup_TOAD-TPII-Hypack.doc, located on the Mapping Center’s server in Ahi10\ Pibhmc\ TOAD-IGOR\ Notes&Instruction.
25
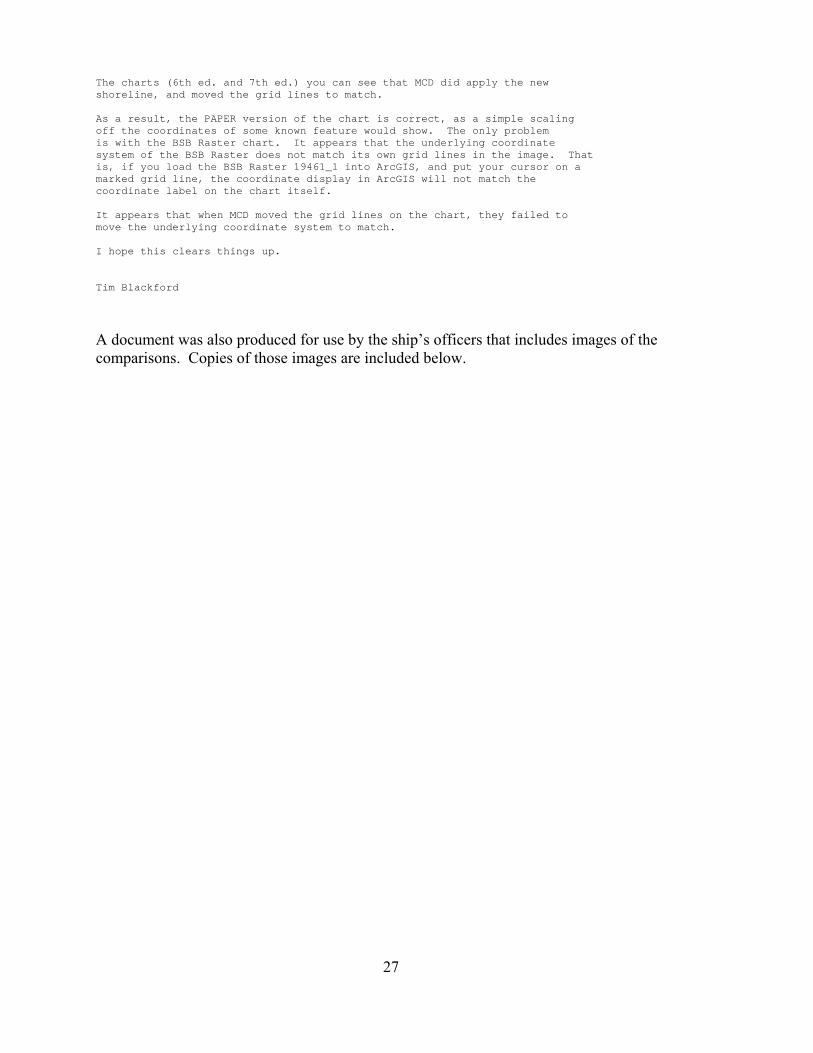
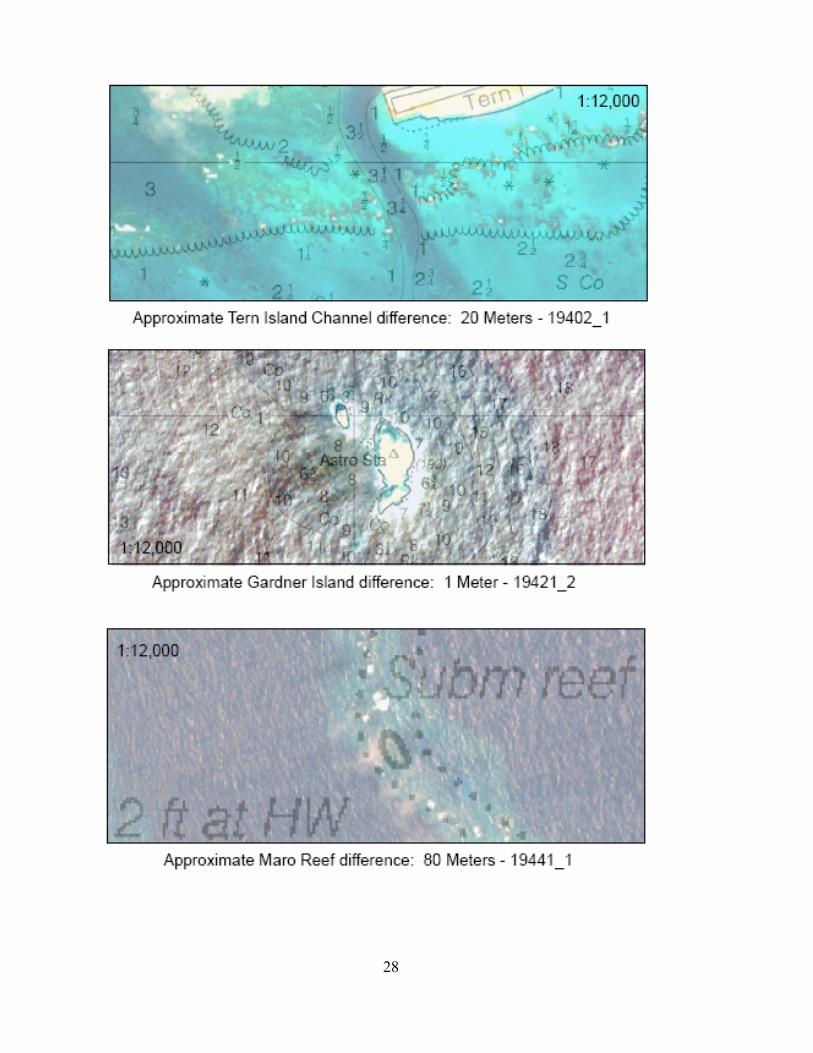
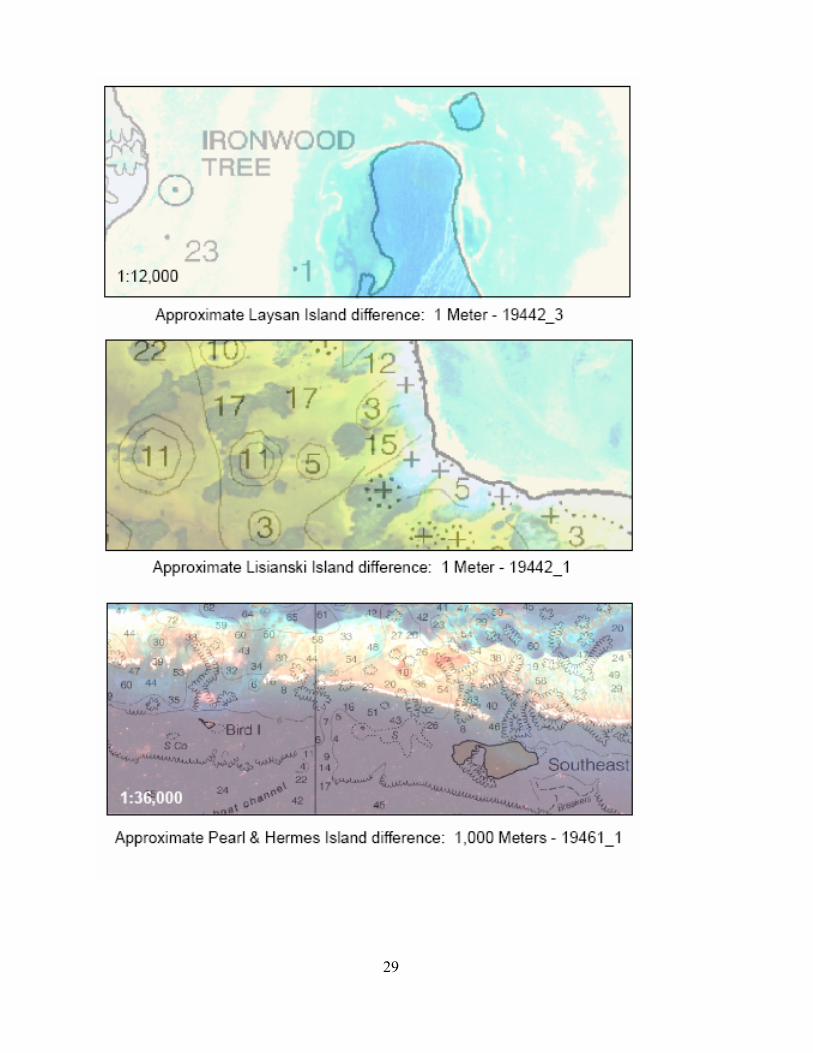
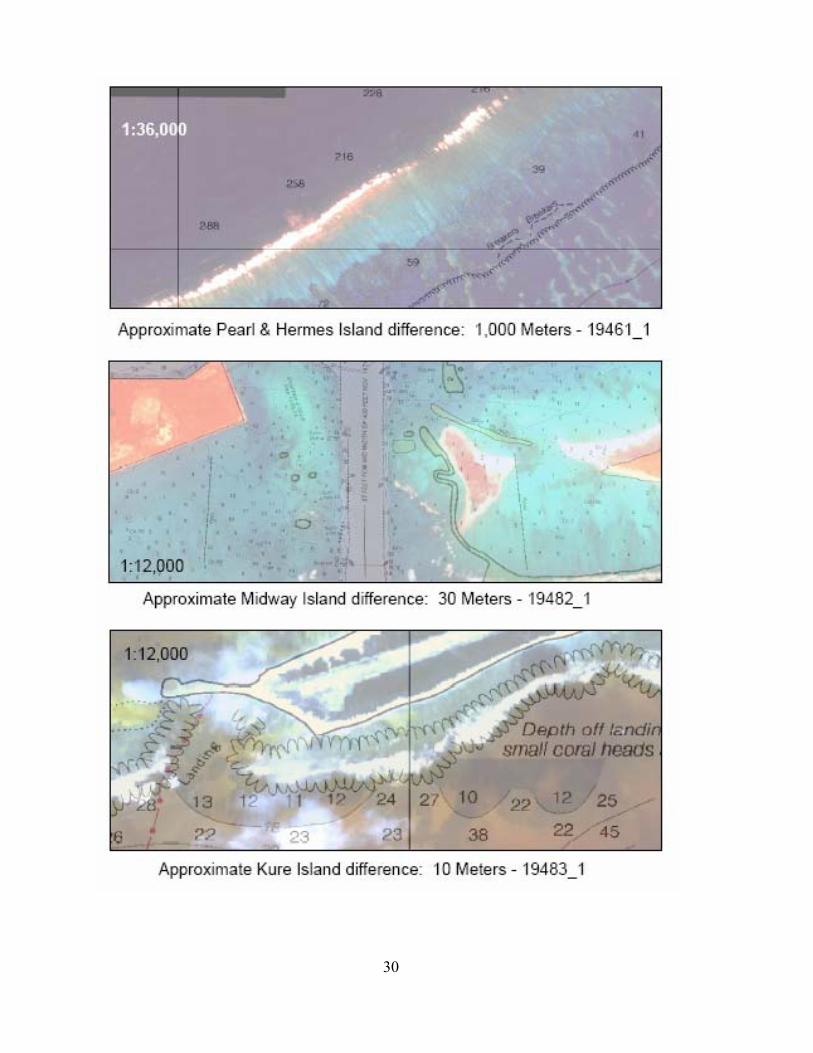
Appendix E: Comparison between charted landforms and IKONOS imagery (Rob O’Connor and Scott Ferguson) As part of the planning for this and subsequent cruises, we compared the charted landforms in the NWHI to those shown in the geo-referenced IKONOS imagery produced by the NOS Special Projects Office. On cruise HI-04-01, offsets were observed between the charted locations of structures at Maro Reef and Pearl and Hermes Reef. Subsequent communications with Office of Coast Survey indicated that all the landforms had been correctly positioned and no offsets should be observed. We performed this comparison between raster nautical charts and IKONOS imagery in order to resolve this inconsistency. IKONOS imagery was used because divers working on coral reef projects routinely rely on these products as base maps for operations in the NWHI and have confidence that those data are well positioned. The Maptech raster nautical charts used are corrected through February 2005. The following table summarizes offsets observed between the charts and the IKONOS data. These offsets were estimated by simple visual comparison after overlaying the two products in ArcGIS so they aren't necessarily quantitative but they should provide similar results to those produced by a ship using the land forms for radar navigation. Landmass Chart Offset Nihoa Island 19016_3 20 m Necker Island 19016_2 30 m La Perouse Pinnacle 19402_1 40 m Tern Island Channel 19402_1 20 m Gardner Pinnacle 19421_2 1 m Maro Reef 19441_1 80 m Laysan Island 19442_3 1 m Lisianski Island 19442_1 1 m Pearl & Hermes 19461_1 1000 m Midway Atoll 19482_1 30 m Kure Atoll 19483_1 10 m This analysis indicates that the majority of the landforms are positioned to within 40 meters or better. The notable exception is Pearl and Hermes Reef, where the charts are offset from the IKONOS imagery by about 1 kilometer; Southeast Island is charted approximately 1000 meters southeast (147 deg) of its position as indicated by IKONOS. This observation is in agreement with observations made by the NOAA Ship Hi’ialakai in September 2004 and is supported by anecdotal information provided by several of the Marine Debris divers who report that when their vessel anchors in the lee south of Southeast Island, their charted position places them well within the reef. Maro Reef has a somewhat greater offset than most of the other charts but there is little if any emergent land at Maro. From this comparison it is evident that the raster nautical chart of Pearl and Hermes Reef contains a substantial offset. The metadata for that chart is:
Chart Name: 19461_1 - PEARL AND HERMES ATOLL Chart Path: C:\Program Files\Nobeltec\Charts\BSBCHART\19461_1.KAP Source Scale: 1:40000 Horizontal Datum: Unknown Depth Units: FEET Sounding Datum: MEAN LOWER LOW WATER
26
Projection: Mercator Skew Angle: 0.000000 Version: 3.0 Paper Chart Edition: 07 Raster Chart Image Edition: 01 Paper Chart Correction Date: 12/01/2002 North Border Lat: 28.008533 South Border Lat: 27.725200 West Border Lon: 176.075933 East Border Lon: 175.654983
These results were forwarded to Jerry Mills at Office of Coast Survey, who provided the following response. Hi Scott, Thanks for the details on Perl and Hermes. The following e-mail from Alex Heliotis in MCD clarifies the correction that has been made. I trust that this completes the action on this chart discrepancy. However, if you discover any addition discrepancies don't hesitate to forward them to the following website for the fastest response: http://ocsdata.ncd.noaa.gov/dr/ Regards. Jerry ------------------------------------------- Subject: [Fwd: [Fwd: Re: [Fwd: Re: [Fwd: Re: Mispositioned Islands in NWHI]]]] Date: Fri, 15 Apr 2005 16:01:34 -0400 From: "Alexandra Heliotis" <[email protected]> Organization: NOAA/NOS/OCS/MCD To: Tim Blackford <[email protected]> CC: Mike Aslaksen <[email protected]>, Jerry Mills <[email protected]>, Richard Sillcox <[email protected]>, David Poltilove <[email protected]>, Lyn Preston <[email protected]>, Kevin Twombly <[email protected]>, Jim Gardner <[email protected]>, Lyn Preston <[email protected]>, Howard Danley <[email protected]> Tim, thank you for helping us resolve the issue with chart 19461. You were correct. The paper chart and POD chart are just fine. Also, the grid on the raster chart itself is correct. What was incorrect is the Georeferencing Grid that is provided by NOAA and incorporated into the BSB file format. And it is this grid that is used for navigation and for importing the chart into arcview, arcGIS or mapinfo. The Grid has been provided, Maptech has processed it and everyone that has the professional update service will receive the update. Also, the correction will also be available on Maptech's web site to registered Region 40 customers. -------------------------------------------------------- Subject: Re: [Fwd: Re: Mispositioned Islands in NWHI] Date: Thu, 14 Apr 2005 16:15:38 -0400 From: "Tim Blackford" <[email protected]> To: Mike Aslaksen <[email protected]> CC: Lyn Preston <[email protected]>, Ted Doyle <[email protected]>, Stephen Goodell <[email protected]>, Jerry Mills <[email protected]>, Jim Gardner <[email protected]>, Alexandra Heliotis <[email protected]>, Dave Doyle <[email protected]> All, There seems to be a lot of confusion about what is wrong with chart 19461, so let me try to clear things up a bit. The shoreline (GC10509) that we (NGS/RSD) provided to MCD to update the chart was not derived from IKONOS imagery, but from classified (NTM) source, as Tim Battista correctly stated. The stated accuracy was 25 meters, and that figure was verified using GPS positioned ground control. If you visually compare our shoreline with
27
The charts (6th ed. and 7th ed.) you can see that MCD did apply the new shoreline, and moved the grid lines to match. As a result, the PAPER version of the chart is correct, as a simple scaling off the coordinates of some known feature would show. The only problem is with the BSB Raster chart. It appears that the underlying coordinate system of the BSB Raster does not match its own grid lines in the image. That is, if you load the BSB Raster 19461_1 into ArcGIS, and put your cursor on a marked grid line, the coordinate display in ArcGIS will not match the coordinate label on the chart itself. It appears that when MCD moved the grid lines on the chart, they failed to move the underlying coordinate system to match. I hope this clears things up. Tim Blackford
A document was also produced for use by the ship’s officers that includes images of the comparisons. Copies of those images are included below.
28
29
30
31
Appendix F: Hi’ialakai Mapping System Status This appendix summarizes the status of the NOAA Ship Hi’ialakai’s mapping system as HI-05-01 nears completion. In brief, the two multibeam sonars have been used for habitat mapping throughout the entire cruise. The EM300 sonar has performed relatively well to-date and the EM3002D appears to be working as well. However, there are still some problems with each sonar as described below. In particular, the EM3002D sonar still exhibits problems detecting the bottom in the outer portion of the swath that results in data gaps in those areas. We believe these problems are associated with system noise. Problems with sound velocity and with the vertical reference also were identified. The former was traced to a malfunctioning conductivity sensor on the ship’s CTD and was resolved. The POS/MV vertical reference does not completely compensate for vessel heave when there is significant swell. The heave artifact has not been analyzed in any detail to determine whether it is within system specifications; our initial impression is that the artifact could be significant, particularly for mapping on the open-ocean banks that are typical in the NWHI. The R/V AHI has been deployed from the ship on a daily basis for 11 days. This operation has gone smoothly, but it should be noted that the weather was good during that time so conditions for deployment and recovery have been favorable. The ship has recommendations for a few relatively minor modifications to the davit that will improve its ability to carry the AHI securely in rough weather, but the davit modifications made in Honolulu last month were successful. There was some sign of bubble sweep-down when the vessel was mapping while headed into the seas. There is no apparent evidence of acoustic interference between different sonars. The Trackpoint II underwater navigation system has been tested and is apparently working. This is a preliminary report intended to provide an update about the current system status. It should be noted that most of the data processing on this cruise has been devoted to swath cleaning, and we are just beginning to synthesize the data and develop data products. As data are examined more closely, we expect to be able to quantify the problems reported here in more detail. EM300 During this trip the sonar was operated in depths ranging from 30 meters to well in excess of 3000 meters. The sonar is able to map while the ship runs at or near full speed. When running down-seas there is no apparent degradation of data quality with vessel speed. During one trip to windward in relatively rough seas, data gaps were produced in the EM300 data that apparently were due to bubble sweep-down. At that time the ship was running in excess of 10 knots at 082°; winds were 20 knots from 100° with 3 to 5 ft seas on top of 4 to 6 ft swells. No analysis of the acoustic backscatter quality under different operational conditions has yet been conducted. The way the Kongsberg sonars recover from noise is to reduce the swath angle and focus on the area beneath the ship. As the system gains more confidence in where the bottom is, the swath increases in width. See figure to right. As a result, in noisy conditions the swath repeatedly narrows and widens out.
32
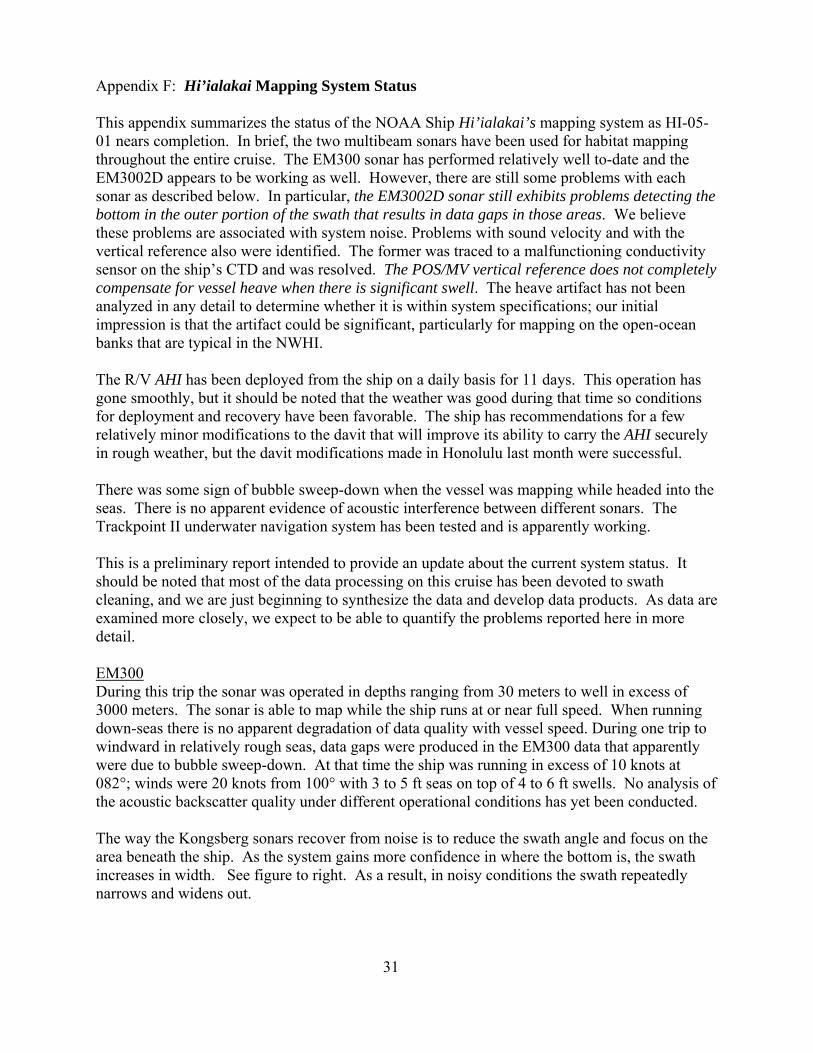
Early in the cruise the EM300 sonar appeared to be dropping pings occasionally, but the problem has not been as apparent during the survey portion of the cruise. Early in the trip we also observed some confusing data that seemed to be an artifact of yaw-compensation. The different sectors of the yaw-compensated data appeared to have significantly different depths from other sectors. This artifact occurred on slopes, when the ship was maneuvering, and when a large amount of yaw compensation was being applied. Unfortunately we did not record the file name where the problems were observed and have not had the time to relocate the data files where the problem was most apparent, so we cannot provide an example of the problem at this time. For the majority of the cruise the yaw compensation was disabled. In shallow water there is a distinct pattern of noisier data in the inner part of the swath and quieter data on the outer edges as shown in the figure below. We suspect that this is not a problem per se but is evidence of the method of bottom detection; the noisier area is amplitude bottom detection, and the quieter parts are phase detection.
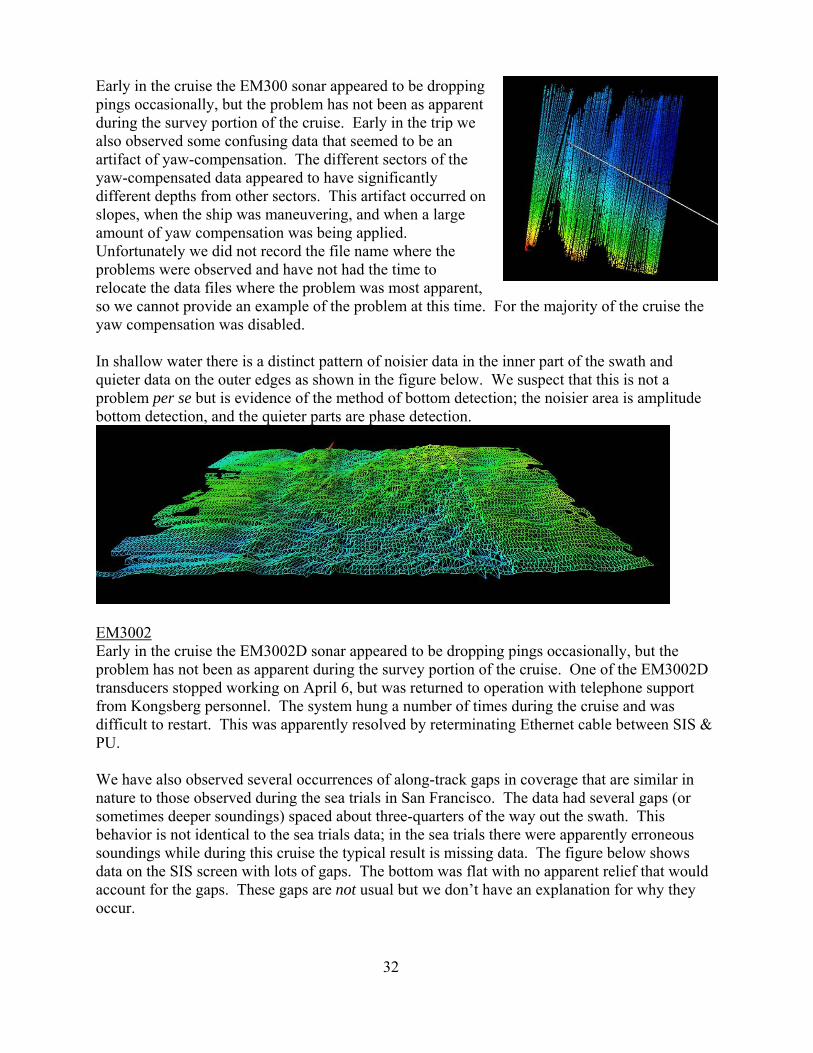
EM3002 Early in the cruise the EM3002D sonar appeared to be dropping pings occasionally, but the problem has not been as apparent during the survey portion of the cruise. One of the EM3002D transducers stopped working on April 6, but was returned to operation with telephone support from Kongsberg personnel. The system hung a number of times during the cruise and was difficult to restart. This was apparently resolved by reterminating Ethernet cable between SIS & PU. We have also observed several occurrences of along-track gaps in coverage that are similar in nature to those observed during the sea trials in San Francisco. The data had several gaps (or sometimes deeper soundings) spaced about three-quarters of the way out the swath. This behavior is not identical to the sea trials data; in the sea trials there were apparently erroneous soundings while during this cruise the typical result is missing data. The figure below shows data on the SIS screen with lots of gaps. The bottom was flat with no apparent relief that would account for the gaps. These gaps are not usual but we don’t have an explanation for why they occur.
33
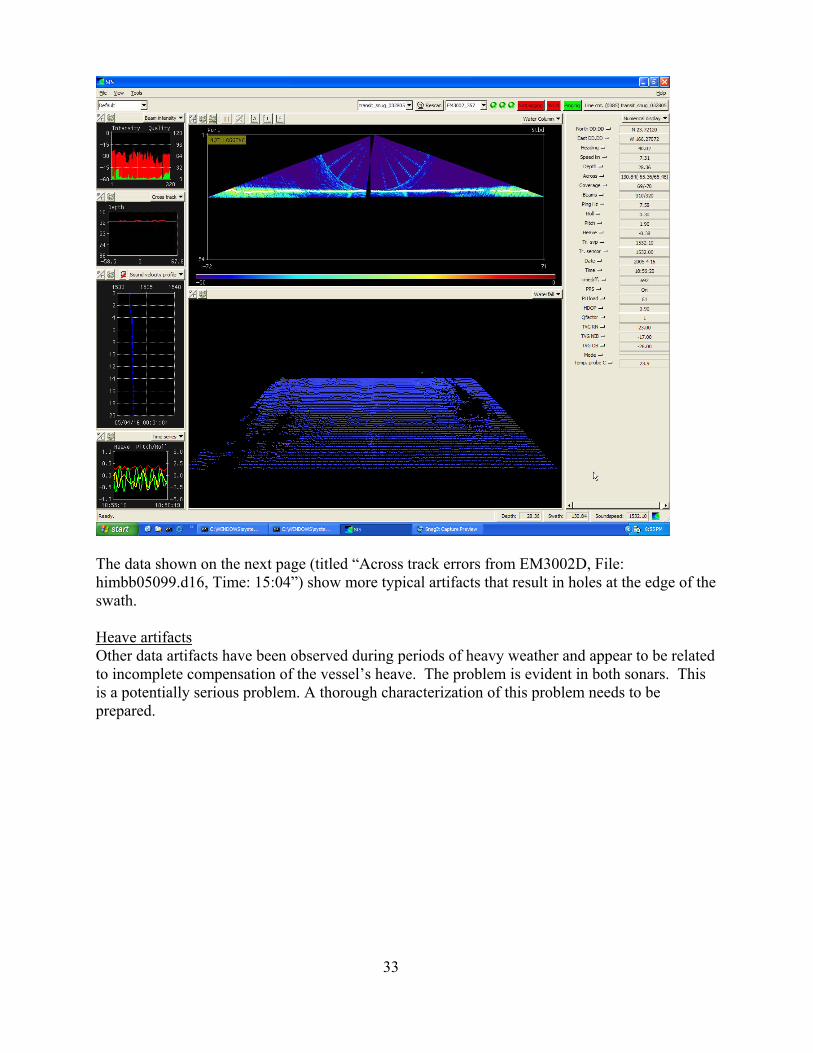
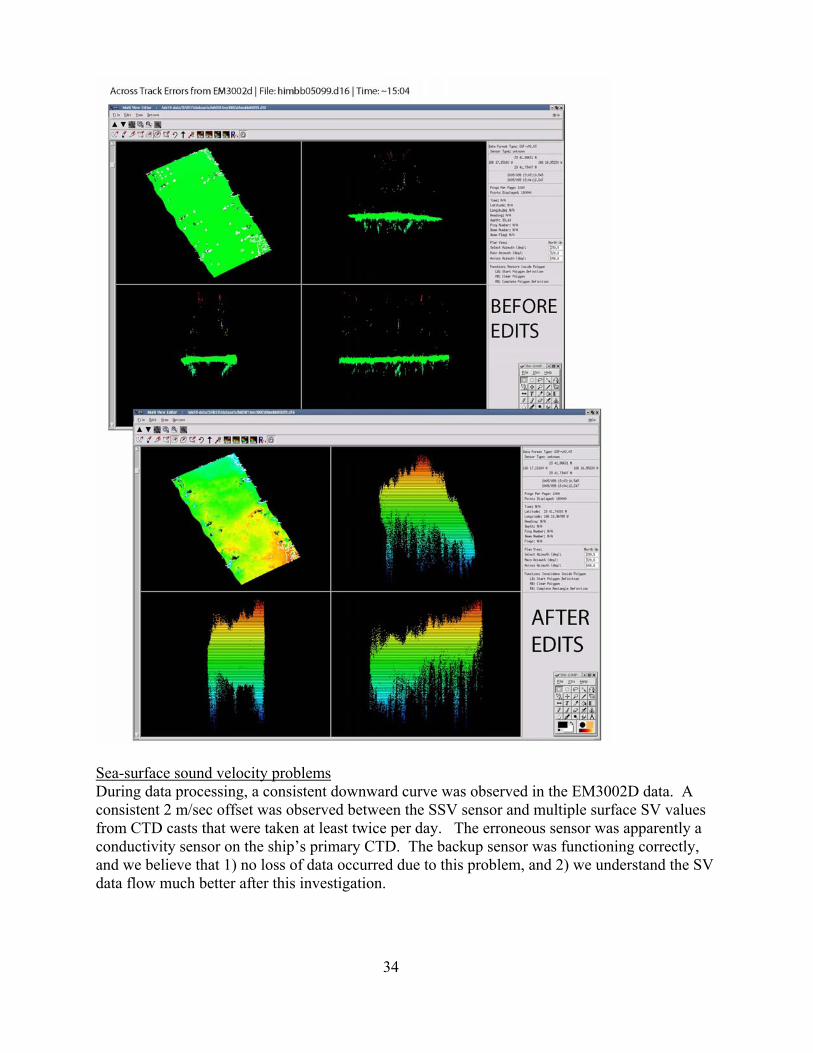
The data shown on the next page (titled “Across track errors from EM3002D, File: himbb05099.d16, Time: 15:04”) show more typical artifacts that result in holes at the edge of the swath. Heave artifacts Other data artifacts have been observed during periods of heavy weather and appear to be related to incomplete compensation of the vessel’s heave. The problem is evident in both sonars. This is a potentially serious problem. A thorough characterization of this problem needs to be prepared.
34
Sea-surface sound velocity problems During data processing, a consistent downward curve was observed in the EM3002D data. A consistent 2 m/sec offset was observed between the SSV sensor and multiple surface SV values from CTD casts that were taken at least twice per day. The erroneous sensor was apparently a conductivity sensor on the ship’s primary CTD. The backup sensor was functioning correctly, and we believe that 1) no loss of data occurred due to this problem, and 2) we understand the SV data flow much better after this investigation.
35
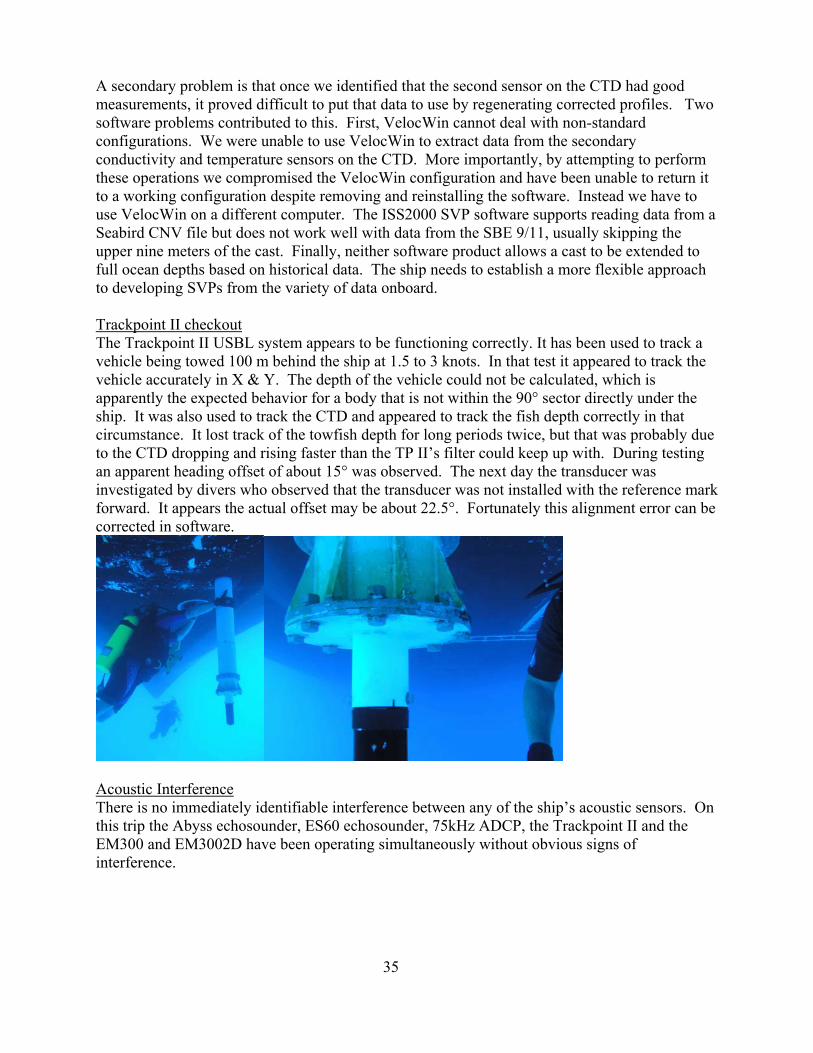
A secondary problem is that once we identified that the second sensor on the CTD had good measurements, it proved difficult to put that data to use by regenerating corrected profiles. Two software problems contributed to this. First, VelocWin cannot deal with non-standard configurations. We were unable to use VelocWin to extract data from the secondary conductivity and temperature sensors on the CTD. More importantly, by attempting to perform these operations we compromised the VelocWin configuration and have been unable to return it to a working configuration despite removing and reinstalling the software. Instead we have to use VelocWin on a different computer. The ISS2000 SVP software supports reading data from a Seabird CNV file but does not work well with data from the SBE 9/11, usually skipping the upper nine meters of the cast. Finally, neither software product allows a cast to be extended to full ocean depths based on historical data. The ship needs to establish a more flexible approach to developing SVPs from the variety of data onboard. Trackpoint II checkout The Trackpoint II USBL system appears to be functioning correctly. It has been used to track a vehicle being towed 100 m behind the ship at 1.5 to 3 knots. In that test it appeared to track the vehicle accurately in X & Y. The depth of the vehicle could not be calculated, which is apparently the expected behavior for a body that is not within the 90° sector directly under the ship. It was also used to track the CTD and appeared to track the fish depth correctly in that circumstance. It lost track of the towfish depth for long periods twice, but that was probably due to the CTD dropping and rising faster than the TP II’s filter could keep up with. During testing an apparent heading offset of about 15° was observed. The next day the transducer was investigated by divers who observed that the transducer was not installed with the reference mark forward. It appears the actual offset may be about 22.5°. Fortunately this alignment error can be corrected in software.
Acoustic Interference There is no immediately identifiable interference between any of the ship’s acoustic sensors. On this trip the Abyss echosounder, ES60 echosounder, 75kHz ADCP, the Trackpoint II and the EM300 and EM3002D have been operating simultaneously without obvious signs of interference.
36
R/V AHI The failure of the R/V AHI’s generator before the cruise began precluded the complete calibration of the launch’s survey system before departing from Honolulu. A roll bias calibration was performed at FFS prior to beginning operations, and the AHI’s mapping system appears to be working well. A complete calibration will be conducted after the cruise and the data will be reprocessed to reflect the observed offsets. However, in the short term, any AHI data used for intercomparison with Kongsberg sonar data must be treated skeptically. Several computer system crashes have occurred aboard the AHI that are unexplained and are apparently hardware related. We plan to procure spare hardware that can be used to troubleshoot and resolve this problem. Data Acquisition and Processing System Status The ISS2000 data acquisition and survey control system was delivered on 31 March and installed immediately prior to this cruise. SAIC engineers were on board for the first 4 days of the cruise testing the system. The installation was successful, providing a single operator console that records data from both Kongsberg sonars in Generic Sensor Format (GSF) and providing a survey control display that is identical to that on the AHI. One significant enhancement is that the helm monitor can display the ship’s progress over both a raster nautical chart and the real-time multibeam coverage map; this significantly enhances the ship’s ability to map by following the contours in steep irregular terrain that is typical of the deeper waters in the NWHI. Data processing equipment is being procured, but most of the equipment was not delivered in time for this cruise so existing processing hardware and software were used. The new processing equipment will be installed as it arrives. One significant enhancement is the addition of Caris HIPS/SIPS data processing software. CARIS can be used to process raw data from both the EM300 and EM3002D as well as data from the RESON 8101 and EM300 when stored in GSF. Caris does not yet support data from the EM3002D sonar when stored in GSF.