Crowdsensing Smart Ambient Environments and Servicesgeog.ucsb.edu/~jano/geotracer.pdf · smart...
21
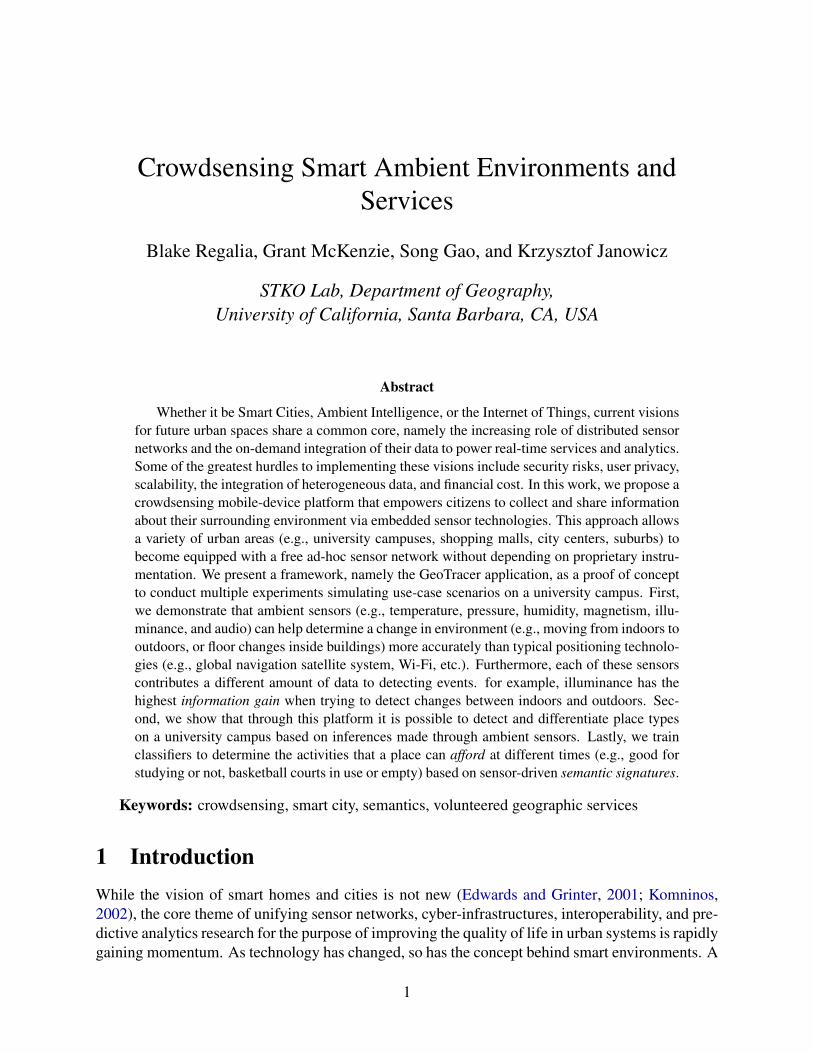
Crowdsensing Smart Ambient Environments and Services Blake Regalia, Grant McKenzie, Song Gao, and Krzysztof Janowicz STKO Lab, Department of Geography, University of California, Santa Barbara, CA, USA Abstract Whether it be Smart Cities, Ambient Intelligence, or the Internet of Things, current visions for future urban spaces share a common core, namely the increasing role of distributed sensor networks and the on-demand integration of their data to power real-time services and analytics. Some of the greatest hurdles to implementing these visions include security risks, user privacy, scalability, the integration of heterogeneous data, and financial cost. In this work, we propose a crowdsensing mobile-device platform that empowers citizens to collect and share information about their surrounding environment via embedded sensor technologies. This approach allows a variety of urban areas (e.g., university campuses, shopping malls, city centers, suburbs) to become equipped with a free ad-hoc sensor network without depending on proprietary instru- mentation. We present a framework, namely the GeoTracer application, as a proof of concept to conduct multiple experiments simulating use-case scenarios on a university campus. First, we demonstrate that ambient sensors (e.g., temperature, pressure, humidity, magnetism, illu- minance, and audio) can help determine a change in environment (e.g., moving from indoors to outdoors, or floor changes inside buildings) more accurately than typical positioning technolo- gies (e.g., global navigation satellite system, Wi-Fi, etc.). Furthermore, each of these sensors contributes a different amount of data to detecting events. for example, illuminance has the highest information gain when trying to detect changes between indoors and outdoors. Sec- ond, we show that through this platform it is possible to detect and differentiate place types on a university campus based on inferences made through ambient sensors. Lastly, we train classifiers to determine the activities that a place can afford at different times (e.g., good for studying or not, basketball courts in use or empty) based on sensor-driven semantic signatures. Keywords: crowdsensing, smart city, semantics, volunteered geographic services 1 Introduction While the vision of smart homes and cities is not new (Edwards and Grinter, 2001; Komninos, 2002), the core theme of unifying sensor networks, cyber-infrastructures, interoperability, and pre- dictive analytics research for the purpose of improving the quality of life in urban systems is rapidly gaining momentum. As technology has changed, so has the concept behind smart environments. A 1
Transcript of Crowdsensing Smart Ambient Environments and Servicesgeog.ucsb.edu/~jano/geotracer.pdf · smart...
Crowdsensing Smart Ambient Environments andServices
Blake Regalia, Grant McKenzie, Song Gao, and Krzysztof Janowicz
STKO Lab, Department of Geography,University of California, Santa Barbara, CA, USA
Abstract
Whether it be Smart Cities, Ambient Intelligence, or the Internet of Things, current visionsfor future urban spaces share a common core, namely the increasing role of distributed sensornetworks and the on-demand integration of their data to power real-time services and analytics.Some of the greatest hurdles to implementing these visions include security risks, user privacy,scalability, the integration of heterogeneous data, and financial cost. In this work, we propose acrowdsensing mobile-device platform that empowers citizens to collect and share informationabout their surrounding environment via embedded sensor technologies. This approach allowsa variety of urban areas (e.g., university campuses, shopping malls, city centers, suburbs) tobecome equipped with a free ad-hoc sensor network without depending on proprietary instru-mentation. We present a framework, namely the GeoTracer application, as a proof of conceptto conduct multiple experiments simulating use-case scenarios on a university campus. First,we demonstrate that ambient sensors (e.g., temperature, pressure, humidity, magnetism, illu-minance, and audio) can help determine a change in environment (e.g., moving from indoors tooutdoors, or floor changes inside buildings) more accurately than typical positioning technolo-gies (e.g., global navigation satellite system, Wi-Fi, etc.). Furthermore, each of these sensorscontributes a different amount of data to detecting events. for example, illuminance has thehighest information gain when trying to detect changes between indoors and outdoors. Sec-ond, we show that through this platform it is possible to detect and differentiate place typeson a university campus based on inferences made through ambient sensors. Lastly, we trainclassifiers to determine the activities that a place can afford at different times (e.g., good forstudying or not, basketball courts in use or empty) based on sensor-driven semantic signatures.
Keywords: crowdsensing, smart city, semantics, volunteered geographic services
1 IntroductionWhile the vision of smart homes and cities is not new (Edwards and Grinter, 2001; Komninos,2002), the core theme of unifying sensor networks, cyber-infrastructures, interoperability, and pre-dictive analytics research for the purpose of improving the quality of life in urban systems is rapidlygaining momentum. As technology has changed, so has the concept behind smart environments. A
1
growth in sensor capabilities, wireless communication, and battery efficiency, combined with theincreasing availability of (personal) data and methods for their synthesis lead to a wide adoptionof these technologies for the purpose of enhancing the urban environment (Ganti et al., 2011). Assmart cities and homes are taking shape, there is increased interest from the research community,industry, and governments regarding the technical challenges, social implications, and practical ap-plications brought on by sensors and their interlinked observations (Martins and McCann, 2015).
One of the primary barriers to entry facing cities, university campuses, home owners, and orga-nizations looking to adopt intelligent sensors is the instrumentation infrastructure. The deploymentand maintenance of large-scale, interconnected sensor networks come with significant financialoverhead. Not only are most authorities required to notify the public of any pending changes topublic space, but they are also required to entertain bids from a variety of third party companies.Installation of sensors and transmitters can cause years of disruption to the urban ecosystem bothphysically, through construction, and politically, through various levels of red tape. As more citiesadopt intelligent sensor platforms, issues of security have also begun to emerge. For instance,smart cities are vulnerable to cyber-attacks at different levels (Elmaghraby and Losavio, 2014).The very premise of a smart city dictates that everything must be connected to everything else;which can be maliciously exploited to aid criminal activity ranging from identify theft (Sen et al.,2013) to stop light resequencing (Cerrudo, 2015).
The adoption of sensor technologies by governments and the industry has also raised concernsover privacy issues. Ubiquitous technologies such as video surveillance and traffic sensors con-stantly monitor human activities in urban settings. The intended purpose of these systems mightbe to aid emergency responders or to improve traffic management but the technologies also enablenefarious activities. To give a concrete and representative example, consider the smart-bin tech-nology. Prior to the 2012 London Olympics, new garbage bins were installed throughout the cityto improve the availability of depositing trash. The bins, however, also housed an LCD screen thatwas used as advertising space. It was eventually discovered that these bins were also collectingMAC addresses from the mobile devices of citizens as they walked around the city. Over 4 milliondevice captures took place without the knowledge nor expressed permission of device owners orcity officials (Vincent, 2013). This gave a small group of people the ability to track hundreds ofthousands of citizens throughout the city and model their daily activities. In many ways, citizensof today’s smart cities have paid for the benefits of amenities like reduced traffic congestion at thecost of their personal privacy. Other potential problems arising from the top-down deploymentof sensor networks and their services include issues of access, payment, and prioritization to saidservices and derived products, e.g., user traces.
It has become clear that a positive definition of the smart city needs to include citizen engage-ment at all horizontal and vertical levels, placing citizens at the focal point of the city. It is here thatwe take up Michael Goodchild’s original call to citizens as sensors (2007). His work introducedthe concept of Volunteered Geographic Information (VGI) as a way for individuals to contributeto their environment through user-contributed geographic content. Our work approaches the cit-izens as sensors idea from a more literal perspective, pointing towards the sensors accessible viaan individual’s mobile device, e.g., a smartphone, smartwatch, tablet, or smart clothing. Manyapplications have been developed to take advantage of these sensors ranging from hyper-sensitivemobile gaming platforms that make use of accelerometers to barometric pressure sensors that re-port elevation change to hiking apps. Until now however, the vast majority of these sensor-centricapplications have targeted the individual rather than society as a whole, a notable exception be-
2

ing crowdsensing systems such as McSense (Cardone et al., 2013). In this work, we argue thatsensor-rich devices have lowered the barrier to entry for the democratization of smart cities andother environments more broadly. Citizens now have the ability and opportunity to collect datavia their existing devices and can share the information with all partnering citizens, enriching theenvironment in which they have a vested, joint interest.
Citizen engagement allows for places to be redefined by how they are used in practice ratherthan how city planners intended their use. This has far reaching implications, e.g., on the wayshow we conceptualize and organize places by types, e.g., in geo-ontologies, and therefore whatkind of queries we can pose to our intelligent personal assistants (Chaudhri et al., 2006). A betterunderstanding of affordance-based place models (Jordan et al., 1998; Scheider and Janowicz, 2014)can be ascertained through the sensors carried by the people who occupy the spaces. For example,a city park may have been originally designed for use on weekends, but data collected by visitorsindicates that the park is quite popular for after school programs. A cafeteria that affords eatingduring lunch hours might be ideal for studying in the early mornings and late evenings. In principle,any public location indoor or outdoor can be used for studying as long as it fits the profile, e.g.sufficiently bright and quiet — a combination of conditions from which a smartphone’s luminositysensor and microphone can easily produce a digital signature.
An added benefit of including citizens as sensors in the smart city system is that the quantityof sensor contributions for a particular area can reflect the usage statistics of public spaces. Aswill be discussed throughout this paper, we envision an ad-hoc network of citizens contributingsensor data as they go about their daily lives. In essence, these citizens are creating ambientsmart environments around the places and locations that are important to them. In other words,every environment ranging from a university campus to a campground can be turned into a smartambient environment without the need for top-down infrastructure and instrumentation. This isalso of importance in case of extreme events such as earthquakes.
In the interest of protecting privacy, the proposed ad-hoc sensor-network does not require hu-man identification. A second’s worth of anonymized sensor readings from a limited set of dis-tributed devices would be enough to build a rich, hyper-local (Xia et al., 2014) model of an ambientfield such as illuminance. Crowdsourced sensor readings compose the backbone of a community-driven service-oriented platform, a concept envisioned by Volunteered Geographic Services (Save-lyev et al., 2011) and other systems before.
Summing up, today’s approaches towards smart cities and smart environments more gener-ally follow a static top-down approach in which decisions are made well in advance and basedon criteria such as the availability of resources. Once the physical infrastructure, e.g., sensor net-works, have been deployed, the abilities and services offered by the smart city become fixed andimmutable, oftentimes controlled solely by the governments and instrument vendors which raiseswell justified concerns among citizens.
2 Research ContributionIn this work, we propose a true citizens-as-sensors platform that allows individuals to contributeinformation collected via mobile sensors for the purpose of generating hyper-local smart ambi-ent environments on-the-fly by deploying services on top of signatures learned from the jointlycollected sensor observations. Thereby we combine ongoing research on learning place types via
3
bottom-up approaches, crowdsensing, VGI, and so forth. To give a first intuition, instead of relyingon a handful of temperature sensors in a city, we envision a platform in which citizens can openan application to sample the surrounding environment passively and anonymously as they movethroughout their locality and combine these data across sensor types and citizens.
Today’s entry-level smartphone includes an impressive array of reasonably accurate sensors ca-pable of recording from several different ambient fields. We have reached a point in mobile devicedevelopment where we can now think more intelligently about how we might use these sensorsto enhance our everyday lives, e.g., by detecting and reacting to activities. Battery expenditure isstill very much an issue for the majority of consumer-grade mobile devices and recent research hasshown that many of the low-battery usage sensors can be used to enhance and sometimes replacehigher-battery usage sensors. For example, GPS receivers are among the most energy-expensivesensors on a typical mobile device. Previous work (Zandbergen, 2009) has shown that Wi-Fi po-sitioning and Cellular trilateration alone do not yield reasonably precise location fixes, howeverusing a combination of methods (Lin et al., 2010) can improve positioning. As we will demon-strate in this work, sensor readings of temperature, humidity, and illuminance can further reducethe uncertainty associated with positioning and also differentiate between adjacent spaces that mayotherwise confuse typical positioning technologies.
The research contribution of this work is rooted in the concept of place. While sensor readingsare associated with spatial fixes, it is through the activities of individuals at those locations thatthe true power of signatures are exposed. The integration of observations from different sensortypes yields unique semantic signatures that can be used to differentiate places based on the typesof activities that they afford. Even nuanced differences between sensor readings (e.g., barometricpressure) often indicate changes in environmental conditions such as moving from one floor ina building to another. Similarly, when positioning technologies locate an individual inside of ashopping mall, signatures generated from audio sensors alone provide the ability to distinguishbetween say a restaurant and a book store. As we examine the various combinations of sensorsand the ways in which they contribute to place signatures, it is important to explore the degreeof each sensor’s contribution to these signatures that allows us to differentiate place types. Whileusing all available sensors in concert would certainly improve the quality and robustness of placetype estimations, it would come at the costs of increased battery consumption and system resourceusage.
Summing up, we propose a hyper-local, sensor-driven platform that uses data from the sensorsof mobile devices to construct ambient smart environments and offers services enabled by thesignatures collected by these devices.
The novel contributions of this research are as follows:
1. Enhance existing location-aware technologies.We show that ambient sensors accessible on most mobile devices can determine a change inenvironment (e.g., moving from indoors to outdoors, or changing floors inside a building)more accurately than standard location technologies (e.g., GNSS, WiFi).
2. Detect and differentiate place typesWe show that through this platform it is possible to detect and differentiate place types on auniversity campus based purely on sensors readings from a mobile device.
4
3. Enable hyper-local activity servicesWe show that the proposed platform permits user-generated geographic services (Savelyevet al., 2011) that rely on up-to-date information for enhancing place-based activities. Forinstance, one can trigger distant sensors to detect whether a class is already in session or notusing the sensors of mobile devices and machine learning. This approach fits into the broadervision of constructing hyper-local environmental fields as well as services for querying thisinformation.
The remainder of this paper is organized as follows. In Section 3 we discuss existing workrelated to our proposed research. A discussion of mobile device sensors and the methods usedto extract information from these sensors is introduced in Section 4. An overview of the mobileplatform designed to collect and assess these sensors readings is described in Section 5. Examplescenarios for this framework are outlined and explored in Section 6 and conclusions and futurework are presented in Section 7.
3 Related WorkTodays smartphones are equipped with a growing set of powerful embedded sensors which advancethe emerging field of mobile phone sensing and facilitate several services such as social network-ing, environmental monitoring and health care (Lane et al., 2010). Location-based services alsobenefit from embedded geographic and proximity-based sensors. Research has also shown that ac-celerometer data can be used to recognize different activity modes (e.g., walking, running, biking)(Wang et al., 2009a), which has been integrated with several innovative fitness-related technologiesand applications.
Microphones also offer a unique perspective on the context of place, which have been used tomeasure noise pollution levels (Santini et al., 2009) and to monitor road conditions by analyzingrecorded audio snippets, such as Microsoft’s Nericell project (Mohan et al., 2008). In addition,some researchers have demonstrated that by using ubiquitous sensing data collected from humansensors, they can build models to diagnose urban noise. For example, Zheng et al. (2014) proposea three-dimensional (consisting of regions, noise categories, and time slots) tensor model to inferurban noise conditions at different times of the day for several regions in New York City, byusing 3-1-1 compliant data combined with social media, road network data, and points of interests(POIs).
Savelyev et al. (2011) coined a new concept of volunteered geographic services (VGS) in whichusers contribute to location-based content while simultaneously improving crowdsourced service-oriented platforms. They develop a novel architecture using the Linked Data paradigm and Seman-tic Web technologies to support location-based human-oriented services, such as ridesharing.
McKenzie and Janowicz (2015) develop a location-distortion model to improve reverse geocod-ing technology using behavior-driven temporal semantic signatures extracted from online location-based social networks. Either the combination or one of spaital, temporal and thematic bands havebeen demonstrated to play an important role in differentiating place types (McKenzie et al., 2015).
Positioning is the key component to support location-based studies. It is well known that GPS-enabled devices work well for positioning in outdoor environments but not in indoor environmentsbecause of the signal obstructions. However, as reported in a national human activity pattern survey
5
(NHAPS), people spend an average of 87% of their time in enclosed buildings and about 6% oftheir time in enclosed vehicles (Klepeis et al., 2001).
Many researchers have made great efforts in the field of indoor positioning. Elhamsharyand Youssef (2015) develop a crowdsourcing-based system that can automate the constructionof semantic-rich indoor floorplans with a specific label (e.g., venue name in a mall) or a generalplace category (e.g., restaurant).
Mazilu et al. (2013) propose to use low-power ambient sensors: temperature (T), humidity (H),pressure (P), and light (L) integrated in phones to extract semantic locations (such as home, office,train, and shop), which can be an alternative to standard power-hungry localization methods, suchas GPS/WiFi/GSM and audio, while significantly reducing the power consumption and saving upto 65% of battery power for the THP sensor combination, and up to 85% for the TH combination.
Cardone et al. (2013) introduce a framework to collect sensor data from a distributed sensor-network of mobile devices in which participants are assigned tasks for the purpose of enablingdata-driven geo-services. We describe here a similar product that extends the conceptual deviceplatform with ambient sensors for passive data collection and learns place type signatures bottom-up to support various location-based services.
4 MethodologyIn this section we introduce sensors that are common to many mobile devices and discuss a numberof approaches that can be used to extract signatures from these sensors. We then show that througha variety of statistical and machine learning methods, these signatures can be employed to identifya range of human activities and place types.
4.1 Device SensorsMost current mobile devices have built-in sensors that measure location (GNSS), motion (e.g.,accelerometer, gyroscope), radio-frequency signals (e.g., Bluetooth, Wi-Fi), and various ambientenvironmental conditions (e.g., microphone, light sensor, barometer, hydrometer). These sensorsare capable of providing raw timestamped data to monitor device orientation, position, and changesto the surrounding environment. The dominant mobile operating system world-wide as of 20151 isAndroid. By examining publicly-available statistics about the Android operation-system versiondistributions2, we can identify prevalence among certain sensors. In rare cases, new releases ofAndroid come with an explicit recommendation to hardware manufacturers to drop a sensor fromtheir device, such as the Compatibility Definition document of Android 4.2 that designated the tem-perature sensor be deprecated 3. A recent report found that the most prevalent sensor on Androidmobile devices world-wide was the accelerometer with 30% adoption having increased adoptionsubstantially from 2012. This was followed by barometric pressure sensor which was housed by20% of Android devices followed by magnetic field sensors and humidity sensors OpenSignal
1https://www.idc.com/prodserv/smartphone-os-market-share.jsp2http://developer.android.com/intl/ru/about/dashboards/index.html3http://static.googleusercontent.com/media/source.android.com/en/
/compatibility/4.2/android-4.2-cdd.pdf
6
(2015). Note that not all sensors were mentioned in this report and that these low percentages in-clude older devices running very early versions of the Android operating system or systems otherthan smartphones and tablets.
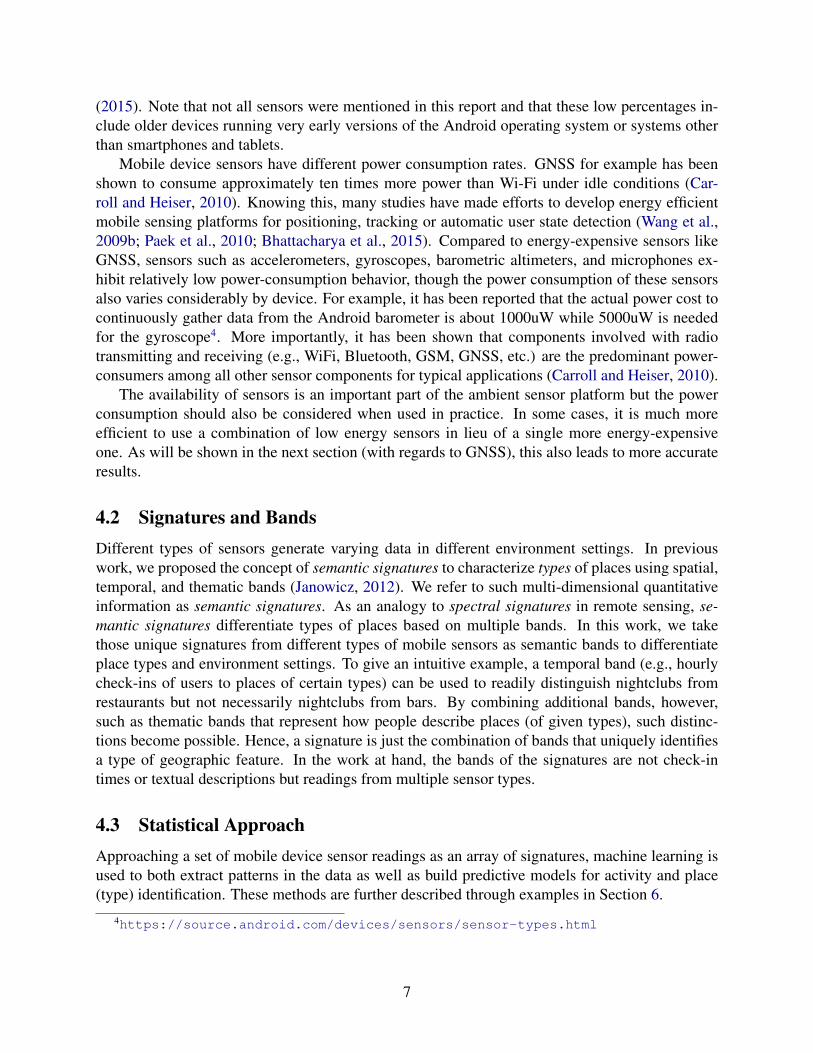
Mobile device sensors have different power consumption rates. GNSS for example has beenshown to consume approximately ten times more power than Wi-Fi under idle conditions (Car-roll and Heiser, 2010). Knowing this, many studies have made efforts to develop energy efficientmobile sensing platforms for positioning, tracking or automatic user state detection (Wang et al.,2009b; Paek et al., 2010; Bhattacharya et al., 2015). Compared to energy-expensive sensors likeGNSS, sensors such as accelerometers, gyroscopes, barometric altimeters, and microphones ex-hibit relatively low power-consumption behavior, though the power consumption of these sensorsalso varies considerably by device. For example, it has been reported that the actual power cost tocontinuously gather data from the Android barometer is about 1000uW while 5000uW is neededfor the gyroscope4. More importantly, it has been shown that components involved with radiotransmitting and receiving (e.g., WiFi, Bluetooth, GSM, GNSS, etc.) are the predominant power-consumers among all other sensor components for typical applications (Carroll and Heiser, 2010).
The availability of sensors is an important part of the ambient sensor platform but the powerconsumption should also be considered when used in practice. In some cases, it is much moreefficient to use a combination of low energy sensors in lieu of a single more energy-expensiveone. As will be shown in the next section (with regards to GNSS), this also leads to more accurateresults.
4.2 Signatures and BandsDifferent types of sensors generate varying data in different environment settings. In previouswork, we proposed the concept of semantic signatures to characterize types of places using spatial,temporal, and thematic bands (Janowicz, 2012). We refer to such multi-dimensional quantitativeinformation as semantic signatures. As an analogy to spectral signatures in remote sensing, se-mantic signatures differentiate types of places based on multiple bands. In this work, we takethose unique signatures from different types of mobile sensors as semantic bands to differentiateplace types and environment settings. To give an intuitive example, a temporal band (e.g., hourlycheck-ins of users to places of certain types) can be used to readily distinguish nightclubs fromrestaurants but not necessarily nightclubs from bars. By combining additional bands, however,such as thematic bands that represent how people describe places (of given types), such distinc-tions become possible. Hence, a signature is just the combination of bands that uniquely identifiesa type of geographic feature. In the work at hand, the bands of the signatures are not check-intimes or textual descriptions but readings from multiple sensor types.
4.3 Statistical ApproachApproaching a set of mobile device sensor readings as an array of signatures, machine learning isused to both extract patterns in the data as well as build predictive models for activity and place(type) identification. These methods are further described through examples in Section 6.
4https://source.android.com/devices/sensors/sensor-types.html
7
4.3.1 Entropy and Information Gain
We use an information entropy-based approach for determining the amount of information thateach sensor contributed to the classification of place types. In our case, Shannon informationentropy (Equation 1) is used to quantify the amount of variability in a given sensor’s readings(Shannon, 1951).
H(D) = −n∑
i=1
pilog2(pi) (1)
H(D) in this equation represents the entropy of a given sensor reading while pi represents theprobability of a particular value belonging to a class i.
Building on the knowledge that each sensor contributes a certain amount to a model used todifferentiate places (for example), we then calculate the information gain (IG) (Quinlan, 1986) foreach sensor. This approach in essence reports the relative amount by which each sensor contributesto the classification, e.g., the indoor or outdoor status. Equation 2 shows the information gainformula for a specific sensor j with |Dj |
|D| being the weight of the jth sensor of the training set.
IG(D|Dj) = H(D)−n∑
j=v
| Dj || D |
×H(Dj) (2)
4.3.2 Support Vector Machine
In this paper, we will demonstrate how leveraging mobile sensor information from a crowdsensingnetwork helps determine suitable locations to conduct certain types of activities. For cases suchas this, it is appropriate to build a classification model using sample data for training. A multi-class support vector machine (SVM) (Suykens and Vandewalle, 1999; Kuhn, 2008) is a type ofsupervised learning model that we use by feeding sensor readings from labeled training data asinputs to build a classification model which can then predict and assign labels to untagged sensorreadings. In Section 6 this approach is used to assess the suitability of a place (type) for studyingprovided sensor readings from known study locations.
4.4 Organizing the Implications of Context by Engineering an OntologyThe platform that we propose in this work collects sensor readings from a network of volunteerswho annotate their data by tagging each recording with text labels that identify enviornmental qual-ities (e.g., quiet, crowded, dark, etc.) as well as the current place or activity types (e.g., studying,eating, library, cafeteria, etc.). Although we train our model to make accurate predictions aboutactivity types given ambient sensor signatures, the device is still far removed from the implicationsof such category ‘tags’. In order to build geographic services that provide practical features to theusers, we must be able to model how activities affect place, which actions should be triggered bycertain conditions, and how to appreciate the full hierarchy of context.
When it comes to organizing the high-level relationships that associate sensor reading qualitiesto the affordances of place types, an ontology is a common way to structure such information.While traditional methods may take an exclusive top-down approach to the engineering of suchontologies, we propose to engineer them also bottom-up, i.e., by mining semantic relations from
8
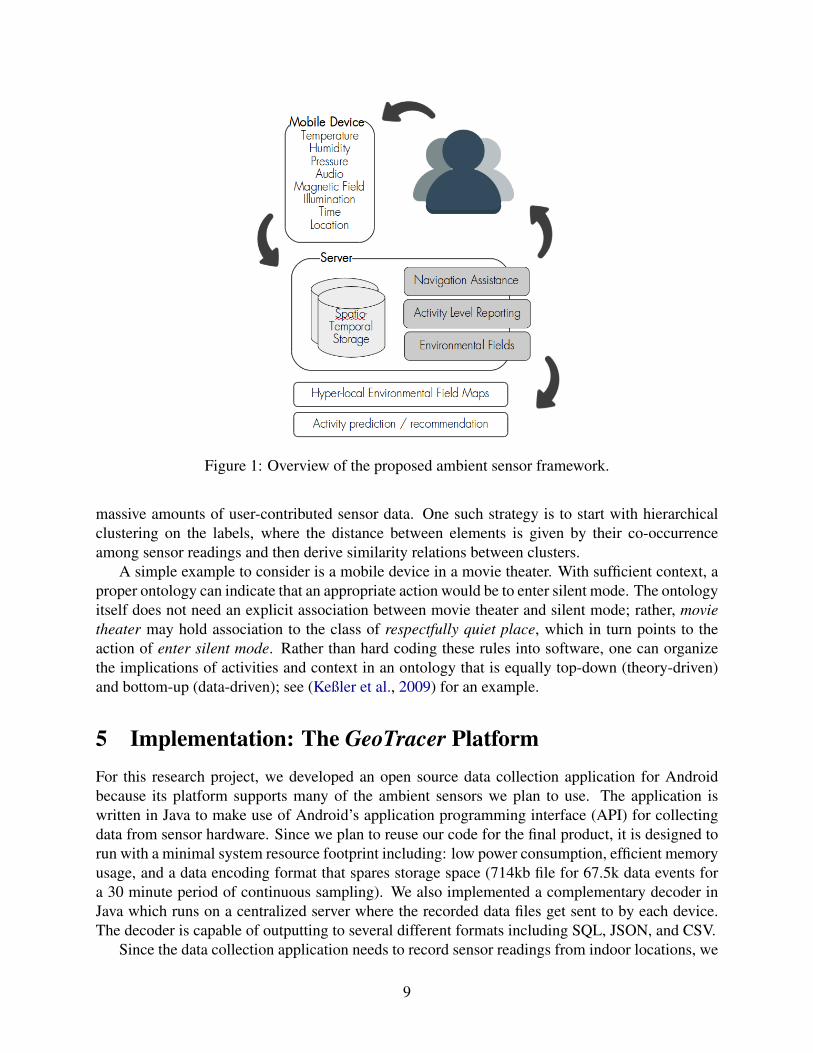
Figure 1: Overview of the proposed ambient sensor framework.
massive amounts of user-contributed sensor data. One such strategy is to start with hierarchicalclustering on the labels, where the distance between elements is given by their co-occurrenceamong sensor readings and then derive similarity relations between clusters.
A simple example to consider is a mobile device in a movie theater. With sufficient context, aproper ontology can indicate that an appropriate action would be to enter silent mode. The ontologyitself does not need an explicit association between movie theater and silent mode; rather, movietheater may hold association to the class of respectfully quiet place, which in turn points to theaction of enter silent mode. Rather than hard coding these rules into software, one can organizethe implications of activities and context in an ontology that is equally top-down (theory-driven)and bottom-up (data-driven); see (Keßler et al., 2009) for an example.
5 Implementation: The GeoTracer PlatformFor this research project, we developed an open source data collection application for Androidbecause its platform supports many of the ambient sensors we plan to use. The application iswritten in Java to make use of Android’s application programming interface (API) for collectingdata from sensor hardware. Since we plan to reuse our code for the final product, it is designed torun with a minimal system resource footprint including: low power consumption, efficient memoryusage, and a data encoding format that spares storage space (714kb file for 67.5k data events fora 30 minute period of continuous sampling). We also implemented a complementary decoder inJava which runs on a centralized server where the recorded data files get sent to by each device.The decoder is capable of outputting to several different formats including SQL, JSON, and CSV.
Since the data collection application needs to record sensor readings from indoor locations, we
9
had to associate each sample with the place from which it was collected. Rather than buildingan indoor positioning system to locate each sample spatially, we used floor plans of the focalbuildings allowing us to manually specify our location to the application’s interface. Since ourobjective was to identify place types and detect changes in activity, the spatial accuracy was lessimportant. Along with this interface, we also included a mechanism that allowed us to tag thetypes of activities that occurred at that place and time to establish a training dataset. Togglingactivity labels during our trials allowed us to associate sensor signatures with an activity. We thenused tagged activity data to train a place type classification model. Using the data we collectedin the field, our model then computes the alignment of each sensor signature to its correspondingclassification of place type, activity, and so on (see Figure 1). The output from this model is whatenables a smart environment to make predictions about the activities afforded by various placesat given times, the primary feature of such a framework. This prototype application is the firstiteration of the proposed platform. The version of the application currently in development allowsauthenticated users to annotate their sensor readings by toggling labeled tags as specific placesbased on their activity type. This improves the place type signatures over time as more data iscollected from a diverse variety of environments and thus makes the classification more robust.
6 ScenariosThe methods and framework discussed in the previous sections present the value of an ambientsensor-driven framework and describe our approach at an abstract level. In this section we intro-duce a number of scenarios that demonstrate the value of the information accessible via mobileambient sensors. Three scenarios are described along with some real-world sensor data examplesagainst which some use cases are validated. The purpose of these example scenarios is to give arepresentative overview as to what is possible through such a platform.
6.1 Enhancing Location TechnologiesCurrent approaches to navigation and place detection rely heavily on the use of radio technolo-gies such as GNSS, cellular trilateration (e.g., GSM, CDMA), Wi-Fi or Bluetooth. Each of theseapproaches, however, comes with its own strengths and weakness. For example, GNSS requiresline-of-sight between the receiver and multiple satellites, making it inadequate for indoor posi-tioning. Wi-Fi and Bluetooth methods require an ample number of beacons in an ideal spatialconfiguration to cover a service area, and are susceptible to marginal positioning errors such aslocating a user on the wrong floor in a building. We propose to use ambient sensors on a mobiledevice to complement current location technologies and in many cases, enhance them.
6.1.1 Scenario: Indoor vs. Outdoor
The first scenario that we investigate for enhancing location technologies is detecting place changeevents that might challenge the credibility of location providing services, such as the boundarybetween moving from outdoors to indoors where GNSS signals can no longer be trusted. Ourargument follows that the mere indication of such a place change event is reason enough to switchoff the GNSS sensor, preserve energy, and prevent location-consuming applications from being
10
misled about the user’s trajectory. Existing work has shown that ambient sensors on mobile devicescan reliably be used to detect room changes (Mazilu et al., 2013), for example walking from akitchen into a bedroom. Following this direction, and to support our assumption about GNSSreliability, we demonstrate that the same effect holds for detecting a place change event fromoutdoors to indoors.
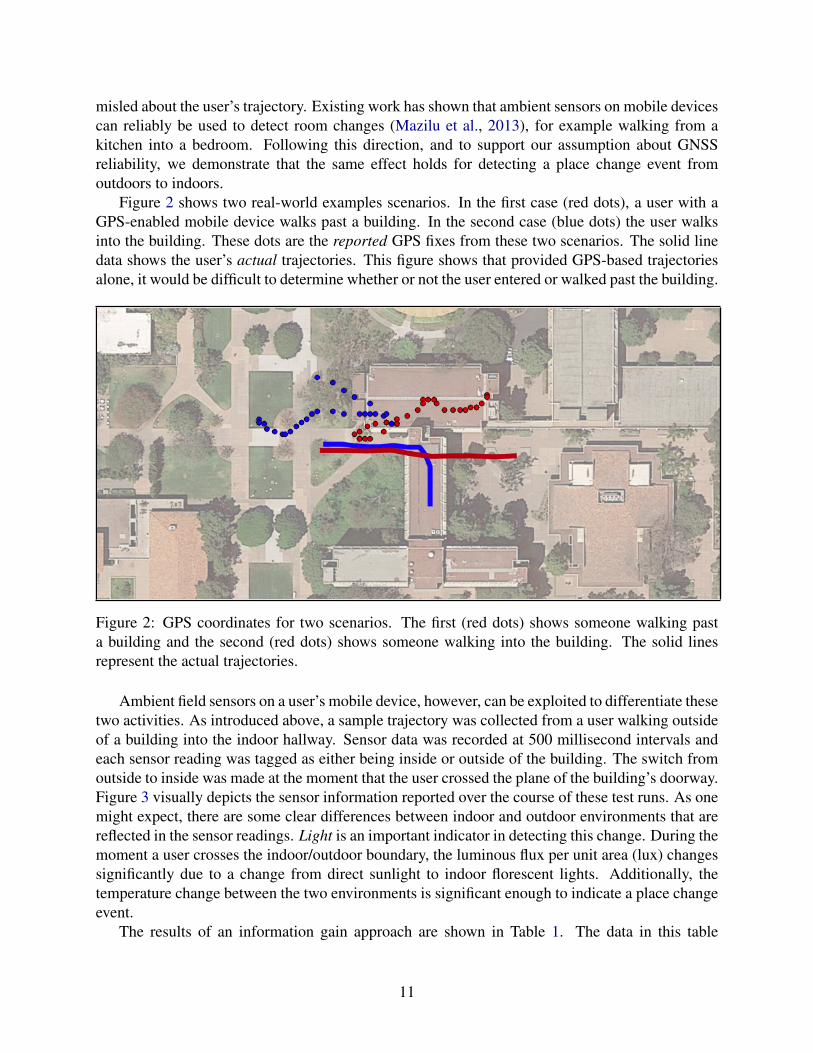
Figure 2 shows two real-world examples scenarios. In the first case (red dots), a user with aGPS-enabled mobile device walks past a building. In the second case (blue dots) the user walksinto the building. These dots are the reported GPS fixes from these two scenarios. The solid linedata shows the user’s actual trajectories. This figure shows that provided GPS-based trajectoriesalone, it would be difficult to determine whether or not the user entered or walked past the building.
Figure 2: GPS coordinates for two scenarios. The first (red dots) shows someone walking pasta building and the second (red dots) shows someone walking into the building. The solid linesrepresent the actual trajectories.
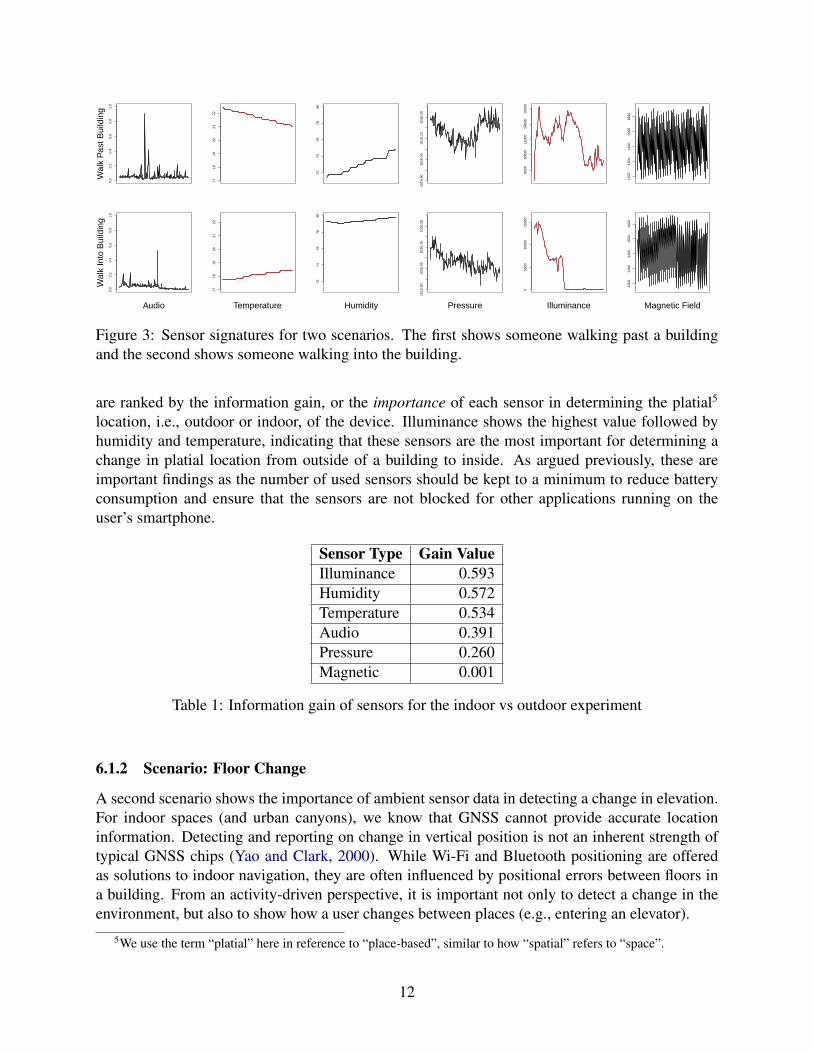
Ambient field sensors on a user’s mobile device, however, can be exploited to differentiate thesetwo activities. As introduced above, a sample trajectory was collected from a user walking outsideof a building into the indoor hallway. Sensor data was recorded at 500 millisecond intervals andeach sensor reading was tagged as either being inside or outside of the building. The switch fromoutside to inside was made at the moment that the user crossed the plane of the building’s doorway.Figure 3 visually depicts the sensor information reported over the course of these test runs. As onemight expect, there are some clear differences between indoor and outdoor environments that arereflected in the sensor readings. Light is an important indicator in detecting this change. During themoment a user crosses the indoor/outdoor boundary, the luminous flux per unit area (lux) changessignificantly due to a change from direct sunlight to indoor florescent lights. Additionally, thetemperature change between the two environments is significant enough to indicate a place changeevent.
The results of an information gain approach are shown in Table 1. The data in this table
11
0.0
0.2
0.4
0.6
0.8
1.0
Wal
k P
ast B
uild
ing
1718
1920
2122
7274
7678
80
1015
.90
1016
.00
1016
.10
1016
.20
8000
1000
012
000
1400
016
000
1200
1300
1400
1500
1600
0.0
0.2
0.4
0.6
0.8
1.0
Audio
Wal
k In
to B
uild
ing
1718
1920
2122
Temperature72
7476
7880
Humidity
1015
.90
1016
.00
1016
.10
1016
.20
Pressure
050
0010
000
1500
0
Illuminance
1200
1300
1400
1500
1600
Magnetic Field
Figure 3: Sensor signatures for two scenarios. The first shows someone walking past a buildingand the second shows someone walking into the building.
are ranked by the information gain, or the importance of each sensor in determining the platial5
location, i.e., outdoor or indoor, of the device. Illuminance shows the highest value followed byhumidity and temperature, indicating that these sensors are the most important for determining achange in platial location from outside of a building to inside. As argued previously, these areimportant findings as the number of used sensors should be kept to a minimum to reduce batteryconsumption and ensure that the sensors are not blocked for other applications running on theuser’s smartphone.
Sensor Type Gain ValueIlluminance 0.593Humidity 0.572Temperature 0.534Audio 0.391Pressure 0.260Magnetic 0.001
Table 1: Information gain of sensors for the indoor vs outdoor experiment
6.1.2 Scenario: Floor Change
A second scenario shows the importance of ambient sensor data in detecting a change in elevation.For indoor spaces (and urban canyons), we know that GNSS cannot provide accurate locationinformation. Detecting and reporting on change in vertical position is not an inherent strength oftypical GNSS chips (Yao and Clark, 2000). While Wi-Fi and Bluetooth positioning are offeredas solutions to indoor navigation, they are often influenced by positional errors between floors ina building. From an activity-driven perspective, it is important not only to detect a change in theenvironment, but also to show how a user changes between places (e.g., entering an elevator).
5We use the term “platial” here in reference to “place-based”, similar to how “spatial” refers to “space”.
12
22.0
22.5
23.0
23.5
24.0
1st fl
to 4
th fl
6061
6263
64
1005
.010
05.2
1005
.410
05.6
1005
.8
050
010
0015
00
2030
4050
60
22.0
22.5
23.0
23.5
24.0
Temperature
4th fl
to 2
nd fl
to 1
st fl
6061
6263
64
Humidity
1005
.010
05.2
1005
.410
05.6
1005
.8
Pressure
050
010
0015
00
Illuminance
2030
4050
60
Magnetic Field
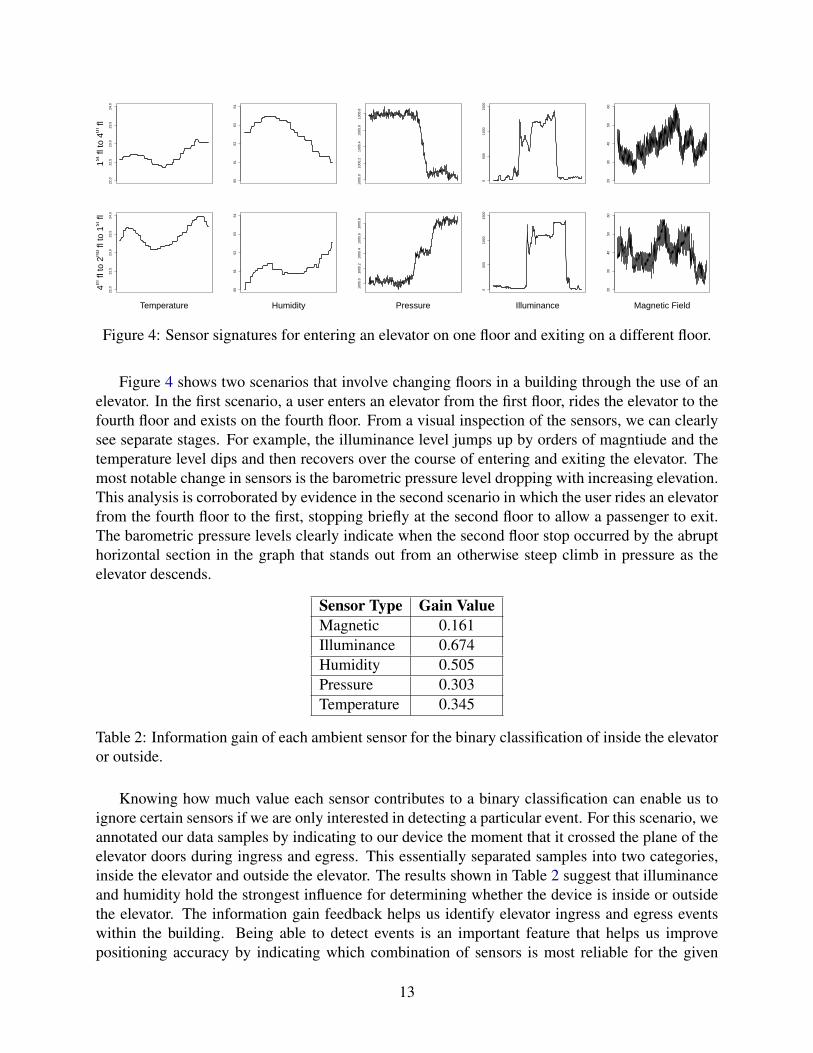
Figure 4: Sensor signatures for entering an elevator on one floor and exiting on a different floor.
Figure 4 shows two scenarios that involve changing floors in a building through the use of anelevator. In the first scenario, a user enters an elevator from the first floor, rides the elevator to thefourth floor and exists on the fourth floor. From a visual inspection of the sensors, we can clearlysee separate stages. For example, the illuminance level jumps up by orders of magntiude and thetemperature level dips and then recovers over the course of entering and exiting the elevator. Themost notable change in sensors is the barometric pressure level dropping with increasing elevation.This analysis is corroborated by evidence in the second scenario in which the user rides an elevatorfrom the fourth floor to the first, stopping briefly at the second floor to allow a passenger to exit.The barometric pressure levels clearly indicate when the second floor stop occurred by the abrupthorizontal section in the graph that stands out from an otherwise steep climb in pressure as theelevator descends.
Sensor Type Gain ValueMagnetic 0.161Illuminance 0.674Humidity 0.505Pressure 0.303Temperature 0.345
Table 2: Information gain of each ambient sensor for the binary classification of inside the elevatoror outside.
Knowing how much value each sensor contributes to a binary classification can enable us toignore certain sensors if we are only interested in detecting a particular event. For this scenario, weannotated our data samples by indicating to our device the moment that it crossed the plane of theelevator doors during ingress and egress. This essentially separated samples into two categories,inside the elevator and outside the elevator. The results shown in Table 2 suggest that illuminanceand humidity hold the strongest influence for determining whether the device is inside or outsidethe elevator. The information gain feedback helps us identify elevator ingress and egress eventswithin the building. Being able to detect events is an important feature that helps us improvepositioning accuracy by indicating which combination of sensors is most reliable for the given
13
environment, e.g. disabling GPS upon entering a building.
6.2 Place Type ClassificationIncreasingly, modern devices are beginning to make use of contextual awareness through theirautomatic responses to certain stimuli such as: entering hands-free mode when a user starts drivingtheir car, bypassing the lock screen at trusted locations, ignoring calls during certain times of theday, and so forth (Baldauf et al., 2007). We recognize an even greater potential to provide bothnative and third-party apps with contextual information about a user’s environment to enable smartfeatures. Since much of the measurable context relies on classifying the type of place as well asits activity affordances, we also briefly discuss how to construct a model of place types and how torender the implications.
6.2.1 Mode Switching
One potential use for contextual information about a user’s environment is the ability to automat-ically switch any application’s mode to better suit the environment. If a student were to walk intoa library and sit down in a study room, their phone could recognize its surrounding environment’sactivity affordance of studying and automatically switch to vibrate mode. Although this may seemtrivial to do with geofencing, our approach allows the model to recognize place types and activ-ity affordances in locations that have never before been observed. As long as the ambient sensorsignatures agree with the model, geographic location would only be used as a secondary datum torefine the context of a place’s environment.
In support of this concept, we ran an experiment to test the accuracy of predicting the activityaffordance of a user’s environment by using a support vector machine. To train the model, we col-lected data from ideal study rooms throughout the main library and student center buildings on aUniversity campus at different times of the day. We also collected data from several heterogeneousplaces around the student center in areas that were deemed not good for studying (e.g, restau-rants, social areas, etc.) to ensure the binary classifier would have sufficient samples of alternativeobservations. In total, we sampled from 12 different places and accumulated more than 740,000individual observations.
Sensor Type Gain ValueHumidity 0.577Illuminance 0.670Temperature 0.646Magnetic 0.029Pressure 0.669Audio 0.662
Table 3: Information gain of each ambient sensor for the binary classification of studying versusnot-studying.
The results of a 10-fold cross-validation yielded an average study affordance prediction ac-curacy of 99.7%. Each row of training and testing data represent a single observation from all
14
sensors recorded simultaneously. As seen in Table 3, information gain analysis reveals that illu-minance, pressure, and audio levels play the greatest role in determining whether or not a certainenvironment is suitable for studying. These encouraging results support continued research intothe potential uses of ambient sensor signatures. Future work will expand this sample to a widervariety of place types and activities at a larger scale.
6.2.2 Event Annotation
Another practical use for contextual information, such as the type of place, is to annotate eventsassociated with user interactions. Since people are strong at recalling memories by association, agroup of device interactions could be annotated with a place and activity type that occurred dur-ing its execution. Accurate metadata can enhance the efficiency of searching on documents andevents. For example, imagine a traveling scholar reading an article on their tablet while riding atrain to the airport. Before they can finish reading the article, they are interrupted by a phone callfrom a colleague. The scholar later powers down their device, losing the saved state of the PDFviewer they had open. Two weeks later, the scholar queries their device history for what docu-ment they had open the moment they received a phone call from their colleague while riding thetrain (Hu and Janowicz, 2012). In this example, human-computer interactions are grouped intomeaningful events so that they can later be processed as individuals, e.g., viewing PDF ‘X’, re-ceiving phone call from ‘Y’. The process of creating events such that they mirror the way a humanconceptualizes a group of interactions, along with selecting how to choose and represent relevantcontextual information to annotate the events with, e.g., riding the train, is a cognitive researchquestion that is outside the scope of this paper. However, the ‘raw materials’ of event annotationstem from a knowledge of time and space of the user’s immediate surrounding environment. Thetheoretical framework presented in this paper aims to achieve a similar effect, albeit restricted tothe hyper-local spatial domains.
6.3 Activity DetectionA key feature of our platform is to enable user-contributed sensor-driven location-based services.The basis of this idea hinges on the ability to accurately estimate the activity affordances of places.Assuming that the sensor network has a user present at some given place, we can detect the ac-tivities that are occurring at that location and then inform a remote user of its current state. Todrive the activity detection process, our service collects live ambient sensor readings from a deviceand feeds them into the service’s model to test against previous observations, i.e., place type andactivity signatures. To provide more context to our model and improve the accuracy of activitydetection, we also include the timestamp of each sample during training and testing phases. Here,we will examine one such scenario using only the ambient sensor data.
Scenario: Finding Places That Suit A Given Activity
A compelling scenario for a student might be to query a smart-campus service by asking it torecommend a place that offers an ideal setting for some activity, such as studying, relaxing, eating,and socializing. To simulate such a service, we ran an experiment in which various places oncampus could afford combinations of an established yet subjective set of activity types. Each type
15
does not preclude any others from occurring (i.e., they are not mutually exclusive). Each activitytype either occurs, or it does not. So for example, four activity types yields a total of 16 possiblecombinations. While our method for collecting the ambient sensor signatures remains the same asin the other experiments presented here, for this scenario we simply show that such data is alsofit for geographic services that may query for particular environmental qualities. To ensure thatsuch a service can distinguish between the varieties of sensor signatures that correlate with certainactivity types, we selected two activities with high co-occurrence (i.e., eating and socializing) andtwo activities we expected to have similar, or easily confused, ambient sensor signatures (i.e.,studying and relaxing).
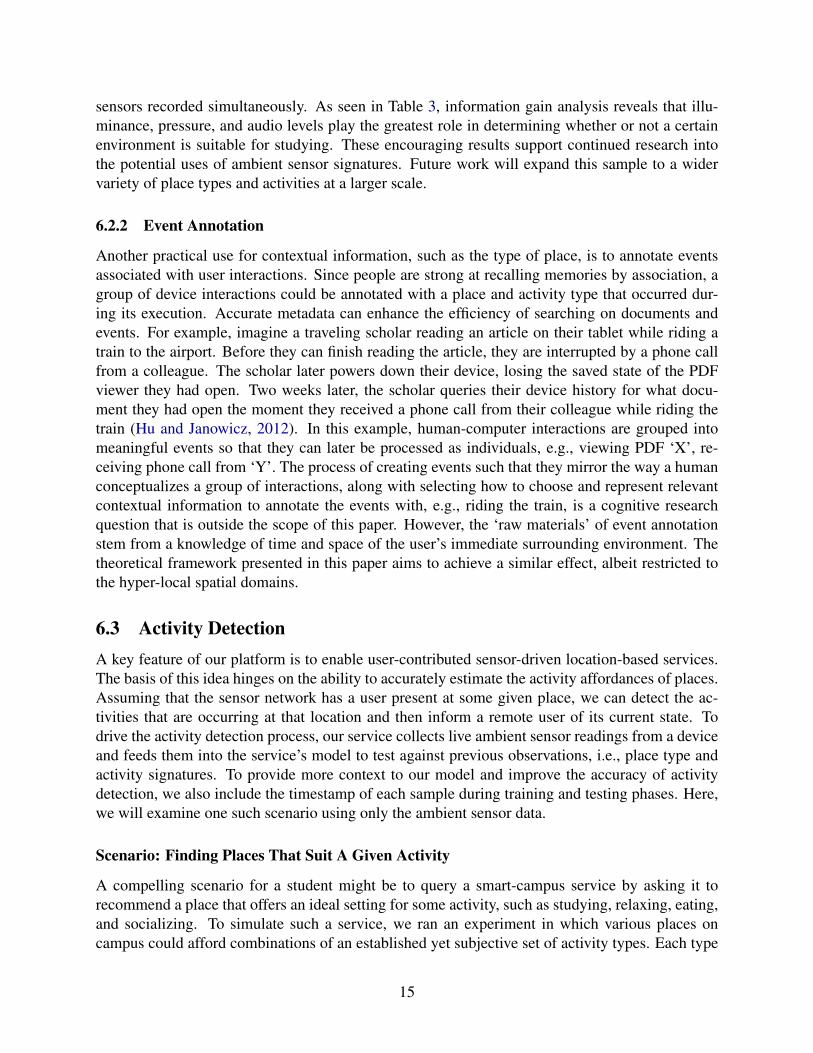
We collected ambient sensor signatures with six environmental features (i.e., humidity, pres-sure, magnetic, temperature, illuminance, and audio) and four activity labels (i.e., eating, relaxing,socializing, and studying) through the GeoTracer App on the mobile devices. After training amulti-class SVM using a 10-fold cross-validation approach (Kohavi, 1995), we generated a clas-sification confusion matrix to evaluate which, if any, activities are likely to be miscategorized andhinder prediction accuracy.
ObservedPrediction eating relaxing socializing studying other
eating 3691 0 0 148 0relaxing 0 27726 0 27 0socializing 2 0 27575 43 6studying 0 0 64 14548 64Accuracy 0.9987 0.9997 0.9994 0.9921 N/A Overall: 0.9961
Table 4: Confusion matrix for one of the 10-fold cross-validation results in the multi-class SVMclassification. The ‘other’ column accounts for predictions that did not hit their correspondingobservations when the original observation had more than one co-occurring tag. These included‘socializing & eating’ and ‘studying & relaxing’.
As is seen in Table 4, relaxing and studying were not readily confused in our model, althoughsubjectively we felt that the conditions of each environment were similar. Instead we find thatstudying and eating are most easily confused, indicating that the signatures with those activity la-bels exhibit similar qualities. Nonetheless, the overall accuracy of our activity-type prediction isquite high (about 99.6%) using the 10-fold cross-validation for evaluating our multi-class SVMclassification results. This small-scale evaluation suggests that ambient sensor signatures are suit-able data for an activity-type detection service.
6.4 Sensors as ServicesAn implication to computing activity affordances of place is the ability to approximate the cur-rent activity status of a known location (Jordan et al., 1998). For example, a student could tapinto their smart-campus sensor network to remotely check the status at some place of interest, e.g.crowdedness of the library. Assuming that a sensor-network contributor is present at the location,their device could provide regular updates to the centralized server, sending ambient sensor sam-ples of the environment to enable up-to-date estimations about the current activity state based on
16
sensor signatures. This sensors-as-a-service approach provides more accurate and real-time infor-mation about places as opposed to modern methods that rely on nth-degree information or somepreconceived default, e.g., hours of operation.
Scenario: Are the (indoor) basketball courts busy?
For our hypothetical scenario, we chose to ask the question, “Are the basketball courts in-use ornot?” Using an SVM with a binary classification of ‘in use’ or ‘not in use’, and only samplingwhen the court was objectively one or the other, we trained our model using samples collected atthree different times throughout the day. 235,000 ambient sensor observations were used to trainthe model, half of them were ‘in use’ tags while the other half were ‘not in use’. We then col-lected samples to be used exclusively as testing data in order to simulate the challenges that highlydynamic spaces pose against support vector machines. We generated predictions for all 26,000observations of testing data that were collected from a single trace. The testing data included both‘in use’ and ‘not in use’ tags. The accuracy of our model’s predictions against this blind testingdata was 85.37%.
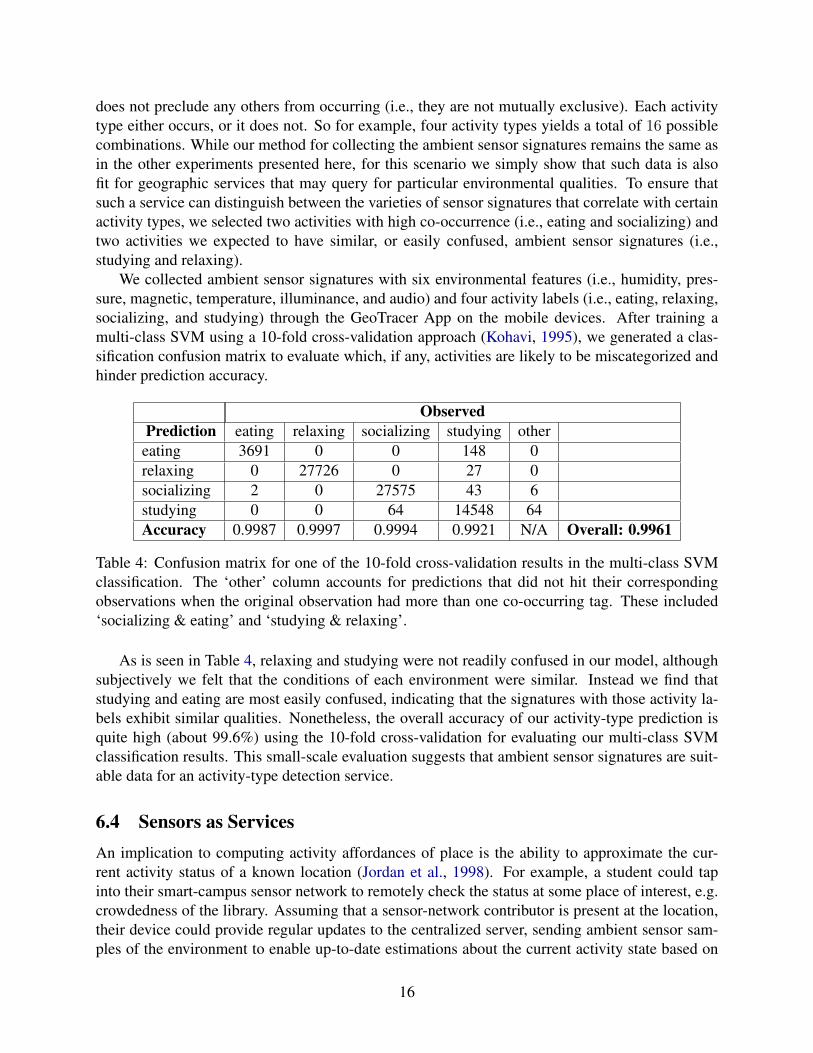
To optimize the performance and experiment with improving the accuracy of our predictions,it is important to analyze how much each sensor band contributes to distinguishing between thetwo different states. To do this, we evaluated the information gain of each sensor.
Sensor Type Gain ValueTemperature 0.677Audio 0.675Humidity 0.670Illuminance 0.628Pressure 0.565Magnetic Field 0.012
Table 5: Information gain for sensor data readings based an active basketball court vs. inactivebasketball court.
The results of our information gain analysis, as seen in Table 5, indicate that the magnetic sen-sor has the weakest correlation to activity status, as one would expect. Interestingly, temperature,audio, and humidity showed the highest information gain values indicating they contributed themost towards determining activity status. These findings are consistent with what one might ex-pect. Temperature and humidity likely increase due to energy exertion and perspiration on the partof the athletes. Given the confines of the closed-door basketball court, it is not surprising that thelocal temperature and humidity would increase during such an activity. The impact on the audiosensor signature is expected as well as there is considerable difference between an empty court anda basketball game in-progress.
7 Conclusions & Future WorkModern approaches to developing smart cities depend on augmenting existing infrastructure withfixed instruments, an expensive process that requires careful planning in order to provide effective
17
coverage to its service area. Instruments must be installed adequately enough to deter sabotage yetaccessible enough to perform maintenance. Additionally, these node-on-a-network instruments aresusceptible to hacking attacks that can lead to compromised networks. In this work, we proposeda mobile sensor-based platform that empowers citizens to collect and share information collectedvia their mobile devices. This approach allows any environment to become equipped with a freead-hoc sensor network without depending on proprietary instrumentation. The platform requiresonly a few hundred milliseconds worth of ambient sensor data to provide several practical servicefeatures, sparing users’ device batteries while preserving their privacy. And thus the proposedframework could be scaled to a variety of urban areas (e.g., university campuses, shopping malls,city centers, suburbs). Compared to traditional smart city implementations, scaling this frameworkto larger settings is not limited by physical infrastructure, spatial constraints or financial barrierssince it operates by creating an ad-hoc network on top of an existing and dynamic infrastructure.As a proof of concept, we developed a system to collect and share crowdsensing data and showedmultiple use-case scenarios about its usages on a university campus.
Future work in this area will involve continued development of the GeoTracer application fordata collection, sensor signature training and place-type classification, and scaling both to moreplace (types) and participants. In addition, further research will explore a temporally weightedapproach to sensor value aggregation with the purpose of continually updating place-type classi-fication models with the most recent sensor readings. Lastly, we are currently exploring methodsfor fully implementing the sensors as a service model allowing ad-hoc querying of hyper-localenvironmental conditions.
Acknowledgement The authors would like to acknowledge partial support by the National Sci-ence Foundation (NSF) under award 1440202 EarthCube Building Blocks: Collaborative Pro-posal: GeoLink Leveraging Semantics and Linked Data for Data Sharing and Discovery in theGeosciences and NSF award 1540849 EarthCube IA: Collaborative Proposal: Cross-Domain Ob-servational Metadata Environmental Sensing Network (X-DOMES).
ReferencesBaldauf, M., Dustdar, S., Rosenberg, F., 2007. A survey on context-aware systems. International
Journal of Ad Hoc and Ubiquitous Computing 2 (4), 263–277.
Bhattacharya, S., Blunck, H., Kjærgaard, M. B., Nurmi, P., 2015. Robust and energy-efficienttrajectory tracking for mobile devices. Mobile Computing, IEEE Transactions on 14 (2), 430–443.
Cardone, G., Foschini, L., Bellavista, P., Corradi, A., Borcea, C., Talasila, M., Curtmola, R., 2013.Fostering participaction in smart cities: a geo-social crowdsensing platform. CommunicationsMagazine, IEEE 51 (6), 112–119.
Carroll, A., Heiser, G., 2010. An analysis of power consumption in a smartphone. In: USENIXannual technical conference. Vol. 14. Boston, MA.
Cerrudo, C., 2015. An emerging us (and world) threat: Cities wide open to cyber attacks. SecuringSmart Cities .
18
Chaudhri, V. K., Cheyer, A., Guilii, R., Jarrold, W., Myers, K., Niekarsz, J., 2006. A case study inengineering a knowledge base for an intelligent personal assistant. In: SemDesk.
Edwards, W. K., Grinter, R. E., 2001. At home with ubiquitous computing: Seven challenges. In:Ubicomp 2001: Ubiquitous Computing. Springer, pp. 256–272.
Elhamshary, M., Youssef, M., 2015. SemSense: Automatic construction of semantic indoor floor-plans. In: Indoor Positioning and Indoor Navigation (IPIN), 2015 International Conference on.IEEE, pp. 1–11.
Elmaghraby, A. S., Losavio, M. M., 2014. Cyber security challenges in smart cities: Safety, secu-rity and privacy. Journal of advanced research 5 (4), 491–497.
Ganti, R. K., Ye, F., Lei, H., 2011. Mobile crowdsensing: current state and future challenges. IEEECommunications Magazine 49 (11), 32–39.
Goodchild, M. F., 2007. Citizens as sensors: the world of volunteered geography. GeoJournal69 (4), 211–221.
Hu, Y., Janowicz, K., 2012. Improving personal information management by integrating activi-ties in the physical world with the semantic desktop. In: Proceedings of the 20th InternationalConference on Advances in Geographic Information Systems. ACM, pp. 578–581.
Janowicz, K., 2012. Observation-driven geo-ontology engineering. Transactions in GIS 16 (3),351–374.
Jordan, T., Raubal, M., Gartrell, B., Egenhofer, M., 1998. An affordance-based model of place ingis. In: 8th Int. Symposium on Spatial Data Handling, SDH. Vol. 98. pp. 98–109.
Keßler, C., Raubal, M., Wosniok, C., 2009. Semantic rules for context-aware geographical infor-mation retrieval. In: Smart Sensing and Context. Springer, pp. 77–92.
Klepeis, N. E., Nelson, W. C., Ott, W. R., Robinson, J. P., Tsang, A. M., Switzer, P., Behar, J. V.,Hern, S. C., Engelmann, W. H., et al., 2001. The national human activity pattern survey (nhaps):a resource for assessing exposure to environmental pollutants. Journal of exposure analysis andenvironmental epidemiology 11 (3), 231–252.
Kohavi, R., 1995. A study of cross-validation and bootstrap for accuracy estimation and model se-lection. In: Proceedings of the International Joint Conference on Artificial Intelligence (IJCAI).Vol. 14(2). pp. 1137–1145.
Komninos, N., 2002. Intelligent cities: innovation, knowledge systems, and digital spaces. Taylor& Francis.
Kuhn, M., 2008. Building predictive models in r using the caret package. Journal of StatisticalSoftware 28 (5).
Lane, N. D., Miluzzo, E., Lu, H., Peebles, D., Choudhury, T., Campbell, A. T., 2010. A survey ofmobile phone sensing. Communications Magazine, IEEE 48 (9), 140–150.
19
Lin, K., Kansal, A., Lymberopoulos, D., Zhao, F., 2010. Energy-accuracy trade-off for continuousmobile device location. In: Proceedings of the 8th international conference on Mobile systems,applications, and services. ACM, pp. 285–298.
Martins, P. M., McCann, J. A., 2015. The programmable city. Procedia Computer Science 52,334–341.
Mazilu, S., Blanke, U., Calatroni, A., Troster, G., 2013. Low-power ambient sensing in smart-phones for continuous semantic localization. In: Ambient Intelligence. Springer, pp. 166–181.
McKenzie, G., Janowicz, K., 2015. Where is also about time: A location-distortion model to im-prove reverse geocoding using behavior-driven temporal semantic signatures. Computers, Envi-ronment and Urban Systems 54, 1–13.
McKenzie, G., Janowicz, K., Gao, S., Yang, J.-A., Hu, Y., 2015. Poi pulse: A multi-granular,semantic signatures-based approach for the interactive visualization of big geosocial data. Car-tographica: The International Journal for Geographic Information and Geovisualization, TheUniversity of Toronto Press 50 (2), 71–85.
Mohan, P., Padmanabhan, V. N., Ramjee, R., 2008. Nericell: rich monitoring of road and trafficconditions using mobile smartphones. In: Proceedings of the 6th ACM conference on Embeddednetwork sensor systems. ACM, pp. 323–336.
OpenSignal, July 2015. Android fragmentation 2015 report. Online, retrieved 02 January 2015.
Paek, J., Kim, J., Govindan, R., 2010. Energy-efficient rate-adaptive gps-based positioning forsmartphones. In: Proceedings of the 8th international conference on Mobile systems, applica-tions, and services. ACM, pp. 299–314.
Quinlan, J. R., 1986. Induction of decision trees. Machine learning 1 (1), 81–106.
Santini, S., Ostermaier, B., Adelmann, R., 2009. On the use of sensor nodes and mobile phones forthe assessment of noise pollution levels in urban environments. In: Networked Sensing Systems(INSS), 2009 Sixth International Conference on. IEEE, pp. 1–8.
Savelyev, A., Xu, S., Janowicz, K., Mulligann, C., Thatcher, J., Luo, W., 2011. Volunteered geo-graphic services: developing a linked data driven location-based service. In: Proceedings of the1st ACM SIGSPATIAL International Workshop on Spatial Semantics and Ontologies. ACM, pp.25–31.
Scheider, S., Janowicz, K., 2014. Place reference systems. Applied Ontology 9 (2), 97–127.
Sen, M., Dutt, A., Agarwal, S., Nath, A., 2013. Issues of privacy and security in the role of soft-ware in smart cities. In: Communication Systems and Network Technologies (CSNT), 2013International Conference on. IEEE, pp. 518–523.
Shannon, C. E., 1951. Prediction and entropy of printed english. Bell system technical journal30 (1), 50–64.
20
Suykens, J. A., Vandewalle, J., 1999. Least squares support vector machine classifiers. Neuralprocessing letters 9 (3), 293–300.
Vincent, J., August 2013. London’s bins are tracking your smartphone. Independent, retrieved 02February 2016.
Wang, Y., Lin, J., Annavaram, M., Jacobson, Q. A., Hong, J., Krishnamachari, B., Sadeh, N.,2009a. A framework of energy efficient mobile sensing for automatic user state recognition. In:Proceedings of the 7th international conference on Mobile systems, applications, and services.ACM, pp. 179–192.
Wang, Y., Lin, J., Annavaram, M., Jacobson, Q. A., Hong, J., Krishnamachari, B., Sadeh, N.,2009b. A framework of energy efficient mobile sensing for automatic user state recognition. In:Proceedings of the 7th international conference on Mobile systems, applications, and services.ACM, pp. 179–192.
Xia, C., Schwartz, R., Xie, K., Krebs, A., Langdon, A., Ting, J., Naaman, M., 2014. Citybeat:Real-time social media visualization of hyper-local city data. In: Proceedings of the companionpublication of the 23rd international conference on World wide web companion. InternationalWorld Wide Web Conferences Steering Committee, pp. 167–170.
Yao, H., Clark, R., 2000. Evaluation of sub-meter and 2 to 5 meter accuracy gps receivers todevelop digital elevation models. Precision Agriculture 2 (2), 189–200.
Zandbergen, P. A., 2009. Accuracy of iphone locations: A comparison of assisted gps, wifi andcellular positioning. Transactions in GIS 13 (s1), 5–25.
Zheng, Y., Liu, T., Wang, Y., Zhu, Y., Liu, Y., Chang, E., 2014. Diagnosing new york city’snoises with ubiquitous data. In: Proceedings of the 2014 ACM International Joint Conferenceon Pervasive and Ubiquitous Computing. ACM, pp. 715–725.
21