Crosslinked conventional size and nanoparticle size ...
223
Eastern Michigan University DigitalCommons@EMU Master's eses and Doctoral Dissertations Master's eses, and Doctoral Dissertations, and Graduate Capstone Projects 4-6-2010 Crosslinked conventional size and nanoparticle size acrylic latexes and their blends: Investigation of the effects of crosslinking, particle size and distribution, glass transition temperature and blending on film formation, properties and morphology Ravi Ghanshyambhai Joshi Follow this and additional works at: hp://commons.emich.edu/theses Part of the Polymer and Organic Materials Commons is Open Access Dissertation is brought to you for free and open access by the Master's eses, and Doctoral Dissertations, and Graduate Capstone Projects at DigitalCommons@EMU. It has been accepted for inclusion in Master's eses and Doctoral Dissertations by an authorized administrator of DigitalCommons@EMU. For more information, please contact [email protected]. Recommended Citation Joshi, Ravi Ghanshyambhai, "Crosslinked conventional size and nanoparticle size acrylic latexes and their blends: Investigation of the effects of crosslinking, particle size and distribution, glass transition temperature and blending on film formation, properties and morphology" (2010). Master's eses and Doctoral Dissertations. 283. hp://commons.emich.edu/theses/283
Transcript of Crosslinked conventional size and nanoparticle size ...

Eastern Michigan UniversityDigitalCommons@EMU
Master's Theses and Doctoral Dissertations Master's Theses, and Doctoral Dissertations, andGraduate Capstone Projects
4-6-2010
Crosslinked conventional size and nanoparticle sizeacrylic latexes and their blends: Investigation of theeffects of crosslinking, particle size and distribution,glass transition temperature and blending on filmformation, properties and morphologyRavi Ghanshyambhai Joshi
Follow this and additional works at: http://commons.emich.edu/theses
Part of the Polymer and Organic Materials Commons
This Open Access Dissertation is brought to you for free and open access by the Master's Theses, and Doctoral Dissertations, and Graduate CapstoneProjects at DigitalCommons@EMU. It has been accepted for inclusion in Master's Theses and Doctoral Dissertations by an authorized administrator ofDigitalCommons@EMU. For more information, please contact [email protected].
Recommended CitationJoshi, Ravi Ghanshyambhai, "Crosslinked conventional size and nanoparticle size acrylic latexes and their blends: Investigation of theeffects of crosslinking, particle size and distribution, glass transition temperature and blending on film formation, properties andmorphology" (2010). Master's Theses and Doctoral Dissertations. 283.http://commons.emich.edu/theses/283

Crosslinked Conventional Size and Nanoparticle Size Acrylic Latexes and Their Blends:
Investigation of the Effects of Crosslinking, Particle Size and Distribution, Glass Transition
Temperature and Blending on Film Formation, Properties and Morphology
by
Ravi Ghanshyambhai Joshi
Doctoral Thesis
Submitted to School of Engineering Technology in College of Technology
Eastern Michigan University
in partial fulfillment of the requirements for the degree of
DOCTOR OF PHILOSOPHY
in
Technology with a concentration in Polymers and Coatings
Thesis Committee:
Vijaykumar Mannari, PhD, Chair
Frank N. Jones, PhD
Mary L. Brake, PhD
Weidian Shen, PhD
Theodore Provder, PhD (Additional Member)
April 6, 2010
Ypsilanti, Michigan

Dedication
Almighty God
&
My family
ii

Acknowledgements
PhD Program at College of Technology, Eastern Michigan University
Doctoral Fellowship Program, Graduate School, Eastern Michigan University
Surface Science Research Center at Eastern Michigan University
Rene Crombez and Malik C. Nagolu for SPM work
Dr. Weihua (Marshall) Ming for guidance and help with experimental of modified
microemulsion process
Sarjak Amin, Paul Ziemer, Ninad Dixit, Chirag Patel, Elodie Lefereve, Achin Goel, and
Kumaril Kapadia for valuable technical discussions, experimental lab set-up
Dr. Bruce Weiner (Brookhaven Instruments) troubleshooting with nanoparticle size
measurements
Dr. Fred Willard and Marty D., CASMI Labs for lab supplies & ASTM test methods
Madhavi Joshi for valuable technical discussions, nanoparticle synthesis plan,
experimental set up, end-use properties testing, and samples preparation for mechanical
and thermal analysis testing
iii

Abstract
Synthetic latexes have many product applications including functioning as a binder in paints and coatings. For many years, researchers in industry as well as in academe have been exploring various strategies to improve performance of acrylic latexes mainly to replace traditionally used solvent borne coatings due to increasing environmental concerns and strict governmental regulations. The main goal of the study is to investigate the effects of type (pre-coalescence or post-coalescence) and level of crosslinking, particle size (nano particle size ~ 20-25 nm vs. conventional particle size ~ 120-130 nm) and distribution, glass transition temperature (Tg), and blending on latex film formation process, properties and latex morphology. Films cast from these latexes were characterized using specific end use tests and fundamental properties using advanced instruments such as a dynamic mechanical analyzer (DMA), thermogravimetric analyzer (TGA), modulated differential scanning calorimeter (MDSC), nano-indenter, and atomic force microscope (AFM). The results showed significant improvements in acrylic latex performance proposing coatings near zero VOC and forming basis for exploring potential commercial applications of functional nanosize latexes and their blends.
iv

TABLE OF CONTENTS
Dedication…………………………………………………………………………………………ii
Acknowledgements………………………………………………………………………………iii
Abstract…………………………………………………………………………………………..iv
List of Tables…………………………………………………………………………………….vii
List of Figures……………………………………………………………………………………..x
Chapter 1: Introduction……………………………………………………....................................1
References…………………………………………………………………………………………8
Chapter 2: Historical Overview…………………………………….............................................12
References……………………………………………..................................................................22
Chapter 3: Effects of pre-coalescence or post-coalescence crosslinking and glass transition
temperature………………………………………………………………………………………26
Introduction………………………………………………………………………………………26
Experimental Details…………………………………..................................................................28
Characterization of Latexes……………………………………………………………………...32
Results and Discussion…………………………………………………………………………..36
Conclusions………………………………………………………………………………………76
References…………………………………………………………………..................................80
Chapter 4: Synthesis and characterization of nanosize acrylic latex and comparison to their
conventional sized counterparts...………………………………………………………………..82
Introduction………………………………………………………………………………………82
Experimental Details…………………………………..................................................................86
Characterization of Latexes……………………………………………………………………...90
v

Results and Discussion…………………………………………………………………………102
Conclusions……………………………………………………………………………………..122
References…………………………………………………………………................................125
Chapter 5: Blends of conventional size and nanoparticle size acrylic latexes………………….129 Introduction……………………………………………………………………………………..129
Experimental Details…………………………………................................................................132
Characterization of Latexes…………………………………………………………………….136
Results and Discussion…………………………………………………………………………141
Conclusions……………………………………………………………………………………..199
References…………………………………………………………………................................201
Chapter 6: Conclusions…………………………………………………………………………204
vi

LIST OF TABLES
Table Page
3.1 Characteristics of 1, 3-BGDMA Pre-coalescence Crosslinked Latexes…………………38
3.2 Characteristics of DAA Externally Crosslinkable Latexes………………………............39
3.3 Empirical properties of films cast from internally crosslinked latexes…………………..55
3.4 Empirical properties of films cast from externally crosslinked latexes………………….55
3.5 Results of Stress-Strain Analysis………………………………………………………...58
3.6 Comparison of DMA values with MDSC Tg values……………………………………..66
4.1 Composition table for nanosize latexes (with or without functional group)…………….89
4.2 Characteristics of nanosize (with or without crosslinker) latexes……………………….96
4.3 Characteristics of conventional (with or without crosslinker) latexes…………………...96
4.4 End use properties of films cast from conventional latexes……………………………110
4.5 End use properties of films cast from nanosize latexes………………………………...110
4.6 Comparison of surface smoothness and gloss values of nanoparticle latexes and
their conventional counter parts………………………………………………………………...110
4.7 Results of stress-strain analysis of nanosize latexes……………………………………113
4.8 Results of stress-strain analysis of conventional size latexes…………………………..113
4.9 Comparison of DMA values with MDSC Tg values of conventionally size
pre-coalescence or post-coalescence crosslinked latexes………………………………………119
4.10 Comparison of DMA values with MDSC Tg values of nano size pre-coalescence or
post-coalescence crosslinked latexes…………………………………………………………...119
vii

5.1 Characteristics of conventionally sized (with or without crosslinker) latexes…………134
5.2 Characteristics of nanosize (with or without crosslinker) latexes……………………...134
5.3 Characteristics of ten most representative latex blends………………………………...135
5.4(a) MFT crack point (MFTc) of latex blends………………………………………………148
5.4(b) MFT knife point (MFTk) of latex blends………………………………………………149
5.5 MDSC Tg of latex blends……………………………………………………………….149
5.6 Cross- cut Adhesion (ASTM D 3359) of latex blends………………………………….151
5.7 Pencil Hardness (ASTM D 3363) of latex blends……………………………………...151
5.8 Solvent Resistance (MEK 2 Rub) of latex blends……………………………………...151
5.9 Elevated Temperature Block Resistance (ASTM D 4946) of latex blends…………….152
5.10 Acid - Open Spot Test (ASTM D 1308) of latex blends……………………………….152
5.11 Water - Open Spot Test (ASTM D 1308) of latex blends……………………………...153
5.12 Specular Gloss (ASTM D 523) of latex blends………………………………………...153
5.13 Formulation matrix based on end-use properties results………………………………..166
5.14 Latex blend series L0_nL0……………………………………………………………...167
5.15 Latex blend series L0_nIL4…………………………………………………………….168
5.16 Latex blend series L0_nEL2……………………………………………………………168
5.17 Latex blend series H0_nL0……………………………………………………………..168
5.18 Latex blend series H0_nIL2…………………………………………………………….169
5.19 Latex blend series H0_nEL5……………………………………………………………169
5.20 Latex blend series EL5_nL0……………………………………………………………169
5.21 Latex blend series IL4_nL0…………………………………………………………….170
5.22 Latex blend series EH5_nL0……………………………………………………………170
viii

5.23 Latex blend series IH4_nL0…………………………………………………………….170
5.24 Latex blend series L0_nL0……………………………………………………………...194
5.25 Latex blend series L0_nIL4…………………………………………………………….194
5.26 Latex blend series L0_nEL2……………………………………………………………195
5.27 Latex blend series H0_nL0……………………………………………………………..195
5.28 Latex blend series H0_nIL2…………………………………………………………….196
5.29 Latex blend series H0_nEL5……………………………………………………………196
5.30 Latex blend series EL5_nL0……………………………………………………………197
5.31 Latex blend series IL4_nL0…………………………………………………………….197
5.32 Latex blend series EH5_nL0……………………………………………………………198
5.33 Latex blend series IH4_nL0…………………………………………………………….198
ix
LIST OF FIGURES
Figure Page
3.A Schematic representation of 1, 3-BGDMA………………………………………………37
3.B Schematic representation of the latex film formation process…………………………...40
3.C Schematic representation of DAA & ADDH crosslinking reaction……………………..43
3.D Representative friction images of morphological changes observed by AFM contact
mode during the film formation………………………………………………………………….50
3.1 Gel Content of Pre-coalescence Crosslinked Latex Films……………………………….45
3.2 Gel Content of Post-coalescence Crosslinked Latex Films……………………………...45
3.3 20 μm × 20 μm AFM topographic image (left) and frictional image (right) of
Sample IH-4……………………………………………………………………………………46
3.4 5 μm × 5 μm AFM topographic image and frictional images of Sample IH-4………….47
3.5 AFM topographic Images of Sample EL-1 (top) and IH-4 (bottom). The two
images have different Z scales, and surface of EL-1 is much rougher than that of IH-4………..48
3.6 Comparison of hardness of samples in groups EL and IL with different crosslinker
levels. The hardness was measured under a normal force of 1 mN……………………………..51
3.7 Comparison of moduli of samples in groups EL and IL with different crosslinker
levels. The modulus was measured under a normal force of 1 mN……………………………..52
3.8 Comparison of hardness of samples in groups EH and IH with different
crosslinker levels. The hardness was measured under a normal force of 1 mN………………...53
3.9 Comparison of modulus of samples in groups EH and IH with different crosslinker
x

levels. The modulus was measured under a normal force of 1 mN……………………………..53
3.10 Optical Images of the Residual Indentation in films cast from latexes IL-1.2 and
IH-1.2 (1000x)…………………………………………………………………………………...54
3.11 Average Stress-Strain Curves for Post-Coalescence Series: Low Tg……………………59
3.12 Average Stress-Strain Curves for Post-Coalescence Series: High Tg……………………60
3.13 Average Stress-Strain Curves for Pre-Coalescence Series: Low Tg……………………..61
3.14 Average Stress-Strain Curves for Pre-Coalescence Series: High Tg…………………….62
3.15 Storage and Loss modulus curves of Post-coalescence Crosslinked Latexes: High Tg….63
3.16 Storage and Loss modulus curves of Post-coalescence Crosslinked Latexes: Low Tg….64
3.17 Tan delta curves of Post-coalescence Crosslinked Latexes: High Tg …………………...67
3.18 Tan delta curves of Post-coalescence Crosslinked Latexes: Low Tg……………………68
3.19 Tan delta curves of Pre-coalescence Crosslinked Latexes: Low Tg……………………..70
3.20 Tan delta curves of Pre-coalescence Crosslinked Latexes: High Tg……………………..71
3.21(a) Representative curves showing 1st day vs. 7th day comparison of stress-strain analysis
of EL series………………………………………………………………………………………72
3.21(b) Representative curves showing 1st day vs. 7th day comparison of stress-strain analysis
of IL series……………………………………………………………………………………….72
3.22(a) Representative tan delta curves showing 1st day vs. 7th day comparison of
DMA studies of EL-2…………………………………………………………………………….73
3.22(b) Representative tan delta curves showing 1st day vs. 7th day comparison of
DMA studies of IL- 1.2 samples…………………………………………………………………74
3.23(a) Time based stress-strain analysis of EH-0 at ambeint conditions……………………….75
3.23(b) Time based DMA analysis of EH-0 at ambeint conditions……………………………...75
xi

4.1 Particle Size Analysis Graphs of nanoparticle latexes (Brookhaven Instruments
90 plus Particle Size Software Output)
(a) Nanoparticle latex with no crosslinker, nL0…………………………………………………..97
(b) Nanoparticle latex with 2% post-coalescence crosslinker, nEL2……………………….98
(c) Nanoparticle latex with 5% post-coalescence crosslinker, nEL5………………………..99
(d) Nanoparticle latex with 2% pre-coalescence crosslinker, nIL2…………………………...100
(e) Nanoparticle latex with 4% pre-coalescence crosslinker, nIL4…………………………...101
4.2 Crosslinking reaction for DAA monomer………………………………………………105
4.3(a) Comparison of gel content of pre-coalescence crosslinked
nanosize vs. conventional latexes………………………………………………………………107
4.3(b) Comparison of gel content of post-coalescence crosslinked
nanosize vs. conventional latexes………………………………………………………………107
4.4 AFM tapping mode phase images of (a) nL0, (b) nIL4, and (c) nEL5 at image
size of 1um X 1um……………………………………………………………………………...111
4.5 AFM tapping mode height images of (a) nL0, (b) nIL4, and (c) nEL5 at image
size of 1um X 1um……………………………………………………………………………...111
4.6 AFM tapping mode height images of (a) L0, (b) nIL4, and (c) nEL5 at image
size of 2um X 2um……………………………………………………………………………...112
4.7 Comparison of surface smoothness and gloss values of nanoparticle latexes
and their conventional counter parts……………………………………………………………112
4.8 Comparison of average stress-strain curves for pre-coalescence crosslinked
nanosize latex series…………………………………………………………………………….115
4.9 Comparison of average stress-strain curves for post-coalescence crosslinked
xii

nanosize latex series……………………………………………………………………………115
4.10 Comparison of average stress-strain curves for post-coalescence crosslinked
conventional latex series………………………………………………………………………..116
4.11 Comparison of average stress-strain curves for post-coalescence crosslinked
conventional latex series………………………………………………………………………..116
4.12 Comparison of storage and loss modulus curves of pre-coalescence crosslinker
nanoparticle latex series………………………………………………………………………...117
4.13 Comparison of storage and loss modulus curves of post-coalescence crosslinker
nanoparticle latex series………………………………………………………………………..117
5. A Volleyball (conventional particles ~120-130nm) vs. golf ball
(nanoparticles ~ 20-25 nm)……………………………………………………………………..179
5.1 Comparison of gel content of (a) pre-coalescence crosslinked nanosize
vs. conventional latexes and (b) post-coalescence crosslinked nanosize
vs. conventional latexes………………………………………………………………………...135
5.2 Crosslinking reactions for DAA monomer……………………………………………..144
5.3 L0_nL0 (from left to right - nanolatex concentration: 0%, 15%, 30%, 50%, 70%,
and 100%)………………………………………………………………………………………158
5.4 L0_nIL4 (from left to right - nanolatex concentration: 0%, 15%, 30%, 50%, 70%,
and 100%)………………………………………………………………………………………158
5.5 L0_nEL2 (from left to right - nanolatex concentration: 0%, 15%, 30%, 50%, 70%,
and 100%)………………………………………………………………………………………158
5.6 H0_nL0 (from left to right - nanolatex concentration: 0%, 15%, 30%, 50%, 70%,
and 100%)………………………………………………………………………………………158
xiii

5.7 H0_nIL2 (from left to right - nanolatex concentration: 0%, 15%, 30%, 50%, 70%,
and 100%)………………………………………………………………………………………159
5.8 H0_nEL5 (from left to right - nanolatex concentration: 0%, 15%, 30%, 50%, 70%,
and 100%)………………………………………………………………………………………159
5.9 EL5_nL0 (from left to right - nanolatex concentration: 0%, 15%, 30%, 50%, 70%,
and 100%)………………………………………………………………………………………159
5.10 IL4_nL0 (from left to right - nanolatex concentration: 0%, 15%, 30%, 50%, 70%,
and 100%)………………………………………………………………………………………159
5.11 EH5_nL0 (from left to right - nanolatex concentration: 0%, 15%, 30%, 50%, 70%,
and 100%)………………………………………………………………………………………160
5.12 IH4_nL0 (from left to right - nanolatex concentration: 0%, 15%, 30%, 50%, 70%,
and 100%)………………………………………………………………………………………160
5.13 Plots of relative average surface smoothness and specular gloss at 20o and 60o
vs. % nanoparticles by weight (L0_nL0 series)………………………………………………...161
5.14 Plots of relative average surface smoothness and specular gloss at 20o and 60o
vs. % nanoparticles by weight (L0_nIL4 series) ………………………………………………161
5.15 Plots of relative average surface smoothness and specular gloss at 20o and 60o
vs. % nanoparticles by weight (L0_nEL2 series) ……………………………………………..162
5.16 Plots of relative average surface smoothness and specular gloss at 20o and 60o
vs. % nanoparticles by weight (H0_nL0 series) ………………………………………………162
5.17 Plots of relative average surface smoothness and specular gloss at 20o and 60o
vs. % nanoparticles by weight (H0_nIL2 series) ……………………………………………..163
5.18 Plots of relative average surface smoothness and specular gloss at 20o and 60o
xiv

vs. % nanoparticles by weight (H0_nEL5 series) ……………………………………………163
5.19 Plots of relative average surface smoothness and specular gloss at 20o and 60o
vs. % nanoparticles by weight (EL5_nIL0 series) ……………………………………………..164
5.20 Plots of relative average surface smoothness and specular gloss at 20o and 60o
vs. % nanoparticles by weight (EH5_nIL0 series) ……………………………………………..164
5.21 Plots of relative average surface smoothness and specular gloss at 20o and 60o
vs. % nanoparticles by weight (IL4_nIL0 series) ……………………………………………...165
5.22 Plots of relative average surface smoothness and specular gloss at 20o and 60o
vs. % nanoparticles by weight (IH4_nIL0 series)...…………………………………………….165
5.23 Comparison of average stress-strain curves for L0_nL0 series………………………...173
5.24 Comparison of average stress-strain curves for L0_nIL4 series………………………..173
5.25 Comparison of average stress-strain curves for L0_nEL2 series……………………….174
5.26 Comparison of average stress-strain curves for H0_nL0 series………………………...174
5.27 Comparison of average stress-strain curves for H0_nIL2 series……………………….175
5.28 Comparison of average stress-strain curves for H0_nEL5 series………………………175
5.29 Comparison of average stress-strain curves for IL4_nL0 series………………………..176
5.30 Comparison of average stress-strain curves for EL5_nL0 series……………………….176
5.31 Comparison of average stress-strain curves for EH5_nL0 series………………………177
5.32 Comparison of average stress-strain curves for IH4_nL0 series……………………….177
5.33 (a) Comparison of loss modulus curves and (b) Comparison of storage modulus
curves for L0_nL0 series……………………….........................................................................184
5.34 (a) Comparison of loss modulus curves and (b) Comparison of storage modulus
curves for L0_nIL4 series………………………........................................................................185
xv

xvi
5.35 (a) Comparison of loss modulus curves and (b) Comparison of storage modulus
curves for L0_nEL2 series……………………….......................................................................186
5.36 (a) Comparison of loss modulus curves and (b) Comparison of storage modulus
curves for H0_nL0 series……………………….........................................................................187
5.37 (a) Comparison of loss modulus curves and (b) Comparison of storage modulus
curves for H0_nIL2 series………………………........................................................................188
5.38 (a) Comparison of loss modulus curves and (b) Comparison of storage modulus
curves for H0_nEL5 series……………………….......................................................................189
5.39 (a) Comparison of loss modulus curves and (b) Comparison of storage modulus
curves for EL5_nL0 series……………………….......................................................................190
5.40 (a) Comparison of loss modulus curves and (b) Comparison of storage modulus
curves for IL4_nL0 series………………………........................................................................191
5.41 (a) Comparison of loss modulus curves and (b) Comparison of storage modulus
curves for EH5_nL0 series……………………….......................................................................192
5.42 (a) Comparison of loss modulus curves and (b) Comparison of storage modulus
curves for IH4_nL0 series………………………........................................................................193

Chapter 1
Introduction
Latexes have been important to industry for many decades due to their performance and
in a number of applications in a wide variety of products in daily human life. Examples can be
found in detergents, cosmetics, paints and coatings, and newspapers. For more than 90 years
many publications, patents and literature reviews have covered the numerous useful properties of
latexes and their application areas.1-3 The literature1-3 reported that almost 7% of the world
polymer production is produced as a polymer dispersion which corresponds to 107 tons.
A latex is a dispersion of polymer particles in water. It can be described or referred to as
an aqueous polymeric dispersion. It should be noted here that the term aqueous polymeric
dispersion is broad and constitutes a variety of polymeric dispersions. In addition to latexes,
prepared by several techniques, for example, there are polyurethane dispersions prepared by a
step growth polymerization process. Historians report that the word latex in Latin means
“liquid” or “fluid” that originally comes from a Greek word “látax” which means a “droplet.”4
Natural latexes are produced by plants, notably by the rubber tree. Synthetic latexes are typically
synthesized using various heterophase polymerization techniques. More than 10 million tons of
latexes or aqueous polymeric dispersions are produced worldwide using heterophase
polymerization techniques.2, 3, 5
In the literature1-3 heterophase polymerization is classically described as a polymerization
reaction under non-homogeneous conditions. For latex it can be simply described as a process
resulting in polymer dispersion, where polymers are finely dispersed meaning mainly insoluble
or immiscible in a continuous phase. Any liquid can be a dispersion medium or a continuous
phase provided it is a non-solvent for the dispersed material. Most of the heterophase
1

polymerization techniques are reported to be carried out in water as a dispersion medium or a
continuous phase.1-3 Further, the most commonly used dispersing medium for latexes is water
due to safety and environmental reasons. However, other volatile organic solvents, stabilizers,
and plasticizers are typically present in the dispersion composition. Antonietti and Tauer1
provided a masterful overview of several heterophase polymerization techniques. Among all
those polymerization techniques (a) emulsion polymerization and (b) microemulsion
polymerization techniques are the main study of interest.
Emulsion polymerization is widely known and the most commonly used heterophase
polymerization technique. The emulsion polymerization technique is used to prepare the majority
of commercial synthetic latexes by a free radical-initiated chain growth polymerization process
where one or more monomer species is added to aqueous surfactant mixtures, in the presence of
an initiator, to form a dispersion of finely divided polymer particles, such as latex. Most latexes
are stabilized by surfactants. The surfactants used in the process contribute to stability, and
additional stabilizing structures may be formed during the emulsion polymerization process or
added later.1, 6 Further, most of the commercial latexes are produced by a semicontinuous batch
process where the polymerization is started in the presence of seed latex and monomers and
initiators are added in the proportions and rates such that rapid polymerization occurs. In this
way, the monomer concentration at any time is low and the polymerization is said to be carried
out under monomer starved conditions. The semicontinuous emulsion polymerization process
and its highlights are covered in great detail in the literature.6
In this study a seeded semi-continuous emulsion polymerization was used to prepare
acrylic latexes having average particle diameters of 120-140 nm referred to as conventional
latexes. The conventional latexes were prepared from commonly used monomers such as n-butyl
2

acrylate (n-BA), n-butyl methacrylate (n-BMA), and methacrylic acid (MAA). For crosslinking,
functional or crosslinkable monomers were used, such as 1-3-butylene glycol dimethacrylate (1-
3-BGDMA) was used for pre-coalescence crosslinking and diacetone acrylamide (DAA) used
for post-coalescence crosslinking with adipic dihydrazide (ADH).
Microemulsion polymerization was first reported by Stoffer and Bone7, 8 and Atik and
Thomas9-11 in 1980. Since then a great deal of research has been devoted in the area of making
polymeric nanoparticles using microemulsion polymerization processs.5, 7-27 As reported in the
literature5, 7-27 in the traditional microemulsion polymerization technique the monomer must be
slightly water soluble to form a separate phase in the shape of so called spherical droplets. The
size of these droplets is mainly controlled by a proper choice of physical dispersing techniques in
combination with chemical stabilization systems.5, 7-27 It has also been reported that due to design
of the recipes for microemulsion polymerization processes the polymerization takes place mainly
inside the preformed monomer droplets.5, 7-27 Further details and mechanisms of microemulsion
polymerization techniques can be found in several references.5, 7-27
Since its introduction many tried to establish the commercial microemulsion process by
addressing its classically known limitations – (a) higher surfactant concentrations to form stable
polymer microlatexes and (b) low final polymer content. The above two so-called limitations of
the microemulsion polymerization technique restricted its proposed viable uses to some extent in
coatings, drug delivery, microencapsulation, and many other applications where lower surfactant
loading and higher polymer content is desired.
In late 1990s, Ming et al.28, 29 reported laboratory scale modified microemulsion
polymerization producing high solids content nanosize polymer latexes. Ming and his coworkers
modified the traditional microemulsion process to produce nano particles with diameters of 10-
3

30 nm and final polymer content ranging from 10-30 wt. %. The details of the process are
covered in later sections. Briefly, in Ming’s modified microemulsion polymerization process the
original microemulsion was composed of the entire amount of surfactant, a co-surfactant (if
required), and a very small portion of monomers and water. The rest of the monomers were
added dropwise into the polymerizing microemulsion.
In the present research, Ming’s modified microemulsion process was further improved to
enable use of a variety of monomers including functional or crosslinkable monomers. The
improved modified microemulsion process was developed to produce acrylic nanoparticle
latexes having average particle diameters of 15-30 nm referred as nanoparticle latexes. The
nanoparticles latexes were prepared using the same monomers used to prepare the conventional
size latexes. In other words, the nanoparticle latexes were prepared from commonly used
monomers such as n-butyl acrylate (n-BA), n-butyl methacrylate (n-BMA), and methacrylic acid
(MAA). For crosslinking, functional or crosslinkable monomers were used, such as 1-3-butylene
glycol dimethacrylate (1-3-BGDMA) was used for pre-coalescence crosslinking and diacetone
acrylamide (DAA) used for post-coalescence crosslinking with adipic dihydrazide (ADH).
For many years both the emulsion and microemulsion polymerization techniques and
their respective mechanisms have been extensively explored by many researchers in academe
and in industry, covered in the following section -- Historical Overview.
As described earlier, latexes have many applications including functioning as a film
former or a binder in paints and coatings – our main area of interest. Traditionally a film former
or a binder, commonly considered as the “engine” in a typical paint formulation, is combined
with pigments, extenders, and several other additives. In a typical paint formulation, a binder is
the main factor that determines the physical, mechanical, and chemical properties of the coating
4

film.6 According to a market report and 2007 – Census Bureau Data,30 aqueous polymeric
dispersions (or latexes) in the United States market are the largest of all coatings, mainly used in
architectural paints, amounting to an annual sales of more than $8 billion in the U.S. Further,
they contribute to 60% of all sales, mainly in the architectural coatings market segment.30
Despite the environmental benefits of latex paints, however, large sectors of the coatings
industry do not use latex paints extensively because latex films typically cannot achieve the
strength, hardness, and gloss of enamels and solvent-based paints. Accordingly, latex paints are
not widely used in the automotive coatings or marine coatings market segments. Similarly, latex
paints have not been widely adopted as protective coatings for metal structures which are
exposed to the elements (bridges, refineries, ships, storage tanks, water towers, etc.)
For many years, researchers in industry as well as in academia have been exploring
various strategies31 to improve latex film properties, such as ultimate mechanical properties (film
modulus, tensile strength, elongation at break, etc.) and solvent resistance. The goal of this
research is to replace traditionally used solvent-borne coatings due to increased environmental
concerns and strict governmental regulations.32 The solvent-borne coatings usually contain
substantial amounts of volatile organic compounds (VOCs), which participate in atmospheric
photochemical reactions, contributing to the formation of smog and the depletion of the ozone
layer.32
An exhaustive review of the literature1, 6, 31, 33, 34 showed that the latex film properties
depend upon many factors. These factors include, for example, the chemistries of latex backbone
monomers, the polymer glass transition temperatures (Tg), molecular weights, and crosslinking
densities of backbone polymers, latex particle size and distribution, surfactant level, the extent of
particle coalescence, particle surface functional groups, interfacial crosslinking, film-forming
5

and curing temperatures and conditions, and so on. By carefully considering these factors,
possible approaches1, 6, 12, 28, 29, 31, 33-58 to be able to either control or improve latex film properties
are (a) imparting a crosslinkable functionality: either externally (between two particles) or
internally (within the particle), and/or (b) making polymeric particles nanosize (average particle
diameter ~ 15-30 nm), or (c) blending polymer nanoparticle latexes with conventional (average
particle diameters ~ 120-140 nm) latexes. The above three approaches form the basic subject of
this thesis research.
The main goal of the present study is to investigate the effect(s) of (a) type (pre-
coalescence or post-coalescence) and level of crosslinking, (b) particle size and distribution, (c)
glass transition temperature (Tg), and (d) blends of conventional and nanoparticle latexes and
their different weight ratios on latex film formation process, end-use properties, fundamental
thermal and mechanical properties, and latex morphology. As described earlier, in the present
research the conventional latexes were prepared using a seeded semi-continuous emulsion
polymerization technique, and nanoparticle latexes were prepared using an improved modified
microemulsion polymerization technique.28, 29 The films cast from the individual conventional
and nanoparticle latexes and their respective blends were characterized for physical and
mechanical properties, using a variety of end-use tests and advanced instruments such as a Nano-
indenter, Dynamic Mechanical Analyzer (DMA), Thermogravimetric Analyzer (TGA),
Modulated Differential Scanning Calorimeter (MDSC), and an Atomic Force Microscope
(AFM). Information from such tests should greatly enhance our understanding of the relationship
between the physical, morphological, and end-use properties of coatings.
This dissertation is divided into six chapters. Chapter 1 includes the introduction, in order
to put emulsion and microemulsion produced latexes in their appropriate perspective; a historical
6

overview of the developments of emulsion and microemulsion polymerization techniques is
presented in Chapter 2. Chapter 3 focuses on the effects of precoalescence or postcoalescence
crosslinking and glass transition temperature (Tg) on conventional size latex film formation,
properties, and latex morphology. Chapter 4 reports synthesis of nanoparticle latexes using
improved modified microemulsion process using similar acrylic monomers used for making
conventional latexes, including functional (pre-coalescence and post-coalescence) monomers,
nanoparticle latex film formation, properties, latex morphology and their comparisons to
conventional size counterparts. Chapter 5 covers formulating various blends of selected
conventional latexes (Chapter 3) and selected nanoparticle latexes (Chapter 4) in different weight
ratios between 7.5/92.5 to 70/30 nanoparticle latex to conventional latex particles and studying
the effects blending and blend ratios on latex film formation, properties; and latex morphology.
The overall conclusion and scope of future research is covered in Chapter 6.
This study will serve as a fundamental and practical contribution to latex and latex blend
research and form a basis for exploring potential commercial applications of crosslinked
conventional latexes, nanoparticle latexes, and their respective blends.
7

References:
1. Antonietti, M.; Tauer, K., 90 Years of Polymer Latexes and Heterophase Polymerization: More vital than ever. Macromolecular Chemistry and Physics 2003, 204, (2), 207-219. 2. DeFusco, A. J.; Sehgal, K. C.; Bassett, D. R., Overview of uses of polymer latexes In NATO ASI Series, Series E: Applied Sciences (Polymeric Dispersions: Principles and Applications), Asua, J. M., Ed. Kluwe Academic Publishers: Dordrecht, Boston, London, 1997; Vol. 335, pp 379-396. 3. Distler, D., Wäßrige Polymerdispersionen: Synthese, Eigenschaften, Anwendungen. Wiley-VCH: Weinheim, 1999. 4. Blackley, D. C., Polymer Latices. 2nd ed.; Chapman & Hall: London, 1997; Vol. 1. 5. Antonietti, M.; Bremser, W.; Muschenborn, D.; Rosenauer, C.; Schupp, B.; Schmidt, M., Synthesis and size control of polystyrene latexes via polymerization in microemulsion Macromolecules 1991, 24, (25), 6636-43. 6. Wicks, Z. W.; Jones, F. N.; Pappas, P. S.; Wicks, D. A., Organic Coatings : science and technology. 3rd Edition ed.; John Wiley & Sons: Hoboken, New Jersey, 2007. 7. Stoffer, J. O.; Bone, T. J., Polymerization in Water-in-Oil Microemulsion Systems I. Journal of Polymer Science, Polymer Chemistry Edition 1980, 18, (8). 8. Stoffer, J. O.; Bone, T. J., Polymerization in water-in-oil microemulsion systems. II. SEM investigation of structure Journal of Dispersion Science and Technology 1980, 1, (4), 393-412. 9. Atik, S. S.; Thomas, J. K., Polymerized Microemulsions. J. American Chemical Society 1981, 103, (14), 4279-4280. 10. Atik, S. S.; Thomas, J. K., Photochemistry in polymerized microemulsion systems Journal of the American Chemical Society 1982, 104, (12), 5868-74. 11. Atik, S. S.; Thomas, J. K., Photoinduced reactions in polymerized microemulsions Journal of the American Chemical Society 1983, 105, (14), 4515. 12. Winnik, M. A., The formation and properties of latex films. In Emulsion Polymerization and Emulsion Polymers, Lovell, P. A. E.-A., M. S., Ed. Wiley: New York, 1997; pp 467-518. 13. Candau, F.; Leong, Y. S.; Fitch, R. M., Kinetic study of the polymerization of acrylamide in inverse microemulsion Journal of Polymer Science, Polymer Chemistry Edition 1985, 23, (1), 193-214. 14. Candau, F.; Leong, Y. S.; Fitch, R. M., Effect of solution components on the termination mechanism in acrylamide microemulsion polymerizations Journal of Polymer Science, Part A: Polymer Chemistry 1989, 27, (7), 2179-88. 15. Capek, I.; Potisk, P., Microemulsion polymerization of butyl acrylate. IV. Effect of emulsifier concentration Journal of Polymer Science, Part A: Polymer Chemistry 1995, 33, (10), 1675-83. 16. Corpart, J. M.; Selb, J.; Candau, F., Characterization of high charge density ampholytic copolymers prepared by microemulsion polymerization Polymer 1993, 34, (18), 3873-86. 17. Feng, L.; Ng, K. Y. S., In situ kinetic studies of microemulsion polymerizations of styrene and methyl methacrylate by Raman spectroscopy Macromolecules 1990, 23, (4), 1048-53.
8

18. Gan, L. M.; Chew, C. H.; Lee, K. C.; Ng, S. C., Polymerization of methyl methacrylate in ternary oil-in-water microemulsions Polymer 1993, 34, (14), 3064-9. 19. Gan, L. M.; Chew, C. H.; Lee, K. C.; Ng, S. C., Formation of polystyrene nanoparticles in ternary cationic microemulsions Polymer 1994, 35, (12), 2659-64. 20. Gan, L. M.; Chew, C. H.; Lian, N.; Li, G. Z., Polymerization of Styrene in a Winsor I-like System Langmuir 1994, 10, (7), 2197-201. 21. Gan, L. M.; Chew, C. H.; Lye, I.; Ma, L.; Li, G., Effect of water-soluble cosurfactants on microemulsion polymerization of styrene Polymer 1993, 34, (18), 3860-4. 22. Guo, J. S.; Sudol, E. D.; Vanderhoff, J. W.; El-Asser, M. S., Particle nucleation and monomer partitioning in styrene oil-in-water microemulsion polymerization Journal of Polymer Science, Part A: Polymer Chemistry 1992, 30, (5), 691-702. 23. Guo, J. S.; Sudol, E. D.; Vanderhoff, J. W.; El-Asser, M. S., Modeling of the styrene microemulsion polymerization Journal of Polymer Science, Part A: Polymer Chemistry 1992, 30, (5), 703-12. 24. Kuo, P. L.; Turro, N. J.; Tseng, C. M.; El-Aasser, M. S.; Vanderhoff, J. W., Photoinitiated polymerization of styrene in microemulsions Macromolecules 1987, 20, (6), 1216-21. 25. Rodriguez-G., L. A.; Mendizabal, E.; Puig, J. E.; Kaler, E. W., Polymerization of methyl methacrylate in 3-component cationic microemulsion Journal of Applied Polymer Science 1993, 48, (5), 775-86. 26. Texter, J.; Oppenheimer, L. E.; Minter, J. R., Microemulsion polymerization in the water, bis(2-ethylhexyl) sulfosuccinate sodium salt (Aerosol-OT), tetrahydrofurfuryl methacrylate system Polymer Bulletin (Berlin, Germany) 1992, 27, (5), 487-94. 27. Wu, C., Laser Light Scattering Determination of the Surfactant Interface Thickness of Spherical Polystyrene Microlatices. Macromolecules 1994, 27, (24), 7099-102. 28. Ming, W.; Jones, F. N.; Fu, S., High solids-content nanosize polymer latexes made by microemulsion polymerization. Macromolecular Chemistry and Physics 1998, 199, (6), 1075-1079. 29. Ming, W.; Jones, F. N.; Fu, S., Synthesis of nanosize poly(methyl methacrylate) microlatexes with high polymer content by a modified microemulsion polymerization. Polymer Bulletin 1998, 40, (6), 749-756. 30. Challener, C., Environmentally Friendly Paints and Coatings: Making the world a Greener Place. JCT Coatings Tech July, 2006, pp 2-8. 31. Taylor, J. W.; Winnik, M. A., Functional Latex and Thermoset Latex Films. Journal of Coatings Technology Research 2004, 1, (3), 163-190. 32. Joshi, R.; Provder, T.; Kustron, K., Green coatings: a trend that is becoming the rule rather than the exception JCT CoatingsTech 2008, 5, (1), 38-43. 33. Lee, D., The effects of latex coalescence and interfacial crosslinking on the mechanical properties of latex films. Polymer 2005, 46, (4), 1287-1293. 34. Flory, P. J., Effects of molecular structure on physical properties of butyl rubber. Industrial and Engineering Chemistry 1946, 38, (4), 417-436. 35. Emmons, W. D. Ambient or low-temperature curable coatings. 4,210,565, 1980. 36. Jones, F. N.; Mao, W.; Ziemer, P. D.; Xiao, F.; Hayes, J.; M., G., Artist Paints –an overview and preliminary studies of durability. Progress in Organic Coatings 2005, 52, 9-20. 37. Geelhaar, H. J.; Penzel, E.; Ley, G. Binders for paints. 4267091 1981.
9

38. Robinson, G. F.; Shemancik, R. C.; Speight, R. D.; Wong, P. T.; Znidersic, K. M. Coating compositions and coatings formed therefrom. 6,605,359, 2003. 39. Winnik, M. A., Crosslinking and polymer interdiffusion in latex films. Polymer Preprints 2003, 44, (1), 100-101. 40. Park Y.; Monteiro, M. J. v. E. S. G. A. L., Effect of ambient crosslinking on the mechanical properties and film morphology of PSTY-P(BA-co-AAEMA) reactive composite latexes. European Polymer Journal 2001, 37, (5), 965-973. 41. Teng, G.; Soucek, M. D., Effect of introduction mode of hydroxyl functionality on morphology and film properties of cycloaliphatic diepoxide crosslinkable core-shell latex. Journal of Polymer Science Part A: Polymer Chemistry 2002, 40, 4256-4265. 42. Park, Y.; Kim, J.-H., Film formation form reactive latex particles : influence of interparticle crosslinking on mechanical properties. Colloids and Surfaces A 1999, 153, 583-590. 43. Zosel, A.; Ley, G., Influence of cross-linking on structure, mechanical properties, and strength of latex films. Macromolecules 1993, 26, 2222-2227 44. Winnik, M. A., Interdiffusion and crosslinking in Thermoset Latex Films. Journal of Coatings Technology 2002, 74, (925), 49-63. 45. Ghazaly, H. M.; Daniels; E.S.; Dimonie; V.L.; Klein, A.; Sperling, L. H.; El-Aasser, M. S., Properties of N-butyl methacrylate copolymer latex films derived from crosslinked latex particles. Jounral of Applied Polymer Science 2003, 88, 42-49. 46. Bufkin, B.; Grawe, J. R., Survey of Applications, Properties, and Technology of Crosslinking Emulsions: Part I. Journal of Coatings Technology 1978, 50, (641), 41-55. 47. Bufkin, B.; Grawe, J. R., Survey of Applications, Properties, and Technology of Crosslinking Emulsions: Part III. Journal of Coatings Technology 1978, 50, (644), 83-109. 48. Bufkin, B.; Grawe, J. R., Survey of Applications, Properties, and Technology of Crosslinking Emulsions: Part IV. Journal of Coatings Technology 1978, 50, (645), 70-100. 49. Bufkin, B.; Grawe, J. R., Survey of Applications, Properties, and Technology of Crosslinking Emulsions: Part V. Journal of Coatings Technology 1978, 50, (647), 65-96. 50. Bufkin, B.; Grawe, J. R., Survey of the Applications, Properties, and Technology of Crosslinking Emulsions : Part II. Journal of Coatings Technology 1978, 50, (643), 67-83. 51. Ghazaly, H. M.; Daniels, E. S.; Dimonie, V. L.; El-Aasser, M. S.; Klein, A., Synthesis and characterization of a macromonomer crosslinker. Jounral of Applied Polymer Science 2000, 77, 1362-1368. 52. Coleman, L. E.; Bork, J. F.; Wyman, D. P.; Hoke, D. I., Synthesis and polymerization of N[2-(2-methyl-4-oxopentyl)]-acrylamide-A new reactive vinyl monomer. Journal of polymer Science Part A: General Papers 1965, 3, (4), 1601-1608. 53. Huang, Y.; Jones, F. N., Synthesis of crosslinkable acrylic latexes by emulsion polymerization in the presence of etherified melamine-formaldehyde (MF) resins. Progress in Organic Coatings 1996, 28, 133-141. 54. Hahn, K.; Ley, G.; Schuller, H.; Oberthur, R., On Particle Coalescence in Latex Films. Colloid & Polymer Science 1986, 264, (12), 1092-1096. 55. El-Aasser, M. S.; Tang, J.; Wang, X.; Daniels, E. S.; Dimonie, V. L.; Sudol, E. D., Advances in Emulsion Polymerization for Coatings Applications: Latex Blends and Reactive Surfactants. Journal of Coatings Technology 2001, 73. 56. Winnik, M. A.; Feng, J., Latex Blends: An approach to Zero VOC Coatings. Journal of Coatings Technology 1996, 68, (852).
10

11
57. Eckersley, S. T.; Helmer, B. J., Mechanisitic considerations of particle size effects on film properties of hard/soft latex blends. Journal of Coatings Technology 1997, 69, (864), 97-110. 58. Winnik, M. A.; Feng, J., Polymer Blend Latex Films: Morphology and Transparency. Macromolecules 1995, 28.

Chapter 2
Historical Overview
Paint and coatings technology can be classified as one of the oldest technologies in the
history of mankind. Several historical reviews1, 2 reported that the Egyptians and many of the
ancient Asian and European cultures used a mixture of raw natural pigments (for example,
turmeric) with plant oil or egg-yolk for decorative as well as protective purpose. In their
masterful historical review on the historical development of heterophase polymerization
techniques Antonietti and Tauer3 noted that the development of heterophase polymerization
techniques has a strong connections to the history of synthetic rubber manufacturing.
Historically, saps from trees were used to make elastic rubber balls, glue, or waterproofed
clothes. Antonietti and Tauer3 further noted that the birth of emulsion polymerization claiming it
as one of the key heterophase polymerization techniques goes back to 1912 when a pioneer
researcher K. Gotlob filed the first patent on manufacturing synthetic rubber using naturally
occurring materials via emulsion polymerization technique.3, 4
In the following 20 years, several companies in the United States and Germany
extensively explored emulsion polymerization processes that led to some groundbreaking
research studies including the development of catalyzed emulsion polymerization process and
commercialization of synthetic latexes using emulsion polymerization process.3, 4 Katz3, 5, 6 and
Mark3, 7, 8 reported a comprehensive review on the early developments of emulsion
polymerization processes. According to previous reports3, 4 from the 1930s to 1950s; nearly two
decades, the number of commercially available synthetic latexes made using an emulsion
polymerization process increased from a few to nearly 200. Several manufacturers in the U.S.
12

and Germany soon recognized the value and merits of emulsion polymerization process in
comparison to traditionally used the bulk polymerization process.
As reported in the literature9 during the World War II, C. S. Marvel led a synthetic rubber
project supported by the US government involving 100 other chemists. Further, Marvel and his
group were involved in a rush program to develop synthetic rubber because supplies of rubber
from Asia were cut off. During the war, the group worked on several key issues and made huge
contributions to the developing area of emulsion polymerization technique. The details of Marvel
and his group’s work during the war are reported in detail in the literature.9 The research by
Marvel and his group was a major impetus for commercial development starting in 1945.
In their key historical overview, Winnik and Taylor4 report that in 1946 Dow Chemical
Company commercialized the first styrene-butadiene (SBR) latex, followed by
commercialization of AC-33 acrylic latex for coatings (Rohm & Haas) and vinyl acetate based
latex - UCAR WC 130 (Union Carbide).3, 4
Prior to 1930 the majority of the research carried out in the emulsion polymerization area
remained within the industrial domain in the form of trade secrets, patents, or non-public
research reports. In their historical overview, Antonietti and Tauer3 report that there was only
one report in form of an abstract on emulsion polymerization in the open literature before 1939.
This was part of a talk by a German scholar Fikentscher during an annual plastic division
meeting in Germany in 1938. In another example, Antonietti and Tauer3 report that after World
War II, research scientists at Bayer published the first document on emulsion polymerization of
butadiene using redox polymerization and chain transfer agents. It was around the 1950s when
13

researchers and scholars in academia and independent research institutes focused intensely on
experimental and theoretical investigation of the emulsion polymerization process.
Harkins,10 Smith, and Ewart11 reported the first theory of emulsion polymerization. A
general mechanism of emulsion polymerization technique was reported by Harkins10 proposing
two key features: (a) he considered two loci of particle formation (i) monomer swollen micelles
and (ii) the aqueous phase. According to Harkins10 the aqueous phase becomes more and more
important with decreasing emulsifier concentration, and (b) the monomer swollen polymer
particles become the locus in which nearly all of the polymer is formed. Another key and
perhaps the most important contribution came from Smith and Ewart11 in 1948. They developed
a quantitative theory of the kinetics of radical polymerization in monomer swollen polymer
particles (isolated loci) where the free radicals are supplied to loci from the aqueous phase
(external source). Further details of Smith and Ewart theory is covered extensively in the past by
many researchers available in the literature elsewhere.3, 4 In later years, many scientists studied
the kinetics of emulsion polymerization technique based upon Smith-Ewart theory. Notably,
Flory12, 13 developed his theories on the swelling structures and gelation and made huge
contributions to polymer science in general. The literature3, 4 reports another significant
contribution that came from Bradford and his co-workers publishing their dry-sintering theory of
latex film formation.
The literature3, 4, 14 reports that during the early 1970s first Fitch and Tsai15-18 and later
Hansen and Ugelstad19-23 contributed and proposed the now famous HUFT,15 homogenous
nucleation theory, in emulsion polymerization. Additionally, Hansen and Ugelstad19-23 also
contributed to general kinetics of emulsion polymerization in 1976. In later years, Napper,
14

Gilbert, and coworkers24, 25 made many important contributions towards understanding the
emulsion polymerization mechanism.
To date, many quantitative theories for understanding mechanisms of emulsion
polymerization have been proposed. Scholars have reported14 that none of the proposed
mechanisms can be generally applied to all systems, because of the wide range of variables
involved in the emulsion polymerization process. It should be noted here that many of the early
studies were based on small-scale batch processes that cannot be used in large scale production.
As a result, some of the earlier mentioned theories do not apply well for starved feed conditions.
As reported in the review literature,3, 4, 14 various theories and mathematical models of emulsion
polymerization have been concisely reviewed by Hansen et al.19-23 and van Berkel et al.26-29 Also,
as cited in Wicks et al.,14 Herrera-Ordonez et al. reviewed controversial issues related to
mechanisms of emulsion polymerization technique.
Due to increasing commercial significance and focus on synthetic latexes many
researchers worked on understanding film formation behavior of heterogeneous systems that
ultimately influences film properties. As reported in the review literature3, 4, 14 Bradford and co-
workers30, 31 proposed dry-sintering theory, concluding that the surface tension of the polymer
plays a critical role in driving particle compaction to a fully dense film. Sheetz32 showed that
evaporation of water from latex films produce stresses (osmotic) that compressed particles.
Vanderhoff33, 34 proposed that water interfacial tension provides the necessary force for particle
compression, ultimately producing particle deformation and densification. Vyoutskii35, 36
suggested that autohesion or polymer diffusion was essential to the development of the
mechanical properties of the latex films. Routh and Russel37, 38 provided an in-depth view of
various film formation mechanisms and developed a model that explains the circumstances under
15

which each of the mechanisms may dominate. During the 1980s and 1990s, research efforts of
the scholars in this area resulted in developments of two direct methods to measure interdiffusion
of polymeric chains in latex film formation. Hahn and co workers39, 40 and Sperling and his
group41-43 monitored interdiffusion of poly (butyl methacrylate) and deuterated polystyrene using
small angle neutron scattering (SANS). Winnik and coworkers4, 14 developed direct nonradiative
energy transfer (DET) method and studied diffusion mechanisms latex polymers.4, 14
Notably, one classical and well-known model of latex film formation by Winnik4, 14
describes the latex film formation in three steps (1) evaporation of volatiles (solvent), (2) particle
deformation to a continuous film (coalescence), and (3) molecular interpenetration to knit the
particles together (fusion). However, the three steps need not be distinct, and they may take
place concurrently as the film forms. According to this classical model, varying the water and
solvent composition of the latexes and size of the polymer particles will vary the properties of
the resultant film. Additionally, the degree to which the polymers interpenetrate and bind
together can be influenced by the inclusion of crosslinkers that bind separate polymer chains
together to form a vast network of linked molecules. The detailed discussion of this is covered in
Chapter 3.
Since 1950, the ongoing commercialization of synthetic polymer latex (or aqueous
polymeric dispersions), however, created a need to develop and understand many new
heterogeneous polymerization techniques. In addition it was critical to understand film formation
process and other useful properties of heterogeneous particles when dispersed in water. All this
was accelerated mainly due to increased environmental concerns, strict governmental
regulations, and technological advancements that resulted in a continuous shift from traditionally
used solvent based materials to aqueous polymeric dispersions.
16

Prior to 1960,44 there were hardly any regulations or laws that specified or restricted the
use of toxic substances or the amount of volatile organic solvents (VOCs) in paint manufacturing
and application. For example, lead pigments (that are toxic in nature and hazardous to human
health), were used without any regulations or mandated limits in commercial paint
manufacturing.44 Another example involves VOC levels. When a gallon of typical paint was
used to coat a surface, approximately 900 grams of volatile organic compounds were released
into the atmosphere.44 When exposed to sunlight, these VOCs contributed to the formation of
smog.44 These compounds have been classically defined by the Environmental Protection
Agency (EPA) as “any compound of carbon, excluding carbon monoxide, carbon dioxide,
carbonic acid, metallic carbides or carbonates, and ammonium carbonate, which participates in
atmospheric photochemical reactions”.44 The above and many more similar examples raised
concerns about product safety, health, and environmental friendliness. These concerns generated
a need to develop regulatory standards for consumer products related to paints and coatings.
In 1966, California’s “Rule 66” was promulgated by the Los Angeles Air Pollution
Control Department (LAAPC) regarding VOC emissions.44 Rule 66 was among the first
regulation in the country regarding VOC emissions.44 It took effect in 1967. Since the passing
of Rule 66, the federal government enacted the Clean Air Act in 1967 and established the
Environmental Protection Agency (EPA).44 The purpose of the law was to regulate the use of
“toxic air pollutants which were hazardous to human health or the environment”.44 The Clean
Air Act was amended in 1977 and again in 1990.44 In addition to nationwide laws, the states
were also asked to develop State Implementation Plans (SIPs), “a collection of the regulations a
state will use to clean up polluted areas”,44 mandated by the 1990 Clean Air Act.44 In 1978, the
Consumer Product Safety Commission (CPSC)45 became involved and issued a regulation to
17

restrict the use of lead pigment in commercial paint manufacturing. It should also be mentioned
that during this period similar regulations – somewhat different in form – were being enacted in
Europe.44
The introduction of the federal and state regulations pushed the researchers in industries
as well as in academe to think “outside the box”.44 They started exploring new strategies to meet
the mandated limits. As a result, many scientists in industry and academia started looking at
various approaches to enhance the performance of synthetic latexes prepared using emulsion
polymerization technique. In addition, a great deal of research efforts have been devoted to
exploration and commercialization of several advanced polymerization techniques, such as
microemulsion polymerization, miniemulsion polymerization, or microencapsulation. From all
the advanced polymerization techniques developed in last 30 years, this dissertation focuses on
microemulsion polymerization discussed below.
Broadly, the literature3, 14 describes microemulsion as a – “large amounts of two
immiscible liquids (e.g. water and oil) brought into a single phase (macroscopically
homogeneous but microscopically heterogeneous) by addition of an appropriate surfactant or a
surfactant mixture.” Characteristically, microemulsions are classified as a unique class of
optically clear, thermodynamically stable, and usually low-viscosity solutions.3, 14 The
literature3, 14 reports two essential distinctions between the emulsion polymerization and the
microemulsion polymerization: (a) particle size of the resulting latex polymers and (b) the
stability feature of the process. Further, as referred in the literature3, 14 the emulsion
polymerization process is characterized as a kinetically stable process, whereas microemulsion
polymerization process is characterized as a thermodynamically stable process.
18

Microemulsion polymerization was first reported by Stoffer and Bone46, 47 and Atik and
Thomas48-50 in 1980-82. The early microemulsion polymerization processes that were reported
produced microlatexes with smaller particle diameters of 10-100 nm when compared to a
conventional latex made using traditional emulsion polymerization technique with relatively
larger particle diameters of 50 nm or higher. Antonietti et al.51 and Wu52 established a
quantitative relation between particle size and the monomer to surfactant ratio for a range of
compositions with the ratios ranging from 1/3 to 3/1 of monomer to surfactant. Many
publications describing microemulsion polymerization of water insoluble53-64 and water soluble
monomers65-67 subsequently followed. Many of these research publications, though not all of
them, reported (a) higher surfactant concentrations to form stable polymer microlatexes, and (b)
final polymer content of less than 10% wt. The removal of surplus surfactant was seldom
undertaken, since it would be an expensive process. The above two or any other reported
limitations of the traditional microemulsion process restricted its proposed viable and
commercial uses to some extent in coatings, drug delivery, microencapsulation, and many other
applications where lower surfactant loading and higher polymer content is desired.
In recent years, many research attempts53-64 were focused on addressing the above two as
well as other limitations of the traditional microemulsion polymerization process. Gan et al.68, 69
reported polymerization of styrene and methyl methacrylate using cationic surfactants and
relatively high weight ratios of polymer to surfactant (approximately 8/1 polymer/surfactant) and
produced latexes with average particle diameters between 30-100 nm. Recently, He et al.70
studied the preparation polystyrene (PS) nano particles using seeded polymerization method
utilizing anionic surfactants. The resulting polymethamethacrylate/polystyrene (PMMA/PS)
nanoparticles had an average particle diameter < 20 nm using lower amounts of surfactant. Kaiyi
19

and Zhaoqun71 demonstrated a novel microemulsion polymerization process and reported
monodisperse polystyrene nanoparticles with average particle diameters < 20 nm using very low
amount of surfactant. Several other research attempts are covered in great detail in previous
literature.53-64
Notably, in late 1990s Ming et al.72, 73 reported laboratory scale modified microemulsion
polymerization producing high solids content nanosize polymer latexes. Ming and his coworkers
modified the traditional microemulsion process to produce nano particles with diameters of 10-
30 nm and final polymer content ranging from 10-30 wt%. In this process the polymer/surfactant
ratio was kept at 7:1 to 12:1. This ratio was significantly higher than a traditional microemulsion
process that typically uses 1:1 polymer/surfactant or even lower as reported in many previous
methods.51, 52 Briefly, in the modified microemulsion polymerization the original microemulsion
was composed of the entire amount of surfactant, a co-surfactant (if required), a very small
portion of monomer or monomer mixture, and water. The rest of the monomer or monomer
mixture was added dropwise into the polymerizing microemulsion. The researchers72, 73 used
anionic, cationic, non-ionic surfactants and their mixtures to produce high solids content
nanosize latexes. The researchers also studied the particle size changes during the
polymerization, the polymerization mechanism and some specific end-use properties. Promising
results from Ming’s modified technique opened up a wealth of opportunities for future research,
particularly, exploration for potential applications in the area of polymers and coatings forming
basis for this research.
In summary, for many years and at present a great deal of research has mainly focused on
(a) emulsion polymerization techniques and (b) developing and understanding advanced
20

polymerization techniques (such as microemulsion polymerization) in order to ultimately
produce latexes with enhanced performance properties for wide variety of applications.
21

References:
1. Martens, C. R., Introduction of Coating Industry. Technology of Paints, Varnishes and Lacquers. R.E.Krieger Publishing: New York, 1974; Vol. II, p 1-12. 2. Fischer, W. v., Introduction to the Protective Coatings Industry. Paint and Varnish Technology. Reinhold Publishing Corp.: New York, 1948; Vol. I, p 1-11. 3. Antonietti, M.; Tauer, K., 90 Years of Polymer Latexes and Heterophase Polymerization: More vital than ever. Macromolecular Chemistry and Physics 2003, 204, (2), 207-219. 4. Taylor, J. W.; Winnik, M. A., Functional Latex and Thermoset Latex Films. Journal of Coatings Technology Research 2004, 1, (3), 163-190. 5. Whitby, G. S.; Katz, M., Synthetic Rubber. Ind. Eng. Chem. 1933, 25, (12), 1338-1348. 6. Whitby, G. S.; Katz, M., Synthetic Rubber. Ind. Eng. Chem. 1933, 25, (11), 1204-1211. 7. Hohenstein, W. P.; Mark, H., Polymerization of olefins and diolefins in suspension and emulsion. I. Journal of Polymer Science 1946, 1, 127-45. 8. Hohenstein, W. P.; Mark, H.; , Polymerization of olefins and diolefins in suspension and emulsion. II. Journal of Polymer Science 1946, 1, 549-80. 9. Morris, P. J. T., Polymer Pioneers: A Popular History of the Science and Technology of Large Molecules. Diane Publishing Co: Darby, PA, 1986; p 88. 10. Harkins, W. D., A General Theory of the Mechanism of Emulsion Polymerization. Journal of Americal Chemical Society 1947, 69, 1428-1444. 11. Smith, W. V.; Ewart, R. H., Kinetics of Emulsion Polymerization. J. Chem. Phys. 1948, 16, (6), 592-599. 12. Flory, P. J., Effects of molecular structure on physical properties of butyl rubber. Industrial and Engineering Chemistry 1946, 38, (4), 417-436. 13. Flory, P. J., Principles of Polymer Chemistry. Cornell University Press: London, 1953; p 495-518. 14. Wicks, Z. W.; Jones, F. N.; Pappas, P. S.; Wicks, D. A., Organic Coatings : science and technology. 3rd Edition ed.; John Wiley & Sons: Hoboken, New Jersey, 2007. 15. Fitch, R. M., ‘‘Polymer Colloids: A Comprehensive Introduction’’. Academic Press: San Diego, London, Boston, New York, Sydney, Tokyo, 1997. 16. Fitch, R. M.; Tsai, C., Polymer colloids: particle formation in nonmicellar systems. Journal of Polymer Science, Polymer Letters Edition 1970, 8, (10), 703-10. 17. Fitch, R. M.; Tsai, C. H. In Homogeneous nucleation of polymer colloids. IV. Role of soluble oligomeric radicals, Polym. Colloids, Proc. Symp. , Storrs, CT, USA, 1971; Fitch, R. M., Ed. Dep. Chem.; Univ. Connecticut: Storrs, CT, USA, 1971; pp 103-16. 18. Fitch, R. M.; Tsai, C. H. In Particle formation in polymer colloids. III. Prediction of the number of particles by a homogeneous nucleation theory, Polym. Colloids, Proc. Symp., Storrs, CT, USA 1971; Fitch, R. M., Ed. Dep. Chem.; Univ. Connecticut: Storrs, CT, USA 1971; pp 73-102. 19. Hansen, F. K.; Ugelstad, J., Particle nucleation in emulsion polymerization. I. A theory for homogeneous nucleation. Journal of Polymer Science, Polymer Chemistry Edition 1978, 16, (8), 1953-79.
22

20. Hansen, F. K.; Ugelstad, J., Particle nucleation in emulsion polymerization. II. Nucleation in emulsifier-free systems investigated by seed polymerization. Journal of Polymer Science, Polymer Chemistry Edition 1979, 17, (10), 3033-45. 21. Hansen, F. K.; Ugelstad, J., Particle nucleation in emulsion polymerization. III. Nucleation in systems with anionic emulsifier investigated by seeded and unseeded polymerization. Journal of Polymer Science, Polymer Chemistry Edition 1979, 17, (10), 3047-67. 22. Hansen, F. K.; Ugelstad, J., Particle nucleation in emulsion polymerization. IV. Nucleation in monomer droplets. Journal of Polymer Science, Polymer Chemistry Edition 1979, 17, (10), 3069-82. 23. Ugelstad, J.; Hansen, F. K., Kinetics and mechanism of emulsion polymerization. Rubber Chemistry and Technology 1976, 49, (3), 536-609. 24. Gilbert, R. G.; Napper, D. H.; Lichti, G.; Ballard, M.; Sangster, D. F., Emulsion polymerization in seeded systems. Organic Coatings and Plastics Chemistry 1980, 43, 527-30. 25. Lichti, G.; Gilbert, R. G.; Napper, D. H. In Molecular weight distributions of polymer formed in emulsion polymerization, Polym. Colloids 2 [Two], [Proc. Symp. Phys. Chem. Prop. Colloidal Part.] Sydney, Australia 1980; Fitch, R. M., Ed. Plenum, New York, N. Y: Sydney, Australia 1980; pp 651-58. 26. Castro, J. V.; van Berkel, K. Y.; Russell, G. T.; Gilbert, R. G., General Solution to the Band-Broadening Problem in Polymer Molecular Weight Distributions. Australian Journal of Chemistry 2005, 58, (3), 178-181. 27. van Berkel, K. Y.; Russell, G. T.; Gilbert, R. G., Entry in Emulsion Polymerization: Effects of Initiator and Particle Surface Charge. Macromolecules 2003, 36, (11), 3921-3931. 28. van Berkel, K. Y.; Russell, G. T.; Gilbert, R. G., Molecular Weight Distributions and Chain-Stopping Events in the Free-Radical Polymerization of Methyl Methacrylate. Macromolecules 2005, 38, (8), 3214-3224. 29. van Berkel, K. Y.; Russell, G. T.; Gilbert, R. G., The dissociation rate coefficient of persulfate in emulsion polymerization systems. Polymer 2006, 47, (13), 4667-4675. 30. Dillion, R. E.; Matheson, L. A.; Bradford, E. B., Sintering of Synthetic Latex Particles. J. Colloid Sci. 1951, 6, 107-117. 31. Henson, W. A.; Taber, D. A.; Bradford, E. B., Ind. Eng. Chem. 1953, 45, 735. 32. Sheetz, D. P., Formation of films by drying of latex. Journal of Applied Polymer Science 1965, 9, (11), 3759-73. 33. Vanderhoff, J. W.; Bradford, E. B.; Tarkowski, H. L.; Wilkinson, B. W., High-energy irradiation in an investigation of the mechanism and kinetics of emulsion polymerization. Journal of Polymer Science 1961, 50, 265-86. 34. Vanderhoff, J. W.; Tarkowski, H. L.; Jenkins, M. C.; Bradford, E. B., Theoretical Consideration of the Interfacial Forces Involved in the Coalescence of Latex Particles. J. Macromol. Sci. Chem. 1966, 1, (2), 361-397. 35. Voyutskii, S. S., Autohesion and Adhesion of High Polymers. In Polymer Reviews, Saegusa, F. a., Ed. Wiley: NY, 1963; Vol. 4, p 272. 36. Voyutskii, S. S.; Ustinova, Z. M., Role of autohesion during film formation from the latex. Journal of Adhesion 1977, 9, (1), 39-50. 37. Routh, A. F.; Russel, W. B., Horizontal Drying Fronts in Evaporating Latex Films. AICHE J. 1998, 44, 2088.
23

38. Routh, A. F.; Russel, W. B., A Process Model for Altex Film Formation: Limiting Regmes for Individual Driving Forces. Langmuir 1999, 15, 7762-7773. 39. Hahn, K.; Ley, G.; Schuller, H.; Oberthur, R., On Particle Coalescence in Latex Films. Colloid & Polymer Science 1986, 264, (12), 1092-1096. 40. Hahn, K. G. Thermosetting Acrylic Latexes. 4,812,491 1989. 41. Linné, M. A.; Klein, A.; Miller, G. A.; Sperling, L. H., Film Formation from Latex: Hindered Initial Interdiffusion of Constrained Polystyrene Chains Characterized by Small-Angle Neutron Scattering. J. Macromol. Sci., Phys. 1988, B27, 217-231. 42. Sperling, L. H.; Klein, A.; Sambasivam, M.; Kim, K. D., Molecular Basis of Healing and Fracture at Polymer Interfaces. Polym. Adv. Technol. 1993, 5, 453-472. 43. Yoo, J. N.; Sperling, L. H.; Glinka, C. J.; Klein, A., Characterization of Film Formation from Polystyrene Latex Particles via SANS. I. Moderate Molecular Weight. Macromolecules 1990, 23, 3962-3967. 44. Joshi, R.; Provder, T.; Kustron, K., Green coatings: a trend that is becoming the rule rather than the exception JCT CoatingsTech 2008, 5, (1), 38-43. 45. NPCA, The Paint and Coatings Industry addresses Lead Issue. Issue Backgrounder 2000, pp 1-6. 46. Stoffer, J. O.; Bone, T. J., Polymerization in Water-in-Oil Microemulsion Systems I. Journal of Polymer Science, Polymer Chemistry Edition 1980, 18, (8). 47. Stoffer, J. O.; Bone, T. J., Polymerization in water-in-oil microemulsion systems. II. SEM investigation of structure Journal of Dispersion Science and Technology 1980, 1, (4), 393-412. 48. Atik, S. S.; Thomas, J. K., Polymerized Microemulsions. J. American Chemical Society 1981, 103, (14), 4279-4280. 49. Atik, S. S.; Thomas, J. K., Photochemistry in polymerized microemulsion systems Journal of the American Chemical Society 1982, 104, (12), 5868-74. 50. Atik, S. S.; Thomas, J. K., Photoinduced reactions in polymerized microemulsions Journal of the American Chemical Society 1983, 105, (14), 4515. 51. Antonietti, M.; Bremser, W.; Muschenborn, D.; Rosenauer, C.; Schupp, B.; Schmidt, M., Synthesis and size control of polystyrene latexes via polymerization in microemulsion Macromolecules 1991, 24, (25), 6636-43. 52. Wu, C., Laser Light Scattering Determination of the Surfactant Interface Thickness of Spherical Polystyrene Microlatices. Macromolecules 1994, 27, (24), 7099-102. 53. Capek, I.; Potisk, P., Microemulsion polymerization of butyl acrylate. IV. Effect of emulsifier concentration Journal of Polymer Science, Part A: Polymer Chemistry 1995, 33, (10), 1675-83. 54. Feng, L.; Ng, K. Y. S., In situ kinetic studies of microemulsion polymerizations of styrene and methyl methacrylate by Raman spectroscopy Macromolecules 1990, 23, (4), 1048-53. 55. Gan, L. M.; Chew, C. H.; Lee, K. C.; Ng, S. C., Polymerization of methyl methacrylate in ternary oil-in-water microemulsions Polymer 1993, 34, (14), 3064-9. 56. Gan, L. M.; Chew, C. H.; Lye, I.; Ma, L.; Li, G., Effect of water-soluble cosurfactants on microemulsion polymerization of styrene Polymer 1993, 34, (18), 3860-4. 57. Gan, L. M.; Chew, C. H.; Lee, K. C.; Ng, S. C., Formation of polystyrene nanoparticles in ternary cationic microemulsions Polymer 1994, 35, (12), 2659-64.
24

25
58. Guo, J. S.; Sudol, E. D.; Vanderhoff, J. W.; El-Asser, M. S., Particle nucleation and monomer partitioning in styrene oil-in-water microemulsion polymerization Journal of Polymer Science, Part A: Polymer Chemistry 1992, 30, (5), 691-702. 59. Guo, J. S.; Sudol, E. D.; Vanderhoff, J. W.; El-Asser, M. S., Modeling of the styrene microemulsion polymerization Journal of Polymer Science, Part A: Polymer Chemistry 1992, 30, (5), 703-12. 60. Larpent, C.; Tadros, T. F., Preparation of microlatex dispersions using oil-in-water microemulsions Colloid & Polymer Science 1991, 269, (11), 1171-83. 61. Ming, W.; Zhao, J.; Lu, X.; Wang, C.; Fu, S., Novel Characteristics of a Polystyrene Microsphere Prepared by Microemulsion Polymerization Macromolecules 1996, 29, (24), 7678-7682. 62. Rodriguez-G., L. A.; Mendizabal, E.; Puig, J. E.; Kaler, E. W., Polymerization of methyl methacrylate in 3-component cationic microemulsion Journal of Applied Polymer Science 1993, 48, (5), 775-86. 63. Texter, J.; Oppenheimer, L. E.; Minter, J. R., Microemulsion polymerization in the water, bis(2-ethylhexyl) sulfosuccinate sodium salt (Aerosol-OT), tetrahydrofurfuryl methacrylate system Polymer Bulletin (Berlin, Germany) 1992, 27, (5), 487-94. 64. Kuo, P. L.; Turro, N. J.; Tseng, C. M.; El-Aasser, M. S.; Vanderhoff, J. W., Photoinitiated polymerization of styrene in microemulsions Macromolecules 1987, 20, (6), 1216-21. 65. Candau, F.; Leong, Y. S.; Fitch, R. M., Kinetic study of the polymerization of acrylamide in inverse microemulsion Journal of Polymer Science, Polymer Chemistry Edition 1985, 23, (1), 193-214. 66. Candau, F.; Leong, Y. S.; Fitch, R. M., Effect of solution components on the termination mechanism in acrylamide microemulsion polymerizations Journal of Polymer Science, Part A: Polymer Chemistry 1989, 27, (7), 2179-88. 67. Corpart, J. M.; Selb, J.; Candau, F., Characterization of high charge density ampholytic copolymers prepared by microemulsion polymerization Polymer 1993, 34, (18), 3873-86. 68. Gan, L. M.; Chew, C. H.; Lian, N.; Li, G. Z., Polymerization of Styrene in a Winsor I-like System Langmuir 1994, 10, (7), 2197-201. 69. Loh, S. E.; Gan, L. M.; Chew, C. H.; Ng, S. C., Polymerization of methyl methacrylate in Winsor I-like system Journal of Macromolecular Science, Pure and Applied Chemistry 1996, A33, (3), 371-84. 70. He, G.; Pan, Q., Synthesis of Polystyrene and Polystyrene/Poly (methyl methacrylate) Nanoparticles. Macromolecular Rapid Communications 2004, 25, (17), 1545-1548. 71. Kaiyi, L.; Zhaoqun, W., A novel method for preparing monodispersed polystyrene nanoparticles. Front.Chem.China 2007, 2, (1), 17-20. 72. Ming, W.; Jones, F. N.; Fu, S., High solids-content nanosize polymer latexes made by microemulsion polymerization. Macromolecular Chemistry and Physics 1998, 199, (6), 1075-1079. 73. Ming, W.; Jones, F. N.; Fu, S., Synthesis of nanosize poly(methyl methacrylate) microlatexes with high polymer content by a modified microemulsion polymerization. Polymer Bulletin 1998, 40, (6), 749-756.

Chapter 3
Effects of pre-coalescence or post-coalescence crosslinking and glass transition
temperature*
Introduction
In 1978 Bufkin and Grawe1(a-e) published a series of review articles on crosslinking
latexes with several thousand references. These articles provided an extensive overview of the
various crosslinking chemistries available before 1978. Many thousands of patents and
publications on crosslinkable latexes have appeared since then. For examples of recent
publications, see references2-9 and patents, see references.10-13
As Jones14 points out, crosslinker mechanisms for latexes include the use of
carbodiimides and aziridine crosslinkers as well as the autoxidation mechanism. The
autoxidation mechanism can allow the crosslinking of latexes at room temperature following
which the latexes are storage stable for long periods of time. This approach includes the use of
allylic functionality in the latex, alkyd-acrylic latexes, latexes incorporating soya oil in the
polymer backbone or side chain, and the use of small amounts of diene monomers (e.g.,
butadiene, pentadiene) in the latex.15 The main disadvantage of the autoxidation mechanism is
the tendency for films to discolor upon aging (crosslinking) at room temperature. The review
paper of Winnik and Taylor2 covers advancements in crosslinking technology, various
crosslinking chemistries, and a masterful overview on their film formation mechanisms.
*Winner of the “Best Student Research Poster” at 2006 International Coatings Expo, sponsored by Federation of Societies for Coatings Technology, in New Orleans, USA.
*Finalist of the “Prestigious Roon Foundation Award” at 2007 FutureCoat! Conference sponsored by Federation of Societies for Coatings Technology, in Toronto, Ontario, Canada.
26

Surprisingly few, if any, of the thousands of publications contain systematic comparisons
of film properties of “pre-coalescence” (internal) and “post-coalescence” (external) crosslinked
latexes, the subject of this research. The main goal of the present study is to compare the effects
of type and level of crosslinking on latex fundamental and end-use properties and on the film
formation process and resulting morphology.
The conventional latexes presented in this study are prepared using n-butyl acrylate/n-
butyl methacrylate copolymers. A third monomer, methacrylic acid (2 wt %) was included to
enhance latex stability. The original goal of the conventional latex project was synthesis of
improved latexes for artist paints.16 Previous work16 showed that n-Butyl acrylate/n-butyl
methacrylate latexes with small amounts of crosslinker proved to be good candidates for artist
paints. This study extended to the research to include crosslinked latexes.
“Pre-coalescence crosslinked latexes” are referred as latexes that are prepared by
emulsion polymerization of conventional monomers such as mono-acrylates, mono-
methacrylates or styrene in combination with di- or poly-functional monomers such as di-
methacrylates or divinyl benzene which cause a degree of crosslinking within the latex particles.
It is sometimes called “intraparticle crosslinking”. The crosslinking reaction takes place before
the coalescence of the particles. In this study 1, 3-butylene glycol dimethacrylate (1, 3-BGDMA)
was used as the pre-coalescence crosslinker.
“Post-coalescence crosslinked latexes” are referred as latexes that are prepared with
reactive sites such as hydroxyl groups and are crosslinked during film formation by a crosslinker
that is added to the coating formulation but not co-polymerized in the latex. Another term is
“interparticle crosslinking.” Many combinations of reactive sites and crosslinkers have been
described in literature.2 In this study, diacetone acrylamide (DAA) was used as the monomer to
27

place reactive sites within the latex and adipic dihydrazide (ADDH) as the post-coalescence
crosslinker. This combination of site and crosslinker has been described in trade literature8 and
in numerous patents10-13and is being utilized by some major coatings and ink companies.
In this study, comparable latexes containing 0 – 4 wt. % of pre-coalescence crosslinker
(1, 3-BGDMA) and 0 – 5 wt. % of reactive monomer for post-coalescence crosslinker (DAA)
was investigated. Both the pre-coalescence and post-coalescence latex series were prepared by
semi-continuous emulsion polymerization using target glass transition temperatures (Tg) of 7 oC
and 22 oC. The films cast from these latexes were characterized using a variety of end-use tests
and advanced instruments such as a Nano-indenter, Dynamic Mechanical Analyzer (DMA),
Modulated Differential Scanning Calorimeter (MDSC), and an Atomic Force Microscope
(AFM). Information from such instruments greatly enhanced our understanding of the
relationship between the physical and morphological properties of coatings. The main goal of the
research was to understand the relationships between level and type of crosslinker and the
resultant fundamental and end-use film properties and film morphology.
Experimental Details
Materials
Materials with sources of supply utilized in this study are listed below:
Deionized Water, n-Butyl Methacrylate (nBMA, 99+%, 10-55 ppm MEHQ from Sigma-
Aldrich), Methacrylic Acid (MAA, 99%, 250 ppm MEHQ from Sigma-Aldrich), n-Butyl
Acrylate (nBA), 99%, 10-55 ppm MEHQ from Sigma-Aldrich), 1,3-Butylene glycol
dimethacrylate (1,3-BGDMA 99%, 200 ppm MEHQ from Sigma-Aldrich), Diacetone
acrylamide (DAA, 99% from Sigma-Aldrich), Adipic dihydrazide (ADDH, 98% from Sigma-
28

Aldrich), Sodium Lauryl Sulfate (SLS, RHODAPON UB (30%) from Rhone-Poulenc],
Ammonium Persulfate (APS, Certified A.C.S, from Fisher Scientific), 2,2’-Azobis [2-(2-
imidazolin-2-yl)propane] (VA-061 from Wako Pure Chemical Industries, Ltd.), Anhydrous
Sodium Carbonate (Certified A.C.S from Fisher Scientific), “Proxyl GXL” (from Avecia
Biocides), 2-Amino-2-methyl-1-propanol (“AMP-95” from Angus Chemical Company),
Ammonium Hydroxide (NH4OH, 29.2% from Fisher Scientific), Sodium Iodide (99.5%,
Certified A.C.S from Sigma-Aldrich), 2-Propanol (99.5+% from Sigma-Aldrich), Acetic Acid,
(99.8% from Sigma-Aldrich), Sodium Thiosulfate volumetric standard (0.1040N Solution in
water from Sigma-Aldrich), Acetone (99.5+% from Aldrich), Methyl Ethyl Ketone (MEK,
99.5% from Sigma-Aldrich), 2-Butoxyethanol (Butyl Cellosolve, 99% from Sigma-Aldrich),
“SURFYNOL 104BC” (from Air Products).
Latex Synthesis
Latexes were synthesized with varying levels of pre-coalescence crosslinker (internal)
and post-coalescence (external) crosslinkable sites. Two sets of latexes were prepared, one with
target glass transition temperatures (Tg) of about 7 oC and the other with target Tg of about 22
oC. Compositions and characteristics of these latexes are shown in Tables 3.1 and 3.2. The
latexes are coded I for pre-coalescence or internal, E for post-coalescence or external, L for low
Tg, H for high Tg , and a number for the weight % of crosslinker or reactive site in the monomer
line up. Thus, for example, IL-2 means an internally (or pre-coalescence) crosslinked, low Tg
latex with 2.0 wt. % of 1, 3-BGDMA and EH-1 means an externally (or post-coalescence)
crosslinked, high Tg latex with 1.0 wt. % of DAA.
29

Representative procedure for synthesis of latex IL-2
The procedure was essentially previously published but is included here for completeness.16
Polymerization was performed under a nitrogen atmosphere in a 5-L, 4-neck flask (“kettle”)
equipped with a mechanical stirrer (fitted with a 125 mm crescent Teflon blade), a temperature
control system, an inlet for a monomer emulsion fed by an FMI peristaltic pump, an inlet for an
initiator solution stream fed by a syringe pump, and a reflux condenser. The temperature control
system was a thermometer immersed in the reaction mixture electronically linked to a heating
mantle and a pneumatic jack. The jack automatically raised or lowered the heating mantle to
increase or reduce heat. A jet of room temperature air was directed at the flask for cooling when
the mantle was lowered. By these means, the temperature was controlled within ± 1 ºC. Steps in
the process were:
1. The kettle was charged with 773 g of DI water and 6.67 g of SLS.
2. In a graduated beaker with a magnetic stirrer was placed 369 g of DI water, 167 g of
SLS, 353 g of nBA, 1260 g of nBMA, 33.6 g of 1,3-BGDMA, and 33.6 g of MAA;
stirring gave a white monomer emulsion.
3. Separately, a solution of 3.37 g of ammonium persulfate in 178 g of DI water was
prepared.
4. To make a “pre-form” (seed latex), the kettle contents were heated to 80 – 82 oC and
stirred as the following ingredients were added sequentially: (a) 44.5 g of the monomer
emulsion, (b) 47.5 g of DI water, (c) a solution of 5.83 g of anhydrous sodium carbonate
in 47.5 g of DI water, and (d) a solution of 4.98 g of ammonium persulfate in 47.5 g of
DI water. The mixture was stirred at 80 – 82 oC for 20 minutes.
30

5. Addition of the main charges was then started by simultaneously pumping the monomer
emulsion (step 2) using the peristaltic pump and the initiator solution (step 3) using the
syringe pump, with continuous stirring of the reaction flask and the monomer emulsion
in the beaker. The monomer emulsion was added at a rate of 450 mL/hr for the first 20
minutes and at a rate of 900 mL/hr for the next 160 minutes. The rate of decrease of the
volume of monomer emulsion in the graduated beaker measured the feed rate. The
initiator solution was added throughout the process at a rate of 60 mL/hr using a
calibrated syringe pump. Throughout the 3-hr. addition, the reactor temperature was
maintained at 80 – 82 oC, and this temperature was maintained for 30 min after addition
was complete.
6. As step 5 approached completion, a solution of 1.6 g of 2, 2’-azobis [2-(2-imidazolin-2-
yl) propane] in 320 g of DI water was prepared with heating to about 70 oC.
7. With the kettle temperature at 80 – 82 oC, the 2, 2’-azobis 2, 2’-azobis [2-(2-imidazolin-
2-yl) propane] solution was added all at once. Temperature was increased to 91 – 93 oC
and held for 2 h with continued stirring.
8. The latex in the kettle was cooled to about 60 oC, and a 50/50 wt./wt, solution of 2-
amino-2-methyl-1-propanol in DI water (about 30 mL) was added with continued
stirring to adjust the pH to 9.2 – 9.5.
9. The kettle temperature was reduced to about 40 oC, and a solution 1.44 g of “Proxyl
GXL,” a bio-stabilizer, in 14 g of water was added and stirred in.
10. The latex was filtered through a tared 200-mesh sieve.
11. Coagulum was assessed by drying the sieve and weighing the material collected.
31

The characteristics of the resulting latexes are shown in Table 3.1. Coagulum was
negligible. The other latexes described in Tables 3.1 and 3.2 were made by essentially identical
procedures with the compositions adjusted as shown in Tables 3.1 and 3.2. In the case of
making pre-coalescence crosslinked latexes, the functional monomer was included in the
monomer mixture recipe. In the case of the post-coalescence crosslinkable latexes, (a)
crosslinkable monomer was added at the end of the monomer addition and (b) aqueous ammonia
was used to adjust the pH of the product instead of 2-amino-2-methyl-1-propanol to reduce the
potential for interference with the crosslinking reaction.
It should be noted that the syntheses were repeated by different operators with
essentially similar results. This demonstrated the robustness of the process, if followed
carefully, in terms of repeatability and reproducibility.
Characterization of Latexes
Latex Properties
The weight percentage of non-volatile solids content (% NVM) was measured using
ASTM D 4758-87. Viscosity was measured by ASTM D 4287 at 20 °C using a Brookfield
Viscometer, Model DV-1, using Spindle #4 at 20 rpm. pH was measured with a Fischer Acumet
Model 620 pH meter and with pH paper.
For particle size (diameter) and particle size distribution measurements, each latex was
diluted to a transmission factor of 0.5-1.0 (about 0.05-0.1 wt% solids) and measured at 25 °C
using the light-scattering instrument, MICROTAC Series 9200. Three tests were performed
within 180 sec. to obtain an average value of a volume distribution.
32

For gel content measurements, an empty extraction thimble was dried at 85 °C in an oven
for 2 hours, cooled in a desiccator overnight, and weighed. Latex films (prepared on glass and
detached) were dried in a desiccator overnight, cut into small pieces, weighed, and put into the
thimble. After a 12-hour extraction with acetone in a Soxhlet extractor, the thimble was dried in
an oven at 85°C for 2 hours, cooled in a desiccator overnight, and weighed. The gel content was
calculated from the initial and final weights, assuming that gelled material remained in the
thimble. The results are shown in Figures 3.1 and 3.2, and in Tables 3.1 and 3.2.
Film Properties
Specimens were prepared on aluminum panels by drawing the latexes down using a
square wet film applicator (Paul N. Gardner Co., Inc.) with 0.2 mm (wet) clearance on aluminum
panels. The panels were placed in at 55 °C in oven overnight then stored at normal room
conditions for a week before testing. No coalescing solvents were used. Dry film thicknesses
were approximately 50 μm. Before casting these films, a stoichiometric amount of adipic
dihydrazide (ADDH) was added to the E-series latexes.
Dry film thickness was measured at 25°C by Elcometer-345-Digital Coating thickness
Gauge (Elcometer Instruments Ltd.). Solvent resistance was determined by methyl ethyl ketone
(MEK) rubbing. Load was applied by a ball peen hammer with a 448 g head wrapped with
cheesecloth soaked with MEK. The reported end point was the number of double rubs required
to break through the film, exposing bare metal.
Chemical resistance tests were conducted at 25 °C following ASTM D 1308. A 1-mL
sample of each test reagent (water, dilute sulfuric acid at pH 3) was pipeted (a 5-mL pipet
graduated in 0.1 mL) onto the horizontal panel and immediately covered with a watch glass.
33

After an interval, the spot was wiped clean and the film was examined immediately for defects.
Intervals used were 15 min, 1 h, and 16 h.
Pencil hardness was tested at 25 °C following the procedure of ASTM 3363. Tape
adhesion was measured by ASTM D 3359. The films were cut with a cross-cut kit (Precision
Gage & Tool Company) before testing.
Thermal and Mechanical Properties
For glass transition temperature (Tg) measurement, specimens were prepared on glass
panels by drawing the latexes down using a square wet film applicator (Paul N. Gardner Co.,
Inc) with 0.25 mm (wet) clearance on glass panels. The panels were dried in an oven at 55 °C
and 50% humidity. The films were then stored at a normal room conditions for a week before
testing. The Tg of the dried films were determined by TA instrument - TA 2920 MDSC with
Liquid Nitrogen Cooling Accessory System (LNCS) under nitrogen purge at flow rate of 50
ml/min. For testing, the samples were kept in closed aluminum non-hermetic pans. Temperature
scans were done from -100 °C to 100 °C at 2 °C/min with modulation of +/- 1.00 °C at every 60
seconds under nitrogen. The MDSC equilibrated at -100 °C for 5 min.
Dynamic Mechanical Analyses were conducted using TA Instruments Model Q800
Dynamic Mechanical Analyzer (DMA) with LNCS accessory. Specimens for stress-strain and
dynamic mechanical studies were prepared on glass panels as described in MDSC studies
section. A film cutter (supplied by TA instruments) was used to cut, at constant depth,
rectangular specimens about 15-20 mm long, 3-6 mm wide, and 0.1-0.2 mm thick from the cured
films.
The stress-strain studies were performed at room temperature (~25°C) in air on the Q800
DMA with the thin film tension clamp in a controlled force mode with a ramped force of 3
34

N/min. up to 18 N/min., and the resultant % strain was observed. DMA measurements of dried
specimen were done at 1 Hz with a thin film tension clamp over the temperature range of -100
°C to 100 °C, using liquid nitrogen as a coolant. The flow rate of liquid nitrogen into the DMA
depends upon the starting temperature desired and is controlled by the ramp rate or heating rate
of 3 °C/min.
Measurements with the Nanoindenter
The nanoindentation or nanoscratch tester used in this study was a computer controlled
“Nanoindenter XP,” made by MTS. Its operation was described in detail in a previous paper by
Shen et al.17
In the present study, a Berkovich diamond tip with an angle of 142.4o was used for the
indentation experiments. The tests were performed by applying an increasing normal force
(loading) at a constantly increasing rate to a pre-determined maximum load in 15 seconds,
holding at the maximum force for 30 seconds to check viscocreep if any, and then decreasing the
force to zero (unloading) in 15 seconds. The temperature during the indentation tests was 26 – 28
oC. The maximum applied force was determined, depending on the hardness of the tested
specimens. The instrument plots a curve of applied force versus the indentation depth during
loading, holding, and unloading after the test. Usually, the tip continues to indent into the
surface at the fixed maximum force during the holding period due to viscous creep of the
material. Also, usually, the unloading curve does not coincide with the loading curve, reflecting
a residual plastic deformation. The instrument automatically calculates the hardness (H), defined
as applied normal force divided by projected contact area,
H = AF (1)
35

and the elastic modulus (E), using the formula
E =A
S2π . (2)
where A is the contact area projected on the original surface under the maximum normal force
and S is the slope of the tangential of the unloading curve at the turning point. Note that A
increases with the indentation depth as explained by Oliver and Pharr.18 The interpretation of H
and E values measured in the indentation tests was discussed by Shen et al. 17
Measurements with Atomic Force Microscope
An Atomic Force Microscope (NanoScope III, Digital Instruments) was used to observe
surface morphology and friction property of the specimens. The contact mode was used to obtain
surface morphology and friction force images. Both surface morphology and friction force
images were obtained at sizes of 20 μm × 20 μm and 5 μm × 5 μm. The 100 μm × 100 μm
surface morphology images were also studied. For time evolution study, both surface
morphology and friction force images were captured at image sizes of 2 μm × 2 μm and 5 μm ×
5 μm; two sets for each sample.
Results and Discussion Latex Synthesis and Characterization
“Pre-coalescence” crosslinked latexes were synthesized by a straightforward semi-
continuous emulsion polymerization process with varying levels of a crosslinking monomer.
Compositions and characteristics of the latexes are shown in Tables 3.1 and 3.2. As shown in
Table 3.1, addition of up to 4 wt. % of 1, 3-BGDMA has minimal effect on the characteristics of
the latexes except that Tg is increased at the 4 % level. In the synthesis 2, 2’-Azobis [2-(2-
imidazolin-2-yl) propane] was used as a “chaser” to consume unreacted monomers at the end of
36

the polymerization rather than the more conventional tert-butyl hydroperoxide. A previous
study16 showed that the azo-chaser was associated with a much lower rate of hydroperoxide build
up during QUV-A exposure.
H2C C C OO
CH2 CH2 CH CH3
O CO
C CH2
CH3CH3
Figure 3.A. Schematic representation of 1, 3-BGDMA
37

Table 3.1. Characteristics of 1,3-BGDMA pre-coalescence crosslinked latexes
Latex
Composition % Non-Volatiles
Particle Size, μm
Glass Transition Temp. (ºC) by MDSC
pH Gel Content
Viscosity η (mPa•s)
IL-0 nBA/nBMA/1,3-BGDMA/MAA=21/77/0/2
47.1 0.130 6 9.3 0.00 100
IL-0.25 nBA/nBMA/1,3-BGDMA/MAA=21/76.75/0.25/
2
47.7 0.129 8 9.3 46.1 90
IL-0.6 nBA/nBMA/1,3-BGDMA/MAA=21/76.4/0.6/2
47.5 0.128 5 9.2 56.2 100
IL-1.2 nBA/nBMA/1,3-BGDMA/MAA=21/75.8/1.2/2
47.4 0.127 6 9.3 52.8 90
IL-2 nBA/nBMA/1,3-BGDMA/MAA=21/75/2/2
44.6 0.118 5 9.0 57.1 80
IL-4 nBA/nBMA/1,3-BGDMA/MAA=21/73/4/2
46.8 0.123 13 9.2 64.2 70
IH-0 nBA/nBMA/1,3-
BGDMA/MAA=9/89/0/2 46.9 0.126 21 9.1 0.0 120
IH-0.25 nBA/nBMA/1,3-BGDMA/MAA=9/88.75/0.25/2
46.6 0.134 25 9.3 10.1 120
IH-0.6 nBA/nBMA/1,3-BGDMA/MAA=9/88.4/0.6/2
46.9 0.129 25 9.4 10.3 120
IH-1.2 nBA/nBMA/1,3-BGDMA/MAA=9/87.8/1.2/2
47.5 0.126 24 9.1 15.6 120
IH-2 nBA/nBMA/1,3-BGDMA/MAA=9/87/2/2
47.8 0.125 13 9.3 61.3 100
IH-4 nBA/nBMA/1,3-BGDMA/MAA=9/85/4/2
47.6 0.125 33 9.2 62.9 120
38

Table 3.2 Characteristics of DAA externally crosslinkable latexes Latex Composition % Non-
Volatiles Particle Size, μm
Glass Transition
Temperature (ºC) by MDSC
pH Gel Content
Viscosity η
(mPa•s)
EL-0 nBA/nBMA/DAA/MAA=21/77/0/2
47.0 0.134 6 9.8 0.0 280
EL-1 nBA/nBMA/DAA/MAA=21/76/1/2
46.4 0.128 9 9.8 91.3 390
EL-2 nBA/nBMA/DAA/MAA=21/75/2/2
46.6 0.133 7 9.8 98.1 560
EL-5 nBA/nBMA/DAA/MAA=21/72/5/2
46.3 0.137 5 9.7 100.0 1320
EH-0 nBA/nBMA/DAA/
MAA=9/89/0/2 47.3 0.135 22 9.8 0.00 260
EH-1 nBA/nBMA/DAA/MAA=9/88/1/2
45.6 0.128 25 9.8 90.0 230
EH-2 nBA/nBMA/DAA/MAA=9/87/0/2
45.8 0.133 25 9.8 97.4 230
EH-5 nBA/nBMA/DAA/MAA=9/84/5/2
46.0 0.129 23 9.8 97.9 1010
In a similar process, emulsion copolymerization with diacetone acrylamide (DAA) at up to 2 wt.
% levels also had negligible effect on the measured characteristics of the latexes (See Table 3.2).
At the 5 wt. % level a substantial increase in latex viscosity was observed along with a slight
effect on Tg. It should be noted here that the surfactant/monomer wt. ratio used in the synthesis
is 3/100.
Film Formation by “Pre-coalescence” Crosslinked Latexes
Films were cast from the internally (pre-coalescence) crosslinked latexes by conventional
means. No coalescing solvent was used; film formation was accelerated by warming the films at
55 oC overnight. Film thicknesses were about 50 μm.
39

A useful model of film formation by latexes2-4 involves three major overlapping stages:
(1) evaporation of volatiles, (2) particle deformation to a continuous film (usually referred as
“coalescence”), and (3) molecular interpenetration to knit the particles together (also called
“fusion” or “further coalescence”). The third stage is critical to achieving full potential film
properties. A schematic diagram of the latex film formation process is shown below.2-4
Figure 3.B. Schematic representation of the latex film formation process2-4
The third stage of film formation involves interdiffusion of polymer chains from different
latex polymers. Interdiffusion knits vestigal particles together and is essential if the polymer
film is to realize the mechanical properties of which its composition is capable. Complete
interdiffusion is not necessary, however; it is only necessary for the molecules from adjacent
particles to interpenetrate to a distance comparable to the root-mean-square radius of gyration
(RG) of the individual molecules, 4 typically a smaller distance than the diameters of the original
latex particles.
40

In this model, latexes with very low levels of internal crosslinking are able to coalesce to
form good films. Presumably, dangling ends of crosslinked molecules and any unreacted
molecules present are able to interdiffuse. But how much internal crosslinking can be tolerated
before interdiffusion is impeded sufficiently that the film cannot approach the mechanical film
properties of uniformly crosslinked latex of that composition? Previous studies offer insight into
this question.
Zosel and Ley5 used swelling, dynamic mechanical analysis, and small angle neutron
scattering to study poly (n-butyl acrylate) (PNBA) and poly (n-butyl methacrylate) (PNBMA)
latexes with 0 to 2 wt. % of an internal crosslinker, methallyl methacrylate (MAMA). Their
results present a complex picture. Films that contain 2 wt. % of MAMA remain brittle even after
annealing at 90 oC, while films with smaller amounts of MAMA become tougher and more
elastic when annealed. The results are discussed in terms of the relationship between the mean
molar mass between crosslinks (Mc) and the entanglement length (Me). When crosslink density
is high enough that Mc = Me, a critical concentration, is reached, above which the films are
incapable of sufficient interdiffusion to fully knit the vestigal particles. Below that level, good
knitting is possible, but the rate of interdiffusion at a given temperature decreases as the critical
level is approached. The critical concentration of MAMA is about 0.7 wt. % for PNBA and
about 1.5 wt. % for PNBMA. Of course, these levels might vary widely with other
compositions.
Tamai, Pinenq, and Winnik, 19 whose research was built on the work of Zosel and Ley, 5
studied the effect of crosslinking on polymer diffusion in Poly (butyl methacrylate-co-butyl
acrylate-co-ethylene glycol dimethacrylate) latex films primarily by fluorescent energy-transfer
measurements and AFM. Their results showed that the presence of crosslinks in the latex
41

particles limits the extent of polymer interdiffusion with increasing levels of crosslinking. At 4
mol% of ethylene glycol dimethacrylate, significant polymer diffusion occurred. This was
attributed primarily to intercellular mixing caused by the diffusion of dangling polymer chains
anchored in the crosslinked network. The crosslinked particles formed tough elastomeric films
with high tensile strength and substantial elongation to break but with expected poor solvent
resistance. Aradian, Raphael, and de Gennes20 developed a theoretical mode to account for the
competition between interdiffusion and cross-linking at polymer interfaces largely inspired by
the experimental work of Winnik and coworkers.19
A series of papers by Ghazaly et al.21-24 provides further insight. These authors used
miniemulsion polymerization to prepare NBMA copolymers with three crosslinkers, ethylene
glycol dimethacrylate (EGDMA) and two polymeric diacrylates with Mn of roughly 4000. The
mole ratio of NBMA to the crosslinkers was 500:1. Studies of swelling and tensile properties of
materials cast from polymers at 120 oC showed wide differences in properties, with one of the
polymeric diacrylate crosslinkers giving the best tensile properties and EGDMA giving brittle
materials. In one case, the choice of initiator for the polymerization also affected properties.
The differences were attributed to differences in the way the network microstructures evolved
during miniemulsion polymerization. Ghazaly et al.’s 21-24 study illustrates the complexities
inherent in studies of internally or pre-coalescence crosslinked latexes.
Film Formation by “Post-coalescence” Crosslinked Latexes
The DAA-containing latexes are combined with a stoichiometric amount of adipic
dihydrazide (ADDH) crosslinker. Then the films were cast under the same conditions as for
internally crosslinked latexes. Before the film is cast, premature reaction of ADDH with the
reactive sites in the latex is minimal.2, 3, 8, 9, 24, 25 The crosslinking reaction for the DAA monomer
42

is shown below. The ADDH is water soluble, and almost all of it remains separated from the
reactive sites in the serum where it is. The relatively high (9 – 9.5) pH also suppresses the
reaction. When the film is cast, however, the water evaporates, forcing ADDH to come in
contact with the latex polymer surfaces when close packing of the latex particles has occurred;
ammonia evaporates, lowering the pH to about 6.5; and then crosslinking accelerates.24
The crosslinking reaction, illustrated for DAA monomer is as follows:
Figure 3.C. Schematic representation of DAA & ADDH crosslinking reaction
After the film is cast, the crosslinking reaction is known to proceed at a useful rate at
room temperature.10 In this study we baked the films overnight at 55oC to assure a high level of
conversion before testing and to avoid the use of coalescing solvents. Among the factors that
influence final properties of the films are the composition of the latexes and the relative rates of
43

• mixing of the crosslinker with the polymer,
• interdiffusion of the polymer molecules that originated in different latex particles,
• the chemical crosslinking reactions and diffusion of ADDH into the polymer,10 and
• Tg of latex at a specific composition.
To reach a high level of conversion, the bake temperature should be well above the Tg of
the specific latex composition. In this study, this is true for the low Tg latex (both pre-
coalescence and post-coalescence crosslinked latexes). However, it may be borderline for high
Tg latex (both pre-coalescence and post-coalescence crosslinked latexes). This will be discussed
further later in the paper.
If the rate of the crosslinking reaction is too fast relative to mixing and interdiffusion,
coalescence and interdiffusion will be slowed and perhaps retarded prematurely. The likely
result will be excessively non-uniform films and less than optimal film properties. Some
literature reports 2, 8, 10-13 suggest that the DAA/ADDH crosslinking combination has satisfactory
relative rates and good film properties can be attained. A patent, 11 however, indicates that film
properties can be improved by incorporating a retarder chosen from wide variety of substances,
many of them salts of weak acids with stronger bases.
44

Gel Content Results
Pre-coalescence Crosslinked Latexes
0
10
20
30
40
50
60
70
0 1 2 3 4 51,3 BGDMA%
Gel
Con
tent
, %
ILIH
Figure 3.1 Gel Content of Pre-coalescence Crosslinked Latex Films
Post-Coalescence Crosslinked Latex
0
20
40
60
80
100
120
0 1 2 3 4 5 6DAA,%
Gel
Con
tent
, %
ELEH
Figure 3.2 Gel Content of Post-coalescence Crosslinked Latex Films
45

Acetone extraction was employed to measure the gel content of the films, with the results
shown in Figures 3.1 and 3.2. For post-coalescence (externally) crosslinked films, not
surprisingly, the gel content was about 90% for films containing 1 wt.% of DAA reactive site
and approaches 100% for films with higher levels of crosslinking. For pre-coalescence
(internally) crosslinked films, however, the gel content measured in this way never rises much
higher than 60%. From 0.25 to 1.2 wt. % internal crosslinker, the low Tg films have much higher
gel fractions than the high Tg films. It is speculated that the gel content of these latexes are
actually much higher. The low values recorded here may reflect incomplete knitting of the pre-
coalescence (internally) crosslinked latex particles during film formation, allowing small pieces
to break loose and pass through the filter.
Atomic Force Microscope Results
Atomic Force Microscope images of the surface of a film cast from latex IH-4 (Figure 3.3
and 2.4) show ball-like features in both the topographic and frictional images. In addition, the
frictional images show dark areas suggestive of deposits of some contaminant on the surface,
cracks, or some other surface defects. In the frictional images, bright indicates low friction and
dark indicates high friction. The physical significance of these dark areas is not known. The fact
that they are high friction areas discourages the notion that they are shrinkage cracks or voids.
46

Figure 3.3 20 μm × 20 μm AFM topographic image (left) and frictional image (right) of Sample IH-4
Figure 3.4 5 μm × 5 μm AFM topographic image and frictional images of Sample IH-4
The AFM images, with higher magnified z scale, of surfaces of the films cast from
latexes EL-1 and IH-4 (Figure 3.5) show the topographic variation of the surfaces with lateral
dimensions of the same order of magnitude as the original latex particles, as commonly observed
47

with films cast from latexes. Note that the height of the peaks at the surface of the EL-1 film is
an order of magnitude larger than the height of the peaks in the IH-4 film. This observation
suggests that the rate of the crosslinking reaction was fast enough to significantly retard the
homogenization of the film, at least near the surface. This observation is consistent with the
previously mentioned report by Geelhaar et al.11 that retarders can improve film properties with
this type of crosslinking, presumably by slowing the rate of the chemical crosslinking reaction.
Figure 3.5 AFM topographic Images of Sample EL-1 (top) and IH-4 (bottom). The two images have different Z scales, and surface of EL-1 is much rougher than that of IH-4
48

49
Time Evolution of Morphology by AFM
Figure 3.D shows morphological changes observed in the frictional images by AFM
operated in the contact mode during the film formation. The latex films were applied at room
temperature, and film formation was studied at regular time-intervals. The film formation
process is clearly evident in AFM images shown in Figure 3.D. The effect of Tg on film
formation can be clearly seen when the images of EL-5 and EH-5 are compared. The EL-5 films
appear smooth and homogenous compared to EH-5 at similar time interval. The effect of level of
crosslinking can also be seen when the images of EH-0 and EH-5 are compared. Looking at EH-
5, images latex particles interdiffusion can be clearly observed. The rate of crosslinking here
certainly affects the rate of interdiffusion of particles. Also, effect of type of crosslinking can
also be seen when comparing the film formation images of EL-5 and IH-4. The image of EL-5
shows more homogenous structure when compared to IH-4 images at similar time intervals.

50
EH 0
EH 5
EL 0
EL 5
IH 0
IH 4 30 min 120 min 2nd Day 15th Day Figure 3.D. Representative friction images of morphological changes observed by AFM contact mode during the film formation

Indentation tests with the nano-indenter
Conditions for preparation and testing of un-pigmented latex films are described in the
Experimental Section. As detailed in previous publications16-17 and in the Experimental Section
each test produces a load-displacement curve from which hardness and modulus were calculated.
For the low-Tg films, hardnesses and elastic moduli at varying crosslinker levels are
compared in Figures 3.6 and 3.7. For hardness, it can be seen that in post-coalescence
crosslinking, the value increases from 0% to 5%, but in the case of pre-coalescence crosslinking
going from 0% to 4%, it appears to have little effect on hardness values. Elastic modulus, post-
coalescence crosslinking caused a modest increase. Pre-coalescence crosslinking may also have
increased modulus, although scatter in the data make interpretation of the data less certain.
0
0.0005
0.001
0.0015
0.002
0.0025
0 1 2 3 4 5 6Crosslink Percentage (%)
Har
dnes
s (G
Pa)
ELIL
Figure 3.6. Comparison of hardness of samples in groups EL and IL with different crosslinker levels. The hardness was measured under a normal force of 1 mN.
51

0
0.01
0.02
0.03
0.04
0.05
0.06
0.07
0 1 2 3 4 5 6Crosslink Percentage (%)
Elas
tic M
odul
us (G
Pa)
ELIL
Figure 3.7. Comparison of moduli of samples in groups EL and IL with different crosslinker levels. The modulus was measured under a normal force of 1 mN.
For high-Tg films, hardnesses and elastic moduli are compared in Figures 3.8 and 3.9. As
expected, high-Tg films are harder than low-Tg films at equal crosslinker levels. In this case,
hardness increases as the levels of both pre-coalescence and post-coalescence crosslinkers
increase. The elastic modulus of the pre-coalescence crosslinker increases with the level of
crosslinker, but does not increase very much with the level of post-coalescence crosslinking.
The latter result is surprising. In addition, high Tg latex films show higher hardness and elastic
modulus, but less instant elastic recovery, than those low Tg latex films. The instant elastic
recovery increased slightly with the increasing crosslinker percentage.
52

0
0.001
0.002
0.003
0.004
0.005
0.006
0.007
0.008
0.009
0 1 2 3 4 5 6Crosslink Percentage (%)
Har
dnes
s (G
Pa)
EHIH
Figure 3.8. Comparison of hardness of samples in groups EH and IH as a function of crosslinker percentage. The hardness was measured under a normal force of 1 mN.
0
0.1
0.2
0.3
0.4
0.5
0.6
0.7
0.8
0.9
0 1 2 3 4 5 6Crosslink Percentage (%)
Elas
tic M
odul
us (G
Pa)
EHIH
Figure 3.9. Comparison of modulus of samples in groups EH and IH as a function of crosslinker percentage. The modulus was measured under a normal force of 1 mN.
53

The dents made by the nano-indenter largely heal with time, as illustrated by the optical
images (1000x) in Figure 10 for IL-1.2 and IH-1.2, pre-coalescence crosslinked films. Note the
rough surface of film IL-1.2 Surface roughness may account for the difficulty of obtaining clear-
cut results with these specimens. As shown in Figure 3.10, the images of indent recovery in
samples IL-1.2 and IH-1.2 were taken at the intervals of 1, 4, 8, and 12 minutes.
Time after
indent
1 minute 4 minutes
8 minutes 12 minutes
IL-1.2
IH-1.2
Figure 3.10. Optical Images of the Residual Indentation in films cast from latexes IL-1.2 and IH-1.2. (1000x)
In general, the hardness and elastic modulus increase with increasing crosslinker
percentage. However, in low Tg pre-coalescence crosslinked latexes, the one with no crosslinker
(0% 1, 3-BGDMA) is harder and has higher modulus value than those that contain crosslinkers
less than 4%. In high Tg post-coalescence crosslinked latexes, EH-4 of 4% DDA/ADDH exhibits
lower modulus value than EH-0. These results are not easily explainable. However, based on
stress-strain data later in the results and discussion section, nano-indentation results are
consistent with modulus results from stress-strain data on bulk samples.
54

End-use film properties
Both types of latexes were cast on aluminum panels and kept at 55 oC overnight. The
end-use film properties correlated to crosslink density such as solvent resistance, hardness,
adhesion, and chemical resistance were studied. Results are presented in Table 3.3 and Table 3.4.
Table 3.3. Empirical properties of films cast from internally crosslinked latexes
Latexes IL-0 IL-0.25
IL-0.6
IL-1.2
IL-2 IL-4 IH-0 IH-0.25
IH-0.6
IH-1.2
IH-2 IH-4
Tape Adhesion 4B 4B 3B 3B 5B 3B 4B 4B 3B 5B 4B 3B Pencil Hardness 5B 4B 4B 4B 4B 4B 4B 4B 4B 4B 4B 5B MEK 2 Rub Resistance
4 6 6 6 6 6 3 4 4 4 4 4
D.I. Water 2 Rub Resistance
200 200 200 200 200 200 200 200 200 200 200 200
H2SO4 Spot Test, pH=3.1
15 min
E E E E E E E E E E E E
1 h E G G G G G G G G G E G 16 h F F F F F F F P P P P P
Distilled Water Spot Test
15 min
E E E E E E E E E E E E
1 h E E E E E E E E E E E E 16 h G F F F F F F P P P P P
E: Excellent, no change; G: Good, slightly white, but recovered quickly F: Fair, whitening, becomes transparent after 24 hours; P: Poor, permanent damage Table 3.4. Empirical properties of films cast from externally crosslinked latexes
Latexes EL-0 EL-1 EL-2 EL-5 EH-0 EH-1 EH-2 EH-5 Tape Adhesion 4B 5B 4B 4B 3B 4B 5B 5B
Pencil Hardness
4B HB 2B 2B 4B HB 2B B
MEK 2 Rub Resistance 5 18 42 83 7 14 16 106 D.I. Water 2Rub Resistance 200 200 200 200 200 200 200 200 H2SO4 Spot Test (pH=3.1)
15 min G E E E G E E E 1 h G E E E G G G G 16 h F F F G F P P F
Distilled Water Spot Test
15 min E E E E E E E E 1 h G E E E E G G G 16 h G G G E G G G G
E, G, F, P as in Table 3.3.
55

Higher DAA/ADDH in post-coalescence crosslinked latexes generally improves
adhesion, MEK solvent resistance, hardness, and chemical resistance as expected for post-
coalescence crosslinking. In contrast, the pre-coalescence crosslinked latexes exhibited opposite
phenomena. The higher amount of 1,3-BGDMA, the worse the adhesion. All pre-coalescence
crosslinked films had poor solvent resistance, and within probable experimental error, there was
no significant difference in film hardness. For pre-coalescence crosslinked latexes, chemical spot
resistance results average one grade down than the post-coalescence crosslinked ones. These
results indicate that, while very low levels of pre-coalescence crosslinking may improve certain
properties, the affect on properties at higher levels is generally deleterious. Thus, in case of pre-
coalescence crosslinking, the interdiffusion is impeded as too much crosslinking occurs before
sufficient coalescence.
Summarizing the end-use test results, it appears that pre-coalescence crosslinked latexes
can provide some good properties but cannot satisfy the full spectrum of film properties needed
for many paints. On the other hand, post-coalescence crosslinked latexes provide dramatic
improvement in chemical resistance and mechanical properties. They improve film toughness,
provide solvent resistance and reduce dirt pick-up. As the crosslinker level in pre-coalescence
crosslinked latexes increases, the particles are increasingly resistant to interdiffusion and perhaps
to coalescence, resulting in inferior films. On the other hand, post-coalescence crosslinked
latexes of the type studied here are apparently able to coalesce and interpenetrate adequately
before the crosslink density is high enough to impede formation of desirable films. These
observations are in harmony with the studies of Winnik and his colleagues on thermoset latex
film formation.24-26
56

Fundamental Mechanical Properties
• Stress-Strain Curves
Average stress-strain curves for postcoalesence low and high Tg latex samples are shown in
Figures 3.11 and 3.12, respectively, while the stress-strain curves for low and high Tg pre-
coalescence latex samples are shown in 2.13 and 2.14, respectively. Each stress-strain curve
represents an average of 5-6 replicates. Stress-strain data give information about the ultimate
mechanical properties of materials. The values of Young’s modulus, area under the stress-strain
curve, strain-at-break, and stress at break are summarized in Table 3.5. The area under the stress-
strain curve is a measure of the flexibility and toughness of the film. As the area decreases, the
film becomes less flexible and more brittle.
57

Table 3.5. Results of Stress-Strain Analysis
Sample Gel Content
Young’s Modulus
(E')
Area Under Curve
Strain at Break(εb)
Stress at Break(εb)
(MPa) (%) (MPa) IL-0 0.00 8.9 ± 0.6 172 ± 11 95.7 ± 6 2.7 ± 0.9
IL-0.25 46.1 13.9 ± 0.9 261 ± 21 109 ± 5.4 5.35 ± 0.6 IL-0.6 56.2 16.7 ± 1.2 299 ± 12 106 ± 5.4 5.78 ± 0.5 IL-1.2 52.8 16.2 ± 2.7 271 ± 40 107 ± 15 5.65 ± 0.8 IL-2 57.1 18.1 ± 0.9 311 ± 14 106 ± 12 6.00 ± 0.2 IL-4 64.2 49.7 ± 9.2 222 ± 6.3 57.9 ± 1.2 7.7
IH-0 0.0 15.9 ± 1.1 175 ± 2.8 98.8 ± 0.1 3.55
IH-0.25 10.1 55.5 ± 4.6 415 ± 68 74.7 ± 9.6 8.66 ± 0.6 IH-0.6 10.3 55.5 ± 4.6 415 ± 68 74.7 ± 9.6 8.66 ± 0.6 IH-1.2 15.6 59.9 ± 1.3 459 ± 25 75.5 ± 4.6 9.67 ± 0.3 IH-2 61.3 15.2 ± 1.6 257 ± 28 105 ± 11 5.04 ± 0.4 IH-4 62.9 213 ± 5.7 186 38.2 9.83
EL-0 0.0 8.9 ± 0.6 172 ± 11 95.7 ± 6 2.7 ± 0.9 EL-1 91.3 19.5 ± 0.5 318 ± 57 93.2 ± 11 6.71 ± 0.6 EL-2 98.1 24.2 ± 1.5 221 ± 50 62.9 ± 9.1 6.63 ± 0.8 EL-5 100.0 45.3 196.5 ± 11 41.8 ± 0.7 9.5 ± 0.5
EH-0 0.0 15.9 ± 1.1 175 ± 2.8 98.8 ± 0.1 3.55 EH-1 90.0 68.9 ± 10 364 ± 66 61.8 ± 7.6 8.71 ± 0.8 EH-2 97.4 69.9 ± 4.1 361 ± 35 60.8 ± 4.1 8.84 ± 0.3 EH-5 97.9 159 ± 11 174 ± 11 38.8 ± 1.5 8.9 ± 0.2
Figure 3.11 shows that with increasing levels of post-coalescence or external
crosslinking, Young’s modulus increases as expected for low Tg latex. However, a significant
decrease in area under the curve and strain at break is observed. The sample becomes more
brittle. Going from 0% to 1% crosslinker for the low Tg latex shows hardly any difference in
Young’s modulus. However, from 1 to 5% of crosslinker Young’s modulus values go from
58

approximately 70 MPa to 159 MPa. This also has been observed by nano-indentation
characterization, which shows that the Elastic modulus values for 0% and 1% crosslinker remain
similar while there has been a significant build-up in modulus values as crosslinker levels go
from 1% to 5% crosslinker. However, it should be noted that nano-indentation gives a surface
modulus value while stress-strain characterization gives a bulk modulus value.
EL SERIES
0
2
4
6
8
10
12
0 20 40 60 80 100 120
% Strain
Stre
ss (M
pa)
Average EL-0
Average EL-1
Average EL-2
Average EL-5
EL-1 EL-5
EL-2
EL-0
Figure 3.11. Average Stress-Strain Curves for Post-Coalescence Series: Low Tg
Figure 3.12 shows that for post-coalescence crosslinked high Tg latexes, the modulus
values increase with the level of crosslinking and the samples become more brittle. The modulus
values are higher than the low Tg counterparts, showing the effect of high glass transition
59

temperature with crosslinking. In contrast to low Tg samples, the high Tg samples shows a
significant change in modulus value as the crosslinking level goes from 0% to 1%. Both stress-
strain and nano-indenter data at 1% and 2% show a similar build up in modulus value compared
to 0% crosslinking. However, in the nano-indentation test, samples with 5% crosslinker show a
significant drop in elastic modulus in contrast to Young’s modulus by stress-stain. This
difference may reflect the different measurement methods.
EH SERIES
0
2
4
6
8
10
12
0 20 40 60 80 100 120
% Strain
Stre
ss (M
Pa)
Average EH-0
Average EH-1
Average EH-2
Average EH-5
EH-2
EH-5
EH-1 EH-0
Figure 3.12. Average Stress-Strain Curves for Post-Coalescence Series: High Tg
Figure 3.13 shows that in the case of pre-coalescence crosslinking, as the level of
crosslinking increases, interdiffusion of particles is retarded by crosslinking. It is observed that
between 0.25% to 2% crosslinker, the modulus value is comparatively lower than 0%
60

crosslinking. At 4% of crosslinking the sample builds up the modulus value but becomes more
brittle. The same trend is observed with the nano-indenter data where it is evident that the 0%
crosslinker sample has a higher modulus value than the modulus values corresponding to 0.25%
and 2% crosslinker. However, at highest level of crosslinking the Young’s modulus value is the
highest.
IL SERIES
0
2
4
6
8
10
12
0 50 100 150% Strain
Stre
ss (M
Pa)
Average IL-0
Average IL-0,25
Average IL-0,6
Average IL-1,2
Average IL-2
Average IL-4
IL-0 IL-2 IL-4
IL-0.25
IL-1.2 IL-0.6
Figure 3.13. Average Stress-Strain Curves for Pre-Coalescence Series: Low Tg
Figure 3.14 shows that for high Tg pre-coalescence crosslinked latexes as the crosslinker
level increases from 0-1.2%, the modulus values increase. However, the modulus value then
decreases at 2% but significantly increases at 4%. The drop in modulus value at 2% could be due
to retarded interdiffusion of polymer chains between particles. At 4% the increase in modulus
61

may be due to significantly increasing intra-particle crosslinking without further interrupting
interdiffusion of polymer chains compared to 2%.
IH SERIES
0
2
4
6
8
10
12
0 20 40 60 80 100 120% Strain
Stre
ss (
MPa
)
Average IH-0
Average IH-0.6
Average IH-1.2
Average IH-2
Average IH-4
IH-1.2 IH-4
IH-0.6
IH-2
IH-0
Figure 3.14. Average Stress-Strain Curves for Pre-Coalescence Series: High Tg
• Dynamic Mechanical Properties
Dynamic Mechanical characterization of heterogeneous polymers is dependent not only on
the chemical composition of a material but also on physical or structural arrangement of the
phases in a bulk polymer. DMA analysis gives an insight into intrinsic mechanical properties of a
polymer. Figure 3.15 and Figure 3.16 show representative temperature scan graphs of the post-
coalescence crosslinked latexes, high Tg and low Tg, respectively.
62

EH-0
EH-0
EH-1
EH-1
EH-2
EH-2
EH-5
EH-5
Storage modulus -Curves
Loss modulus Curves
Figure 3.15: Storage and Loss modulus curves of Post-coalescence Crosslinked Latexes: High Tg
63

Figure 3.16 Storage and Loss modulus curves of Post-coalescence Crosslinked Latexes: Low Tg
EL-5
EL-2
EL-1
EL-0
EL-0
EL-1
EL-2
EL-5
DMA provides information about the viscoelastic properties (storage modulus and loss
modulus) of a polymer as a function of frequency and temperature. The inflection point of the
storage modulus is related to the Tg of the polymer. It should be noted that the temperature
64

corresponding to the inflection point of the tan delta curve is higher than the Tg value determined
by MDSC, which is commonly observed. The tan delta curve is calculated as ratio of the loss
modulus and storage modulus. The point where the storage modulus curve flattens is an indicator
of the rubbery plateau. Hill27 points out that “for unpigmented crosslinked coating films the level
of the storage modulus, E', in the rubbery plateau region above Tg is an indication of crosslink
density”. Hill27 further points out that a wide variation in E' values have been observed from
4MPa for lightly crosslinked systems to 200MPa for very highly crosslinked films. For the EH
series latex films in the 80 to 90°C temperature range, the values of E’ are as follows: EH0, E' =
1MPa; EH1, E'=2MPa; EH2, E' = 2MPa and EH5, E'= 9MPa. For the EL series latex films in the
80 to 900C temperature range the values of E’ are as follows: EL0, E' = 1MPa; EL1, E'=3MPa;
EL2, E' = 3MPa and EL5, E'= 10MPa. Therefore, according to Hill’s27 criteria, the rubbery
plateau modulus values indicate that at 5% crosslinker level, films from both EH and EL latexes
are very lightly crosslinked systems.
Table 3.6 compares the MDSC Tg, DMA storage modulus inflection point, DMA loss
peak temperature, tan delta peak temperature, and half width/half height of tan delta peak.
65

Table 3.6 Comparison of DMA values with MDSC Tg values
Samples MDSC (Tg)
DMA DMA DMA (L)HWHH (R)HWHH Storage modulus inflection
point
Loss peak temperature
Tan delta peak
temperature
DMA Tan delta
DMA Tan delta
EL-0 6 13.5 18.7 42.5 10.0 12.6 EL-1 9 16.0 18.7 42.7 11.0 14.2 EL-2 7 18.9 18.7 43.9 11.6 14.2 EL-5 5 21.4 20.6 44.4 13.1 16.8
IL-0 6 13.5 18.5 42.4 10 12.6
IL-0.25 8 16.7 17.6 42.7 10.8 12.9 IL-0.6 5 20.0 17.6 43.3 11.0 13.7 IL-1.2 6 17.0 19.1 43.0 10.5 12.9 IL-2 5 18.7 18.2 42.7 10.0 13.1 IL-4 13 23.4 25.1 50.4 10.5 13.4
EH-0 22 31.2 20.3 41.6 11.3 14.2 EH-1 25 38.4 37.2 61.4 11.0 12.1 EH-2 25 37.1 34.6 61.4 11.3 13.7 EH-5 23 36.4 34.4 59.1 12.6 16.3
IH-0 21 31.2 32.8 41.9 11.3 14.2
IH-0.25 25 31.0 35.0 62.2 10.5 13.2 IH-0.6 25 31.0 35.0 62.2 10.5 13.2 IH-1.2 24 20.3 36.6 62.0 10.5 12.4 IH-2 13 20.4 26.0 48.1 11.0 13.1 IH-4 33 * * * * *
* indicates – sample was too brittle to test
• Tan delta Curves
In the case of post-coalescence crosslinked latexes, with increasing % crosslinker, clear
broadening and shifting of tan delta peak to higher temperatures is evident in Figure 3.17. Going
from 0% to 1% or 2% shows a shift in tan delta peak to higher temperatures but the clear
broadening of the tan delta peak can be seen at the 5 % crosslinker level. However, in the case of
low Tg latexes in Figure 3.18, the shifting in tan delta peaks is negligible, but at the highest level
of crosslinking, broadening as well as a decrease in peak height can be seen very clearly. The
66

above observations are also reflected in half width and half height values of tan delta curves as
shown in Table 3.6. The broadening of the tan delta peak is an indication of the development of a
heterogeneous network structure and morphology as the crosslinker level increases.27
EH-0
EH-2 EH-1
EH-5
Figure 3.17 Tan delta curves of Post-coalescence Crosslinked Latexes: High Tg
67

EL-5
EL-0
EL-2
EL-1
Figure 3.18 Tan delta curves of Post-coalescence Crosslinked Latexes: Low Tg
Figures 3.17 and 3.18 show that the decrease of the tan delta peak can be seen for both
high Tg and low Tg post-coalescence crosslinker latex samples, particularly at the 5% level. This
can be directly attributed to increased crosslinking. As the level of crosslinking increases, the
Young’s modulus value increases at measurement temperatures of 25°C as shown in Figures
3.11 and 3.12 and Table 3.5. Also, the tan delta peaks become broader (increase of half width
and half height, Table 3.6), and the tan delta peak value decreases, an indication of the
development of a more heterogeneous network structure and morphology. Thus, as the
crosslinking level increases, the elastic modulus level obtained from stress-strain measurements
increases and the DMA tan delta peak broadens. The rubbery plateau modulus obtained from
68

DMA measurements increases at the 5% level indicating a lightly crosslinked latex film. It
should be noted that the MEK double rub resistance does increase as a function of crosslinking
level and the pencil hardness also increases with crosslinking level (see Table 3.3). These results
lead us to conclude that at the appropriate crosslinker levels an optimized hardness-flexibility
balance can be achieved. Clearly the postcoalescence crosslinked latex particles are able to
coalesce, interdiffuse, and interpenetrate adequately before the crosslink density is high enough
to impede the formation of films with desirable properties.
In the case of the pre-coalescence crosslinked latex samples, shifting of the tan delta peak
to higher temperature can be seen for low Tg latex samples at the highest crosslinking level in
Figure 3.19 with minimal broadening of the tan delta peak. In the case of higher Tg latex samples
in Figure 3.20, shifting of the tan delta peak to higher temperatures can be seen for all crosslinker
levels with minimal broadening of the tan delta peak. This would indicate that with increasing
crosslinker level, a more heterogeneous structure is not developing at least up to crosslinker
levels of 4%. However, as the crosslinking level increases, the elastic modulus level obtained
from stress-strain measurements increases at the 4% level. For IL latex films, the rubbery plateau
modulus obtained from DMA measurements increases to 9MPa for IL0.6 and then declines to
about 1MPa for IL2. This indicates as the level of precoalescence crosslinker increases internal
particle crosslinking increases and inhibits interdiffusion and interparticle chain entanglement.
For IH latex films the rubbery plateau modulus obtained from DMA measurements does not
increase above 3MPa for all levels of crosslinker. This indicates that for all levels of
precoalescence crosslinker, internal particle crosslinking inhibits interdiffusion and interparticle
chain entanglement. It should be noted that the MEK double rub resistance does not increase as a
function of crosslinking level, and the pencil hardness appears to be essentially independent of
69

crosslinking level (see Table 3.3). These results indicate that the precoalescence particles are
indeed internally crosslinked but do not improve the properties of the latex films. These results
lead to the conclusion that higher crosslink levels will not affect the rubbery plateau modulus for
these high molecular weight, high Tg latex polymer chains. Thus, in case of pre-coalescence
crosslinking, the interdiffusion is impeded because too much crosslinking occurs before
sufficient interparticle chain entanglement and particle coalescence can occur.
IL-4
IL-1.2
IL-2 IL-0.25
IL-0
IL-0.6
Figure 3.19 Tan delta curves of Pre-coalescence Crosslinked Latexes: Low Tg
70

.
IH-0
IH-0.25
IH-2
IH-1.2
Figure 3.20 Tan delta curves of Pre-coalescence Crosslinked Latexes: High Tg
Comparison of DMA results of latex samples: 1st day (after oven cured) vs. 7th day (after oven
curing):
Two sets of studies were performed: (1) on the first day (at the end of overnight cure into
the oven), and (2) on the 7th day (7 days of ambient cure after overnight cure into the oven). The
results from the 1st and 7th day studies were compared. Comparison between the first day studies
and the 7th day studies were done. Figure 3.21 (a, b) shows Young’s modulus vs. % gel of EL
and IL samples of 1st vs. 7th day studies. Figure 3.22 (a, b) shows representative tan delta curves
of EL2 and IL-1.2 samples of 1st vs. 7th day studies. The comparison showed that similar trend is
71

observed when comparing the results obtained in 1st and 7th day for stress-strain results and
dynamic mechanical analysis. The values are not identical but these are very close (with in the
experimental error or standard deviations) and the curves show the same inflection.
EL Series
Figure 3.21 (a) Representative curves showing 1st day vs. 7th day comparison of stress-strain analysis of EL series
IL Series
Figure 3.21 (b) Representative curves showing 1st day vs. 7th day comparison of stress-strain analysis of IL series
72
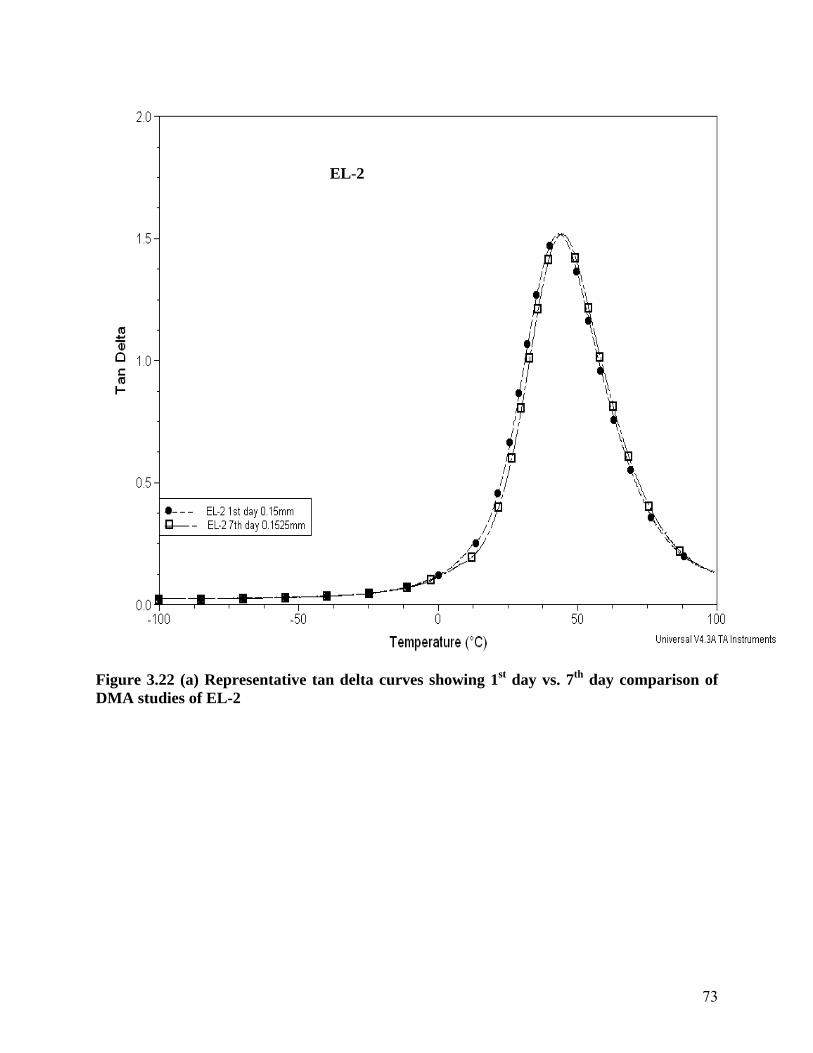
EL-2
Figure 3.22 (a) Representative tan delta curves showing 1st day vs. 7th day comparison of DMA studies of EL-2
73

IL-1.2
Figure 3.22 (b) Representative tan delta curves showing 1st day vs. 7th day comparison of DMA studies of IL- 1.2 samples
Time-evolution of mechanical properties
The liquid coating samples were applied and cured on glass panels at room temperature.
The stress-strain and DMA analysis of samples of dried coatings at specified time intervals from
1st day to 10th day were done. Figure 3.23 (a-b) shows representative stress-strain average curves
and Storage & Loss modulus curves of sample EH-0. The graph shows clear evidence of build
up in mechanical properties as a function of time. Going from the first day to second day to fifth
day, the mechanical properties show significant build-up.
74

0
0.5
1
1.5
2
2.5
3
3.5
0 20 40 60 80 100 120% Strain
Stre
ss (M
pa)
EH-0 1st Day
EH-0 2nd Day
EH-0 5th Day
EH-0 10th Day
Figure 3.23 (a) Time-based stress-strain analysis of EH-0 at ambeint conditions
EH-0
Figure 3.23(b) Time-based DMA analysis of EH-0 at ambeint conditions
75

Conclusions
The present research is one of the few, if any, systematic comparisons of both pre-
coalescence vs. post-coalescence crosslinking. The key findings of the research are summarized
below:
• Up to 4 wt. % of 1, 3-BGDMA has a minimal effect on the end-use properties of the pre-
coalescence crosslinked latexes except that Tg is increased at the 4 % (highest) level. In
the case of post-coalescence crosslinked latexes, at the 5 wt. % level (highest) a
substantial increase in latex viscosity was observed along with a slight effect on Tg.
• The post-coalescence crosslinked latexes showed higher % gel compared to pre-
coalescence crosslinked latexes. The low values recorded for pre-coalescence crosslinked
latexes may reflect incomplete knitting of the pre-coalescence crosslinked latex particles
during film formation, allowing small pieces to break loose and pass through the
extraction filter.
• AFM images of the films cast from latexes showed that the height variation at the surface
of the low Tg post-coalescence latex at the 1% crosslinker level is an order of magnitude
larger than the height variation at the surface of high Tg pre-coalescence latex at the 4%
level of crosslinker. This observation suggests that the rate of the crosslinking reaction
for high Tg precoalescence latex at the 4% level was fast enough to significantly impede
interdiffusion and retard particle coalescence and the homogenization of the film, at least
near the surface.
• With the use of AFM the film formation as a function of time can clearly be seen through
evolution of mechanical properties and morphological changes with time for post-
coalescence and pre-coalescence crosslinking.
76

• Hardness values of low Tg post-coalescence crosslinked latexes increased with increasing
crosslinker level, while hardness values of low Tg pre-coalescence crosslinked latexes
were independent of crosslinker level. Hardness values of high Tg pre-coalescence and
post-coalescence crosslinked latexes increased with increasing levels of crosslinker. As
expected, high Tg films were harder than low Tg films at equal crosslinker levels. The
elastic modulus for post-coalescence crosslinked latexes showed a modest increase with
the increase of the level of crosslinker, while the pre-coalescence crosslinked latexes had
an increased elastic modulus at increasing crosslinker levels. At the 4% (the highest)
level of crosslinker for pre-coalescence crosslinked latexes, the elastic modulus was the
highest. Surprisingly, for the high Tg post-coalescence latexes the elastic modulus did not
increase very much. In addition, the high Tg latex films showed higher hardness and
elastic modulus but less instant elastic recovery than the low Tg latex films. The instant
elastic recovery increased slightly with increasing levels of crosslinker.
• For pre-coalescence crosslinking, as the level of crosslinking increased the interdiffusion
of polymer chains between particles was retarded by increasing levels of crosslinker. The
same trend was observed when results were corroborated with the nano-indenter data
where it was evident that the 0% crosslinker level sample had a higher modulus value
than samples with 0.25% to 2% crosslinker levels. However, at the highest level of
crosslinking, the modulus value was at its highest value. For high Tg pre-coalescence
crosslinked latexes, the tan delta peak shifts to higher temperatures with increasing levels
of crosslinker. For the low Tg pre-coalescence crosslinked latex samples, shifting of tan
delta peak to higher temperatures occurs at the highest crosslinking level. The rubbery
77

plateau modulus values indicate that at 0.6% crosslinker, these systems are lightly
crosslinked.
• For post-coalescence crosslinking, with increasing levels of post-coalescence crosslinker,
Young’s modulus increased for both high and low Tg latexes as expected. However, a
decrease in area under the curve and strain at break was observed, clearly indicating that
the samples become more brittle. Both high and low Tg post-coalescence crosslinker
latex samples exhibited a decrease and broadening of the tan delta peak with increasing
levels of crosslinker, indicating an increase in heterogeneous network structure and
morphology. At the 5% crosslinker level for both high and low Tg samples, the rubbery
plateau modulus values indicate that these systems are lightly crosslinked.
• Samples with higher DAA/ADDH levels for post-coalescence crosslinked latexes
exhibited improved adhesion, MEK solvent resistance, hardness, and chemical resistance,
as expected. In contrast, the pre-coalescence crosslinked latexes showed generally
deleterious properties at high levels. At very high levels of 1, 3 – BGDMA, the films had
poor solvent resistance and no significant difference in film hardness; adhesion became
worse; and chemical spot resistance results averaged one grade down compared to the
post-coalescence crosslinked samples. These results indicated that the effect of higher
crosslinker levels on end-use properties was generally deleterious for pre-coalescence
crosslinking. However up to 0.6% and may be up to 1.2% level of 1,3 BGDMA, the latex
samples showed may be neutral or even favorable for overall properties. Thus, as the
crosslinker level in pre-coalescence crosslinked latexes increased, the polymer chains
within particles became increasingly resistant to interdiffusion between particles and
perhaps to coalescence, resulting in inferior film properties. In contrast post-coalescence
78

crosslinked latexes of the type studied here had sufficient interdiffusion of polymer
chains between particles to interdiffuse and interpenetrate adequately before the cross-
link density was high enough to impede the formation of films with desirable end-use
properties.
79

References:
1. a. Bufkin, B. G. and Grawe, J. R., “Survey of the applications, properties, and technology of crosslinking emulsions. Part I”, Journal of Coatings Technology-Research 1978, 50, (641), 41-55.
b. Grawe, J. R. and Bufkin, B. G., “Survey of the applications, properties, and technology of crosslinking emulsions. Part II”, Journal of Coatings Technology-Research 1978, 50, (643), 67-83.
c. Bufkin, B. G. and Grawe, J. R., “Survey of the applications, properties, and technology of crosslinking emulsions. Part III”, Journal of Coatings Technology-Research 1978, 50, (644), 83-109.
d. Grawe, J. R. and Bufkin, B. G., “Survey of the applications, properties, and technology of crosslinking emulsions. Part IV”, Journal of Coatings Technology-Research 1978, 50, (645), 70-100.
e. Bufkin, B. G. and Grawe, J. R., “Survey of the applications, properties, and technology of crosslinking emulsions. Part V”, Journal of Coatings Technology-Research 1978, 50, (647), 65-96.
2. Taylor J.W. and Winnik M.A., “Functional Latex and Thermoset Latex Films,” Journal of Coatings Technology-Research 2004, 1, (3), 163-190 and references therein.
3. a) Winnik, M.A., “Interdiffusion and crosslinking in Thermoset Latex Films,” Journal of Coatings Technology-Research 2002, 74, (925), 49-63 and references therein. b) Winnik, M.A., “Crosslinking and polymer interdiffusion in latex films,” Polym. Prep. 2003, 44(1), 100-101.
4. Winnik, M.A, “The formation and properties of latex films,” in Lovell, P.A. and El-Aasser, M. S., In Emulsion Polymerization and Emulsion Polymers, Wiley, New York, 1997, 467-518.
5. Zosel, A. and Ley, G., “Influence of crosslinking on structure, mechanical properties, and strength of latex films,” Macromolecules 1993, 26, 2222-2227.
6. Huang, Y. and Jones, F.N., “Synthesis of crosslinkable acrylic latexes by emulsion polymerization in the presence of etherified melamine-formaldehyde (MF) resins,” Prog. Org. Coat. 1996, 28, 133-141.
7. Teng, G. and Soucek, M.D., “Effect of introduction mode of hydroxyl functionality on morphology and film properties of cycloaliphatic diepoxide crosslinkable core-shell latex,” J. Polym. Sci. Part A: Polymer Chemistry 2002, 40, 4256-4265.
8. Technical information sheet, “Diacetone acrylamide, N-(1,1dimethyl-3-oxobutyl)-acrylamide,” Kyowa Hakko U.S.A. Inc., p 4.
9. Coleman, L.E.; Bork, J. F.; Wyman, D. P.; Hoke, D. I.., “Synthesis and polymerization of N-[2-(2-methyl-4-oxopentyl)]-acrylamide (diacetone acrylamide)--a new reactive vinyl monomer”, Journal of Polymer Science, Part A: General Papers 1965, 3, (4), 1601-1608.
10. Emmons, W.D., (to Rohm and Haas) “Ambient or low-temperature curable coatings,” U.S. Patent 4,210,565, 1980.
11. Geelhaar, H.J., Penzel, E., and Ley, G., (to BASF) “Binders for paints,” U.S. Patent 4,267,091, 1981.
80

81
12. Krajnik, J.M., Lam, V.H., Sabo, L. O., Camerson, J.M., Mittleman, M.L., and Wise, K.M., (to Sherwin-Williams) “Waterborne coating compositions,” U.S. Patent Application 20020103278, 2002.
13. Robinson, G.F., Shemancik, R.C., Speight, R.D., Wong, P.T., and Znidersic, K.M. (to Akzo Nobel), U.S. Patent 6,605,359, 2003.
14. Wicks, Jr. Z.W., Jones, F. N., and Pappas, S. P., Organic Coatings Science and Technology, Third Edition, Wiley-Interscience, New York 2007, 195-196.
15. Baghdachi, J., Eastern Michigan University, private communication. 16. Jones, F.N., Mao, W., Ziemer, P.D., Xiao, F., Hayes, J., and Golden M., “Artist
Paints –an overview and preliminary studies of durability”, Prog. In Organic Coatings 2005, 52, 9-20.
17. Shen, W., Sun, J., Liu, Z., Mao, W., Nordstrom, J.D., Ziemer, P. D., and Jones, F.N., “Methods for study of mechanical and Tribological properties of hard and soft coatings with a nano-indenter,” J. Coat. Tech. Research 2004, 1(2), 117-125.
18. Oliver, W.C. and Pharr, G.M., “An improved technique for determining hardness and elastic modulus using load and displacement sensing indentation”, J. Mater. Res. 1992, 7, (6), 1564-1583.
19. Tamai,T., Pinenq, P., and Winnik, M.A. “ Effect of cross-linking on polymer diffusion in poly(butyl methacrylate-co-butyl acrylate) latex films”, Macromolecules 1999, 32, 6102-6110.
20. Aradian, A., Raphael, E., and de Gennes, P.G., “A scaling theory of the competition between interdiffusion and cross-linking at polymer interfaces”, Macromolecules 2002 35, 4036-4043.
21. Ghazaly, H.M., Daniels, E.S., Dimonie, V.L., Klein, A., Sperling, L.H., and El-Aasser, M.S., “Properties of N-butyl methacrylate copolymer latex films derived from crosslinked latex particles” J. Appl. Polym. Sci. 2003, 88, 42-49.
22. Ghazaly, H.M., Daniels, E.S., Dimonie, V.L., Klein, A., and El-Aasser, M.S., “Miniemulsion copolymerization of n-butyl methacrylate with crosslinking monomers,” J. Appl. Polym. Sci. 2001, 81, 1721-1730.
23. Ghazaly, H.M., Daniels, E.S., Dimonie, V.L., El-Aasser, M.S., and Klein, A., “Synthesis and characterization of a macromonomer crosslinker,” J. Appl. Polym. Sci. 2000, 77, 1362-1368.
24. Winnik, M. A. and Feng, J., J. Coat. Tech. Research 1996, 68, (852), 39-47. 25. Kessel, N., Illsley, D.R., and Keddie, J.L., “The influence of interdiffusion and
crosslinking in the film formation of an acrylic latex”, Journal of Coatings Technology-Research 2008, 5, (3), 285-297.
26. Feng, J., Pham, H.,Macdonald, P., Winnik, M. A.,Geurts, J. M.,Zirkzee, H.,Vn Es, S., and German, A. L, J. Coat. Tech. Research 1998, 70, (881), 57-68.
27. Hill, L. W., “Dynamic Mechanical and Tensile Properties” in Koleske, J.V. Ed., Paint and Coatings Testing Manual: Fourteenth Edition of the Gardner-Sward Handbook 1995, ASTM, Ann Arbor, MI, ,534-546.

Chapter 4
Synthesis and Characterization of Nanosize Acrylic Latex and Comparison to
Their Conventional sized Counterparts
Introduction
In recent years a great deal of research has been devoted to the nano-structured materials.
Many publications have appeared dealing with metal, ceramic, semiconductor nanoparticles,1-3
and polymer related nano-structured materials.4 Nevertheless, until now there have been a few
descriptions5-8 of direct synthesis of polymer nanoparticles (especially with diameters < 30 nm),
which are speculated to be potential candidates for various application fields, such as drug
delivery carriers, microencapsulation, electric materials, catalysts, high performance polymers
and coatings.5-8
In the early 1980s Stoffer and Bone9, 10 and Atik11-13 first reported microemulsion
polymerization process. Since then researchers around the globe explored the process and sought
commercial applications of microemulsion polymerization process.14-30 As Jones points out, it is
now widely recognized that the method can be used to prepare latexes with particle diameters in
the nanoparticle region. In late 1990s, Liu et al.31, 32 published the preparation of nano-spheres by
dispersing a block copolymer [poly (2-cinnamoylethyl methacrylate)-block-polyacrylic acid] in
an appropriate solvent mixture. However, this approach involved the synthesis of a block
copolymer and a photo-crosslinking reaction. Jiang et al.33 reported preparation of stable
colloidal nanoparticles from randomly caboxylated polystyrene ionomers. In both the above
methods the resultant final solids content were fairly low. In 1997, Okubo et al.34, 35 reported
preparation of nanoparticles by “dissolution” of submicron sized ionized copolymer particles of
* 2 Patents filed, Joshi, R.G. et al., “Conventional Latex/Nanolatex Blends”, US (12578442) and PCT (60536) on Oct 13, 2009 (Eastern Michigan University)
82

styrene-methacrylic acid (MAA) in nonionic emulsifier solution; but the final polymer content
was as low as 2.2 g/L.
The above and several other research reports14-30 demonstrated that the microemulsion
polymerization showed great potential for broad application areas since it can produce nanosize
particles. However, it had two major limitations as reported in the literature – (1) the traditional
microemulsion process demanded higher surfactant to produce lower particle diameters and (2)
resultant polymers were produced at very low solids content. The above two limitations of
traditional microemulsion process restricted its proposed viable and commercial uses to some
extent in coatings, drug delivery, microencapsulation, and many other applications where lower
surfactant loading and higher polymer content is desired.
In the last decade, many research attempts were focused on addressing the classically
known limitations of traditional microemulsion polymerization process. Gan et al.36, 37 reported
polymerization of styrene and methyl methacrylate using cationic surfactants and relatively high
weight ratios of polymer to surfactant (approximately 8/1 polymer/surfactant) and produced
latexes with particle diameters between 30-100 nm. Recently, He et al.8 studied the preparation
polystyrene (PS) nano particles using particular seeded polymerization method utilizing anionic
surfactants. The resulting polymethamethacrylate/polystyrene (PMMA/PS) nanoparticles had an
average particle diameter <20 nm using lower amount of surfactant. In another recent report,
Kaiyi and Zhaoqun7 demonstrated a novel method of producing monodisperse polystyrene (PS)
nanoparticles having average particle diameters <20 nm using very low amount of surfactant.
Several other research attempts are covered in great detail in previous literature.17, 19-29
83

Notably, in late 1990s Ming et al. 27, 38, 39 reported laboratory scale modified
microemulsion polymerization producing high solids content nanosize polymer latexes. Ming
and his group modified the traditional microemulsion process to produce nano particles with
diameters of 10-30 nm and final polymer content ranging from 10-30 wt%. In this process the
polymer/surfactant ratio was kept from 7:1 to 12:1. The ratio in the process was significantly
higher than the traditional microemulsion process that typically uses 1:1 polymer/surfactant or
even lower as reported in many previous methods.14, 30 Briefly, in the modified microemulsion
polymerization, the original microemulsion was composed of the entire amount of surfactant, a
co-surfactant (if required), a very small portion of monomer or monomer mixture, and all water.
The rest of the monomer or monomer mixture was added dropwise into the polymerizing
microemulsion. The researchers used anionic, cationic, non-ionic surfactants and their mixtures
to produce high solids content nanosize latexes. The researchers also studied the particle size
changes during the polymerization, the polymerization mechanism, and some specific end-use
properties. As reported,14, 30 this method can also be used to make nanosize latexes that are
crosslinked within the particles and/or bear reactive groups that can crosslink later. Promising
results from Ming’s modified technique14, 30 opened up a wealth of opportunities for future
research, particularly exploration for potential applications in the area of polymers and coatings
forming basis for this research.
In the present research, Ming’s modified microemulsion14, 30 process was further
improved to enable the use of a variety of monomers including functional or crosslinkable
monomers. The improved modified microemulsion process was developed to produce acrylic
nanoparticle latexes having average particle diameters of 15-30 nm referred to as nanoparticle
latexes. For pre-coalescence crosslinking: 0-4 wt% of 1, 3 butylene glycol dimethacrylate (1, 3-
84

BGDMA), and for post-coalescence crosslinking: 0-5 wt% of diacetone acrylamide (DAA) as
reactive monomer and adipic dihydrazide (ADH) as crosslinker were used. Both the pre-
coalescence and post-coalescence nano-size polymeric latex series were prepared using a target
glass transition temperature (Tg) of about 7 to 9 oC. The nanoparticle latexes were compared with
respective conventional latexes (of similar compositions) with average particle diameters of 120-
140 nm made using seeded semi-continuous emulsion polymerization process (described in
Chapter 3). The films cast from these latexes were characterized using a variety of end-use tests
and advanced instruments such as a Dynamic Mechanical Analyzer (DMA), Modulated
Differential Scanning Calorimeter (MDSC), and an Atomic Force Microscope (AFM).
Information from such instruments should greatly enhance our understanding of the relationship
between the physical and morphological properties of coatings. The main goals of the research
described in this chapter are (a) an improved method of making nanoparticle latexes using a
variety of monomers including functional monomers and (b) an understanding of the
relationships between particle size and distribution and the resultant fundamental and end-use
film properties and film morphology.
85

Experimental Details
Preparation of nanoparticle latexes using improved modified microemulsion
copolymerization: 40-43
Nanosize latexes were synthesized with varying levels of pre-coalescence (internal) and
post-coalescence (external) crosslinkable sites. The latexes were prepared with the target glass
transition temperature (Tg) of 5 oC. Composition and characteristics of these latexes are shown in
Tables 3.1 and 3.2 respectively. Further, the nanosize latexes are coded n for nanosize, I for pre-
coalescence or internal, E for post-coalescence or external, L for low Tg, and a number for the
weight % of the crosslinker or reactive site in the monomer line up. Thus, for example, nIL-2
means pre-coalescence crosslinked latex with 2 wt. % of 1, 3-BGDMA, and nEL-5 means post-
coalescence crosslinked latex with 5 wt. % of DAA.
Materials
Materials with sources of supply to be utilized in this study are listed below:
Deionized (DI) Water, n-Butyl Methacrylate (99+%), 10-55 ppm MEHQ (nBMA)
(Aldrich), Methacrylic Acid (99%), 250 ppm MEHQ (MAA) (Aldrich),n-Butyl Acrylate (99%),
10-55 ppm MEHQ (nBA) (Aldrich), Sodium dodecyl Sulfate (SDS) [95.5%], Ammonium
Persulfate (Certified A.C.S) (Fisher Scientific), N,N,N’,N’- tetramethylethylenediamine
(TMEDA), 1-pentanol (Aldrich), 2-Amino-2-methyl-1-propanol (“AMP-95,” Angus Chemical
Company), Ammonium Hydroxide (NH4OH, 29.2%) (Fisher Scientific), 1, 3-Butylene glycol
dimethacrylate, 200 ppm MEHQ (1, 3-BGDMA) (Aldrich), Diacetone acrylamide, 99 %, (DAA)
(Aldrich), Adipic dihydrazide, 98 % (ADDH) (Aldrich).
86

(a) Representative procedure for synthesis of nL0 (nanoparticle size latexes with no functional
group):
A nanolatex, comprising a 21/77/2 ratio of nBA/nBMA/MAA monomers, having a Tg =
5-10 °C, was prepared under a nitrogen atmosphere in a 250 mL, 3-neck flask (Ace Glass,
Vineland, N. J.) equipped with a reflux condenser, a thermometer, an addition funnel, and a
nitrogen gas inlet and outlet. The flask was heated and stirred with a stirring hotplate (Fisher
Scientific, Waltham MA) using a 25mm x 8mm magnetic stirrer. Using the above setup, the
nanolatex was prepared in the following steps:
STEP 1: A microemulsion formulation was formed by mixing 0.3 g of a 21/77/2 (wt/wt/wt)
mixture of nBA/nBMA/MAA monomers, 1 g of SDS (monomer to surfactant ratio 10.5:1), 0.1 g
of 1-pentanol (Sigma-Aldrich, St. Louis, MO), 78.7 g of DI water and 10-14 drops of aqueous
ammonia (30% in water, Sigma-Aldrich, St. Louis, MO). After addition of the ammonia
solution, the formulation had a pH of 9-10.
STEP 2: The microemulsion was heated at 40 °C with stirring and purged by bubbling nitrogen
through the formulation for 5 minutes.
STEP 3: A solution of 0.0464 g of N,N,N’,N’- tetramethylethylenediamine (TMEDA) (Sigma-
Aldrich, St. Louis, MO) in 5 g of D.I. water (4mM) was added to the microemulsion via addition
funnel, followed by a solution of 0.0912 g of ammonium persulfate in 5 g of water (4mM),
which initiated the polymerization.
STEP 4: An additional 9.7 g 21/77/2 (wt/wt/wt) mixture of nBA/nBMA/MAA monomers was
added dropwise via addition funnel (~ 6 drops/min.) into the microemulsion formulation over the
course of 90-120 mins. During addition, the temperature of the formulation was maintained at
87

88
40 +/- 1 °C, a slow flow of nitrogen was maintained, and the reaction mixture was stirred at a
rate of approximately 600 revolutions per minute.
STEP 5: After addition was complete, stirring was continued for another 2-3 hours at 40 °C to
essentially complete the conversion of the monomer mixture. A 50/50 wt/wt solution of 2-
amino-2-methyl-1-propanol (in DI water (about 3 mL) was added with continued stirring. The
resulting latex had the characteristics shown in Table 4.3.
(b) Representative procedure for synthesis of nEL or nIL (nanoparticle size latexes with
functional groups):
The pre-coalescence and the post-coalescence nano crosslinkable latexes, described in the
Table 4.1, were made by essentially identical procedures as described above. In case of making
pre-coalescence crosslinked nano latexes, the functional monomers were included in the
monomer mixture recipe. In case of the post-coalescence nano crosslinkable latexes (a)
crosslinkable monomer was added at the end of the monomer addition and (b) aqueous ammonia
was used to adjust the pH of the product instead of 2-amino-2-methyl-1-propanol to reduce the
potential for interference with the crosslinking reaction. The resulting latexes had the
characteristics shown in Table 4.2.

Table 4.1: Composition table for nanosize latexes (with or without functional group)
Nano Latex
Original Microemulsion in Step 1 (in g.) Monomer Mixture added in Step 2 (in g.)
Monomer Composition Monomer/ Surfactant ratio
Monomer SDS 1-pentanol Water (pH= 9-10)
nL0 0.3 (monomer mixture –
M1)
1.0 0.1 78.7 9.7 (monomer mixture – M2) + 0.1 g. 1-pentanol
nBA/nBMA//MAA=21/77/2 10.5
nEL2 0.3 (M1) 1.0 0.1 77.7 (a) 8.7 g. (M2) + 0.1 g. 1-pentanol
(b) 0.8 g. (monomer mixture- M3) + 0.2 g. DAA
nBA/nBMA/DAA/MAA=21/75/2/2
10.5
nEL5 0.3 (M1) 1.0 0.1 77.7 (a) 7.7 g. (M2) + 0.1 g. 1-pentanol
(b) 1.5 g. (M3) + 0.5 g. DAA
nBA/nBMA/DAA/MAA=21/72/5/2
10.5
nIL2 0.3 (M1) 1.0 0.1 77.7 (a) 9.7 g. (M2) + 0.1 g. 1-pentanol
nBA/nBMA/1,3-BGDMA/MAA=21/75/2/2
10.5
nIL4 0.3 (M1) 1.0 0.1 78.7 (a) 9.7 g. (M2) + 0.1 g. 1-pentanol
nBA/nBMA/1,3-BGDMA/MAA=21/73/4/2
10.5
89

Preparation of conventional pre-coalescence or post-coalescence crosslinked conventional
latexes44, 45 (described in Chapter 3):
The conventional latex samples employed here have been described previously.31 In
brief, latexes were synthesized with varying levels of pre-coalescence crosslinker (internal) and
post-coalescence (external) crosslinkable sites. For comparisons, the conventional latexes were
prepared with a target glass transition temperature (Tg) of about 7oC. Compositions and
characteristics of these latexes are shown in Table 4.3. The latexes are coded I for pre-
coalescence or internal, E for post-coalescence or external, L for low Tg, and a number for the
weight % of crosslinker or reactive site in the monomer line up. Thus, for example, IL-4 means
an internally (or pre-coalescence) crosslinked, low Tg latex with 4.0 wt. % of 1, 3-BGDMA and
EL-5 means an externally (or post-coalescence) crosslinked, low Tg latex with 5.0 wt. % of
DAA. It also should be noted that in terms of composition, both nanoparticle latexes and
selected conventional latexes were similar for the purpose of the study as described earlier.
Characterization of Latexes
Latex Properties
(a) Conventional Latexes (with or without functional groups): 44, 45
The weight percentage of non-volatile solids content (% NVM) was measured using
ASTM D 4758-87. Viscosity was measured by ASTM D 4287 at 20 °C using a Brookfield
Viscometer, Model DV-1, using Spindle #4 at 20 rpm. pH was measured with a Fischer Acumet
Model 620 pH meter and with pH paper.
For particle size (diameter) and particle size distribution measurements, each latex was
diluted to a transmission factor of 0.5-1.0 (about 0.05-0.1 wt% solids) and measured at 25 °C
using the light-scattering instrument, MICROTAC Series 9200. Three tests were performed
90

within 180 sec. to obtain an average value of a volume distribution. The results are shown in
Table 4.3.
For gel content measurements, an empty extraction thimble was dried at 85°C in an oven
for 2 h, cooled in a desiccator overnight, and weighed. Latex films (prepared on glass and
detached) were dried in a desiccator overnight, cut into small pieces, weighed, and put into the
thimble. After a 12-h extraction with acetone in a Soxhlet extractor, the thimble was dried in an
oven at 85°C for 2 h, cooled in a desiccator overnight, and weighed. The gel content was
calculated from the initial and final weights, assuming that gelled material remained in the
thimble. The results are shown in Figure 4.3(a, b) and Table 4.3.
(b) Nanoparticle latexes (with or without functional groups):
The weight percentage of non-volatile solids content (% NVM) was measured using
ASTM D 4758-87. Viscosity was measured by ASTM D 4287 at 25 °C using a using a
Brookfield Viscometer, model CAP 2000+, using Spindle #1 at 113 rpm. pH was measured with
a Fischer Acumet Model 620 pH meter and with pH paper.
Particle size (diameter) and particle size distribution of nanosize latexes were determined
using dynamic light scattering method with a 90 PLUS Particle Analyzer (Brookhaven
Instruments Co.) at room temperature, before which the nanosize latex samples were diluted to a
solid content of about 0.1 wt.%. A 10 MM potassium nitrate (KNO3) solution was used as
diluent. The latex samples were filtered using Whatman Puradisc 25 AS filters with 200nm pore
size before running for particle size analysis. For each sample at least 3 runs (each run of 10 min.
duration) for a total of 30 min. were done. The average effective diameters and polydispersity
from the intensity distribution were obtained directly from the measurement results and reported.
91

The results are shown in Table 4.2 and the particle size distribution graphs are shown in 3.1 (a-
e).
For gel content measurements of nanosize latexes, the same procedure was followed as
described earlier for gel content measurements of conventional latex. The results are shown in
Figure 4.3(a, b) and Table 4.2.
Film Properties of conventional latexes and nanoparticle latexes:
The minimum film formation temperature (MFFT), crack point and knife point, was
determined using a Rhopoint MFFT Bar - 90, Rhopoint Instruments. Briefly, the instrument was
equilibrated over a specific temperature range (determined based on the glass transition
temperature of latex sample) for about 20 minutes. Five replicates are laid down in quick
succession using a 75- micron (3 mils) one-inch cube applicator. The tracks were laid down left
to right. A clearly defined limit of coalescence will show in about 90-120 minutes, and the
MFFT temperature can then be read using the cursor scale. The crack point, the temperature
onset of formation that is crack-free, was determined using a fingernail. The knife point, the
temperature onset of film integrity, where the film no longer cracks upon disturbing or peeling
the film was determined using a plastic or metallic spatula by carefully peeling away the film,
starting from the crack point.
Specimens were prepared on aluminum panels by drawing the latexes down using a
square wet film applicator (Paul N. Gardner Co., Inc.) with 0.25 mm (wet) clearance on
aluminum panels. The panels were dried in an oven at 70 °C and 50% humidity for 24 hours and
then stored at normal room conditions for a week before testing. No coalescing solvents were
used. Dry film thicknesses were approximately 50 μm. Before casting these films, a
stoichiometric amount of adipic dihydrazide (ADDH) was added to the E-series latexes.
92

Dry film thickness was measured at 25°C by Elcometer-345-Digital Coating thickness
Gauge (Elcometer Instruments Ltd.).
Solvent resistance was determined by methyl ethyl ketone (MEK) rubbing. Load was
applied by a ball peen hammer with a 448 g head wrapped with cheesecloth soaked with MEK.
The reported end point was the number of double rubs required to break through the film,
exposing bare metal.
Chemical resistance tests were conducted at 25 °C following ASTM D 1308. A 1-mL
sample of each test reagent (water, dilute sulfuric acid at pH 3) was pipeted (a 5-mL pipet
graduated in 0.1 mL) onto the horizontal panel and immediately covered with a watch glass.
After an interval, the spot was wiped clean and the film was examined immediately for defects.
Intervals used were 15 min, 1 h, and 16 h.
Pencil hardness was tested at 25 °C following the procedure of ASTM 3363.
Tape adhesion was measured by ASTM D 3359. The films were cut with a cross-cut kit
(Precision Gage & Tool Company) before testing.
Block Resistance was measured by ASTM D 4946. Briefly, latex films were cast on a
sealed test chart and the films were dried in an oven at 70 °C and 50% humidity for 8-10 hours
and then stored at normal room conditions for a week before testing. After conditioning, six 3.8
X 3.8 cm. sections from the films were exactly cut as mentioned in the ASTM method. 3 sets of
2 film squares facing each other were placed in oven, exactly as described in the ASTM method,
at 50 °C for 30 minutes. The specimens were cooled at room temperature for about 30 min. and
blocking was measured. An average of three reading with standard deviation is reported.
Specular Gloss at 20° and 60° was measured using ASTM D 523 test method. Latex
films were applied to glass panels, conditioned in an oven at 70 °C and 50% humidity for 8-10
93

hours and then stored at normal room conditions for a week before testing. Gloss was measured
using BYK Gardner, BYK micro-TRI-gloss meter.
Thermal and Mechanical Properties of conventional latexes and nanoparticle latexes:
For glass transition temperature (Tg) measurement specimens were prepared as follows:
(a) nanoparticle latexes were prepared using a rectangular Teflon block about 50mm long, 10
mm wide and 3 mm deep (or thick), and (b) conventional latexes were prepared on glass panels
by drawing the latexes down using a square wet film applicator (Paul N. Gardner Co., Inc) with
0.30 mm (wet) clearance on glass panels. The glass panels and Teflon blocks were dried in an
oven at 70 °C and 50% humidity for 8-10 hours and then stored at normal room conditions for a
week before testing. The Tg of the dried films were determined by TA instrument - TA 2920
MDSC with RCS (Refrigerant Cooling System) accessory under nitrogen purge at flow rate of
50 mL/min. For testing, the samples were kept in closed Aluminum non-hermetic pans.
Temperature scans were done from -90 °C to 100 °C at 2 °C/min with modulation of +/- 1.00 °C
at every 60 seconds under nitrogen. The MDSC equilibrated at -90 °C for 5 min.
Dynamic Mechanical analyses were conducted using TA Instruments Model Q800
Dynamic Mechanical Analyzer (DMA) with the LNCS accessory. Specimens for stress-strain
and dynamic mechanical studies were prepared on glass panels and Teflon blocks accordingly as
described in MDSC studies section. A film cutter (supplied by TA instruments) was used to cut,
at constant depth, rectangular specimens about 15-20 mm long, 3-6 mm wide and 0.1-0.2 mm
thick from the cured films.
The stress-strain studies were done at the room temperature (~25 °C) in air on the Q800
DMA with the thin film tension clamp in a controlled force mode with a ramped force of 3N/min
up to 18N/min and the resultant % strain was observed. DMA measurements of dried specimen
94

95
were done at 1 Hz with a thin film tension clamp over the temperature range of -100°C to 120°C,
using liquid nitrogen as a coolant. The flow rate of liquid nitrogen into the DMA depends upon
the starting temperature desired and is controlled by the ramp rate or heating rate of 3 °C/min.
Measurements with AFM of conventional latexes and nanoparticle latexes:
A Digital Instruments Multimode SPM with a Nanoscope IIIa controller and an E-
scanner (X-Y scanning limit of 15 μm and a Z limit of 2 μm), operated in the tapping mode, was
used to observe surface morphologies of selected specimens. The latex samples were conditioned
in an oven at 70 °C and 50% humidity for 8-10 hours and then stored at normal room conditions
for a week before imaging. Both height and phase data were captured at image size of 1 × 1 μm
(for conventional and nanoparticle latexes). For every sample, two sets of images were captured.

Table 4.2: Characteristics of nanosize (with or without crosslinker) latexes Nanoparticle
latex Composition % Non-
VolatilesAvg.
Particle Size, nm
Polydispersity Glass Transition
Temperature (ºC) using
MDSC
Glass Transition
Temperature (ºC) using
Fox Equation
pH Gel Content
Viscosity η
(mPa•s)
nL0 nBA/nBMA//MAA=21/77/2 10.8 23.2 0.09 4.77 5.06 9.3 0.0 13 nEL2 nBA/nBMA/DAA/MAA=21/75/2/2 10.7 23 0.087 3.13 --- 9.7 98.1 13 nEL5 nBA/nBMA/DAA/MAA=21/72/5/2 10.6 21.7 0.12 5.15 --- 9.5 99.9 17 nIL2 nBA/nBMA/1,3-
BGDMA/MAA=21/75/2/2 10.9 23.2 0.089 4.67 --- 9.1 63.8 13
nIL4 nBA/nBMA/1,3-BGDMA/MAA=21/73/4/2
10.9 22.2 0.1 10.9 --- 9.8 97.4 15
Table 4.3: Characteristics of conventional (with or without crosslinker) latexes Conventional
Latex Composition % Non-
Volatiles Avg.
Particle Size, nm
Glass Transition Temp. (ºC) by MDSC
Glass Transition Temperature
(ºC) using Fox Equation
pH Gel Content
Viscosity η (mPa•s)
IL-0 nBA/nBMA/MAA=21/77/2 47.1 130 6 5.06 9.3 0.00 100
IL-2 nBA/nBMA/1,3-BGDMA/MAA=21/75/2/2
44.6 118 5 --- 9.0 57.1 80
IL-4 nBA/nBMA/1,3-BGDMA/MAA=21/73/4/2
46.8 123 13 --- 9.2 64.2 70
EL-2 nBA/nBMA/DAA/MAA=21/75/2/2
46.6 133 7 --- 9.8 98.1 560
EL-5 nBA/nBMA/DAA/MAA=21/72/5/2
46.3 137 5 --- 9.7 100.0 1320
96

Figure 4.1. Particle Size Analysis Graphs of nanoparticle latexes (Brookhaven Instruments 90
Plus Particle Size Software Output):
(a) Nanoparticle latex with no crosslinker, nL0:
97

(b) Nanoparticle latex with 2% post-coalescence crosslinker, nEL2:
98

(c) Nanoparticle latex with 5% post-coalescence crosslinker, nEL5:
99

(d) Nanoparticle latex with 2% pre-coalescence crosslinker, nIL2:
100

(e) Nanoparticle latex with 4% pre-coalescence crosslinker, nIL4:
101

Results and discussion
Nanosize latex synthesis and characterization
Both pre-coalescence and post-coalescence crosslinked nanosize latexes were
synthesized by an improved modified microemulsion process with varying levels of crosslinking
monomers. Composition and characteristics of these latexes are shown in Tables 4.2 and 3.3. In
general, Ming et al.’s 40-43 modified microemulsion process was used as a starting point of the
present work to make nanosize latexes.40-43 The process was further improved to make it more
useful for partially water soluble monomers such as n-BMA and n-BA. The key parameters
varied/changed for the present research are as follows:
(a) At least one of the monomers in base micro emulsion must be partially or fully water
soluble. In this study, methacrylic acid was in the base (or seed) microemulsion,
(b) If an acidic monomer (methacrylic acid) is used in the seed microemulsion, it is important to
maintain the pH of the seed microemulsion of 8-9 before addition of the initiator/activator
(APS/TMEDA) to fully utilize the efficiency.46 In the present research, pH of water in seed
microemulsion was maintained slightly alkaline (9-10 at 250C)46 using 8-10 drops of diluted
liquid ammonium hydroxide (50% in DI water),
(c) Equal partitioning of co-surfactant (1-pentanol), the first part of the co-surfactant was added
with monomer mixture in seed microemulsion and the second part was added with monomer
mixture added dropwise in step 2. Partitioning of cosurfactant depends on the total monomer(s)
present in the seed microemulsion, and it often holds the key to producing stable nanoparticle
latexes
(d) Amount of monomer(s) present in the seed microemulsion
(e) Monomer(s) addition time, monomer droplet size, addition rate, and mixing rate, and
102

(f) Amount of initiator/activator
By properly controlling the above variables, stable pre-coalescence or post-coalescence
crosslinked nanoparticle size latexes (diameters about 15-30 nm) were produced.
As shown in Table 4.2 and Figure 4.1 (a-e), addition of monomers with functional groups
up to 2 wt% has minimal effect on particle size and polydispersity of the latexes. Even with 4
wt% of 1, 3-BGDMA and with 5 wt% of DAA, the polydispersity shows a very slight increase.
The robustness of the modified microemulsion process was demonstrated with functional
monomers since the polydispersity remained very low. Similarly, a negligible effect on the
viscosity and glass transition temperature is observed up to 2 wt% additions of functional groups.
With DAA a slight increase in viscosity and Tg is observed up to 5 wt%. Addition up to 4 wt% of
1, 3-BGDMA in pre-coalescence nanosize latex series showed substantial increases in Tg as well
as viscosity.
Film formation by “pre-coalescence” and “post-coalescence” crosslinked latexes
Theoretical considerations of film formation by pre-coalescence and post-coalescence
crosslinked latexes have been essentially previously published44, 45 and covered in Chapter 3 but
are briefly included here for completeness.
(a) Film formation by “pre-coalescence” crosslinked latexes:
Films were cast from the internally (pre-coalescence) crosslinked latexes by conventional
means. No coalescing solvent was used; film formation was accelerated by warming the films at
70°C overnight. Film thicknesses were about 50 μm. Theoretical considerations of film
formation by pre-coalescence crosslinked latexes have been studied extensively by Zosel and
Ley,47 Tamai et al.,48 Aradian et al.,49 and Ghazaly et al.50-52 Recently we published44, 45 a
103

systematic comparison of pre-coalescence crosslinked latexes with varying levels of crosslinking
monomers. We demonstrated that with low levels (up to 2 wt%) of internal crosslinking, latex
films are able to coalesce to form good films. At higher levels (above 2 wt%) of 1,-BGDMA
often the interdiffusion of polymeric particles is impeded by crosslinking, hence, resulting in
inferior film properties.
(b) Film formation by “post-coalescence” crosslinked latexes:
The DAA-containing latexes are combined with a stoichiometric amount of adipic
dihydrazide (ADDH) crosslinker. Then the films were cast under the same conditions as for
internally or pre-coalescence crosslinked latexes. Before the film is cast, premature reaction of
ADDH with the reactive sites in the latex is minimal. The crosslinking reaction for the DAA
monomer is shown in Figure 4.2. The ADDH is water soluble, and almost all of it remains
separated from the reactive sites in the serum where it is. The relatively high (9–9.5) pH also
suppresses the reaction. When the film is cast, however, the water evaporates, forcing ADDH to
come in contact with the latex polymer surfaces when close packing of the latex particles has
occurred; ammonia evaporates, lowering the pH to about 6.5; and then crosslinking accelerates.53
104

Figure 4.2: crosslinking reaction for DAA monomer
After the film is cast, the crosslinking reaction is known to proceed at a useful rate at
room temperature. In this study we baked the films overnight at 70°C to assure a high level of
conversion before testing and to avoid the use of coalescing solvents. Among the factors that will
influence final properties of the films are the composition of the latexes and the relative rates of
• mixing of the crosslinker with the polymer,
• interdiffusion of the polymer molecules that originated in different latex particles,
• the chemical crosslinking reactions and diffusion of ADDH into the polymer,54 and
• T g of latex at a specific composition.
As demonstrated earlier,44, 45 to reach a high level of conversion the bake temperature
should be well above the Tg of the specific latex composition. In this study, this is true for the
low Tg latex (both pre-coalescence and post-coalescence crosslinked latexes). However, it may
be borderline for high Tg latex (both pre-coalescence and post-coalescence crosslinked latexes).
This was discussed in detail elsewhere.44, 45
105

If the rate of the crosslinking reaction is too fast relative to mixing and interdiffusion,
coalescence and interdiffusion will be slowed and perhaps retarded prematurely. The likely result
will be excessively non-uniform films and less than optimal film properties. Some research
reports44, 45, 53-57 suggest that the DAA/ADDH crosslinking combination has satisfactory relative
rates and that good film properties can be attained.
Gel Content Results
Acetone extraction was employed to determine the gel content of the films from nanosize
latexes as shown in Figure 4.3 (a, b). For comparison, gel content graphs of selected
conventional latexes are also shown in the figure. In case of post-coalescence crosslinked films,
not surprisingly, gel content was close to 100% for films containing DAA reactive sites. The
results are in agreement with conventional size post-coalescence crosslinkable latexes. In case of
pre-coalescence crosslinked nanosize latexes, the gel content values are much higher than their
conventionally size counterparts. At 2 wt% gel content of nIL2 is 63.8, whereas IL-2 is 57.1. At
4 wt% level gel content of nIL-4 approaches 97.4%, whereas IL-4 is 64.2%. It’s evident from the
graph that in the case of conventional sized pre-coalescence crosslinked latexes at higher
crosslinking levels, low values of gel fraction may reflect incomplete knitting of the particles
during film formation, allowing small pieces to break loose and pass through filter. That is not
the case with their nanosize counterparts. This could be due to the large surface area of nanosize
latex particles facilitating uniform distribution of functional groups across the polymer network.
106

Comparison of pre-coalescence crosslinked nanosize vs. conventionally size latexes
0
20
40
60
80
100
0 1 2 3 4 5
1,3 BGDMA (%)
Gel
con
tent
(%)
n- IL seriesIL series
Comparison of post-coalescence crosslinked nanosize vs. conventionally size latexes
0
20
40
60
80
100
120
0 1 2 3 4DAA (%)
Gel
con
tent
(%)
5
n- EL seriesEL series
Figure 4.3 (a, b): Comparison of gel content of (a) pre-coalescence crosslinked nanosize vs.
conventional latexes and (b) post-coalescence crosslinked nanosize vs. conventional latexes
End-use film properties
All the latexes were cast on aluminum panels and kept at 70 °C and 50% humidity for 8-
10 hours and then stored at normal room conditions for a week before testing. The end-use
properties are listed in Tables 3.4 and 3.5. Table 4.5 shows end-use properties of constituent
nanosize latexes with pre-coalescence or post-coalescence crosslinking. These properties are
compared with conventional size latexes as listed in Table 4.4.
In post-coalescence crosslinked nanolatexes as the level of crosslinking increase, solvent
rub resistance significantly increases as expected. At 5 wt. % crosslinker all the properties, such
as pencil hardness: B, solvent rub resistance: 100, block resistance: 4, 20 ° gloss: 52.2, and 60 °
gloss value: 86.4, are the highest. When nEL5 is compared to EL5 superior gloss, adhesion,
hardness, and solvent rub resistance are observed in nEL5. This could be due to the large surface
area of nanosize latexes providing uniform crosslinking of DAA across latex polymer chains.
The poor resistance to water after 1 hour and 16 hours is likely due to the large amount of
surfactant present on the surface of nEL5. For pre-coalescence latexes, most of the properties
107

remained largely unchanged except for a slight increase in solvent rub resistance at increasing
levels of crosslinker. In general, post-coalescence crosslinked latex series have superior gloss
and solvent resistance when compared to pre-coalescence latex counterparts. This is in harmony
with our previous observations (described in Chapter 3) that in case of pre-coalescence
crosslinked latexes, interdiffusion of polymer chains is impeded by crosslinking, showing
deleterious effects on end-use properties.44, 45
In general, comparisons of properties of nanosize latexes to their conventionally sized
counterparts show improvement in gloss, adhesion, and solvent resistance. For all nanosize
latexes, tape adhesion to aluminum increases from 4B (good) to 5B (excellent, the highest rating
in this test). Solvent rub resistance greatly increases. Block resistance of conventional size
latexes when compared with their nanosize counterparts is either comparable or slightly higher.
In case of nanosize latexes, resistance to water is inferior compared to their conventional size
counterparts. This may be due to the amount of surfactant present on the surface of nanosize
latexes. Resistance to dilute sulfuric acid largely remained unchanged or slightly improved at 16
hours in case of nanosize latexes.
AFM Results
AFM tapping mode phase and height images of representative samples of latexes dried in
an oven at 70°C and 50% relative humidity (RH) for 8-10 hours are show in Figures 4.4, 4.5, and
4.6. Figures 4.4 (a, b, and c) and 4.5 (a, b, and c) show tapping mode phase and height images of
nL0, nIL4, and nEL5 at image size of 1um x 1um. Both the phase and height images of nL0
represent homogeneous structure when compared to those of nIL4 and nEL5. The effect of type
of crosslinking and rate of crosslinking can be clearly seen when phase images of nIL4 and nEL5
108

109
are compared. The nEL5 images appear smooth and homogeneous compared to nIL4. Also, it is
evident from the nIL4 phase image that the nanosize particles have retained their identity even
after the films were force dried at 70°C, 50% RH. These observations suggest that rate of
crosslinking reaction in nIL4 was fast enough to significantly retard homogenization of the film,
at least near the surface. This is in harmony with our previous studies of conventional pre-
coalescence or post-coalescence crosslinked latexes described in detail in Chapter 3.44, 45
Figures 4.5 and 4.6 show comparison of tapping mode height images of nanoparticle
latexes (at image size 1um x 1um) and conventional size constituents (at image size 1um x
1um). Figure 4.6 (a) shows peaks and valleys with lateral dimensions that are of a higher order
of magnitude for neat L0 than nL0 in Figure 4.5(a). This indicates that with nanosize latexes, the
surface becomes smooth and homogeneous. Significant effects on surface homogeneity are
observed in case of functional latexes when comparing EL-5 (conventional) vs. nEL-5 (nano) or
IL-4 (conventional) vs. nIL-4 (nano) where the nanoparticle latexes showed smooth and
homogeneous surfaces in comparison to conventional counterparts. It is clear from these images
that indeed nanosize particles, whether crosslinked or not, in general produces smooth films.
Table 4.6 shows average surface roughness values, Ra (in nm), measured using AFM
and the surface smoothness values calculated from the roughness values. Further, the surface
smoothness values are compared with the 200 or 600 gloss values. When comparing all the
values for conventional vs. nanoparticle latexes, it is clear that indeed nanoparticle latexes in
general showed smooth and homogeneous surface with higher gloss. Further, in case of post-
coalescence crosslinked nanosize latex, nEL5, produces very smooth and homogeneous films, at
least near to the surface. This is consistent with very high gloss values of nEL5 as shown in
Table 4.6.

110
Table 4.4: End use properties of films cast from conventional latexes Latex Tape
adhesion Pencil
hardness MEK
double rub resistance
Block Resistance
H2SO4 spot test, pH=3.1 (open)
Distilled water spot test
(open)
Gloss
15 min.
1 hour
16 hours
15 min.
1 hour
16 hours
20o 60o
L0 4B 4B 5 3 ± 1 E E F E E G 18 ± 2.1 38.9 ± 5.1 EL-2 4B 2B 42 E E F E E G 21± 0.3 38.2 ± 1.1 EL-5 4B 2B 83 9 ± 1 E E G E E E 19 ± 1.6 36.7 ± 3.8 IL-2 5B 4B 6 E G F E E F 12.2 ± 2.8 34.3 ± 1.2 IL-4 3B 4B 6 4 ± 1 E G F E E F 11.6 ± 1.6 32.4 ± 2.9
Table 4.5: End use properties of films cast from nanosize latexes Latex Tape adhesion Pencil
hardness MEK
double rub resistance
Block Resistance
H2SO4 spot test, pH=3.1 (open)
Distilled water spot test
(open)
Gloss
15 min.
1 hour
16 hours
15 min.
1 hour
16 hours
20o 60o
nL0 5B 4B 15 3 ± 1 E G E F F F 49 ± 7.9 79.4 ± 5.6 nIL2 5B 4B 17 1 G F P G E P 40 ± 4.1 85.8 ± 0.8 nEL2 5B 4B 75 1 E G G E F F 50.9 ± 3.6 77.9 ± 1 nIL4 5B 4B 20 2 ± 1 G G G F F P 39 ± 3.9 87.6 ± 2.6 nEL5 5B B 100 4 ± 1 E E E G F F 52.2 ± 6.7 86.4 ± 2.6
Table 4.6: Comparison of surface smoothness and gloss values of nanoparticle latexes and their conventional counter parts Latex Sample AFM surface roughness: Ra (measured) (nm) Surface smoothness:1/Ra (calculated)(nm) 20 Gloss 60 Gloss
L0 (conventional)
1.2 0.83 18 ± 2.1 38.9 ± 5.1
IL-4 (conventional)
1.11 0.90 11.6 ± 1.6 32.4 ± 2.9
EL-5 (conventional)
1.14 0.87 19 ± 1.6 36.7 ± 3.8
nL0 (nano) 0.476 2.1 49 ± 7.9 79.4 ± 5.6 nIL4 (nano) 0.624 1.6 39 ± 3.9 87.6 ± 2.6 nEL5 (nano) 0.326 3.07 52.2 ± 6.7 86.4 ± 2.6

111
nL0 nIL4 nEL5 Figure 4.4(a, b, and c): AFM tapping mode phase images of (a) nL0, (b) nIL4, and (c) nEL5 at image size of 1um X 1um
nL0 nIL4 nEL5 Figure 4.5(a, b, and c): AFM tapping mode height images of (a) nL0, (b) nIL4, and (c) nEL5 at image size of 1um X 1um

112
L0 IL-4 EL-5 Figure 4.6(a, b, and c): AFM tapping mode height images of (a) L0, (b) nIL4, and (c) nEL5 at image size of 2um X 2um
Comparisons of surface smoothness and surface gloss values of conventional vs. nanoparticle latex
0102030405060708090
100
L0 (c
onve
ntion
al)nL
0 (na
no)
IL-4 (c
onve
ntion
al)nIL
4 (na
no)EL-5
(con
venti
onal)
nEL5 (
nano
)
Latex Sample
Surfa
ce G
loss
@ 6
0 de
g
0
0.5
1
1.5
2
2.5
3
3.5
4
Avg
. sur
face
sm
ooth
ness
va
lue
(1/n
m.)
Surface Gloss @ 60 deg. Avg. surface smoothness (1/ nm.)
Figure 4.7: Comparison of surface smoothness and gloss values of nanoparticle latexes and their conventional counter parts

Fundamental Mechanical Properties (a) Stress-Strain Curves
Average stress-strain curves of nanolatex pre-coalescence and post-coalescence series are
shown in Figures 4.8 and 4.9, respectively. Each stress-strain curve represents an average of 5-6
replicates. Stress-strain data give important information about the ultimate mechanical properties
of polymeric materials.44, 45 The values of Young’s modulus, area under the stress–strain curve,
strain at break, and stress at break are summarized in Table 4.7 for nanolatex series. For
comparison, stress-strain analysis values for conventional latex series are shown in Table 4.8,
and the respective curves for each post-coalescence and pre-coalescence conventional latex
series are shown in Figures 4.10 and 4.11, respectively. It should be noted that for ease of
comparisons the average stress-strain curves are used from Chapter 3. The area under the stress–
strain curve is a measure of the flexibility and toughness of the film. As the area decreases, the
film becomes less flexible and more brittle.
Table 4.7: Results of stress-strain analysis of nanosize latexes
Nanoparticle Latex Young’s Modulus (E'), MPa
Area Under Curve
Strain at Break(εb), %
Stress at Break(εb), MPa
nL0 2.2 ± 0.4 33 ± 1 81.5 ± 5.7 0.8 nIL2 6.4 ± 0.8 40.1 ± 15 86.4 ± 12 0.9 ± 0.2 nEL2 4.1 ± 0.1 71.8 ± 4.3 94.8 ± 4.3 1.5 ± 0.1 nIL4 5 ± 1.3 52.9 88.5 1.2 nEL5 11.4 ± 0.2 151 ± 20 78 ± 3.5 3.9 ± 0.2
Table 4.8: Results of stress-strain analysis of conventional size latexes
Conventional Latex Young’s Modulus (E'), MPa
Area Under Curve
Strain at Break(εb), %
Stress at Break(εb), MPa
L0 8.9 ± 0.6 172 ± 11 95.7 ± 6 2.7 ± 0.9 IL-2 18.1 ± 0.9 311 ± 14 106 ± 12 6.00 ± 0.2 EL-2 24.2 ± 1.5 221 ± 50 62.9 ± 9.1 6.63 ± 0.8 IL-4 49.7 ± 9.2 222 ± 6.3 57.9 ± 1.2 7.7 EL-5 45.3 196.5 ± 11 41.8 ± 0.7 9.5 ± 0.5
113

Stress-strain analysis of constituent nanosize latexes with pre-coalescence and post -
coalescence crosslinking and comparisons with their conventional size counterparts:
For post-coalescence crosslinking nano latex series with increasing level of crosslinking,
the values showed an increase indicating increased toughness in the sample. At 5 wt% of post-
coalescence crosslinker nanolatex all four values, Y-modulus, area under the curve, stress at
break and strain at break, are the highest when compared to all the other nano latex samples
tested. This is an opposite trend when compared to the values of conventional latex with 5 wt%
of post-coalescence crosslinker. In the latter case, only Young’s modulus value showed an
increase with significant decrease in area under the curve and strain at break, indicating
brittleness in the sample. This could be attributed to the large surface area of nanosize latex
particles facilitating uniform distribution of functional groups across the polymer network.
In case of pre-coalescence crosslinked nano latexes, Young’s modulus showed marginal
increase as the level of crosslinking increases. Area under the curve and stain at break largely
remained unchanged (within the standard deviation of the test). Both pre-coalescence and post-
coalescence crosslinked latexes at 2 wt% level of crosslinking showed higher values of strain at
break. Also, when comparing the pre-coalescence crosslinking at 4 wt% vs. post-coalescence
crosslinking at 5 wt%, the highest levels, in the nanolatex series – the post-coalescence
crosslinking showed higher, almost twice, the modulus and the area under the curve values.
Overall, when comparing the nanosize latex films with their conventional size counterparts, the
Young’s modulus and area under the curve values of nanosize latexes are very low. This could
be attributed to the presence of the additional surfactant in the nanolatex series.
114

0
0.2
0.4
0.6
0.8
1
1.2
1.4
0 20 40 60 80 100
% Strain
Stress (Mpa)
nIL4 nIL2 nL0
Figure 4.8: Comparison of average stress-strain curves for pre-coalescence crosslinked nanosize latex series
0
0.5
1
1.5
2
2.5
3
3.5
4
4.5
5
0 20 40 60 80 100
% Strain
Stress (Mpa)
nL0 nEL2 nEL5
Figure 4.9: Comparison of average stress-strain curves for post-coalescence crosslinked nanosize latex series
115

EL SERIES
0
10
12
0 20 40 60 80 100 120
% Strain
2
4
6
8
Stre
ss (M
pa)
Average EL-0
Average EL-1
Average EL-2
Average EL-5
EL-1 EL-5
EL-2
EL-0
Figure 4.10: Comparison of average stress-strain curves for post-coalescence crosslinked conventional latex series (from Chapter 3)
IL SERIES
0
2
4
6
8
10
12
0 50 100 150% Strain
Stre
ss (M
Pa)
Average IL-0
Average IL-0,25
Average IL-0,6
Average IL-1,2
Average IL-2
Average IL-4
IL-4 IL-0 IL-2
IL-0.25
IL-1.2 IL-0.6
Figure 4.11: Comparison of average stress-strain curves for pre-coalescence crosslinked conventional latex series (from Chapter 3)
116

Dynamic mechanical properties
Dynamic mechanical characterization of heterogeneous polymers is dependent not only
on the chemical composition of a material but also on physical or structural arrangement of the
phases in a bulk polymer.44, 45 DMA analysis gives an insight into intrinsic mechanical properties
of a polymer.44, 45 Figures 4.12-4.13 show respective storage and loss modulus curves of pre-
coalescence nanolatex series and post-coalescence nanolatex series.
DMA provides information about the viscoelastic properties (storage modulus and loss
modulus) of a polymer as a function of frequency and temperature.44, 45 The inflection point of
the storage modulus is related to the Tg of the polymer.44, 45 It should be noted that the
temperature corresponding to the inflection point of the tan delta curve is higher than the Tg
value determined by MDSC, which is commonly observed.44, 45 The tan delta curve is calculated
as ratio of the loss modulus and storage modulus. The point where the storage modulus curve
flattens is an indicator of the rubbery plateau. Hill58 points out that “for unpigmented crosslinked
coating films the level of the storage modulus, E′, in the rubbery plateau region above Tg is an
indicator of the level of crosslink density.” Hill58 further points out that a wide variation in E′
values has been observed from 4 MPa for lightly crosslinked systems to 200 MPa for very highly
crosslinked films. For nanosize post-coalescence crosslinked latexes as shown in Table 4.10, in
the 80-90 oC range, the values of E’ are as follows: nL0, E’ = 0.9 MPa, nEL2, E’ = 0.4 MPa, and
nEL5, E’ = 1.3 MPa. In case of pre-coalescence crosslinked films for both nIL2 and nIL4, E’
value in rubbery region is lower than E’ value of nL0 in rubbery region. This difference in trends
between nE-series and nI-series is consistent with our previous conclusions described in detail in
Chapter 3.44, 45
117

118
Also, when comparing the modulus values with their conventional size counterparts,
nanoparticle latexes showed lower values. This could be due to presence of surfactant in
nanosize latexes, which may lower the values of modulus in rubbery region.
Figure 4.12: Comparison of storage and loss modulus curves of pre-coalescence crosslinker nanoparticle latex series
Figure 4.13: Comparison of storage and loss modulus curves of post-coalescence crosslinker nanoparticle latex series

119
Table 4.9: Comparison of DMA values with MDSC Tg values of conventionally size pre-coalescence or post-coalescence crosslinked latexes
Conventional Latex MDSC Tg (oC) DMA DMA Tan delta
DMA storage modulus (Mpa), E′, in rubbery
(80-90 oC) region
Storage modulus inflection
point (oC)
Loss peak temperature
(oC)
Tan delta peak
Temperature (oC)
(L)HWHH (R)HWHH
L0 7.05 13.8 15.2 40.7 15.8 21.7 3.1 IL-2 5 18.7 18.2 42.7 10 13.1 1 EL-2 7 18.9 18.7 43.9 11.6 14.2 3 IL-4 14.6 26.3 24.3 50.3 16.92 21.6 5.2 EL-5 11.6 11.4 19.8 45.4 18.75 25 9
Table 4.10: Comparison of DMA values with MDSC Tg values of nano size pre-coalescence or post-coalescence crosslinked latexes
Nanoparticle Latex MDSC Tg (oC) DMA DMA Tan delta
DMA storage modulus (Mpa), E′, in rubbery
(80-90 oC) region
Storage modulus inflection
point (oC)
Loss peak temperature
(oC)
Tan delta peak
Temperature (oC)
(L)HWHH (R)HWHH
nL0 4.77 13.1 13.8 32.5 18.65 18.85 0.9 nIL2 4.67 17.4 14.6 33.5 16.12 19.38 0.3 nEL2 3.13 9.4 14.6 35.8 18.01 25.79 0.4 nIL4 10.9 17.1 16.4 37.2 17.99 19.51 0.7 nEL5 5.15 15.9 14.3 41.4 14.04 32.36 1.3

Table 4.9 compares the MDSC Tg, DMA storage modulus inflection point, DMA loss
peak temperature, tan delta peak temperature and half width/half height of tan delta peak. In the
case of post-coalescence crosslinked latexes, with increasing % crosslinker, the shifting in tan
delta peaks to higher temperature is negligible, but at the highest level of crosslinking,
broadening as well as a shift to higher temperature is observed as reported in Table 4.6. The
above observations are also reflected in half width and half height values of tan delta curves as
shown in Table 4.6. The broadening of the tan delta peak is an indication of the development of a
heterogeneous network structure and morphology as the crosslinker level increases.58 This is
consistent with our previous observations with post-coalescence conventional latex series as
described in Chapter 3.44, 45
Further, as the level of post-coalescence crosslinker increases, Y-modulus value increases
at measurement temperatures of 250C as shown in Figure 4.9 and Table 4.8. Also, as was
observed in the case of conventional post-coalescence series, similarly with nanolatex post-
coalescence series the tan delta peaks become broader (increase in half width and half height,
Table 4.10), and the tan delta peak temperature increases, an indication of development of a
more heterogeneous network structure and morphology. Thus, as the crosslinking level increases,
the elastic modulus level obtained from stress-strain measurements increases and the DMA tan
delta peak broadens. The rubbery plateau modulus obtained from DMA measurements increases
at the 5% level, indicating a lightly crosslinked latex film. It should be noted that the MEK
double rub resistance does increase as a function of crosslinking level, and the pencil hardness
also increases with crosslinking level (see Table 4.5). These results lead us to conclude that at the
appropriate crosslinker levels, an optimized hardness-flexibility balance can be achieved. Clearly
the postcoalescence crosslinked latex particles are able to coalesce, interdiffuse, and
120

interpenetrate adequately before the crosslink density is high enough to impede the formation of
films with desirable properties. All these observations indeed correlate with the observations
noted (Chapter 3) in case of post-coalescence crosslinked conventional latex series.
In the case of the pre-coalescence crosslinked nanolatex samples, shifting of the tan delta
peak to higher temperature (not as high as the post-coalescence crosslinked nanolatex at 5 wt%)
can be seen at the highest crosslinking level in Table 4.10 with minimal broadening of the tan
delta peak. This indicates that with increasing crosslinker level, a more heterogeneous structure
is not developing, at least up to crosslinker levels of 4%. However, as the crosslinking level
increases, the elastic modulus level obtained from stress-strain measurements increases up to 4%
level and is the highest at 2% level. For nIL latex films, the rubbery plateau modulus obtained
from DMA measurements does not show any significant increase for nIL2 or nIL4. This
indicates that as the level of precoalescence crosslinker increases, internal particle crosslinking
increases and inhibits interdiffusion and interparticle chain entanglement. It should be noted that
the MEK double rub resistance showed a marginal increase as a function of crosslinking level,
and the pencil hardness appears to be essentially independent of crosslinking level (see Table
4.5). These results indicate that the pre-coalescence particles are indeed internally crosslinked
but only improve the properties of the latex films up to 2% level. However, at higher levels of
crosslinking, such as at 4 wt% of pre-coalescence crosslinker, the properties are generally
deleterious. Thus, in case of pre-coalescence crosslinking, the interdiffusion is impeded because
too much crosslinking occurs before sufficient interparticle chain entanglement and particle
coalescence can occur. All of these observations indeed correlate with the observations noted
(Chapter 3) in case of pre-coalescence crosslinked conventional latex series.44, 45
121
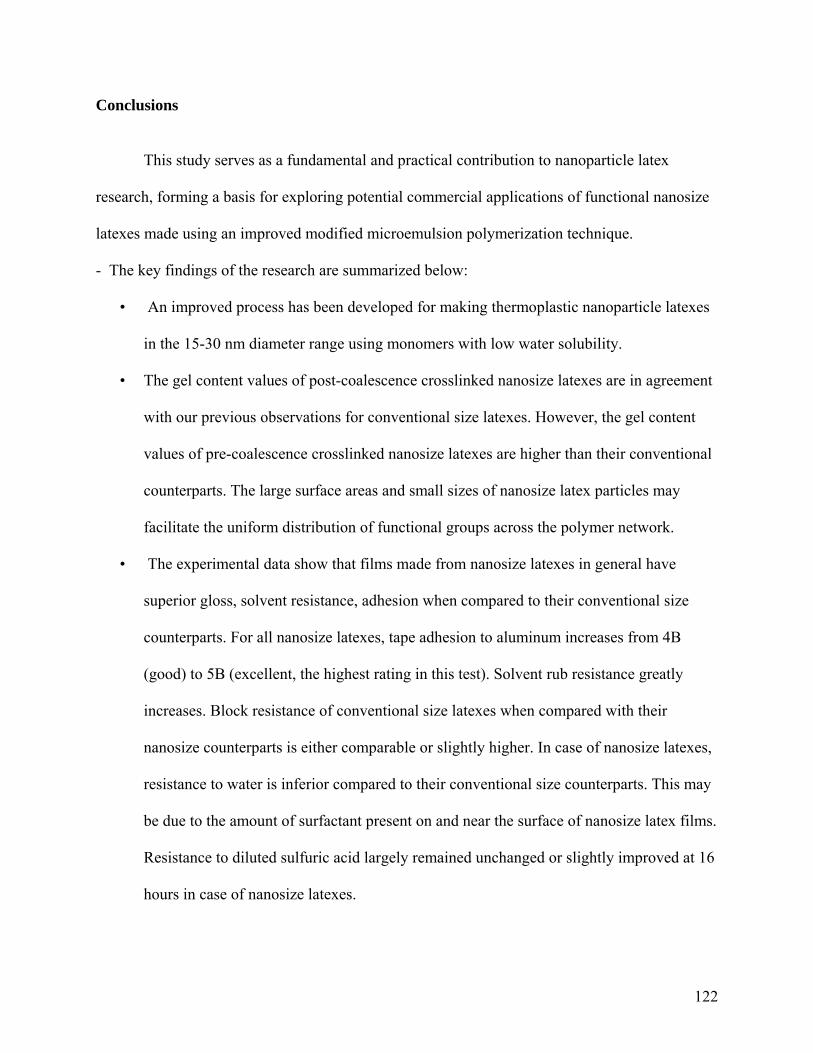
Conclusions
This study serves as a fundamental and practical contribution to nanoparticle latex
research, forming a basis for exploring potential commercial applications of functional nanosize
latexes made using an improved modified microemulsion polymerization technique.
- The key findings of the research are summarized below:
• An improved process has been developed for making thermoplastic nanoparticle latexes
in the 15-30 nm diameter range using monomers with low water solubility.
• The gel content values of post-coalescence crosslinked nanosize latexes are in agreement
with our previous observations for conventional size latexes. However, the gel content
values of pre-coalescence crosslinked nanosize latexes are higher than their conventional
counterparts. The large surface areas and small sizes of nanosize latex particles may
facilitate the uniform distribution of functional groups across the polymer network.
• The experimental data show that films made from nanosize latexes in general have
superior gloss, solvent resistance, adhesion when compared to their conventional size
counterparts. For all nanosize latexes, tape adhesion to aluminum increases from 4B
(good) to 5B (excellent, the highest rating in this test). Solvent rub resistance greatly
increases. Block resistance of conventional size latexes when compared with their
nanosize counterparts is either comparable or slightly higher. In case of nanosize latexes,
resistance to water is inferior compared to their conventional size counterparts. This may
be due to the amount of surfactant present on and near the surface of nanosize latex films.
Resistance to diluted sulfuric acid largely remained unchanged or slightly improved at 16
hours in case of nanosize latexes.
122

• AFM tapping mode phase images clearly showed the effect of type and rate of
crosslinking on the resulting film morphology. The rate of the crosslinking reaction in
pre-coalescence crosslinked (4wt% level) low Tg nanoparticle latex was fast enough to
significantly retard homogenization of the film, at least near to the surface, and is
consistent with previous observations for the conventional size counterpart. Comparing
tapping mode height images of nanosize vs. conventional size counterparts, in general,
we see that nanosize latex films produce smoother surfaces.
• Stress-strain results showed that with increasing levels of post-coalescence crosslinker in
nanosize latexes, Young’s modulus increased. In the case of pre-coalescence crosslinked
latexes, Young’s modulus showed marginal increase as the level of crosslinking
increases. Area under the curve and stain at break largely remained unchanged (within
the standard deviation of the test). At 2 wt% level of crosslinking in both pre-coalescence
and post-coalescence crosslinked nanolatexes, higher values of strain at break is
observed. Overall, when comparing the nanosize latex films with their conventional size
counterparts, the Young’s modulus and area under the curve values of nanosize latexes
are very low. This could be attributed to presence of the additional surfactant in the
nanolatex series.
• DMA analysis results showed that in the case of post-coalescence crosslinker,
nanoparticle latex samples exhibited a decrease and broadening of the tan delta peak with
increasing levels of crosslinker, indicating an increase in heterogeneous network structure
and morphology. At the 5% crosslinker level, the rubbery plateau modulus values
indicate that these systems are lightly crosslinked. For the pre-coalescence crosslinked
nanoparticle latex samples, shifting of tan delta peak to higher temperatures occurs at the
123

increasing crosslinking level, although not as greatly as in the case of post-coalescence
crosslinked nanoparticle latexes. DMA analysis showed that the precoalescence particles
are indeed internally crosslinked, but internal crosslinking only improves the properties
of the latex films up to the 2% level and mostly showed no improvement or in most cases
deleterious properties at higher crosslinking levels (4 wt%). Thus, in case of pre-
coalescence crosslinking, the interdiffusion is apparently impeded because too much
crosslinking occurs before sufficient interparticle chain entanglement and particle
coalescence can occur. All of these observations indeed correlate with the observations
noted (Chapter 3) in case of conventional latex series.44, 45
124
References:
1. Moser, W. R., Advance Catalysts and Nanostructured Materials : Modern Synthetic Methods. Academic Press: San Diego, CA, 1996. 2. Jena, P., Clusters and Nanostructured Materials. In Behera, S. N., Ed. Nova Science Publishers: New York, 1996. 3. Chow, G.-M., Nanotechnology: Molecularly Designed Materials. In Gonsalves, K. E., Ed. American Chemical Society: Washington, D.C., 1996. 4. Siegel, R. W., Polymeric Material Science Engineering 1995, 73, 26. 5. Gref, R. M., Y. ; Peracchia, M.T.; Trubetskoy, V.; Langer, R.; Torchilin, V., Science 1995, 267, 458. 6. Stupp, S. I. L., V.; Walker, K.; Li,L.S.; Huggins, K.E.; Kesser, M.; Amstutz, A., Science 1997, 276, 384. 7. Kaiyi, L.; Zhaoqun, W., A novel method for preparing monodispersed polystyrene nanoparticles. Front.Chem.China 2007, 2, (1), 17-20. 8. He, G.; Pan, Q., Synthesis of Polystyrene and Polystyrene/Poly (methyl methacrylate) Nanoparticles. Macromolecular Rapid Communications 2004, 25, (17), 1545-1548. 9. Stoffer, J. O.; Bone, T. J., Polymerization in Water-in-Oil Microemulsion Systems I. Journal of Polymer Science, Polymer Chemistry Edition 1980, 18, (8). 10. Stoffer, J. O.; Bone, T. J., Polymerization in water-in-oil microemulsion systems. II. SEM investigation of structure Journal of Dispersion Science and Technology 1980, 1, (4), 393-412. 11. Atik, S. S.; Thomas, J. K., Polymerized Microemulsions. J. American Chemical Society 1981, 103, (14), 4279-4280. 12. Atik, S. S.; Thomas, J. K., Photochemistry in polymerized microemulsion systems Journal of the American Chemical Society 1982, 104, (12), 5868-74. 13. Atik, S. S.; Thomas, J. K., Photoinduced reactions in polymerized microemulsions Journal of the American Chemical Society 1983, 105, (14), 4515. 14. Antonietti, M.; Bremser, W.; Muschenborn, D.; Rosenauer, C.; Schupp, B.; Schmidt, M., Synthesis and size control of polystyrene latexes via polymerization in microemulsion Macromolecules 1991, 24, (25), 6636-43. 15. Candau, F.; Leong, Y. S.; Fitch, R. M., Kinetic study of the polymerization of acrylamide in inverse microemulsion Journal of Polymer Science, Polymer Chemistry Edition 1985, 23, (1), 193-214. 16. Candau, F.; Leong, Y. S.; Fitch, R. M., Effect of solution components on the termination mechanism in acrylamide microemulsion polymerizations Journal of Polymer Science, Part A: Polymer Chemistry 1989, 27, (7), 2179-88. 17. Capek, I.; Potisk, P., Microemulsion polymerization of butyl acrylate. IV. Effect of emulsifier concentration Journal of Polymer Science, Part A: Polymer Chemistry 1995, 33, (10), 1675-83. 18. Corpart, J. M.; Selb, J.; Candau, F., Characterization of high charge density ampholytic copolymers prepared by microemulsion polymerization Polymer 1993, 34, (18), 3873-86.
125

19. Feng, L.; Ng, K. Y. S., In situ kinetic studies of microemulsion polymerizations of styrene and methyl methacrylate by Raman spectroscopy Macromolecules 1990, 23, (4), 1048-53. 20. Gan, L. M.; Chew, C. H.; Lee, K. C.; Ng, S. C., Polymerization of methyl methacrylate in ternary oil-in-water microemulsions Polymer 1993, 34, (14), 3064-9. 21. Gan, L. M.; Chew, C. H.; Lye, I.; Ma, L.; Li, G., Effect of water-soluble cosurfactants on microemulsion polymerization of styrene Polymer 1993, 34, (18), 3860-4. 22. Gan, L. M.; Chew, C. H.; Lee, K. C.; Ng, S. C., Formation of polystyrene nanoparticles in ternary cationic microemulsions Polymer 1994, 35, (12), 2659-64. 23. Guo, J. S.; Sudol, E. D.; Vanderhoff, J. W.; El-Asser, M. S., Particle nucleation and monomer partitioning in styrene oil-in-water microemulsion polymerization Journal of Polymer Science, Part A: Polymer Chemistry 1992, 30, (5), 691-702. 24. Guo, J. S.; Sudol, E. D.; Vanderhoff, J. W.; El-Asser, M. S., Modeling of the styrene microemulsion polymerization Journal of Polymer Science, Part A: Polymer Chemistry 1992, 30, (5), 703-12. 25. Kuo, P. L.; Turro, N. J.; Tseng, C. M.; El-Aasser, M. S.; Vanderhoff, J. W., Photoinitiated polymerization of styrene in microemulsions Macromolecules 1987, 20, (6), 1216-21. 26. Larpent, C.; Tadros, T. F., Preparation of microlatex dispersions using oil-in-water microemulsions Colloid & Polymer Science 1991, 269, (11), 1171-83. 27. Ming, W.; Zhao, J.; Lu, X.; Wang, C.; Fu, S., Novel Characteristics of a Polystyrene Microsphere Prepared by Microemulsion Polymerization Macromolecules 1996, 29, (24), 7678-7682. 28. Rodriguez-G., L. A.; Mendizabal, E.; Puig, J. E.; Kaler, E. W., Polymerization of methyl methacrylate in 3-component cationic microemulsion Journal of Applied Polymer Science 1993, 48, (5), 775-86. 29. Texter, J.; Oppenheimer, L. E.; Minter, J. R., Microemulsion polymerization in the water, bis(2-ethylhexyl) sulfosuccinate sodium salt (Aerosol-OT), tetrahydrofurfuryl methacrylate system Polymer Bulletin (Berlin, Germany) 1992, 27, (5), 487-94. 30. Wu, C., Laser Light Scattering Determination of the Surfactant Interface Thickness of Spherical Polystyrene Microlatices. Macromolecules 1994, 27, (24), 7099-102. 31. Guo, A. L., G.; Tao, J. , Macromolecules 1996, 29, 2487. 32. Henselwood, F. L., G., ibid 1997, 30, 488. 33. Li, M. J., M.; Zhu, L.; Wu, C., Macromolecules 1997, 30, 2201. 34. Okubo, M. F., N.; Ito, A., Journal of Applied Polymer Science 1997, 66, 1461. 35. Okubo, M. S., R.; Fukami, N.; Ito, A., Colloid & Polymer Science 1997, 275, 170. 36. Gan, L. M.; Chew, C. H.; Lian, N.; Li, G. Z., Polymerization of Styrene in a Winsor I-like System Langmuir 1994, 10, (7), 2197-201. 37. Loh, S. E.; Gan, L. M.; Chew, C. H.; Ng, S. C., Polymerization of methyl methacrylate in Winsor I-like system Journal of Macromolecular Science, Pure and Applied Chemistry 1996, A33, (3), 371-84. 38. Ming, W.; Jones, F. N.; Fu, S., High solids-content nanosize polymer latexes made by microemulsion polymerization. Macromolecular Chemistry and Physics 1998, 199, (6), 1075-1079.
126

39. Ming, W.; Jones, F. N.; Fu, S., Synthesis of nanosize poly(methyl methacrylate) microlatexes with high polymer content by a modified microemulsion polymerization. Polymer Bulletin 1998, 40, (6), 749-756. 40. Ming, W.; Jones, F. N.; Fu, S., High Solids-content Nanosize Polymer Latexes Made by Microemulsion Polymerization. Macromol. Chem. Phys. 1998, 199, 1075-1079. 41. Ming, W.; Jones, F. N.; Fu, S., Synthesis of nanosize poly(methyl methacrylate) microlatexes with high polymer content by a modified microemulsion polymerization. Polym. Bull. 1998, 40, (6), 749-756. 42. Ming, W.; Zhao, Y.; Cui, J.; Fu, S.-K.; Jones, F. N., “Formation of Irreversible Nearly Transparent Physical Polymeric Hydrogels During a Modified Microemulsion Polymerization,” Macromol 1999, 32, 528-530. 43. Ming, W.; Zhao, Y.; Fu, S.; Jones, F. N. In Polym. Mater. Sci. Eng., 1999; ACS: 1999; p 514. 44. Joshi, R.; Lefevre, E.; Patel, C.; Provder, T.; Crombez, R.; Shen, W.; Jones, F. N., Thermoanalytical and morphological studies of cross-linked latex films by advanced techniques. Journal of Thermal Analysis and Calorimetry 2008, 93, (1), 19-26. 45. Joshi, R. G.; Provder, T.; Ziemer, P. D.; Mao, W.; Shen, W.; Jones, F. N., Investigation of the effect of precoalescence or postcoalescence crosslinking on film formation, properties, and latex morphology. Journal of Coatings Technology and Research 2008 (online first, DOI: 10.1007/s11998-008-9115-7). 46. Chang-Mei, K. E.; Hou-Zhi, W.; Wei, D.; Yan, W.; Jun, X. U.; Hui, D.; Mei-jie, X.; Hui-zhong, Z.; Xuan-ke, L., High solids-content nanosize polymeric microlatexes made by microemulsion copolymerization at ambient temperature. Journal of Wuhan University of Technology - Mater. Sci. Ed. 2004, 19, (1), 30-34. 47. Zosel, A.; Ley, G., “Influence of crosslinking on structure, mechanical properties, and strength of latex films”. Macromolecules, 1993, 26, 2222–2227. 48. Tamai, T.; Pinenq, P.; Winnik, M. A., “Effect of cross-linking on polymer diffusion in poly(butyl methacrylate-co-butyl acrylate) latex films”. Macromolecules 1999, 32, 6102-6110. 49. Aradian, A.; Raphael, E.; G., d. G. P., “A scaling theory of the competition between interdiffusion and cross-linking at polymer interfaces”. Macromolecules 2002, 35, 4036-4043. 50. Ghazaly, H. M.; Daniels, E. S.; Dimonie, V. L.; El-Aasser, M. S.; Klein, A., “Synthesis and characterization of a macromonomer crosslinker”. J. Appl. Polym. Sci. 2000, 77, 1362–1368. 51. Ghazaly, H. M.; Daniels, E. S.; Dimonie, V. L.; Klein, A.; El-Aasser, M. S., “Miniemulsion copolymerization of n-butyl methacrylate with crosslinking monomers". J. Appl. Polym. Sci. 2001, 81, 1721-1730. 52. Ghazaly, H. M.; Daniels, E. S.; Dimonie, V. L.; Klein, A.; Sperling, L. H.; El-Aasser, M. S., “Properties of N-butyl methacrylate copolymer latex films derived from crosslinked latex particles” J. Appl. Polym. Sci. 2003, 88, 42-49. 53. Kessel, N.; Illsley, D. R.; Keddie, J. L., “The Influence of Interdiffusion and Crosslinking in the Film Formation of an Acrylic Latex” J. Coat. Technol. Res. 2008, (online first, DOI:10.1007/s11998-008-9096-6). 54. Emmons, W. D., (to Rohm and Haas) “Ambient or low-temperature curable coatings,”. U.S. Patent 4,210,565, 1980.
127

128
55. “Diacetone acrylamide, N-(1,1 dimethyl-3-oxobutyl)-acrylamide,” Kyowa Hakko U.S.A. Inc. Technical information sheet 2008 (retrieved), p 4. 56. Taylor, J. W.; Winnik, M. A., “Functional Latex and Thermoset Latex Films,”. JCT Research 2004, 1, (3), 163-190. 57. Robinson, G. F.; Shemancik, R. C.; Speight, R. D.; Wong, P. T.; Znidersic, K. M. (to Akzo Nobel), “Coating Compositions and Coatings Formed Therefrom.” US Patent 6,605,359, 2003. 58. Hill, L. W., “Dynamic Mechanical and Tensile Properties”. In Paint and Coatings Testing Manual: Fourteenth Edition of the Gardner-Sward Handbook, Koleske, J. V., Ed. ASTM: Ann Arbor, MI, 1995; pp 534–546.

Chapter 5
Blends of conventional size and nanoparticle size acrylic latexes*
Introduction
Synthetic latexes have been industrially important for over 60 years and have attracted
considerable academic interest. Latex blends, physically mixing two different latexes with
homogeneous particle morphologies, have attained a great deal of attention in last two decades.1-
21 This strategy is known to eliminate or reduce the use of coalescing aids (or plasticizers), which
are considered volatile organic compounds (VOCs) in a coating formulation.7, 20 Another
effective approach is the use of structured latexes by changing the particle morphology in a
single particle i.e. core/shell type latexes covered extensively in the literatures.9, 10, 12, 15, 19 There
have been many thousands of publications and patents on latex blend research.1-15, 17-21 Drying
behavior and mechanical properties of blends of a low glass transition temperature (Tg) polymer
based latex (commonly viewed as film former or a continuous phase) and a high Tg polymer
based latex (commonly viewed as filler or a dispersed phase) have been thoroughly investigated
in the past. Many other factors, individually or combined, covered in the literature1-15, 17-21 govern
the film properties and film formation of latex blends, such as mechanical properties of neat
constituents and their morphologies, compatibility between the two mixing phases or the
interfacial activity between the two mixed phases, particle size and particle size ratios of blend
components, weight fraction, distribution and packing factor of dispersed phase, or their blend
ratios. Further, it was shown that incorporation of a functional group can enhance the miscibility
between the two phases, hence, the overall film properties of resulting latex blends.2, 17
*Winner of the Prestigious “A.L. Gordon Award” at 2008 FutureCoat! Conference sponsored by Federation of Societies for Coatings Technology, in Chicago, IL, USA.
*Presented at Prestigious “Matiello Symposium” at 2009 CoatingsTech Conference sponsored by FSCT-NPCA, in Indianapolis, IN, USA.
*2 Patents filed, Joshi, R.G. et al., “Conventional Latex/Nanolatex Blends”, US (12578442) and PCT (60536) on Oct 13, 2009 (Eastern Michigan University)
129

Although many investigators have studied blends of latexes, including blends of latexes
with different particle sizes, surprisingly few, if any, of the thousands of publications contain
systematic studies of blends of thermoplastic nanoparticles in the 15-30 nm diameter range with
larger thermoplastic latexes (diameters of about 100 to 1000 nm) – the subject of this research.
Also, two significant variables, the glass transition temperature (Tg) of the large and small
polymer particles (they can be the same or different) and the effects of chemical crosslinking,
pre-coalescence (internal) vs. post-coalescence crosslinking (external), are key factors in this
research.
In Chapter 3, the effect of pre-coalescence or post-coalescence crosslinking on
conventionally sized latex film formation, properties, and latex morphology was covered.22, 23 As
described Chapter 3, “Pre-coalescence crosslinked latexes” or “intraparticle crosslinking latexes”
refers to latex particles that are crosslinked before the film formation or the coalescence stage. In
this study, 1, 3-butylene glycol dimethacrylate (1, 3-BGDMA) was used as the pre-coalescence
crosslinker. The “post-coalescence crosslinked latexes” or “interparticle crosslinking latexes”
referred to the latexes that are prepared with reactive sites such as hydroxyl groups and are
crosslinked during film formation by an external crosslinker that is added to the coating
formulation but not co-polymerized in the latex. Many combinations of reactive sites and
crosslinkers have been described in literature.24 In this study diacetone acrylamide (DAAM) was
used as the monomer to place reactive sites within the latex and adipic dihydrazide (ADDH) as
the post-coalescence crosslinker. This combination of site and crosslinker has been described in
trade literature25 and in numerous patents26-29 and is being utilized by some major coatings and
ink companies in their product formulations.
130

In Chapter 4, preparation of comparable nanosize latexes containing 0 – 4 wt. % of pre-
coalescence crosslinker (1, 3-BGDMA) and 0 – 5 wt. % of reactive monomer for post-
coalescence crosslinker (DAA) is covered. Both the pre-coalescence and post-coalescence
nanosize latex series were prepared using improved modified microemulsion copolymerization
process using target glass transition temperature of 5 oC. As described in Chapter 4, Ming’s
modified microemulsion process30-33 was basically used to make nanoparticle latexes with
further improvements to enable use of functional monomers and monomers with low water
solubility.
This chapter describes a study in which the nanosize latexes (from Chapter 4) were
blended with previously reported22, 23 conventional latexes (from Chapter 3) in different weight
ratios ranging from 7.5/92.5 to 70/30 nano/conventional latexes. The films cast from these
latexes were characterized using a variety of end-use tests and advanced instruments such as a
dynamic mechanical analyzer (DMA), modulated differential scanning calorimeter (MDSC), and
atomic force microscope (AFM). Information from such instruments should greatly enhance our
understanding of the relation between physical and morphological properties of coatings. The
overall goal was to understand the relationship among the variables of (a) particle size and
distribution level, (b) type and level of crosslinker, and (c) blending and blend ratios and the
effect upon the resultant fundamental and end-use film properties and latex film morphology.
131

Experimental Details
Preparation of pre-coalescence or post-coalescence crosslinked conventional latexes22, 23
(described in detail in Chapter 3):
The conventional latex samples employed here have been described previously.31 In
brief, latexes were synthesized with varying levels of pre-coalescence crosslinker (internal) and
post-coalescence (external) crosslinkable sites. Two sets of latexes were prepared, one with a
target glass transition temperature (Tg) of about 7 oC and the other with a target Tg of about 22
oC. Compositions and characteristics of these latexes are shown in Table 5.1. It should be noted
here that the surfactant/monomer wt. ratio used for conventional latex synthesis is 3/100. The
latexes are coded I for pre-coalescence or internal, E for post-coalescence or external, L for low
Tg, H for high Tg, and a number for the weight % of crosslinker or reactive site in the monomer
line up. Thus, for example, IL-4 means an internally (or pre-coalescence) crosslinked, low Tg
latex with 4.0 wt. % of 1, 3-BGDMA and EH-5 means an externally (or post-coalescence)
crosslinked, high Tg latex with 5.0 wt. % of DAA.
Preparation of nanosize latexes (with or w/o functional group) using improved modified
microemulsion copolymerization30-33 (described in detail in Chapter 4):
Nanosize latexes were synthesized with varying levels of pre-coalescence (internal) and
post-coalescence (external) crosslinkable sites as described previously. The latexes were
prepared with the target glass transition temperature (Tg) of 5 oC. The compositions and
characteristics of these latexes are shows in Table 5.2. It should be noted here that the
surfactant/monomer wt. ratio used for nanoparticle latex synthesis is 1/10.5. The nanosize latexes
are coded I for pre-coalescence or internal, E for post-coalescence or external, L for low Tg and,
a number for the weight % of crosslinker or reactive site in the monomer line up. Thus, for
132

133
example nIL-2 means pre-coalescence crosslinked latex with 2 wt. % of 1, 3-BGDMA and nEL-
5 means post-coalescence crosslinked latex with 5 wt. % of DAA.
Preparation of latex blends using functional pre-coalescence (internally crosslinked) and
post-coalescence (crosslinkable) conventional latexes with nanosize polymer latexes with or
without functional groups:
The conventional latexes, listed in Table 5.1, and the nanoparticle latexes, listed in Table
5.2, were mixed in a variety of ratios, on wt/wt basis, with gentle stirring in a glass beaker. The
resulting latex blends are listed in Table 5.3. The blends are coded as first two/three
alphanumeric for conventional latexes (as described above) and the second three/four
alphanumeric for nanolatexes (as described above) separated using a hyphen. For example,
H0_nL0 showed blend of high Tg conventional latex with no crosslinker with low Tg nanolatex
with no crosslinker. Many latex blends were employed and large amounts of experimental work
have been generated. For the purpose of this chapter, in order to make the results more
understandable, the ten most representative examples in seven different concentrations are shown
in Table 5.3.

134
Table 5.1: Characteristics of conventionally sized (with or without crosslinker) latexes22, 23 (Chapter 3) Latex Composition % Non-
Volatiles Particle Size, nm
Glass Transition
Temperature (ºC) by MDSC
Glass Transition
Temperature (ºC) by Fox Equation
pH Gel Content
Viscosity η (mPa•s)
L0 nBA/nBMA//MAA=21/77/2 47.0 134 7.05 5.06 9.8 0.0 280 EL-5 nBA/nBMA/DAA/MAA=21/72/5/2 46.3 137 11.6 --- 9.7 100.0 1320 IL-4 nBA/nBMA/1,3-
BGDMA/MAA=21/73/4/2 46.8 123 14.6 --- 9.2 64.2 70
H0 nBA/nBMA/ /MAA=9/89/2 46.9 126 26.3 14.4 9.1 0.0 120 EH-5 nBA/nBMA/DAA/MAA=9/84/5/2 46.0 129 29.7 --- 9.8 97.9 1010 IH-4 nBA/nBMA/1,3-
BGDMA/MAA=9/85/4/2 47.6 125 33 --- 9.2 62.9 120
Table 5.2: Characteristics of nanosize (with or without crosslinker) latexes (Chapter 4) Nanosize
Latex Composition % Non-
VolatilesParticle
Size, nm
Polydispersity Glass Transition
Temperature (ºC) using
MDSC
Glass Transition
Temperature (ºC) using
Fox Equation
pH Gel Content
Viscosity η
(mPa•s)
nL0 nBA/nBMA//MAA=21/77/2 10.8 23.2 0.09 4.77 5.06 9.3 0.0 13 nEL2 nBA/nBMA/DAA/MAA=21/75/2/2 10.7 23 0.087 3.13 --- 9.7 98.1 13 nEL5 nBA/nBMA/DAA/MAA=21/72/5/2 10.6 21.7 0.12 5.15 --- 9.5 99.9 17 nIL2 nBA/nBMA/1,3-
BGDMA/MAA=21/75/2/2 10.9 23.2 0.089 4.67 --- 9.1 63.8 13
nIL4 nBA/nBMA/1,3-BGDMA/MAA=21/73/4/2
10.9 22.2 0.1 10.9 --- 9.8 97.4 15

135
Table 5.3: Characteristics of ten most representative latex blends Latex blend Composition (%wt.) Brief description
Conventionally size latex Nanosize latex L0_nL0 100,92.5,85,70,50,30,0 0,7.5,15,30,50,70,100 L0 (Soft conventional latex, zero crosslinker) with Tg = 7 oC, particle diameter 134 nm and nL0 (Soft
nanoparticle latex, zero crosslinker), Tg=4.77 oC, particle diameter 23.2 nm L0_nEL2 100,92.5,85,70,50,30,0 0,7.5,15,30,50,70,100 L0 (Soft conventional latex, zero crosslinker) with Tg = 7 oC, particle diameter 134 nm and nEL2
(Soft nanoparticle latex with 2% crosslinkable monomer), Tg = 3.13 oC, particle diameter 23 nm L0_nIL4 100,92.5,85,70,50,30,0 0,7.5,15,30,50,70,100 L0 (Soft conventional latex, zero crosslinker) with Tg = 7 oC, particle diameter 134 nm and nIL4
(Soft nanoparticle latex with 4% crosslinkable monomer within the particles,), Tg = 10.9 oC, particle diameter 22 nm
H0_nL0 100,92.5,85,70,50,30,0 0,7.5,15,30,50,70,100 H0(Hard conventional latex, zero crosslinker) with Tg = 26 oC, particle diameter 126 nm, and nL0 (Soft nanoparticle latex, zero crosslinker), Tg = 4.77 oC, particle diameter 23.2 nm
H0_nEL5 100,92.5,85,70,50,30,0 0,7.5,15,30,50,70,100 H0 (Hard conventional latex, zero crosslinker) with Tg = 26 oC, particle diameter 126 nm, and nEL5 (Soft nanoparticle latex with 5% crosslinkable monomer), Tg = 5.15 oC, particle diameter 21.7 nm
H0_nIL2 100,92.5,85,70,50,30,0 0,7.5,15,30,50,70,100 H0 (Hard conventional latex, zero crosslinker) with Tg =26 oC, particle diameter 126 nm, and nIL2 (Soft nanoparticle latex with 2% crosslinkable monomer), Tg = 4.67 oC, particle diameter 23.2 nm
EL5_nL0 100,92.5,85,70,50,30,0 0,7.5,15,30,50,70,100 EL5 (Soft conventional latex with 5% crosslinkable monomer) with Tg =5 oC, particle diameter 137 nm, and nL0 (Soft nanoparticle latex, zero crosslinker), Tg=4.77 oC, particle diameter 23.2 nm
IL4_nL0 100,92.5,85,70,50,30,0 0,7.5,15,30,50,70,100 IL4 (Soft conventional latex with 4% crosslinkable monomer within the particles) with Tg =13 oC, particle diameter 123 nm, and nL0 (Soft nanoparticle latex, zero crosslinker), Tg=4.77 oC, particle
diameter 23.2 nm EH5_nL0 100,92.5,85,70,50,30,0 0,7.5,15,30,50,70,100 EH5 (Hard conventional latex with 5% crosslinkable monomer) with Tg =23 oC, particle diameter
129 nm, and nL0 (Soft nanoparticle latex, zero crosslinker), Tg=4.77 oC, particle diameter 23.2 nm IH4_nL0 100,92.5,85,70,50,30,0 0,7.5,15,30,50,70,100 IH4 (Hard conventional latex with 4% crosslinkable monomer within the particles) with Tg =33 oC,
particle diameter 125 nm, and nL0 (Soft nanoparticle latex, zero crosslinker), Tg=4.77 oC, particle diameter 23.2 nm
Figure 5.1 (a, b): Comparison of gel content of (a) pre-coalescence crosslinked nanosize vs. conventional latexes and (b) post-coalescence crosslinked nanosize vs. conventional latexes
Comparison of pre-coalescence crosslinked nanosize vs. conventionally size latexes
0
20
40
60
80
100
0 1 2 3 4 5
1,3 BGDMA (%)
Gel
con
tent
(%)
n- IL seriesIL series
Comparison of post-coalescence crosslinked nanosize vs. conventionally size latexes
0
20
40
60
80
100
120
0 1 2 3 4 5DAA (%)
Gel
con
tent
(%)
n- EL seriesEL series

Characterization of Latexes
Latex Properties
(a) Conventional Latexes (with or without functional groups) 22, 23 (Chapter 3):
The weight percentage of non-volatile solids content (% NVM) was measured using ASTM
D 4758-87. Viscosity was measured by ASTM D 4287 at 20 °C using a Brookfield Viscometer,
Model DV-1, using Spindle #4 at 20 rpm. pH was measured with a Fischer Acumet Model 620
pH meter and with pH paper.
For particle size (diameter) and particle size distribution measurements, each latex was
diluted to a transmission factor of 0.5-1.0 (about 0.05-0.1 wt% solids) and measured at 25 °C
using the light-scattering instrument, MICROTAC Series 9200. Three tests were performed
within 180 sec. to obtain an average value of a volume distribution.
For gel content measurements, an empty extraction thimble was dried at 85°C in an oven
for 2 h, cooled in a desiccator overnight, and weighed. Latex films (prepared on glass and
detached) were dried in a desiccator overnight, cut into small pieces, weighed, and put into the
thimble. After a 12-h extraction with acetone in a Soxhlet extractor, the thimble was dried in an
oven at 85°C for 2 h, cooled in a desiccator overnight, and weighed. The gel content was
calculated from the initial and final weights, assuming that gelled material remained in the
thimble. The results are show in Figure 5.1(a, b) and Table 5.1.
(b) Nanosize latexes (with or without functional groups) (Chapter 4):
The weight percentage of non-volatile solids content (% NVM) was measured using
ASTM D 4758-87. Viscosity was measured by ASTM D 4287 at 25 °C using a using a
Brookfield Viscometer, model CAP 2000+, using Spindle #1 at 113 rpm. pH was measured with
a Fischer Acumet Model 620 pH meter and with pH paper.
136

Particle size (diameter) and particle size distribution of nanosize latexes were determined
using dynamic light scattering method with a 90 PLUS Particle Analyzer (Brookhaven
Instruments Co.) at room temperature, after the nanosize latex samples were diluted to a solid
content of about 0.1 wt.%. A 10 MM potassium nitrate (KNO3) solution was used as diluent. The
latex samples were filtered using Whatman Puradisc 25 AS filters with 200nm pore size before
running for particle size analysis. For each sample at least 3 runs (each run of 10 min. duration)
for a total of 30 min. were done. The average effective diameters and polydispersity from the
intensity distribution were obtained directly from the measurement results and reported.
For gel content measurements of nanosize latexes, a similar procedure was followed as
described earlier for gel content measurements of conventional latex. The results are shown in
Figure 5.1(a, b), Table 5.2.
It should be noted that for particle size measurement, different instruments were used to
measure the particle size and distribution of conventional and nanolatex samples. In selected
cases, results from the MICROTRAC Series 9200 light scattering instrument and the
Brookhaven 90 PLUS Particle Size Analyzer were found to correlate well.
Film Properties:
The minimum film formation temperature (MFT), crack point and knife point, was
determined using a Rhopoint MFFT Bar - 90, Rhopoint Instruments. Briefly, the instrument was
equilibrated over a specific temperature range (determined based on the glass transition
temperature of latex sample) for about 20 minutes. Five replicates are laid down in quick
succession using a 75 micron (3 mils) one inch cube applicator. The tracks were laid down left to
right. A clearly defined limit of coalescence will show in about 90-120 minutes, and the MFT
temperature can then be read using the cursor scale. The crack point, the temperature onset of
137

formation that is crack-free, was determined using a fingernail. The knife point, the temperature
onset of film integrity where the film no longer cracks upon disturbing or peeling the film, was
determined using a plastic or metallic spatula by carefully peeling away the film starting from
the crack point.
Specimens were prepared on aluminum panels by drawing the latexes down using a
square wet film applicator (Paul N. Gardner Co., Inc.) with 0.25 mm (wet) clearance on
aluminum panels. The panels were dried in an oven at 70 °C and 50% humidity for 24 hours and
then stored at normal room conditions for a week before testing. No coalescing solvents were
used. Dry film thicknesses were approximately 50 μm. Before casting these films, a
stoichiometric amount of adipic dihydrazide (ADDH) was added to the E-series latexes.
Dry film thickness was measured at 25°C by Elcometer-345-Digital Coating thickness
Gauge (Elcometer Instruments Ltd.).
Solvent resistance was determined by methyl ethyl ketone (MEK) rubbing. The load was
applied by a ball peen hammer with a 448 g head wrapped with cheesecloth soaked with MEK.
The reported end point was the number of double rubs required to break through the film and
expose bare metal.
Chemical resistance tests were conducted at 25 °C following ASTM D 1308. A 1-mL
sample of each test reagent (water, dilute sulfuric acid at pH 3) was pipeted (a 5-mL pipet
graduated in 0.1 mL) onto the horizontal panel and immediately covered with a watch glass.
After a specific time interval, the spot was wiped clean and the film was examined immediately
for defects. Intervals used were 15 min, 1 h, and 16 h.
Pencil hardness was tested at 25 °C following the procedure of ASTM 3363.
138

Tape adhesion was measured by ASTM D 3359. The films were cut with a cross-cut kit
(Precision Gage & Tool Company) before testing.
Block Resistance was measured by ASTM D 4946. Briefly, latex films were cast on a
sealed test chart and the films were dried in an oven at 70 °C and 50% humidity for 8-10 hours
and then stored at normal room conditions for a week before testing. After conditioning, six 3.8 x
3.8 cm. sections from the films were exactly cut as mentioned in the ASTM method. 3 sets of 2
film squares facing each other were placed in the oven, exactly as described in the ASTM
method, at 50 °C for 30 minutes. The specimens were cooled at room temperature for about 30
min. and blocking was measured. The average of three reading with standard deviation is
reported.
Specular Gloss at 20° and 60° was measured using ASTM D 523 test method. Latex
films were applied to glass panels, conditioned in an oven at 70 °C and 50% humidity for 8-10
hours and then stored at normal room conditions for a week before testing. Gloss was measured
using BYK Gardner, BYK micro-TRI-gloss meter.
Thermal and Mechanical Properties:
For glass transition temperature (Tg) measurement, specimens for latex blends were
prepared on glass panels by drawing the latexes down using a square wet film applicator (Paul N.
Gardner Co., Inc) with 0.30 mm (wet) clearance on glass panels. The glass panels were dried in
an oven at 70 °C and 50% humidity for 8-10 hours and then stored at normal room conditions for
a week before testing. The Tg of the dried films was determined by TA instrument - TA 2920
MDSC with RCS (Refrigerant Cooling System) accessory under nitrogen purge at flow rate of
50 mL/min. For testing, the samples were kept in closed aluminum non-hermetic pans.
139

Temperature scans were done from -90 °C to 100 °C at 2 °C/min with a modulation of +/- 1.00
°C at every 60 seconds under nitrogen. The MDSC was equilibrated at -90 °C for 5 min.
Dynamic Mechanical analyses were conducted using TA Instruments Model Q800
Dynamic Mechanical Analyzer (DMA) with the LNCS accessory. Specimens for stress-strain
and dynamic mechanical studies were prepared on glass panels as described in MDSC studies
section. A film cutter (supplied by TA instruments) was used to cut, at constant depth,
rectangular specimens about 15-20 mm long, 3-6 mm wide, and 0.1-0.2 mm thick from the cured
films.
The stress-strain studies were done at room temperature (~25 °C) in air on the Q800
DMA with the thin film tension clamp in a controlled force mode with a ramped force of 3N/min
up to 18N/min and the resultant % strain was observed. DMA measurements of dried specimen
were done at 1 Hz with a thin film tension clamp over the temperature range of -100 °C to 120
°C, using liquid nitrogen as a coolant. The flow rate of liquid nitrogen into the DMA depends
upon the starting temperature desired and is controlled by the ramp rate or heating rate of 3
°C/min.
Measurements with AFM:
A Digital Instruments Multimode SPM with a NanoScope IIIa controller and an E-
scanner (X-Y scanning limit of 15 μm and a Z limit of 2 μm), operated in the tapping mode, was
used to observe surface morphologies of selected specimens. The latex samples were conditioned
in an oven at 70 °C and 50% humidity for 8-10 hours and then stored at normal room conditions
for a week before imaging. Both height and phase data were captured at image size of 1 × 1 μm
for all samples. For every sample, two sets of images were captured. For each uncrosslinked
conventional latex blend, nanolatex at six different concentrations (wt %), 0%, 15%, 30%, 50%,
140

70%, and 100%, were captured. For each pre-coalescence or post-coalescence crosslinked latex
blend, nanolatex at five different concentrations (wt %), 0%, 15%, 30%, 50%, and 100% were
captured.
Results and discussion
Theoretical considerations of film formation and properties by latex blends
A useful model of film formation by latexes involves three major, overlapping, stages.20,
24, 34-36 The third stage of film formation involves interdiffusion of polymer chains from different
latex particles. Interdiffusion knits vestigal particles together and is essential if the polymer film
is to realize the mechanical properties of which its composition is capable. Complete
interdiffusion is not necessary, however; it is only necessary for the molecules from adjacent
particles to interpenetrate to a distance comparable to the root-mean-square radius of gyration
(RG) of the individual molecules,34 typically a smaller distance than the diameters of the original
latex particles.
In this model, latexes with high Tg (above room temperature) are difficult to coalesce
and interdiffuse, thus resulting in poor film formation. On the other hand, low Tg (below room
temperature) latex polymers will easily interdiffuse resulting in better film formation but can not
provide sufficient hardness and will have poor block resistance. Many investigators described2, 5-
8, 11, 14, 18, 20 blending hard-soft and/or large-small particles latexes to achieve better film
formation with improved film properties. Winnik and Feng20 studied drying behavior of hard-
soft latex blends, their mechanical properties and effect of surfactant on drying process. The
group found that hard and soft latexes dried more slowly than the corresponding soft latexes
alone. They investigated the transparency of latex films as a function of soft phase and particle
diameter. They also reported that in the blend films, hard particles act as reinforcement fillers
141

and provide great improvement to the mechanical properties of films formed. Geurts et al.7
recently proposed a theoretical model for latex blend in which the hard polymer builds an
internal film structure along the edges of the particles of the soft polymer, wherein the soft
polymer forms a coherent film under ambient conditions, and the internal structure of the hard
polymeric material present in a limited amount provides the required hardness.
Schmidt et al.16 produced bimodal size blends of poly (styrene-co-butyl acrylate)
particles and claimed that the bimodal size latex produces film with superior luster due to the
improved packing efficiency of bimodal latex particles. Eckersley and Helmer5 demonstrated
that particle size ratio of soft/hard constituent latexes has a significant effect on end-use
properties and resulting morphology of latex blends. They reported that when Rsoft/Rhard >>1
(where R is the radius of the latex particle), the hard phase acts as reinforcing filler, thus
increasing bulk modulus of the film. Farris and Agarwal1 published a complete study of the
mechanical properties and morphology of acrylic latex blends. The results of the study showed
that phase inversion to a continuous hard matrix from the soft one occurs around 30-40% of
hard phase content. Tang et al.17 reported that compatibility between two polymer phases
distribution and packing behavior of dispersed hard particles in a continuous soft matrix, can
greatly affect resulting mechanical properties of latex blends. They showed that surface
modification of the hard phase can greatly influence the particle distribution in the continuous
phase, and dynamic mechanical properties of blends through the mechanism of glassy
interphase formation. Colombini et al.3, 4 thoroughly investigated viscoelastic properties and
morphology of latex blends. They reported that the mechanical behavior of latex blends is
governed by the mechanical properties of the neat constituents, the morphology, the interfacial
activity between the phases, and the effect of polymerization route on the amount of interphases
142

and blend composition. Xu et al.37 demonstrated that crosslinking could help produce cohesive
films of incompatible polymers. In general, the latex polymers used in most of the above studies
had particle sizes ranging from 40nm to 400 nm and contained no functional (crosslinkable or
crosslinked) group.
In this research, the large (~120 to 130 nm) and small (~ 20 to 25nm) particles are sized
so that the nanoparticles can fill the hollow spaces between the larger particles during the late
stages of particle coalescence and the early stages of interdiffusion assuming unimpeded
interdiffusion of polymer chains between latex particles.
Film formation by “pre-coalescence” and “post-coalescence” crosslinked latexes
Theoretical considerations of film formation by pre-coalescence and post-coalescence
crosslinked latexes have been extensively covered in Chapters 3 and 4 but are briefly included
here for completeness.
(a) Film formation by “pre-coalescence” crosslinked latexes:
Films were cast from the internally (pre-coalescence) crosslinked latexes by conventional
means. No coalescing solvent was used; film formation was accelerated by warming the films at
70°C overnight. Film thicknesses were about 50 μm. Theoretical considerations of film
formation by pre-coalescence crosslinked latexes have been studied extensively by Zosel and
Ley,38 Tamai et al.,39 Aradian et al.,40 and Ghazaly et al.41- 43 In Chapter 3 a systematic
comparison of pre-coalescence crosslinked latexes with varying levels of crosslinking monomers
was covered. It was demonstrated that with low levels (up to 2 wt%) of internal crosslinking,
latex films are able to coalesce to form good films. At higher levels (above 2 wt%) of 1,-
143

BGDMA, often the interdiffusion of polymeric particles is impeded by crosslinking, hence,
resulting in inferior film properties.
(b) Film formation by “post-coalescence” crosslinked latexes:
The DAA-containing latexes are combined with a stoichiometric amount of adipic
dihydrazide (ADDH) crosslinker. Then the films were cast under the same conditions as for
internally or pre-coalescence crosslinked latexes. Before the film was cast, premature reaction of
ADDH with the reactive sites in the latex was minimal.21-26, 44, 46 The crosslinking reaction for
the DAA monomer is shown below. The ADDH is water soluble, and almost all of it remains
separated from the reactive sites in the serum where it is. The relatively high (9–9.5) pH also
suppresses the reaction. When the film is cast, however, the water evaporates, forcing ADDH to
come in contact with the latex polymer surfaces when close packing of the latex particles has
occurred; ammonia evaporates, lowering the pH to about 6.5 and then crosslinking accelerates.44
Figure 5.2: crosslinking reaction for DAA monomer
144

After the film is cast, the crosslinking reaction is known to proceed at a useful rate at
room temperature. In this study the latex films were baked overnight at 70°C to assure a high
level of conversion before testing and to avoid the use of coalescing solvents. Among the factors
that will influence final properties of the films are the composition of the latexes, and the relative
rates of
• mixing of the crosslinker with the polymer,
• interdiffusion of the polymer molecules that originated in different latex particles,
• the chemical crosslinking reactions and diffusion of ADDH into the polymer,26 and
• T g of latex at a specific composition.
As demonstrated earlier,22, 23 to reach a high level of conversion the bake temperature
should be well above the Tg of the specific latex composition. In this study, this is true for the
low Tg latex (both pre-coalescence and post-coalescence crosslinked latexes). However, it may
be borderline for high Tg latex (both pre-coalescence and post-coalescence crosslinked latexes).
This was discussed in detail elsewhere.22, 23
If the rate of the crosslinking reaction is too fast relative to mixing and interdiffusion,
coalescence and interdiffusion will be slowed and perhaps retarded prematurely. The likely result
will be excessively non-uniform films and less than optimal film properties. Some researchers22-
26, 29, 44 report that the DAA/ADDH crosslinking combination has satisfactory relative rates and
good film properties can be attained.
Minimum film formation (MFT) crack point and knife point temperature, MDSC Tg:
MFT crack point [MFTc] and knife point [MFTk] of latex blends with different weight
ratios of nanolatex (with or without functional group) in conventional size functional latexes are
145

shown in Table 5.4. Table 5.5 shows the respective glass transition temperatures, Tg, of latex
blends measured using MDSC. For comparisons, their respective neat constituents, conventional
and nanoparticle latexes are included in each table.
Overall, for all latex blends samples, at different ratios of nano/conventional latexes,
similar trends are observed when comparing the results of MFTk, MFTc data and their respective
MDSC Tg. In general, when the Tg’s of the components were different, and the Tg’s of the films
fell in between. The data were not entirely linear; however, the blends displayed a modest
upward bias from linearity. The results from Tables 5.4(a), (b) and Table 5.5 showed that
increasing the levels of nanolatex in the blends – particularly at 15 wt% or more, in general,
showed a significant decrease in the crack point, knife point, and MDSC Tg temperatures. At 7.5
wt% of nanolatex in the blend, negligible effects are observed when compared to their
conventional size neat constituents.
When a low Tg non-crosslinked conventional latex (L0) is blended with a nanolatex,
either (a) with non-crosslinked (L0_nL0 blend) or (b) with 4% pre-coalescence crosslinker
(L0_nIL4 blend), a marginal decrease in crack point, knife point, and MDSC Tg is observed.
When a 2% post-coalescence crosslinked nanoparticle latex is blended with a non-crosslinked
conventional latex, L0_nEL2 blend, a significant decrease in the minimum film formation
temperatures and glass transition temperature was observed, particularly at or above 30 wt% of
nanolatex in the blend. As shown in tables below, L0: MFTc = 1.250C, MFTk = 11.90C, and
MDSC Tg is = 70C when compared to L0_nEL2: at 30% nEL2, MFTc = <0 0C, MFTk = 10.9
0C, and MDSC Tg = 4.95 0C.
146

When a low Tg pre-coalescence crosslinked latex was blended with a non-crosslinked
nanolatex, IL4_nL0 blend, a significant decrease in the MFTs and MDSC Tg was observed in
blends with 50 wt% or more nanolatex. In the case of low Tg post-coalescence crosslinked latex
when blended with a non-crosslinked nanolatex, EL5_nL0 blend, surprisingly negligible
differences were observed as a function of wt% nanolatex for MFT and most Tg values.
In the case of a high Tg conventional latex, crosslinked or non-crosslinked, when blended
with a low Tg nanoparticle latex, crosslinked or non-crosslinked, showed sharp decreases in
crack point, knife point, and MDSC Tg values, particularly at or above 15 wt% of nanolatex
present in the blends. For example, H0_nL0 at 0% nanolatex showed MFTc = 19.60C, MFTk =
220C that decreases to 16.850C at 15% nL0, 14.30C at 30% nL0, 12.10C at 50% nL0 and MFTc =
5.20C, MFTk = 9.70C at 70% nL0 present in the MFTk blend. Similarly, in case of EH5_nL0 at
0% nL0 the MFTc = 20.20C, MFTk = 27.4 0C, MDSC Tg = 29.7 0C; all continued to decrease at
increasing levels of nL0 in the blend. In fact, at 70% nL0 present: MFTc = 13.8 0C, MFTk = 19.7
0C, and MDSC Tg = 22.10C. From these results it can be speculated that the nanosize latexes
may facilitate the coalescence process in high Tg conventional size latex particles. This
speculation is supported by the fact that some nanoparticle latexes have molecules compressed
into volumes that are smaller than their normal RMS radius of gyration, a thermodynamically
uncomfortable situation, and coalescence gives the molecules an opportunity to gain their normal
dimensions, a thermodynamically favored transition. Earlier research by Fu et al. 45 and Ming et
al.30-33 support the speculation. Typically, in commercial practice, coalescing aids or plasticizers
are used to temporarily depress or reduce MFT of high Tg latexes. Use of nanosize latexes to
reduce MFT of high Tg latexes could potentially reduce or conceivably eliminate air-polluting
solvents from a typical latex paint formulation.
147

Table 5.4 (a): MFT crack point (MFTc) of latex blends:
% nano by wt. Latex blend sample
(conventional size latex_ nanosize latex) 0% 7.5% 15% 30% 50% 70% 100%
L0_nL0 1.25 ± 0.1
1.6 ± 0.2
0.55 ± 0.1
0.43 ± 0.1
0.46 ± 0.1
< 0 < 0
L0_nIL4 1.25 ± 0.1
1.5 ± 0.4
1.63 ± 0.5
1.48 ± 0.2
1.35 ± 0.1
<0 <0
L0_nEL2 1.25 ± 0.1
0.65 ± 0.1
0.25 ± 0.3
<0 <0 <0 <0
H0_nL0 19.6 ± 1.1
19.2 ± 0.6
16.85 ± 0.5
14.3 ± 0.9
12.1 ± 0.2
5.2 ± 0.3
<0
H0_nIL2 19.6 ± 1.1
19.3 ± 0.8
19.1 ± 0.3
14 ± 0.7 14.4 ± 0.1
8.9± 0.2 <0
H0_nEL5 19.6 ± 1.1
18.9 ± 0.9
17.6 ± 1.5
16.3 ± 0.5
14.6± 0.3
13.5± 0.8
<0
EL5_nL0 <0 <0 <0 <0 <0 <0 <0 IL4_nL0 6.8 ±
0.1 6.1± 0.3 5.7 ±
0.2 4.8± 0.4 4.2± 0.2 <0 <0
EH5_nL0 20.2 ± 1.3
19.4± 0.3
18.7 ± 0.7
19± 0.2 14.2± 0.5
13.8± 0.6
<0
IH4_nL0 29.3 ± 0.7
28.2± 0.7
26.4 ± 1.2
25.2± 0.8
24.5± 0.9
<0 <0
148

Table 5.4 (b): MFT knife point (MFTk) of latex blends:
% nano by wt. Latex blend sample
(conventional size latex_ nanosize latex) 0% 7.5% 15% 30% 50% 70% 100%
L0_nL0 11.9 ± 0.1
13.2 ± 0.3
13.6 ± 0.2
12.2± 0.2
12.8 ± 0.1
10.1 ± 0.3
9.7 ± 0.2
L0_nIL4 11.9 ± 0.1
11.6 ± 0.2
11.8 ± 0.6
11.3 ± 0.4
11.5 ± 0.3
10 ± 0.5 13.2 ± 0.1
L0_nEL2 11.9 ± 0.1
11.3 ± 0.3
11.75 ± 0.1
10.9 ± 0.5
8.93 ± 0.3
8.8 ± 0.2
7.33 ± 0.5
H0_nL0 22 ± 1 21.6 ± 0.3
19.3 ± 0.5
16.7 ± 0.3
14.5 ± 0.6
7.6 ± 0.3
9.7 ± 0.2
H0_nIL2 22 ± 1 21.7 ± 0.3
21.5 ± 0.6
16.4 ± 0.9
16.8 ± 0.8
11.3 ± 0.5
9.2 ± 0.1
H0_nEL5 22 ± 1 21.3 ± 0.9
23 ± 0.6 18.7 ± 0.4
17 ± 0.3 15.9 ± 0.2
10.1 ± 0.1
EL5_nL0 7.1 ± 0.1
8.5 ± 0.1
8.1 ± 1.4
7.9 ± 0.7
7.5 ± 0.6
8.8 ± 0.1
9.7 ± 0.2
IL4_nL0 14.6 ± 0.3
14.7 ± 0.1
13.7 ± 0.5
12.9 ± 0.9
12.5 ± 0.8
8.7 ± 0.3
9.7 ± 0.2
EH5_nL0 27.4 ± 0.7
24.4 ± 0.8
24.9 ± 0.4
24.1 ± 1.1
20.1 ± 0.6
19.7 ± 0.1
9.7 ± 0.2
IH4_nL0 > 33 32.2 ± 1.2
31.8 ± 2.4
28.3 ± 1.8
27.6 ± 1.7
11.5 ± 0.1
9.7 ± 0.2
Table 5.5. MDSC Tg of latex blends:
% nano by wt. Latex blend sample
(conventional size latex_ nanosize latex) 0% 7.5% 15% 30% 50% 70% 100%
L0_nL0 7.05 7.4 6.38 6.23 6.26 4.9 4.77 L0_nIL4 7.05 7.10 7.17 7.10 7.08 5.5 10.9 L0_nEL2 7.05 7.2 7.62 4.95 4.8 4.6 3.13 H0_nL0 26.3 25.9 23.5 21.0 18.8 11.9 4.77 H0_nIL2 26.3 26.1 25.7 20.8 21.2 15.7 4.67 H0_nEL5 26.3 25.7 24.5 23.1 21.4 20.3 5.15 EL5_nL0 11.6 10.5 10.1 9.9 9.77 4.7 4.77 IL4_nL0 14.6 12.8 11.62 11 10.8 4.7 4.77 EH5_nL0 29.7 26.7 25.8 26.5 22.5 22.1 4.77 IH4_nL0 33 32.8 31.9 29.8 29.1 4.11 4.77
149

150
End-use film properties
All the latex blends samples were cast on pre-treated aluminum panels and baked at 70
°C and 50% humidity for 8-10 hours and then stored at normal room conditions for a week
before testing. The goal of baking was to assure high coalescence and conversion before testing
and to avoid the complication of coalescing solvents. The end-use properties are listed in Tables
5.6-5.10. For comparison, their respective neat conventional latex and nanoparticle latexes are
included in the tables.

151
Table 5.6: Cross- cut Adhesion (ASTM D 3359) of latex blends:
L0_nL0 L0_nIL4 L0_nEL2 H0_nL0 H0_nIL2 H0_nEL5 EL5_nL0 IL4_nL0 EH5_nL0 IH4_nL0 0% 4B 4B 4B 4B 4B 4B 4B 3B 5B 3B
7.5% 5B 5B 5B 5B 5B 5B 5B 5B 5B 3B 15% 5B 5B 5B 5B 5B 5B 5B 5B 4B 1B 30% 5B 5B 5B 5B 5B 5B 5B 5B 5B 2B 50% 5B 5B 5B 5B 5B 5B 5B 5B 5B 4B 70% 5B 5B 5B 5B 5B 5B 5B 5B 5B 3B 100% 5B 5B 5B 5B 5B 5B 5B 5B 5B 5B
Table 5.7: Pencil Hardness (ASTM D 3363) of latex blends:
%nano by wt. Latex blend sample (conventional size latex_ nanosize latex) L0_nL0 L0_nIL4 L0_nEL2 H0_nL0 H0_nIL2 H0_nEL5 EL5_nL0 IL4_nL0 EH5_nL0 IH4_nL0
0% 4B 4B 4B 4B 4B 4B 2B 4B B 5B 7.5% 4B 3B 3B HB F F HB B H 2H 15% 2B HB B B HB HB B HB HB F 30% 2B HB B B HB B B F H B 50% 4B B B B B B B B H B 70% 4B B B B B B 3B 2B B 3B 100% 4B 4B 4B 4B 4B B 4B 4B 4B 4B
Table 5.8: Solvent Resistance (MEK 2 Rub) of latex blends:
%nano by wt. Latex blend sample (conventional size latex_ nanosize latex) L0_nL0 L0_nIL4 L0_nEL2 H0_nL0 H0_nIL2 H0_nEL5 EL5_nL0 IL4_nL0 EH5_nL0 IH4_nL0
0% 5 5 5 7 7 7 83 6 106 4 7.5% 6 12 15 9 13 16 112 12 120 10 15% 5 12 24 10 12 20 110 10 125 12 30% 6 30 25 16 13 18 113 10 115 10 50% 6 10 22 20 15 20 100 13 110 12 70% 7 10 20 18 12 15 70 8 75 14 100% 15 20 75 15 17 100 15 15 15 15

152
Table 5.9: Elevated Temperature Block Resistance (ASTM D 4946) of latex blends:
%nano by wt. Latex blend sample (conventional size latex_ nanosize latex) L0_nL0 L0_nIL4 L0_nEL2 H0_nL0 H0_nIL2 H0_nEL5 EL5_nL0 IL4_nL0 EH5_nL0 IH4_nL0
0% 3 ± 1 3 ± 1 3 ± 1 9 9 9 9 ± 1 4 ± 1 9 9 7.5% 9 8 9 10 10 10 10 9 10 10 15% 3 ± 1 5 ± 1 8 ± 1 10 9 10 9 5 ± 1 9 9 30% 6 ± 1 4 ± 1 7 ± 1 9 9 9 9 4 ± 1 10 9 50% 4 ± 1 5 6 ± 1 8 ± 1 9 ± 1 9 10 5 ± 1 10 10 70% 4 ± 1 5 ± 1 6 7 ± 1 8 8 9 ± 1 5 ± 1 9 9 100% 3 ± 1 2 ± 1 1 3 ± 1 1 4 ± 1 3 ± 1 3 ± 1 3 ± 1 3 ± 1
Table 5.10: Acid - Open Spot Test (ASTM D 1308) of latex blends:
%nano by wt.
Latex blend sample (conventional size latex_ nanosize latex)
L0_nL0 L0_nIL4 L0_nEL2 H0_nL0 H0_nIL2 H0_nEL5 EL5_nL0 IL4_nL0 EH5_nL0 IH4_nL0 15
min. 1
hr. 16 hr.
15 min.
1 hr.
16 hr.
15 min.
1 hr.
16 hr.
15 min.
1 hr.
16 hr.
15 min.
1 hr.
16 hr.
15 min.
1 hr.
16 hr.
15 min.
1 hr.
16 hr.
15 min.
1 hr.
16 hr.
15 min.
1 hr.
16 hr.
15 min.
1 hr.
16 hr.
0 E E F E E F E E F E G F E G F E G F E E G E G F E G F E G P 7.5% E E G E E E E E E E E E E G G E E G E E E E G E E G F E G G 15% E E G E E E E E E E E E E E E E E E E E G E E E G G F E G G 30% E G E G G G E E E E E E G G G G E F E G G E E E E E G G G G 50% E G E G G G E E E E E E G G F E E G E E G E E E E E E E G G 70% E G E G G G E G G E G E G F P E E G E E G E G G E G E E G E 100% E G E G G G E G G E G E G F P E E E E G E E G E E G E E G E E: Excellent, no change; G: Good, slightly white, but recovered quickly; F: Fair, whitening, becomes transparent after 24 hours; P: Poor, permanent damage.

153
Table 5.11: Water - Open Spot Test (ASTM D 1308) of latex blends:
%nano by wt.
Latex blend sample (conventional size latex_ nanosize latex)
L0_nL0 L0_nIL4 L0_nEL2 H0_nL0 H0_nIL2 H0_nEL5 EL5_nL0 IL4_nL0 EH5_nL0 IH4_nL0 15
min. 1
hr. 16 hr.
15 min.
1 hr.
16 hr.
15 min.
1 hr.
16 hr.
15 min.
1 hr.
16 hr.
15 min.
1 hr.
16 hr.
15 min.
1 hr.
16 hr.
15 min.
1 hr.
16 hr.
15 min.
1 hr.
16 hr.
15 min.
1 hr.
16 hr.
15 min.
1 hr.
16 hr.
0 E E G E E G E E G E E G E E G E E G E E E E E F E G G E E P 7.5% E E E E E G E E G E E G E E G E E G E E E E E G E G G E E G 15% E E E E E E E E G E G F E E G E E F E E E E E E E G G E G G 30% E E E G E E E G G E G F E G G G E E E G E E E E E G G E E G 50% E E E E E E E G G E G G E E F G E F E E E E E E E G G E E G 70% G G G G G G E G G G F F G E F G G F G G G G G G G F F G G G 100% F F F F F P E F F F F F G E P G F F F F F F F F F F F F F F E: Excellent, no change; G: Good, slightly white, but recovered quickly; F: Fair, whitening, becomes transparent after 24 hours; P: Poor, permanent damage.
Table 5.12: Specular Gloss (ASTM D 523) of latex blends:
Specular Gloss test results (ASTM D 523) %nano by wt.
Latex blend sample (conventional size latex_ nanosize latex)
L0_nL0 L0_nIL4 L0_nEL2 H0_nL0 H0_nIL2 H0_nEL5 EL5_nL0 IL4_nL0 EH5_nL0 IH4_nL0 20o 60o 20o 60o 20o 60o 20o 60o 20o 60o 20o 60o 20o 60o 20o 60o 20o 60o 20o 60o
0% 18.1 ± 2.1
38.9 ± 5.1
18.1 ± 2.1
38.9 ± 5.1
18.1 ± 2.1
38.9 ± 5.1
19.2 ± 1.3
34.6 ± 1.3
19.2 ± 1.3
34.6 ± 1.3
19.2 ± 1.3
34.6 ± 1.3
19.1 ± 1.6
36.7 ± 3.8
11.6 ± 1.6
32.4 ± 2.9
23.2 ± 5.6
50.1 ± 2.3
19 ± 0.3
37.8 ± 2.3
7.5% 14.7 ± 0.1
50.6 ± 1.6
15.3 ± 0.9
50 ± 1.2
14.3 ± 0.6
53.4 ± 0.2
49.3 ± 1.6
77.5 ± 1.3
58.6 ± 1.2
81.8 ± 0.1
61.3 ± 0.4
81.1 ± 0.3
24.2 ± 5.1
56.3 ± 7.3
14.4 ± 2.8
53.7 ± 6
43.6 ± 2.9
73.3 ± 7.5
14.5 ± 1.9
50.2 ± 0.2
15% 38.7 ± 3.4
72.5 ± 1.6
35.4 ± 0.6
76 ± 1.8
46.1 ± 2.6
68.1 ± 7.1
73.2 ± 1.6
92.7 ± 2.9
59.8 ± 2.4
80.1 ± 2
73.2 ± 2.3
97.1 ± 3.1
42.7 ± 2.3
70 ± 2.1
47.6 ± 3.3
65.8 ± 3.1
68.2 ± 2.7
82.2 ± 2.6
41.7 ± 0.6
73.5 ± 0.9
30% 42.6 ± 4.3
68.8 ± 4.5
48.2 ± 0.3
73.2 ± 2.3
47.2 ± 5.6
76.3 ± 2.9
57.8 ± 2.4
80.4 ± 0.8
41.8 ± 1.8
74.6 ± 4
58.6 ± 3.8
84.2 ± 2.6
52.6 ± 4
78.6 ± 2.6
48.8 ± 0.8
70.6 ± 3.4
54.8 ± 2.2
78.2 ± 1.6
49.6 ± 2.8
80.5 ± 3
50% 15.2 ± 2.9
46.6 ± 3
38.1 ± 6
73.3 ± 4
36.5 ± 1.1
77.7 ± 2
64.6 ± 1.4
86.1 ± 2.3
46.8 ± 0.9
77.9 ± 0.1
64.8 ± 2
88.2 ± 2.4
48.8 ± 1.3
82.5 ± 0.5
40.6 ± 0.5
78.3 ± 2.5
46.7 ± 3.4
80.4 ± 1.8
54.8 ± 2.6
87.6 ± 2
70% 15.6 ± 0.3
45.8 ± 2.1
42.5 ± 4.2
71.5 ± 2.8
38.4 ± 6.2
73.2 ± 3.9
27.5 ± 0.1
67.5 ± 0.3
40.3 ± 0.7
79.1 ± 0.4
35.3 ± 0.1
75.8 ± 0.4
45.7 ± 2.6
79.4 ± 0.9
31.8 ± 2.6
74.5 ± 3.6
31.7 ± 1
71 ± 1.6
44.6 ± 2.4
71.6 ± 2.9
100% 49.3 ± 7.9
79.4 ± 5.6
39.3 ± 3.9
87.6 ± 2.6
50.9 ± 3.6
77.9 ± 1
49.3 ± 7.9
79.4 ± 5.6
40.3 ± 4.1
85.8 ± 0.8
52.2 ± 6.7
86.2 ± 2.6
49.3 ± 7.9
79.4 ± 5.6
49.3 ± 7.9
79.4 ± 5.6
49.3 ± 7.9
79.4 ± 5.6
49.3 ± 7.9
79.4 ± 5.6

Table 5.6 shows crosscut adhesion test results for all latex blends samples with different
concentration ranges. The results indicate that in general the addition of nanosize latexes
increases the tape adhesion to aluminum 4B (good) to 5B (excellent, the highest rating in this
test). For nine of the ten blends, adhesion of all films containing nanoparticles was 5B. The
exceptions were films that included a highly crosslinked (pre-coalescence; e.g., IH4) latex.
However, the very crude nature of the crosscut adhesion test (ASTM) does not allow an
assessment of how much adhesion was improved. The difference between 4B (good) and 5B
(the top rating) can be modest or large. Further, the data can be rationalized on the basis that
nanoparticles are much better able to conform to irregularities in the substrate surface than
conventional latex particles, especially when the nanoparticles have Tg’s below the film
formation conditions.
The pencil hardness results are shown in Table 5.7 for all latex blend series with different
concentrations of nanoparticle latexes. In general the pencil hardness grade improves,
particularly at 7.5 to 30 % by wt. of nanoparticle polymers. The pencil hardness values do
correlate to some degree with Tg, but more strongly to the level of nanoparticles (or particle
packing) and secondly, to the degree of crosslinking (or degree of chain entanglement between
the particles) in the film brought about by crosslinking either in the conventional or nanoparticles
latexes. See Table 5.7 for values of pencil hardness of H, 2H, and HB, which generally optimizes
at 7.5%, 15% and 30% concentration of nanoparticles. The effect of crosslinking and Tg on
pencil hardness is strongly seen in EH5_nL0 concentrations. To give another example: the
blended film with 15% post-coalescence crosslinked nanolatex (H0_nEL5, 15%) was superior to
films cast from 100% post-coalescence cross-linked conventional latex (EL5) with no
nanoparticles. MDSC Tg’s of the films in Table 5.5 were 24.5 oC (H0_nEL5, 15%) and 11.6 oC
154

(EL5, 100%). The blended film was significantly superior in tensile properties and in pencil
hardness. This result is appealing because it achieves superior film properties with an 85%
reduction of the amount of crosslinker required in conventional technology. It should also be
noted here that in general, properties of coatings depend on both the bulk properties of film and
its surface, and near-surface, properties. To give an example, pencil hardness depends upon
compressive strength and tear strength of the bulk material and often on adhesion to the substrate
and on slipperiness of the outer surface.
The solvent resistance (MEK 2 rubs) test results are shown in Table 5.8. In general, it is
noteworthy that the solvent resistance of the all-thermoplastic blends improved modestly, again
suggesting that the nanoparticles are able to improve the coalescence and interpenetration of the
polymer molecules during film formation, independent of crosslinking. However, the auxiliary
effect of crosslinking on solvent resistance (MEK 2 rubs) was most strongly seen in EL5_nL0
(low Tg blends) and EH5_nL0 (high Tg blends) as well as in 100% nanoparticle nEL5 and nEL2
films. This improvement in properties is due to chain entanglement and interdiffusion between
particles due to external crosslinking. Interestingly the modest level of nanoparticle addition
improves MEK rubs even where there is no crosslinking, such as H0_nL0 series or at the modest
levels of total crosslinking for example H0_nEL5. In both of these cases, the Tg of the mixture is
high, around 20+. This factor in addition to the packing affects the crosslinking.
Table 5.9 shows elevated temperature block resistance values of the latex blends. In
general, the block resistance correlates primarily to the blend Tg (high), secondarily to
crosslinking in the nanoparticle or conventional latex particle, and thirdly to particle packing in
the blend at some specific nanoparticle composition. This last point with respect to particle
packing is illustrated by IL4_nL0 (7.5%); and L0_nL0, L0_nIL4, at 7.5%. The most unusual
155

result was for L0_nEL2 series of blends at up to 70% of nEL2 addition. The highest block
number is at 7.5%, L0_nEL2 (9 - excellent) and the second highest block number is at 15% of
nEL2 in latex blend (8 - very good) when compared to 100% L0 (block number rating 3 – poor).
Typically the block resistance of low Tg latexes is poor. This is one of the reasons why low Tg
latexes are blended with high Tg latexes. This is not the case here. The unusually high block
ratings of the L0_nEL2 blend series produce an unexpected result. One explanation could be
based on the percolation theory as explained by Eckersley and Helmer.5 They demonstrated that
high particle size ratio of constituent latexes has a significant effect on block resistance and other
end-use properties of latex blend. This could also be happening in this case since the large
particle size latexes are ~ 120nm vs. nanosize latexes are ~ 20-25nm, a size ratio of 5 to 6. Also,
homogeneous distribution of functional group across the polymer particle and effect of extra
surfactant from nanoparticle, conceivably thermodynamic effect of allowing constrained
molecules in nanoparticles to extend to RMS dimensions can play significant role in improving
final properties of the latex blends.
Table 5.12 shows 200 and 600 specular gloss values of the latex blends. In general, the
gloss values (200 and 600) tend to optimize at 15 and 30% concentration of nanoparticles when
compared to the 0% nanoparticle composition, which in many cases is close to values obtained at
100% nanoparticles, which ideally should provide the optimum gloss levels because of particle
packing in the nanosize regime. Thus the 15 to 30% concentration range is more or less
equivalent to gloss achieved at 100% nanoparticles. It is clear that inclusion of nanoparticles
increases specular gloss at 20o and 60o. The increase in gloss is noteworthy because it overcomes
a long-standing limitation of conventional latexes, their inability to form films with high gloss.
156

157
Futher, the increase in the specular gloss can be explained on the basis that nanoparticles tend to
populate the surface as the films form, making the surfaces smoother.
To verify this explanation, atomic force microscopy (AFM) images of the films were
taken. The results were mixed. Often the images gave a clear visual impression of smoother
films with nanoparticles, but not always. The AFM micrographs are shown in Figures 5.2-5.12,
for each latex blend with different concentrations of nanolatex. Perusal of these images suggests
a correlation between visual impression and measured gloss, although the correlation is
imperfect. Note that the smoothest appearing image (disregarding the artifacts) is the 85/15
blend, which has the highest gloss. However, it is difficult to explain why the films with higher
nanoparticle levels appear rougher and had lower gloss.
The atomic force microscope’s software includes a program that enables calculation of
average roughness (Ra) of the surface. This calculation was performed for all specimens.
Examples of the outcomes are shown in Figures 5.13-5.23. In these figures, the reciprocal of Ra
(termed average “relative surface smoothness”) is plotted along with the gloss readings at 20o
and 60o against % of nanoparticles by weight. The results show reasonably good correlation. In
other cases the correlation is usually similar, but sometimes not as good. Overall, nanolatex at
15% concentration showed the highest gloss and smoothness that correlated well with the visuals
of the images from AFM.

Figure 5.3. L0_nL0 (from left to right - nanolatex concentration: 0%, 15%, 30%, 50%, 70%, and 100%):
Figure 5.4. L0_nIL4 (from left to right - nanolatex concentration: 0%, 15%, 30%, 50%, 70%, and 100%):
Figure 5.5. L0_nEL2 (from left to right - nanolatex concentration: 0%, 15%, 30%, 50%, 70%, and 100%):
Figure 5.6. H0_nL0 (from left to right - nanolatex concentration: 0%, 15%, 30%, 50%, 70%, and 100%):
158

Figure 5.7. H0_nIL2 (from left to right - nanolatex concentration: 0%, 15%, 30%, 50%, 70%, and 100%):
Figure 5.8. H0_nEL5 (from left to right - nanolatex concentration: 0%, 15%, 30%, 50%, 70%, and 100%):
Figure 5.9. EL5_nL0 (from left to right - nanolatex concentration: 0%, 15%, 30%, 50%, 70%, and 100%):
Figure 5.10. IL4_nL0 (from left to right - nanolatex concentration: 0%, 15%, 30%, 50%, 70%, and 100%):
159

160
Figure 5.11. EH5_nL0 (from left to right - nanolatex concentration: 0%, 15%, 30%, 50%, 70%, and 100%):
Figure 5.12. IH4_nL0 (from left to right - nanolatex concentration: 0%, 15%, 30%, 50%, 70%, and 100%):

L0_nL0 seriesASTM D523 Specular gloss @ 20/60 vs. 1/Ra AFM relative
surface smoothness (in 1/nm)
0
10
20
30
40
50
60
70
80
90
0 15 30 50 100
% nano by wt.
Spec
ular
Glo
ss
0
0.5
1
1.5
2
2.5
AFM
rela
tive
surfa
ce
smoo
thne
ss 1
/Ra
(1/n
m)
Avg. Specular Gloss @ 20 deg.Avg. Specular Gloss @ 60 deg.AFM relative surface smoothness 1/Ra (1/nm)
Figure 5.13. Plots of relative average surface smoothness and specular gloss at 20o and 60o vs. % nanoparticles by weight. (L0_nL0 series)
L0_nIL4 seriesASTM D523 Specular gloss @ 20/60 vs. 1/Ra AFM relative
surface smoothness (in 1/nm)
0
10
20
30
40
50
60
70
80
90
100
0 15 30 50 70 100
% nano by wt.
Spec
ular
Glo
ss
0
0.5
1
1.5
2
2.5
AFM
rela
tive
surfa
ce
smoo
thne
ss 1
/Ra
(1/n
m)
Avg. Specular Gloss @ 20 deg.Avg. Specular Gloss @ 60 deg.AFM relative surface smoothness 1/Ra (1/nm)
Figure 5.14. Plots of relative average surface smoothness and specular gloss at 20o and 60o vs. % nanoparticles by weight. (L0_nIL4 series)
161

L0_nEL2 seriesASTM D523 Specular gloss @ 20/60 vs. 1/Ra AFM relative
surface smoothness (in 1/nm)
0
10
20
30
40
50
60
70
80
90
0 15 30 50 70 100
% nano by wt.
Spec
ular
Glo
ss
0
0.5
1
1.5
2
2.5
AFM
rela
tive
surfa
ce
smoo
thne
ss 1
/Ra
(1/n
m)
Avg. Specular Gloss @ 20 deg.Avg. Specular Gloss @ 60 deg.AFM relative surface smoothness 1/Ra (1/nm)
Figure 5.15. Plots of relative average surface smoothness and specular gloss at 20o and 60o vs. % nanoparticles by weight. (L0_nEL2 series)
H0_nL0 seriesASTM D523 Specular gloss @ 20/60 vs. 1/Ra AFM relative
surface smoothness (in 1/nm)
0
10
20
30
40
50
60
70
80
90
100
0 15 30 50 70 100
% nano by wt.
Spec
ular
Glo
ss
0
0.5
1
1.5
2
2.5
3
3.5
4
4.5
5
AFM
rela
tive
surfa
ce
smoo
thne
ss 1
/Ra
(1/n
m)
Avg.Specular Gloss @ 20 deg.Avg. Specular Gloss @ 60 deg.AFM relative surface smoothness 1/Ra (1/nm)
Figure 5.16. Plots of relative average surface smoothness and specular gloss at 20o and 60o vs. % nanoparticles by weight. (H0_nL0 series)
162

H0_nIL2 seriesASTM D523 Specular gloss @ 20/60 vs. 1/Ra AFM relative
surface smoothness (in 1/nm)
0
10
20
30
40
50
60
70
80
90
100
0 15 30 50 70 100
% nano by wt.
Spec
ular
Glo
ss
0
0.5
1
1.5
2
2.5
3
3.5
AFM
rela
tive
surfa
ce
smoo
thne
ss 1
/Ra
(1/n
m)
Avg. Specular Gloss @ 20 deg.Avg. Specular Gloss @ 60 deg.AFM relative surface smoothness 1/Ra (1/nm)
Figure 5.17. Plots of relative average surface smoothness and specular gloss at 20o and 60o vs. % nanoparticles by weight. (H0_nIL2 series)
H0_nEL5 seriesASTM D523 Specular gloss @ 20/60 vs. 1/Ra AFM relative
surface smoothness (in 1/nm)
0
20
40
60
80
100
120
0 15 30 50 70 100
% nano by wt.
Spec
ular
Glo
ss
0
0.5
1
1.5
2
2.5
3
3.5
4
4.5
AFM
rela
tive
surfa
ce
smoo
thne
ss 1
/Ra
(1/n
m)
Avg. Specular Gloss @ 20 deg.Avg. Specular Gloss @ 60 deg.AFM relative surface smoothness 1/Ra (1/nm)
Figure 5.18. Plots of relative average surface smoothness and specular gloss at 20o and 60o vs. % nanoparticles by weight. (H0_nEL5 series)
163

EL5_nL0 seriesASTM D523 Specular gloss @ 20/60 vs. 1/Ra AFM relative
surface smoothness (in 1/nm)
0
10
20
30
40
50
60
70
80
90
0 15 30 50 100
% nano by wt.
Spec
ular
Glo
ss
0
0.5
1
1.5
2
2.5
3
AFM
rela
tive
surfa
ce
smoo
thne
ss 1
/Ra
(1/n
m)
Avg. Specular Gloss @ 20 deg.
Avg. Specular Gloss @ 60 deg.
AFM relative surface smoothness 1/Ra (1/nm)
Figure 5.19. Plots of relative average surface smoothness and specular gloss at 20o and 60o vs. % nanoparticles by weight. (EL5_nIL0 series)
EH5_nL0 seriesASTM D523 Specular gloss @ 20/60 vs. 1/Ra AFM relative
surface smoothness (in 1/nm)
0
10
20
30
40
50
60
70
80
90
0 15 30 50 100
% nano by wt.
Spec
ular
Glo
ss
0
0.5
1
1.5
2
2.5
3
3.5
4
AFM
rela
tive
surfa
ce
smoo
thne
ss 1
/Ra
(1/n
m)
Avg. Specular Gloss @ 20 deg.
Avg. Specular Gloss @ 60 deg.
AFM relative surface smoothness 1/Ra (1/nm)
Figure 5.20. Plots of relative average surface smoothness and specular gloss at 20o and 60o vs. % nanoparticles by weight. (EH5_nIL0 series)
164

IL4_nL0 seriesASTM D523 Specular gloss @ 20/60 vs. 1/Ra AFM relative
surface smoothness (in 1/nm)
0
10
20
30
40
50
60
70
80
90
0 15 30 50 100
% nano by wt.
Spec
ular
Glo
ss
0
0.5
1
1.5
2
2.5
3
AFM
rela
tive
surfa
ce
smoo
thne
ss 1
/Ra
(1/n
m)
Avg. Specular Gloss @ 20 deg.
Avg. Specular Gloss @ 60 deg.
AFM relative surface smoothness 1/Ra (1/nm)
Figure 5.21. Plots of relative average surface smoothness and specular gloss at 20o and 60o vs. % nanoparticles by weight. (IL4_nIL0 series)
IH4_nL0 seriesASTM D523 Specular gloss @ 20/60 vs. 1/Ra AFM relative
surface smoothness (in 1/nm)
0
10
20
30
40
50
60
70
80
90
100
0 15 30 50 100
% nano by wt.
Spec
ular
Glo
ss
0
0.5
1
1.5
2
2.5
3
3.5
AFM
rela
tive
surfa
ce
smoo
thne
ss 1
/Ra
(1/n
m)
Avg. Specular Gloss @ 20 deg.
Avg. Specular Gloss @ 60 deg.
AFM relative surface smoothness 1/Ra (1/nm)
Figure 5.22. Plots of relative average surface smoothness and specular gloss at 20o and 60o vs. % nanoparticles by weight. (IH4_nIL0 series)
165

Overall, correlating all the above figures and data clearly indicates that nanoparticles tend
to populate the outer surface of the film, increasing gloss, and the film substrate interface,
improving adhesion. As Provder et al.46 pointed out, the AFM analysis clearly suggests that the
packing model theory would be applicable to the bulk of the film; however, at the very surface of
the film, which is seen by AFM, the morphology could be different. In this case, auto-
stratification could also be occurring with an excess of nanoparticles at the surface compared
to the bulk film. These observations are consistent with Leary et al.’s (ICI Paints, Australia)
research6, 11, 14 that demonstrated that such auto-stratification can occur in a bimodal population if
the ratio of modes (large diameter to small diameter) was on the order of
5 or so. Indeed, the candidates presented in this research showed a size ratio of 5 to 6 (large
particle size latexes are ~ 120nm vs. nanosize latexes are ~ 20-25nm).
Table 5.13: Formulation matrix based on end-use properties results
Latex blend Properties improve up to (concentration of nano by
wt.)
Best properties at (concentration of nano by
wt.) L0_nL0 30% by wt. of nano At 15, 30 wt.% nano L0_nIL4 70% by wt. of nano At 15, 30 wt.% nano L0_nEL2 70% by wt. of nano At 15, 30 wt.% nano
H0_nL0 70% by wt. of nano At 15, 50 wt.% nano H0_nIL2 70% by wt. of nano At 15, 50 wt.% nano H0_nEL5 70% by wt. of nano At 15, 50 wt.% nano
IL4_nL0 50% by wt. of nano At 15, 30 wt.% nano EL5_nL0 50% by wt. of nano At 30 wt.% nano EH5_nL0 50% by wt. of nano At 15 wt.% nano IH4_nL0 50% by wt. of nano At 50 wt.% nano
Table 5.13 provides a quick general summary of (a) at what concentration of nanolatex
the properties improve and (b) which is the best concentration of nanolatex that provides the best
properties in general. This table serves as a fundamental matrix or aid for a coatings formulator
166
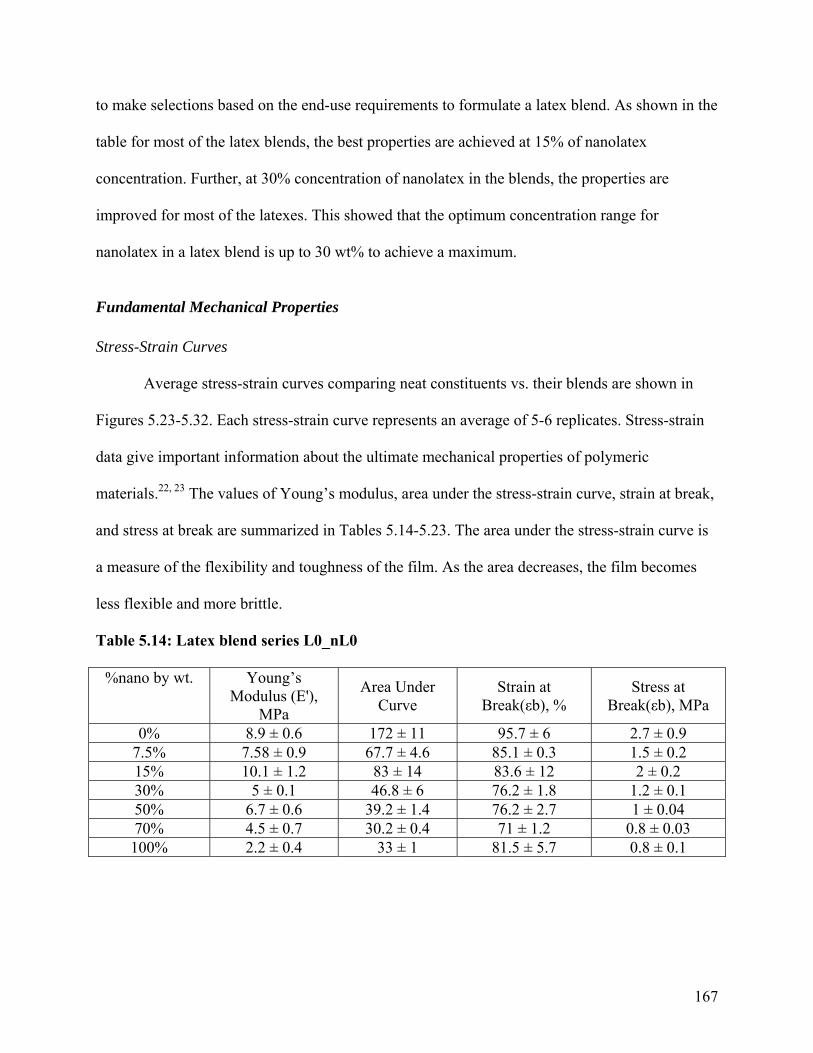
to make selections based on the end-use requirements to formulate a latex blend. As shown in the
table for most of the latex blends, the best properties are achieved at 15% of nanolatex
concentration. Further, at 30% concentration of nanolatex in the blends, the properties are
improved for most of the latexes. This showed that the optimum concentration range for
nanolatex in a latex blend is up to 30 wt% to achieve a maximum.
Fundamental Mechanical Properties Stress-Strain Curves
Average stress-strain curves comparing neat constituents vs. their blends are shown in
Figures 5.23-5.32. Each stress-strain curve represents an average of 5-6 replicates. Stress-strain
data give important information about the ultimate mechanical properties of polymeric
materials.22, 23 The values of Young’s modulus, area under the stress-strain curve, strain at break,
and stress at break are summarized in Tables 5.14-5.23. The area under the stress-strain curve is
a measure of the flexibility and toughness of the film. As the area decreases, the film becomes
less flexible and more brittle.
Table 5.14: Latex blend series L0_nL0
%nano by wt. Young’s Modulus (E'),
MPa
Area Under Curve
Strain at Break(εb), %
Stress at Break(εb), MPa
0% 8.9 ± 0.6 172 ± 11 95.7 ± 6 2.7 ± 0.9 7.5% 7.58 ± 0.9 67.7 ± 4.6 85.1 ± 0.3 1.5 ± 0.2 15% 10.1 ± 1.2 83 ± 14 83.6 ± 12 2 ± 0.2 30% 5 ± 0.1 46.8 ± 6 76.2 ± 1.8 1.2 ± 0.1 50% 6.7 ± 0.6 39.2 ± 1.4 76.2 ± 2.7 1 ± 0.04 70% 4.5 ± 0.7 30.2 ± 0.4 71 ± 1.2 0.8 ± 0.03 100% 2.2 ± 0.4 33 ± 1 81.5 ± 5.7 0.8 ± 0.1
167

Table 5.15: Latex blend series L0_nIL4
%nano by wt. Young’s Modulus (E'),
MPa
Area Under Curve
Strain at Break(εb), %
Stress at Break(εb), MPa
0% 8.9 ± 0.6 172 ± 11 95.7 ± 6 2.7 ± 0.9 7.5% 5.4 ± 1.2 49.6 ± 9.1 68.8 ± 6.2 1.31 ± 0.1 15% 9.7 ± 0.2 72.9 ± 8.8 78.5 ± 3.8 1.9 ± 0.2 30% 4.9 ± 1.1 57.5 ± 6.6 83.3 ± 8.3 1.3 ± 0.1 50% 5.5 ± 0.1 47.2 ± 2.5 77.9 ± 2.6 1.1 ± 0.1 70% 8.9 ± 0.8 51.5 ± 8.3 85.6 ± 8.5 1.2 ± 0.1 100% 5 ± 1.3 52.9 ± 5.9 88.5 ± 3.5 1.2 ± 0.1
Table 5.16: Latex blend series L0_nEL2
%nano by wt. Young’s Modulus (E'),
MPa
Area Under Curve
Strain at Break(εb), %
Stress at Break(εb), MPa
0% 8.9 ± 0.6 172 ± 11 95.7 ± 6 2.7 ± 0.9 7.5% 7.3 ± 1.7 56.6 ± 9.8 75.9 ± 2.3 1.43 ± 0.1 15% 10.2 ± 2 154 ± 27 94 ± 6.3 3.13 ± 0.2 30% 6.4 ± 1.2 60.7 ± 1.2 81 ± 4.3 1.42 ± 0.1 50% 6.81 ± 1.4 53.5 ± 3.7 79.3 ± 7.9 1.31 ± 0.1 70% 4.3 ± 1.1 75.1 ± 7.5 93.9 ± 3.4 1.6 ± 0.1 100% 4.1 ± 0.1 71.8 ± 4.3 94.8 ± 4.3 1.5 ± 0.1
Table 5.17: Latex blend series H0_nL0
%nano by wt. Young’s Modulus (E'),
MPa
Area Under Curve
Strain at Break(εb), %
Stress at Break(εb), MPa
0% 15.9 ± 1.1 175 ± 2.8 98.8 ± 0.1 3.55 ± 0.1 7.5% 46.1 ± 3.2 177.8 ± 11 79.1 ± 7.8 4.6 ± 0.1 15% 149 ± 45.4 528 ± 95 78 ± 7.7 13.9 ± 0.6 30% 66.9 ± 15 201.4 ± 4 81.1 ± 0.4 4 ± 0.1 50% 38 ± 21 125 ± 15 80.9 ± 1.8 3.1 ± 0.1 70% 44 ± 9 117 ± 23 77.8 ± 2.2 2.9 ± 0.2 100% 2.2 ± 0.4 33 ± 1 81.5 ± 5.7 0.8 ± 0.1
168

Table 5.18: Latex blend series H0_nIL2
%nano by wt. Young’s Modulus (E'),
MPa
Area Under Curve
Strain at Break(εb), %
Stress at Break(εb), MPa
0% 15.9 ± 1.1 175 ± 2.8 98.8 ± 0.1 3.55 ± 0.1 7.5% 89 ± 30 198 ± 11 89 ± 4.3 4.5 ± 0.4 15% 194 ± 4.9 530 ± 101 81 ± 11 12.7 ± 0.3 30% 31.6 ± 3 124 ± 6 81 ± 2 3 ± 0.2 50% 19.1 ± 0.7 107 ± 5 83 ± 2.1 2.6 ± 0.1 70% 36.3 ± 8 94.2 ± 2.8 84.8 ± 3.3 2.2 ± 0.1 100% 6.4 ± 0.8 40.1 ± 15 86.4 ± 12 0.9 ± 0.2
Table 5.19: Latex blend series H0_nEL5
%nano by wt. Young’s Modulus (E'),
MPa
Area Under Curve
Strain at Break(εb), %
Stress at Break(εb), MPa
0% 15.9 ± 1.1 175 ± 2.8 98.8 ± 0.1 3.55 ± 0.1 7.5% 81.8 ± 12 189 ± 12 91 ± 2.3 4.13 ± 0.1 15% 206 ± 1 983 ± 175 85.2 ± 2.4 23.4 ± 2 30% 53.3 ± 5.2 183 ± 8.9 91 ± 3.2 3.9 ± 0.1 50% 33.4 ± 3.3 151 ± 11 88.1 ± 2.1 3.5 ± 0.1 70% 25.6 ± 12 133 ± 19 85 ± 2.2 3.1 ± 0.2 100% 11.4 ± 0.2 151 ± 20 78 ± 3.5 3.9 ± 0.2
Table 5.20: Latex blend series EL5_nL0
%nano by wt. Young’s Modulus (E'),
MPa
Area Under Curve
Strain at Break(εb), %
Stress at Break(εb), MPa
0% 45.3 ± 9.2 196.5 ± 11 41.8 ± 0.7 9.5 ± 0.5 7.5% 36.6 ± 0.1 149 ± 34 68 ± 5.4 4.4 ± 0.7 15% 94.7 ± 26 541 ± 12 71.6 ± 6.2 15.4 ± 1.8 30% 47.4 ± 4 160 ± 11 65.4 ± 0.3 5 ± 0.4 50% 24.9 ± 10 156 ± 25 69.8 ± 5.5 4.4 ± 0.3 70% 25.3 ± 0.5 118 ± 27 79.8 ± 3.4 2.9 ± 0.6 100% 2.2 ± 0.4 33 ± 1 81.5 ± 5.7 0.8 ± 0.1
169

Table 5.21: Latex blend series IL4_nL0
%nano by wt. Young’s Modulus (E'),
MPa
Area Under Curve
Strain at Break(εb), %
Stress at Break(εb), MPa
0% 49.7 ± 9.2 222 ± 6.3 57.9 ± 1.2 7.7 ± 0.5 7.5% 14.2 ± 3.1 83 ± 9.3 87.5 ± 5 1.9 ± 0.1 15% 29.8 ± 0.7 239 ± 7.7 95.5 ± 3.4 5 ± 0.2 30% 14.2 ± 0.1 87.2 ± 3.9 87.2 ± 2 1.94 ± 0.2 50% 13.7 ± 1.1 75.5 ± 1.7 84 ± 1.2 1.7 ± 0.1 70% 9.6 ± 2.5 55.4 ± 11 73 ± 10 1.5 ± 0.1 100% 2.2 ± 0.4 33 ± 1 81.5 ± 5.7 0.8 ± 0.1
Table 5.22: Latex blend series EH5_nL0
%nano by wt. Young’s Modulus (E'),
MPa
Area Under Curve
Strain at Break(εb), %
Stress at Break(εb), MPa
0% 159 ± 11 174 ± 11 38.8 ± 1.5 8.9 ± 0.2 7.5% 100 ± 2 183 ± 9 61.4 ± 2.3 6.05 ± 0.2 15% 222 ± 3 429 ± 12 56.1 ± 5.6 16.2 ± 0.1 30% 135 ± 17 186 ± 2 72 ± 7.1 5.2 ± 0.5 50% 114 ± 23 142 ± 9.8 68 ± 8.6 4.2 ± 0.4 70% 35.5 ± 0.5 127 ± 11 80.2 ± 5.1 3.18 ± 0.2 100% 2.2 ± 0.4 33 ± 1 81.5 ± 5.7 0.8 ± 0.1
Table 5.23: Latex blend series IH4_nL0
%nano by wt. Young’s Modulus (E'),
MPa
Area Under Curve
Strain at Break(εb), %
Stress at Break(εb), MPa
0 213 ± 5.7 186 ± 9 38.2 ± 2 9.83 7.5% * * * * 15% 150 ± 30 355 ± 12 74.9 ± 4.6 9.9 30% * * * * 50% 107 ± 5.5 143 ± 8 33.3 ± 1.2 8.6 ± 0.9 70% 63.9 ± 6.9 198 ± 10 80 ± 0.2 5 ± 0.1 100% 2.2 ± 0.4 33 ± 1 81.5 ± 5.7 0.8 ± 0.1
Note: Asterisk in Table indicates sample was too brittle to test
Figures 5.23-5.32 show comparison of different neat constituent versus blend
concentrations. Surveying all data in tables and figures, we see that, when L0 is blended with
nL0, there is a general decrease in Young’s modulus values as expected for a very soft film.
170

However, a slight increase in Young’s modulus is observed at 15% concentration of
nanoparticles. Also, at increasing concentration of nanoparticle latex, the respective area under
the curve values decrease, indicating less flexibility or brittleness in the samples. Comparing pre-
coalescence versus post-coalescence crosslinked nanosize latex blends with L0, similar trends
are observed. Also, in both these cases at 15% concentration of nanoparticles, increase in
Young’s modulus values is observed.
When nanosize latexes with or without crosslinker blended with H0 (hard matrix), results
were unexpected. The Young’s modulus values showed outstanding improvements in the
concentration ranges between 7.5-30% of nanoparticles, particularly at 15% concentration. The
Young’s modulus of 100% H0 (15.9 MPa) showed 9-fold increase (149 MPa) with only 20%
decrease in strain-to-break when blended with 15% nL0. This is not expected. These results are
striking because the compositions of the two types of particles are the same, and no crosslinking
is involved. The main difference is particle size. Typically when soft particles (dispersed phase)
are blended in a hard matrix (continuous phase), the modulus values should go down depending
upon the composition. This is not the case here. Farris and Agarwal1 studied the fundamental
mechanical behavior of hard/soft latex blends. They demonstrated that blends of hard/soft
conventional size latex mostly reflect characteristics of their continuous phase. Another
explanation could be based on the percolation theory as explained by Eckersley and Helmer.5
The nonfunctional low Tg nanoparticles may be filling in voids between the large particles so
that the large particles can coalesce better and, thus, increase the overall mechanical strength of
the films.
What happens when we subject the nanoparticles to pre-coalescence or post-coalescence
crosslinking? In case of functional nanolatex, further improvements in the values can be
171

obtained. At 15% concentration of nIL2, the increase in Young’s modulus of H0 was 12 folds
(194 MPa) with only 18% decrease in strain-to-break and at 15% concentration of nEL5, the
increase in Young’s modulus of H0 was the highest, 13 fold (206 MPa), with only 15% decrease
in strain-to-break values. Similarly, a respective increase in the area under the curve and stress at
break is observed, indicating increased toughness in samples.
Similar significant increases in Young’s modulus values are observed when
nonfunctional nanosize low Tg latexes blended with post-coalescence crosslinked conventional
size latex. The Young’s modulus values for EL5: 45 MPa vs. EL5_nL0: 94.7 MPa and EH5: 159
MPa vs. EH5_nL0: 222 MPa. In addition, the area under the curve and strain-to-break values
also showed respective improvements in both the above samples. This indicates increased
toughness in the samples. In the case of nL0 when blended with pre-coalescence crosslinked
conventional latexes, the Young’s modulus values decreases: IL4: 49.7 MPa vs. IL4_nL0 (15%):
29.8 MPa, IH4: 213 MPa vs. IH4_nL0 (15%): 150 MPa. However, the area under the curve and
the strain-at-break values showed respective increase in both the blends indicating flexibility in
samples with optimum Young’s modulus values. When correlating the values from MFTs and
MDSC Tg of the above samples, this is a beneficial feature, especially in case of high Tg pre-
coalescence latex, when blended with low Tg nanoparticle latexes – The low Tg nanoparticle
latex will help coalesce the high Tg precoalescence latex particles and provide efficient film
formation.
172

0
0.5
1
1.5
2
2.5
3
3.5
4
0 20 40 60 80 100
% Strain
Stress (Mpa)
L0_nL0 (0% nano),conventional latex
L0_nL0 (7.5% nano)
L0_nL0 (15% nano)
L0_nL0 (30% nano)
L0_nL0 (50% nano)
L0_nL0 (70% nano)
L0_nL0 (100% nano),nano latex
Figure 5.23. Comparison of average stress-strain curves for L0_nL0 series
0
0.5
1
1.5
2
2.5
3
3.5
4
0 20 40 60 80 100
% Strain
Stress (Mpa)
L0_nIL4 (0% nano),conventional latex
L0_nIL4 (7.5% nano)
L0_nIL4 (15% nano)
L0_nIL4 (30% nano)
L0_nIL4 (50% nano)
L0_nIL4 (70% nano)
L0_nIL4 (100% nano),nano latex
Figure 5.24. Comparison of average stress-strain curves for L0_nIL4 series
173

0
0.5
1
1.5
2
2.5
3
3.5
4
0 20 40 60 80 100
% Strain
Stress (Mpa)
L0_nEL2 (0% nano),convetional latex
L0_nEL2 (7.5% nano)
L0_nEL2 (15% nano)
L0_nEL2 (30% nano)
L0_nEL2 (50% nano)
L0_nEL2 (70% nano)
L0_nEL2 (100% nano),nano latex
Figure 5.25. Comparison of average stress-strain curves for L0_nEL2 series
0
2
4
6
8
10
12
14
0 20 40 60 80 100
% Strain
Stress (Mpa)
H0_nL0 (0% nano),conventional latexH0_nL0 (7.5% nano)
H0_nL0 (15% nano)
H0_nL0 (30% nano)
H0_nL0 (50% nano)
H0_nL0 (70% nano)
H0_nL0 (100% nano),nano latex
Figure 5.26. Comparison of average stress-strain curves for H0_nL0 series
174

0
2
4
6
8
10
12
14
0 20 40 60 80 100% Strain
Stress (Mpa)
H0_nIL2 (0% nano), conventional latexH0_nIL2 (7.5% nano)H0_nIL2 (15% nano)H0_nIL2 (30% nano)H0_nIL2 (50% nano)H0_nIL2 (70% nano)H0_nIL2 (100% nano), nano latex
Figure 5.27. Comparison of average stress-strain curves for H0_nIL2 series
0
2
4
6
8
10
12
14
16
18
20
22
24
0 20 40 60 80 100
% Strain
Stress (Mpa)
H0_nEL5 (0% nano),conventional latexH0_nEL5 (7.5% nano)
H0_nEL5 (15% nano)
H0_nEL5( 30% nano)
H0_nEL5 (50% nano)
H0_nEL5 (70% nano)
H0_nEL5 (100% nano),nano latex
Figure 5.28. Comparison of average stress-strain curves for H0_nEL5 series
175

0
2
4
6
8
10
12
14
16
0 20 40 60 80 100
% Strain
Stress (Mpa)
IL4_nL0 (0% nano),conventional latexIL4_nL0 (7.5% nano)
IL4_nL0 (15% nano)
IL4_nL0 (30% nano)
IL4_nL0 (50% nano)
IL4_nL0 (70% nano)
IL4_nL0 (100% nano),nano latex
Figure 5.29. Comparison of average stress-strain curves for IL4_nL0 series
0
2
4
6
8
10
12
14
16
0 20 40 60 80 100
% Strain
Stress (Mpa)
EL5_nL0 (0% nano),conventional latex
EL5_nL0 (7.5% nano)
EL5_nL0 (15% nano)
EL5_nL0 (30% nano)
EL5_nL0 (50% nano)
EL5_nL0 (70% nano)
EL5_nL0 (100% nano),nano latex
Figure 5.30. Comparison of average stress-strain curves for EL5_nL0 series
176

0
2
4
6
8
10
12
14
16
18
0 20 40 60 80 100
% Strain
Stress (Mpa)
EH5_nL0 (0% nano),conventional latex
EH5_nL0 (7.5% nano)
EH5_nL0 (15% nano)
EH5_nL0 (30% nano)
EH5_nL0 (50% nano)
EH5_nL0 (70% nano)
EH5_nL0 (100% nano),nano latex
Figure 5.31. Comparison of average stress-strain curves for EH5_nL0 series
0
2
4
6
8
10
12
14
16
18
0 20 40 60 80 100
% Strain
Stress (Mpa)
IH4_nL0 (0% nano),conventional latex
IH4_nL0 (15% nano)
IH4_nL0 (50% nano)
IH4_nL0 (70% nano)
IH4_nL0 (100%nano), nano latex
Figure 5.32. Comparison of average stress-strain curves for IH4_nL0 series
177

In general, the stress-strain analysis showed that in most cases, the 85/15 blends give the
most improved results. Properties of other blend ratios, at 7.5% and at 30% concentration, are
also often enhanced. It is noteworthy that the pencil hardness of all the blends is sharply
increased relative to the conventional latex film. It is also interesting that the solvent resistance
of the all-thermoplastic blends improved modestly, again suggesting that the nanoparticles were
able to improve the coalescence and interpenetration of the polymer molecules during film
formation, independent of crosslinking.
In summary, based on end-use properties and stress-strain data, it is clear that in most
cases the 85/15 blends gave a great balance of overall properties. The other effective blends
ratios are at 7.5% and at 30% in most cases. Further, surveying all data, it is clear that the film
properties depend on (a) Tg, (b) crosslinking, and (c) blend ratio. Properties of most coatings are
significantly influenced by Tg and crosslinking, which is not surprising. What is surprising is the
strong dependence on blend ratio and the very positive synergies in property improvement that
are observed.
As suggested by Jones et al.,46 the above observations lead us to theorize about why the
blends, especially the 85/15 blends, perform so well. The conjecture is based on the classical
model of film formation by thermoplastic latexes; this model is simplistic but useful.20, 24, 34-36 It
postulates three overlapping stages of film formation: (1) evaporation of volatiles, (2) particle
deformation to a continuous film (or sometimes referred to as “coalescence”), (3) molecular
interpenetration to knit the particles together (also called “fusion” or “further coalescence”). The
third stage is critical to achieving full potential film properties. Based on this model, a picture of
what might be happening with blends follows:
178

• During evaporation, nanoparticles (22-23 nm) presumably fill the interstices among
the 120-140 nm conventional particles.
• If the larger particles were rigid, uniform spheres and were able to adopt a close-
packed geometry, we estimate that there would be room for only 4 to 6 nanoparticles
per large particle. The diameter ratio of a 130 nm particle to a 22 nm particle is about
the same as that of a volley ball (10 inches) to a golf ball (1.68 inches). As indicated
above, the ratio of conventional particles to nanoparticles in an 85/15 blend is roughly
1/25, as visualized in Figure 5.A.
Figure 5.A. Volleyball (conventional particles ~120-130nm) vs. golf ball (nanoparticles ~ 20-25 nm)46 • However, the conventional particles are not uniform in size, and they are unlikely to
be able to form a neat, close-packed array in the presence of nanoparticles, especially
since the evaporation step is rapid. Thus there is probably room for more than 4 to 6
nanoparticles in a reasonably homogenous array after water evaporation.
• At high levels of nanoparticles, however, the nanoparticles would be forced to cluster,
and the array at the end of stage 1 would become less homogeneous.
179

• Assuming a reasonably uniform distribution of large and small particles in the film at
the start of stage 2, there are three mechanisms by which nanoparticles could facilitate
coalescence and molecular interpenetration as the films form:
1. The nanoparticles would partly fill voids, sharply reducing the amount of
shrinkage needed to achieve film uniformity during stage 2.
2. Coalescence is thought to be driven partly by reductions in surface energy during
the process. Nanoparticles would enhance this effect because their surface areas
are much larger on an equal weight basis.
3. Conceivably, some molecules within the nanoparticles may be constrained within
the particles and unable to extend to their preferred RMS dimensions. If this were
true, it would provide an additional driving force for molecular interpenetration
needed to develop full film properties.
• If there is, indeed, an optimum ratio of conventional particles to nanoparticles, it is
not known how to measure it directly. The data presented here suggest that it may be
somewhere between 1/15 and 1/30 for particles of the sizes studied here.
• The dynamical mechanical property results in the next section show a measureable
maximum in the storage modulus values in the rubbery region at 85/15 conventional
particle/nanoparticle concentration ratio for both crosslinkable and uncrosslikable
nanoparticles. This supports the speculation that at this concentration, a film structure
is formed which optimizes end-use and fundamental properties of the nanoparticle
blends.
180

• When the nanoparticles are crosslinkable after coalescence, the outcome might be a
framework of crosslinked nanoparticles surrounding uncrosslinked vestiges of the
conventional particles analogous to a semi-interpenetrating polymer network.
Dynamic mechanical properties
Dynamic mechanical characterization of heterogeneous polymers is dependent not only
on the chemical composition of a material but also on physical or structural arrangement of the
phases in a bulk polymer.22, 23 DMA analysis gives an insight into intrinsic mechanical properties
of a polymer.22, 23 DMA provides information about the viscoelastic properties (storage modulus
and loss modulus) of a polymer as a function of frequency and temperature.22, 23 The inflection
point of the storage modulus is related to the Tg of the polymer.22, 23 It should be noted that the
temperature corresponding to the inflection point of the tan delta curve is higher than the Tg
value determined by MDSC, which is commonly observed.22, 23 The tan delta curve is calculated
as the ratio of the loss modulus to the storage modulus. The point where the storage modulus
curve flattens is an indicator of the rubbery plateau. Figures 5.33-5.42 show comparison of
different neat constituent versus their blends concentrations. Each figure includes two sub-
figures: (a) comparison of loss modulus curves and (b) comparison of storage modulus curves.
Tables 5.24-5.33 show comparison of MDSC Tg, DMA storage modulus inflection point, DMA
loss peak temperature, tan delta peak temperature, half width/half height of tan delta peak, and
storage modulus values in rubbery region (80-900C). In general, the MDSC Tg, DMA storage
modulus inflection point, DMA loss peak temperature values, showed similar trends and good
correlation.
Hill47 points out that “for unpigmented crosslinked coating films the level of the storage
modulus, E′, in the rubbery plateau region above Tg is an indicator of the level of crosslink
181

density.” Hill47 further points out that a wide variation in E′ values has been observed from
4 MPa for lightly crosslinked systems to 200 MPa for very highly crosslinked films. For latex
blends, E’ values in rubbery region depict a complex scenario. The E’ values, in 80-90 oC range,
are lower compared to their neat conventional size constituents. Thus, none of the latex blends
films are lightly crosslinked per Hill’s criteria.47 However, upon close examination of the storage
modulus values in the rubbery region for the blends, it can be seen that the values go through a
small but measurable maximum at the 15 wt.% concentration of nanoparticles. The only
exception to this is the blend EH5-nL0, where the maximum occurs at 7.5 wt.% concentration of
nanoparticles. This small but measureable maximum value of the storage modulus at 15 wt.% of
nanoparticles correlates well with other end-use and fundamental property results indicating that
optimum property improvements in nanoparticle blends occur around 15 wt.% of nanoparticles.
This observation supports the speculation that a unique film structure is formed at this
concentration of nanoparticles.
In the case of blends of low Tg conventional latex L0, with increasing levels of nL0
concentration, clear broadening (refer to increase of half width/half height values) and shifting
of tan delta peak to lower temperature is evident in Figure 5.33 and Table 5.24. Going from 0%
to 7.5% to 15% nanoparticle concentration showed a shift in tan delta to lower temperature, but
the clear broadening of the tan delta peak can be seen at levels at or above 30% concentration. In
case of pre-coalescence (nIL4) or post-coalescence (nEL2) nanolatex blended with L0, the trends
in the tan delta peak are not clear. Mostly for both blends, at higher concentration of pre-
coalescence or post-coalescence nanoparticles, the broadening in tan delta curves is observed.
Surprisingly, at 15% concentration of pre-coalescence or post-coalescence nanoparticles, the tan
delta peak shifts towards higher temperature. Similarly, in the cases EL5_nL0 blends, EH5_nL0
182

blend, IH4_nL0 blend, and IL4_nL0 blends, no clear trend was observed. For most of the blends,
shifting of tan delta peaks to lower temperature was observed. Tan delta peak broadening was
clearly observed for EL5_nL0 blend; at 7.5%, 30%, and 50% nL0 concentration of nL0 and for
IL4_nL0 blend: at 15% and 30% concentration of nL0, for EH5_nL0 blend: at 30% nL0
concentration and for IH4_nL0: at 50% concentration.
An opposite trend is observed with the blends of H0_nL0. At increasing levels of
nanoparticles in the blend, the tan delta peak shifts towards higher temperature and broadening in
the tan delta peak is also evident. The broadening of the tan delta peak is an indication of
development of a heterogeneous network structure and morphology.47 Indeed, in the case of
H0_nL0 blends, the tan delta peaks become broader and the peak value decreases, an indication
of development of more heterogeneous network structure and morphology. Further, at 15%
concentration of nanoparticle latex, the peak shifts to the highest temperature compared to all the
other samples. At 15% concentration of nL0, the elastic modulus level obtained from stress-
strain measurements increases, and DMA tan delta peak broadens. As mentioned earlier, these
results are striking because the compositions of the two types of particles are the same, and no
crosslinking is involved. The main difference is particle size. This proves that, in addition to
glass transition temperature (and crosslinking), blend ratio is a significant variable. Also, these
observations are consistent with all the other test results and solidifies our theory about why the
blends, especially the 85/15 blends, perform so well.
In the case of pre-coalescence or post-coalescence crosslinked nanolatex, when blended
with a high Tg no crosslinker latex in a different concentrations, similar effects are observed. In
general, at increasing concentration of nanoparticle latex, tan delta peaks shift to higher
temperatures, clear broadening of the tan delta peaks are observed, and at 15% concentration of
183

the functional nanoparticles in the blend, the tan delta peak showed the highest temperature shift
and broadening.
Figure 5.33: (a) Comparison of loss modulus curves and (b) Comparison of storage modulus curves for L0_nL0 series
184

Figure 5.34: (a) Comparison of loss modulus curves and (b) Comparison of storage modulus curves for L0_nIL4 series
185

Figure 5.35: (a) Comparison of loss modulus curves and (b) Comparison of storage modulus curves for L0_nEL2 series
186

Figure 5.36: (a) Comparison of loss modulus curves and (b) Comparison of storage modulus curves for H0_nL0 series
187

Figure 5.37: (a) Comparison of loss modulus curves and (b) Comparison of storage modulus curves for H0_nIL2 series
188

Figure 5.38: (a) Comparison of loss modulus curves and (b) Comparison of storage modulus curves for H0_nEL5 series
189

Figure 5.39: (a) Comparison of loss modulus curves and (b) Comparison of storage modulus curves for EL5_nL0 series
190

Figure 5.40: (a) Comparison of loss modulus curves and (b) Comparison of storage modulus curves for IL4_nL0 series
191

Figure 5.41: (a) Comparison of loss modulus curves and (b) Comparison of storage modulus curves for EH5_nL0 series
192

193
Figure 5.42: (a) Comparison of loss modulus curves and (b) Comparison of storage modulus curves for IH4_nL0 series

194
Table 5.24: Latex blend series L0_nL0
%nano by wt. MDSC Tg (oC) DMA DMA Tan delta
DMA storage modulus (Mpa), E′, in rubbery
(80-90 oC) region
Storage modulus inflection
point (oC)
Loss peak temperature
(oC)
Tan delta peak
Temperature (oC)
(L)HWHH (R)HWHH
0% 7.05 13.8 15.2 40.7 15.8 21.7 3.1 7.5% 7.4 11.4 12.8 35.9 17.49 26.26 0.7 15% 6.38 13.9 12.7 37.6 17.93 19.57 1.8 30% 6.23 13.8 15.5 38 19.62 30.38 1.1 50% 6.26 7.4 11.9 36.7 14.65 32.01 0.6 70% 4.9 12.7 12.4 35 16.26 27.59 0.3 100% 4.77 13.1 13.8 32.5 18.65 18.85 0.9
Table 5.25: Latex blend series L0_nIL4
%nano by wt. MDSC Tg (oC) DMA DMA Tan delta
DMA storage modulus (Mpa), E′, in rubbery
(80-90 oC) region
Storage modulus inflection
point (oC)
Loss peak temperature
(oC)
Tan delta peak
Temperature (oC)
(L)HWHH (R)HWHH
0% 7.05 13.8 15.2 40.7 16.88 19.62 3.1 7.5% 7.1 13.6 13.2 39.9 11.45 19.05 0.7 15% 7.17 17.9 17.3 43.9 17.6 21.52 1.2 30% 7.1 17.5 15.9 39.3 16.81 25.93 0.6 50% 7.08 13.7 14.1 35.8 20.5 32.65 0.3 70% 5.5 13.4 13.8 35.1 20.9 19.75 0.2 100% 10.9 17.1 16.4 37.2 17.99 19.51 0.7

195
Table 5.26: Latex blend series L0_nEL2
%nano by wt. MDSC Tg (oC) DMA DMA Tan delta
DMA storage modulus (Mpa), E′, in rubbery
(80-90 oC) region
Storage modulus inflection
point (oC)
Loss peak temperature
(oC)
Tan delta peak
Temperature (oC)
(L)HWHH (R)HWHH
0% 7.05 13.8 15.2 40.7 16.88 19.62 3.1 7.5% 7.2 9 13.4 36.8 9.83 22.17 0.5 15% 7.62 10.5 14.4 44.7 13.45 13.05 1.6 30% 4.95 16.4 16.1 35.4 17.21 30.64 0.3 50% 4.8 17.5 16.7 33.1 15.49 31.36 0.2 70% 4.6 12.3 15.4 38.4 16.54 33.46 0.7 100% 3.13 9.4 14.6 35.8 18.01 25.79 0.4
Table 5.27: Latex blend series H0_nL0
%nano by wt. MDSC Tg (oC) DMA DMA Tan delta
DMA storage modulus (Mpa), E′, in rubbery
(80-90 oC) region
Storage modulus inflection
point (oC)
Loss peak temperature
(oC)
Tan delta peak
Temperature (oC)
(L)HWHH (R)HWHH
0% 26.3 20.8 19.6 43.9 15.33 22.17 3 7.5% 25.9 28.2 25.9 56.8 12.8 20.2 1.2 15% 23.5 33.1 29.9 58.1 17.7 16.8 2.5 30% 21 22.9 24.4 52.4 17.16 23.44 0.7 50% 18.8 23 21 48.5 19.71 21.89 0.3 70% 11.9 9.9 19.6 45.6 20.32 26.68 0.2 100% 4.77 13.1 13.8 32.5 18.65 18.85 0.9

196
Table 5.28: Latex blend series H0_nIL2
%nano by wt. MDSC Tg (oC) DMA DMA Tan delta
DMA storage modulus (Mpa), E′, in rubbery
(80-90 oC) region
Storage modulus inflection
point (oC)
Loss peak temperature
(oC)
Tan delta peak
Temperature (oC)
(L)HWHH (R)HWHH
0% 26.3 20.8 19.6 43.9 15.02 22.38 3 7.5% 26.1 21.8 26.3 56.6 17.06 22.54 1 15% 25.7 34 28.9 57.6 16.48 22.02 1.8 30% 20.8 20.2 24.5 50.2 18.97 17.63 0.5 50% 21.2 19.9 24.1 49.8 20.1 21.2 0.4 70% 15.7 18.9 20.3 47.4 20.75 15.05 0.3 100% 4.67 17.4 14.6 33.5 16.12 19.38 0.3
Table 5.29: Latex blend series H0_nEL5
%nano by wt. MDSC Tg (oC) DMA DMA Tan delta
DMA storage modulus (Mpa), E′, in rubbery
(80-90 oC) region
Storage modulus inflection
point (oC)
Loss peak temperature
(oC)
Tan delta peak
Temperature (oC)
(L)HWHH (R)HWHH
0% 26.3 20.8 19.6 43.9 16.72 21.08 3 7.5% 25.7 24.8 23.4 54.1 17.03 22.67 0.7 15% 24.5 33.7 26.4 55.6 15.48 22.02 0.8 30% 23.1 22.8 23.8 53.1 18.81 22.89 0.5 50% 21.4 16 20.3 48.1 16.72 21.38 0.3 70% 20.3 16.3 18.8 46.3 21.07 23.83 0.3 100% 5.15 15.9 14.3 41.4 14.04 32.36 1.3

197
Table 5.30: Latex blend series EL5_nL0
%nano by wt. MDSC Tg (oC) DMA DMA Tan delta
DMA storage modulus (Mpa), E′, in rubbery
(80-90 oC) region
Storage modulus inflection
point (oC)
Loss peak temperature
(oC)
Tan delta peak
Temperature (oC)
(L)HWHH (R)HWHH
0% 11.6 11.4 19.8 45.4 18.75 25 9 7.5% 10.5 11.1 16.4 37.2 23.04 35.42 1.2 15% 10.1 18.7 18.3 40.4 15.58 26.08 4.5 30% 9.86 10.7 13.7 39.3 22.92 35.42 1.2 50% 9.77 13.3 12.1 29.6 21.9 31.3 0.6 70% 4.7 2.4 11.2 31.8 25 25 0.6 100% 4.77 13.1 13.8 32.5 18.65 18.85 0.9
Table 5.31: Latex blend series IL4_nL0
%nano by wt. MDSC Tg (oC) DMA DMA Tan delta
DMA storage modulus (Mpa), E′, in rubbery
(80-90 oC) region
Storage modulus inflection
point (oC)
Loss peak temperature
(oC)
Tan delta peak
Temperature (oC)
(L)HWHH (R)HWHH
0% 14.6 26.3 24.3 50.3 16.92 21.58 5.2 7.5% 12.8 27.1 23.3 46.1 16.4 27.6 0.3 15% 11.6 19.8 16.8 42.4 22.09 15.41 0.6 30% 11 12.4 15.8 40.4 18.21 26.49 0.5 50% 10.8 11.4 13.3 35.6 20.58 29.42 0.2 70% 4.7 10.4 12.8 39.2 18.64 29.21 0.2 100% 4.77 13.1 13.8 32.5 18.65 18.85 0.9

198
Table 5.32: Latex blend series EH5_nL0
%nano by wt. MDSC Tg (oC) DMA DMA Tan delta
DMA storage modulus (Mpa), E′, in rubbery
(80-90 oC) region
Storage modulus inflection
point (oC)
Loss peak temperature
(oC)
Tan delta peak
Temperature (oC)
(L)HWHH (R)HWHH
0% 29.7 38.5 36.2 63.9 22.6 26.3 13 7.5% 26.7 34.6 32.1 60.8 24.45 25.55 3.5 15% 25.8 18.3 29.2 56.9 18.66 26.09 2.2 30% 26.5 17.4 26.3 55.8 19.2 32.9 1.7 50% 22.5 13.5 16.8 54.4 19.84 27.03 1.2 70% 22.1 4.9 11.4 49.7 20.98 24.27 0.6 100% 4.77 13.1 13.8 32.5 18.65 18.85 0.9
Table 5.33: Latex blend series IH4_nL0
%nano by wt. MDSC Tg (oC) DMA DMA Tan delta
DMA storage modulus (Mpa), E′, in rubbery
(80-90 oC) region
Storage modulus inflection
point (oC)
Loss peak temperature
(oC)
Tan delta peak
Temperature (oC)
(L)HWHH (R)HWHH
0% 33 * * * * * * 7.5% 32.8 * * * * * * 15% 31.9 * * * * * * 30% 29.8 * * * * * * 50% 29.1 13 14 58.6 19.77 24.03 0.5 70% 4.11 11.4 15.4 57.2 24.05 23.05 0.7 100% 4.77 14.9 13.8 32.5 18.65 18.85 0.9
Note: Asterisk in Table indicates sample was too brittle to test

Conclusions:
The overall results of the present study described in this chapter suggest these
conclusions:
• Blending conventional latexes with nanoparticle latexes may be a useful approach to
near-zero VOC coating formulations. The blends combine substantial improvements in
certain film properties with a modest decrease in minimum filming temperatures (MFT).
None of the properties we tested were seriously degraded by blending. Further, from all
data it can be clearly stated that the nanoparticles are functioning as coalescing aids. This
could be due to number reasons such as better packing, release of surplus surface energy
from the nanoparticles, action of extra surfactant that comes along with the nanoparticles,
and conceivably thermodynamic effect of allowing constrained molecules in
nanoparticles to extend to RMS dimensions.
• Film properties are strongly influenced by Tg, crosslinking, particle size and distribution,
blending, and blend ratios.
• Independent of Tg and crosslinking, blending at the optimum ratio has a large effect on
bulk film properties such as modulus and hardness and also a beneficial effect on solvent
resistance and block resistance. Improved molecular interpenetration (the third stage of
film formation) is a suggested explanation.
• Crosslinking the nanoparticles can be combined with blending to further enhance
properties.
• AFM images and the surface smoothness graphs showed that the nanoparticles with Tg’s
of 5 oC appear to populate both film surfaces, increasing gloss and adhesion.
199

• The optimum level of 22 nm nanoparticles in 130 nm conventional particles is thought to
be somewhere around 15/1 to 30/1 on a number of particles basis. For a 15 wt %
nanoparticle blend this ratio is roughly 25/1.
• Substantial property improvements also occur at 7.5 wt % and 30 wt% nanoparticles.
200

References
1. Agarwal, N.; Farris, R. J., Mechanical Properties of Acrylic Based Latex Blends. POLYMER ENGINEERING AND SCIENCE 2000, 40, (2), 376-390. 2. Boyars, B., Daniels, E.S., Storer, R., Klein, A., The Influence of Latex Blend Composition on Crosslinking and Mechanical Properties. Journal of Applied Polymer Science 2007, 104, 3774-3779. 3. Colombini, D., Ljungberg, N.,Hassander, H.,Karlsson, O.J., The effect of the polymerization route on the amount of interphase in structured latex particles and their corresponding films. Polymer 2005, 46, 1295-1308. 4. Colombini, D., Hassander, H.,Karlsson,O.J., Maurer,F.H., Effects of Thermal Annealing on the viscoelastic Properties and Morphology of Bimodal Hard/Soft Latex Blends. Journal of Polymer Science:Part B: Polymer Physics 2005, 43, 2289-2306. 5. Eckersley, S. T.; Helmer, B. J., Mechanistic Considerations of Particle Size Effects on Film Properties of Hard/Soft Latex Blends. Journal of Coatings Technology 1997, 69, (864), 97-107. 6. Geoffrey, B. A.; Bignell, D. S.; Cook, I. B.; Leary, B.; Lyons, C. J. (to ICI Australia Operations Proprietary Ltd.) “Addition polymer particles”. U.S. Patent 5244737, 1993. 7. Geurts, J., Bouman, J., Overbeek, A., New Waterborne Acrylic Binders For Zero VOC paints. J.Coat.Technol.Res. 2008, 5, (1), 57-63. 8. Geurts, J. M., Lammers,M., German A.L., The Effect of Bimodality of the Particle Size Distribution on Film Formation of Lattices. Colloids Surf. A: Physiochem. Eng. Aspects 1996, 108, (2-3), 295-303. 9. Hagen, R., Salmen,L.,Karlsson,O.,Wesslen,B., Viscoelastic Properties and Film Morphology of Heterogeneous Styrene-Butadiene Latexes. J.Appl.Polym.Sci. 1996, 62, (7), 1067-1078. 10. Heuts, M. P. J., Febre Le, R.A., Hilst Van, J.L.M.,Overbeek, G.C., Influence of Morphology on Film Formation of Acrylic Dispersions. Am.Chem.Soc.Symp.Ser. 1996, 648, 271-285. 11. Jocelyn, M. C.; William, M. C.; William, P. H.; Leary, B.; Henry, C. S.; Thamala, C. W. (to Orica Australia PTY Ltd.) “Aqueous polymer dispersion”. U.S. Patent 6777489 2004. 12. Juhue, D.; Lang, J., Film Formation from Dispersion of Core-Shell Latex Particles. Macromol. 1995, 28, 1306-1308. 13. Keddie, J. L., Film Formation of Latex. Mater. Sci.Eng. Rep. 1997, 21, (3), 101-170. 14. Leary, B.; Lyons, C. J., “A Novel Composite Polymer Latex Technology”. Australian Journal of Chemistry 1989, 42, (12), 2055-2070. 15. Lepizzera, S., Lhommeau,C., Dilger, G., Pith, T., Lambla, M., Film Forming Ability and Mechnical Properties of Coalesced Latex Blends. Journal of Polymer Science:Part B: Polymer Physics 1997, 35, 2093-2101. 16. Schmidt, A.; Gunter, K.; Werner, C. (to Bayer Aktiengesellschaft) "Aqueous dispersions based on (metha)acrylic acid alkyl ester polymers with two pronounced, substantially non-overlapping peaks in the particle size distribution within specific particle size ranges, and a process for the preparation and use thereof". United States Patent 4384056, 1983.
201

17. Tang, J., Daniels, E.S., Dimonie V.L., Vratsanos, M.S., Klein, A., El-Aasser, M.S., Mechnical Properties of Films Prepared from Model High-Glass-Transition-Temperature/Low-Glass-Transition Temperature Latex Blends. Journal of Applied Polymer Science 2002, 86, 2788-2701. 18. Tzitzinou, A., Keddie,J.L.,Geurts,J.M.,Peters,ACIA,Satguru,R., Film Formation of Latex Blends with Bimodal Particle Size Distributions:Consideration of Particle Deformability and Continuity of the Dispersed Phase. Macromol 2000, 33, 2695-2708. 19. Vandezande, G. A.; Rudin, A., Novel Composite Latex Particles for Use in Coatings. J.Coat.Technol. 1994, 66, (828), 99-108. 20. Winnik, M. A.; Feng, J., Latex Blends: An Approach to Zero VOC Coatings. Journal of Coatings Technology 1996, 68, (852), 39-50. 21. Wu, W.; Olesen, K. R.; Miner II, A. R.; Schneider, J. A., “Vinyl Acetate-Ethylene and Acrylic Latexes to Achieve Targeted Performance Properties” JCT Coatings Tech. 2008, pp 44-52. 22. Joshi, R.; Lefevre, E.; Patel, C.; Provder, T.; Crombez, R.; Shen, W.; Jones, F. N., Thermoanalytical and morphological studies of cross-linked latex films by advanced techniques. Journal of Thermal Analysis and Calorimetry 2008, 93, (1), 19-26. 23. Joshi, R. G.; Provder, T.; Ziemer, P. D.; Mao, W.; Shen, W.; Jones, F. N., Investigation of the effect of precoalescence or postcoalescence crosslinking on film formation, properties, and latex morphology. Journal of Coatings Technology and Research 2008 (online first, DOI: 10.1007/s11998-008-9115-7). 24. Taylor, J. W.; Winnik, M. A., “Functional Latex and Thermoset Latex Films,”. JCT Research 2004, 1, (3), 163-190. 25. “Diacetone acrylamide, N-(1,1dimethyl-3-oxobutyl)-acrylamide,” Kyowa Hakko U.S.A. Inc. Technical information sheet 2008 (retrieved), p 4. 26. Emmons, W. D., (to Rohm and Haas) “Ambient or low-temperature curable coatings,”. U.S. Patent 4,210,565, 1980. 27. Geelhaar, H. J.; Penzel, E.; Ley, G., (to BASF) “Binders for paints,” U.S. Patent 4,267,091, 1981. 28. Krajnik, J. M.; Lam, V. H.; Sabo, L. O.; Camerson, J. M.; Mittleman, M. L.; Wise, K. M., (to Sherwin-Williams) “Waterborne coating compositions,”. U.S. Patent Application 20020103278, 2002. 29. Robinson, G. F.; Shemancik, R. C.; Speight, R. D.; Wong, P. T.; Znidersic, K. M. (to Akzo Nobel), “Coating Compositions and Coatings Formed Therefrom.” US Patent 6,605,359, 2003. 30. Ming, W.; Jones, F. N.; Fu, S., High Solids-content Nanosize Polymer Latexes Made by Microemulsion Polymerization. Macromol. Chem. Phys. 1998, 199, 1075-1079. 31. Ming, W.; Jones, F. N.; Fu, S., Synthesis of nanosize poly(methyl methacrylate) microlatexes with high polymer content by a modified microemulsion polymerization. Polym. Bull. 1998, 40, (6), 749-756. 32. Ming, W.; Zhao, Y.; Cui, J.; Fu, S.-K.; Jones, F. N., “Formation of Irreversible Nearly Transparent Physical Polymeric Hydrogels During a Modified Microemulsion Polymerization,” Macromol 1999, 32, 528-530. 33. Ming, W.; Zhao, Y.; Fu, S.; Jones, F. N. In Polym. Mater. Sci. Eng., 1999; ACS: 1999; p 514.
202

203
34. Winnik, M. A., “The formation and properties of latex films”. In Emulsion Polymerization and Emulsion Polymers, Lovell, P. A.; El-Aasser, M. S., Eds. Wiley: New York, 1997; pp 467–518. 35. Winnik, M. A., “Interdiffusion and Crosslinking in Thermoset Latex Films”. J. Coat. Technol. 2002, 74, (925), 49-63. 36. Winnik, M. A., “Crosslinking and Polymer Interdiffusion in Latex Films”. Polym. Prep. 2003, 44, (1), 100-101. 37. Xu, J.; Dimonie, V. L.; Sudol, D. E.; El-Aasser, M. S., Crosslinking of isocyanate functional acrylic latex with telechelic polybutadiene. I. Synthesis and characterization. J. Appl. Polym. Sci. 1997, 69, (5), 965-975. 38. Zosel, A.; Ley, G., “Influence of crosslinking on structure, mechanical properties, and strength of latex films”. Macromolecules, 1993, 26, 2222–2227. 39. Tamai, T.; Pinenq, P.; Winnik, M. A., “Effect of cross-linking on polymer diffusion in poly(butyl methacrylate-co-butyl acrylate) latex films”. Macromolecules 1999, 32, 6102-6110. 40. Aradian, A.; Raphael, E.; G., d. G. P., “A scaling theory of the competition between interdiffusion and cross-linking at polymer interfaces”. Macromolecules 2002, 35, 4036-4043. 41. Ghazaly, H. M.; Daniels, E. S.; Dimonie, V. L.; El-Aasser, M. S.; Klein, A., “Synthesis and characterization of a macromonomer crosslinker”. J. Appl. Polym. Sci. 2000, 77, 1362–1368. 42. Ghazaly, H. M.; Daniels, E. S.; Dimonie, V. L.; Klein, A.; El-Aasser, M. S., “Miniemulsion copolymerization of n-butyl methacrylate with crosslinking monomers". J. Appl. Polym. Sci. 2001, 81, 1721-1730. 43. Ghazaly, H. M.; Daniels, E. S.; Dimonie, V. L.; Klein, A.; Sperling, L. H.; El-Aasser, M. S., “Properties of N-butyl methacrylate copolymer latex films derived from crosslinked latex particles” J. Appl. Polym. Sci. 2003, 88, 42-49. 44. Kessel, N.; Illsley, D. R.; Keddie, J. L., “The Influence of Interdiffusion and Crosslinking in the Film Formation of an Acrylic Latex” J. Coat. Technol. Res. 2008, (online first, DOI:10.1007/s11998-008-9096-6). 45. JIANG, W.; YANG, W.; ZENG, X.; FU, S., Structure and Properties of Poly(methyl methacrylate) Particles Prepared by a Modified Microemulsion Polymerization. Journal of Polymer Science: Part A: Polymer Chemistry 2004, 42, 733-741. 46. Jones, F. N.; Joshi, R. G.; Provder, T.; Shen, W. In Blending Polymer Nanoparticles with Conventional Latexes, CoatingsTech Conference, Indianapolis, IN, 2009; FSCT- NPCA: Indianapolis, IN, 2009. 47. Hill, L. W., “Dynamic Mechanical and Tensile Properties”. In Paint and Coatings Testing Manual: Fourteenth Edition of the Gardner-Sward Handbook, Koleske, J. V., Ed. ASTM: Ann Arbor, MI, 1995; pp 534–546.

Chapter 6
Conclusions
This study serves as a fundamental and practical contribution to latex research, forming a
basis for exploring potential applications of crosslinked and nanoparticle size latexes and their
blends as a binder in paints, coatings, or adhesives. The main goal of the present study was to
investigate the effect(s) of type (pre-coalescence or post-coalescence) and level of crosslinking,
particle size and distribution, glass transition temperature (Tg), and blends of conventional and
nanoparticle latexes and their different weight ratios on latex film formation process, end-use
properties, fundamental thermal and mechanical properties, and latex morphology.
The key highlights of present research are shown below:
• When comparing post-coalescence versus pre-coalescence crosslinking, the research data
(Chapter 3) clearly showed that at increasing levels of crosslinking (up to 5 wt. %) post-
coalescence crosslinking showed improvement in latex end-use and mechanical
properties due to sufficient interdiffusion of the polymer chains between the particles to
interdiffuse and interpenetrate adequately before the crosslink density was high enough to
impede formation of films with desirable end-use properties. On the other hand, pre-
coalescence crosslinking studied showed that up to a certain level (up to 0.6% to 1.2%)
the latex properties are neutral or even favorable for overall properties. However, at
levels higher than 0.6% to 1.2%, the polymer chains within particles became increasingly
resistant to interdiffusion between particles and perhaps to coalescence, resulting into
inferior film properties.
• Studying the effect of type of crosslinking on glass transition temperature, the test data
clearly demonstrated that at increasing levels of pre-coalescence crosslinking, the Tg
204

increases. At 4 wt. % level (highest) of pre-coalescence crosslinked latexes, the Tg was
increased by 100C ± 20C. In the case of post-coalescence crosslinked latexes, up to 5 wt.
% level (highest) very slight effect was observed on Tg.
• An improved process was developed for making thermoplastic nanoparticle latexes in the
15-30 nm diameter range using monomers with low water solubility (Chapter 4).
• Studying the effects of particle size and distribution (Chapter 4), the experimental data
showed that films made from nanosize latexes (avg. particle size = 20 to 25 nm) in
general have superior gloss, solvent resistance, and adhesion and produce smoother films
when compared to their conventional size counterparts (avg. particle size = 120-130nm).
However, due to amount of surfactant present on and near the surface of nanosize latex
films, they showed inferior water resistance and lower Young’s modulus and area under
the curve values when compared to the conventional size counterparts.
• Studying blends of conventional and nanoparticle latexes (Chapter 5) showed that in
addition to Tg, crosslinking, particle size and distribution, film properties are also
strongly influenced by blending and blend ratios. Independent of Tg and crosslinking,
blending at the optimum ratio has a large effect on bulk film properties such as modulus
and hardness, and also a beneficial effect on solvent resistance and block resistance. The
optimum level of 22 nm nanoparticles in 130 nm conventional particles is thought to be
somewhere around 15/1 to 30/1 on a number of particles basis. At 15 wt % nanoparticle
blend ratio (roughly 25/1, nano/conventional), significant improvements in bulk
properties such as Young’s modulus (up to 13 fold increase) and surface properties such
as specular 600gloss value [from 35 (indicating a rough surface, as usual for films cast
from latexes) to 92 (indicating a very smooth surface, unprecedented from films cast
205

206
from latexes)] was observed. At 7.5 wt% and 30 wt% of nanoparticles, the blends showed
substantial improvements in latex properties.
• Our research data (Chapter 5) clearly demonstrated that blending conventional and
nanoparticle latexes may be a useful approach to near-zero VOC coating formulations.
The blends combined substantial improvements in certain film properties with a modest
decrease in minimum filming temperatures (MFT). None of the properties tested were
seriously degraded by blending. Further, from all data it can be clearly stated that the
nanoparticles were functioning as coalescing aids. This could be due to number reasons
such as better packing, release of surplus surface energy from the nanoparticles, action of
extra surfactant that comes along with the nanoparticles, conceivably thermodynamic
effect of allowing constrained molecules in nanoparticles to extend to RMS dimensions.
In the future, one of the major areas of research could be formulating the crosslinked and
nanoparticle latexes and their blends in paints and coatings as binders and studying their effects
on paint properties. Another area of future interest could be formulating nanosize latexes as
additives (up to 5 wt% to 10 wt %) in paint formulation with other acrylic binders. Studying the
effects of blends of pre-coalescence and post-coalescence crosslinked latexes in different weight
ratios on latex film formation and properties could also be an area of potential future interest.
Studying real-time film formation of nanoparticle latexes and their blends with conventional size
(crosslinked or uncrosslinked latexes) will be useful study to understand the role of nanoparticle
latexes as coalescing aids.


![Palladium Metal Nanoparticle Size Control through Ion · Palladium Metal Nanoparticle Size Control through Ion Paired Structures of [PdCl 4] 2-with Protonated PDMAEMA . Behzad Tangeysh.](https://static.fdocuments.net/doc/165x107/5c893c4109d3f2431b8be742/palladium-metal-nanoparticle-size-control-through-palladium-metal-nanoparticle.jpg)

![Crosslinked chitosan-dextran sulfate nanoparticle for ... · drug delivery system that can provide sustained release and increased residence time on the ocular surface [ 3]. The latter](https://static.fdocuments.net/doc/165x107/5f0b5ca17e708231d4302427/crosslinked-chitosan-dextran-sulfate-nanoparticle-for-drug-delivery-system-that.jpg)