Cross, Wyatt F.. 2004. Nutrient enrichment of a detritus-based stream ecosystem
280
NUTRIENT ENRICHMENT OF A DETRITUS-BASED STREAM ECOSYSTEM: EFFECTS ON INVERTEBRATE COMMUNITY STRUCTURE AND FUNCTION by WYATT FIRMIN CROSS (Under the Direction of J. Bruce Wallace) ABSTRACT Nutrient enrichment of aquatic ecosystems is occurring globally as a result of anthropogenic changes to the availability and mobility of elements such as nitrogen (N) and phosphorus (P). Currently, very little is known about the effects of nutrient enrichment on detritus-based ecosystems despite the prevalence and global significance of detritus in most energetic budgets. This study was aimed at quantifying effects of an experimental nitrogen and phosphorus enrichment on invertebrate consumers and basal resources in a detritus-based headwater stream. Efforts were focused on examining nutrient-induced changes in a) the quantity and quality of detrital food resources and b) invertebrate growth rates, secondary production, food web dynamics, and stoichiometry. Enrichment had a large positive effect on the quality of basal resources (i.e., leaf litter, fine benthic organic matter, and epilithon) though increased N and P content. In contrast, the quantity of basal resources declined overall due to a significant reduction in benthic leaf litter. Both primary and secondary invertebrate consumers exhibited a positive response to enrichment through increased biomass and secondary production. However, there were large differences in response among individual taxa, which was related to an interaction between two dominant life history characteristics – larval lifespan
Transcript of Cross, Wyatt F.. 2004. Nutrient enrichment of a detritus-based stream ecosystem

NUTRIENT ENRICHMENT OF A DETRITUS-BASED STREAM ECOSYSTEM: EFFECTS
ON INVERTEBRATE COMMUNITY STRUCTURE AND FUNCTION
by
WYATT FIRMIN CROSS
(Under the Direction of J. Bruce Wallace)
ABSTRACT
Nutrient enrichment of aquatic ecosystems is occurring globally as a result of
anthropogenic changes to the availability and mobility of elements such as nitrogen (N) and
phosphorus (P). Currently, very little is known about the effects of nutrient enrichment on
detritus-based ecosystems despite the prevalence and global significance of detritus in most
energetic budgets. This study was aimed at quantifying effects of an experimental nitrogen and
phosphorus enrichment on invertebrate consumers and basal resources in a detritus-based
headwater stream. Efforts were focused on examining nutrient-induced changes in a) the
quantity and quality of detrital food resources and b) invertebrate growth rates, secondary
production, food web dynamics, and stoichiometry. Enrichment had a large positive effect on
the quality of basal resources (i.e., leaf litter, fine benthic organic matter, and epilithon) though
increased N and P content. In contrast, the quantity of basal resources declined overall due to a
significant reduction in benthic leaf litter. Both primary and secondary invertebrate consumers
exhibited a positive response to enrichment through increased biomass and secondary
production. However, there were large differences in response among individual taxa, which
was related to an interaction between two dominant life history characteristics – larval lifespan

and feeding behavior. Long-lived taxa (>1 year) showed little or no response to enrichment,
whereas many short-lived taxa (<1 year) showed large positive responses to enrichment.
Individual growth rates of chironomid larvae increased during enrichment, while those of
Tallaperla spp. were not affected. Enrichment had no effect on the diets of consumers, but there
were large effects on total organic matter flows to all functional feeding groups. Patterns of
consumer stoichiometry indicated distinctly lower relative P content of detritus-based consumers
in comparison to previously published data from plant- or algal-based communities. In addition,
consumer P content was elevated in the treatment stream during enrichment, demonstrating that
some insect consumers are much less homeostatic than other well-studied crustaceans. These
data suggest potential evolutionary adaptations of detritus-based consumers to nutrient poor food
resources. This dissertation should provide a basis for predicting how landscape-scale nutrient
enrichment may affect community structure, production, and material cycling in forested
headwater streams.
INDEX WORDS: Stream, Detritus, Invertebrate, Secondary production, Growth, Trophicbasis of production, Ecological stoichiometry, Food web, Leaf litter,Coweeta

NUTRIENT ENRICHMENT OF A DETRITUS-BASED STREAM ECOSYSTEM: EFFECTS
ON INVERTEBRATE COMMUNITY STRUCTURE AND FUNCTION
by
Wyatt Firmin Cross
B.A. The University of Colorado, 1994
M.S., The University of Alabama, 1999
A Dissertation Submitted to the Graduate Faculty of the University of Georgia in Partial
Fulfillment of the Requirements for the Degree
DOCTOR OF PHILOSOPHY
ATHENS, GEORGIA
2004

” 2004
Wyatt Firmin Cross
All Rights Reserved

NUTRIENT ENRICHMENT OF A DETRITUS-BASED STREAM ECOSYSTEM: EFFECTS
ON INVERTEBRATE COMMUNITY STRUCTURE AND FUNCTION
by
WYATT FIRMIN CROSS
Major Professor: J. Bruce Wallace
Committee: Amy D. RosemondDarold BatzerMark D. HunterJudy L. Meyer
Electronic Version Approved:
Maureen GrassoDean of the Graduate SchoolThe University of GeorgiaAugust 2004

iv
ACKNOWLEDGEMENTS
I am deeply indebted to the huge number of people who helped throughout this
dissertation. Most importantly, I thank my major professor (and colleague), J. Bruce Wallace,
for his support, insight, and friendship throughout my stay. I also thank the other members of
my committee, Amy D. Rosemond, Judy L. Meyer, Darold Batzer, and Mark D. Hunter for their
unique approaches and input which greatly improved the study. Amy Rosemond deserves
special thanks for putting so much thought and time into the study design, interpretation, and
writing – and for being someone I could always go to for advice. I am also grateful to my family
for periodically ‘grounding’ me, and for continual encouragement, interest, and faith that one
day, I would finish – my mother Pat, my brother Jake, and my sister-in-law Courtney. I also owe
a huge thanks to my girlfriend, Zab, for her help with many aspects of the study, and her
paramount and unconditional support during the ups and downs. I thank the many (>20)
laboratory assistants – most notably Lizzy Melda, Catherine Evans, Andrew Paloucci, and Gavin
Veitch – who spent literally thousands of hours removing bugs from mud, or weighing dirt
(glorious stuff). I also thank Boggs Benstead, Heidi Wilcox, Sue Eggert, and Sally Entrekin for
their insight and help at various stages of the study. Many graduate students in both Ecology and
Entomology were great to me during my stay, and will undoubtedly remain long-term friends.
Loads of thanks also goes out to Janice Sand for making the Institute of Ecology what it is.
Finally, thanks to Lake Oglethorpe for good times fishin’ with good brobies and peebers.

v
TABLE OF CONTENTS
Page
ACKNOWLEDGEMENTS………………………………………………………………………iv
CHAPTER
1 INTRODUCTION……………………………………………………………………1
2 CONSUMER-RESOURCE STOICHIOMETRY IN DETRITUS-BASED
STREAMS……………………………………………………………………….14
3 EFFECTS OF LONG-TERM NUTRIENT ENRICHMENT ON GROWTH AND
PRODUCTION OF TWO STREAM DETRITIVORES………………………...50
4 CONSUMER RESPONSE TO LONG-TERM NUTRIENT ENRICHMENT OF A
DETRITUS-BASED STREAM ECOSYSTEM ………………………………...97
5 NUTRIENT EFFECTS ON FOOD WEB DYNAMICS OF A DETRITUS-BASED
STREAM ………………………………………………………………………160
6 GENERAL CONCLUSIONS……………………………………………………...222
APPENDICES
A GROWTH RATE DATA………………………………………………………….229
B ABUNDANCE, BIOMASS, AND SECONDARY PRODUCTION DATA……..233
C INVERTEBRATE GUT CONTENTS (RAW PROPORTIONS)………………...257
D CONTRIBUTION OF FOOD TYPES TO INVERTEBRATE SECONDARY
PRODUCTION…………………………………………………………………268

1
CHAPTER 1
INTRODUCTION
General context
Concentrations of biologically available nutrients, such as nitrogen (N) and phosphorus
(P), are increasing in aquatic and terrestrial ecosystems worldwide (e.g., Vitousek et al. 1997,
Carpenter et al. 1998, Galloway et al. 2003). Humans have contributed substantially to this trend
through activities such as fossil fuel combustion, fertilizer production and application, mining,
and suburban/urbanization. The net effect has been large-scale mobilization of nutrients and
changes in local and global biogeochemical cycles (e.g., Caraco 1993, Vitousek et al. 1997,
Caraco and Cole 1999). Such changes can have drastic effects on species and ecosystems
because the rates of many biochemical processes are often limited by the supply of N and P. A
current challenge for ecologists is to understand the long-term consequences of increased
nutrient availability on population and ecosystem dynamics, and to develop predictive
conceptual and empirically based models to better forecast future trends. To this end,
experimental studies will be critical for predicting ecological change associated with nutrient
enrichment, providing theoretical insight, and for developing effective management strategies to
minimize potentially deleterious effects (e.g., Carpenter et al. 1995). This dissertation was part
of a long-term ecosystem-scale experiment aimed at understanding the effects of nutrient
enrichment on the structure and function of detritus-based stream ecosystems.
While much is known concerning the effects of nutrients on living plant- or algal-based
ecosystems (e.g., Tilman 1987, 1996, Vitousek and Howarth 1991, Peterson et al. 1993),

2
heretofore little attention has been given to ecosystems based on detritus. This is surprising
when one considers the prevalence and energetic importance of detritus in most food webs and
ecosystems (e.g., Odum and de la Cruz 1963). Indeed, the vast majority of global primary
production goes unconsumed by herbivores, and ultimately fuels detritus-based food webs (e.g.,
O’Neill and Reichle 1980). Research on nutrient effects in these systems is critical because the
response of detritus-based communities and ecosystem processes may be quite different than
those documented in plant- or algal-based systems.
A fundamental difference between detrital and plant-based systems is the composition of
the predominant basal resource. In detrital food webs, the resource base is largely heterotrophic,
and detritus and associated microbes (i.e., bacteria and fungi) occupy a similar trophic position
as living plants or algae. This has important implications because nutrient enrichment can
enhance the productivity of these detritus-associated microbes and accelerate the loss or
mineralization of carbon at the base of the food web (e.g., Gulis and Suberkropp 2003). In
contrast, nutrient enrichment of plant-based systems generally leads to a net carbon gain among
producers at the base of the food web (e.g., Tilman 1996, Slavik et al. 2004)
Freshwater ecosystems
Freshwater ecosystems are among the most threatened by nutrient enrichment (Carpenter
et al. 1998). This is due, in part, to their low-lying position in the landscape, acting as recipients
and vectors for nutrient loading, processing, and transport. Additionally, freshwater systems are
subject to considerable human development of the riparian zone leading to significant nutrient
loading from point- and non point-sources (e.g., Caraco and Cole 1999). In general, our
understanding of nutrient enrichment effects on freshwater ecosystems comes from theoretical
and empirical work conducted in algal-based systems. In these systems, studies have shown that

3
enrichment can lead to increased algal biomass or productivity (e.g., Schindler et al. 1978, Hart
and Robinson 1990, Peterson et al. 1993, Mazumder and Edmonson 2002), changes in algal
nutrient content (e.g., Stelzer and Lamberti 2001), and shifts in algal community structure or
species diversity (e.g., Barnese and Schelske 1994). Such nutrient-induced alterations to the
base of these food webs may ‘cascade up’ (Hunter and Price 1992) to primary and secondary
consumers, having potentially significant effects on life history traits, community structure, and
secondary production (e.g., Peterson et al. 1993, Mazumder and Edmonson 2002, Slavik et al.
2004). In some cases, enrichment can indirectly modify the strength or importance of top-down
consumer effects (e.g., Rosemond et al. 1993, Peterson et al. 1993, Forkner and Hunter 2000).
In detritus-based stream ecosystems, terrestrially-derived leaf litter provides the dominant
energetic source for microbial and metazoan productivity, and in-stream algal production is
generally minimal (e.g., Webster et al. 1997, Wallace et al. 1999). Thus, nutrient enrichment
effects are manifested through changes to detrital resources. Considerable research has
examined the effects of nutrient enrichment on the decomposition (e.g., Elwood et al. 1981,
Meyer and Johnson 1983, Chadwick and Huryn 2003, Gulis and Suberkropp 2003) and quality
of detritus (Howarth and Fisher 1976, Cross et al. 2003, Stelzer et al. 2003), as well as biomass
and production of detritus-associated microbes (Suberkropp 1995, Gulis and Suberkropp 2003,
Rosemond et al. 2002, Ramirez et al. 2003). In general, nutrient effects on detrital quality are
positive (via increased microbial biomass and nutrient content) and effects on quantity are
negative (via accelerated decomposition). Few studies, however, have examined how these basal
changes affect the long-term dynamics of higher consumers (but see Rosemond et al.2002,
Ramirez and Pringle, in review); herein lies the primary goal of this dissertation. A conceptual
working hypothesis which provided the theoretical backdrop for this project is depicted in Figure

4
1.1. In low-nutrient detritus-based streams (Figure 1.1A), benthic leaf litter is expected to
decline slowly each year providing sufficient carbon throughout the year to support consumer
growth and production. However, the quality of this detritus is relatively low. In nutrient-
enriched streams (Figure 1.1B), rapid decomposition and mineralization of organic matter may
lead to periods of time during the year when consumers are limited by carbon availability. The
quality of this enriched organic matter, however, is expected to be high. To date, few studies
have been conducted for sufficient duration to test this working hypothesis. This dissertation
represents one of the first attempts to quantify in detail the response of detritivorous and
predatory consumers to a long-term experimental enrichment (i.e., nitrogen and phosphorus) of a
detritus-based ecosystem. The approach taken was to examine effects of nutrient enrichment at
multiple hierarchical scales ranging from elemental patterns to ecosystem processes.
Experimental design
A paired-catchment design was used to examine long-term effects of nutrient enrichment.
Streams draining two adjacent catchments at Coweeta Hydrologic Laboratory, North Carolina,
were chosen for study because of similar physical, chemical, and biological characteristics (see
Table 3.1). Research was conducted in both streams before and during 2 years of experimental
enrichment. The mechanics of the experimental set-up are described in detail in Chapters 3, 4,
and 5.
This ecosystem-level experiment was not replicated, employing 1 reference stream and 1
treated stream. This approach has been lauded for its realism and scale (e.g., Carpenter et al.
1995, Schindler 1998, Oksanen 2001), as well as criticized for its lack of strict replication or
inference potential (Hurlbert 1984, 2004). The limitations of our design are recognized, but we

5
felt that the scale of manipulation was essential for predicting realistic effects. Such catchment-
level manipulations have indeed been critical for advancing our understanding of ecosystem
dynamics and effects of perturbations (e.g., Likens et al. 1969, Wallace et al. 1997, Schindler
1998, Pace et al. 2004). Throughout the study, time-series data were examined statistically using
randomized intervention analysis (Carpenter et al. 1989, Stewart-Oaten 2003, Murtaugh 2003).
This method compares differences between the reference and treated systems before and after an
experimental manipulation (i.e., in this case, nutrient enrichment). Generally, this statistic tests
the null hypothesis of no change in the treated system relative to the reference system after the
manipulation.
Dissertation
The goal of Chapter 2 is to describe the elemental composition of consumers and basal
resources in the enriched stream and the reference stream. This chapter is a preliminary attempt
to test some of the basic theoretical tenets of ecological stoichiometry. In doing so, it sets the
stage for later chapters by reporting changes in the quality of organic matter and describing
trends in nutrient content of invertebrates. Basic descriptive work on elemental composition of
food webs (particularly non-algal) will be critical for determining the robustness of
stoichiometric theory.
Chapter 3 examines in detail the response of 2 dominant detritivores (i.e., non-
Tanypodinae chironomids and Tallaperla spp.) to nutrient enrichment. The goal was to contrast
growth and secondary production of 2 taxa with highly disparate larval lifespan and feeding
behavior. Such detailed growth studies were not logistically possible for all dominant primary
consumers, so it was my hope that these taxa would represent opposite ends of the ‘slow-fast’

6
life history continuum. The differential response of these consumers provides insight into the
interaction between lifespan and feeding behavior in determining the response of invertebrates to
enrichment.
Chapter 4 examines the effects of enrichment on the structure and secondary production
of the entire invertebrate community, as well as the storage dynamics of coarse and fine
particulate organic matter. In addition relationships between predator and prey production are
examined. Results are placed in a broader context by comparison with multiple years (21) of
data collected from headwater streams at Coweeta. This chapter will be among the first to
quantify long-term effects of nutrient enrichment on community secondary production in a
detritus-based ecosystem.
The final study chapter (5) explores the effects of nutrient enrichment on food web
dynamics. This study was designed to better understand mechanisms responsible for
community-level changes in secondary production (Chapter 4). I quantified the trophic basis of
production for all dominant consumers in both streams before and during enrichment. Organic
matter flow food webs were also constructed to determine whether the magnitude or direction
(i.e., major taxa involved) of flows was affected by enrichment. Such an approach can aid in
determining whether nutrient-induced changes in secondary production were due to actual shifts
in the diets of consumers or changes in the quality or basal resources.
Literature Cited
Barnese, L. E. and C. L. Schelske. 1994. Effects of nitrogen, phosphorus, and carbon
enrichment on planktonic and periphytic algae in a softwater, oligotrophic lake in Florida,
USA. Hydrobiologia 277:159-170.

7
Caraco, N. F. 1993. Disturbance of the phosphorus cycle: a case of indirect effects of human
activity. Trends in Ecology and Evolution 8:51-54.
Caraco, N. F. and J. J. Cole. 1999. Human impact on nitrate export: an analysis using major
world rivers. Ambio 28:167-170.
Carpenter, S. R., N. F. Caraco, D. L. Correll, R. W. Howarth, A. N. Sharpley, and V. H. Smith.
1998. Nonpoint pollution of surface waters with phosphorus and nitrogen. Ecological
Applications 8:559-568.
Carpenter, S. R., S. W. Chisholm, C. J. Krebs, D. W. Schindler, and R. F. Wright. 1995.
Ecosystem experiments. Science 269:324-327.
Carpenter S. R., T. M. Frost, D. Heisey, and T. K. Kratz. 1989. Randomized intervention
analysis and the interpretation of whole-ecosystem experiments. Ecology 70:1142-1152.
Chadwick, M. A. and A. D. Huryn. 2003. Effect of a whole-catchment N addition on stream
detritus processing. Journal of the North American Benthological Society 22:194-206.
Cross, W. F., J. P. Benstead, A. D. Rosemond , and J. B. Wallace. 2003. Consumer-resource
stoichiometry in detritus-based streams. Ecology Letters 6:721-732.
Elwood, J. W., J. D. Newbold, A. F. Trimble, and R. W. Stark. 1981. The limiting role of
phosphorus in a woodland stream ecosystem – effects of P-enrichment on leaf
decomposition and primary producers. Ecology 62:146-158.
Forkner, R. E. and M. D. Hunter. 2000. What goes up must come down? Nutrient addition and
predation pressure on oak herbivores. Ecology 81:1588-1600.
Galloway, J. N., J. D. Aber, J. W. Erisman, S. P. Seitzinger, R. W. Howarth, E. B. Cowling, and
B. J. Cosby. 2003. The nitrogen cascade. BioScience 53:341-356.
Gulis, V. and K. Suberkropp. 2003. Leaf litter decomposition and microbial activity in nutrient-

8
enriched and unaltered reaches of a headwater stream. Freshwater Biology 48:123-134.
Hart, D. D., and C. T. Robinson. 1990. Resource limitation in a stream community: phosphorus
enrichment effects on periphyton and grazers. Ecology 71:1494-1502.
Howarth, R. W. and S. G. Fisher. 1976. Carbon, nitrogen, and phosphorus dynamics during leaf
decay in nutrient-enriched stream micro-ecosystems. Freshwater Biology 6:221-228.
Hunter, M. D. and P. W. Price. 1992. Playing chutes and ladders: heterogeneity and the relative
roles of bottom-up and top-down forces in natural communities. Ecology 73:724-732.
Hurlbert, S. H. 1984. Pseudoreplication and the design of ecological field experiments.
Ecological Monographs 54:187-211.
Hurlbert, S. H. 2004. On misinterpretations of pseudoreplication and related matters: a reply to
Oksanen. Oikos 104:591-597.
Likens, G. E., F. H. Bormann, N. M. Johnson, D. W. Fisher, and R. S. Pierce. 1969. Effects of
forest cutting and herbicide treatment on nutrient budgets in the Hubbard Brook
watershed-ecosystem. Ecological Monographs 40:23-47.
Mazumder, A. and J. A. Edmonson. 2002. Impact of fertilization and stocking on trophic
interactions and growth of juvenile sockeye salmon (Oncorhynchus nerku). Canadian
Journal of Fisheries and Aquatic Sciences 59:1361-1373.
Meyer, J. L. and C. Johnson. 1983. The influence of elevated nitrate concentration on rate of
leaf decomposition in a stream. Freshwater Biology 13: 177-183.
Murtaugh, P. A. 2003. On rejection rates of paired intervention analysis: reply. Ecology
84:2799-2802.
Odum, E. P and A. A. de la Cruz. 1963. Detritus as a major component of ecosystems. AIBS
Bulletin 13:39-40.

9
Oksanen, L. 2001. Logic of experiments in ecology: is pseudoreplication a pseudoissue? Oikos
94:27-38.
O’Neill, R. V. and D. A. Reichle. 1980. Dimensions of ecosystem theory. In: R.
H. Waring, (ed) Forests: Fresh Perspectives From Ecosystem Analysis. Oregon State
University Press, Corvallis, Oregon.
Peterson, B. J., L. Deegan, J. Helfrich, J. E. Hobbie, M. Hullar, B. Moller, T. E. Ford, A.
Hershey, A. Hiltner, G. Kipphut, M. A. Lock, D. M. Fiebig, V. McKinley, M. C. Miller,
J. R. Vestal, R. Ventullo, and G. Volk. 1993. Biological responses of a tundra river to
fertilization. Ecology 74:653-672.
Ramirez, A. and C. M. Pringle. In review. Response of detrital consumers to phosphorus levels
in lowland tropical streams.
Ramirez, A., C. M. Pringle, and L. Molina. 2003. Effects of stream phosphorus levels on
microbial respiration. Freshwater Biology 48:88-97.
Rosemond, A. D., P. J. Mullholland, and J. W. Elwood. 1993. Top-down and bottom-up control
of stream periphyton: effects of nutrients and herbivores. Ecology 74:1264-1280.
Rosemond, A. D., C. M. Pringle, A. Ramirez, M. J. Paul, and J. L. Meyer. 2002. Landscape
variation in phosphorus concentration and effects on detritus-based tropical streams.
Limnology and Oceanography 47:278-289.
Schindler, D. W. 1998. Replication versus realism: the need for ecosystem-scale experiments.
Ecosystems 1:323-334.
Schindler, D. W., E. J. Fee, and T. Rusczynski. 1978. Phosphorus input and its consequences
for phytoplankton standing crop and production in the experimental lakes area and in
similar lakes. Journal Fisheries Research Board of Canada 35:190-196.

10
Slavik, K., B. J. Peterson, L. A. Deegan, W. B. Bowden, A. E. Hershey, and J. E. Hobbie. 2004.
Long-term responses of the Kuparuk river ecosystem to phosphorus enrichment. Ecology
85:939-954.
Stelzer, R. S., J. Heffernan, and G. E. Likens. 2003. The influence of dissolved nutrients and
particulate organic matter quality on microbial respiration and biomass in a forest stream.
Freshwater Biology 48:1925-1937.
Stelzer, R. S. and G. A. Lamberti. 2001. Effects of N:P ratio and total nutrient concentration on
stream periphyton community structure, biomass, and elemental composition.
Limnology and Oceanography 46:356-367.
Stewart-Oaten, A. 2003. On rejection rates of paired intervention analysis: comment. Ecology
84:2795-2799.
Suberkropp, K. 1995. The influence of nutrients on fungal growth, productivity, and sporulation
during leaf breakdown in streams. Canadian Journal of Botany 73:s1361-s1369.
Tilman, D. 1987. Secondary succession and the pattern of plant dominance along experimental
nitrogen gradients. Ecological Monographs 57:189-214.
Tilman, D. 1996. Biodiversity: population versus ecosystem stability. Ecology 77:350-363.
Vitousek, P. M., J. D. Aber, R. W. Howarth, G. E. Likens, P. A. Matson, D. W. Schindler, W. H.
Schlesinger, and D. G. Tilman. 1997. Human alteration of the global nitrogen cycle:
sources and consequences. Ecological Applications 7:737-750.
Vitousek, P. M. and R. W. Howarth. 1991. Nitrogen limitation on land and in the sea: how can
in occur? Biogeochemistry 13:87-115.
Wallace J. B., S. L. Eggert, J. L. Meyer and J. R. Webster. 1997. Multiple trophic levels of a
forest stream linked to terrestrial litter inputs. Science 277:102-104.

11
Wallace J. B., S. L. Eggert, J. L. Meyer and J. R. Webster. 1999. Effects of resource limitation
on a detrital-based ecosystem. Ecological Monographs 69:409-442.
Webster, J. R., J. L. Meyer, J. B. Wallace, and E. F. Benfield. 1997. Organic matter dynamics
in Hugh White Creek, Coweeta Hydrologic Laboratory, North Carolina, USA. Journal of
the North American Benthological Society 16:74-78.

12
Figure 1.1. Conceptual diagram of leaf litter quantity and quality in detritus-based streams at
low (A) and high (B) nutrient concentrations. Black arrows represent pulsed annual inputs of
allochthonous terrestrial leaf litter (i.e., figure is depicting 3 years). In streams with low nutrient
concentrations (A), leaf litter is expected to decline each year at a relatively slow rate, and its
quality is expected to be low because of low microbial biomass and low nutrient content. In
streams with high nutrient concentrations (B), leaf litter is expected to decline rapidly each year
with periods of time (gray-shaded areas) in which consumers may be limited by carbon
availability. However, the quality of this leaf liter is expected to be high because of increased
microbial biomass and nutrient content.

13
A. Low nutrient concentrations
B. High nutrient concentrations
Gray-shaded areas represent times of potential carbon limitation
annual pulses of leaf litter
Quantity Quality
Low
time
leaf
litte
r
Quantity Quality
High
time
leaf
litte
r

14
CHAPTER 2
CONSUMER-RESOURCE STOICHIOIMETRY IN DETRITUS-BASED STREAMS1
________________________1Cross, W. F., J. P. Benstead, A. D. Rosemond, and J. B. Wallace. 2003. Ecology Letters 6:721-732. Reprinted here with permission of publisher.

15
Abstract
Stoichiometric relationships between consumers and resources in detritus-based
ecosystems have received little attention, despite the importance of detritus in most food webs.
We analyzed carbon (C), nitrogen (N), and phosphorus (P) content of invertebrate consumers
and basal food resources in two forested headwater streams (one reference, one nutrient-
enriched). We found large elemental imbalances between consumers and food resources
compared to living plant-based systems, particularly in regard to P content, which were reduced
with enrichment. Enrichment significantly increased nutrient content of food resources
(consistent with uptake of N and P by detritus-associated microbes). P content of some
invertebrates also increased in the enriched vs reference stream, suggesting deviation from strict
homeostasis. Nutrient content varied significantly among invertebrate functional feeding groups,
orders, and to some extent, size classes. Future application of stoichiometric theory to detritus-
based systems should consider the potential for relatively large consumer-resource elemental
imbalances and P storage by insect consumers.

16
Introduction
Ecological stoichiometry is a conceptual framework that considers the relative balance of
key elements in trophic interactions (Reiners 1986, Elser et al. 1996, Elser & Urabe 1999, Elser
et al. 2000c, Sterner & Elser 2002). Within this framework, food items consumed are essentially
packages of elements that may or may not be in balance with a consumer’s elemental
requirements. Limiting nutrients (e.g., N or P) are retained at higher efficiencies by the
consumer, while others are consumed in excess and are egested or excreted. Data collected from
a wide variety of invertebrates suggest that a consumer’s chemical composition (i.e.,
carbon:nitrogen:phosphorus [C:N:P] ratio) is relatively homeostatic regardless of the chemical
composition of its food (e.g., Hessen & Lyche 1991, Elser et al. 2000a, Sterner & Elser 2002).
According to stoichiometric theory, and considerable empirical support, the nutrient
content and relative growth rate of a given consumer ultimately determine its nutritional
requirements (e.g., Sterner & Elser 2002). Consumers (or specific life stages) with high body N
or P content and high growth rates require food that is high in N or P, respectively, to maintain
optimal growth. These nutrient-rich consumers are also most susceptible to reductions in growth
or fitness if food resources are low in N or P relative to body demand (e.g., Sterner et al. 1993).
Alternatively, consumers (or life stages) with low body N or P or low relative growth rates have
lower requirements for these elements, and are less likely to suffer from reduced food quality
(e.g., Schulz & Sterner 1999).
Several key factors are known to contribute to intra- and interspecific variation in
consumer nutrient content. For example, a number of studies have linked variation in organism
P content to differences in specific growth rate (e.g., Main et al. 1997, Elser et al. 2000c). Rapid
growth rates during early stages of development or among species with fast turnover rates (i.e., r-

17
selected species) have been correlated with high levels of P-rich ribosomal RNA and associated
high body P demand (Elser et al. 2000c). In addition, variation in body nutrient content can arise
from differences among organisms (or life stages) in the relative allocation of structural
biomolecules such as chitin (high N:P ratio) or bone (high P) (Elser et al. 1996). Thus, to some
degree, differences in ontogeny, life history strategy, and relative allocation of structural
biomolecules may all contribute to the nutritional requirements of a given consumer.
In essence, stoichiometric theory implies that different food types do not have inherent
‘qualities’ per se; food quality is relative based on the nutritional requirements of individual
consumers. For this reason, attention should be focused on the relative imbalances between
consumer C:N:P and that of their food, instead of relying solely on measures of food quantity or
nutrient content. Such knowledge of elemental imbalance may allow predictions about which
taxa or life stages are most limited by nutrients (e.g., Urabe & Watanabe 1992), which taxa
should respond positively (in terms of growth and secondary production) to increased nutrient
content of food, and which taxa should dominate high- versus low-nutrient environments (e.g.,
Elser et al. 1988).
Important questions remain, however, concerning the importance of other evolutionary or
ecological characteristics in determining consumer nutrient content (Frost et al. 2003). For
example, little is known about relationships between phylogenetic position and nutrient content
(but see Fagan et al. 2002, Vanni et al. 2002), or whether organisms adapt, via natural selection,
to low or high-nutrient food resources. Moreover, basic information is still lacking about how
consumer trophic level or feeding mode (i.e., functional feeding group, sensu Cummins 1973)
may affect body nutrient content. However, some evidence suggests that nutrients tend to

18
concentrate among consumers at higher trophic levels (e.g., Fagan et al. 2002, Sterner & Elser
2002).
Most empirical support for stoichiometric theory has come from algal-based food webs in
lentic environments (Sterner & Elser 2002). In these systems, a stoichiometric perspective has
led to considerable progress in understanding trophic dynamics, nutrient cycling, and
competitive interactions (see Sterner & Elser 2002 and references therein). However, we still
lack basic information about consumer-resource stoichiometry in other types of ecosystems, such
as those based on detritus (but see Higashi et al. 1992). Study of detritus-based food webs is
crucial because they represent the dominant pathway of energy flow in most ecosystems (i.e.,
>80 % of plant biomass ultimately ends up in detritus-based food webs; O’Neill & Reichle 1980,
Wetzel & Ward 1992). Moreover, the nutritional quality of detritus is likely to be extremely low
relative to the demands of detritivores (e.g., Enriquez et al. 1993), leading to potentially large
elemental imbalances and growth constraints. In addition, there has been little research on
benthic communities that are typically dominated by insect taxa (but see Frost & Elser 2002,
Frost et al. 2002 a, b, Stelzer & Lamberti 2002, Frost et al. 2003).
Our primary objective in this paper was to test some of the basic tenets of ecological
stoichiometry in a detritus-based ecosystem by contrasting elemental composition of larval
insects and basal resources in two adjacent headwater streams of different trophic status (a
nutrient poor vs. an experimentally nutrient-enriched stream). We determined the effects of
nutrient enrichment on elemental composition of basal resources, and then examined how this
enrichment affected the elemental composition of higher trophic levels and consumer-resource
elemental imbalances. We also compared elemental composition of invertebrates among major
taxonomic (orders), functional (functional feeding groups [FFG]), and life history (length of

19
larval lifespan, body size) categories to extend our general understanding of consumer-resource
stoichiometry to these nutrient-poor detritus-based food webs.
Methods
Study Site
This study was conducted in two adjacent headwater streams at the Coweeta Hydrologic
Laboratory in Macon Co., North Carolina, USA. Coweeta is a large (1626 ha) heavily forested
basin located in the Blue Ridge physiographic province of the southern Appalachian Mountains
(see Swank & Crossley 1988). A network of small 1st-3rd order streams drains the Coweeta
basin. Vegetation is dominated by mixed hardwoods (primarily maple, poplar, and oak) and a
dense understory of Rhododendron, which shades the streams for most of the year. The two
streams used in this study drain the relatively small catchments (C) 53 and 54 (hereafter, C53
and C54). In general, C53 and C54 have similar physical and chemical characteristics (i.e.,
catchment area, elevation, slope, discharge, temperature, pH, conductivity; Lugthart & Wallace
1992) but differ considerably in their concentrations of inorganic N and P as a result of an
experimental nutrient enrichment. Nutrients (NH4NO3, K2HPO4, and KH2PO4) were dripped into
C54 via a solar-powered metered-dose pump roughly every 10 m along the entire length of the
stream for 2 years (July 2000 – August 2002). Before enrichment, stream water in both
catchments was extremely low in N and P (ca. 29 µg (NH4 + NO3)-N/L, 7 µg/L SRP, biweekly
samples, September 1999 – June 2000). After enrichment, nutrient levels in the enriched stream,
C54, averaged 383 µg (NH4 + NO3)-N/L and 46 µg/L SRP (A.D. Rosemond, unpublished data).
Invertebrate community structure was similar in both streams, and has been extensively
described elsewhere (e.g., Lugthart & Wallace 1992). Headwater streams at Coweeta are

20
extremely heterotrophic, and detritus, mostly in the form of leaf litter from the surrounding
catchment, provides >90% of the energy base for microbial and invertebrate production (e.g.,
Wallace et al. 1997b). In-stream primary production is minimal (ca. 4-8 g C m-2 y-1), and
generally constitutes <1% of the total carbon entering these streams (Wallace et al. 1997a).
Basal Resources
Leaf litter – Submerged leaf litter was collected from C53 and C54 on a monthly basis
from June 1999 to August 2002 for analysis of C, N, and P content. Five leaves were collected
at 5 random points along each stream on each date (i.e., 25 total leaves/date) without regard to
taxon. Monthly estimates of leaf C:N:P, therefore, represent a mixture of leaf species roughly in
proportion to their natural abundance each month. Litter samples were transported to the
laboratory, dried, and homogenized. Samples were subsequently weighed on a microbalance to
the nearest µg. For C and N analysis, samples were weighed in tin capsules and analyzed with a
Carlo Erba NA 1500 CHN analyzer. For P analysis, samples were weighed into acid-washed
and pre-ashed ceramic crucibles, ashed at 500°C, acid digested, and analyzed
spectrophotometrically (ascorbic acid method; APHA 1998). Ground pine needles (U.S.
National Institute of Standards and Technology, 1575a) and poplar leaves (Analytical Chemistry
Laboratory, University of Georgia) were used as external standards for P and N analyses
(recovery 99% for P, 102% for N). All data are presented as either %C, N, and P of ash-free dry
mass or as molar ratios.
Epilithon- Unglazed ceramic tiles (190 x 190 mm) were placed in C53 and C54 on 2
April 2002 to allow natural colonization of epilithon. We chose this pre-leaf-out period because
it encompasses the time of peak chlorophyll a standing crop in Coweeta streams (typically ~10

21
mg/m2; J. Greenwood, University of Georgia, personal communication). After 6 weeks, tiles
were removed and immediately frozen. When tiles were thawed, epilithon was removed, filtered
onto a glass fiber filter (pore size 45µm), dried at 50°C for >72h, and analyzed for C, N, and P as
for other organic material. Freezing and thawing of tiles can potentially lyse algal cells, causing
nutrient-rich cell contents to be lost upon filtration. Nonetheless, relative differences between
streams in epiltihon nutrient content remain valid.
Fine particulate organic matter (FPOM)- Deposited inorganic and organic material
(upper 5-10 cm) was collected haphazardly by hand from the entire length of C53 and C54 on 2
April 2002. Fine particulate organic matter retained on metal sieves (pore size <4.75 mm and
>125 µm) was dried, homogenized, and analyzed for total C, N, and P as above.
Invertebrates
Invertebrates were collected from C53 and C54 between 14 March and 2 April 2002.
Organic and inorganic substratum was collected from all dominant stream habitats (i.e., leaf
packs, cobble, depositional areas, and bedrock outcrops) along the entire length of each stream.
Substratum was rinsed onto stacked sieves with pore sizes ranging from 125 µm to 4.75 mm.
Large invertebrates were removed live from material retained on sieves >1 mm. Chironomids
and early instars of other taxa (all >1 mm in length) were removed live under a dissecting
microscope from material retained on smaller sieves (125 – 250 µm mesh size). Invertebrates
were frozen within 4 h of collection. Upon thawing, invertebrates were identified, measured in
length to the nearest mm, their gut contents carefully removed (except chironomids and first
instars of a few other taxa), refrozen at –80°C, lyophilized, homogenized, weighed, and analyzed
for total C, N, and P as above. Analysis of C, N, and P content was generally conducted on

22
composite samples of a given taxon consisting of 3-100 individuals of similar-size (within 1 mm
size classes). Otherwise, if enough material was present, chemical analysis was performed on
individual larvae. The majority of samples contained enough material for C, N, and P analysis;
however, when sample weight was limited, we restricted our analysis to %P. Biomass of
individuals was obtained using previously established length-weight regressions for Coweeta
stream taxa (Benke et al. 1999). Functional feeding groups (FFG) were designated according to
Merritt and Cummins (1996) and knowledge of the local fauna based on gut-content analyses (J.
B. Wallace, unpublished data). Functional feeding groups, which are based primarily on mouth-
part morphology and behavioral characteristics (Cummins 1973), included scrapers (scrape
biofilm from hard surfaces), shredders (consume primarily leaf material), collector-gatherers
(gather fine organic particles), collector-filterers (filter fine particles), and predators (consume
other animals).
Statistical analyses
Leaf litter- We analyzed the time series of leaf litter nutrient content using randomized
intervention analysis (RIA, Carpenter et al. 1989). RIA uses paired, before-and-after time-series
data from a manipulated and a reference system to detect changes caused by the manipulation. In
this study, RIA was used to test the null hypothesis that no change in leaf litter nutrient content
occurred in the treatment stream relative to the reference stream following the initiation of
nutrient enrichment.
Invertebrates- Overall differences between streams in invertebrate %C, %N, %P, C:P,
N:P, and C:N were assessed with Kolmogorov-Smirnov goodness-of-fit tests. To test the null
hypothesis of no difference in invertebrate nutrient content between streams (i.e., chemical

23
homeostasis), samples of similarly sized taxa (within 2 mm) from both streams were compared
with paired t-tests. Differences among functional feeding groups and orders were analyzed with
two-way analysis of variance; significant ANOVAs were followed by Tukey’s HSD multiple
comparisons. Relationships between body size (mg AFDM) or length of larval lifespan (days)
and invertebrate nutrient content were examined with linear regression. All such regressions
were performed on the entire data set, within functional feeding groups, and within orders. Data
were either log(x+1) or arcsin-square root transformed to meet assumptions of normality and
homoscedasticity. No adjustments were made to a for protection against experimentwise error
(e.g., Bonferroni) because of relatively low statistical power, and the potential for increased type
II error (Perneger 1998).
Results
Basal resources
Nutrient enrichment of C54 resulted in significantly higher nutrient content of leaf litter,
including increases in %P, and consequent decreases in N:P and C:P ratios relative to leaf litter
in the control stream (P < 0.00001 for all three tests, RIA; Fig. 2.1, Table 2.1). Post-enrichment
values of P content were on average 59% higher in C54 compared to C53 (range 14-111%).
There was also a small, but significant (P = 0.04, RIA), increase in %C in the enriched stream
(data not shown). No change in %N or C:N ratio of leaf litter was observed (see Table 2.1 for
C:N; %N data not shown).
FPOM contained slightly more P and N, and less C in the enriched stream than in the
reference stream (P: 0.1% vs. 0.07%; N: 0.9% vs. 0.8%; C: 23% vs. 25%). These minor
differences were reflected in FPOM elemental ratios (Table 2.1).

24
Epilithon in the enriched stream contained ~4X more P and ~5.5X more N than in the
reference stream (P: 0.08% vs. 0.02%; N: 12.1% vs. 2.2%). Enrichment also increased %C in
the enriched stream relative to the reference (27.7% vs. 16.5%), presumably because of
differences in standing crop, and a higher proportion of organic (including microbes) vs.
inorganic matter on tiles in the enriched stream. Epilithon C:P, N:P, and C:N ratios differed
correspondingly (Table 2.1).
Invertebrates
We analyzed the nutrient content of 40 invertebrate taxa from C53 and C54, ranging from
1–36 mm in length and 0.002 – 86 mg AFDM in weight. Larval lifespan of these taxa ranges
from < 2 weeks to > 3 years (see Wallace et al. 1999). Invertebrates exhibited considerable
variability in %P, %N, and %C (Fig. 2.2). Overall, the coefficient of variation in %P (CV =
52%) was much higher than %N (CV = 13%) or %C (CV = 8%). Coefficients of variation for
%P, %N, and %C were, on average, 30-45% lower in the enriched stream (C54) than in the
reference stream (C53). High variability of %P was reflected in invertebrate C:P, N:P, and C:N
ratios, where overall variability was much higher in C:P (CV = 60%) and N:P (CV = 51%) ratios
than in the C:N (CV = 15%) ratio (Fig. 2.2). Coefficients of variation for C:P, N:P, and C:N
were also 30-40% lower in the enriched stream (C54) than in the reference stream (C53).
Overall, there was no difference in %P, %C, %N, C:P, N:P, and C:N ratios of invertebrates
between C53 and C54 (Kolmogorov-Smirnov tests, P > 0.05).
Paired comparisons of similar-sized taxa between C53 and C54 revealed patterns that
indicate some invertebrate taxa may not be strictly homeostatic with regard to body nutrient
content. Invertebrates in the enriched stream had significantly higher %P (P = 0.03) and lower

25
C:P (P = 0.01) and N:P (P = 0.02) ratios than in the reference stream (Fig. 2.3). No difference
was detected in %C, %N, or C:N ratios among paired taxa between streams (P > 0.05).
Significant differences in %P, %N, and %C were found among major insect orders when
data from both streams were considered together (two-way ANOVA, order: P < 0.0001, Fig.
2.4). Trichoptera and Ephemeroptera were generally lower in %P and %N than Diptera,
Odonata, and Plecoptera (Fig 2.4). Significant differences also existed in C:P, N:P, and C:N
among the major insect orders (two-way ANOVA, order: P < 0.001, Fig. 2.4). The only
significant difference found in invertebrate nutrient content between streams was among
Trichoptera, in which C:P ratios were lower in the enriched stream (C54) than in the reference
stream (C53) (two-way ANOVA, stream: P = 0.03, stream x order interaction: P = 0.002, Fig.
2.4).
Percent P, %N, and %C varied significantly among invertebrate FFGs when considering
all data together (two-way ANOVA, FFG: P < 0.0001, Fig. 2.5). Again, most of the variation
was associated with P content. On average, predators contained more P and N than the other
FFGs. There were no significant effects of enrichment on %P, %N, and %C for any FFG (two-
way ANOVA, stream and stream x FFG interaction non-significant: P > 0.05). Carbon:P and
C:N ratios also differed significantly among FFGs (two-way ANOVA, FFG: P < 0.001, Fig. 2.5).
Carbon:P ratios of shredders were higher than those of collector-gatherers and predators.
Carbon:N ratios were higher among shredders and collector-filterers than predators. No
difference in N:P ratios was apparent among FFGs. Additionally, there were no overall
differences in C:P, N:P, and C:N ratios between C53 and C54 (two-way ANOVA, stream and
interaction non-significant: P > 0.05).

26
Invertebrate body size (mg AFDM) did not explain any significant variation in
invertebrate nutrient content when all data were considered together (linear regression, all P
values > 0.05), and when invertebrate orders were examined separately for each stream.
However, when body size-nutrient content relationships were examined by FFG irrespective of
stream, some significant patterns emerged. Collector-gatherer C:P (r2 = 0.58, P < 0.01), N:P (r2 =
0.48, P < 0.01), and C:N (r2 = 0.21, P = 0.1) ratios all increased with body size (mg AFDM); %P
decreased with body size (r2 = 0.25, P = 0.04). In addition, collector-filterers exhibited an
increase in N:P ratio (r2 = 0.27, P = 0.08) and a concomitant decrease in %P (r2 = 0.24, P = 0.05)
with body size. No such relationships existed for scrapers, shredders, or predators.
No significant relationships were found between larval lifespan (d) and any measure of
body nutrient content.
Discussion
Basal food resources in streams at Coweeta had very low nutrient content (Table 2.1).
Leaf litter, which forms the basis for most heterotrophic production (Wallace et al. 1997b), was
extremely low in N and P. Carbon:P and N:P ratios were among the highest reported for
vascular plant detritus (Enriquez et al. 1993). These values are also considerably higher than
those of living terrestrial foliage (Table 2.1), suggesting nutrient loss via absorption by trees
before leaf abscission, the dominance of structural C compounds in leaf litter, and leaching of
soluble N and P upon contact with stream water. Increases in P of leaf litter after enrichment
coincided with significant increases in bacterial and fungal production on leaves (K. Suberkropp,
unpublished data), suggesting increased microbial biomass associated with leaf litter as the
primary cause of changes in nutrient content.

27
Nitrogen and P content of epilithon was much higher than that of leaf litter, but still low
relative to many previously reported values for streams (Table 2.1, e.g., Kahlert 1998: C:P range
(99-603), N:P range (10-49)). Fine particulate organic matter (<4 mm, FPOM), which is also
directly consumed by many stream invertebrates, generally had a higher nutrient content than
large leaf particles (Table 2.1; Sinsabaugh & Linkins 1990); this was likely a result of increased
surface:volume ratios leading to a higher proportion of nutrient-rich microbes (i.e., bacteria) on
smaller particles, and the presence of microbial and animal exudates within stream FPOM
(Findlay et al. 2002).
Carbon:P and N:P ratios of stream consumers were considerably higher than those of
invertebrate consumers in littoral benthic, planktonic, and terrestrial environments (Table 2.1).
C:N ratios of consumers did not differ among these environments (Table 2.1). Differences in P
content were unexpected, as invertebrate nutrient content has been thus far reported as relatively
constant across a wide range of systems with very different basal resource elemental composition
(Table 2.1, e.g., Elser et al. 2000a, Frost et al. 2003). Such low relative P content may be
characteristic of detritus-based systems. Nutritional constraints in these systems may be severe
enough to cause evolutionary adaptation to low nutrient food resources via lowered body nutrient
content and hence lowered requirements for P (e.g., Elser et al. 2000b, Fagan et al. 2002). In
addition, some prominent detritivores at Coweeta (e.g., Tipula spp., Diptera) harbor gut flora or
fauna that potentially aid in the assimilation of low nutrient leaf litter (e.g., Klug & Kotarski
1980), an adaptation also seen among wood-eating termites (Higashi et al. 1992).
To estimate simple consumer-resource elemental imbalances, we calculated arithmetic
differences between the C:P and C:N of consumers and their food resources (Table 2.1). This
provides a comparison of the relative stoichiometric constraints among trophic groups in

28
detritus-based streams versus systems based on living plants or algae. It is evident that stream
consumers dependent on leaf litter (i.e., shredders) in C53 are far out of balance with their food
resources (C:P 4360, C:N 66, Table 2.1). In comparison, the elemental imbalances between
terrestrial herbivores and living plants (C:P 852, C:N 30) are ca. 5X and 2X lower than those of
stream shredders, in terms of P and N, respectively. Thus, limits to growth and production of
leaf-eating consumers are potentially more severe in detritus-based food webs than in those
based on living plant tissue. Imbalances of other stream consumers (i.e., collectors, scrapers)
were also relatively high in comparison to lake zooplankton, but fell within the range of some
lake benthic invertebrates (Table 2.1). Stream predators were generally the least out of balance
with their food, based on consumption of N and P-rich prey. For all stream trophic groups,
nutrient enrichment reduced consumer-resource imbalances, potentially alleviating nutrient
limitation for some taxa (C54, Table 2.1).
A central tenet of ecological stoichiometry is that consumers maintain elemental
homeostasis within a relatively small range (Elser et al. 1996, Sterner & Elser 2002), regardless
of the elemental composition of their food. Here we have shown that this may not be strictly true
for some invertebrates at Coweeta that exhibited up to 4-fold differences in C:P and N:P ratios
between C53 and C54. This deviation from strict homeostasis may have been due to either
increased P storage in insect tissue or hemolymph (Woods et al. 2002), or increased rRNA
allocation associated with higher growth rates (e.g., Schade et al. 2003). Woods et al. (2002)
demonstrated that a larval lepidopteran (Manduca sexta) was capable of storing excess P as
a-glycerophosphate in hemolymph. The authors suggested that P storage might act as a potential
buffer against short-term decreases in P availability. Interestingly, the taxa in our study that
consistently showed the largest differences in P content between C53 and C54 were Trichoptera,

29
which share a close evolutionary history with Lepidoptera (Wheeler et al. 2001), and may be
similarly capable of P storage. An alternative explanation is that higher P content of some
consumers in the enriched stream was due to higher growth rates and greater cellular allocation
to rRNA (e.g., Schade et al. 2003). Frost and Elser (2002) showed that mayfly larvae
(Ephemerella sp.) fed P-enriched epilithon harbored significantly more P in their body tissue
than those that were fed low-P periphyton. In this case, growth rates were higher on P-rich
epilithon, suggesting a growth-rRNA effect on mayfly P content. A thorough test of these
alternative hypotheses for organisms that deviate from strict homeostasis will require careful
estimates of daily growth rate, rRNA content, and C:N:P content of consumers and basal
resources.
Our analyses relating body size and larval lifespan to nutrient content were made in an
effort to test the ‘growth rate hypothesis’ (i.e., rapid growth associated with P-rich rRNA, Elser
et al. 1996, Main et al. 1997). Although we did not find that body size was consistently related
to nutrient content, we did find some patterns that support previous stoichiometric theory. For
example, N and P content decreased with body size among collector-gatherers and collector-
filterers. These results suggest that, for some taxa, later instars contain less N and P, have
decreased growth rates (as shown for Chironomidae, Huryn 1990, W. F. Cross, unpublished
data), and may have lower physiological requirements for N and P than early instars. Although
no relationship was found between larval lifespan (a proxy for turnover rate) and P content,
patterns may be difficult to detect among organisms that vary in size or life-stage. For example,
relationships may be obscured when comparing early instars of long-lived taxa (i.e., high P for
that taxon due to high growth rates at small size, low P relative to other taxa due to long-lived
life history), and late instars of short-lived taxa (i.e., low P for that taxon, high relative P).

30
We found significant differences among stream invertebrate functional and taxonomic
groups. Nitrogen and P content were generally highest among predators, which is consistent
with the results of Fagan et al. (2002), who found that terrestrial invertebrate predators contained
higher amounts of N than invertebrate herbivores. Multiple valid hypotheses exist for this
trophic difference, including the effect of higher nutrient content in the diet of predators (Fagan
et al. 2002), but proper understanding will require further analysis. Among orders, Diptera
consistently harbored the highest amount of P, which may be related to a disproportionate
number of fast-growing taxa (i.e., chironomids) within this order (Huryn 1990). We found no
apparent relationship between nutrient content and invertebrate phylogenetic position (i.e.,
ancient Ephemeroptera vs. recently derived Diptera) (e.g., Fagan et al. 2002).
A large disparity exists between the temporal scale of leaf-litter sampling in this study
(monthly for 3 years), and that of other food web components (once). This disparity raises
important questions about seasonal differences in consumer-resource elemental imbalance. For
example, temporal changes in resource elemental composition could potentially alleviate nutrient
imbalances for some invertebrates during critical times of the year (i.e., during growth spurts).
Although our long-term leaf litter data showed no obvious seasonal trends, this does not preclude
the potential for seasonal variability in FPOM, epilithon, or, to a lesser extent, invertebrates.
Future studies geared towards understanding temporal variability of consumer-resource C:N:P
content will be important in recognizing the potential for seasonal differences in stoichiometric
constraints.
We sampled most food web components from both streams after the experimental
enrichment had begun in one of them. As a consequence, it is not certain that stoichiometric
differences between streams were actually due to the enrichment. However, both of the study

31
streams were similarly low in inorganic N and P before the enrichment. In addition, large
changes in leaf-litter nutrient content coincided directly and significantly with experimental
enrichment (Fig. 2.1). Therefore, it is highly likely that between-stream elemental differences in
epilithon, FPOM, and invertebrates were caused by the enrichment.
This study is one of the first to describe stoichiometric relationships among consumers
and basal resources in a detritus-based ecosystem. We have shown that larval invertebrates in
these systems harbor low relative amounts of P in their body tissue compared to invertebrates in
other food webs based on living plant tissue. We have also shown that some invertebrate taxa do
not exhibit strict elemental homeostasis, and may have the potential to avoid nutrient limitation
via storage of P. Indeed, insects may cope with physiological nutrient constraints in a different
manner (e.g., store nutrients) than some well-studied crustaceans (i.e., copepods, cladocerans).
Nutrient enrichment of detritus-based ecosystems may alleviate nutrient limitation of some
invertebrate taxa, and potentially lead to long-term alteration of community structure, secondary
production, and food web dynamics. More research in detritus-based systems will be necessary
to determine whether stoichiometric relationships in these systems are fundamentally different
from those in systems based on living plants.
Acknowledgements
We are grateful to Keller Suberkropp for collection of leaf litter, and Molly Neely-
Burnam, Nathan Taylor, and Roger Hilten for laboratory assistance. We also thank Judy Meyer,
Elizabeth Reese, and three anonymous reviewers for helpful advice that improved the
manuscript. Research funding was provided by the National Science Foundation (DEB –

32
9806610; A.D. Rosemond, J.B. Wallace, K. Suberkropp, and P.J. Mulholland), and a Sigma Xi
Grant in Aid of Research (W. Cross).
Literature Cited
American Public Health Association. (1998). Standard methods for the examination of water
and wastewater, 20th edition, American Public Health Association, Washington, DC,
USA.
Benke A.C., Huryn A.D., Smock L.A. & Wallace J.B. (1999). Length-mass relationships for
freshwater macroinvertebrates in North America with particular reference to the
southeastern United States. J. N. Am. Benthol. Soc., 18, 308-343.
Carpenter S.R., Frost T.M., Heisey D. & Kratz T.K. (1989). Randomized intervention analysis
and the interpretation of whole-ecosystem experiments. Ecology, 70, 1142-1152.
Cummins K.W. (1973). Trophic relations of aquatic insects. Ann. Rev. Entomol., 18, 183-206.
Elser J.J. & Urabe J. (1999). The stoichiometry of consumer-driven nutrient recycling: theory,
observations, and consequences. Ecology, 80, 735-751.
Elser J.J., Dobberfuhl D.R., MacKay N.A. & Schampel J.H. (1996). Organism size, life history,
and N:P stoichiometry. BioScience, 46, 674-684.
Elser J.J., Elser M.M., Mackay N.A. & Carpenter S.R. (1988). Zooplankton-mediated
transitions between N-limited and P- limited algal growth. Limnol. Oceanogr., 33, 1-14.
Elser J.J., Fagan W.F., Denno R.F., Dobberfuhl D.R., Folarin A., Huberty A., Interlandi S.,
Kilham S.S., McCauley E., Schulz K.L., Siemann E.H. & Sterner R.W. (2000a).
Nutritional constraints in terrestrial and freshwater food webs. Nature, 408, 578-580.
Elser J.J., O’Brien J.O., Dobberfuhl D.R. & Dowling T.E. (2000b). The evolution of ecosystem

33
processes: growth rate and elemental stoichiometry of a key herbivore in temperate and
arctic habitats. J. Evol. Biol., 13, 845-853.
Elser J.J., Sterner R.W., Gorokhova E., Fagan W.F., Markow T.A., Cotner J.B., Harrison J.F.,
Hobbie S.E., Odell G.M. & Weider L.J. (2000c). Biological stoichiometry from genes to
ecosystems. Ecol. Lett., 3, 540-550.
Enriquez S., Duarte C.M. & Sandjensen K. (1993). Patterns in decomposition rates among
photosynthetic organisms - the importance of detritus C-N-P content. Oecologia, 94,
457-471.
Fagan W.F., Siemann E., Mitter C., Denno R.F., Huberty A.F., Woods H.A. & Elser J.J. (2002).
Nitrogen in insects: implications for trophic complexity and species diversification. Am.
Nat., 160, 784-802.
Findlay S., Tank J., Dye S., Valett H.M., Mulholland P.J., McDowell W.H., Johnson S.L.,
Hamilton S.K., Edmonds J., Dodds W.K., Bowden W.B. (2002). A cross-system
comparison of bacterial and fungal biomass in detritus pools of headwater streams.
Microb. Ecol., 43, 55-66.
Frost P.C. & Elser J.J. (2002). Growth responses of littoral mayflies to the phosphorus content
of their food. Ecol. Lett., 5, 232-240.
Frost P.C., Elser J.J. & Turner M.A. (2002a). Effects of caddisfly grazers on the elemental
composition of epilithon in a boreal lake. J. N. Am. Benthol. Soc., 21, 54-63.
Frost P.C., Stelzer R. S., Lamberti G.A. & Elser J. J. (2002b). Ecological stoichiometry of
trophic interactions in the benthos: understanding the role of C:N:P ratios on littoral and
lotic habitats. J. N. Am. Benthol. Soc., 21, 515-528.
Frost P.C., Tank S.E., Turner M.A. & Elser J.J. (2003). Elemental composition of littoral

34
invertebrates from oligotrophic and eutrophic Canadian lakes J. N. Am. Benthol. Soc., 22,
51-62.
Hessen D.O. & Lyche A. (1991). Interspecific and intraspecific variations in zooplankton
element composition. Archiv. Hydrobiol., 121, 343-353.
Higashi M., Abe T. & Burns T.P. (1992). Carbon-nitrogen balance and termite ecology. Proc R.
Soc. Lond. B, 249, 303-308.
Huryn A.D. (1990). Growth and voltinism of lotic midge larvae: patterns across an Appalachian
mountain basin. Limnol. Oceanogr., 35, 339-351.
Kahlert M. (1998). C:N:P ratios of freshwater benthic algae. Arch. Hydrobiol. Spec. Issues
Advanc. Limnol., 51, 105-114.
Klug M.J. & Kotarski S. (1980). Bacteria associated with the gut tract of larval stages of the
aquatic cranefly Tipula abdominalis (Diptera: Tipulidae). App. Env. Microb., 40, 408-
416.
Lugthart G.J. & Wallace J.B. (1992). Effects of disturbance on benthic functional structure and
production in mountain streams. J. N. Am. Benthol. Soc., 11, 138-164.
Main T.M., Dobberfuhl D.R. & Elser J.J. (1997). N:P stoichiometry and ontogeny of crustacean
zooplankton: a test of the growth rate hypothesis. Limnol. Oceanogr., 42, 1474-1478.
Merritt R.W. & Cummins K.W. (1996). An Introduction to the Aquatic Insects of North America.
3rd edn. Kendall/Hunt Publishing Co., USA.
O’Neill R.V. & Reichle D.A. (1980). Dimensions of ecosystem theory. In: Forests: Fresh
Perspectives from Ecosystem Analysis (ed. Waring R.H.). Oregon State University Press,
Corvallis, Oregon, pp. 11-26.
Perneger T.V. (1998). What’s wrong with Bonferroni adjustments. Brit. Med. J., 316, 1236-1238

35
Reiners W.A. (1986). Complementary models for ecosystems. Am. Nat., 127, 59-73.
Schade J.D., Kyle M., Hobbie S.E., Fagan W.F. & Elser J.J. (2003). Stoichiometric tracking of
soil nutrients by a desert insect herbivore. Ecol. Lett., 6, 96-101.
Schulz K.L. & Sterner R.W. (1999). Phytoplankton phosphorus limitation and food quality for
Bosmina. Limnol. Oceanogr., 44, 1549-1556.
Sinsabaugh R.L. & Linkins A.E. (1990). Enzymic and chemical analysis of particulate organic
matter from a boreal river. Freshwat. Biol., 23, 301-309.
Stelzer R.S. & Lamberti G.A. (2002). Ecological stoichiometry in running waters: periphyton
chemical composition and snail growth. Ecology, 83, 1039-1051.
Sterner R.W., Hagemeier D.D. & Smith W.L. (1993). Phytoplankton nutrient limitation and
food quality for Daphnia. Limnol. Oceanogr., 38, 857-871.
Sterner R.W. & Elser J.J. (2002). Ecological Stoichiometry. Princeton University Press,
Princeton, USA.
Swank W.T & Crossley D.A. (1988). Forest hydrology and ecology at Coweeta. Springer-
Verlag, New York, USA.
Urabe J. & Watanabe Y. (1992). Possibility of N-limitation or P-limitation for planktonic
cladocerans - an experimental test. Limnol. Oceanogr., 37, 244-251.
Vanni M.J., Flecker A.S., Hood J.M. & Headworth J.L. (2002). Stoichiometry of nutrient
recycling by vertebrates in a tropical stream: linking species identity and ecosystem
processes. Ecol. Lett., 5, 285-293.
Wallace J.B., Cuffney T.F., Eggert S.L. & Whiles M.R. (1997a). Stream organic matter inputs,
storage, and export for Satellite Branch at Coweeta Hydrologic Laboratory, North

36
Carolina, USA. J. N. Am. Benthol. Soc., 16, 67-74.
Wallace J.B., Eggert S.L., Meyer J.L. & Webster J.R. (1997b). Multiple trophic levels of a forest
stream linked to terrestrial litter inputs. Science, 277, 102-104.
Wallace J.B., Eggert S.L., Meyer J.L. & Webster J.R. (1999). Effects of resource limitation on a
detrital-based ecosystem. Ecol. Monogr., 69, 409-442.
Wetzel R.G. & Ward A.K. (1992). Primary production. In: The Rivers Handbook, Volume 1 (ed
Calow P. & Petts G.E.). Blackwell Scientific, Oxford, UK, pp. 354-369.
Wheeler W.C., Whiting M, Wheeler Q.D. & Carpenter J.M. (2001). The phylogeny of the extant
hexapod orders. Cladistics, 2, 113-169.
Woods H.A., Perkins M.C., Elser J.J. & Harrison J.F. (2002). Absorption and storage of
phosphorus by larval Manduca sexta. J. Ins. Phys., 48, 555-564.

37
Table 2.1. Comparisons of C:P, N:P, and C:N among invertebrate trophic groups and food resources from lake, stream, and terrestrialhabitats1. Values in bold are from this study. C53 (reference), C54 (enriched). All ratios are molar.
Trophic Group Food Resource Elemental imbalance2
C53 C543 C53 C543 C53 C54_____________________ ____________________ _____ _____ ____ ____mean median range mean median range mean mean
stream shredders leaf detritus
C:P 498 493 (136–877) 252 221 (123-610) 4858 3063 4360 2565
C:N 6.7 6.4 (5.4-8.9) 6.4 6.3 (5.0-7.7) 73 82 66 75
N:P 73 76 (17-125) 39 30 (19-97) 67 39 -- --
stream collectors FPOM
C:P 277 208 (93-574) 227 219 (80-358) 1015 673 738 396
C:N 6.4 6.0 (5.2-9.0) 6.0 5.8 (5.3-7.2) 34 29 28 23
N:P 43 38 (14-78) 37 37 (14-59) 28 23 -- --
stream scraper-herbivores stream epilithon
C:P 369 -- -- 287 304 (155-371) 1741 845 1372 476
C:N 6.2 -- -- 5.8 5.4 (5.1-7.1) 8.7 4.6 2.5 -1.6
N:P 59 -- -- 51 56 (22-68) 201 318 -- --

38
Table 2.1. (cont.)
Trophic Group Food Resource Elemental imbalance2
C53 C543 C53 C543 C53 C54_____________________ ____________________ _____ _____ ____ ____mean median range mean median range mean mean
stream predators stream prey
C:P 223 215 (102-351) 227 215 (78-430) 324 236 101 13
C:N 5.1 5.2 (4.9-5.4) 5.6 5.5 (5.0-6.8) 6.1 5.9 1.0 0.8
N:P 43 42 (20-65) 40 37 (15-75) 52 40 -- --
terrestrial herbivores terrestrial plants
C:P 116 968 852
C:N 6.5 36 30
N:P 26 28 --
lake zooplankton lake phytoplankton
C:P 124 307 183
C:N 6.3 10 3.9
N:P 22 30 --

39
Table 2.1. (cont.)
Trophic Group Food Resource Elemental imbalance2
C53 C543 C53 C543 C53 C54_____________________ ____________________ _____ _____ ____ ____mean median range mean median range mean mean
lake benthic invertebrates lake benthic algae
C:P 148 (98-1496) (-50-1348)
C:N 5.5
N:P 271Terrestrial herbivores and plants, lake phytoplankton and zooplankton from Elser et al. 2000a; Lake benthic algae and benthicinvertebrates from Frost & Elser 2002 and Frost et al. 2003.2Elemental imbalance is calculated as the arithmetic difference between a consumer and its food resource.3Post-enrichment values.

40
Figure 2.1. Changes in (a) %P, (b) N:P, and (c) C:P of leaf litter in the reference stream, (C53,
open symbols) and the enriched stream (C54, closed symbols) from June 1999 to August 2002.
Arrow indicates start of nutrient enrichment of C54. All ratios are molar. Data are means (N =
5, except first date where N = 3).

41
0
0.01
0.02
0.03
0.04
0.05
0.06%
P
6/1/99 9/9/9912/18/993/27/007/5/0010/13/001/21/015/1/01 8/9/0111/17/012/25/02 6/5/02
enriched (C54)
reference (C53)
0
50
100
150
200
N:P
6/1/99 9/9/9912/18/993/27/00 7/5/0010/13/001/21/015/1/01 8/9/0111/17/012/25/02 6/5/02
0
2500
5000
7500
10000
12500
C:P
6/1/99 9/9/9912/18/993/27/007/5/0010/13/001/21/01 5/1/01 8/9/0111/17/012/25/026/5/02
Date
a
b
c
p<0.0001
p<0.0001
p<0.0001
nutrient addition
nutrient addition
nutrient addition

42
Figure 2.2. Frequency histograms of invertebrate body % P, % C, % N, C:P, N:P, and C:N.
Histograms include all data from C53 and C54 together; no significant difference was found
between streams for any measure of nutrient content when all data were considered together
(Kolmogorov-Smirnov tests, P > 0.05). All ratios are molar.

43
0
10
20
30
40
0.0
0.2
0.4
0.6
0.8
1.0
1.2
1.4
1.6
1.8
2.0
% P
% o
f o
bse
rvat
ion
s
0
10
20
30
40
35
.03
7.5
40
.04
2.5
45
.04
7.5
50
.05
2.5
55
.05
7.5
60
.0% N% C
0
10
20
30
40
6.0
7.0
8.0
9.0
10
.0
11
.0
12
.0
13
.0
0
15
30
45
010
020
030
040
050
060
070
080
090
010
00
C:P N:P C:N
0
15
30
45
0 20 40 60 80
100
120
140
0
15
30
45
4.5
5.0
5.5
6.0
6.5
7.0
7.5
8.0
8.5
9.0
n = 127mean = 0.61st dev = 0.31
n = 100mean = 50.71st dev = 3.18
n = 100mean = 10.02st dev = 1.16
n = 100mean = 268.25st dev = 158.33
n = 100mean = 44.25st dev = 22.29
n = 100mean = 5.99st dev = 0.88

44
Figure 2.3. Percent P, C:P, and N:P ratios of paired invertebrates of similar size from C53
(reference) and C54 (enriched). Capital letters before the genus indicate insect order. D =
Diptera; E = Ephemeroptera; O = Odonata; P = Plecoptera; T = Trichoptera. Where more than
one size class of a given taxon is presented, numbers in parentheses indicate length of larvae in
mm. P values are shown for paired t-tests between streams. All ratios are molar.

45
0
200
400
600
800
1000
C:P
T-L
epid
ost
om
a sp
.
P-T
alla
per
la s
p. (
5)
T-F
atti
gia
sp
. (15
)
T-F
atti
gia
sp
. (11
)
E-S
ten
on
ema
sp.
T-P
ycn
op
sych
e sp
.
T-D
iple
ctro
na
sp. (
13)
T-D
iple
ctro
na
sp. (
8)
D-T
ipu
la s
p.
E-E
peo
rus
sp.
D-S
imu
liiu
m s
p.
T-P
arap
sych
e sp
.
P-I
sop
erla
sp
.
P-B
elo
neu
ria
sp.
O-L
anth
us
sp. (
7)
O-L
anth
us
sp. (
16)
D-H
exat
om
a sp
.
P-L
euct
ra s
p.
P-T
alla
per
la s
p. (
8)
D-m
idg
e (3
-4)
D-m
idg
e (1
-2)
D-t
anyp
od
(3-
5)
D-m
idg
e (5
+)
D-D
ixa
sp.
p = 0.01
0
50
100
150
N:P
P-T
alla
per
la s
p. (
5)
T-F
atti
gia
sp
. (11
)
T-F
atti
gia
sp
. (15
)
T-L
epid
ost
om
a sp
.
E-S
ten
on
ema
sp.
T-P
ycn
op
sych
e sp
.
T-P
arap
sych
e sp
.
T-D
iple
ctro
na
sp. (
8)
D-T
ipu
la s
p.
E-E
peo
rus
sp.
P-I
sop
erla
sp
.
D-S
imu
liiu
m s
p.
T-D
iple
ctro
na
sp. (
13)
P-B
elo
neu
ria
sp.
O-L
anth
us
sp. (
7)
O-L
anth
us
sp. (
16)
D-H
exat
om
a sp
.
P-L
euct
ra s
p.
D-m
idg
e (3
-4)
D-m
idg
e (1
-2)
D-t
anyp
od
(3-
5)
D-m
idg
e (5
+)
P-T
alla
per
la s
p. (
8)
D-D
ixa
sp.
p = 0.02
0.00.20.40.60.81.01.21.41.61.8
%P
D-D
ixa
sp.
D-t
anyp
od
(3-
5)
D-m
idg
e (5
+)
P-T
alla
per
la s
p. (
8)
D-m
idg
e (1
-2)
D-m
idg
e (3
-4)
P-L
euct
ra s
p.
D-H
exat
om
a sp
.
O-L
anth
us
sp. (
16)
O-L
anth
us
sp. (
7)
P-B
elo
neu
ria
sp.
P-I
sop
erla
sp
.
T-P
arap
sych
e sp
.
E-E
peo
rus
sp.
D-S
imu
liiu
m s
p.
D-T
ipu
la s
p.
T-D
iple
ctro
na
sp. (
8)
T-D
iple
ctro
na
sp. (
13)
T-P
ycn
op
sych
e sp
.
E-S
ten
on
ema
sp.
T-F
atti
gia
sp
. (11
)
T-F
atti
gia
sp
. (15
)
P-T
alla
per
la s
p. (
5)
T-L
epid
ost
om
a sp
.
p = 0.03 reference (C53)enriched (C54)

46
Figure 2.4. Mean %P, %N, %C, C:P, N:P, and C:N ratio (+1 SD) of invertebrates from 5
dominant insect orders in the reference stream (C53, white bars) and the enriched stream (C54,
grey bars). DIPT = Diptera; ODON = Odonata; PLEC = Plecoptera; TRIC = Trichoptera; EPHE
= Ephemeroptera. Results of 2 way ANOVA: ORDER factor significant for all variables:
%P****, %N****, %C****, C:P****, N:P***, C:N****, STREAM factor significant for C:P*,
ORDER x STREAM interaction significant for C:P** and N:P**. Different capital letters above
bars indicate significant differences among orders (Tukey’s HSD) using data from both streams
(i.e., STREAM factor not significant). Different lower-case letters above bars (as for C:P)
indicate significant differences (Tukey’s HSD) considering the reference and enriched streams
separately (i.e., STREAM factor significant). *p < 0.05, **p < 0.01, ***p < 0.001, ****p <
0.0001. For %P in C53 & C54, DIPT (N = 17, 23), ODON (N = 5, 6), PLEC (N = 9, 14), TRIC
(N = 12, 23), EPHE (N = 6, 10). For other graphs in C53 & C54, DIPT (N = 11, 17), ODON (N
= 5, 6), PLEC (N = 8, 12), TRIC (N = 8, 20), EPHE (N = 4, 7). All ratios are molar.

47
0.00.20.40.60.81.01.21.41.6
% P
DIPT
ODON
PLEC
TRIC
EPHE
reference
enriched
0
5
10
15%
N
DIPT
ODON
PLEC
TRIC
EPHE
0
20
40
60
80
% C
DIPT
ODON
PLEC
TRIC
EPHE
0
200
400
600
800
1000
C:P
DIPT
ODON
PLEC
TRIC
EPHE
ab
b
bab
ab
bb b b
*a
0
25
50
75
100
125
N:P
DIPT
ODON
PLEC
TRIC
EPHE
0
2
4
6
8
10
C:N
DIPT
ODON
PLEC
TRIC
EPHE
A
AB
AB
BB
BABA
A AB ABC
AC ABC
B
A A
AB
AB BCC
ABA AC

48
Figure 2.5. Mean %P, %N, %C, C:P, N:P, and C:N ratio (+1 SD) of invertebrates from 4
functional feeding groups in the reference stream (C53, white bars) and the enriched stream
(C54, gray bars). SCRA = scraper; SHRE = shredder; COL-G = collector-gatherer; COL-F =
collector-filterer; PRED = predator. Results of 2 way ANOVA: FFG factor significant for all
variables except N:P: %P**, %N****, %C****, C:P***, C:N****, STREAM factor not
significant for any variables, FFG x STREAM interaction not significant for any variables.
Different capital letters above bars indicate significant differences (Tukey’s HSD) based on
results from both streams combined. *p < 0.05, **p < 0.001, ***p < 0.001, ****p < 0.0001. For
%P in C53 & C54, SCR (N = 2, 10), SHRE (N = 13, 20), COL-G (N = 9, 9), COL-F (N = 9, 8),
PRED (N = 16, 29). For other graphs in C53 & C54, SCR (N = 1, 5), SHRE (N = 11, 16), COL-
G (N = 7, 7), COL-F (N = 6, 6), PRED (N = 11, 28). All ratios are molar.

49
0.00.20.40.60.81.01.21.41.6
% P
SCRA
SHRE
COL-G
COL-F
PRED
0
5
10
15
% N
SCRA
SHRE
COL-G
COL-F
PRED
0
10
20
30
40
50
60
70
% C
SCRA
SHRE
COL-G
COL-F
PRED
0
200
400
600
800
C:P
SCRA
SHRE
COL-G
COL-F
PRED
0
25
50
75
100
125
N:P
SCRA
SHRE
COL-G
COL-F
PRED
0
2
5
8
10
C:N
SCRA
SHRE
COL-G
COL-F
PRED
A
A
AB AB BAB
A A AB
referenceenriched ABC BC BAC
ABAB AA
B
AB
A
B
AB
BA
A
A
AA

50
CHAPTER 3
EFFECTS OF LONG-TERM NUTRIENT ENRICHMENT ON GROWTH AND
PRODUCTION OF TWO STREAM DETRITIVORES1
________________________1Cross, W. F., B. R. Johnson, J. B. Wallace, and A. D. Rosemond. To be submitted to
Limnology and Oceanography.

51
Abstract
The effects of nutrient enrichment (i.e., nitrogen and phosphorus) on the dynamics of
primary consumers in detritus-based aquatic ecosystems is poorly understood. Nutrient
enrichment may simultaneously increase the nutritional quality of detritus for consumers while
accelerating its loss via increased metabolism of heterotrophic microbes such as bacteria and
fungi. In this study we examined in detail the response of growth and secondary production of
two dominant stream detritivores (non-Tanypodinae chironomids and Tallaperla spp.) to a 2-
year large-scale experimental enrichment of a small headwater stream. We purposely contrasted
the response of 2 detritivores at opposite ends of the ‘slow-fast’ life-history continuum and with
distinct feeding behavior. Nutrient enrichment had large positive effects (~50% increase) on
individual growth rates of chironomids, but no detectable effects on growth rates of Tallaperla
spp.. On a per square meter basis, enrichment had large positive effects secondary production
(~183% increase), and production/biomass ratios of chironomid larvae, but these effects were
largely habitat-specific. In contrast, production of Tallaperla spp. per square meter was
unaffected by enrichment. When expressed on a per gram organic matter basis (i.e., per gram
leaf litter or fine benthic organic material), enrichment had a large positive effect on secondary
production of chironomids and Tallaperla spp.. Together, these results suggest nutrient-induced
changes to organic matter quality positively affected both taxa; however, for Tallaperla spp.,
positive effects on resource quality were offset by negative effects on resource (i.e., leaf litter)
quantity. We explored the generality of these results by examining the response of many other
stream taxa to enrichment (Chapter 4) in relation to larval lifespan and feeding behavior. For
leaf-eating taxa (i.e., shredders), life history and feeding behavior strongly interact to determine
the response of these taxa to enrichment. Differential response of consumers to nutrient

52
perturbation underscores the importance of species-specific characteristics such as larval
lifespan, feeding behavior, and elemental composition in determining the population and
community-level responses of detritivores to enrichment.
Introduction
Nutrient enrichment of aquatic ecosystems is occurring worldwide as a result of human-
induced changes to global nitrogen and phosphorus cycling (e.g., Caraco 1993, Bennett et al.
2001, Galloway et al. 2003). Fertilizer production and application, fossil fuel combustion, and
suburban/urbanization have all contributed to increased mobilization of nitrogen (N) and
phosphorus (P) and elevated concentrations of these elements in streams, lakes, and coastal
marine environments (e.g., Caraco 1993, Vitousek et al. 1997, Carpenter et al. 1998, Howarth et
al. 2002). Such changes in nutrient availability can have strong effects on population dynamics,
community structure, and ecosystem processes because many functional attributes of aquatic
systems (e.g., respiration, decomposition, primary and secondary production) are limited by the
supply of N and P (e.g., Carpenter et al. 1998). Our general understanding of nutrient effects on
aquatic ecosystems is limited, however, because the majority of studies have been conducted in
algal- or plant-based systems, where effects of enrichment are often manifested in increased
primary production and eutrophication (e.g., Hart and Robinson 1990, Peterson et al. 1993,
Carpenter et al. 1998, Howarth et al. 2002).
In most aquatic ecosystems, detritus is a dominant basal resource and provides the
energetic basis for diverse and productive detritus-based food webs (e.g., Wetzel 1995).
However, despite the prevalence of these detrital pathways, our understanding of nutrient
enrichment effects in detritus-based systems lags far behind that of plant- or algal-based systems.

53
Responses of detritus-based food webs to enrichment may be fundamentally different than their
living plant-based counterparts (e.g., Polis and Strong 1996, Rosemond et al. 2001). Stimulation
of microbial production at the base of the food web may provide an enriched resource for
primary consumers in the short-term, but may ultimately have negative effects on these
consumers by increasing the rate at which detritus is metabolized or lost from the system (e.g.,
Gulis and Suberkropp 2003).
In the eastern US, and many other forested regions of the world, detritus-based headwater
streams dominate the total length of stream networks (e.g., Wallace 1988, Meyer and Wallace
2001). In these streams, productivity is driven by pulsed inputs of allochthonous leaf litter, and
in-stream autotrophic production can be extremely low (e.g., Webster et al. 1997). Recent
studies have shown that elevated levels of inorganic N and P in detritus-based streams can lead
to increased biomass and productivity of microbes (i.e., bacteria and fungi) associated with
detritus (e.g., Rosemond et al. 2002, Gulis and Suberkropp 2003, Ramirez et al. 2003, Stelzer et
al. 2003), and consequent increased rates of organic matter decomposition (e.g., Elwood et al.
1981, Robinson and Gessner 2000, Grattan and Suberkropp 2001, Chadwick and Huryn 2003,
Gulis and Suberkropp 2003). Thus, both the quality (i.e., through increased biomass of nutrient-
rich microbes) and quantity (i.e., through increased rates of decomposition) of detritus can be
affected by nutrient availability. However, we know very little about how nutrient-mediated
changes in detritus affect the growth and productivity of primary consumers (but see Ward and
Cummins 1979, Rosemond et al. 2001, 2002). This is an important line of research because
primary consumers limit the flow of energy and materials to higher trophic levels, and often play
prominent roles in the retention, processing, and export of organic matter and nutrients in

54
forested streams (Wallace et al. 1982, Cuffney et al. 1990, Pringle et al. 1999, Crowl et al. 2001,
Cross et al. in press).
Assemblages of primary consumers typically exhibit a broad range of life-history
characteristics, with potentially large differences among coexisting taxa in terms of growth rates,
lifespan duration, and feeding behavior (e.g., Huryn and Wallace 2000). These fundamental
characteristics are likely to have considerable influence on the response of individual taxa to
perturbations such as nutrient enrichment. For example, lifespan duration may influence the rate
of population response because short-lived taxa may undergo more generations during a given
perturbation than long-lived taxa. Additionally, feeding mode or behavior may affect the
response of consumers if food resources are differentially affected by a given perturbation.
Understanding emergent community-level responses to perturbations may require careful
consideration of taxa that occupy disparate ‘ends’ of life-history continua and feeding behavior.
In this study, we experimentally enriched a detritus-based headwater stream with
inorganic N and P for 2 years. Our objective was to examine effects of nutrient enrichment on
the abundance, biomass, growth rates, and secondary production of two detritivorous taxa that
exhibit very different life history strategies (i.e., fast growth and short life span vs. slow-growth
and long life span) and feeding behavior (i.e., leaf litter vs. fine benthic organic detritus). We
compared the response of these taxa in the treatment stream to an adjacent reference stream to
isolate the effects of enrichment from natural inter-annual variability.
We predicted that increased food quality as a result of nutrient enrichment (Cross et al.
2003, Gulis and Suberkropp 2003) would positively influence growth rates and assimilation of
both short and long-lived taxa. We tested this hypothesis by comparing the growth rates and
production per gram organic matter (i.e., per gram leaf litter or fine benthic organic matter, a

55
proxy for assimilation) of both taxa in the reference and treatment streams. In addition, we
predicted that changes in organic matter quantity as a result of enrichment (i.e., decline in leaf
litter) would negatively affect long-lived taxa that depend on continuous availability of leaf litter.
This hypothesis was tested by examining consumer production on a per square meter basis.
Because we examined 2 taxa that differ in both lifespan duration and feeding behavior, our
ability to examine these characteristics independently is confounded. Therefore, we examined
the response of multiple taxa to enrichment from a concurrent study (Cross Chapter 4) in relation
to larval lifespan and feeding mode. Our analysis provided a unique opportunity to explore the
multiple influences of larval lifespan, food quantity, and food quality on response of detritivores
to a long-term nutrient enrichment.
Study organisms
Non-Tanypodinae chironomids (Diptera) were chosen as representative r-selected taxa
(i.e., rapid growth, high reproductive rates). Chironomids are among the most abundant
macroinvertebrates in most freshwater ecosystems (Armitage et al. 1995) and generally exhibit
rapid growth rates (e.g., Huryn 1990, Hauer and Benke 1991, Johnson et al. 2003), short larval
life spans (e.g., Huryn 1990), and multivoltine life histories (i.e., complete multiple generations
per year, Huryn 1990). Most non-tanypod chironomids are functionally classified as collector-
gatherers (Merritt and Cummins 1996), and their diet in southern Appalachian streams is
dominated by amorphous detritus associated with fine benthic organic matter (FBOM) (e.g., Hall
et al. 2000, Rosi-Marshall and Wallace 2002). More than 25 genera of non-Tanypodinae have
been collected from the study streams (Wallace et al. 1991), but 7 dominant genera represent >
80% of their abundance (see Huryn 1990).

56
Tallaperla spp. (Plecoptera: Peltoperlidae) larvae were chosen as representative K-
selected taxa (i.e., slow growth, low reproductive rates). These stoneflies exhibit slow growth
rates (e.g., O’Hop et al. 1984, Johnson et al. 2003), have relatively long larval life spans (≈ 540
days), and comprise a significant proportion of the abundance and biomass of the study stream
communities (Lugthart and Wallace 1992, Wallace et al. 1999, this study). Tallaperla spp. are
functionally classified as leaf-eating shredders (Merritt and Cummins 1995), although early
instars may predominantly feed on amorphous detritus (Cross, personal observation). Up to four
species of Tallaperla spp. potentially co-occur in Coweeta headwater streams: T. maria, T.
anna, T. cornelia, and T. elisa (Huryn and Wallace 1987, Stewart and Stark 1993). These
species are indistinguishable as larvae but share the same semivoltine life cycle. Previous work
has shown that growth rates of Tallaperla spp. are sensitive to changes in resource (i.e., leaf)
quantity (Johnson et al. 2003).
Methods
Study site and experimental enrichment
This study was conducted in two adjacent headwater streams at the Coweeta Hydrologic
Laboratory, Macon County, North Carolina, USA. Coweeta is a large (2185-ha) heavily forested
basin located in the Blue Ridge physiographic province of the southern Appalachian Mountains
(see Swank and Crossley 1988). Forest vegetation is dominated by mixed hardwoods (primarily
oak, maple, and poplar) and a dense understory of Rhododendron maximum which shades the
streams throughout the year. Headwater streams at Coweeta are extremely heterotrophic, and
allochthonous inputs of detritus provide >90% of the energy base for microbial and invertebrate
production (Wallace et al. 1997b, Hall et al. 2000). In-stream primary production is low (ca. 4 –

57
8 g C m-2 y-1) and constitutes < 1% of the total carbon entering these streams (Wallace et al.
1997a).
The two streams used for this study drain catchments (C) 53 and 54. These streams have
very similar physical and chemical characteristics (Table 3.1), but differ (since July 2000) in
their concentrations of dissolved N and P as a result of our experimental nutrient enrichment of
C54 (Table 3.1).
Starting in July 2000, nitrogen (NH4NO3) and phosphorus (K2HPO4 and KH2PO4) were
dripped continuously into C54 to increase concentrations of dissolved inorganic N and P to ≈ 6-
15 X background levels (Table 3.1). Nutrient solution was added along 140 m of C54 with a
solar powered metered-dose pump (LMI, Acton, Massachusetts, USA) connected to a
streamwater-fed plastic pipe laid along the streambed. The plastic pipe was fitted with garden
irrigation valves every 10 m to evenly distribute nutrients along the length of the stream. Stream
water nutrient concentrations were held relatively constant across a range of discharge by
connecting the pump to a discharge data logger (Isco Inc., Lincoln, NE, USA) located at the base
of the stream; the pump was engaged every time a known volume of water (generally 50-100
liters) passed through the downstream weir. Concentrations of (NO3 + NO2)-N, NH4-N, and
soluble reactive phosphorus (SRP) were measured biweekly at the weir of each study stream
(APHA 1998). During enrichment, nutrient concentrations were also measured at 5 locations
along the length of C54 to confirm that nutrients were evenly distributed along the stream.
Nutrient concentrations in the enriched stream (Table 3.1) were well within the range of natural
concentrations in streams in the region (Scott et al. 2002), and thus provided a realistic
assessment of moderate enrichment effects. Water temperature (°C) was monitored every 30

58
min throughout the study in both streams (K. Suberkropp, University of Alabama, unpublished
data) with Optic StowAway temperature probes (Onset Computer Corp., Pocasset, MA, USA).
Growth rates
In situ daily growth rates (mg mg-1 d-1) of chironomids and Tallaperla spp. were
quantified on a seasonal basis in both streams following methods developed by Huryn and
Wallace (1986) and Huryn (1990). Chironomid growth rates were measured between November
1999 and July 2002 (n = 10 seasons; 3 before treatment, 7 during treatment), and Tallaperla spp.
growth rates were measured between November 1999 and November 2001 (n = 8 seasons; 3
before treatment, 5 during treatment).
During each season, larvae were obtained from leaf litter and FBOM collected in nearby
undisturbed Coweeta headwater streams. Organic matter was rinsed with stream water through a
series of nested metal sieves and examined under a dissecting microscope (chironomids) or by
eye (Tallaperla spp.) for removal of larvae. Body length of larvae was measured to the nearest
0.01 mm under a dissecting microscope fitted with an ocular micrometer, and larvae were
separated into 1-mm size classes irrespective of species identity. Size classes used for each
growth incubation were chosen based on the natural size distribution of larvae at the time of
collection. In general, seasonal incubations consisted of 3 distinct size classes of chironomids
and 2-4 size classes of Tallaperla spp. in each stream.
Groups of larvae within a given size class were placed into partially submerged triangular
growth chambers constructed of Plexiglas“ and Nitex“ mesh. (base: 20 cm x 20 cm x 14 cm,
sides: 16 cm height, described in Huryn and Wallace 1986). The mesh size of chambers (63 µm)
was small enough to prevent immigration or emigration of stream invertebrates, but sufficiently

59
large to allow entry of FBOM. Chambers were placed directly in the stream with the triangular
point facing upstream, their tops extending above the water surface, and anchored to the stream
bottom with rocks placed along external Plexiglas“ flanges. The shape of growth chambers
greatly reduced the amount of drag and debris-clogging of the nitex mesh. Larval densities in
chambers (Appendix A) fell within the range of naturally occurring densities of chironomids, and
were slightly higher than natural densities of Tallaperla spp. in the study streams (Lugthart et al.
1990, Wallace et al. 1999, this study). On occasion, two widely disparate size classes of
Tallaperla spp. were placed in the same growth chamber to increase the number of growth
estimates during a given season. Because these size classes were easily distinguishable, growth
rates could be estimated separately.
At the beginning of growth incubations, 8-10 leaves collected from either stream were
rinsed to remove invertebrates and placed in each of the chambers. Leaves placed in the
chambers represented a mixture of species readily available during the time of incubation. The
most commonly used leaf types were maple (Acer spp.), beech (Fagus granifolia, Ehrh.), oak
(Quercus spp.), rhododendron, yellow poplar (Liriodendron tulipifera L.), and dogwood (Cornus
florida L.). Efforts were made to keep leaf species and leaf condition relatively constant among
chambers and between streams.
Growth incubations lasted ≈ 1-2 weeks for chironomids and ≈ 2 months for Tallaperla
spp. (see Appendix A). Leaves were replaced half way through Tallaperla spp. incubations to
prevent food limitation of larvae. At the end of growth incubations chamber contents were
preserved in Kahle’s solution, larvae were removed, and final body length of larvae was
measured as described above. Initial and final lengths were converted to biomass estimates (ash-
free dry mass, AFDM) using previously established length-mass regressions for these taxa

60
(Benke et al. 1999). Size-specific daily growth rates (g, mg mg-1 d-1) of larvae were calculated
as: g = (ln Mf – ln Mi)/t, where Mf is the mean final AFDM of surviving larvae, Mi is the mean
intial AFDM of larvae introduced into chambers, and t is the duration of the incubation in days.
Linear equations were derived from relationships between ln(initial length[mm]) and daily
growth rate. Growth estimates were not used in these relationships if fewer than 2 individuals
survived the incubation. This assemblage-based method of estimating growth rates assumes that
changes in the average weight of similarly-sized mixtures of species accurately reflects size-
specific growth rates of the entire taxonomic group (Huryn and Wallace 1986).
Food was always provided in excess during growth incubations to control for food
quantity; thus, between-stream differences in growth were viewed as a test for effects of food
quality.
Benthic sampling and secondary production
Quantitative benthic sampling was conducted monthly in each stream for 4 yrs between
September 1998 and August 2002. Each month, samples were taken in two distinct stream
habitats: mixed substrate (i.e., cobble, pebble, gravel, sand, silt) and bedrock outcrops. The
mixed substrate habitat dominates the total area of both streams (C53: 73%, C54: 65%), with
bedrock comprising the remainder (C53: 27%, C54: 35%). Mixed substrate samples were
collected at 4 predetermined random locations in each stream with a core sampler (400 cm2).
Cores were firmly placed in the streambed, and all material was removed to a depth of 15 cm by
hand or cup and placed in a large plastic jar. Bedrock samples (15 cm x 15 cm) were taken at 3
randomly determined locations in each stream by brushing and scraping moss and associated

61
particles from a known area (15 cm x 15 cm) with a dish scrubber and knife into a plastic bag
pressed flush against the bedrock.
Benthic samples were brought to the laboratory, refrigerated, and processed within 24
hours. Samples were rinsed onto nested metal sieves (pore sizes 1 mm and 250 µm), and
material retained on each sieve was elutriated to separate organic from inorganic material.
Organic material was then preserved separately for each size fraction (> 1mm and < 1 > 250 µm)
with formalin solution (6-8%). All invertebrates were removed from the > 1 mm fraction by
hand picking under a dissecting microscope at 15x magnification. Organic material in the
smaller size fraction (<1 mm>250 µm) was subsampled (1/8 to 1/64 of whole samples) using a
sample splitter (Waters 1969), and animals were removed from subsamples with a dissecting
microscope at 15x magnification. The amount of coarse and fine particulate organic matter in
each sample was also quantified, and those data are presented elsewhere (Cross Chapter 4).
All Non-Tanypodinae chironomids and Tallaperla spp. were counted and their body
length measured to the nearest mm using a graduated microscope stage. Biomass (mg AFDM)
of individual larvae was determined with length-mass relationships as described above, and total
biomass per square meter was calculated for each sample. Secondary production was estimated
for each sampling interval using the community-level instantaneous growth method (Huryn and
Wallace 1986, Benke 1993). Production (mg AFDM m-2 interval-1) for each sampling interval
(Pint) was calculated as: Pint = Si = 1 to n ([Bt+1 + Bt]/2) x gi x d, where n = 1 mm size classes, Bt+1 =
mean larval biomass at sampling interval t+1, Bt = mean larval biomass at sampling interval t, gi
= size-specific instantaneous growth rate, and d = number of days in the interval. Annual
production was calculated as the sum of all Pint values for a given year. Size-specific growth
rates were obtained from empirically-derived linear growth equations described above. Larval

62
abundance (no. m-2), biomass (mg AFDM m-2), and interval or annual secondary production (mg
AFDM m-2 interval[d-1] or mg AFDM m-2 y-1) were estimated separately for each stream habitat.
Habitat-weighted values for the entire stream were calculated according to the relative proportion
of each habitat in each stream (e.g., Huryn and Wallace 1987). Production/biomass (P/B) ratios
were calculated for each sampling interval (P/Bint) and for each year of study. Annual P/B ratios
can be used as a relative assessment of biomass turnover rates (Benke 1993, Benke 1998).
To examine the influence of changes in food quality on production of chironomids and
Tallaperla spp., annual production during the study was additionally expressed on a per gram
leaf litter (for Tallaperla spp.) or FBOM (for chironomids) basis (organic matter data from Cross
Chapter 4).
Statistical analyses
A t-test was used to test for temperature differences between streams. We used stepwise
multiple regression analysis to build parsimonious models for predicting growth rates or
mortality from mean daily stream temperature, number of degree days, density of larvae in
chambers, and initial length of larvae (mm) (a ≤ 0.1 to enter model). Analysis of covariance
(ANCOVA) was used to test for differences in growth rates between streams before and during
enrichment; initial length was used as the covariate because early instars tend to grow faster than
late instars for both taxonomic groups examined (e.g., Huryn 1990, Johnson et al. 2003).
Time series of chironomid and Tallaperla spp. abundance, biomass, and secondary
production were analyzed with randomized intervention analysis (RIA, Carpenter et al. 1989,
also see Murtaugh 2003, Stewart-Oaten 2003). RIA uses paired, before-and-after time series
data from a manipulated and a reference system to detect changes caused by the manipulation.

63
In this study, RIA was used to test the null hypothesis that no change in abundance, biomass, or
secondary production occurred in the treatment stream relative to the reference stream following
the initiation of nutrient enrichment.
Differences in the proportion of larvae distributed among size classes between mixed
substrate and bedrock outcrop habitats were tested with chi-square tests. We examined
relationships between P/Bint in reference and enriched streams before and during treatment.
Deviations from the 1:1 line before and during treatment were examined with Wilcoxon signed-
ranks tests. All data were appropriately transformed (log[x+1] or arcsin-square root) when
necessary to meet assumptions of normality and homoscedasticity.
Results
Temperature
Throughout the study, temperature ranged from 1 – 19°C and did not differ between
study streams (P > 0.05, K. Suberkropp, unpublished data).
Growth rates
Numbers of chironomid larvae introduced into individual growth chambers ranged from
13 to 94 (mean: 47). Average mortality of chironomids was high at 69% (range: 37% - 100%)
(Appendix A), and daily mortality rates averaged 6.1%/d (range: 2.5 – 11.8%/d). Rates of
mortality were not influenced by larval density, larval initial length, or the number of degree
days of growth incubations (regression analysis: r2 values < 0.1, P values > 0.05). However,
mean daily stream temperature (°C) during incubations had an overall significant positive effect
on mortality rates (r2 = 0.18, P = 0.002). When streams were analyzed separately, the effect of

64
temperature was only significant for C54 (r2 = 0.41, P < 0.001), and did not differ between pre-
and post-enrichment periods (P > 0.05).
Growth rates of chironomid larvae in the reference and treatment stream were relatively
high (mean: 0.07 mg mg-1 d-1) and ranged from 0.015 to 0.153 mg mg-1 d-1 (Figure 3.1A). Mean
daily temperature (°C), number of degree days, and larval density did not affect chironomid
growth rates (r2 values < 0.10, P > 0.1), and were therefore dropped from the model. Overall,
growth rate was inversely related to initial length in both streams (r2 = 0.48, P < 0.0001) and this
relationship was best described by the equation: g = -0.065 * ln(initial length[mm]) + 0.122.
Prior to the nutrient enrichment, no difference was found between growth rates in the reference
stream and the treatment stream (ANCOVA, P > 0.05, Figure 3.1A). These data were thus
combined to yield a single ‘non-enriched’ growth equation: g = -0.054 * ln(initial length[mm]) +
0.095 (r2 = 0.49, P < 0.0001, Figure 3.1A: dotted line).
Nutrient enrichment of C54 had a highly significant positive effect on chironomid growth
rates (ANCOVA, P < 0.0001, Figure 3.1A). On average, chironomids grew 53% faster in the
treatment stream during enrichment than in the reference stream and treatment before
enrichment. This relationship was best described by the linear equation: g = -0.083 * ln(initial
length[mm]) + 0.143 (r2 = 0.78, P < 0.0001, Figure 3.1: solid line). Differences between
enriched and non-enriched conditions were most pronounced among small larvae (Figure 3.1A).
Numbers of Tallaperla spp. introduced into growth chambers ranged from 5 to 40 (mean:
25). Average mortality of Tallaperla spp. was slightly lower than chironomids at 42% (range: 6
– 100%), and daily mortality rates averaged 0.7%/d (range: 0.1 – 1.4%/d). Rates of mortality
were not significantly affected by initial length or density of larvae, mean daily temperature (°C),
or degree days during incubation (r2 values < 0.10, P > 0.05).

65
Growth rates of Tallaperla spp. were an order of magnitude lower than chironomids
(overall average: 0.006 mg mg-1 d-1) and ranged from 0 to 0.015 mg mg-1 d-1 (Figure 3.1B).
There was no significant effect of larval density, mean daily temperature (°C), or number of
degree days on Tallaperla spp. growth rates (r2 values < 0.10, P > 0.1). A large proportion of
the variation in growth rates was explained by initial length of larvae (r2 = 0.50, P < 0.0001,
Figure 3.1B), and this negative relationship was best described by the linear equation: g = -0.007
* ln(initial length[mm]) + 0.018.
Growth rates of Tallaperla spp. did not differ significantly among the reference stream,
the treatment stream before enrichment, and the treatment stream during enrichment (ANCOVA,
P > 0.05, Figure 3.1B).
Assemblage responses to nutrient enrichment
Nutrient enrichment had a large positive effect on habitat-weighted chironomid
abundance, biomass, and interval secondary production per square meter (RIA, P values all <
0.0001, Figure 3.2, Table 3.2). The greatest response was seen in chironomid production (183%
increase in comparison to pretreatment period), followed by biomass (86% increase) and
abundance (70% increase). These increases are conservative estimates because concomitant
decreases were seen in abundance, biomass, and production in the reference during treatment. A
closer examination of individual habitats revealed that positive effects of enrichment only
occurred in the mixed substrate habitat and not on bedrock outcrops (Table 3.2). Annual habitat-
weighted chironomid production in the reference stream (C53) was similar before (mean of yrs 1
and 2: 1098 mg AFDM m-2 y-1) and during (mean of yrs 3 and 4: 1050 mg AFDM m-2 y-1)
enrichment of C54 (Table 3.3). Annual habitat-weighted production in the treatment stream

66
(C54) increased considerably from an average of 968 mg m-2 y-1 before enrichment to 2531 mg
AFDM m-2 y-1 during enrichment (Table 3.3).
We expressed annual production of chironomids in the mixed substrate habitat on a per
gram organic matter (FBOM) basis (Table 3.4). During the 2 pretreatment years, chironomid
production per gram FBOM was considerably lower (48% on average) in the treatment stream
than in the reference stream (years 1 & 2, Table 3.4). During the 2 years of nutrient enrichment,
production per gram FBOM increased in the enriched stream to levels comparable to that of the
reference stream (years 3 & 4, Table 3.4). The quantity of FBOM was relatively stable in both
streams before and during enrichment (Cross Chapter 4).
Nutrient enrichment did not significantly affect habitat-weighted Tallaperla spp. biomass
or secondary production per square meter (RIA, P values > 0.05, Figure 3.3, Table 3.2). Habitat-
weighted abundance increased 60% in the treatment stream (RIA, P = 0.01, Figure 3.3), while
abundances in the reference stream decreased by 37% during enrichment (Table 3.2). This
significant effect was likely driven by large recruitment events in the reference stream before
(Sept-Dec 1998 and 1999), but not during, enrichment, and small increases in abundance in the
treated stream during the enrichment (Figure 3.3). Abundance, but not biomass or production, of
Tallaperla spp. increased in the mixed substrate habitat during enrichment (RIA, P = 0.01, Table
3.2). On bedrock outcrops, abundance, biomass, and production appeared to decrease in the
treated stream during enrichment (RIA, P values < 0.05, Table 3.2). However, the significance
of this RIA resulted from large increases in the reference stream during enrichment as opposed to
increases in the enriched stream. Throughout the study, annual habitat-weighted production was
consistently higher (≈ 75%) in the reference stream (mean: 308 mg AFDM m-2 y-1) than in the

67
enriched stream (175 mg AFDM m-2 y-1), and nutrient enrichment had no effect on this difference
(Table 3.3).
Annual production of Tallaperla spp. per gram leaf litter in the mixed substrate habitat
was lower (55% on average) in the treatment stream than in the reference stream during the 2
years of non-enriched conditions (years 1 & 2, Table 3.4). In contrast, production of Tallaperla
spp. per gram leaf litter increased during nutrient enrichment relative to the reference stream and
was 47% greater during the second year of enrichment (year 4, Table 3.4).
Annual P/B ratios of chironomids ranged from 7.5 to 19.5 in the mixed substrate habitat,
and 16.2 to 27.4 in the bedrock outcrops. These P/B ratios suggest average community biomass
turnover rates between 49 and 13 days, with the fastest turnover rates occurring on bedrock
outcrops (Table 3.3). In general, the highest annual P/B values were found in C54 during
enrichment (Table 3.3). Higher P/B ratios on bedrock outcrops versus mixed substrate habitat
was due to slightly higher proportions of smaller instars on bedrock. Plots of habitat-weighted
P/B values during each sampling interval (P/Bint) in the reference versus the treatment stream
demonstrated that before enrichment, values were spread evenly around the 1:1 ratio line (Figure
3.4A, Wilcoxon signed ranks test, arithmetic differences between C53 and C54 not significantly
different than 0, P > 0.05). In contrast, during nutrient enrichment, 81% of P/Bint values fell
above the 1:1 line (Figure 3.4A, P < 0.05), indicating consistently higher biomass turnover rates
of chironomids in the enriched stream.
Annual P/B ratios of Tallaperla spp. were considerably lower than chironomids, ranging
from 1.6 to 2.7 in the mixed substrate habitat, and 2.4 to 3.2 on bedrock outcrops (Table 3.3).
These annual P/B values correspond to biomass turnover rates of 228 – 114 days. Because larval
life span (or cohort production interval) of Tallaperla spp. in Coweeta streams is ≈ 540 days, this

68
suggests at least two overlapping cohorts of Tallaperla spp. are present in these streams (e.g.,
O’Hop et al. 1984). Nutrient enrichment had no apparent effect on Tallaperla spp. P/Bint values
(Figure 3.4B, Wilcoxon signed ranks tests, P values > 0.05).
Discussion
Although a number of studies have demonstrated a causal link between nutrient
enrichment and increased microbial activity, detrital quality, and decomposition rates, this study
is among the first to examine the long-term consequences of these basal changes on growth and
production of detritivorous macroconsumers (but see Rosemond et al. 2002, Ramirez and
Pringle, in review). We observed a marked difference between the response of chironomids and
Tallaperla spp. to enrichment, and this difference provides valuable insight into the interaction
between larval lifespan and feeding behavior in determining consumer response to nutrient
enrichment.
Larval development time, or cohort production interval (CPI, Benke 1979), is an
important life history characteristic that is central to determining population turnover rate and
contributing to estimates of secondary production (e.g., Benke 1993). Differences in CPI among
taxa largely determine the extent to which species can exploit disturbed habitats, or respond to
environmental perturbations (e.g., Wallace 1990). Larval development times for non-
Tanypodinae chironomids at Coweeta range from 46 – 365 days (Huryn 1990), indicating that
some of these taxa are capable of completing up to 8 generations per year. Such fast
development times likely enabled chironomids to increase their production rapidly in response to
nutrient enrichment.

69
Nutrient-induced changes in food quality is the most probable mechanism responsible for
increased production of chironomids. Fine benthic organic matter (the dominant food resource
for chironomids) is extremely abundant in headwater streams at Coweeta (ca. 1000 g m-2), and its
quantity is relatively stable throughout the year (Cross Chapter 4). Nutrient enrichment caused
increased N and P content of FBOM in the treatment stream (Cross et al. 2003), which generally
translates to increased food quality for chironomids (e.g., Ward and Cummins 1979, Vos et al.
2000). In contrast, enrichment had little effect on FBOM quantity (Cross Chapter 4). Results
from our growth incubations indicated that changes in food quality led to increased growth rates
of chironomids. Additionally, chironomid production per gram FBOM increased in the
treatment stream relative to the reference stream during enrichment (Table 3.4), further
supporting the notion that changes were driven by food quality.
Enrichment also had a positive effect on the quality of leaf litter, the dominant food
resource of Tallaperla spp.. Concurrent research demonstrated that leaf nutrient content (Cross
et al. 2003, Gulis and Suberkropp), as well as fungal and bacterial biomass (K. Suberkropp,
University of Alabama, unpublished data) increased significantly in the treatment stream during
enrichment. At first glance, our results conflict with regard to the effects of increased food
quality on Tallaperla spp.. We did not detect an effect of enrichment on individual growth rates
(i.e., no quality effect), but we found that secondary production per gram leaf litter increased in
the treatment stream during enrichment (i.e., positive quality effect). One possible explanation
for this disparity is that growth incubations were not conducted for long enough time periods to
detect a response. Each growth trial lasted 2 months, which only represents ca. 11% of the larval
lifespan of Tallaperla spp.. During incubations, growth was sufficiently low that differences
caused by enrichment may have been swamped by measurement error or variability among

70
individuals. In contrast, 2 week growth incubations of chironomids represented ca. 50% of the
lifespan of many chironomid taxa (Huryn 1990).
Alternatively, it is possible that growth rates of Tallaperla spp. are physiologically
‘fixed’, and effects of enrichment are only manifested as increased survivorship or increased
carrying capacity per gram resource. Between-taxon differences in growth response may have
been due to fundamental differences in elemental requirements (sensu Elser et al. 1996).
Chironomids at Coweeta grow rapidly, and, in accordance with stoichiometric theory, have
relatively high amounts of body P (1.1%) and low C:P ratios (113) (Elser et al. 1996, Cross et al.
2003). In contrast, Tallaperla spp. have slow growth rates and, on average, lower body P (0.5%)
and higher C:P ratios (419) (Cross et al. 2003). Theory predicts that invertebrates containing
high amounts of body P (or N) require P-(or N) rich food resources for optimal growth (Elser et
al. 1996). Those that contain low amounts of these elements are less constrained by low-nutrient
resources, and may not respond to increased food nutrient content. Thus, the absence of an
enrichment effect on growth rates of Tallaperla spp. may have been due to a low physiological
requirement for P and a lack of pronounced P limitation.
Despite evidence for potentially positive effects of food quality on Tallaperla spp., our
results suggest that production per square meter was ultimately limited by food quantity. Larval
development times for Tallaperla spp. are much longer than chironomids (480 – 550 days,
O’Hop et al. 1984), and these semivoltine taxa complete less than one generation per year. Thus,
Tallaperla spp. require consistent availability of leaf litter throughout the year. Nutrient
enrichment led to major reductions in benthic leaf litter via increased leaf decomposition rates
(Gulis and Suberkropp 2003, Greenwood 2004, Cross Chapter 4). In fact, during summer
months of the enrichment (particularly year 2), leaf litter was virtually absent from the treatment

71
stream (K. Suberkropp, unpublished data, Cross Chapter 4). Nonetheless, total secondary
production per square meter was unaffected by enrichment. Therefore, overall, any positive
effects of nutrient enrichment on food quality were offset by the negative effects of decreased
food quantity. In this case, a long larval development time may be considered a constraint for
Tallaperla spp. in terms of their ability to take full advantage of increased food quality.
Were differences in the response of chironomids and Tallaperla spp. to enrichment
primarily caused by lifespan duration or feeding behavior? Can these life-history characteristics
be viewed separately in terms of their effect on invertebrate response? To get at these questions
we first examined the range of larval lifespans among invertebrate taxa in Coweeta headwater
streams (Figure 3.5A). Larval lifespans ranged from ca. 28 – 1140 days. Next, we identified
those taxa that increased in production more than 100% in the treatment stream during
enrichment relative to the pretreatment period (data from Cross Chapter 4); these taxa are
represented as dark circles on Figure 3.5A. It is clear that positive effects of enrichment were
limited to taxa with lifespans less than or equal to 1 year. Thus, it appears that larval lifespan is
indeed an important determinant of invertebrate response to enrichment. Next, we explored the
response of long- versus short-lived shredders (Figure 3.5B). Here, our analysis revealed a
minimal response among long-lived shredders, and a consistently large response among short-
lived shredders. Interestingly, one of the main contributors to increased production in the
treatment stream (Cross Chapter 4) was Pycnopsyche spp., a shredder with a relatively short
lifespan (275 d). The dominant species of Pycnopsyche enters a non-feeding final instar in the
spring, prior to the time leaf litter was limiting in the treatment stream. Thus, both the duration
and timing of larval development may be important determinants of shredder response to
enrichment. For gatherer taxa, 1 long-lived taxon did not respond to enrichment, and there was

72
considerably variability in response among short-lived taxa (3.5C). This pattern suggests that
larval lifespan may be less important in determining the response of gatherer taxa to enrichment
because the quantity of their food base is unaffected by enrichment.
General growth and production comparisons
Daily growth rates of chironomids were high, but not outside the range of those of
previous studies conducted at Coweeta (Huryn and Wallace 1986, Huryn 1990, Johnson et al.
2003). Growth rates were also comparable to those found for chironomids in other field-based
(e.g., Gresens 1997) and laboratory studies (e.g., Mackey 1977, Vos et al. 2000), although
growth is highly variable in these studies as a result of differences in taxonomic composition,
thermal regime, and food quality. We found that nutrient enrichment had a large positive effect
on chironomid growth (ca. 50% increase). However, the highest growth rates measured in this
study (0.153 d-1) were still considerably lower than values reported from warmer streams in the
southeastern U.S. (Stites and Benke 1989, Hauer and Benke 1991), the southwestern U.S. (Fisher
and Gray 1983), and the tropics (Jackson and Sweeney 1995, Rosemond et al. 2001, Ramirez
and Pringle, in review).
Annual secondary production of chironomids under non-enriched conditions (mean: 1038
mg AFDM m-2 y-1) was slightly lower than previous studies of undisturbed headwater streams at
Coweeta (Lugthart et al. 1990: 2254 mg AFDM m-2 y-1; Wallace et al. 1999: 1379 mg AFDM m-2
y-1), but did not fall outside the 95% confidence interval (CI) of these estimates (1009 – 2319 mg
AFDM m-2 y-1). However, this comparison is conservative because a) growth equations used to
estimate production in prior studies (Huryn 1990) generally predict higher production than
equations used in this study, and b) production was abnormally high (3636 mg AFDM m-2 y-1) in

73
C53 during 1984-1985 (Lugthart et al. 1990) during a year of low precipitation. During nutrient
enrichment, annual production increased by ca. 160% compared to pre-enrichment values. The
highest annual production value (2963 mg AFDM m-2 y-1) was outside the 95% CI of previous
studies, but was still lower than the highest reported value at Coweeta (3636 mg AFDM m-2 y-1
Lugthart et al. 1990). Drought conditions, such as those experienced in the mid-80s (Lugthart et
al. 1990), and during this study, can positively influence invertebrate production by increasing
organic matter retention (see Wallace et al. 1991, Wallace et al. 1999). However, in our study
discharge was consistently low during pre- and post treatment periods (data not shown),
suggesting that increased production of chironomids during enrichment was due factors other
than increased retention, such as aforementioned changes in food quality.
As expected, growth rates and secondary production of Tallaperla spp. were significantly
lower than chironomids (Tank 1996, Johnson et al. 2003). Estimated production values (mean:
242 mg AFDM m-2 y-1) were similar, but slightly lower than those reported for other streams at
Coweeta (mean: 358 mg AFDM m-2 y-1, 95% CI: 236 – 480 mg AFDM m-2 y-1, O’Hop et al.
1984, Wallace et al. 1999).
Interestingly, temperature did not influence growth rates of chironomids or Tallaperla
spp. in this study. Others have found that temperature is an important determinant of chironomid
growth rates (e.g., Mackey 1977, Huryn and Wallace 1986, Huryn 1990, Gresens 1997), as well
as growth rates of many other benthic invertebrate taxa (e.g., Vanote and Sweeney 1980, Huryn
and Wallace 2000). It is possible that the range of incubation temperatures used in this study
(6.7 – 17.1°C) was not wide enough to detect a significant effect. Indeed, previous studies at
Coweeta have measured growth rates at temperatures as low as 2°C (Huryn and Wallace 1986).

74
Long-term implications
In detritus-based ecosystems, enrichment is capable of stimulating microbial respiration
(e.g., Ramirez et al. 2003, Stelzer et al. 2003), invertebrate production (e.g., this study, Cross
Chapter 4), and leaf litter decomposition (e.g., Elwood et al. 1981, Gulis and Suberkropp 2003).
Over a sufficient time period, these factors may cause a net loss of carbon from the system (A.
D. Rosemond, unpublished data, Greenwood 2004). This carbon loss has the potential to cause
major shifts in community structure by favoring species with short life spans that do not require
continuous availability of coarse particulate organic matter. Our study suggests that community
change in response to enrichment will largely depend on life history characteristics of the initial
species composition. Such functional changes in the detritivore community, if persistent, will
have major consequences for the storage, processing, and export of organic matter from
headwater streams (e.g.,Wallace and Webster 1996).
Nutrient enrichment of aquatic ecosystems continues to threaten the long-term
sustainability of aquatic communities and the ecosystem services they provide. Predicting the
consequences of enrichment and developing effective management strategies will require
considerable research in ecosystems that are based on detritus. Detritus-based food webs truly
dominate the earth’s biosphere (e.g., Odum and de la Cruz 1963), and increasing knowledge of
their response to enrichment is a high priority.
Acknowledgements
We thank Heidi Wilcox and Sally Entrekin for field assistance and patience during long
grueling hours of measuring live chironomids. We also thank Jonathan Benstead, Elizabeth

75
Reese, and Sue Eggert for insightful comments on an earlier draft. Research funding was
provided by NSF (DEB – 9806610).
Literature Cited
Armitage, P, P. S. Cranston, and L. C. V. Pinder. 1995. The Chironomidae: Biology and
Ecology of Non-Biting Midges. Chapman and Hall.
American Public Health Association. 1998. Standard Methods for the Examination of Water
and Wastewater, 20th edn. American Public Health Association.
Benke, A. C. 1979. A modification of the Hynes method for estimating secondary production
with particular significance for multivoltine populations. Limnology and Oceanography
24:168-171.
Benke, A. C. 1993. Concepts and patterns of invertebrate production in running waters. Verh.
Internat. Verein. Limnol. 25:1-24.
Benke, A. C. 1998. Production dynamics of riverine chironomids: extremely high biomass
turnover rates of primary consumers. Ecology 79:899-910.
Benke, A.C., A. D. Huryn, L. A. Smock, and J. B. Wallace. 1999. Length-mass relationships
for freshwater macroinvertebrates in North America with particular reference to the
southeastern United States. Journal of the North American Benthological Society 18:
308–343.
Bennett, E. M., S. R. Carpenter, and N. F. Caraco. 2001. Human impact on erodable
phosphorus and eutrophication: a global perspective. BioScience 51:227-234.
Caraco, N. F. 1993. Disturbance of the phosphorus cycle: a case of indirect effects of human
activity. Trends in Ecology and Evolution 8:51-54.

76
Carpenter, S. R., T. M. Frost, D. Heisey, and T. K. Kratz. 1989. Randomized intervention
analysis and the interpretation of whole-ecosystem experiments. Ecology 70:1142-1152.
Carpenter, S. R., N. F. Caraco, D. L. Correll, R. W. Howarth, A. N. Sharpley, and V. H. Smith.
1998. Nonpoint pollution of surface waters with phosphorus and nitrogen. Ecological
Applications 8:559-568.
Chadwick, M. A. and A. D. Huryn. 2003. Effect of a whole-catchment N addition on stream
detritus processing. Journal of the North American Benthological Society 22:194-206.
Cross, W. F., A. D. Rosemond, J. P. Benstead, S. L. Eggert, and J. B. Wallace. in press.
Differential effects of consumers on C, N, and P dynamics: insights from long-term
research. Food Webs. deRuiter and Moore (eds.). Elsevier.
Cross, W. F., J. P. Benstead, A. D. Rosemond , and J. B. Wallace. 2003. Consumer-resource
stoichiometry in detritus-based streams. Ecology Letters 6:721-732.
Crowl, T. A., W. H. McDowell, A. P. Covich, and S. L. Johnson. 2001. Freshwater shrimp
effects on detrital processing and nutrients in a tropical headwater stream. Ecology
82:775-783.
Cuffney, T. F., J. B. Wallace, and G. J. Lugthart. 1990. Experimental evidence quantifying the
role of benthic invertebrates in organic matter dynamics of headwater streams.
Freshwater Biology 23:281-299.
Elser, J. J., D. R. Dobberfuhl, N. A. MacKay, and J. H. Schampel. 1996. Organism size, life
history, and N:P stoichiometry. BioScience 46:674-684.
Elwood, J. W., J. D. Newbold, A. F. Trimble, and R. W. Stark. 1981. The limiting role of
phosphorus in a woodland stream ecosystem: effects of P enrichment on leaf
decomposition and primary producers. Ecology 62:146-158.

77
Fisher, S. G. and L. J. Gray. 1983. Secondary production and organic matter processing by
collector macroinvertebrates in a desert stream. Ecology 64:1217-1224.
Galloway, J. N., J. D. Aber, J. W. Erisman, S. P. Seitzinger, R. W. Howarth, E. B. Cowling, and
B. J. Cosby. 2003. The nitrogen cascade. BioScience 53:341-356.
Grattan, R. M., and K. Suberkropp. 2001. Effects of nutrient enrichment on yellow poplar leaf
decomposition and fungal activity in streams. Journal of the North American
Benthological Society 20:33-43.
Greenwood, J. 2004. The response of heterotrophic and autotrophic resources to a long-term
nutrient enrichment in an Appalachian headwater stream ecosystem. Dissertation.
University of Georgia, Athens, GA, USA.
Gresens, S. E. 1997. Interactive effects of diet and thermal regime on growth of the midge
Pseudochironomus richardsoni Malloch. Freshwater Biology 38:365-373.
Gulis, V. and K. Suberkropp. 2003. Leaf litter decomposition and microbial activity in nutrient-
enriched and unaltered reaches of a headwater stream. Freshwater Biology 48:123-134.
Hall, R. O. J., J. B. Wallace, and S. L. Eggert. 2000. Organic matter flow in stream food webs
with reduced detrital resource base. Ecology 81:3445-3463.
Hart, D. D., and C. T. Robinson. 1990. Resource limitation in a stream community: phosphorus
enrichment effects on periphyton and grazers. Ecology 71:1494-1502.
Hauer, F. R. and A. C. Benke. 1991. Growth of snag-dwelling chironomids in a blackwater
river – the influence of temperature and discharge. Journal of the North American
Benthological Society 10:154-164.
Howarth, R. W., A. Sharpley, and D. Walker. 2002. Sources of nutrient pollution to coastal
waters in the United States: implications for achieving coastal water quality goals.

78
Estuaries 25:656-676.
Huryn, A. D. 1990. Growth and voltinism of lotic midge larvae: patterns across an Appalachian
mountain basin. Limnology and Oceanography 35:339-351.
Huryn, A. D., and J. B. Wallace. 1986. A method for obtaining in situ growth rates of larval
Chironomidae (Diptera) and its application to studies of secondary production.
Limnology and Oceanography 31:216-222.
Huryn, A. D., and J. B. Wallace. 1987. Local geomorphology as a determinant of macrofaunal
production in a mountain stream. Ecology 68:1932-1942.
Huryn, A. D., and J. B. Wallace. 2000. Life history and production of stream insects. Annual
Review of Entomology 45:83-110.
Jackson, J. K, and B. W. Sweeney. 1995. Egg and larval development times for 35 species of
tropical stream insects from Costa Rica. Journal of the North American Benthological
Society 14:115-130.
Johnson, B. R., W. F. Cross, and J. B. Wallace. 2003. Long-term resource limitation reduces
insect detritivores growth in a headwater stream. Journal of the North American
Benthological Society 22:565-574.
Lugthart, G. J., and J. B. Wallace. 1992. Effects of disturbance on benthic functional structure
and production in mountain streams. Journal of the North American Benthological
Society 11: 138-164.
Lugthart, G. J., J. B. Wallace, and A. D. Huryn. 1990. Secondary production of chironomid
communities in insecticide-treated and untreated headwater streams. Freshwater Biology
24:417-427.
Mackey, A. P. 1977. Growth and development of larval Chironomidae. Oikos 28:270-275.

79
Merritt, R.W. and K. W. Cummins. 1996. An Introduction to the Aquatic Insects of North
America. 3rd edn., Kendall/Hunt Publishing Co., USA.
Meyer, J. L. and J. B. Wallace. 2001. Lost linkages and lotic ecology: rediscovering small
streams. In: Ecology: Achievement and Challenge, M. C. Press, N. J. Huntly, and S.
Levin (eds.), Blackwell Science Press.
Murtaugh, P. A. 2003. On rejection rates of paired intervention analysis: reply. Ecology
84:2799-2802.
Odum, E. P and A. A. de la Cruz. 1963. Detritus as a major component of ecosystems. AIBS
Bulletin 13:39-40.
O'Hop, J., J. B. Wallace, and J. D. Haefner. 1984. Production of a stream shredder, Peltoperla
maria (Plecoptera: Peltoperlidae) in disturbed and undisturbed hardwood catchments.
Freshwater Biology 14:13-21.
Peterson, B. J., L. Deegan, J. Helfrich, J. E. Hobbie, M. Hullar, B. Moller, T. E. Ford, A.
Hershey, A. Hiltner, G. Kipphut, M. A. Lock, D. M. Fiebig, V. McKinley, M. C. Miller,
J. R. Vestal, R. Ventullo, and G. Volk. 1993. Biological responses of a tundra river to
fertilization. Ecology 74:653-672.
Polis, G. A., and D. R. Strong. 1996. Food web complexity and community dynamics.
American Naturalist 147:813-846.
Pringle, C. M., N. Hemphill, W. H. McDowell, A. Bednarek, and J. G. March. 1999. Linking
species and ecosystems: different biotic assemblages cause interstream differences in
organic matter. Ecology 80:1860-1872.
Ramirez, A. and C. M. Pringle. In review. Response of detrital consumers to phosphorus levels
in lowland tropical streams.
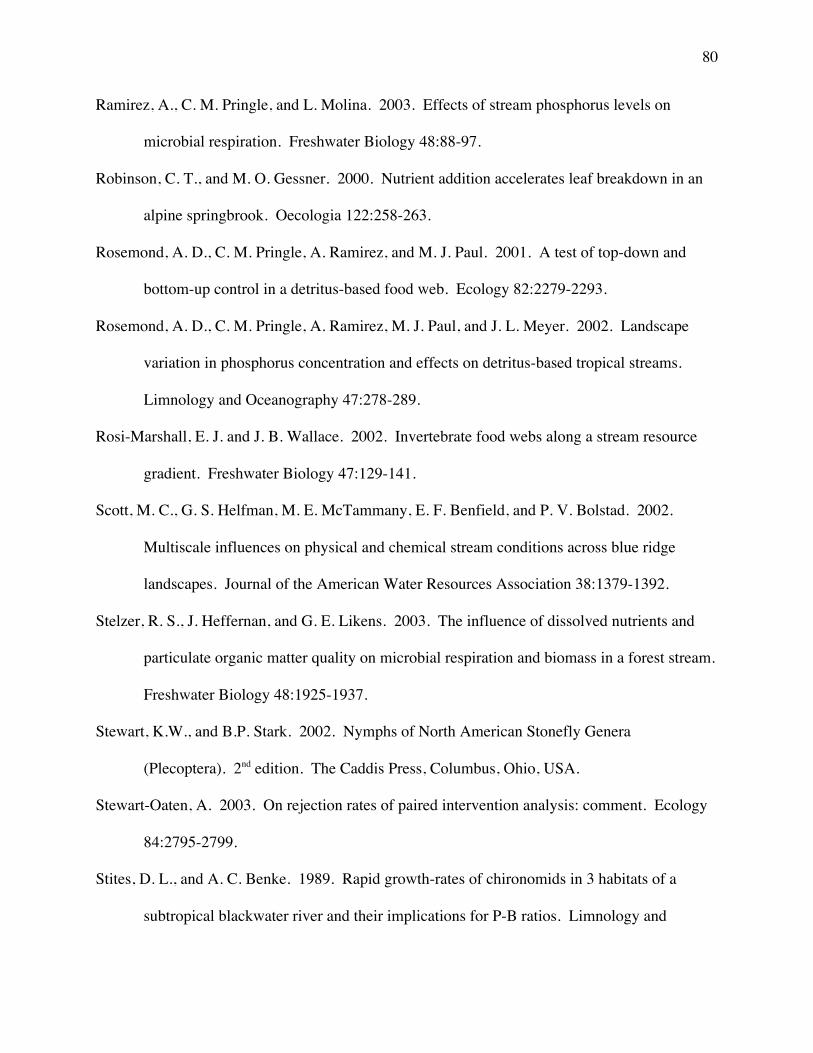
80
Ramirez, A., C. M. Pringle, and L. Molina. 2003. Effects of stream phosphorus levels on
microbial respiration. Freshwater Biology 48:88-97.
Robinson, C. T., and M. O. Gessner. 2000. Nutrient addition accelerates leaf breakdown in an
alpine springbrook. Oecologia 122:258-263.
Rosemond, A. D., C. M. Pringle, A. Ramirez, and M. J. Paul. 2001. A test of top-down and
bottom-up control in a detritus-based food web. Ecology 82:2279-2293.
Rosemond, A. D., C. M. Pringle, A. Ramirez, M. J. Paul, and J. L. Meyer. 2002. Landscape
variation in phosphorus concentration and effects on detritus-based tropical streams.
Limnology and Oceanography 47:278-289.
Rosi-Marshall, E. J. and J. B. Wallace. 2002. Invertebrate food webs along a stream resource
gradient. Freshwater Biology 47:129-141.
Scott, M. C., G. S. Helfman, M. E. McTammany, E. F. Benfield, and P. V. Bolstad. 2002.
Multiscale influences on physical and chemical stream conditions across blue ridge
landscapes. Journal of the American Water Resources Association 38:1379-1392.
Stelzer, R. S., J. Heffernan, and G. E. Likens. 2003. The influence of dissolved nutrients and
particulate organic matter quality on microbial respiration and biomass in a forest stream.
Freshwater Biology 48:1925-1937.
Stewart, K.W., and B.P. Stark. 2002. Nymphs of North American Stonefly Genera
(Plecoptera). 2nd edition. The Caddis Press, Columbus, Ohio, USA.
Stewart-Oaten, A. 2003. On rejection rates of paired intervention analysis: comment. Ecology
84:2795-2799.
Stites, D. L., and A. C. Benke. 1989. Rapid growth-rates of chironomids in 3 habitats of a
subtropical blackwater river and their implications for P-B ratios. Limnology and

81
Oceanography 34:1278-1289.
Swank, W.T., and D.A. Crossley. 1988. Forest Hydrology and Ecology at Coweeta. Ecological
Studies Series Volume 66, Springer-Verlag, New York.
Tank, J. L. 1996. Microbial activity on wood in streams: exploring abiotic and biotic factors
affecting the structure and function of wood biofilms. Dissertation. Virginia Polytechnic
Institute and State University.
Vannote, R. L., and B. W. Sweeney. 1980. Geographic analysis of thermal equilibria: a
conceptual model for evaluating the effect of natural and modified thermal regimes on
aquatic insect communities. American Naturalist 115:667-695.
Vitousek, P. M., J. D. Aber, R. W. Howarth, G. E. Likens, P. A. Matson, D. W. Schindler, W. H.
Schlesinger, and D. G. Tilman. 1997. Human alteration of the global nitrogen cycle:
sources and consequences. Ecological Applications 7:737-750.
Vos, J. H., M. A. G. Oojevaar, J. F. Postma, and W. Admiraal. 2000. Interaction between food
availability and food quality during growth of early instar chironomid larvae. Journal of
the North American Benthological Society 19:158-168.
Wallace, J. B. 1988. Aquatic invertebrate research. In: Ecological Studies, Vol. 66: Forest
Hydrology and Ecology at Coweeta, W. T. Swank and D. A. Crossley, Jr. (eds.),
Springer-Verlag.
Wallace, J. B. 1990. Recovery of lotic macroinvertebrate communities from disturbance.
Environmental Management 14:605-620.
Wallace, J. B., J. R. Webster, and T. F. Cuffney. 1982. Stream detritus dynamics: regulation by
invertebrate consumers. Oecologia 53:197-200.
Wallace, J. B., T. F. Cuffney, S. L. Eggert, and M. R. Whiles. 1997. Stream organic matter

82
inputs, storage, and export for Satellite Branch at Coweeta Hydrologic Laboratory, North
Carolina, USA. Journal of the North American Benthological Society 16:67-74.
Wallace, J. B., S. L. Eggert, J. L. Meyer, and J. R. Webster. 1997. Multiple trophic levels of a
forest stream linked to terrestrial litter inputs. Science 277:102-104.
Wallace, J. B., A. D. Huryn, and G. J. Lugthart. 1991. Colonization of a headwater stream
during three years of seasonal insecticidal applications. Hydrobiologia 211:65-76.
Wallace, J. B., S. L. Eggert, J. L. Meyer, and J. R. Webster. 1999. Effects of resource limitation
on a detrital-based ecosystem. Ecological Monographs 69:409-442.
Wallace, J. B., and J. R. Webster. 1996. The role of macroinvertebrates in stream ecosystem
function. Annual Review of Entomology 41:115-139.
Ward, G. M. and K. W. Cummins. 1979. Effects of food quality on growth of a stream
detritivores: Paratendipes albimanus (Meigen) (Diptera: Chironomidae). Ecology 60:57-
64.
Waters, T. F. 1969. Subsampler for dividing large samples of stream invertebrate drift.
Limnology and Oceangraphy 14:813.
Webster, J. R., J. L. Meyer, J. B. Wallace, and E. F. Benfield. 1997. Organic matter dynamics
in Hugh White Creek, Coweeta Hydrologic Laboratory, North Carolina, USA. Journal of
the North American Benthological Society 16:74-78.
Wetzel, R. G. 1995. Death, detritus, and energy flow in aquatic ecosystems. Freshwater
Biology 33:83-89.

83
Table 3.1. Physical and chemical characteristics of headwater streams draining catchments 53(reference) and 54 (enriched) at the Coweeta Hydrologic Laboratory. Elevations were measuredat the gauging weirs.Variable C53 (reference) C54 (enriched)Catchment Area (ha) 5.2 5.5 Elevation (m asl) 829.0 841.0Channel Gradient (cm m-1) 27.0 33.0 Length (m) 145.0 282.0 Bankfull Area (m2) 327.0 443.0Discharge (l s-1) Average* 1.2 1.5 Maximum* 47.2 35.5 Average this study¶ 0.3 0.5 Maximum this study¶ 3.8 4.8Substrate composition (%) Mixed substrates 73.0 65.0 Bedrock outcrop 27.0 35.0Temperature (°C) ¶
Annual average 12.0 12.0 Minimum 2.6 4.8 Maximum 18.6 16.7Water chemistry (range) pH 6.6 (6.2-7) 6.9 (6.6-7.9) (NO3-N + NO2)-N (µg l-1) pretreatment: 1999 – 2000 15.4 (9.4-25.8) 18.8 (4-39.5) treatment: 2000 – 2002 16.9 (bd-151) 308.9 (11-1711) NH4-N (µg l-1) pretreatment: 1999 – 2000 9.4 (bd-30) 9.9 (bd-25) treatment: 2000 – 2002 10.4 (bd-76) 105.5 (6-566) SRP‡ (µg l-1) pretreatment: 1999 – 2000 7.6 (bd-20) 8.8 (bd-22) treatment: 2000 – 2002 3.7 (bd-17) 51.2 (bd-268)
*C53 values from 12 years (1984-1996), C54 values from 8 years (1985-1992).‡Soluble reactive phosphorus. ¶September 1998 – August 2002. bd = below detection limit.

84
Table 3.2. Mean monthly abundance, biomass, and interval secondary production of non-tanypod Chironomidae and Tallaperla spp.in the reference stream (C53) and enriched stream (C54) before (pretreatment: September 1998 – June 2000) and during (treatment:July 2000 – August 2002) nutrient enrichment of C54.
Taxon/habitat Abundance (no m-2) Biomass (mg m-2) Production (mg m-2 interval-1) reference enriched reference enriched reference enriched
ChironomidaeMixed Substrate mean ±SE mean ±SE mean ±SE mean ±SE mean ±SE mean ±SE
pretreatment 44979 (5894) 24470 (3859) 115.5 (14.4) 89.8 (19.2) 123.9 (14.8) 86.6 (12.4) *** *** *** treatment 32899 (2412) 49330 (4627) 90.6 (6.7) 187.7 (23.7) 118.4 (6.8) 302.5 (24.8)
Bedrock Outcrops pretreatment 8832 (1085) 16092 (2764) 19.3 (3.8) 38.8 (7.3) 29.0 (3.5) 64.2 (11.5)
ns ns ns treatment 9628 (2002) 13098 (1804) 25.1 (6.3) 33.8 (6.7) 36.8 (6.9) 75.1 (10.1)Habitat-Weighted pretreatment 35219 (4328) 21538 (3024) 89.5 (10.4) 72.0 (13.2) 98.3 (10.7) 78.8 (9.4)
*** *** *** treatment 26616 (1994) 36649 (3197) 72.9 (5.6) 133.9 (16.8) 96.4 (5.4) 222.9 (18.2)Tallaperla spp.Mixed Substrate pretreatment 1193 (327) 276 (58) 105.7 (19.3) 78.3 (25.5) 26.2 (4.7) 12.2 (2.4)
** ns ns treatment 627 (82) 598 (129) 164.8 (22.6) 138.6 (31.5) 35.5 (4.4) 25.5 (4.1)Bedrock Outcrops pretreatment 294 (71) 315 (82) 53.6 (16.9) 44.0 (13.1) 14.3 (3.1) 10.2 (2.2)
** * * treatment 511 (65) 211 (54) 97.0 (17.1) 33.5 (8.6) 24.4 (3.4) 9.3 (1.8)Habitat-Weighted pretreatment 950 (240) 289 (52) 91.7 (14.9) 66.3 (17.2) 23.0 (3.7) 11.5 (1.8)
* ns ns treatment 595 (64) 462 (90) 146.5 (18.6) 101.8 (20.5) 32.5 (3.6) 19.8 (2.7)
*P < 0.05, **P < 0.01, ***P < 0.001, Randomized intervention analysis. ns = not significant, P > 0.05. This analysis comparesbefore- and after-treatment time series data from C53 and C54.

85
Table 3.3. Annual secondary production (mg m-2 y-1) and P/B ratios for chironomids and Tallaperla spp. during each year of the studyin the reference (C53) and enriched (C54) streams. Year 1 = September 1998 – August 1999, year 2 = September 1999 – August2000, year 3 = September 2000 – August 2001, year 4 = September 2001 – August 2002. Years 1 and 2 are before the experimentalnutrient enrichment. Also see Figures 2 and 3.
year 1 year 2 year 3 year 4
Chironomidae P P/B P P/B P P/B P P/B Mixed substrate reference 1005.4 9.2 1704.1 12.7 1260.9 15.2 1279.0 13.1 enriched 802.6 10.0 1456.8 7.5 3968.0 19.5 2817.4 15.7 Bedrock outcrop reference 292.9 16.2 321.6 17.9 332.8 17.2 581.8 16.7 enriched 479.7 16.2 854.0 19.9 1097.2 25.0 764.4 27.4 Habitat-Weighted reference 838.2 9.9 1356.8 13.2 1007.9 15.3 1090.7 13.5 enriched 692.8 11.1 1243.0 8.8 2963.2 20.0 2098.8 16.6
Tallaperla spp. Mixed substrate reference 217.5 2.4 333.9 2.6 442.1 2.7 359.5 2.1 enriched 81.0 1.6 222.2 2.1 334.8 2.0 227.3 2.0 Bedrock outcrop reference 142.7 3.2 159.7 2.9 275.2 2.9 333.2 3.0 enriched 90.4 2.4 134.8 2.7 90.6 2.6 80.0 2.5 Habitat-Weighted reference 197.3 2.5 286.9 2.7 397.0 2.8 352.4 2.2
enriched 84.3 1.8 191.6 2.2 249.3 2.0 175.7 2.1

86
Table 3.4. Annual secondary production of non-Tanypodinae chironomids and Tallaperla spp. expressed per gram fine benthicorganic matter (FBOM) or leaf litter throughout the study in the reference and treatment streams. A description of organic mattermethods and results can be found in Chapter 4. Year 1 = September 1998 – August 1999, year 2 = September 1999 – August 2000,year 3 = September 2000 – August 2001, year 4 = September 2001 – August 2002.
chironomid productionmg mg-1 FBOM m-2 y-1
Tallaperla spp. productionmg mg-1 leaf litter m-2 y-1
reference treatment% higher or lowerin enriched stream reference enriched
% higher or lowerin enriched stream
year 1 0.00096 0.00055 (-) 42% 0.00148 0.00046 (-) 69%year 2 0.00204 0.00068 (-) 67% 0.00125 0.00074 (-) 41%year 3 0.00164 0.00191 (+) 16% 0.00160 0.00147 (-) 8%year 4 0.00156 0.00140 (-) 10% 0.00154 0.00225 (+) 47%

87
Figure 3.1. Size-specific daily growth rates (d-1) of non-Tanypodinae chironomids (A) and
Tallaperla spp. (B) in the reference stream (C53, white circles), the treatment stream before
enrichment (C54, gray circles), and the treatment stream during the experimental enrichment
(C54, black circles). Lines represent significant linear regressions (see text for equations). For
chironomids (A), the dashed line represents data from the reference stream and the treatment
stream before enrichment (white and grey circles), and the solid line represents data from the
treatment stream during enrichment (black circles). For Tallaperla spp. (B), the solid line
represents data from all time periods.

88
0.00
0.05
0.10
0.15
0.20
gro
wth
rat
e (d
-1)
0.0
0
0.2
5
0.5
0
0.7
5
1.0
0
1.2
5
treat54growth
pretreat54growth
53growthreference
treatment (pre-enriched)
treatment (enriched)
0.000
0.005
0.010
0.015
0.020
0.0
0
1.0
0
2.0
0
3.0
0
ln(initial length [mm])
A
B

89
Figure 3.2. Mean monthly abundance and biomass, and interval secondary production, of non-
Tanypodinae chironomids in the reference stream (C53, white circles) and the treatment stream
(C54, black circles) from September 1998 to August 2002. The arrow indicates the initiation of
nutrient enrichment of C54. Differences between streams were tested with randomized
intervention analysis.

90
0
25000
50000
75000
100000
ab
un
da
nc
e (
no
./m
2)
sept
98
nov
98ja
n 99
mar
99
may
99
jul 9
9se
pt 9
9no
v 99
jan
00m
ar 0
0m
ay 0
0ju
l 00
sept
00
nov
00ja
n 01
mar
01
may
01
jul 0
1se
pt 0
1no
v 01
jan
02m
ar 0
2m
ay 0
2ju
l 02
54chiroabund
53chiroabund
0
100
200
300
400
bio
mas
s (m
g/m
2)
sept
98
nov
98ja
n 99
mar
99
may
99
jul 9
9se
pt 9
9no
v 99
jan
00m
ar 0
0m
ay 0
0ju
l 00
sept
00
nov
00ja
n 01
mar
01
may
01
jul 0
1se
pt 0
1no
v 01
jan
02m
ar 0
2m
ay 0
2ju
l 02
0
100
200
300
400
pro
du
ctio
n (
mg
m-2
in
terv
al-
1 )
sep
t 98
no
v 98
jan
99
ma
r 9
9m
ay 9
9ju
l 99
sep
t 99
no
v 99
jan
00
ma
r 0
0m
ay 0
0ju
l 00
sep
t 00
no
v 00
jan
01
ma
r 0
1m
ay 0
1ju
l 01
sep
t 01
no
v 01
jan
02
ma
r 0
2m
ay 0
2ju
l 02
reference
treatmentN+P
N+P
N+P
P<0.0001
P<0.0001
P<0.0001

91
Figure 3.3. Mean monthly abundance and biomass, and interval secondary production, of non-
Tallaperla spp. in the reference stream (C53, white circles) and the treatment stream (C54, black
circles). The arrow indicates the initiation of nutrient enrichment of C54. Differences between
streams were tested with randomized intervention analysis.

92
0
1000
2000
3000
4000
5000
ab
un
da
nc
e (
no
/m2
)
sept
98
nov
98ja
n 99
mar
99
may
99
jul 9
9se
pt 9
9no
v 99
jan
00m
ar 0
0m
ay 0
0ju
l 00
sept
00
nov
00ja
n 01
mar
01
may
01
jul 0
1se
pt 0
1no
v 01
jan
02m
ar 0
2m
ay 0
2ju
l 02
54talabund
referencereference
treatment
0
100
200
300
400
500
bio
mas
s (m
g/m
2)
sept
98
nov
98ja
n 99
mar
99
may
99
jul 9
9se
pt 9
9no
v 99
jan
00m
ar 0
0m
ay 0
0ju
l 00
sept
00
nov
00ja
n 01
mar
01
may
01
jul 0
1se
pt 0
1no
v 01
jan
02m
ar 0
2m
ay 0
2ju
l 02
0
25
50
75
100
pro
du
cti
on
(m
g m
-2 i
nte
rva
l-1 )
sep
t 98
no
v 98
jan
99
ma
r 9
9m
ay 9
9ju
l 99
sep
t 99
no
v 99
jan
00
ma
r 0
0m
ay 0
0ju
l 00
sep
t 00
no
v 00
jan
01
ma
r 0
1m
ay 0
1ju
l 01
sep
t 01
no
v 01
jan
02
ma
r 0
2m
ay 0
2ju
l 02
N+P
N+P
N+P
P=0.01
P=0.61
P=0.85

93
Figure 3.4. Relationship between interval P/B (P/Bint) in the reference stream (C53) and P/Bint in
the treatment stream (C54) before (pretreatment, white circles) and during enrichment of C54
(enrichment, black circles) for non-Tanypodinae chironomids (A) and Tallaperla spp. (B).
Differences from the 1:1 line during pretreatment and treatment periods tested with Wilcoxon
signed-ranks tests. ns = not significant (P >0.05).

94
0.50
1.00
1.50
2.00
2.50
enri
ched
P/B
int
0.5
0
1.0
0
1.5
0
2.0
0
2.5
0
monthly P:B 54 (treat)
monthly P:B 54 (pretreat)pretreatment
enrichment
0.00
0.10
0.20
0.30
0.40
0.50
0.0
0
0.1
0
0.2
0
0.3
0
0.4
0
0.5
0
reference P/Bint
A
B
P<0.05
ns

95
Figure 3.5. Coweeta invertebrate taxa ranked by larval lifespan. A. This panel shows the larval
lifespan of chironomids and Tallaperla spp. in relation to other consumers. Dark circles indicate
taxa that increased in production 100% or more in the treatment stream during enrichment
relative to the pretreatment period. B. This panel points out the position of long-lived versus
short-lived shredders. C. This panel points out the position of long-lived versus short-lived
gatherers.

96
0
200
400
600
800
1000
1200
Invertebrate taxa ranked by larval lifespan
Lar
val l
ifes
pan
(d
)
chironomids
Tallaperla spp.
0
200
400
600
800
1000
1200
Invertebrate taxa ranked by larval lifespan
Lar
val l
ifes
pan
(d
) Long-lived shredders
Short-lived shredders
0
200
400
600
800
1000
1200
Invertebrate taxa ranked by larval lifespan
Lar
val l
ifes
pan
(d
)
long-lived gatherer
short-lived gatherers
A
B
C

97
CHAPTER 4
CONSUMER RESPONSE TO LONG-TERM NUTRIENT ENRICHMENT OF A DETRITUS-
BASED STREAM ECOSYSTEM1
________________________1Cross, W. F., J. B. Wallace, A. D. Rosemond, and S. L. Eggert. To be submitted to Ecology.

98
Abstract
Increased availability and mobilization of nutrients, such as nitrogen and phosphorus, is
having large effects on the structure, function, and diversity of aquatic and terrestrial ecosystems
globally. Much of our understanding of these effects, however, comes from systems or food
webs based on living plants or algae. In contrast, little is known about the effects of enrichment
in systems based on non-living detritus, despite the prevalence and energetic importance of
detritus in most ecosystems. We experimentally enriched a detritus-based headwater stream for
2 years to examine the effects of nutrient-induced changes at the base of the food web on higher
metazoan (predominantly invertebrate) consumers. Our paired-catchment design was aimed at
quantifying organic matter and invertebrate dynamics in the enriched stream and an adjacent
reference stream for 2 years prior to enrichment and 2 years during enrichment. Enrichment had
a strong negative effect on standing crop of leaf litter, but no apparent effect on fine benthic
organic matter. Abundance, biomass and secondary production of many invertebrate taxa
increased in response to enrichment, and taxon-specific differences were related to length of
larval lifespan – a prominent life history characteristic. Production of invertebrate predators was
also positively influenced by enrichment, and closely tracked the increased production of
invertebrate prey. Response of invertebrates was largely habitat-specific with little effect of
enrichment on food webs inhabiting bedrock outcrops. Invertebrate secondary production during
the enrichment was the highest ever reported for streams at Coweeta, and was much higher than
predicted production based on 27 years of background data from these streams. Despite
reductions in leaf litter quantity caused by enrichment, production was extremely high
underscoring the potential importance of nutrient-induced changes in food quality in driving
consumer response.

99
Introduction
Humans are altering global carbon (C), nitrogen (N), and phosphorus (P) budgets.
Activities such as fossil fuel combustion, agriculture, mining, and urban/suburbanization have
led to changes in the dynamics of these elements (e.g., Galloway et al. 2003), and large-scale
mobilization of nutrients such as N and P (e.g., Vitousek et al. 1997, Carpenter et al. 1998,
Bennett et al. 2001, Paul and Meyer 2001). Increased nutrient availability in terrestrial and
aquatic ecosystems may cause long-term changes in ecosystem structure and function because
these elements often limit the rate of many ecological processes (e.g., Vitousek et al. 1997).
While much is known about how nutrients function in plant- or algal-based ecosystems (e.g.,
Schindler et al. 1978, Tilman 1987, Tamm 1991, Vitousek and Howarth 1991, Peterson et al.
1993, Carpenter et al. 1998, Harvey et al. 1998), few studies have addressed the effects of
enrichment in ecosystems based on detritus (i.e., non-living organic matter) (but see Chen and
Wise 1999, Scheu and Schaefer 1999, Pearson and Connolly 2000, Rosemond et al. 2001, 2002,
Ramirez et al. 2003).
Detritus-based ecosystems may respond to nutrient enrichment in a fundamentally
different way than ecosystems based on living-plants. This is largely due to differences in
composition of the dominant basal resource. In detrital systems, detritus and associated
heterotrophic microbes (i.e., bacteria and fungi) occupy a similar trophic position as living plants
or algae. This is of paramount importance because nutrient enrichment can stimulate the
metabolism of these heterotrophic microbes (e.g., Pace and Funke 1991), as opposed to plants or
algae, and this may result in a net loss of carbon at the base of the food web. Evidence from
soils, lakes, streams, and coastal marine systems indicates that nutrients may indeed stimulate the
biomass and metabolism of heterotrophic microbes (e.g., Pace and Funke 1991, Gallardo and

100
Schlesinger 1994, Pomeroy et al. 1995, Joergensen and Scheu 1999, Gulis and Suberkropp
2003). In addition, both correlational and experimental studies of forested streams and soils have
linked increased microbial activity to higher decomposition or mineralization rates and carbon
depletion (e.g., Elwood et al. 1981, Suberkropp and Chauvet 1995, Scheu and Schaefer 1998,
Gulis and Suberkropp 2003, but see Aerts et al. 2003).
The degree to which nutrient-induced changes at the base of detrital food webs affects the
dynamics of higher consumers has received very little attention (e.g., Scheu and Schaefer 1998,
Pearson and Connolly 2000, Rosemond et al. 2001, 2002). Consumers that rely on detritus and
associated microbes as a dominant food source may be positively or negatively affected by
nutrient enrichment. In the short term, stimulation of microbial activity can lead to higher
nutrient content of detritus, and increased food quality for consumers (e.g., Cross et al. 2003,
Stelzer et al. 2003). Indeed, growth rates of detritivores have been shown to increase with
detrital nutrient content (e.g., Iversen 1974, Tenore 1977, Ward and Cummins 1979, Vos et al.
2000). However, in the long term, accelerated decomposition rates may lead to decreased food
quantity which could negatively affect long-lived consumers that depend on the availability of
detritus throughout their entire life cycles.
Although all natural systems include important detrital pathways (e.g., Odum and de al
Cruz 1963, Wetzel 1995, Moore et al., in press), detritus represents the dominant carbon source
in forested headwater streams in the eastern U.S., and many other regions of the world (e.g.,
Wallace et al. 1997b). In these streams, productivity and metabolism are driven by inputs of
allochthonous leaf detritus from the terrestrial catchment (e.g., Fisher and Likens 1973, Wallace
et al. 1997b, 1999), and in-stream autotrophic production is generally very low (e.g., Fisher and
Likens 1973, Webster et al. 1997). A number of studies have demonstrated strong positive links

101
between the quantity of detritus and stream consumer abundance or productivity (e.g., Minshall
1967, Richardson 1991, Wallace et al. 1997, 1999). However, the quality of detritus is also
likely to be important in determining limits to consumer production; this is particularly true in
detritus-based systems where large elemental imbalances exist between consumers and food
resources (Cross et al. 2003). Although many studies have demonstrated significant effects of
nutrient enrichment on stream detritus quality (e.g., Howarth and Fisher 1976, Elwood et al.
1981, Cross et al. 2003, Stelzer et al. 2003), microbial activity (e.g., Ramirez et al. 2003, Stelzer
et al. 2003) and decomposition rates (e.g, Elwood et al. 1981, Meyer and Johnson 1983,
Rosemond et al. 2002, Gulis and Suberkropp 2003), our current knowledge of enrichment effects
on productivity of higher consumers is limited by a lack of long-term experimental
manipulations at the whole ecosystem scale. Such large-scale experiments are critical for
assessing the response of ecosystems to environmental change and human-induced perturbations
(e.g., Carpenter et al. 1995, Schindler 1998).
In this study, our main objective was to examine the effects of an ecosystem-scale
experimental nutrient enrichment on community structure and productivity of consumers in
detritus-based headwater streams. We examined the dynamics of invertebrates and benthic
organic matter in the experimental stream and an adjacent reference stream for 2 years prior to
enrichment and 2 years during enrichment. Concurrent studies in these streams demonstrated a
strong positive effect of nutrients on the quality of detritus via increased detritus-bound
microbial biomass and production (Gulis and Suberkropp 2003, K. Suberkropp, University of
Alabama, unpublished data) and increased detrital nutrient content (Cross et al. 2003, Gulis and
Suberkropp 2003). We predicted that these microbially-mediated changes would positively
influence total production of invertebrate detritivores and predators. However, we hypothesized

102
that the quantity of detritus (particularly leaf litter) would be negatively affected by enrichment,
and that production of some leaf-eating taxa (i.e, shredders) would suffer from this quantitative
decline in their resource base. Finally, we predicted that differences among taxa in response to
changes in resource quantity and quality would be dependent upon larval lifespan, a dominant
life history characteristic.
Study sites
This study was conducted in two adjacent headwater streams at the Coweeta Hydrologic
Laboratory, Macon County, North Carolina, USA. Coweeta is a large (2185 ha) heavily forested
basin located in the Blue Ridge physiographic province of the southern Appalachian Mountains
(see Swank and Crossley 1988). Forest vegetation is dominated by mixed hardwoods (primarily
oak, maple, and poplar) and a dense understory of Rhododendron maximum which shades the
streams throughout the year. Headwater streams at Coweeta are extremely heterotrophic, and
allochtonous inputs of detritus provide >90% of the energy base for microbial and invertebrate
production (Wallace et al. 1997b, Hall et al. 2000). In-stream primary production is very low
(ca. 4 – 8 g C m-2 y-1) and constitutes < 1% of the total carbon entering these streams (Wallace et
al. 1997a). Both streams are fishless, but contain vertebrate larval salamanders.
The two streams used for this study are first order, and drain the small catchments (C) 53
and 54 (hereafter C53 and C54). These streams have similar physical and chemical
characteristics (Table 4.1), but differ (since July 2000) in their concentrations of dissolved N and
P as a result of our experimental nutrient enrichment of C54 (Table 4.1). Natural concentrations
of inorganic N and P in these streams are very low (Table 4.1). The dominant stream substrate is
a heterogeneous mixture of cobble, pebble, gravel, sand, and silt (hereafter ‘mixed substrate’)

103
(Table 4.1). This habitat is disrupted periodically by moss-covered bedrock outcrops (hereafter
‘bedrock outcrops’) (Table 4.1). The bedrock outcrops comprise a smaller proportion of the
benthos than the mixed substrate habitat (Table 4.1). Both streams have rough topography and
abundant woody debris, which facilitate high retention and processing of organic matter
(Wallace et al. 1995).
Discharge was monitored continuously during the study with FW-1 stage and ISCO 3230
Bubble Flow Meter (ISCO Inc., Lincoln, Nebraska, USA) recorders attached to 30 cm H-flumes
at the base of each catchment. Water temperature (°C) was monitored every 30 minutes in both
streams with Optic StowAway temperature probes (Onset Computer Corp., Pocasset, MA, USA
K. Suberkropp, University of Alabama, unpublished data).
Precipitation during the study was considerably lower than the long term average of 182
cm y-1 (based on 64-y record from Coweeta Hydrologic Laboratory). When expressed as a
percentage of the long-term average, year 1 (September 1998 – August 1999) was 83%, year 2
(September 1999 – August 2000) was 66%, year 3 (September 2000 – August 2001) was 74%,
and year 4 (September 2001 – August 2002) was 78%.
Methods
Experimental Enrichment
Our study consisted of a ~2 year pretreatment period (September 1998 – June 2000) and
a ~2 year experimental enrichment (July 2000 – August 2002) of C54. Starting in July 2000,
nitrogen (NH4NO3) and phosphorus (K2HPO4 and KH2PO4) were dripped continuously into the
treatment stream to increase concentrations of dissolved inorganic N and P to ≈ 6-15 X
background levels (Table 4.1). Nutrient solution was added along 140 m of the treatment stream

104
with a solar powered metered-dose pump (LMI, Acton, Massachusetts, USA) connected to a
streamwater-fed plastic pipe laid along the streambed. The plastic pipe was fitted with garden
irrigation valves roughly every 10 m to evenly distribute nutrients along the length of the stream.
Stream water nutrient concentrations were held relatively constant across a range of discharge by
connecting the pump to an Isco data logger (Isco Inc., Lincoln, NE, USA) located at the base of
the stream; the pump was engaged every time a known volume of water (generally 50-100 liters)
passed through the downstream weir. Concentrations of (NO3 + NO2)-N, NH4-N, and soluble
reactive phosphorus (SRP) were measured biweekly at the flume of each study stream (APHA
1998). During the experimental enrichment, nutrient concentrations were also measured at 5
locations along the length of C54 to confirm that nutrients were evenly distributed along the
stream. Nutrient concentrations in the treatment stream during enrichment (Table 4.1) were well
within the range of natural concentrations of streams in the region (Scott et al. 2002), and thus
provided a realistic assessment of moderate enrichment effects.
This ecosystem-level experiment was not replicated, employing a paired-catchment
design (e.g., Likens et al. 1969) with one treatment stream and one reference stream. This
approach has been lauded for its realism and scale (e.g., Carpenter et al. 1995, Schindler 1998,
Oksanen 2001), as well as criticized for its lack of strict replication (Hurlbert 1984, 2004). The
limitations of our design are recognized, but we felt that the scale of manipulation was essential
for predicting realistic effects.
Benthic sampling
We quantified invertebrate secondary production, as well as abundance and biomass,
because production estimates capture population-level dynamics of growth, mortality, and

105
fecundity (Benke 1993), as well as provide a measurement of energetic flow through consumers.
Quantitative benthic sampling was conducted monthly in each stream for 4 years between
September 1998 and August 2002. Each month, samples were taken from mixed substrate and
bedrock outcrop habitats. Mixed substrate samples were collected at 4 random locations in each
stream with a stove pipe core sampler (400 cm2). Cores were firmly placed in the streambed, and
all material was removed to a depth of 15 cm by hand or cup and placed in a large plastic jar.
Following sample removal, five water depths were taken inside the core to estimate the total
volume of material remaining in the water. This water was then stirred, subsampled with a
plastic cup, and brought to the laboratory to estimate the amount of fine particulate organic
matter remaining in the sampler (OMW). Bedrock samples were taken at 3 randomly
determined locations in each stream by brushing and scraping moss and associated particles from
a known area (15 cm x 15 cm) with a dish scrubber and knife into a plastic bag and hess net (250
µm mesh size) pressed flush against the bedrock.
Benthic samples were brought to the laboratory, refrigerated, and processed within 24
hours. Samples were rinsed with tap water onto nested metal sieves (pore sizes 1 mm and 250
µm), and material retained on each sieve was elutriated to separate organic from inorganic
material. All organic material, including invertebrates and salamanders, was then preserved
separately for each size fraction (> 1mm and < 1 > 250 µm) in formalin (6-8%). Animals were
removed from the > 1 mm fraction by hand picking under a dissecting microscope at 15x
magnification. Organic material in the smaller size fraction (<1 mm>250 µm) was subsampled
(1/8 to 1/64 of whole samples) using a sample splitter (Waters 1969), and animals were removed
from subsamples with a dissecting microscope at 15x magnification.

106
The amount of coarse (>1 mm, CBOM), fine (<1 mm>250 µm, FBOM), and very-fine
(<250 µm, VFBOM) benthic organic matter was quantified in each sample (also see Lugthart
and Wallace 1992). CBOM was separated into leaf, wood, seed, moss, and miscellaneous
categories, then dried (50°C), weighed to the nearest 0.01 g, ashed (at 500°C), and reweighed to
quantify ash-free dry mass (AFDM). FBOM and VFBOM were quantified during sample
processing by placing material that was retained (FBOM) or had passed through (VFBOM) the
250 µm sieve into a graduated bucket with a known volume of water. This material was stirred,
sub-sampled (< 1%) with a graduated syringe, and filtered onto pre-ashed, pre-weighed glass
fiber filters (Gelman A/E). Filters were dried, weighed to the nearest 0.01 mg, ashed, and
reweighed to quantify AFDM. OMW was subsampled with a syringe, filtered, dried, weighed,
ashed, and re-weighed as for FBOM. In this study, total FBOM refers to the summation of
FBOM, VFBOM, and OMW (i.e., all organic particles <1 mm).
Invertebrates and larval salamanders were counted and identified. All insects, except
Chironomidae, were identified to the genus or species level. Larval chironomids were identified
as either Tanypodinae or non-Tanypodinae. Most non-insect taxa were identified to the ordinal
level or higher. Taxa were assigned to functional feeding groups according to Merritt and
Cummins (1996) and our knowledge of the local fauna. In this study, all functional feeding
group designations (i.e., shredder, collector-gatherer [=gatherers], scraper, collector-filterer
[=filterers], and predator) follow Wallace et al. (1999). The body length of each individual was
measured to the nearest mm with a dissecting microscope at 12X magnification and a graduated
stage. Total snout-vent length and carapace length were measured on salamanders and crayfish,
respectively. For most taxa, biomass (AFDM) was obtained using previously established length-
weight regressions for invertebrates at Coweeta, or, for a few taxa, nearby North Carolina

107
streams (Benke et al. 1999). For Copepoda, Hydracarina, Nematoda, and Cladocera, biomass
was obtained from mean mass of >50 individuals in subsamples of representative size classes (J.
B. Wallace, unpublished data).
Secondary production
Annual production was estimated for most taxa using the size-frequency method
(Hamilton 1969) corrected for the cohort production interval (CPI, Benke 1979). Invertebrate
CPIs were the same as those used by Wallace et al. (1999), and were estimated from length-
frequency histograms constructed from monthly benthic samples taken in the study streams
(Lugthart and Wallace 1992) or another stream at Coweeta (Huryn and Wallace 1987a, b).
Larval development times for salamanders were obtained from Lugthart (1991).
Annual production of non-Tanypodinae chironomids and Tallaperla spp. (Plecoptera:
Peltoperlidae) was estimated using the community-level instantaneous growth method (Huryn
and Wallace 1986, Huryn 1990). Size-specific growth rates were measured in situ in both
streams throughout the study and applied to monthly biomass values (Cross Chapter 3).
Production of Copepoda was estimated using an empirically-derived production/biomass (P/B)
value of 18 (O’Doherty 1985). For the remaining taxa, the product of standing stock biomass
and annual P/B ratio was used to estimate production. P/B values of 5 and 10 were used for
several taxa considered to by univoltine and bivoltine, respectively (Waters 1977, Lugthart and
Wallace 1992). With the exception of oligochaetes, these remaining taxa comprised a small
proportion of total community biomass. A conservative P/B value of 5 was used for oligochaetes
(but see Brinkhurst and Cook 1980).

108
Annual production was estimated separately for each taxon in the mixed substrate and
bedrock outcrop habitats. Habitat-weighted production values for the entire stream were
calculated according to the relative proportion of each habitat in each stream (e.g., Huryn and
Wallace 1987a, Lugthart and Wallace 1992, Table 4.1).
Statistical analyses
We used randomized intervention analysis (RIA, Carpenter et al. 1989, also see Stewart-
Oaten 2003, Murtaugh 2003) to test for effects of nutrient enrichment on benthic organic matter
and abundance and biomass of invertebrate taxa and functional feeding groups. RIA uses paired
before- and after-treatment time-series data from a manipulated and a reference system to detect
changes caused by the manipulation. In this study, RIA was used to test the null hypothesis of
no change in the variable of interest in the treatment stream relative to the reference stream
following initiation of nutrient enrichment. To increase the statistical power of RIAs, we
included data from a previous unmanipulated year (October 1984 – September 1985) in both
streams (see Lugthart and Wallace 1992). These previous data are presented throughout the
study as the first year of pretreatment (Pre-1). Data were log (x+1) transformed to meet
assumptions of normality and homoscedasticity.
Relationships between organic matter standing crop and invertebrate production were
analyzed with linear regression analysis. Regression was also used to analyze relationships
between primary consumer or total invertebrate production and predator production. For these
relationships the y-intercept was set equal to zero (i.e., no prey production = no predator
production). Although predators are included in both axes of the relationship between total and

109
predator production, this analysis is justified based on the prevalence of intraguild predation in
these streams (Wallace et al. 1999, Hall et al. 2000, W. F. Cross, personal observation).
Long-term relationships between organic matter standing crop and invertebrate
production were also examined using data from the present study, as well as previously
published estimates from the study streams (Lughtart and Wallace 1992, Wallace et al. 1999) and
another headwater stream at Coweeta (C55, Wallace et al. 1999). These long-term data include 7
years of leaf litter reduction in C55 (Wallace et al. 1999).
We calculated percent difference in production for each taxon between pre- and post-
enrichment periods in the enriched stream. To test for significant differences between the
response of short lived (<365 days) and long-lived (>365 days) taxa we used a non-parametric
Wilcoxon test.
Results
Nutrient enrichment
The experimental enrichment successfully elevated concentrations of NO3-N, NO2-N,
NH4-N, and soluble reactive phosphorus (SRP) to 6-15 X background levels in the treatment
stream (Table 4.1). During enrichment, the molar N:P ratio of streamwater in the treated stream
was 19.7. This ratio was considerably higher than that of the stock nutrient solution added
(11.4), suggesting preferential uptake of P in the enriched stream.
Benthic organic matter
Nutrient enrichment had a significant negative effect on standing crop of leaf litter
detritus (RIA, P = 0.002, Figure 4.1, Table 4.2) in the mixed substrate habitat. Although both

110
streams attained similar maxima during annual leaf fall, benthic leaf litter disappeared more
rapidly in the treatment stream during the two years of enrichment (Figure 4.1). Between-stream
differences in leaf litter standing crop were most pronounced during the final year of the study in
which the treatment stream contained on average only 43% of leaf litter in the reference stream
(101 g AFDM m-2 vs. 234 g AFDM m-2). Although nutrient enrichment appeared to have a
significant positive influence on total FBOM standing crop (RIA, P = 0.001, Figure 4.1, Table
4.1), closer examination of the data revealed that changes in the treatment stream occurred more
than a year prior to the enrichment (Figure 4.1). Total CBOM standing crop in the mixed
substrate habitat was not affected by nutrient enrichment (RIA, P values > 0.05, Figure 4.1,
Table 4.2).
Standing crop of benthic organic matter on bedrock outcrop habitat was not influenced by
nutrient enrichment (RIA, P values > 0.05, Table 4.2). All categories of bedrock organic matter
(ie., total FBOM, total CBOM, and moss) were higher before enrichment than during enrichment
in both streams (Table 4.2).
Invertebrates
Nutrient enrichment had a significant positive effect on total invertebrate abundance and
biomass in the mixed substrate habitat (RIA, P values <0.000001, Figure 4.2). During
enrichment, abundance and biomass in the treatment stream were 104% and 71% higher than
average pretreatment values, respectively. In contrast, invertebrate abundance and biomass in
the reference stream decreased during the 2 yrs of enrichment in comparison to pretreatment
values (abundance: -42%; biomass: -15%, Figure 4.2). Total invertebrate secondary production
in the mixed substrate habitat was similar in both streams during the 3 years of pretreatment

111
(Figure 4.2). During enrichment, production in the treatment stream was ca. 117% higher than
pretreatment values and ca. 135% higher than production in the reference stream (Figure 4.2).
Total secondary production in the reference stream was slightly lower (-19%) during the
treatment in comparison to pretreatment years.
In sharp contrast to mixed substrate habitat, nutrient enrichment had no significant effect
on total invertebrate abundance and biomass on bedrock outcrops (RIA, P values > 0.05, Figure
4.2). Excepting the first year of pretreatment data, total abundance was similar between streams
before and after enrichment (Figure 4.2). Total biomass was consistently higher in the treatment
stream than in the reference stream before (25%) and during (43%) treatment, with the largest
difference (71%) occurring during the first year of enrichment (Figure 4.2). Annual secondary
production was also consistently higher in the treatment stream than in the reference stream
before (23%) and during (65%) enrichment, with the largest difference (102%) occurring during
the first year of enrichment (Figure 4.2).
Functional feeding groups
In mixed substrate habitat, abundance and biomass of all functional feeding groups
except scrapers were positively influenced by nutrient enrichment (RIA, all P values < 0.05,
Figure 4.3, Table 4.3). In the treatment stream, percent increase in abundance between pre- and
post-enrichment periods was greatest for filterers (170%), followed by shredders (143%),
gatherers (111%), and predators (79%) (Table 4.3); percent increase in biomass was greatest for
filterers (140%), and followed by gatherers (98%), predators (56%), and shredders (50%).
Annual secondary production of all functional feeding groups except scrapers increased during
the enrichment period (Table 4.5). Filterers exhibited the largest increase in production (192%),

112
followed by shredders (178%), gatherers (108%), and predators (60%). For many functional
feeding groups, concomitant decreases in abundance and biomass occurred in the reference
stream during the period of nutrient enrichment (Figure 4.3, Table 4.5).
Although invertebrates on bedrock outcrops did not respond to enrichment as a group
(Table 4.4), some functional feeding groups showed significant changes following nutrient
enrichment (Figure 4.4, Tables 4.4 and 4.5). Shredder abundance and biomass in the treatment
stream decreased on bedrock following nutrient enrichment (abundance: -51%; biomass: -60%,
Table 4.4). Although predator abundance on bedrock significantly changed following
enrichment (RIA, P = 0.004), pre- and post-treatment differences only occurred in the reference
stream (-49%, Figure 4.4). Biomass of gatherers increased (82%) in the treatment stream with
nutrient enrichment (Figure 4.4, Table 4.4). Secondary production of scrapers and gatherers in
the treatment stream increased by 74% and 51% respectively on bedrock outcrops following
enrichment (Table 4.5). Shredder production on bedrock outcrops decreased (-50%), while no
change was observed for filterers or predators (Table 4.5).
Taxon-specific responses
Twenty five out of 65 taxa (38%) in the mixed substrate habitat exhibited a significant
change in abundance, biomass, or both in the treatment stream relative to the reference stream
(Table 4.6). These taxa comprised ca. 75% of total secondary production of these streams. All
changes in the mixed substrate of the treatment stream were positive, except for the crayfish,
Cambarus bartoni; however, this result should be viewed with caution because crayfish numbers
were extremely low throughout the study (Appendix B). Individual shredder taxa that showed
increased abundance or biomass with enrichment included plecopterans (Leuctra spp.),

113
trichopterans (Lepidostoma spp., Pycnopsyche spp.), and dipterans (Molophilus sp.) (Table 4.6).
Both Lepidostoma spp. and Pycnopsyche spp. increased in biomass, but not abundance,
suggesting either increased body size of individuals or increased survivorship. Gatherer taxa that
exhibited a significant increase in abundance or biomass included ephemeropterans (Serratella
sp., Stenonema sp), plecopterans (Amphinemura sp.), dipterans (non-tanypod chironomids,
Leptotarsus sp.), Copepoda, Nematoda, and Oligochaeta (Table 4.6). Filterer taxa that increased
with enrichment included trichopterans (Diplectrona modesta), dipterans (Simuliidae), and
molluscs (Sphaeridae).
Nutrient enrichment also led to increased abundance or biomass of 9 out of 19 predator
taxa in the mixed substrate habitat (Table 4.6). These secondary consumers included odonates
(Cordulegaster sp.), plecopterans (Sweltsa sp., Beloneuria sp., Isoperla spp.), dipterans
(Ceratopogonidae, Dicranota spp., Tanypodinae, Empididae), and aquatic mites (Acari). There
was no change in abundance or biomass of larval salamanders following enrichment, although
there was evidence that individual growth rates of salamanders increased in the treatment stream
during the first year of enrichment (Johnson 2002). In the mixed substrate habitat, 22 of 25 taxa
(88%) that responded to enrichment have larval development times less than, or equal to, 1 year.
Of the 10 taxa that contributed most to total invertebrate biomass on mixed substrate
habitat, the largest response was seen for the shredder, Pycnopsyche sp. (Figure 4.5). Smaller
increases were seen among the gatherers Ceratopogonidae and Chironomidae (Figure 4.5).
On bedrock outcrops, 10 out of 35 taxa, representing ca. 30% of total bedrock production,
exhibited significant changes in abundance or biomass following nutrient enrichment (Table
4.6). Three of these taxa, of which all were shredders (Leuctra spp, Tallaperla spp, Tipula spp.),
actually declined on bedrock outcrops in the treatment stream following enrichment (Table 4.6,

114
Appendix B). Significant change in biomass of Pycnopsyche spp., was due to a decrease in the
reference stream as opposed to an increase in the treatment stream (Appendix B). In contrast, 3
gatherer taxa (Serratella sp., Amphinemura sp., Nematoda), 1 filterer (Simuliidae), and 3
predators (Pseudogoera singularis, Dicranota spp., Acari) on bedrock outcrops increased in
abundance or biomass in the treatment stream following enrichment (Table 4.6). All 7 taxa
which responded positively to nutrient enrichment on bedrock outcrops have larval development
times less than, or equal to, 1 year.
Of the 10 dominant taxa in terms of biomass on bedrock outcrops, the most notable
positive response was seen for the mayfly gatherer, Serratella sp. (Figure 4.5).
Taxon-specific percent increase in production in the treatment stream was related to
length of larval lifespan (Figure 4.6). Although there was no significant linear relationship
between these variables, the response of taxa with lifespans longer than 1 year was significantly
lower than that of taxa with lifespans less than, or equal to, 1 year (P<0.001, Wilcoxon test).
Predator-prey relationships
Annual habitat-weighted invertebrate production data from both study streams (n = 10)
were combined to examine relationships between predator and prey production. Both primary
consumer production and total invertebrate production explained a significant amount (61% and
27%, respectively, P values < 0.001) of variation in predator production (Figure 4.7). Slopes of
these relationships (0.27 and 0.37) were close to known bioenergetic efficiencies
(production/ingestion ≈ 0.35) of invertebrate predators (Slansky and Scriber 1982, Wallace et al.
1999).

115
Organic matter – secondary production relationships
In the mixed substrate habitat, relationships between annual mean organic matter
standing crop (i.e., leaf litter and total benthic organic matter) and annual secondary production
or shredder production were not significant when considering all 10 stream-years of data from
this study (r2 < 0.1, all P values > 0.05). Moreover, when values from the treatment stream
during enrichment were excluded from the analysis, relationships were still non-significant (r2 <
0.1, all P values > 0.05).
We examined these data in the context of long-term data from headwater streams at
Coweeta (n = 29 stream years). For relationships between annual mean leaf litter standing crop
and total invertebrate production or shredder production, all non-enriched years of the present
study (C53: 1998 – 2002, C54: 1998 – 2000, n = 6) were in close agreement with previous years
(Figure 4.8a and b). In sharp contrast, total secondary production during the two years of
enrichment was 100% (yr 1) and 282% (yr 2) higher than predicted production based on the
long-term relationship (Figure 4.8a). In addition, shredder production during the 2 years of
enrichment was even further from predicted values at 125% and 493% of predicted production
(Figure 4.8b). These two years of enrichment comprised the largest residuals of these
relationships, were identified as outliers, and were thus not included in regression equations
(Figure 4.8). Excluding enriched years, leaf litter standing crop explained 64% and 70% of the
variation in total and shredder secondary production, respectively (Figure 4.8a and b, P <
0.0001). Total benthic organic matter also explained a large amount (54%) of the variation in
total secondary production (Figure 4.8c, P < 0.0001). Although the two years of enrichment
were among the largest residuals, they were not identified as outliers, and were included in the
regression. However, the two years of enrichment were 90% and 118% higher than the final

116
year of pretreatment in the treated stream which had similarly high levels of total benthic organic
matter (Figure 4.8c).
Discussion
To our knowledge, this study is the first to examine the effects of long-term nutrient
enrichment on whole-community macroconsumer production in a detritus-based ecosystem. We
have shown that enrichment can lead to increased production of both primary and secondary
invertebrate consumers despite major reductions in the quantity of leaf litter, a dominant
allochthonous food resource. As predicted by theory, release of bottom-up nutrient limitation in
this donor-controlled food web led to increased biomass of consumers at both intermediate and
top trophic positions (sensu Polis and Strong 1996).
Nutrient enrichment led to significant increases in microbial biomass and production
(Gulis and Suberkropp 2003, K. Suberkropp, University of Alabama, unpublished data,
Greenwood 2004), detrital nutrient content (Cross et al. 2003, Gulis and Suberkropp 2003), and
leaf decomposition rates (Gulis and Suberkropp 2003, Greenwood 2004). For invertebrate
consumers, the positive effects of enrichment on detrital quality (i.e., increased microbial activity
and nutrient content) appeared to outweigh the negative effects of enrichment on carbon loss
(i.e., increased decomposition and respiration). Despite significant reductions in leaf litter at the
base of the food web (ca. 45% lower in the enriched stream), invertebrate production in the
dominant stream habitat was ca. 135% higher in the treatment stream than in the reference
stream. Moreover, production during the two years of enrichment were statistical outliers when
compared to long-term production data from Coweeta (Figure 4.8). For invertebrates that
consume leaf litter (i.e., shredders), these results suggest that either a) assimilation efficiencies

117
and/or survivorship were much higher on nutrient-rich leaf litter, or b) shredders switched diets
to include other high quality food items such as wood biofilm (e.g., Tank and Webster 1998,
Eggert 2003). The former explanation is the most plausible based on gut content analyses (Cross
Chapter 5) in which no major dietary changes among shredders were observed. This finding,
however, does not discount the importance of leaf litter quantity to consumer production in the
treatment stream. Even under enriched conditions, during the final 4 months of the study
shredder production appeared to be limited by low standing crop of leaf litter; six out of 8
dominant shredder taxa had lower biomass in the enriched stream than the reference stream
during these months. Therefore, despite overall elevated production of shredders during
enrichment, accelerated decomposition rates may lead to resource ‘crunches’ (sensu Wiens 1977)
during spring and summer months in which consumer production may be limited by the
availability of leaf litter.
Increased production of other detritivorous taxa, such as gatherers and filterers, was
likely due to higher nutrient content of FBOM (Cross et al. 2003) during enrichment. Although
FBOM quantity was similar among the final 3 years of the study, invertebrate production during
the 2 enriched years was ca. 100% higher than the year preceding enrichment, suggesting a
significant effect of FBOM quality. Indeed, individual growth rates of a dominant gatherer, non-
tanypod chironomids, were significantly higher in the treatment steam than the reference stream
during the enrichment (Cross Chapter 3). Other studies have also demonstrated a positive
influence of detrital nutrient content on detritivore growth or physiological condition (e.g.,
Iversen 1974, Tenore 1977, Pearson and Connolly 2000, Vos et al. 2000). FBOM-feeding taxa
are potentially less vulnerable than shredders to nutrient-induced carbon loss because FBOM is
much more abundant in Coweeta streams than leaf litter (Table 4.2). Moreover, FBOM storage

118
in stream sediments is sufficiently high that quantitative reductions of FBOM, even in the
absence of leaf litter inputs, has been shown to take many years (Wallace et al. 1999, J. B.
Wallace, unpublished).
Nutrient enrichment also had a positive effect on production of invertebrate predators,
whose trophic position is generally multiple links removed from the ultimate source of
enrichment; however, the magnitude of this effect was not as great as that observed for
detritivores. This pattern is consistent with McQueen et al.’s (1986) bottom up:top down model,
which predicts that bottom-up control should be strong at the base of the food web and weaker at
the top. Others have found support for this model in lake ecosystems (e.g., McQueen et al. 1989,
Brett and Goldman 1997). Predator production also appeared to closely track prey production
over the course of the study in both streams (Figure 4.7), and the slopes of these relationships
were similar to gross production efficiencies reported for invertebrate predators
(production/ingestion ~ 0.35, Slansky and Scriber 1982). Others have observed increased
abundance and biomass of soil invertebrate predators in response to an enhanced resource base
(Chen and Wise 1999, Scheu and Schaefer 1998). In addition, Wallace et al. (1999)
demonstrated that experimental reduction of allochthonous detritus (i.e., leaf litter) drastically
reduced production of stream invertebrate predators and growth rates of vertebrate salamanders
(Johnson 2002) in a nearby Coweeta stream. Together, these studies highlight the prevalence of
resource limitation among consumers at all trophic positions in detritus-based food webs (sensu
Polis and Strong 1996). Interestingly, the contribution of predators to total secondary production
declined during the final year of study in the treatment stream (Figure 4.7, final year was well
below predicted line). This observation suggests a potential saturation of predator functional

119
response (Holling 1959), which is supported by reduced estimates of the proportion of available
prey consumed by predators during the final year (Cross Chapter 5).
The response of invertebrates to nutrient enrichment was strongly habitat-dependent. In
contrast to mixed substrate habitat, enrichment had a relatively small effect on bedrock outcrop
invertebrate production. Moreover, abundance and biomass of few individual taxa associated
with bedrock increased during enrichment. One potential explanation for this difference between
habitats is that space, as opposed to organic matter quality or quantity, limits invertebrate
production on bedrock outcrops. Many filtering taxa such as hydropsychid caddisflies or black
flies are known to compete for space on stable substrata (e.g., Hemphill 1991, Hiltner and
Hershey 1992). Such competition may be particularly strong when drifting food abundance is
low, as in streams at Coweeta. Interestingly, Hall et al. (2000) showed that cannabalism among
filter-feeding caddisflies was common during periods of larval recruitment, and they suggested
that space-limitation may have accentuated such intraguild predation. Scrapers, which maintain
very low densities in Coweeta headwater streams, also showed no significant response to
enrichment despite increased periphyton biomass (Greenwood 2004) and nutrient content (Cross
et al. 2003). Close examination of the data revealed that mean scraper abundance and biomass
was actually higher in the treatment stream during periods of high periphyton availability (March
- May), but this effect was far too variable to be detected as significant, and a similar pattern was
seen during the first non-enriched year of the study (Table 4.5). Interestingly, 3 out of 5 shredder
taxa on bedrock outcrops actually decreased with enrichment. Generally, shredders occupying
bedrock habitat, such as Lepidostoma spp. or Tallaperla spp., are dominated by early instars.
We can only speculate that this effect was due to the increased movement of early instars away

120
from bedrock because of higher nutritional quality of organic matter in the mixed substrate
habitat.
There are multiple factors to consider in understanding mechanisms leading to increased
production of invertebrates in response to enrichment. Positive effects on production could be
driven by changes in individual growth rates, survivorship, fecundity, or a combination of these
factors (Benke 1984, 1993, Huryn and Wallace 2000). Invertebrate growth rates at Coweeta are
difficult to assess from benthic samples because a large number of taxa have overlapping
generations or asynchronous development. However, visual examination of size-frequency
histograms (data not shown), as well as positive results from field-based growth studies (Cross
Chapter 3) indicate that increased production was potentially due to both increased survivorship
and higher individual growth rates. Although fecundity was not directly quantified in this study,
larger terminal size of many taxa in the enriched stream likely led to increased egg production
per female (e.g., Vannote and Sweeney 1980). Further detailed observation of life history and
physiology of individual taxa is necessary to tease out the relative importance of different
mechanisms leading to increased production.
We found that length of larval lifespan, a dominant life history trait, was related to the
magnitude of invertebrate response to enrichment in the treatment stream. In general, there was
extreme variability among taxa with lifespans less than one year, but a consistently weak
response of longer-lived taxa (Figure 4.6). This pattern generally supports the idea that species
with rapid turnover rates are more likely to respond to enrichment because they can complete
multiple generations and increase rates of fecundity. Longer lived taxa are faced with multiple
constraints on production. For example, if many generations are necessary to elicit an increase
in production, response of some taxa may take much longer than the timeframe of this study.

121
However, species with different life history strategies may have very different elemental
composition or metabolism which can lead to very distinct nutritional requirements (e.g., Elser et
al. 1996). For example, long-lived, slow growing taxa may not be nutrient limited because of
evolutionarily-fixed slow rates of metabolism or low nutrient requirements. Interestingly, we
found no effect of enrichment on individual growth rates of a long-lived shredder, Tallaperla
spp. (Cross Chapter 3), which suggests a longer time of enrichment may have little effect on this
species. Tallaperla spp. also had a low amount of body P, suggesting relatively low
requirements for this element (e.g., Elser et al. 2000, Cross et al. 2003). For some long-lived
taxa – particularly those that consume large leaf particles – carbon availability may have primacy
in limiting secondary production. Further research dealing with life history evolution and
nutritional requirements will be fruitful for understanding mechanisms behind community
change or response to elevated nutrient concentrations.
During the two years of nutrient enrichment we saw greatly increased invertebrate
production. However, questions remain concerning the long-term sustainability of this boost in
secondary production. Multiple lines of evidence suggest that continued enrichment would lead
to decreased secondary production via carbon limitation. Benthic samples (this study), leaf litter
surveys (K. Suberkropp, University of Alabama, unpublished data), and litter bag decomposition
studies (Gulis and Suberkropp 2003, Greenwood 2004) all demonstrated elevated breakdown and
metabolism of carbon during the enrichment. Invertebrates undoubtedly contributed these losses
via increased feeding activity. In addition, biweekly samples of organic matter export (A. D.
Rosemond, unpublished data) indicated a significant increase in FBOM export from the
treatment stream during enrichment. Even though FBOM standing crop in benthic samples did
not decrease during the study, reductions may take much longer than the time span of this study.

122
This is especially true considering the large inputs of leaf litter which occur each autumn. We
expect that continued nutrient enrichment would ultimately lead to an alternate, albeit lower,
equilibrium state of total organic matter standing crop. Invertebrate production would likely
decrease to levels comparable to the reference stream considering the new combination of lower
organic matter quantity and higher organic matter quality. Interestingly, despite greater overall
production during the 2nd year of enrichment, ca. 50% of invertebrate species had lower
production during the final year of enrichment compared to the first year of enrichment. This
result coincides with lower organic matter standing crop during the second year.
In summary, our study was the first to show that nutrient enrichment can stimulate
whole-community production through detrital-microbial pathways. We demonstrated strong
bottom-up effects of nutrient enrichment in a detritus-based stream ecosystem which propagated
from microbes to top invertebrate predators. Although net carbon loss occurred in the treatment
stream (Gulis and Suberkrop 2003, Greenwood 2004, A. D. Rosemond, and K. Suberkropp,
unpublished data), total secondary production during the 2 years of enrichment was still much
higher than that predicted based on long-term relationships. However, anecdotal evidence
suggested that this loss may have lessened the effects of enrichment on some leaf-eating
consumers. In combination with other studies examining resource limitation of detritus-based
systems, our study reinforces the current view that overall productivity of both primary and
secondary consumers is resource limited in these donor-controlled food webs.
Acknowledgements
We thank the many hardworking undergraduates who removed invertebrates from
benthic samples - without which this work would not have been possible. In particular,

123
Catherine Evans, Lizzy Melda, Andrew Paloucci, and Gavin Veitch, dedicated many hours and
maintained remarkably good attitudes. In addition, Lizzy Melda provided valuable laboratory
assistance. We also thank Jennifer Greenwood, Sue Eggert, and Elizabeth Reese for comments
on an earlier version. Funding was provided by NSF (DEB – 9806610) to Amy D. Rosemond, J.
Bruce Wallace, Keller Suberkropp, and Pat J. Mulholland.
Literature Cited
Aerts, R., H. De Caluwe, and B. Beltman. 2003. Plant community mediated vs. nutritional
controls on litter decomposition rates in grasslands. Ecology 84:3198-3208.
American Public Health Association. 1998. Standard methods for the examination of water and
wastewater, 20th edition. American Public Health Association, Washington, DC, USA.
Arsuffi, T. L. and K. Suberkropp. 1985. Selective feeding by stream caddisfly (Trichoptera)
detritivores on leaves with fungal-colonized patches. Oikos 45:50-58.
Benke, A. C. 1979. A modification of the Hynes method for estimating secondary production
with particular significance for multivoltine populations. Limnology and Oceanography
24:168-171.
Benke, A. C. 1984. Secondary production of aquatic insects. In: Resh, V. H. and D. M.
Rosenberg (eds). The Ecology of Aquatic Insects. Praeger, pp. 289-322.
Benke, A. C. 1993. Concepts and patterns of invertebrate production in running waters. Verh.
Internat. Verein. Limnol. 25:1-24.
Benke A. C., A. D. Huryn, L. A. Smock and J. B. Wallace. 1999. Length-mass relationships for
freshwater macroinvertebrates in North America with particular reference to the
southeastern United States. Journal of the North American Benthological Society

124
18:308-343.
Bennett, E. M., S. R. Carpenter, and N. F. Caraco. 2001. Human impact on erodable
phosphorus and eutrophication: a global perspective. BioScience 51:227-234.
Brett, M. T. and C. R. Goldman. 1997. Consumer versus resource control in freshwater pelagic
food webs. Science 275:384-386.
Brinkhurst, R. O. and D. G. Cook, editors. 1980. Aquatic Oligochaete Biology. Plenum Press,
New York, USA.
Caraco, N. F. 1993. Disturbance of the phosphorus cycle: a case of indirect effects of human
activity. Trends in Ecology and Evolution 8:51-54.
Carpenter, S. R., S. W. Chisholm, C. J. Krebs, D. W. Schindler, and R. F. Wright. 1995.
Ecosystem experiments. Science 269:324-327.
Carpenter S. R., T. M. Frost, D. Heisey, and T. K. Kratz. 1989. Randomized intervention
analysis and the interpretation of whole-ecosystem experiments. Ecology 70:1142-1152.
Carpenter, S. R., N. F. Caraco, D. L. Correll, R. W. Howarth, A. N. Sharpley, and V. H. Smith.
1998. Nonpoint pollution of surface waters with phosphorus and nitrogen. Ecological
Applications 8:559-568.
Chen, B. and D. H. Wise. 1999. Bottom-up limitation of predaceous arthropods in a detritus-
based terrestrial food web. Ecology 80:761-772.
Cross, W. F., J. P. Benstead, A. D. Rosemond , and J. B. Wallace. 2003. Consumer-resource
stoichiometry in detritus-based streams. Ecology Letters 6:721-732.
Eggert, S. L. 2003. Resource use by detritivorous macroinvertebrates in southern Appalachian
headwater streams. Dissertation, University of Georgia, Athens, GA, USA.
Elser J. J., D. R. Dobberfuhl, N. A. MacKay and J. H. Schampel. 1996. Organism size, life

125
history, and N:P stoichiometry. BioScience 46:674-684.
Elser J. J., R. W. Sterner, E. Gorokhova, W. F. Fagan, T. A. Markow, J. B. Cotner, J. F.
Harrison, S. E. Hobbie, G. M. Odell and L. J. Weider. 2000. Biological stoichiometry
from genes to ecosystems. Ecology Letters 3:540-550.
Elwood, J. W., J. D. Newbold, A. F. Trimble, and R. W. Stark. 1981. The limiting role of
phosphorus in a woodland stream ecosystem – effects of P-enrichment on leaf
decomposition and primary producers. Ecology 62:146-158.
Fisher, S. G. and G. E. Likens. 1973. Energy flow in Bear Brook, New Hampshire: integrative
approach to stream ecosystem metabolism. Ecological Monographs 43:421-439.
Gallardo, A. and W. H. Schlesinger. 1994. Factors limiting microbial biomass in the mineral
soil and forest floor of a warm-temperate forest. Soil Biology and Biochemistry 26:1409-
1415.
Galloway, J. N., J. D. Aber, J. W. Erisman, S. P. Seitzinger, R. W. Howarth, E. B. Cowling, and
B. J. Cosby. 2003. The nitrogen cascade. BioScience 53:341-356.
Greenwood, J. 2004. The response of heterotrophic and autotrophic resources to a long-term
nutrient enrichment in an Appalachian headwater stream ecosystem. Dissertation.
University of Georgia, Athens, GA, USA.
Gulis, V. and K. Suberkropp. 2003. Leaf litter decomposition and microbial activity in nutrient-
enriched and unaltered reaches of a headwater stream. Freshwater Biology 48:123-134.
Hall, R. O. Jr., J. B. Wallace, and S. L. Eggert. 2000. Organic matter flow in stream food webs
with reduced detrital resource base. Ecology 81:3445-3463.
Hamilton, A. L. 1969. On estimating annual production. Limnology and Oceanography 14:
771-782.

126
Harvey, C. J., B. J. Peterson, W. B. Bowden, A. E. Hershey, M. C. Miller, L. A. Deegan, and J.
C. Finlay. Biological responses to fertilization of Oksrukuyik Creek, a tundra stream.
Journal of the North American Benthological Society 17:190-209.
Hemphill, N. 1991. Disturbance and variation in competition between 2 stream insects.
Ecology 72:864-872.
Hiltner, A. L. and A. E. Hershey. 1992. Black fly (Diptera, Simuliidae) response to phosphorus
enrichment of an arctic tundra stream. Hydrobiologia 240:259-265.
Holling, C. S. 1959. The components of predation as revealed by a study of small mammal
predation of the European pine sawfly. Canadian Entomologist 91: 293-320.
Howarth, R. W. and S. G. Fisher. 1976. Carbon, nitrogen, and phosphorus dynamics during leaf
decay in nutrient-enriched stream micro-ecosystems. Freshwater Biology 6:221-228.
Hurlbert, S. H. 1984. Pseudoreplication and the design of ecological field experiments.
Ecological Monographs 54:187-211.
Hurlbert, S. H. 2004. On misinterpretations of pseudoreplication and related matters: a reply to
Oksanen. Oikos 104:591-597.
Huryn, A. D. 1990. Growth and voltinism of lotic midge larvae: patterns across an Appalachian
mountain basin. Limnology and Oceanography 35:339-351.
Huryn, A. D., and J. B. Wallace. 1986. A method for obtaining in situ growth rates of larval
Chironomidae (Diptera) and its application to studies of secondary production.
Limnology and Oceanography 31:216-222.
Huryn, A. D., and J. B. Wallace. 1987a. Local geomorphology as a determinant of macrofaunal
production in a mountain stream. Ecology 68:1932-1942.
Huryn, A. D., and J. B. Wallace. 1987b. The exopterygote insect community of a mountain

127
stream in North Carolina, USA – life histories, production, and functional structure.
Aquatic Insects 9:229-251.
Huryn, A. D., and J. B. Wallace. 2000. Life history and production of stream insects. Annual
Review of Entomology 45:83-110.
Iversen, T. M. 1974. Ingestion and growth in Sericostoma personatum (Trichoptera) in relation
to the nitrogen content of ingested leaves. Oikos 25:278-282.
Joergensen, R. G. and S. Scheu. 1999. Response of soil microorganisms to the addition of
carbon, nitrogen, and phosphorus in a forest Rendzina. Soil Biology and Biochemistry
31:859-866.
Johnson , B. R. 2002. Effects of resource manipulation on selected primary and secondary
consumers in two detritus-based southern Appalachian streams. Dissertation.
University of Georgia.
Likens, G. E., F. H. Bormann, N. M. Johnson, D. W. Fisher, and R. S. Pierce. 1969. Effects of
forest cutting and herbicide treatment on nutrient budgets in the Hubbard Brook
watershed-ecosystem. Ecological Monographs 40:23-47.
Lugthart, G. J. 1991. Macrofaunal community structure and production in disturbed and
undisturbed headwater streams. Dissertation. University of Georgia, Athens, GA, USA.
Lugthart G. J. and J. B. Wallace. 1992. Effects of disturbance on benthic functional structure
and production in mountain streams. Journal of the North American Benthological
Society 11: 138-164.
McQueen, D. J., M. R. S. Johannes, J. R. Post, T. J. Stewart, and D. R. S. Lean. 1989. Bottom-
up and top-down impacts on freshwater pelagic community structure. Ecological
Monographs 59:289-309.

128
McQueen, D. J., J. R. Post, and E. L. Mills. 1986. Trophic relationships in freshwater pelagic
ecosystems. Canadian Journal of Fisheries and Aquatic Sciences 43:1571-1581.
Meyer, J. L. and C. Johnson. 1983. The influence of elevated nitrate concentration on rate of
leaf decomposition in a stream. Freshwater Biology 13: 177-183.
Minshall, G. W. 1967. Role of allochthonous detritus in trophic structure of a woodland
springbrook community. Ecology 48:139-149.
Moore, J. C., E. L. Berlow, D. C. Coleman, P. C. de Ruiter, Q. Dong, A. Hastings, N. C.
Johnson, K. S. McCann, K. Melville, P. J. Morin, K. Nadelhoffer, A. D. Rosemond, D.
M. Post, J. L. Sabo, K. M. Scow, M. J. Vanni, and D. H. Wall. In press. Detritus, trophic
dynamics and biodiversity. Ecology Letters.
Murtaugh, P. A. 2003. On rejection rates of paired intervention analysis: reply. Ecology
84:2799-2802.
O’Doherty, E. C. 1985. Stream dwelling copepods: their life history and ecological
significance. Limnology and Oceanography 30:554-564.
Odum, E. P and A. A. de la Cruz. 1963. Detritus as a major component of ecosystems. AIBS
Bulletin 13:39-40.
Oksanen, L. 2001. Logic of experiments in ecology: is pseudoreplication a pseudoissue? Oikos
94:27-38.
Pace, M. L. and E. Funke. 1991. Regulation of planktonic microbial communities by nutrients
and herbivores. Ecology 73:904-914.
Paul, M. J. and J. L. Meyer. 2001. Streams in the urban landscape. Annual Review of Ecology
and Systematics 32:333-365
Pearson, R. G. and N. M. Connolly. 2000. Nutrient enhancement, food quality and community

129
dynamics in a tropical rainforest stream. Freshwater Biology 43:31-42.
Peterson, B. J., L. Deegan, J. Helfrich, J. E. Hobbie, M. Hullar, B. Moller, T. E. Ford, A.
Hershey, A. Hiltner, G. Kipphut, M. A. Lock, D. M. Fiebig, V. McKinley, M. C. Miller,
J. R. Vestal, R. Ventullo, and G. Volk. 1993. Biological responses of a tundra river to
fertilization. Ecology 74:653-672.
Polis, G. A. and D. R. Strong. 1996. Food web complexity and community dynamics.
American Naturalist 147:813-846.
Pomeroy, L. R., J. E. Sheldon, W. M. Sheldon, Jr., and F. Peters. 1995. Limits to growth and
respiration of bacterioplankton in the Gulf of Mexico. Mar. Ecol. Prog. Ser. 117:259-
269.
Ramirez, A., C. M. Pringle, and L. Molina. 2003. Effects of stream phosphorus levels on
microbial respiration. Freshwater Biology 48:88-97.
Richardson, J. S. 1991. Seasonal food limitation of detritivores in a montane stream – an
experimental test. Ecology 72:873-887.
Rosemond, A. D., C. M. Pringle, A. Ramirez, and M. J. Paul. 2001. A test of top-down and
bottom-up control in a detritus-based food web. Ecology 82:2279-2293.
Rosemond, A. D., C. M. Pringle, A. Ramirez, M. J. Paul, and J. L. Meyer. 2002. Landscape
variation in phosphorus concentration and effects on detritus-based tropical streams.
Limnology and Oceanography 47:278-289.
Schindler, D. W. 1998. Replication versus realism: the need for ecosystem-scale experiments.
Ecosystems 1:323-334.
Schindler, D. W., E. J. Fee, and T. Rusczynski. 1978. Phosphorus input and its consequences
for phytoplankton standing crop and production in the experimental lakes area and in

130
similar lakes. Journal Fisheries Research Board of Canada 35:190-196.
Scheu, S. and M. Schaefer. 1998. Bottom-up control of the soil macrofauna community in a
beechwood on limestone: manipulation of food resources. Ecology 79:1573-1585.
Scott, M. C., G. S. Helfman, M. E. McTammany, E. F. Benfield, and P. V. Bolstad. 2002.
Multiscale influences on physical and chemical stream conditions across blue ridge
landscapes. Journal of the American Water Resources Association 38:1379-1392.
Slansky, F. and J. M. Scriber. 1982. Selected bibliography and summary of quantitative food
utilization by immature insects. Bulletin of the Entomological Society of America 28:43-
55.
Slavik, K., B. J. Peterson, L. A. Deegan, W. B. Bowden, A. E. Hershey, and J. E. Hobbie. 2004.
Long-term responses of the Kuparuk river ecosystem to phosphorus enrichment. Ecology
85:939-954.
Stelzer, R. S., J. Heffernan, and G. E. Likens. 2003. The influence of dissolved nutrients and
particulate organic matter quality on microbial respiration and biomass in a forest stream.
Freshwater Biology 48:1925-1937.
Stelzer, R. S. and G. A. Lamberti. 2001. Effects of N:P ratio and total nutrient concentration on
stream periphyton community structure, biomass, and elemental composition.
Limnology and Oceanography 46:356-367.
Stewart-Oaten, A. 2003. On rejection rates of paired intervention analysis: comment. Ecology
84:2795-2799.
Suberkropp, K. and E. Chauvet. 1995. Regulation of leaf breakdown by fungi in streams:
influences of water chemistry. Ecology 76:1433-1445.
Swank W.T and D. A. Crossley. 1988. Forest Hydrology and Ecology at Coweeta. Springer-

131
Verlag, New York, USA.
Tamm, C. O. 1991. Nitrogen in terrestrial ecosystems. Springer-Verlag. Berlin, Germany.
Tank, J. L. and J. R. Webster. 1998. Interaction of substrate and nutrient availability on wood
biofilm processes in streams. Ecology 79:2168-2179.
Tenore, K. R. 1977. Growth of Capitella capatata cultured on various levels of detritus from
different sources. Limnology and Oceangraphy 22:936-941.
Tilman, D. 1987. Secondary succession and the pattern of plant dominance along experimental
nitrogen gradients. Ecological Monographs 57:189-214.
Vannote, R. L. and B. W. Sweeney. 1980. Geographic analysis of thermal equilibria – a
conceptual model for evaluating the effect of natural and modified thermal regimes on
aquatic insect communities. American Naturalist 115:667-695.
Vitousek, P. M., J. D. Aber, R. W. Howarth, G. E. Likens, P. A. Matson, D. W. Schindler, W. H.
Schlesinger, and D. G. Tilman. 1997. Human alteration of the global nitrogen cycle:
sources and consequences. Ecological Applications 7:737-750.
Vitousek, P. M. and R. W. Howarth. Nitrogen limitation on land and in the sea – how can it
occur. Biogeochemistry 13:87-115.
Vos, J. H., M. A. G. Oojevaar, J. F. Postma, and W. Admiraal. 2000. Interaction between food
availability and food quality during growth of early instar chironomid larvae. Journal of
the North American Benthological Society 19:158-168.
Wallace J. B., T. F. Cuffney, S. L. Eggert and M. R. Whiles. 1997a. Stream organic matter
inputs, storage, and export for Satellite Branch at Coweeta Hydrologic Laboratory, North
Carolina, USA. Journal of the North American Benthological Society 16:67-74.
Wallace J. B., S. L. Eggert, J. L. Meyer and J. R. Webster. 1997b. Multiple trophic levels of a

132
forest stream linked to terrestrial litter inputs. Science 277:102-104.
Wallace J. B., S. L. Eggert, J. L. Meyer and J. R. Webster. 1999. Effects of resource limitation
on a detrital-based ecosystem. Ecological Monographs 69:409-442.
Wallace, J. B., M. R. Whiles, S. L. Eggert, T. F. Cuffney, G. J. Lugthart, and K. Chung. 1995.
Long-term dynamics of coarse particulate organic matter in three Appalachian Mountain
streams. Journal of the North American Benthological Society 14:217-232.
Ward, G. M. and K. W. Cummins. 1979. Effects of food quality on growth of a stream
detritivores: Paratendipes albimanus (Meigen) (Diptera: Chironomidae). Ecology 60:57-
64.
Waters, T. F. 1969. Subsampler for dividing large samples of stream invertebrate drift.
Limnology and Oceanography 14:813-815.
Waters, T. F. 1977. Secondary production of inland waters. Advances in Ecological Research
10:91-164.
Webster, J. R., J. L. Meyer, J. B. Wallace, and E. F. Benfield. 1997. Organic matter dynamics
in Hugh White Creek, Coweeta Hydrologic Laboratory, North Carolina, USA. Journal of
the North American Benthological Society 16:74-78.
Wetzel, R. G. 1995. Death, detritus, and energy flow in aquatic ecosystems. Freshwater
Biology 33:83-89.
Whiles, M. R. and J. B. Wallace. 1992. First-year recovery of a headwater stream following a
3-year insecticide-induced disturbance. Freshwater Biology 28:81-91.
Whiles, M. R. and J. B. Wallace. 1995. Macroinvertebrate production in a headwater stream
during recovery from anthropogenic disturbance and hydrologic extremes. Canadian
Journal of Fisheries and Aquatic Sciences 52:2402-2422.

133
Wiens, J. A. 1977. On competition and variable environments. American Scientist 65: 590-
597.

134
Table 4.1. Physical and chemical characteristics of headwater streams draining the reference(C53) and treated (C54) catchments at Coweeta Hydrologic Laboratory. Elevations weremeasured at the gauging weirs.Variable Reference (C53) Treatment (C54)
Catchment Area (ha) 5.2 5.5 Elevation (m asl) 829.0 841.0Channel Gradient (cm m-1) 27.0 33.0 Length (m) 145.0 282.0 Bankfull Area (m2) 327.0 443.0Discharge (l s-1) Average* 1.2 1.5 Maximum* 47.2 35.5 Average this study¶ 0.3 0.5 Maximum this study¶ 3.8 4.8Substrate composition (%) Mixed substrates 73.0 65.0 Bedrock outcrop 27.0 35.0Temperature (°C) ¶
Annual average 12.0 12.0 Minimum 2.6 4.8 Maximum 18.6 16.7Water chemistry (range) pH 6.6 (6.2-7) 6.9 (6.6-7.9) (NO3-N + NO2)-N (µg l -1) pretreatment: 1999 – 2000 15.4 (9.4-25.8) 18.8 (4-39.5) enrichment: 2000 – 2002 16.9 (bd-151) 308.9 (11-1711) NH4-N (µg l-1) pretreatment: 1999 – 2000 9.4 (bd-30) 9.9 (bd-25) enrichment: 2000 – 2002 10.4 (bd-76) 105.5 (6-566) SRP‡ (µg l-1) pretreatment: 1999 – 2000 7.6 (bd-20) 8.8 (bd-22) enrichment: 2000 – 2002 3.7 (bd-17) 51.2 (bd-268)*C53 values from 12 years (1984-1996), C54 values from 8 years (1985-1992).‡Soluble reactive phosphorus. ¶September 1998 – August 2002. bd = below detection limit. Fornutrient data: reference stream - pretreatment n = 5, treated stream - pretreatment n = 12,reference stream - enrichment n = 33, treated stream - enrichment n = 44.

135
Table 4.2. Organic matter standing crops (g AFDM m-2) for mixed substrate and bedrock outcrop habitats before†, and after‡, theinitiation of nutrient enrichment in the reference stream (C53) and the treatment stream (C54).
Habitat reference, before reference, after treatment, before treatment, after RIA probability n
Mixed substrates Total FBOM 900.0 784.7 1327.4 2023.0 (+) 0.001 60 Total CBOM 1157.0 1236.6 1060.7 1330.0 0.213 60 Leaf detritus 204.2 244.7 244.3 168.5 (-) 0.002 60
Bedrock Outcrop Total FBOM 28.0 20.1 45.8 28.7 0.336 60 Total CBOM 51.6 30.6 45.2 17.6 0.346 60 Moss 9.1 3.5 15.2 4.5 0.157 60
†‘before’ data include October 1984 – September 1985 (Lugthart and Wallace 1992) and September 1998 – June 2000 (this study);‡’after’ initiation of enrichment includes data from July 2000 – August 2002. Total FBOM = all benthic organic matter <1 mm, TotalCBOM = all benthic organic matter >1 mm. n = total number of months included in RIA. Bold values indicate significant RIAs. (+)and (-) indicate the direction of effect due to enrichment.

136
Table 4.3. Average abundance and biomass of invertebrate functional feeding groups in mixed substrate habitat of the referencestream (C53) and treatment stream (C43) before (October 1984 – September 1985 & September 1998 – June 2000) and after (July2000 – August 2002) the initiation of nutrient enrichment.Functional group reference, before reference, after enriched, before enriched, after RIA probability†
Abundance (no. m-2) Scrapers 45 33 16 17 0.668 Shredders 3365 3311 1843 4476 (+) <0.000001 Gatherers 115304 69684 64931 137039 (+) <0.000001 Filterers 690 527 306 825 (+) 0.016 Total primary consumers 119350 73514 67069 142284 (+) <0.000001 Predators 16840 9492 7556 13525 (+) <0.000001
Biomass (mg AFDM m-2) Scrapers 7 4 14 1 0.477 Shredders 1203 916 1090 1635 (+) 0.006 Gatherers 457 338 357 706 (+) <0.000001 Filterers 46 29 47 113 (+) <0.000001 Total primary consumers 1707 1286 1501 2443 (+) <0.000001 Predators 1022 739 920 1433 (+) <0.000001
†Randomized intervention analysis (RIA) tests the null hypothesis of no change in benthic abundance and biomass for each functionalfeeding group between the reference and enriched stream. Bold values indicate significant RIAs. Total primary consumer numbersare slighty less than the sum of all primary consumer groups because a fraction of Parapsyche cardis and Diplectrona spp.(omnivorous filtering caddisflies) was placed into the predator category. (+) and (-) indicate the direction of effect due to enrichment.n = 60 for all RIAs.

137
Table 4.4. Average abundance and biomass of invertebrate functional feeding groups in bedrock outcrop habitat of the referencestream (C53) and treatment stream (C43) before (October 1984 – September 1985 and September 1998 – June 2000) and after (July2000 – August 2002) the initiation of nutrient enrichment.Functional group reference, before reference, after treatment, before treatment, after RIA probability†
Abundance (no. m-2) Scrapers 175 233 200 262 0.273 Shredders 556 827 695 338 (-) <0.000001 Gatherers 18035 12941 16716 15960 0.126 Filterers 889 1057 693 816 0.623 Total primary consumers 19484 14839 18151 17211 0.232 Predators 3820 1952 2120 1863 (+) 0.004
Biomass (mg AFDM m-2) Scrapers 22 35 74 60 0.393 Shredders 135 145 113 45 (-) <0.000001 Gatherers 125 74 126 229 (+) 0.003 Filterers 151 128 190 167 0.459 Total primary consumers 399 347 454 456 0.954 Predators 128 87 154 129 0.287
†Randomized intervention analysis (RIA) tests the null hypothesis of no change in benthic abundance and biomass for each functionalfeeding group between the reference and enriched stream. Bold values indicate significant RIAs (P < 0.05). (+) and (-) indicate thedirection of effect due to enrichment. Total primary consumer numbers are slighty less than the sum of all primary consumer groupsbecause a fraction of Parapsyche cardis and Diplectrona spp. (omnivorous filtering caddisflies) was placed into the predator category.(+) and (-) indicate the direction of effect due to enrichment. n = 60 for all RIAs.

138
Table 4.5. Annual invertebrate secondary production (mg AFDM m-2 y-1) in the reference stream (C53) and treatment stream (C54) byfunctional feeding group in mixed substrate and bedrock outcrop habitats. RIA was not possible on these annual data because oflimited data points before (n=3) and after (n=2) treatment.Functional group Stream Pre – 1† Pre – 2 Pre – 3 Enr – 1 Enr – 2Mixed substrates Scrapers reference 67 25 19 6 16
treatment 162 2 9 24 1 Shredders reference 4017 3198 3434 3327 4768
treatment 4953 2636 3531 7802 12805 Gatherers reference 7123 3572 3389 2248 2442
treatment 4755 1695 3077 6775 6451 Filterers reference 526 114 289 177 279
treatment 113 170 420 666 706 Predators reference 4655 2468 3635 3745 2839
treatment 4318 1732 4598 6036 5297
Bedrock outcrops Scrapers reference 44 50 175 131 131
treatment 207 52 96 222 190 Shredders reference 1137 407 376 438 1024
treatment 916 395 395 163 410 Gatherers reference 2390 704 629 743 1227
treatment 2091 863 1698 2813 1879 Filterers reference 658 960 1459 842 871
treatment 1820 1207 972 968 1626 Predators reference 741 257 203 184 386
treatment 705 385 567 559 581†Pre – 1, 2, and 3 = pretreatment October 1984 – September 1985, September 1998 – August 1999, and September 1999 – August2000, respectively. Enr – 1 and 2 = nutrient enrichment September 2000 – August 2001, and September 2001 – August 2002. Datafor 1984 – 1985 are from Lugthart and Wallace (1992); Stenonema sp. was moved from scrapers and placed in gatherers for 1984 –1985.

139
Table 4.6. Results of randomized intervention analyses (RIA) for abundance and biomass of individual taxa in mixed substrate andbedrock outcrop habitats. RIA tests the null hypothesis of no change in abundance or biomass between the reference stream andtreatment stream. Data (n = 60) include 34 months of pretreatment data (October 1984 – September 1985, September 1998 – June2000) and 26 months of post-enrichment data (July 2000 – August 2002).
Mixed Substrate Bedrock Outcrops
Functional group and taxon OrderP value,
abundanceP value,biomass
P value,abundance
P value,biomass
Scrapers Epeorus sp. E -- -- 0.896 0.760 Baetis sp. E -- -- 0.467 0.389 Hydroptila sp. T -- -- 0.928 0.963 Neophylax sp. T -- -- 0.053 0.127 Ectopria sp. C 0.256 0.378 0.651 0.154 Elmidae C -- -- -- --
Shredders Leuctra spp. P (+) <0.000001 (+) 0.003 (-) 0.006 (-) 0.005 Tallaperla spp. P 0.634 0.249 (-) <0.000001 (-) <0.000001 Lepidostoma spp. T 0.931 (+) 0.009 0.057 0.393 Pycnopsyche spp. T 0.214 (+) 0.006 0.995 (+) 0.026 Fattigia pele T 0.250 0.305 -- -- Psilotreta sp. T 0.237 0.348 -- -- Molophilus sp. D (+) 0.029 (+) 0.004 -- -- Tipula sp. D 0.334 0.657 (-) 0.002 (-) 0.002 Lipsothrix sp. D 0.334 0.293 -- -- Limonia sp. D 0.507 0.345 -- -- Anchytarsus sp. C 0.600 0.531 -- -- Cambarus bartoni NI (-) 0.010 0.060 -- --
Collector-gatherers Paraleptophlebia sp. E 0.095 0.059 0.496 0.291 Serratella sp. E 0.345 (+) 0.008 (+) 0.028 (+) 0.007

140
Table 4.7. (cont.)Mixed Substrate Bedrock Outcrops
Functional group and taxon Order P, abundance P, biomass P, abundance P, biomass Collector-gatherers (cont.) Stenonema sp. E (+) 0.004 (+) <0.000001 -- -- Amphinemura sp. P 0.101 (+) 0.001 0.188 (+) 0.014 Soyedina sp. P 0.845 0.542 -- -- Lype diversa T 0.731 0.192 -- -- Chironomidae (non-Tanypodinae) D (+) <0.000001 (+) <0.000001 0.274 0.945 Leptotarus sp. D (+) <0.000001 (+) 0.011 -- -- Nymphomyiidae D -- -- 0.510 0.287 Ormosia sp. D 0.139 0.117 -- -- Sciaridae D 0.806 0.394 -- -- Copepoda NI (+) <0.000001 (+) <0.000001 0.087 0.201 Nematoda NI (+) <0.000001 (+) <0.000001 (+) 0.005 (+) 0.004 Oligochaeta NI (+) <0.000001 (+) 0.040 0.717 0.909
Collector-filterers Diplectrona modesta T 0.469 (+) 0.001 0.363 0.837 Diplectrona metaqui T -- -- -- -- Parapsyche cardis T -- -- 0.952 0.764 Wormaldia spp. (summer cohort) T 0.913 0.978 0.947 0.758 Wormaldia spp. (winter cohort) T 0.816 0.060 0.424 0.452 Dolophilodes distinctus T -- -- -- -- Simuliidae D 0.234 (+) 0.024 0.249 (+) 0.002 Dixa sp. D 0.631 0.765 0.310 0.564 Sphaeridae NI (+) <0.000001 (+) <0.000001 -- --
Predators Cordulegaster sp. O (+) 0.037 (+) 0.002 -- -- Lanthus sp. O 0.062 0.076 -- -- Sweltsa sp. P 0.089 (+) 0.027 -- -- Beloneuria sp. P 0.500 (+) 0.036 0.618 0.968

141
Table 4.7. (cont.)Mixed Substrate Bedrock Outcrops
Functional group and taxon Order P, abundance P, biomass P, abundance P, biomass Predators (cont.) Isoperla spp. P (+) <0.000001 (+) 0.001 0.164 0.125 Malerikus hastatus P -- -- -- -- Rhyacophila spp. T 0.097 0.228 0.915 0.222 Pseudogoera singularis T 0.962 0.100 (+) 0.050 (+) 0.003 Ceratopogonidae D (+) <0.000001 (+) 0.001 0.317 0.740 Hexatoma spp. D 0.782 0.429 0.054 0.179 nr. Pedicia sp. D 0.190 0.519 -- -- Pedicia sp. D 0.100 0.095 -- -- Dicranota spp. D (+) 0.029 (+) <0.000001 (+) 0.004 (+) <0.000001 Glutops sp. D 0.143 0.177 -- -- Tanypodinae D (+) <0.000001 (+) <0.000001 0.711 0.431 Empididae D 0.186 (+) 0.011 0.658 0.495 Pilaria sp. D -- -- -- -- Pseudolimnolphila sp. D 0.971 0.131 -- -- Rhabdomastix sp. D -- -- -- -- Dolichopodidae D 0.494 0.023 -- -- Turbellaria NI 0.606 0.912 0.110 0.226 Acari NI (+) 0.003 (+) <0.000001 (+) 0.001 (+) 0.004
Vertebrate predators Eurycea sp. NI 0.353 0.353 -- -- Desmognathus spp. NI 0.565 0.390 -- -- Total salamanders 0.195 0.136 -- --
Notes: All analyses were conducted on log (x+1) transformed data based on monthly means for mixed substrate and bedrock outcrophabitats (n = 60 for each habitat). Insect orders are as follows: E = Ephemeroptera, P = Plecoptera, T = Trichoptera, C = Coleoptera,O = Odonata, and NI = non-insect. Bold values indicate significant RIAs (i.e., P < 0.05). (+) and (-) indicate the direction of effectdue to enrichment. -- indicates too few data points for RIA analysis.

142
Figure 4.1. Long-term time series of log (x+1) leaf litter, FBOM, and CBOM standing crop (g
AFDM m-2) in the reference stream (C53, white circles) and treatment stream (C54, black
circles). The vertical dashed line refers to the initiation of nutrient enrichment in the treatment
stream. Elapsed days –365 through 0 are between October 1984 and September 1985; days 0
through 1460 are between September 1998 and August 2002. P values are from randomized
intervention analysis (RIA) on differences between streams before and after the manipulation.
NS = non-significant (P > 0.05).

143
2.0
2.5
3.0
3.5
4.0
log
(x+
1) (
g A
FD
M m
-2)
-365 0 365 730 1095 1460
0.0
0.5
1.0
1.5
2.0
2.5
3.0
3.5
4.0
log
(x+
1) (
g A
FD
M m
-2)
-365 0 365 730 1095 1460
leaf 54 longleaf 53 long
2.0
2.5
3.0
3.5
4.0
log
(x+
1) (
g A
FD
M m
-2)
-365 0 365 730 1095 1460
NS
P = 0.001
P = 0.002
Elapsed days
Leaf litter
FBOM
CBOM
referencetreatment

144
Figure 4.2. Annual mean abundance, biomass, and annual secondary production during the five
years of study in the reference stream (white bars) and treatment stream (grey bars) in mixed
substrate and bedrock outcrop habitats. The arrow refers to the initiation of nutrient enrichment
in the treatment stream. Pre-1, 2, and 3 = October 1984 – September 1985, September 1998 –
August 1999, and September 1999 – August 2000, respectively. Enr-1 and 2 = September 2000
– August 2001 and September 2001 – August 2002. Error bars for abundance and biomass are
±1 SE (n = 12). P values are from randomized intervention analysis (RIA) on differences
between streams before and after the manipulation. NS = non-significant (P > 0.05). RIA was
not possible on annual production data because of limited data points before (n = 3) and during
(n = 2) enrichment.

145
0
50000
100000
150000
200000
250000
300000
ab
un
da
nc
e (
no
. m
- 2)
54 BC ABUND
53 BC ABUNDreference
treatment
P < 0.000001
0
1000
2000
3000
4000
5000
6000
bio
mas
s (m
g m
-2) P < 0.000001
0
5000
10000
15000
20000
25000
30000
pro
du
ctio
n (
mg
m-2
y-1
)
Pre 1 Pre 2 Pre 3 Enr 1 Enr 20
1000
2000
3000
4000
5000
6000
pro
du
ctio
n (
mg
m-2
y-1
)
Pre 1 Pre 2 Pre 3 Enr 1 Enr 2
0
10000
20000
30000
40000
50000
60000
ab
un
da
nc
e (
no
./m
2)
54 RF ABUND
53 RF ABUNDreference
treatment
NS
0
250
500
750
1000
1250
bio
mas
s (m
g/m
2) NS
Mixed Substrates Bedrock Outcrops

146
Figure 4.3. Time series of log (x+1) abundance and biomass of (a) primary consumers, (b)
predators, (c) shredders, (d) gatherers, (e) filterers, and (f) scrapers in the mixed substrate habitat
in the reference stream (C53, white circles) and treatment stream (C54, black circles). The
vertical dashed line refers to the initiation of nutrient enrichment in the treatment stream.
Horizontal dashed lines represent mean values in the reference stream before and during
enrichment. Horizontal solid lines represent mean values in the treatment stream before and
during treatment. Elapsed days –365 through 0 are between October 1984 and September 1985;
days 0 through 1460 are between September 1998 and August 2002. P values are from
randomized intervention analysis (RIA) on differences between streams before and after the
manipulation. NS = non-significant (P > 0.05).
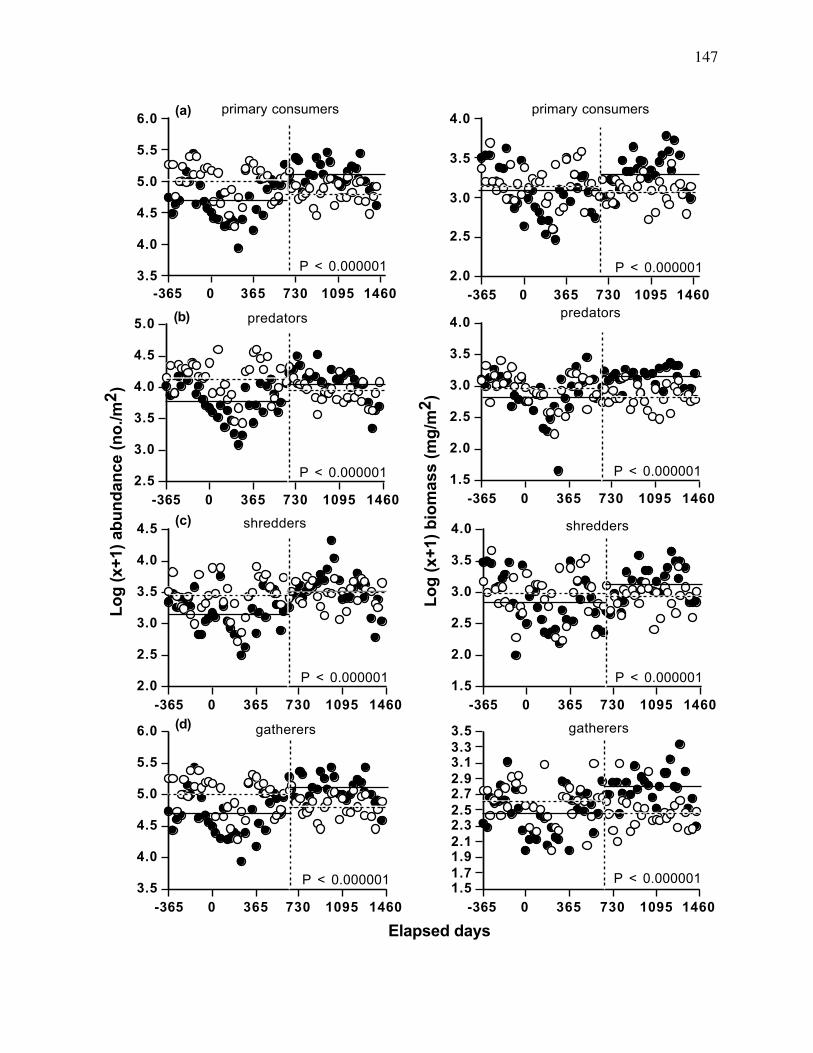
147
2.0
2.5
3.0
3.5
4.0
-365 0 365 730 1095 14603.5
4.0
4.5
5.0
5.5
6.0
-365 0 365 730 1095 1460
primary consumers primary consumers
2.5
3.0
3.5
4.0
4.5
5.0
-365 0 365 730 1095 1460
predators
1.5
2.0
2.5
3.0
3.5
4.0
-365 0 365 730 1095 1460
predators
2.0
2.5
3.0
3.5
4.0
4.5
-365 0 365 730 1095 1460
shredders
1.5
2.0
2.5
3.0
3.5
4.0
-365 0 365 730 1095 1460
shredders
3.5
4.0
4.5
5.0
5.5
6.0
-365 0 365 730 1095 1460
gatherers
1.51.71.92.12.32.52.72.93.13.33.5
-365 0 365 730 1095 1460
gatherers
Lo
g (
x+1)
ab
un
dan
ce (
no
./m2
)
Lo
g (
x+1)
bio
mas
s (m
g/m
2)
Elapsed days
P < 0.000001 P < 0.000001
P < 0.000001 P < 0.000001
P < 0.000001 P < 0.000001
P < 0.000001 P < 0.000001
(a)
(b)
(c)
(d)

148
0.0
1.0
2.0
3.0
4.0
-365 0 365 730 1095 1460
filterers
0.0
1.0
2.0
3.0
-365 0 365 730 1095 1460
filterers
0.0
1.0
2.0
3.0
4.0
-365 0 365 730 1095 1460
scrapers
0.0
0.5
1.0
1.5
2.0
-365 0 365 730 1095 1460
scrapers
Lo
g (
x+1)
ab
un
dan
ce (
no
./m2
)
Lo
g (
x+1)
bio
mas
s (m
g/m
2)
P < 0.000001P = 0.016
NSNS
(e)
(f)
figure 3 (cont.)
Elapsed days

149
Figure 4.4. Time series of log (x+1) abundance and biomass of (a) primary consumers, (b)
predators, (c) shredders, (d) gatherers, (e) filterers, and (f) scrapers in the bedrock outcrop habitat
in the reference stream (C53, white circles) and treatment stream (C54, black circles). The
vertical dashed line refers to the initiation of nutrient enrichment in the treatment stream.
Horizontal dashed lines represent mean values in the reference stream before and during
enrichment. Horizontal solid lines represent mean values in the treatment stream before and
during treatment. Elapsed days –365 through 0 are between October 1984 and September 1985;
days 0 through 1460 are between September 1998 and August 2002. P values are from
randomized intervention analysis (RIA) on differences between streams before and after the
manipulation. NS = non-significant (P > 0.05).

150
3.0
3.5
4.0
4.5
5.0
-365 0 365 730 1095 1460
primary consumers
1.5
2.0
2.5
3.0
3.5
-365 0 365 730 1095 1460
primary consumers
0.0
1.0
2.0
3.0
4.0
-365 0 365 730 1095 1460
shredders
0.0
1.0
2.0
3.0
4.0
-365 0 365 730 1095 1460
shredders
2.0
2.5
3.0
3.5
4.0
4.5
-365 0 365 730 1095 1460
predators predators
0.5
1.0
1.5
2.0
2.5
3.0
3.5
-365 0 365 730 1095 1460
3.0
3.5
4.0
4.5
5.0
5.5
-365 0 365 730 1095 1460
gatherers gatherers
0.5
1.0
1.5
2.0
2.5
3.0
3.5
-365 0 365 730 1095 1460
Elapsed days
Lo
g (
x+1)
ab
un
dan
ce (
no
./m2
)
Lo
g (
x+1)
bio
mas
s (m
g/m
2)
P < 0.000001 P < 0.000001
P = 0.004
P = 0.003NS
NS
NS NS(a)
(b)
(c)
(d)

151
1.0
2.0
3.0
4.0
5.0
-365 0 365 730 1095 1460
filterers
0.0
1.0
2.0
3.0
4.0
-365 0 365 730 1095 1460
filterers
0.0
1.0
2.0
3.0
4.0
-365 0 365 730 1095 1460
scrapers
0.0
1.0
2.0
3.0
4.0
-365 0 365 730 1095 1460
scrapers
Lo
g (
x+1)
ab
un
dan
ce (
no
./m2
)
Lo
g (
x+1)
bio
mas
s (m
g/m
2)
NS
NS NS
NS(e)
(f)
figure 4 (cont.)
Elapsed days

152
Figure 4.5. Average biomass (mg AFDM m-2 y-1) of the 10 dominant taxa in mixed substrate
and bedrock outcrop habitats in the reference and treatment stream before (both streams
averaged) and during enrichment of the treatment stream (reference and treatment shown
separately). Taxa in the legend are grouped by functional feeding group; in the mixed substrate
habitat, the top 4 taxa are predators, the middle 3 taxa are shredders, and the bottom 2 taxa are
gatherers. For bedrock outcrops, Parapsyche is a filterer, Tallaperla is a shredder, and the
bottom 3 taxa are gatherers.

0
500
1000
1500
2000
2500b
iom
ass
(mg
AF
DM
m-2
) Lanthus
Ceratopogonidae
Cordulegaster
Hexatoma
Pycnopsyche
Fattigia
Tallaperla
Chironomidae
Oligochaeate
0
100
200
300
400
500
bio
mas
s (m
g A
FD
M m
-2)
Parapsyche
Tallaperla
Chironomidae
Serratella
Amphinemura
Mixed Substrate
Bedrock Outcrops
both streamspretreatment
referenceduring
enrichment
treatmentduring
enrichment
both streamspretreatment
referenceduring
enrichment
treatmentduring
enrichment
153

154
Figure 4.6. Relationship between length of larval lifespan (days) and % increase in taxon-
specific production in the treatment stream.

155
length of larval lifespan (d)0 200 400 600 800 1000 1200
% in
crea
sed
prod
uctio
n in
trea
tmen
t str
eam
0
200
400
600
800
10002500

156
Figure 4.7. Relationships between habitat-weighted primary consumer (grey circles) or total
(white circles) secondary production (g AFDM m-2 y-1) and predator production. These
relationships include data from the reference stream and treatment stream during the 4 years of
this study and 1 previous year (Lugthart and Wallace 1992) (total n = 10). Both linear
regressions are statistically significant (P < 0.001). Equations for lines are reported on figure.

157
0
2
4
6
Pre
dat
or
seco
nd
ary
pro
du
ctio
n
(g A
FD
M m
-2 y
-1)
0 5 10 15 20
Primary consumer or total secondary production (g AFDM m-2 y-1)
data for prim line
data for total line
Pred prod HWPred prod HW
y = 0.272x
r2 = 0.61
y = 0.367x
r2 = 0.27
total vs. predator productionprimary consumer vs. predator production

158
Figure 4.8. Long-term relationships between leaf litter standing crop (g AFDM m-2) and (a) total
secondary production (g AFDM m-2 y-1) and (b) shredder secondary production (g AFDM m-2 y-1)
in the mixed substrate habitat. (c) Long term relationship between total benthic organic matter
and total secondary production (g AFDM m-2 y-1). Data include 29 years of production estimates
from headwater streams at Coweeta, C53, C54, and C55 (Lughtart and Wallace 1992, Whiles
and Wallace 1992, 1995, Wallace et al. 1999). The smallest 7 values are from a previous whole-
stream experimental reduction of leaf litter in C55 (Wallace et al. 1999, J. B. Wallace and S. L.
Eggert, unpublished data). White circles represent previous data from Coweeta, grey circles
represent non-enriched years of this study, and black circles represent two years of experimental
nutrient enrichment. The black circles are, from right to left, year 1 of enrichment and year 2 of
enrichment.

159
0
5
10
15
20
25
30
tota
l se
con
dar
y p
rod
uct
ion
(g
AF
DM
m-2
y-1
)
0 100 200 300
mean benthic leaf litter (g AFDM/m2)
y = 0.034x + 3.07
r2 = 0.64
previous years (n = 21)
this study non-enriched (n = 6)
this study enriched (n = 2)
0
5
10
15
20
25
30
tota
l se
con
dar
y p
rod
uct
ion
(g
AF
DM
m-2
y-1
)
0 1000 2000 3000 4000
mean total benthic organic matter (g AFDM/m2)
y = 0.0047x + 0.192
r2 = 0.54
0
2
4
6
8
10
12
14
shre
dd
er p
rod
uct
ion
(g
AF
DM
m-2
y-1
)
0 100 200 300
mean benthic leaf litter (g AFDM/m2)
y = 0.012x + 0.883
r2 = 0.70
A
B
C

160
CHAPTER 5
NUTRIENT EFFECTS ON FOOD WEB DYNAMICS OF A DETRITUS-BASED STREAM1
________________________1Cross, W. F., J. B. Wallace, A. D. Rosemond, and K. Suberkropp. To be submitted toOecologia.

161
Abstract
Quantifying flows of organic matter and materials through food webs is critical for
understanding the role of consumers in ecosystems, identifying functionally-key consumer taxa,
and for assessing the influence of perturbations, such as nutrient enrichment, on food web
dynamics. In detritus-based ecosystems, accurate estimates of organic matter flows require
consideration of both detrital and microbial resources; this is especially true in comparative
studies where among-system resource quality differs. We estimated the trophic basis of
production and constructed explicit flow food webs for consumers (i.e., invertebrates and
salamanders) in 2 detritus-based headwater streams. Flow webs were quantified before, and for
2 years during, an experimental whole-stream nutrient enrichment of 1 stream. Throughout the
study, consumption by primary consumers was dominated by leaf litter (~50%) and amorphous
detritus (~42%), but varied considerably among functional feeding groups. Secondary
production of primary consumers was predominantly supported by amorphous detritus (45%),
leaf litter (28%), and fungi (19%). Nutrient enrichment had little influence on the diets of
consumers, yet total organic matter flows to consumers increased substantially (up to ~290%)
during enrichment. Predators consumed a large proportion of prey production (~80%) under
non-enriched conditions, but this proportion was reduced considerably (~40% – 50%) during
enrichment. Invertebrate consumption of annual detrital and fungal inputs was relatively low,
suggesting a potentially important top-down role of invertebrate predators in these streams. Our
results suggest that nutrient enrichment had a large effect on the quality and assimilability of
detrital resources, permitting increased flows of organic matter despite minimal changes in
consumer dietary composition.

162
Introduction
A major goal of food web ecology is description and quantification of feeding
relationships among consumers and resources (e.g., Pimm 1982, Cohen et al. 1993, Polis and
Winemiller 1996). Although a variety of methodological approaches have been used to elucidate
these relationships, consensus on the most informative approach is elusive, highly debated, and
necessarily context-dependent (e.g., Paine 1988, Polis 1991, 1994). Typically, food webs have
been described by assessing the presence or absence of feeding links and reporting various
characteristics based on these links, such as connectivity, predator-prey ratios, or food chain
length (e.g., Cohen et al. 1990, Martinez 1991, Pimm et al. 1991, Thompson and Townsend
1999). While these descriptive methods are informative for understanding food web structure or
theoretical stability, they generally lack any quantitative analysis of material flows between
consumers and resources or any attempt at understanding the importance of individual feeding
links (but see Baird and Ulanowicz 1989). A significant development in this regard has been the
use of experimental consumer manipulations to assess per capita interaction strengths (e.g., Paine
1992, Wooton 1994). However, this method is logistically problematic because of the
difficulties associated with manipulating all major consumers in the food web or those that are
physically too small to manipulate (but see Wootton 1997 and Hall et al. 2000 for an alternative
method).
In the past few decades, it has become increasingly apparent that a thorough
understanding of food web dynamics requires actual quantification of energy or material flows
between consumers and resources (e.g., Polis 1994). One successful method developed for
quantifying such flows is the trophic basis of production (Benke and Wallace 1980, 1997).
Traditionally, this quantitative approach requires knowledge of consumer secondary production,

163
diet, and assimilation efficiencies for major food types (e.g., leaves, wood, diatoms, animal, etc.).
More recently, stable isotope analysis has been used in combination with secondary production
estimates to quantify organic matter flows and trophic support of consumers (Hall et al. 2000,
Lewis et al. 2001, McCutchan and Lewis 2002). The trophic basis of production method enables
an estimation of a) how much of a consumer’s production can be attributed to various food
resources, and b) how much of each food type is consumed over the duration of the study (i.e.,
energetic or material flows). Results from recent studies indicate that this technique can shed
considerable light on the magnitude and importance of food web linkages (Benke and Wallace
1997, Rosi-Marshall and Wallace 2002), as well as the response of food web dynamics to
perturbations such as heavy metal contamination (Carlisle and Clements 2003), nutrient pollution
(Shieh et al. 2002), or resource base reduction (Hall et al. 2000, Eggert 2003).
One limitation of the trophic basis of production method has been the reliance of flow
estimates on a single literature-based assimilation efficiency for each food category (e.g., Benke
and Wallace 1997). For example, leaf litter and animal prey have generally been assigned
assimilation efficiency values of 0.1 and 0.8, respectively, based on few actual measurements
(but see Eggert 2003). While these estimates are valuable for incorporating inherent food quality
differences among major food categories, they are limited in that they do no account for subtle
differences in nutritional quality within a given food type. For example, the quality of leaf litter
for a consumer may vary depending on the amount of nutrient-rich microbial biomass associated
with leaf litter (e.g., Arsuffi and Suberkropp 1984, 1985), leaf nutrient content (e.g., Iversen
1974), or leaf condition (e.g., Hutchens et al. 1997); generally, assimilation efficiency is assumed
to be equivalent for all leaves. Such limitations make comparisons of trophic basis of production

164
among systems difficult, especially when differences are manifested in the quality of food types
as opposed to their quantity.
In detritus-based stream food webs, the dominant basal resource for invertebrate
detritivores is a complex of detritus and associated heterotrophic microbes (i.e., bacteria and
fungi) (e.g., Wallace et al. 1999, Hall et al. 2000, 2001). Many invertebrates indiscriminately
ingest this resource, and assimilate carbon from both detrital and microbial sources (e.g., Findlay
et al. 1984, 1986a, b). However, quantifying the flows of these separate resources to consumers,
and the fraction of invertebrate production derived from each resource, is somewhat problematic.
Traditional gut content analysis does not accurately assess the contribution of bacteria, fungi, or
microbial exopolymers because these components are difficult to see under typical magnification
(e.g., 400X), and the bulk of these microbes are bound to, or concealed within, detrital particles
(i.e., leaves, amorphous detritus). Although some researchers have successfully used stable
isotope tracer additions to assess the contribution of bacteria (Hall and Meyer 1998) or total
microbes (e.g., Mulholland et al. 2000) to invertebrate production, realistic estimates of fungal
contribution have not been achieved (but see Findlay et al. 1986a, b). Because leaf and wood-
associated fungi comprise a significant proportion of the microbial biomass in detritus-based
headwater streams (e.g., Findlay et al. 2002), their importance in supporting invertebrate
production has likely been underestimated.
In this study we had two main objectives. The first was to explicitly estimate flows of
detrital, microbial, and animal food resources to invertebrate consumers in 2 detritus-based
headwater stream ecosystems. We aimed to overcome limitations of the trophic basis of
production method by combining traditional gut content analyses with empirical measurements
(and estimates) of detritus-associated microbial biomass. Our second objective was to assess the

165
effects of experimental nutrient enrichment on trophic basis of production and organic matter
flows to stream consumers. We compared food web flows in an un-manipulated reference
stream and an adjacent treatment stream that was experimentally enriched with nitrogen (N) and
phosphorus (P) for 2 years.
Study sites
This study was conducted in two adjacent headwater streams at the Coweeta Hydrologic
Laboratory, Macon County, North Carolina, USA. Coweeta is a large (2185-ha) heavily forested
basin located in the Blue Ridge physiographic province of the southern Appalachian Mountains
(see Swank and Crossley 1988). Forest vegetation is dominated by mixed hardwoods (primarily
oak, maple, and poplar) and a dense understory of Rhododendron maximum which shades the
streams throughout the year. Headwater streams at Coweeta are extremely heterotrophic, and
allochthonous inputs of detritus provide >90% of the energy base for microbial and invertebrate
production (Wallace et al. 1997b, Hall et al. 2000). In-stream primary production is low (ca. 4 –
8 g C m-2 y-1) and constitutes < 1% of the total carbon entering these streams (Wallace et al.
1997a).
The two streams used for this study drain catchments (C) 53 and 54. These streams have
very similar physical and chemical characteristics (Table 5.1), but differ (since July 2000) in
their concentrations of dissolved N and P as a result of our experimental nutrient enrichment of
C54 (Table 5.1).
Starting in July 2000, nitrogen (NH4NO3) and phosphorus (K2HPO4 and KH2PO4) were
dripped continuously into C54 to increase concentrations of dissolved inorganic N and P to ≈ 6-
15 X background levels (Table 5.1). Nutrient solution was added along 140 m of C54 with a

166
solar powered metered-dose pump (LMI, Acton, Massachusetts, USA) connected to a
streamwater-fed plastic pipe laid along the streambed. The plastic pipe was fitted with garden
irrigation valves every 10 m to evenly distribute nutrients along the length of the stream. Stream
water nutrient concentrations were held relatively constant across a range of discharge by
connecting the pump to a discharge data logger (Isco Inc., Lincoln, NE, USA) located at the base
of the stream; the pump was engaged every time a known volume of water (generally 50-100
liters) passed through the downstream flume. Concentrations of (NO3 + NO2)-N, NH4-N, and
soluble reactive phosphorus (SRP) were measured biweekly at the flume of each study stream
(APHA 1998). Nutrient concentrations in the enriched stream (Table 5.1) were well within the
range of natural concentrations of streams in the region (Scott et al. 2002), and thus provided a
realistic assessment of moderate enrichment effects.
Methods
We used the trophic basis of production method (Benke and Wallace 1980, 1997) to
quantify a) the proportion of macro-consumer production derived from dominant basal food
resources (i.e., leaf detritus, wood detritus, amorphous detritus, fungi, diatoms, and animals), and
b) annual organic matter flows (i.e., mg ash-free dry mass [AFDM] m-2 y-1) of these resources to
consumers. Trophic basis of production was calculated for 22 primary consumer taxa and 8
predatory taxa in both study streams during three distinct time periods: before nutrient
enrichment (September 1998 – August 2000), year 1 of enrichment (September 2000 – August
2001), and year 2 of enrichment (September 2001 – August 2002). The trophic basis of
production calculation requires knowledge of invertebrate secondary production, proportion of

167
food resources consumed, and assimilation efficiencies for each food resource. Methods used to
obtain these data are described below.
Secondary production
Annual secondary production of invertebrates was estimated from benthic samples
collected monthly in both study streams between September 1998 and August 2002 (Cross
Chapter 4). Each month, 7 benthic samples were taken from two dominant stream habitats:
mixed substrates (i.e., mixed cobble, pebble, gravel, sand, and silt, n = 4) and moss-covered
bedrock outcrops (n = 3). Mixed substrate samples were collected at random locations in each
stream with a stove pipe core sampler (400 cm2). Bedrock samples (15 cm x 15 cm) were
collected at random locations by brushing and scraping moss and associated particles from a
known area (15 cm x 15 cm) into a plastic bag and Hess Sample net (250 µm mesh size) pressed
flush against the bedrock.
Benthic samples were brought to the laboratory, refrigerated, and processed within 24
hours. Invertebrates were separated into 2 size fractions using nested 1 mm and 250 µm metal
sieves and preserved in formalin solution (6-8%) with Phloxine B dye to aid in sorting. All
invertebrates were removed from the > 1 mm fraction by hand picking under a dissecting
microscope at 15x magnification. The smaller size fraction (<1mm >250µm) was generally
subsampled (1/8 to 1/64 of whole samples) with a sample splitter (Waters 1969), and animals
were removed from subsamples with a dissecting microscope at 15x magnification.
All invertebrates were counted, identified, and their body lengths measured to the nearest
mm with a dissecting microscope and a graduated stage. Most invertebrates were identified to
genus or species level; exceptions included chironomids which were identified as either

168
Tanypodinae (predatory) or non-Tanypodinae (non-predatory), and some non-insect taxa (e.g.,
Oligochaeta) which were identified to the ordinal level or higher. Taxa were assigned to
functional feeding groups according to Merritt and Cummins (1996) and our knowledge of the
local fauna. In this study, all functional feeding group designations (i.e., shredder, collector-
gatherer [=gatherers], scraper, collector-filterer [=filterers], and predator) follow Wallace et al.
(1999). Biomass (AFDM) of individuals was obtained using previously established length-
weight regressions for invertebrates at Coweeta, or, for a few taxa, nearby North Carolina
streams (Benke et al. 1999). Annual secondary production was estimated for most taxa using the
size-frequency method (Hamilton 1969) corrected for the cohort production interval (CPI, Benke
1979, Wallace et al. 1999). Annual production of non-Tanypodinae chironomids and Tallaperla
spp. (Plecoptera: Peltoperlidae) was estimated using the community-level instantaneous growth
method (Huryn and Wallace 1986, Huryn 1990, Cross Chapter 3). All secondary production
estimates were weighed by the relative proportions of mixed substrate and bedrock habitat in
each stream. For a complete description of secondary production results see Cross (Chapter 4).
Gut content analysis
Gut content analysis was used to estimate the relative proportions of dominant food items
in the guts of consumers (Cummins 1973, Benke and Wallace 1980). Invertebrate consumers
were collected roughly seasonally from both streams between July 1999 and July 2002 (n = 10
collection dates). Five to 10 individuals of each of the dominant taxa were collected from each
stream on each date, preserved in Kahle’s solution, and brought to the laboratory. Non-
Tanypodinae chironomids were removed from collections of fine benthic organic material with a
dissecting microscope in the laboratory.

169
Gut contents were teased from invertebrate guts into water, sonicated, and filtered onto
0.45 µm membrane filters. Filters were air-dried, placed on glass slides, cleared with immersion
oil, covered, and sealed with clear nail polish. For most taxa, gut contents of 1-2 individuals
were used for each slide. For smaller taxa (e.g., chironomids), we used a greater number of
individuals (2-10). During each season, between 1-4 slides were made for each taxon; however,
individuals from each taxon were not found during all seasonal collections. Approximately 50
food particles from each slide were identified and their area measured using a phase-contrast
compound microscope (400x) equipped with a digital video camera and image analysis software
(Image Pro 3.0).
The proportional area of each food type (i.e., leaf, wood, amorphous detritus, diatoms,
fungi, and animal) was calculated for each individual. Because leaf- and wood-associated fungi
is not accurately accounted for with this method, we further partitioned leaf and wood detrital
particles into non-living detritus and fungi. We did this by multiplying leaf and wood
percentages in the gut by the average contribution of fungi to leaf or wood biomass (K.
Suberkropp, University of Alabama, unpublished data). Before nutrient enrichment, leaf litter
and wood biomass contained 3.9% and 2.3% fungi, respectively; during enrichment fungal
biomass increased to 5.3% of leaf litter and 10.2% of wood.
It was also necessary to account for differences in the quality of amorphous detritus
between the reference and treatment stream during enrichment. We assumed that changes in
C:N ratios of epilithon (Cross et al. 2003, Cross Chapter 2) reflected the relative increase in
microbial contribution to amorphous detritus. Hence, we adjusted the assimilation efficiency of
amorphous detritus (see below) during enrichment to reflect this difference.

170
Guts of the dominant predators were examined annually (R. O. Hall, University of
Wyoming and W. F. Cross, unpublished data), and generally contained 100% animal material.
For this study we assumed all flows to predators were animal prey.
Assimilation efficiencies and net production efficiency
Literature-based assimilation efficiencies were used for most food categories (Barlocher
and Kendrick 1975, Slansky and Scriber 1982, Benke and Wallace 1980, 1997, Hall et al. 2000).
An assimilation efficiency of 80% was used for animal material, 30% for diatoms, and 70% for
fungi. Leaf and wood detritus were assigned an assimilation efficiency of 0.05%. This value is
lower than the assimilation efficiency generally used for these detritus categories (10%) because
we separately assessed flows of non-living leaf or wood detritus and detritus-bound fungi. An
assimilation efficiency of 10% was used for amorphous detritus during non-enriched conditions
(e.g., Benke and Wallace 1980, Hall et al. 2000). During nutrient enrichment we used an
assimilation efficiency of 19% for amorphous detritus in the treatment stream because the C:N
ratio of epilithon was 1.9-fold lower (i.e., nitrogen was roughly 1.9-fold higher) in the treatment
stream than the reference stream during enrichment (Cross et al. 2003). Although nutrient
enrichment may affect epilithic elemental ratios without altering the total microbial biomass
(e.g., Stelzer and Lamberti 2001), this is only likely to occur when epilithon contains a large
proportion of algae. In these streams, algal contribution to epilithic biomass is extremely low
(Greenwood 2004), and changes in elemental content are more likely to reflect changes in
microbial biomass. A net production efficiency of 0.4 was used for all calculations (e.g., Benke
and Wallace 1997).

171
Trophic basis of production
Secondary production attributed to each food type, and the total amount of each food type
consumed each year (i.e., flows) were quantified following the calculations of Benke and
Wallace (1980, 1997). For each taxon, seasonal proportions of food types during a given year
were averaged to obtain annual average proportions. The relative fraction of a consumer’s
annual production attributed to each food type was calculated as:
Fi = (Gi x AEi x NPE)
where Fi = fraction of production attributed to food type i, Gi = percent of food type i in
consumer’s gut (mean annual percent), AEi = assimilation efficiency for food type i, and NPE =
net production efficiency. Each relative fraction was converted to a percentage of all food types
(PFi) as:
PFi = Fi / SF(i + j + k …n) x 100
To estimate the actual amount of consumer production attributed to these food types, percentages
(PFi) were multiplied by annual consumer secondary production (mg AFDM m-2 y-1). Lastly, the
amount of each food type consumed by a consumer was calculated as:
FCi = (PFi x P) / (AEi x NPE)
where FCi = amount of food type i consumed (mg AFDM m-2 y-1), and P = secondary production
of consumer (mg AFDM m-2 y-1).

172
Statistical analyses
We compared consumer diet overlap between streams during each treatment period, and
among treatment periods within each stream, for all functional feeding groups using proportional
similarity analysis (Whittaker 1975). Proportional similarities were calculated for 3 separate
time periods: before enrichment, year 1 of enrichment, and year 2 of enrichment as:
PS = Si = 1 to n (between-stream mini)
where i = a single food category (e.g., leaves), n = total number of food categories, and between-
stream mini = the minimum proportion of food type i between the reference and enriched
streams. For this analysis we used the weighted-average proportions (weighted by secondary
production) of food items across all taxa within a given functional feeding group. Mean and
standard error proportional similarities for each time period were calculated from multiple
collection dates within a time period. A PS of 1.0 is indicative of complete diet overlap.
Invertebrate consumption versus resource productivity
We calculated the average proportion of food resource productivity (i.e., inputs)
consumed by invertebrates during each time period of the study (i.e., pretreatment and years 1
and 2 of enrichment). Average annual inputs of leaf litter (510 g AFDM m-2 y-1) and small
woody debris (160 g AFDM m-2 y-1) were taken from long-term studies of headwater streams at
Coweeta (Wallace et al. 1995, 2000). Fungal production per gram leaf litter was measured
during each year of the present study (K. Suberkropp, University of Alabama, unpublished data);
these values were multiplied by the average leaf litter standing crop during each year (Cross
Chapter 4). We assumed that fungal production in fine organic sediments was negligible in

173
comparison to that on leaf litter, and was therefore ignored (K. Suberkropp, unpublished data,
Findlay et al. 2002). In lieu of estimates of fine benthic organic matter (FBOM) inputs, we used
values of FBOM storage (Cross Chapter 4) to assess the proportion of this storage consumed by
invertebrates.
Results
We examined the diet and estimated trophic basis of production for 22 primary consumer
taxa. These taxa comprised 89% of the primary consumer community based on average annual
secondary production. In addition, we estimated flows of prey to 8 dominant predatory taxa
which comprised 76% of predator production. On average, our complete food webs represented
86% of the entire community secondary production.
Gut contents
As a group, gut contents of primary consumers in both streams were dominated by leaf
litter (50%) and amorphous detritus (42%). Wood and fungi contributed 3.5% and 2.5%
respectively, and the remaining 2% was split among diatoms and animal material.
Gut contents of individual functional feeding groups exhibited strong differences (Figure
5.1). Shredder guts were dominated by leaf litter (77%) with smaller contributions from
amorphous detritus (12%), wood (6%), and fungi (4%). Diatoms and animal prey were rarely
encountered in shredder guts. In contrast, gut contents of gatherers were dominated by
amorphous detritus (76%) with the remainder consisting primarily of leaf litter (21%) (Figure
5.1). Filterer taxa had a more diverse diet with significant contributions from leaf litter (36%),
amorphous detritus (46%), and animal prey (11%). Wood and fungi contributed an additional

174
4% and 2% to filterer gut contents respectively. Scrapers consumed primarily amorphous
detritus (81%), and smaller amounts of diatoms (11%) and leaf litter (6%) (Figure 5.1).
Within each functional feeding group, noteworthy dietary differences existed among
individual taxa (Appendix C). For the shredders, gut contents of Leuctra spp. and Anchytarsus
sp. contained much higher amounts of amorphous detritus (45%) and lower amounts of leaf litter
(47%) than the other dominant shredder taxa (i.e., Fattigia pele, Lepidostoma spp., Pycnopsyche
spp., Tallaperla spp., and Tipula spp.). Among gatherers, Chironomidae, Paraleptophlebia sp.,
Serratella sp., and Stenonema sp. had gut contents dominated by amorphous detritus (84%). Gut
contents of Amphinemura sp. and Oligochaetae were more evenly split among amorphous
detritus and leaf litter, while Sciaridae guts were dominated by leaf litter (78%). Among
filterers, animal material comprised a significant proportion of the diet of Parapsyche cardis
(17%) and Diplectrona spp. (5%). The remainder for these taxa was split among leaf litter and
amorphous detritus, with fungi and diatoms contributing very little to gut contents. In contrast,
the filterers Simuliidae and Wormaldia spp. consumed primarily amorphous detritus (~88-98%).
Scraper diets were consistently dominated by amorphous detritus (83%), however, small
amounts of leaf litter (7%) and diatoms (8%) were found in the guts of Baetis sp., Ectopria sp.,
and Epeorus sp.. Diatoms made up a larger proportion (25%) of the diet of Neophylax sp.
(Appendix C).
Nutrient enrichment had very little effect on the proportions of food resources in the guts
of consumers (Figure 5.1). Proportional similarities of gut contents for each functional feeding
group were consistently high between treatment periods within each stream (reference: 0.74 –
0.92, treatment: 0.63 – 0.92, Table 5.2) and between the reference and treatment streams during
each time period (0.77 – 0.95, Table 5.2). There was, however, a small increase (~2%) in the

175
proportion of fungi in the guts of shredders in the enriched stream (Figure 5.1). The lowest
proportional similarity value (0.63) corresponded to higher amounts of leaf litter in the guts of
gatherers in the enriched stream during the second year of enrichment (45%) versus the
pretreatment period (12%). Other minor differences among treatment periods or between
streams were idiosyncratic and did not appear to be related to nutrient enrichment effects (Figure
5.1).
Contribution of food resources to secondary production
Because food types are assimilated at different efficiencies, the fraction of invertebrate
secondary production attributable to different food resources (i.e., trophic basis of production)
contrasted with the raw proportions of food types in the guts (Appendix D). Overall, 32% of
consumer production was attributed to amorphous detritus, while 31% and 20% of production
was attributed to animal prey and leaf litter, respectively (Table 5.3). An additional 14% of
consumer production was derived from fungi, and only ~3% came from wood detritus and
diatoms. When only primary consumers were included in these estimates, 45% of total
production was attributed to amorphous detritus, 28% was attributed to leaf litter, 19% was
attributed to fungi, and only ~8% came from wood, diatoms, and animal prey (Table 5.3).
Nutrient enrichment had little effect on total invertebrate trophic basis of production. The
percent contribution of food resources did not differ widely between the reference and treatment
streams (Table 5.3). One exception was during year 1 of enrichment in which amorphous
detritus contributed more and animal prey contributed less to consumer production in the
treatment stream relative to the reference stream (Table 5.3).

176
On average, production of shredders in both streams was primarily attributed to leaf litter
(46%), fungi (31%), and amorphous detritus (17%) (Table 5.4). Gatherer and scraper production
were predominantly supported by amorphous detritus (81% and 73%, respectively), although
~23% of scraper production was attributed to diatoms (Table 5.4). Production of filterer taxa
was largely attributed to amorphous detritus (38%) and animal prey (41%). The contribution of
animal prey to filterer production declined in both streams during the 2 years of enrichment.
Although nutrient enrichment had little effect on invertebrate trophic basis of production,
the absolute amount of production supported by food resources increased greatly in the treatment
stream during enrichment (Figure 5.2, Table 5.4). For example, the amount of shredder
production attributed to fungi increased from 603 mg AFDM m-2 y-1before enrichment to ca.
2194 mg AFDM m-2 y-1. Among gatherers, production attributable to amorphous detritus
increased from ca. 1293 mg AFDM m-2 y-1 before enrichment to ca. 3404 mg AFDM m-2 y-1.
Similar increases in trophic support were seen for most food types among all functional feeding
groups during enrichment (Figure 5.2).
Organic matter flows
Using trophic basis of production values and resource-specific assimilation efficiencies,
we calculated the absolute amount of each resource consumed by the entire invertebrate
assemblage, individual functional feeding groups, and all dominant taxa during each treatment
period. Overall, leaf (52%) and amorphous detritus (35%) dominated resource flows to the
invertebrate community, followed by animal prey (5%), wood detritus (4%), fungi (3%), and
diatoms (~1%) (Table 5.3). Absolute flows from the dominant basal resources to invertebrates
were very similar in the reference stream and the treatment stream before enrichment (Tables 5.3

177
and 5.5). This was due to similar gut contents and secondary production values in both streams
under non-enriched conditions. In contrast, during nutrient enrichment organic matter flows to
consumers were ca. 1-10X higher in the treatment stream than in the reference stream (Tables
5.3 and 5.5). This difference was primarily driven by increased consumer secondary production
in the treatment stream (Cross Chapter 4).
Flows of basal resources differed greatly among functional feeding groups, and key taxa
dominated consumption within each group. Organic matter flows to shredders under non-
enriched conditions (i.e., reference stream and pretreatment in the treatment stream) were
dominated by consumption of leaf litter by Pycnopsyche spp. and Tipula spp. (Table 5.5, Figure
5.3). These flows were dominant because of low assimilation efficiency of leaves, and relatively
high secondary production of these taxa. Nutrient enrichment greatly increased the magnitude of
flows to shredders, with increased flows of detritus (particularly leaf litter and amorphous
detritus) as well as microbes (i.e., fungi) (Table 5.5, Figure 5.3). Flows of amorphous detritus
increased considerably during the second year of enrichment despite the higher assimilation
efficiency assigned to this nutrient-enriched resource. Flows to other taxa, such as Leuctra spp.
and Lepidostoma spp. became more prominent with nutrient enrichment (Figure 5.3).
Resource flows to gatherer taxa under non-enriched conditions were dominated by flows
of amorphous detritus (Table 5.5, Figure 5.4). Chironomidae and Oligochaetae dominated
gatherer consumption because of their relatively high production. However, these taxonomic
groups are highly aggregated, and flows to individual species would be considerably lower.
During nutrient enrichment, total flows to gatherers increased ~56% relative to pretreatment
values; much of this increased consumption was of amorphous detritus and leaf litter (Table 5.5,
Figure 5.4). Flows of leaf litter to Amphinemura sp. increased substantially during enrichment.

178
Flows to filterer and scraper taxa were low in comparison to other primary consumer
groups (Table 5.5, Figures 5.5 and 5.6). Among filterers, dominant flows were from amorphous
detritus, leaf litter, and animal prey to Diplectrona spp, and Parapsyche cardis (Figure 5.5).
Nutrient enrichment slightly increased the magnitude of these flows (ca. 25%) (Table 5.5, Figure
5.5). Total flows to scrapers (predominantly amorphous detritus) were extremely low because of
their minimal secondary production (Table 5.5, Figure 5.6). Nutrient enrichment increased flows
to scrapers, with the largest increases occurring from amorphous detritus to Epeorus sp., and
Neophylax sp. (Figure 5.6).
Flows of animal prey to predators were moderate because of the relatively high
assimilation efficiency of animal material (Figure 5.7). The largest flows of prey during
reference conditions were to Ceratopogonidae, Hexatoma spp., and Lanthus sp., although other
predators consumed significant amounts of prey (Figure 5.7). On average, 82% of total
invertebrate secondary production was consumed by predators during reference years. During
nutrient enrichment, total flows nearly doubled, and consumption by Rhyacophila spp. became
more prominent (Figure 5.7). Interestingly, the total amount of prey production consumed by
predators declined during enrichment to 64% during the first year (Enr-1) and 47% during the
second year (Enr-2).
Invertebrate consumption vs. basal resource production
We calculated the percentage of food resource productivity (i.e., inputs) consumed by
invertebrates during the study. Our estimates demonstrate that during non-enriched years,
invertebrates consumed a relatively small proportion of the annual inputs of leaf litter (15%),
wood (4%), fungi (2%), FBOM (8%), and diatoms (4%) (Figure 5.8). In contrast, a relatively

179
large proportion of available prey was consumed by predators (79%) during non-enriched years.
During nutrient enrichment, consumption of leaf litter increased in the treatment stream to an
average of ~32% of annual leaf inputs. In addition, consumption of diatom production went up
to ~ 54% of inputs. Consumption of prey declined during the enrichment to ~56% of prey
secondary production.
Discussion
Quantifying material flows through food webs is a critical step towards understanding
dominant pathways of energy and nutrients through consumers, and for identifying key players
in the cycling and processing of these materials (e.g., Benke and Wallace 1997). In addition, this
approach can provide insight into mechanisms responsible for changes to ecosystem functions
(e.g., secondary production) resulting from natural or human-induced perturbations. We utilized
the trophic basis of production method to follow organic matter flows to consumers in a
reference stream and an experimentally-enriched stream. Our intent was to account for nutrient-
induced differences in food quality by a) utilizing empirical measurements of fungal biomass,
and b) estimating between-stream differences in the quality of amorphous detritus. Importantly,
we demonstrated that nutrient enrichment had a major positive effect on resource flows to
consumers despite a lack of evidence for dietary shifts or changes in invertebrate trophic basis of
production. These results lend support to the notion that nutrient-induced changes to detrital
food quality are more complex than simple changes in biomass of detritus-associated microbes.
The importance of non-living detritus versus detritus-bound microbes to the nutrition of
consumers has long been a topic of interest to aquatic ecologists (e.g., Cummins 1973). Findlay
et al. (1986a ,b) demonstrated that leaf-associated fungi comprised a moderate component of the

180
total carbon respired by a freshwater isopod (up to 57%) and a stonefly (25%). In contrast,
bacteria associated with leaf litter were shown to be much less important for consumer nutrition,
comprising only ~1 - 5% of total carbon respired by the isopod, the stonefly, and a cranefly larva
(Findlay et al. 1986a, b). These results imply that although some nutrition is derived from
microbes, a large proportion of respired carbon must necessarily come from the non-living leaf
substrate. Indeed, some detritivores have adapted the capability to assimilate recalcitrant detrital
compounds through high gut pH or microbial gut symbionts (Martin et al. 1981, Sinsabaugh et
al. 1985). Our estimates of fungal contribution to the production of leaf-eating taxa (i.e.,
shredders) were comparable (ca. 31%) to estimates of Findlay et al. (1986 a, b), but considerably
higher than most studies which used traditional gut content analysis (e.g., Smock and Roeding
1986, Benke and Wallace 1997, Rosi-Marshall and Wallace 2002). Knowledge of fungal
biomass on leaf litter and wood throughout the study allowed us to account for the fungi which is
typically not detected with standard gut content analysis. Our results, along with previous
laboratory experiments (Findlay et al. 1986 a,b), likely provide a more realistic view of the
importance of fungi to the nutrition of leaf-eating consumers.
The importance of fungi to stream consumers, however, goes far beyond their direct
contribution to the diet of consumers. Aquatic hyphomycetes play a prominent role in the
physical and chemical breakdown of leaf litter, and make large particles more available for
further breakdown and consumption by bacteria and invertebrates (e.g., Barlocher 1985,
Suberkropp 1992). In addition, fungal exoenzymes are critical for degrading complex
carbohydrates, rendering these compounds more available for assimilation by invertebrates (e.g.,
Sinsabaugh et al. 1985). Leaf-associated fungi may also stimulate invertebrate feeding by
increasing leaf palatability and affecting feeding preferences (Arsuffi and Suberkropp 1984,

181
1985). In forested headwater streams where allochthonous inputs of leaf litter fuel the majority
of secondary production (e.g., Hall et al. 2000), fungi potentially play a ‘keystone’ role in driving
the processing and consumption of organic material. Experimental manipulation of the presence
of fungi in these systems (A. D. Rosemond, study in progress) will be instrumental in evaluating
their role as a keystone component of headwater stream food webs.
In our study, the diets of most non-shredder primary consumer taxa contained a large
percentage of amorphous detritus, and we estimated that a significant component of their
production (~64%) was derived from this resource. The dominance of amorphous detritus as a
food resource has been consistently reported for a wide range of taxa and aquatic ecosystem
types (e.g., Smock and Roeding 1986, Wallace et al. 1987, Carlough 1994, Benke and Wallace
1997, Hall et al. 2000, Rosi-Marshall and Wallace 2002, Hart and Lovvorn 2003, Benstead and
Pringle 2004). However, understanding the trophic significance of this resource has been
somewhat elusive because of difficulty in quantifying the contribution of microbial vs. non-
microbial components. Studies that have explicitly examined the contribution of amorphous
detritus-associated bacteria have indeed shown that a large proportion of assimilated carbon may
come from the microbial component. Edwards (1987) and Edwards and Meyer (1990) labeled
sestonic bacteria with tritiated thymidine to show that snag-dwelling mayflies and blackflies in a
large blackwater river derived between 20 and 93% of their carbon from bacteria. Moreover,
Hall and Meyer (1998) used a whole-stream 13C-tracer addition to demonstrate that a large
fraction of invertebrate carbon was derived from bacteria (and exopolymers) associated with
amorphous detritus. In our study, it is likely that production attributed to amorphous detritus is
synonymous with microbial-based production. Because of the prominence of amorphous detritus
in the guts of stream consumers, and the uncertainty of its composition and origins (e.g.,

182
Carlough 1994), further research on the dynamics, composition, and importance of amorphous
detritus will greatly improve our general understanding of stream trophic dynamics and basis of
production.
Overall, diatoms were of minimal significance to the trophic basis of primary consumers
at Coweeta. This is not surprising considering the generally low levels of primary production
and epilithic chlorophyll a at Coweeta and in other forested headwater streams (Haines 1981,
Webster et al. 1983, Hall et al. 2001, Bernhardt and Likens 2004, Greenwood 2004).
Nonetheless, because of this low level of primary production and a relatively high secondary
production of some taxa that included small amounts of diatoms in their diets, we estimated that
invertebrates were capable of consuming a significant proportion (up to 72%) of the annual
inputs (Figure 5.8). This result underscores the paucity of algal resources available for
consumers at Coweeta. Among epilithic specialists (i.e., scrapers), however, we found that
diatoms supported a significant proportion (~25%) of secondary production. In fact, during
spring months, gut contents of Neophylax sp. contained up to 90% diatoms (Appendix C).
Mayer and Likens (1987) similarly demonstrated that production of the scraper Neophylax
aniqua was predominantly (~75%) supported by algae in a small stream in Hubbard Brook, New
Hampshire. In streams at Coweeta, scraper biomass tends to peak during each spring (Cross
Chapter 4) suggesting the life-histories of scrapers are adapted to intra-annual variation in food
supply.
In contrast to streams at Coweeta, others have shown a strong dependence of whole-
assemblage consumer production on autochthonous primary production despite shaded and/or
heterotrophic conditions. McCutchan and Lewis (2002) combined secondary production
estimates with stable isotope analysis to demonstrate that ca. 40% of invertebrate production in

183
predominantly shaded reaches of Colorado mountain streams was derived from algae. These
small streams in Colorado, however, are much less shaded than those at Coweeta which have a
thick understorey of Rhododendon maximum.
Nutrient enrichment had only minor effects on consumer diets, yet there were large
increases in organic matter flows as a result of elevated secondary production. This suggests that
enrichment led to changes in the food base that positively affected consumer growth or survival
beyond simple changes in microbial content of detritus. For heuristic purposes, we examined
whether increased production of shredders in the enriched stream (Cross Chapter 4) could be
accounted for by simple differences in microbial content of leaf litter between the reference and
treatment stream. Microbial contribution to leaf litter biomass increased 1.4% in the treatment
stream (from 3.9% - 5.3%) during enrichment. If we assume a 5% assimilation efficiency for
leaf detritus and a 100% (theoretical maximum) assimilation efficiency for microbes, the total
amount of material assimilated by consumers would only increase by 15% in the treatment
stream. However, organic matter flows (and production) of shredders increased, on average,
162% with enrichment (Figure 5.3, Chapter 4). This large discrepancy suggests that factors
other than actual differences in microbial biomass led to increased production and organic matter
flows to consumers. In the treatment stream, it is likely that a greater proportion of benthic leaf
material was ‘primed’ for invertebrate consumption by microbial degradation of recalcitrant leaf
compounds. This could have a strong positive effect on leaf palatability and/or assimilation
efficiency of the non-living leaf substrate by making leaf carbon more available (i.e., digestible)
to invertebrates (e.g., Sinsabaugh et al. 1985). Moreover, enrichment caused significant changes
in the nutrient content and C:nutrient ratios of detritus (Cross et al. 2003), reducing elemental
imbalances and potentially contributing to increased secondary production (e.g., Sterner et al.

184
1998). Nonetheless, pinning down the actual mechanism responsible for increased secondary
production is difficult because production is influenced by a suite of factors including individual
growth, survivorship, and reproduction, which all could have been positively affected by
microbial-induced changes of stream detritus.
We demonstrated that invertebrates consumed a relatively small proportion of the annual
inputs of detrital and fungal food resources (Figure 5.8) throughout the study. Excluding leaf
litter during enrichment and diatoms, invertebrates generally consumed less than 10-15% of
annual food resource inputs. Using a similar energetic budget approach, Huryn (1998)
demonstrated that only a small proportion of primary production was consumed by invertebrates
in a New Zealand trout stream. In this case, nearly all invertebrate production was necessary to
meet the energetic requirements of trout, and the surplus of primary production was presumably
the result of cascading top-down control by trout. In streams at Coweeta, a similarly high
proportion of invertebrate production (~80%) was necessary to meet the requirements of
primarily invertebrate predators (Figure 5.8). This suggests that invertebrate predators have
potentially strong cascading top-down effects on detrital resources (see Malmqvist 1993).
Interestingly, the increased consumption of leaf litter during enrichment (up to ~38%) coincided
with a decreased proportion of prey consumed by predators (down to ~47%). Such an energetic
budget approach (e.g., Allen 1951, Huryn 1998) may be useful for examining trophic dynamics
in systems where experimental manipulation of food web components is not logistically possible.
In summary, we have shown that the effects of nutrient enrichment on a detritus-based
stream food web were manifested as changes to total organic matter flows with little effect on
consumer diet or trophic basis of production. Our results suggest that elevated invertebrate
production (Cross Chapter 4) in response to nutrient enrichment was brought on by microbially-

185
mediated changes to organic matter (i.e., increased carbon assimilability, or release of
stoichiometric constraints), as opposed to direct changes in the consumption and assimilation of
microbes. Future research focused on species-specific nutritional requirements will undoubtedly
add to our understanding of community-level responses to enrichment.
Acknowledgements
We thank Catherine Evans and James Norman for tireless assistance preparing slides.
We also thank Sue Eggert, Jennifer Greenwood, Bob Hall, and Heidi Wilcox for help with
invertebrate collections. Emma Rosi-Marshall and Jon Benstead gave valuable advice about
identifying and digitizing gut contents. Funding was provided by NSF (DEB – 9806610) to Amy
D. Rosemond, J. Bruce Wallace, Keller Suberkropp, and Pat J. Mulholland.
Literature Cited
Allen, K. R. 1951. The Horokiwi stream: a study of a trout population. Bull. Mar. New
Zealand. Fish 10:1-238.
American Public Health Association. 1998. Standard Methods for the Examination of Water
and Wastewater, 20th edn. American Public Health Association.
Arsuffi, T. L. and K. Suberkropp. 1984. Leaf processing capabilities of aquatic hyphomycetes
- interspecific differences and influence on shredder feeding preferences. Oikos 42:144-
154.
Arsuffi, T. L. and K. Suberkropp. 1985. Selective feeding by stream caddisfly (Trichoptera)
detritivores on leaves with fungal-colonized patches. Oikos 45:50-58.
Baird, D. and R. E. Ulanowicz. 1989. The seasonal dynamics of the Chesapeake Bay

186
ecosystem. Ecological Monographs 59:329-364.
Barlocher, F. 1985. The role of fungi in the nutrition of stream invertebrates. Botanical Journal
of the Linnean Society 91:83-94.
Barlocher, F., and B. Kendrick. 1975. Assimilation efficiency of Gammarus pseudolimnaeus
(Amphipoda) feeding on fungal mycelium or autumn-shed leaves. Oikos 26:55-59.
Benke, A. C. 1979. A modification of the Hynes method for estimating secondary production
with particular significance for multivoltine populations. Limnology and Oceanography
24:168-171.
Benke, A.C., A. D. Huryn, L. A. Smock, and J. B. Wallace. 1999. Length-mass relationships
for freshwater macroinvertebrates in North America with particular reference to the
southeastern United States. Journal of the North American Benthological Society 18:
308–343.
Benke, A. C. and J. B. Wallace. 1980. Trophic basis of production among net-spinning
caddisflies in a southern Appalachian stream. Ecology 61:108-118.
Benke, A. C. and J. B. Wallace. 1997. Trophic basis of production among riverine caddisflies:
implications for food web analysis. Ecology 78:1132-1145.
Benstead, J. P and C. M. Pringle. 2004. Deforestation alters the resource base and biomass of
endemic stream insects in eastern Madagascar. Freshwater Biology 49:490-501.
Berhardt, E. S. and G. E. Likens. 2004. Controls on periphyton biomass in heterotrophic
streams. Freshwater Biology 49:14-27.
Carlisle, D. M. and W. H. Clements. 2003. Growth and secondary production of aquatic insects
along a gradient of Zn contamination in Rocky Mountain streams. Journal of the North
American Benthological Society 22:582-597.

187
Carlough, L. A. 1994. Origins, structure, and trophic significance of amorphous seston in a
blackwater river. Freshwater Biology 31:227-237.
Cohen, J. E., R. A. Beaver, S. H. Cousins, D. L. DeAngelis, L. Goldwasser, K. L. Heong, R. D.
Holt, A. J. Kohn, J. H. Lawton, N. Martinez, R. O’Malley, L. M. Page, B. C. Patten, S. L.
Pimm, G. A. Polis, M. Rejmanek, T. W. Schoener, K. Schoenly, W. G. Sprules, J. M.
Teal, R. E. Ulanowicz, P. H. Warren, H. M. Wilber, and P. Yodzis. 1993. Improving
food webs. Ecology 74:252-258.
Cohen, J. E., F. Briand, and C. M. Newman. 1990. Community Food Webs: Data and Theory.
Springer, Berlin.
Cummins, K. W. 1973. Trophic relations of aquatic insects. Annual Review of Entomology
18:183-206.
Edwards, R. T. 1987. Sestonic bacteria as a food source for filtering invertebrates in 2
southeastern blackwater rivers. Limnology and Oceanography 32:221-234.
Edwards, R. T. and J. L. Meyer. 1990. Bacterivory by deposit-feeding mayfly larvae
(Stenonema spp.). Freshwater Biology 24:453-462.
Eggert, S. L. 2003. Resource use by detritivorous macroinvertebrates in southern Appalachian
headwater streams. Dissertation, University of Georgia, Athens, GA, USA.
Findlay, S., J. L. Meyer, and P. J. Smith. 1984. Significance of bacterial biomass in the nutrition
of a freshwater isopod (Lirceus sp.). Oecologia 63:38-42.
Findlay, S., J. L. Meyer, and P. J. Smith. 1986a. Contribution of fungal biomass to the diet of a
fresh-water isopod (Lirceus Sp). Freshwater Biology 16:377-385.
Findlay, S., J. L. Meyer, and P. J. Smith. 1986b. Incorporation of microbial biomass by
Peltoperla sp. (Plecoptera) and Tipula sp. (Diptera). Journal of the North American

188
Benthological Society 5:306-310.
Findlay, S., J. Tank, S. Dye, H. M. Valett, P. J. Mulholland, W. H. McDowell, S. L. Johnson, S.
K. Hamilton, J. Edmonds, W. K. Dodds, and W. B. Bowden. 2002. A cross-system
comparison of bacterial and fungal biomass in detritus pools of headwater streams.
Microbial Ecology 43:55-66.
Greenwood, J. 2004. The response of heterotrophic and autotrophic resources to a long-term
nutrient enrichment in an Appalachian headwater stream ecosystem. Dissertation.
University of Georgia, Athens, GA, USA.
Hains, J. J. 1981. The response of stream flora to watershed perturbation. MS Thesis. Clemson
University, Clemson, SC.
Hall, R. O., G. E. Likens, and H. M. Malcom. 2001. Trophic basis of invertebrate production in
2 streams at the Hubbard Brook Experimental Forest. Journal of the North American
Benthological Society 20:432-447.
Hall, R. O. and J. L. Meyer. 1998. The trophic significance of bacteria in a detritus-based
stream food web. Ecology 79:1995-2012.
Hall, R. O. J., J. B. Wallace, and S. L. Eggert. 2000. Organic matter flow in stream food webs
with reduced detrital resource base. Ecology 81:3445-3463.
Hamilton, A. L. 1969. On estimating annual production. Limnology and Oceanography
14:771-782.
Hart, E. A. and J. R. Lovvorn. 2003. Algal vs. macrophyte inputs to food webs of inland saline
wetlands. Ecology 84:3317-3326.
Huryn, A. D. 1990. Growth and voltinism of lotic midge larvae: patterns across an Appalachian
mountain basin. Limnology and Oceanography 35:339-351.

189
Huryn, A. D. 1998. Ecosystem-level evidence for top-down and bottom-up control of
production in a grassland stream system. Oecologia 115:173-183.
Huryn, A. D. and J. B. Wallace. 1986. A method for obtaining in situ growth rates of larval
Chironomidae (Diptera) and its application to studies of secondary production.
Limnology and Oceanography 31:216-222.
Hutchens, J. J., E. F. Benfield, and J. R. Webster. 1997. Diet and growth of a leaf-shredding
caddisfly in southern Appalachian streams of contrasting disturbance history.
Hydrobiologia 346:193-201
Iversen, T. M. 1974. Ingestion and growth in Sericostoma personatum (Trichoptera) in relation
to the nitrogen content of ingested leaves. Oikos 25:278-282.
Lewis, W. M., S. K. Hamilton, M. A. Rodriguez, J. F. Saunders, and M. A. Lasi. 2001.
Foodweb analysis of the Orinoco floodplain based on production estimates and stable
isotope data. Journal of the North American Benthological Society 20:241-254.
Malmqvist, B. 1993. Interactions in stream leaf packs – effects of a stonefly predator on
detritivores and organic matter processing. Oikos 66:454-462.
Martin, M. M., J. J. Kukor, J. S. Martin, D. L. Lawson, and R. W. Merritt. 1981. Digestive
enzymes of larvae of 3 species of caddisflies (Trichoptera). Insect Biochemistry 11:501-
505.
Martinez, N. D. 1991. Artifacts or attributes? Effects of resolution on the Little Rock Lake
food web. Ecological Monographs 61:367-392.
McCutchan, J. H. and W. M. Lewis. 2002. Relative importance of carbon sources for
macroinvertebrates in a Rocky Mountain stream. Limnology and Oceanography 47:742-
752.

190
Merritt, R.W. and K. W. Cummins. 1996. An Introduction to the Aquatic Insects of North
America. 3rd edn., Kendall/Hunt Publishing Co., USA.
Mulholland, P. J., J. L. Tank, D. M. Sanzone, W. M. Wollheim, B. J. Peterson, J. R. Webster,
and J. L. Meyer. 2000. Food resources of stream macroinvertebrates determined by
natural abundance stable C and N isotopes and a 15N tracer addition. Journal of the
North American Benthological Society 19:145-157.
Paine, R. T. 1988. Food webs - road maps of interactions or grist for theoretical
development. Ecology 69:1648-1654.
Paine, R. T. 1992. Food-web analysis through field measurement of per capita interaction
strength. Nature 355:73-75.
Pimm, S. L. 1982. Food Webs. Chapman and Hall, New York.
Pimm, S. L., J. H. Lawton, and J. E. Cohen. 1991. Food web patterns and their consequences.
Nature 350:669-674.
Polis, G. A. 1991. Complex trophic interactions in deserts: an empirical critique of food-web
theory. American Naturalist 138:123-155.
Polis, G. A. 1994. Food webs, trophic cascades and community structure. Australian Journal of
Ecology 19:121-136.
Polis, G. A. and K. O. Winemiller. 1996. Food webs: Integration of Pattern and Dynamics.
Chapman and Hall, New York.
Rosi-Marshall, E. J. and J. B. Wallace. 2002. Invertebrate food webs along a stream resource
gradient. Freshwater Biology 47:129-141.
Scott, M. C., G. S. Helfman, M. E. McTammany, E. F. Benfield, and P. V. Bolstad. 2002.
Multiscale influences on physical and chemical stream conditions across blue ridge

191
landscapes. Journal of the American Water Resources Association 38:1379-1392.
Shieh, S-H., J. V. Ward, and B. C. Kondratieff. 2002. Energy flow through macroinvertebrates
in a polluted plains stream. Journal of the North American Benthological Society
21:660-675.
Sinsabaugh, R. L., A. E. Linkins, and E. F. Benfield. 1985. Cellulose digestion and assimilation
by 3 leaf-shredding aquatic insects. Ecology 66:1464-1471.
Slansky, F. and J. M. Scriber. 1982. Selected bibliography and summary of quantitative food
utilization by immature insects. Bulletin of the Entomological Society of America 28:43-
55.
Smock, L. A. and C. E. Roeding. 1986. The trophic basis of production of the
macroinvertebrate community of a southeastern U.S.A. blackwater stream. Holarctic
Ecology 9:165-174.
Stelzer, R. S. and G. A. Lamberti. 2001. Effects of N:P ratio and total nutrient concentration on
stream periphyton community structure, biomass, and elemental composition.
Limnology and Oceanography 46:356-367.
Sterner, R. W., J. Clasen, W. Lampert, and T. Weisse. 1998. Carbon: phosphorus stoichiometry
and food chain production. Ecology Letters 1:146-150.
Suberkropp, K. 1992. Interactions with invertebrates. In: Barlocher, F. (ed). The Ecology of
Aquatic Hyphomycetes. Springer-Verlag. New York.
Swank, W.T. and D.A. Crossley. 1988. Forest Hydrology and Ecology at Coweeta. Ecological
Studies Series Volume 66, Springer-Verlag, New York.
Thompson, R. M. and C. R. Townsend. 1999. The effect of seasonal variation on the
community structure and food-web attributes of two streams: implications for food-web

192
science. Oikos 87:75-88.
Wallace, J. B., A. C. Benke, A. H. Lingle, and K. Parsons. 1987. Trophic pathways of
macroinvertebrate primary consumers in subtropical blackwater streams. Archiv fur
Hydrobiologie, Supplement 74:423-451.
Wallace, J. B., T. F. Cuffney, S. L. Eggert, and M. R. Whiles. 1997a. Stream organic matter
inputs, storage, and export for Satellite Branch at Coweeta Hydrologic Laboratory, North
Carolina, USA. Journal of the North American Benthological Society 16:67-74.
Wallace, J. B., S. L. Eggert, J. L. Meyer, and J. R. Webster. 1997b. Multiple trophic levels of a
forest stream linked to terrestrial litter inputs. Science 277:102-104.
Wallace, J. B., S. L. Eggert, J. L. Meyer, and J. R. Webster. 1999. Effects of resource limitation
on a detrital-based ecosystem. Ecological Monographs 69:409-442.
Wallace, J. B., M. R. Whiles, S. L. Eggert, T. F. Cuffney, G. J. Lugthart, and K. Chung. 1995.
Long-term dynamics of coarse particulate organic matter in three Appalachian Mountain
streams. Journal of the North American Benthological Society 14:217-232.
Wallace, J. B., J. R. Webster, S. L. Eggert, and J. L. Meyer. 2000. Small wood dynamics in a
headwater stream. Verh. Internat. Verein. Linmol. 27:1361-1365.
Waters, T. F. 1969. Subsampler for dividing large samples of stream invertebrate drift.
Limnology and Oceangraphy 14:813.
Webster, J. R., M. E. Gurtz, J. J. Hains, J. L. Meyer, W. T. Swank, J. B. Waide, and J. B.
Wallace. 1983. Stability of stream ecosystems. Pages 355-395. In: Barnes, J. R. and G.
W. Minshall (eds). Stream Ecology. Plenum Press, New York.
Whittaker, R.H. 1975. Communities and ecosystems. 2nd ed. Macmillan Pub. Co., New
York.

193
Wootton, J. T. 1994. Predicting direct and indirect effects: an integrated approach using
experiments and path analysis. Ecology 75:151-165.
Wootton, J. T. 1997. Estimates and tests of per capita interaction strength: diet, abundance, and
impact of intertidally foraging birds. Ecological Monographs 67:45-64.

194
Table 5.1. Physical and chemical characteristics of headwater streams draining catchments 53(reference) and 54 (enriched) at the Coweeta Hydrologic Laboratory. Elevations were measuredat the gauging weirs.Variable Reference (C53) Treatment (C54)Catchment Area (ha) 5.2 5.5 Elevation (m asl) 829.0 841.0Channel Gradient (cm m-1) 27.0 33.0 Length (m) 145.0 282.0 Bankfull Area (m2) 327.0 443.0Discharge (l s-1)¶
Average 0.3 0.5 Maximum 3.8 4.8Temperature (°C) ¶
Annual average 12.0 12.0 Minimum 2.6 4.8 Maximum 18.6 16.7Water chemistry (range) pH 6.6 (6.2-7) 6.9 (6.6-7.9) (NO3-N + NO2)-N (µg l-1) pretreatment: 1999 – 2000 15.4 (9.4-25.8) 18.8 (4-39.5) enrichment: 2000 – 2002 16.9 (bd-151) 308.9 (11-1711) NH4-N (µg l-1) pretreatment: 1999 – 2000 9.4 (bd-30) 9.9 (bd-25) enrichment: 2000 – 2002 10.4 (bd-76) 105.5 (6-566) SRP‡ (µg l-1) pretreatment: 1999 – 2000 7.6 (bd-20) 8.8 (bd-22) enrichment: 2000 – 2002 3.7 (bd-17) 51.2 (bd-268)¶September 1998 – August 2002. Temperature was measured with Optic Stowaway temperatureprobes (Onset Computer Corp., Pocasset, MA, USA). ‡Soluble reactive phosphorus. bd =below detection limit. For nutrient data: reference stream - pretreatment n = 5, treated stream -pretreatment n = 12, reference stream - enrichment n = 33, treated stream - enrichment n = 44.
195
Table 5.2. Proportional similarity of diet between treatment periods or between streams for primary consumer functional feedinggroups in the reference stream (C53) and treatment stream (C54). Pre = before nutrient enrichment (September 1998 - June 2000),Enr-1 = year 1 of enrichment (July 2000 – August 2001), Enr-2 = year 2 of enrichment (September 2001 – August 2002). Values aremeans ± SE for multiple seasons within each comparison. Food resource categories included leaves, wood, fungi, amorphous detritus,diatoms, and animal material.
Reference stream Treatment streamBetween-stream
comparisonsPre Enr-1 Enr-2 Pre Enr-1 Enr-2
Shredders Pre --- --- --- --- --- --- 0.95 ± 0.02 Enr-1 0.84 ± 0.05 --- --- 0.88 ± 0.01 --- --- 0.88 ± 0.03 Enr-2 0.88 ± 0.06 0.88 ± 0.07 --- 0.84 ± 0.05 0.92 ± 0.02 --- 0.93 ± 0.03
Gatherers Pre --- --- --- --- --- --- 0.90 ± 0.08 Enr-1 0.88 ± 0.08 --- --- 0.88 ± 0.06 --- --- 0.91 ± 0.04 Enr-2 0.86 ± 0.03 0.92 ± 0.03 --- 0.63 ± 0.13 0.80 ± 0.13 --- 0.83 ± 0.08
Filterers Pre --- --- --- --- --- --- 0.86 ± 0.02 Enr-1 0.81 ± 0.12 --- --- 0.82 ± 0.06 --- --- 0.85 ± 0.04 Enr-2 0.74 ± 0.10 0.83 ± 0.02 --- 0.85 ± 0.03 0.84 ± 0.06 --- 0.78 ± 0.08
Scrapers Pre --- --- --- --- --- --- 0.93 ± 0.04 Enr-1 0.85 ± 0.02 --- --- 0.74 ± 0.15 --- --- 0.77 ± 0.06 Enr-2 0.77 ± 0.16 0.81 ± 0.04 --- 0.80 ± 0.06 0.80 ± 0.10 --- 0.86 ± 0.08

196
Table 5.3. Fraction of total invertebrate production attributed to food resources and total flows from food resources to the invertebratecommunities in the reference (C53) and treatment (C54) streams. Pre = pretreatment period (September 1998 – August 2000), Enr-1= year 1 of enrichment (September 2000 – August 2001), and Enr-2 = year 1 of enrichment (September 2001 – August 2002). Forfractions, values in parentheses only include primary consumers (i.e., no predators). For total organic matter flows, values inparentheses are percentages of the total.
Fraction of total secondary production derived from food resourcesPre Enr-1 Enr-2
reference treatment reference treatment reference treatmentLeaf detritus 0.19 (0.27) 0.17 (0.26) 0.20 (0.30) 0.16 (0.21) 0.25 (0.34) 0.22 (0.28)Wood detritus 0.02 (0.03) 0.03 (0.04) 0.02 (0.02) 0.00 (0.01) 0.01 (0.01) 0.01 (0.01)Amorphous detritus 0.32 (0.45) 0.31 (0.46) 0.29 (0.45) 0.40 (0.54) 0.30 (0.42) 0.32 (0.40)Fungi 0.12 (0.16) 0.11 (0.16) 0.12 (0.18) 0.13 (0.18) 0.14 (0.20) 0.19 (0.24)Diatoms 0.03 (0.04) 0.01 (0.01) 0.01 (0.01) 0.03 (0.04) 0.01 (0.02) 0.01 (0.02)Animal prey 0.33 (0.05) 0.37 (0.07) 0.37 (0.03) 0.28 (0.02) 0.28 (0.02) 0.24 (0.04)
Total organic matter flows from food resources (g AFDM m-2 y-1)Pre Enr-1 Enr-2
reference treatment reference treatment reference treatmentLeaf detritus 74.9 (47) 59.7 (45) 78.8 (50) 124.4 (53) 100.6 (57) 199.3 (64)Wood detritus 8.3 (5) 9.2 (7) 6.4 (4) 3.7 (2) 3.5 (2) 9.8 (3)Amorphous detritus 62.8 (40) 52.8 (40) 58.3 (37) 82.2 (35) 61.3 (35) 74.3 (24)Fungi 3.2 (2) 2.6 (2) 3.4 (2) 7.4 (3) 4.2 (2) 12.4 (4)Diatoms 1.8 (1) 0.4 (<1) 0.6 (<1) 4.2 (2) 0.9 (1) 2.1 (1)Animal prey 8.0 (5) 8.0 (6) 9.1 (6) 13.6 (6) 7.1 (4) 13.2 (4)
Total 159.1 132.7 156.6 235.5 177.5 311.2

197
Table 5.4. Total annual production (g AFDM m-2 y-1) attributable to each food type (percent of total in parentheses) for primaryconsumer functional feeding groups in the reference and treatment stream during the pretreatment period (average of September 1998– August 1999 and September 1999 – August 2000), year 1 of enrichment (September 2000 – August 2001), and year 2 of enrichment(September 2001 – August 2002). Values in parentheses are percentages of the total.
Pretreatment (year 1)
Nutrient Enrichment (year 2)
Nutrient EnrichmentFunctional group/
Food type Reference Treatment Reference Treatment Reference Treatment Shredders
Leaf detritus 1.022 (51) 0.944 (50) 1.260 (45) 1.915 (38) 1.598 (52) 3.159 (40)Wood detritus 0.126 (6) 0.131 (7) 0.106 (4) 0.065 (1) 0.057 (2) 0.173 (2)
Amorphous detritus 0.250 (12) 0.208 (11) 0.631 (23) 1.015 (20) 0.484 (16) 1.632 (21)Fungi 0.624 (31) 0.582 (31) 0.753 (27) 1.616 (32) 0.929 (30) 2.771 (35)Diatoms 0.002 (<1) 0.007 (<1) 0.024 (1) 0.366 (7) 0.015 (<1) 0.156 (2)Animal 0.000 (0) 0.000 (0) 0.005 (<1) 0.000 (0) 0.008 (<1) 0.004 (<1)
Total 2.025 1.873 2.780 4.978 3.092 7.897
GatherersLeaf detritus 0.142 (10) 0.108 (6) 0.157 (10) 0.284 (6) 0.188 (11) 0.528 (13)Wood detritus 0.006 (<1) 0.026 (2) 0.009 (1) 0.001 (<1) 0.000 (0) 0.007 (<1)
Amorphous detritus 1.140 (78) 1.445 (86) 1.234 (81) 3.828 (87) 1.366 (80) 2.980 (72)Fungi 0.083 (6) 0.070 (4) 0.093 (6) 0.226 (5) 0.107 (6) 0.428 (10)Diatoms 0.110 (7) 0.026 (2) 0.026 (2) 0.063 (<1) 0.052 (3) 0.063 (2)Animal 0.000 (0) 0.000 (0) 0.000 (0) 0.000 (0) 0.000 (0) 0.109 (3)
Total 1.483 1.674 1.520 4.402 1.714 4.116

198
Table 5.4 (cont.)
Pretreatment (year 1)
Nutrient Enrichment (year 2)
Nutrient EnrichmentFunctional group/
Food type Reference Treatment Reference Treatment Reference Treatment Filterers
Leaf detritus 0.037 (8) 0.054 (9) 0.044 (14) 0.063 (9) 0.064 (17) 0.082 (9)Wood detritus 0.008 (2) 0.012 (2) 0.004 (1) 0.002 (<1) 0.006 (2) 0.008 (1)
Amorphous detritus 0.111 (25) 0.140 (25) 0.129 (39) 0.344 (50) 0.195 (51) 0.368 (38)Fungi 0.024 (5) 0.034 (6) 0.027 (8) 0.053 (8) 0.039 (10) 0.078 (8)Diatoms 0.004 (1) 0.008 (1) 0.009 (3) 0.008 (1) 0.008 (2) 0.005 (1)Animal 0.265 (60) 0.317 (56) 0.115 (35) 0.215 (31) 0.070 (18) 0.427 (44)
Total 0.447 0.564 0.327 0.686 0.275 0.968
ScrapersLeaf detritus 0.000 (<1) 0.000 (7) 0.001 (4) 0.001 (1) 0.000 (1) 0.001 (1)Wood detritus 0.000 (0) 0.000 (0) 0.000 (0) 0.000 (0) 0.000 (4) 0.000 (0)
Amorphous detritus 0.031 (77) 0.009 (72) 0.020 (71) 0.068 (81) 0.010 (54) 0.053 (80)Fungi 0.000 (<1) 0.001 (4) 0.001 (2) 0.000 (1) 0.000 (2) 0.001 (1)Diatoms 0.009 (22) 0.002 (16) 0.006 (22) 0.015 (18) 0.007 (39) 0.012 (18)Animal 0.000 (0) 0.000 (0) 0.000 (<1) 0.000 (0) 0.000 (0) 0.000 (0)
Total 0.041 0.012 0.029 0.084 0.018 0.066

199
Table 5.5. Annual organic matter flows in g AFDM m-2 y-1 (percent of total in parentheses) from each food type to primary consumerfunctional feeding groups in the reference and treatment stream during the pretreatment period (average of September 1998 – August1999 and September 1999 – August 2000), year 1 of enrichment (September 2000 – August 2001), and year 2 of enrichment(September 2001 – August 2002). Values in parentheses are percentages of the total.
Pretreatment (year 1)
Nutrient Enrichment (year 2)
Nutrient EnrichmentFunctional group/
Food type Reference Treatment Reference Treatment Reference Treatment Shredders Leaf detritus 51.126 (78) 47.221 (77) 63.022 (72) 95.726 (79) 79.911 (81) 157.963 (79) Wood detritus 6.280 (10) 6.597 (11) 5.308 (6) 3.261 (3) 2.842 (3) 8.664 (4) Amorphous detritus 6.270 (10) 5.192 (8) 15.779 (18) 13.358 (11) 12.104 (12) 21.478 (11) Fungi 2.229 (2) 2.077 (3) 2.690 (3) 5.772 (5) 3.319 (3) 9.898 (5) Diatoms 0.013 (<1) 0.062 (<1) 0.199 (<1) 3.053 (3) 0.126 (<1) 1.305 (1) Animal 0.000 (0) 0.000 (0) 0.016 (<1) 0.000 (0) 0.024 (<1) 0.013 (<1)
Total 65.919 61.150 87.016 121.170 98.330 199.322
Gatherers Leaves 7.135 (19) 5.381 (12) 7.899 (20) 14.227 (22) 9.440 (21) 26.376 (39) Wood 0.289 (1) 1.285 (3) 0.464 (1) 0.034 (<1) 0.000 (0) 0.369 (1) Amorphous detritus 28.508 (77) 36.126 (84) 30.842 (78) 50.365 (76) 34.140 (77) 39.211 (57) Fungi 0.297 (1) 0.249 (1) 0.332 (1) 0.807 (1) 0.384 (1) 1.530 (2) Diatoms 0.921 (2) 0.218 (1) 0.220 (1) 0.524 (1) 0.431 (1) 0.523 (1) Animal 0.000 (0) 0.000 (0) 0.000 (0) 0.000 (0) 0.000 (0) 0.342 (1)
Total 37.151 43.260 39.757 65.956 44.395 68.351

200
Table 5.5 (cont.)
Pretreatment (year 1)
Nutrient Enrichment (year 2)
Nutrient EnrichmentFunctional group/
Food type Reference Treatment Reference Treatment Reference Treatment Filterers Leaf detritus 1.843 (31) 2.679 (34) 2.211 (36) 3.159 (36) 3.207 (36) 4.117 (37) Wood detritus 0.398 (7) 0.586 (7) 0.204 (3) 0.099 (1) 0.302 (3) 0.395 (4) Amorphous detritus 2.767 (47) 3.498 (44) 3.216 (52) 4.521 (52) 4.878 (55) 4.848 (44) Fungi 0.084 (1) 0.123 (2) 0.095 (2) 0.190 (2) 0.138 (2) 0.277 (3) Diatoms 0.030 (1) 0.064 (1) 0.074 (1) 0.070 (1) 0.064 (1) 0.041 (<1) Animal 0.827 (14) 0.990 (12) 0.358 (6) 0.673 (8) 0.218 (2) 1.335 (12)
Total 5.948 7.940 6.158 8.713 8.806 11.013
Scrapers Leaf detritus 0.004 (<1) 0.045 (16) 0.059 (9) 0.030 (3) 0.008 (2) 0.037 (4) Wood detritus 0.000 (0) 0.001 (<1) 0.000 (0) 0.000 (0) 0.037 (10) 0.000 (0) Amorphous detritus 0.785 (91) 0.221 (77) 0.512 (82) 0.897 (85) 0.238 (69) 0.696 (83) Fungi 0.000 (<1) 0.002 (1) 0.002 (<1) 0.002 (<1) 0.001 (<1) 0.002 (<1) Diatoms 0.076 (8) 0.016 (6) 0.054 (9) 0.124 (12) 0.058 (17) 0.100 (12) Animal 0.000 (0) 0.000 (0) 0.000 (<1) 0.000 (0) 0.000 (0) 0.000 (0)
Total 0.865 0.285 0.628 1.052 0.342 0.834

201
Figure 5.1. Proportion (%) of food resources consumed by invertebrate functional feeding
groups in the reference stream (ref) and the treatment stream (tmt) during the pretreatment period
(pre = average of September 1998 – August 1999 and September 1999 – August 2000), year 1 of
enrichment (enr-1 = September 2000 – August 2001), and year 2 of enrichment (enr 2 =
September 2001 – August 2002).

0
20
40
60
80
100
Pro
po
rtio
n o
f fo
od
re
so
urc
es
in
gu
t (%
)
Pre
Pre
N+
P
En
r1
En
r1 N
+P
En
r2
En
r2 N
+P
0
20
40
60
80
100
Pre
Pre
N+
P
En
r1
En
r1 N
+P
En
r2
En
r2 N
+P
animal
diatom
amorphous detritus
fungi
wood
leaf
Shredders Gatherers
Filterers Scrapers
Pre Enr-1 Enr-2
0
20
40
60
80
100
ref
tmt
ref
tmt
ref
tmt
Pre Enr-1 Enr-2
0
20
40
60
80
100
ref
tmt
ref
tmt
ref
tmt
202

203
Figure 5.2. Invertebrate secondary production (mg m-2 y-1) attributed to food resources among
functional feeding groups in the reference stream (ref) and treatment stream (tmt) during the
pretreatment period (pre = average of September 1998 – August 1999 and September 1999 –
August 2000), year 1 of enrichment (enr-1 = September 2000 – August 2001), and year 2 of
enrichment (enr 2 = September 2001 – August 2002). Note difference in scale among functional
groups.
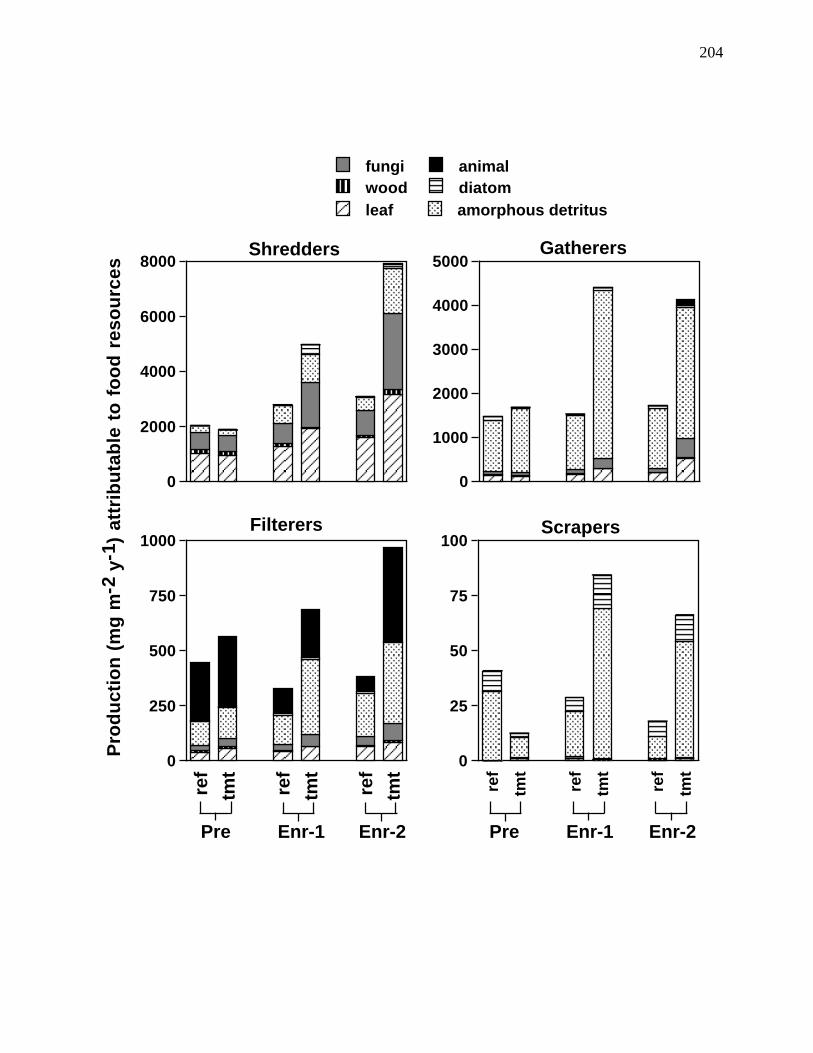
0
2000
4000
6000
8000
animaldiatom
amorphous detritus
fungiwood
leaf
0
1000
2000
3000
4000
5000
0
250
500
750
1000
Pro
du
cti
on
(m
g m
-2 y
-1)
att
rib
uta
ble
to
fo
od
re
so
urc
es
ref
tmt
ref
tmt
ref
tmt
0
25
50
75
100
ref
tmt
ref
tmt
ref
tmt
Shredders Gatherers
Filterers Scrapers
Pre Enr-1 Enr-2 Pre Enr-1 Enr-2
204

205
Figure 5.3. Organic matter flows (g AFDM m-2 y-1) from basal food resources to dominant
invertebrate shredder taxa in the reference stream and the treatment stream during each time
period of the study. Numbers on the left side of each graph indicate the total amount of flows
from basal resources to these shredder taxa. The thickness of arrows is proportional to the
magnitude of flows (see flow key on figure).

206
Shredders (reference stream)
Fattigia LepidostomaTallaperla Leuctra
Leafdetritus
Wooddetritus
DiatomsFungi Animals
Pycnopsyche Tipula Anchytarsus
Fattigia LepidostomaTallaperla Leuctra
Leafdetritus
Wooddetritus
DiatomsFungi Animals
Pycnopsyche Tipula Anchytarsus
Fattigia LepidostomaTallaperla Leuctra
Leafdetritus
Wooddetritus
DiatomsFungi Amorphousdetritus
Animals
Pycnopsyche Tipula Anchytarsus
Pretreatment
Enrichment Year 1
Enrichment Year 2
< 0.1 0.1 – 1.0 1.0 – 5.0 5.0 – 10.0 10.0 – 25.0 25.0 – 50.0 > 50.0
Flows (g m-2 y-1)
65.9
87.0
98.3
Amorphousdetritus
Amorphousdetritus

207
Shredders (treatment stream)
Fattigia LepidostomaTallaperla Leuctra
Leafdetritus
Wooddetritus
DiatomsFungi Animals
Pycnopsyche Tipula Anchytarsus
Fattigia LepidostomaTallaperla Leuctra
Leafdetritus
Wooddetritus
DiatomsFungi Animals
Pycnopsyche Tipula Anchytarsus
Fattigia LepidostomaTallaperla Leuctra
Leafdetritus
Wooddetritus
DiatomsFungi Animals
Pycnopsyche Tipula
Pretreatment
Enrichment Year 1
Enrichment Year 2
Flows (g m-2 y-1)
61.1
121.2
199.3
Amorphousdetritus
Amorphousdetritus (enr)
Amorphousdetritus (enr)
< 0.1 0.1 – 1.0 1.0 – 5.0 5.0 – 10.0 10.0 – 25.0 25.0 – 50.0 > 50.0

208
Figure 5.4. Organic matter flows (g AFDM m-2 y-1) from basal food resources to dominant
invertebrate gatherer taxa in the reference stream and the treatment stream during each time
period of the study. Numbers on the left side of each graph indicate the total amount of flows
from basal resources to these gatherer taxa. The thickness of arrows is proportional to the
magnitude of flows (see flow key on figure).
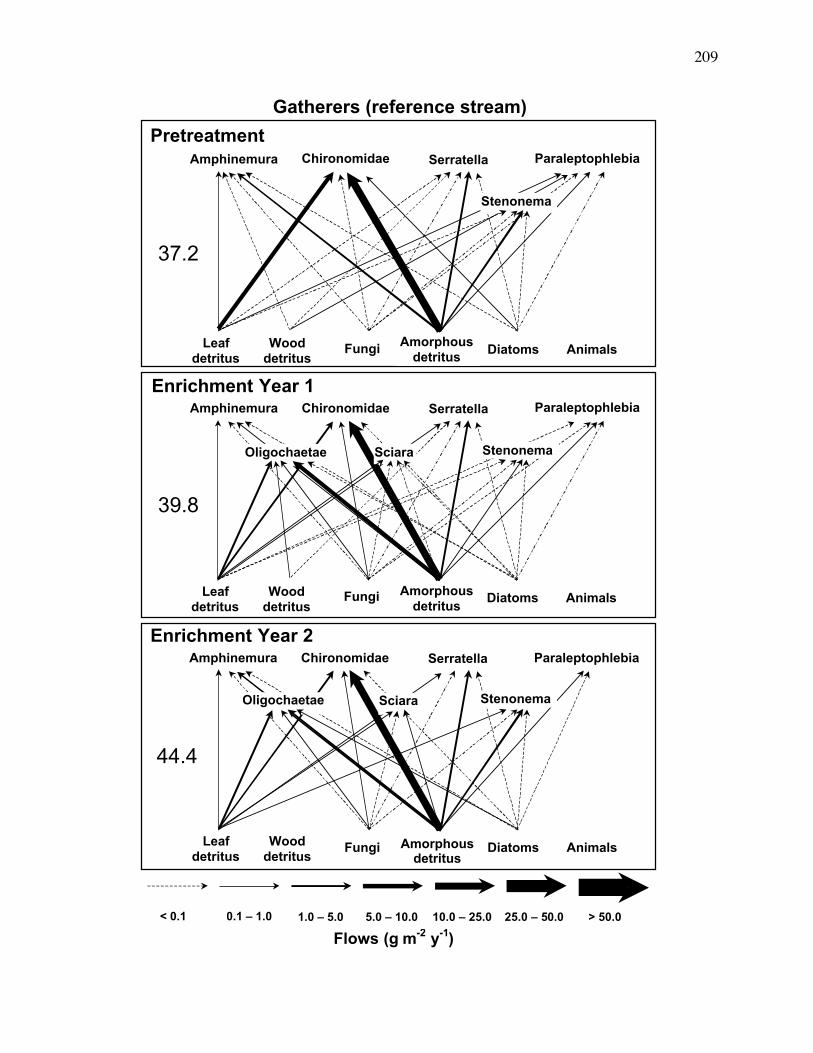
209
Gatherers (reference stream)
Leafdetritus
Wooddetritus
DiatomsFungi Animals
Leafdetritus
Wooddetritus
DiatomsFungi Animals
Chironomidae SerratellaAmphinemura Paraleptophlebia
Leafdetritus
Wooddetritus
DiatomsFungi Animals
Stenonema
Pretreatment
Enrichment Year 1
Enrichment Year 2
Flows (g m-2 y-1)
Chironomidae SerratellaAmphinemura Paraleptophlebia
Oligochaetae Sciara Stenonema
Chironomidae SerratellaAmphinemura Paraleptophlebia
Oligochaetae Sciara Stenonema
37.2
39.8
44.4
Amorphousdetritus
Amorphousdetritus
Amorphousdetritus
< 0.1 0.1 – 1.0 1.0 – 5.0 5.0 – 10.0 10.0 – 25.0 25.0 – 50.0 > 50.0

210
Gatherers (treatment stream)
Leafdetritus
Wooddetritus
DiatomsFungi Animals
Leafdetritus
Wooddetritus
DiatomsFungi Animals
Chironomidae SerratellaAmphinemura Paraleptophlebia
Leafdetritus
Wooddetritus
DiatomsFungi Animals
Oligochaetae Stenonema
Pretreatment
Enrichment Year 1
Enrichment Year 2
Flows (g m-2 y-1)
Chironomidae SerratellaAmphinemura Paraleptophlebia
Oligochaetae Stenonema
Chironomidae SerratellaAmphinemura Paraleptophlebia
Oligochaetae Sciara Stenonema
43.2
66.0
68.4
Amorphousdetritus
Amorphousdetritus (enr)
Amorphousdetritus (enr)
< 0.1 0.1 – 1.0 1.0 – 5.0 5.0 – 10.0 10.0 – 25.0 25.0 – 50.0 > 50.0

211
Figure 5.5. Organic matter flows (g AFDM m-2 y-1) from basal food resources to dominant
invertebrate filterer taxa in the reference stream and the treatment stream during each time period
of the study. Numbers on the left side of each graph indicate the total amount of flows from
basal resources to these filterer taxa. The thickness of arrows is proportional to the magnitude of
flows (see flow key on figure).

212
Filterers (reference stream)
Leafdetritus
Wooddetritus
DiatomsFungi Animals
Leafdetritus
Wooddetritus
DiatomsFungi Animals
Leafdetritus
Wooddetritus
DiatomsFungi Animals
Pretreatment
Enrichment Year 1
Enrichment Year 2
Flows (g m-2 y-1)
Parapsyche WormaldiaDiplectrona Simullidae
Parapsyche WormaldiaDiplectrona Simullidae
ParapsycheDiplectrona Simullidae
5.9
6.2
8.8
Wormaldia
Amorphousdetritus
Amorphousdetritus
Amorphousdetritus
< 0.1 0.1 – 1.0 1.0 – 5.0 5.0 – 10.0 10.0 – 25.0 25.0 – 50.0 > 50.0

213
Filterers (treatment stream)
Leafdetritus
Wooddetritus
DiatomsFungi Animals
Leafdetritus
Wooddetritus
DiatomsFungi Animals
Leafdetritus
Wooddetritus
DiatomsFungi Animals
Pretreatment
Enrichment Year 1
Enrichment Year 2
Flows (g m-2 y-1)
Parapsyche WormaldiaDiplectrona Simullidae
Parapsyche WormaldiaDiplectrona Simullidae
Parapsyche WormaldiaDiplectrona Simullidae
7.9
8.7
11.0
Amorphousdetritus
Amorphousdetritus (enr)
Amorphousdetritus (enr)
< 0.1 0.1 – 1.0 1.0 – 5.0 5.0 – 10.0 10.0 – 25.0 25.0 – 50.0 > 50.0

214
Figure 5.6. Organic matter flows (g AFDM m-2 y-1) from basal food resources to dominant
invertebrate scraper taxa in the reference stream and the treatment stream during each time
period of the study. Numbers on the left side of each graph indicate the total amount of flows
from basal resources to these scraper taxa. The thickness of arrows is proportional to the
magnitude of flows (see flow key on figure).

215
Scrapers (reference stream)
Leafdetritus
Wooddetritus
DiatomsFungi Bacteria Animals
Leafdetritus
Wooddetritus
DiatomsFungi Bacteria Animals
Leafdetritus
Wooddetritus
DiatomsFungi Bacteria Animals
Pretreatment
Enrichment Year 1
Enrichment Year 2
Flows (g m-2 y-1)
Epeorus EctopriaBaetis Neophylax
Epeorus Ectopria Neophylax
Epeorus Ectopria Neophylax
0.86
0.63
0.34
Amorphousdetritus
Amorphousdetritus
Amorphousdetritus
< 0.1 0.1 – 1.0 1.0 – 5.0 5.0 – 10.0 10.0 – 25.0 25.0 – 50.0 > 50.0

216
Scrapers (treatment stream)
Leafdetritus
Wooddetritus
DiatomsFungi Animals
Leafdetritus
Wooddetritus
DiatomsFungi Animals
Leafdetritus
Wooddetritus
DiatomsFungi Animals
Pretreatment
Enrichment Year 1
Enrichment Year 2
Flows (g m-2 y-1)
EpeorusBaetis
Epeorus Ectopria Neophylax
Epeorus EctopriaBaetis Neophylax
0.29
1.1
0.83
Amorphousdetritus
Amorphousdetritus (enr)
Amorphousdetritus (enr)
< 0.1 0.1 – 1.0 1.0 – 5.0 5.0 – 10.0 10.0 – 25.0 25.0 – 50.0 > 50.0

217
Figure 5.7. Organic matter flows (g AFDM m-2 y-1) from animal prey to dominant predator taxa
in the reference stream and the treatment stream during each time period of the study. Numbers
on the left side of each graph indicate the total amount of flows from basal resources to these
scraper taxa; numbers in parentheses indicate the percentage of total prey production consumed
by these predators. The thickness of arrows is proportional to the magnitude of flows (see flow
key on figure).

218
Predators (reference stream)
Isoperla Cordulegaster
Hexatoma
Rhyacophila
Animals
Ceratopogoniadae
Beloneuria Lanthus
Pretreatment
Enrichment Year 1
Enrichment Year 2
< 0.1 0.1 – 1.0 1.0 – 5.0 5.0 – 10.0 10.0 – 25.0 25.0 – 50.0 > 50.0
Flows (g m-2 y-1)
Isoperla Cordulegaster
Hexatoma
Rhyacophila
Animals
Ceratopogoniadae
Beloneuria Lanthus
Isoperla Cordulegaster
Hexatoma
Rhyacophila
Animals
Ceratopogoniadae
Beloneuria Lanthus
Salamanders
Salamanders
Salamanders
6.3(79%)
6.5(81%)
5.7(71%)

219
Predators (enriched stream)
Isoperla Cordulegaster
Hexatoma
Rhyacophila
Animals
Ceratopogoniadae
Beloneuria Lanthus
Pretreatment
Enrichment Year 1
Enrichment Year 2
< 0.1 0.1 – 1.0 1.0 – 5.0 5.0 – 10.0 10.0 – 25.0 25.0 – 50.0 > 50.0
Flows (g m-2 y-1)
Isoperla Cordulegaster
Hexatoma
Rhyacophila
Animals
Ceratopogoniadae
Beloneuria Lanthus
Isoperla Cordulegaster
Hexatoma
Rhyacophila
Animals
Ceratopogoniadae
Beloneuria Lanthus
Salamanders
Salamanders
Salamanders
5.8(85%)
10.1(64%)
8.3(47%)

220
Figure 5.8. Percent of annual inputs of leaf litter, wood, fungi, FBOM (standing stock), diatoms,
and animals consumed by invertebrates in the reference stream (white bars) and treatment stream
(grey bars) during each time period of the study. pre = average of September 1998 – August
1999 and September 1999 – August 2000, enr-1 = September 2000 – August 2001, enr 2 =
September 2001 – August 2002).

221
0
10
20
30
40
50
60
70
80
% o
f a
nn
ua
l in
pu
ts c
on
su
me
d b
y i
nv
ert
eb
rate
s
pre
en
r-1
en
r-2
pre
en
r-1
en
r-2
pre
en
r-1
en
r-2
pre
en
r-1
en
r-2
pre
en
r-1
en
r-2
pre
en
r-1
en
r-2
treatment stream
reference stream
leaves wood fungi FBOM diatoms animals

222
CHAPTER 6
GENERAL CONCLUSIONS
Until recently, next to nothing was known about the effects of nutrient enrichment on
consumers in detritus-based stream ecosystems. Although considerable previous research has
examined effects of enrichment at the basal resource level (i.e., detritus and associated
microbes), few attempts have been made to link basal resource changes to population/community
dynamics and energetics of macro-consumers (Rosemond et al. 2001, 2002, Ramirez and
Pringle, in review). Moreover, to this point, studies addressing this issue have been relatively
short in duration (e.g., Pearson and Connolly 2000, Rosemond et al. 2001). This dissertation was
an attempt to examine in detail the response of detritus-based stream invertebrates to nutrient
enrichment using a variety of methodological approaches. All dissertation research fell within
the context of a large-scale experimental manipulation of a headwater stream at Coweeta
Hydrologic Laboratory. It was my hope that multiple studies at a variety of hierarchical scales
would help clarify mechanisms by which individuals, populations, and communities may be
affected by enrichment. My specific objectives were to examine effects of nutrient enrichment
on 1) elemental composition and stoichiometric relationships of consumers and basal resources
(Chapter 2), 2) individual growth rates and production of 2 dominant detritivores (Chapter 3), 3)
whole-community invertebrate secondary production and organic matter dynamics (Chapter 4),
and 4) trophic basis of production and organic matter flow food webs (Chapter 5). Each of these
studies provided a unique ‘lens’ through which to examine enrichment effects, and all led to new
insight as well as important questions for future study.

223
Before discussing the general conclusions of my dissertation, it is important to briefly
mention major results from concurrent studies during the nutrient enrichment to provide context.
Most noteworthy were nutrient-induced changes that occurred at the base of the food web.
Enrichment led to significantly higher bacterial and fungal production on leaf litter, as well as
increased leaf respiration rates (K. Suberkropp, University of Alabama, unpublished, Greenwood
2004). As well, enrichment accelerated decomposition rates of leaves and wood (Gulis and
Suberkropp 2003, V. Gulis and K. Suberkropp, University of Alabama, unpublished, Greenwood
2004), and increased epilithic chlorophyll a levels during spring months (Greenwood 2004).
Lastly, enrichment led to increased downstream export of fine particulate organic matter (A. D.
Rosemond, unpublished data). Carbon budgets are currently being constructed for both streams
and will shed considerable light on ecosystem-level effects of enrichment on carbon cycling in
detritus-based streams. These changes to basal resources all had important implications for the
structure and productivity of invertebrate communities.
In the first study chapter (2), I set out to test some of the basic tenets of ecological
stoichiometry (e.g, Sterner and Elser 2002). This was a unique and timely study because
virtually no previous work had addressed consumer-resource stoichiometry in detritus-based
ecosystems. Additionally, very few studies had described the elemental composition of insect
(as opposed to crustacean) consumers. This research led to a number of important results that
provide a framework for further hypothesis testing. First, and least surprising, enrichment led to
increased nutrient content of stream basal food resources (i.e., leaf litter, FBOM, and epilithon).
However, contrary to my predictions, this effect appeared to be transferred to higher trophic
levels. Carbon:P and N:P ratios of some consumers (primarily Trichoptera) were up to 4-fold
lower in the treatment stream than in the reference stream during enrichment. This result

224
demonstrated that some insects may be much more plastic (i.e., less homeostatic) with regard to
their elemental composition (particularly P content) than other well-studied invertebrates such as
cladocerans and copepods (e.g., Elser and Urabe 1999). Another surprise from this work was
that average molar C:P and N:P ratios of invertebrates were much higher than any other
invertebrate community reported in the literature. Interestingly, all other published values came
from invertebrate communities based on plants or algae. An intriguing hypothesis is that low
body P (or high C:P and N:P ratios) is an evolutionary adaptation of detritus-based consumers to
low nutrient content of detritus. This idea will undoubtedly require much further testing.
Chapter 3 was aimed at understanding nutrient effects at the individual- and population-
level by way of growth rate measurements and quantitative benthic sampling. The approach was
to examine the response of taxa that occupy disparate ends of the ‘slow-fast’ life-history
continuum (i.e., r- versus K-selected), and have different feeding behaviors (i.e., fine particulate
organic matter vs. leaf litter). I examined field growth rates of 2 common detritivores (non-
Tanypodinae chironomids and peltoperlid stoneflies) seasonally in both streams before and
during the enrichment. By examining taxon-level responses (abundance, biomass and secondary
production) on a per square meter basis, as well as on a per gram organic matter basis (i.e., per
gram leaf litter or fine benthic organic matter), I was able to somewhat tease apart the effects
nutrient-induced changes to food quantity versus food quality on consumer growth and
production. Results from this study suggest an important interaction between larval lifespan and
feeding behavior in determining species-specific responses to enrichment. Larval lifespan was
apparently important in determining the response of leaf-eating consumers because long-lived
taxa are highly susceptible to nutrient-induced food depletion. In contrast, larval lifespan was

225
less important in determining the response of fine particulate feeders (i.e., gatherers) because
their food supply is abundant and unaffected by enrichment.
Chapter 4 addressed community-level responses to nutrient enrichment as well as
dynamics of benthic organic matter. This study, to my knowledge, is the first to quantify effects
of enrichment on whole-assemblage secondary production in a detritus-based ecosystem. Here, I
showed that total secondary production increased drastically in the treatment stream during
enrichment, reaching the highest levels of secondary production recorded for streams at
Coweeta. This response, however, was largely restricted to the dominant habitat (i.e., mixed
substrate). Interestingly, production increased in the treatment stream despite a significant
decline in benthic leaf litter (a dominant food resource), suggesting higher assimilation of leaf
litter and other basal resources by detritivores during enrichment. Predator production also
appeared to track increased availability of prey, but their ability to track prey production declined
during the final year of study. Finally, years of enrichment were statistical outliers when plotted
with long-term relationships between benthic organic matter and secondary production from
streams at Coweeta. Important questions remain concerning the sustainability of this positive
effect.
The final chapter (5) examined the effects of enrichment on invertebrate trophic basis of
production and organic matter flow food webs. This chapter complemented the others by
exploring the mechanistic basis for changes in secondary production through gut-content
analysis. Originally, I hypothesized that consumer diets would shift to reflect changes in
resource availability (e.g., increased fungi or algae, decreased leaf litter). Surprisingly, I found
no large differences in the diets of primary consumers between streams before and during

226
enrichment. Trophic support for primary consumers was predominantly based on amorphous
detritus, leaf litter, and fungi and was unaffected by enrichment.
Although there was little effect of enrichment on the diets of consumers, I observed large
effects on total organic matter flows to primary consumers. Were such large differences caused
by relatively small between-stream differences in microbial biomass associated with detritus?
Simple calculations revealed that small changes in microbial biomass could not possibly account
for observed differences in secondary production and organic matter flows. This is an important
result because it suggests that increased microbial activity and detrital degradation associated
with nutrient enrichment increases the assimilability of detrital carbon for consumers. This is a
slightly different mechanism than the commonly-held view that consumers primarily benefit
from increased microbial biomass associated with detritus. These results, in combination with
Chapter 2, also suggest that increased flows and secondary production may have been due to
nutrient-induced reductions in consumer-resource elemental imbalances.
Taken together, the chapters of this dissertation demonstrate for the first time that nutrient
enrichment can have strong effects on macro-consumers through changes in the quality and
quantity of detrital resources. Results provide empirical support for conceptual theory that
enrichment or increased resource productivity should positively influence consumers at all
trophic positions (e.g., Polis and Strong). Nonetheless, interesting differences in response to
enrichment occurred among taxa in relation to dominant life history characteristics. This
dissertation should provide solid predictions for how landscape-scale nutrient enrichment may
affect community structure, production, and material cycling. A productive avenue for future
research will be testing whether results from this empirical study accurately predict the structure
and production of invertebrate communities across a gradient of enrichment in forested streams.

227
Although the majority of nutrient effects on invertebrate productivity were positive, it is my hope
that resource managers and policy makers will strongly consider potential long-term effects of
enrichment on community structure (i.e., declines in biodiversity) and carbon loss from forested
headwater streams.
Literature cited
Elser, J. J., and J. Urabe. 1999. The stoichiometry of consumer-driven nutrient recycling:
theory, observations, and consequences. Ecology 80:735-751.
Greenwood, J. 2004. The response of heterotrophic and autotrophic resources to a long-term
nutrient enrichment in an Appalachian headwater stream ecosystem. Dissertation.
University of Georgia, Athens, GA, USA.
Gulis, V. and K. Suberkropp. 2003. Leaf litter decomposition and microbial activity in nutrient-
enriched and unaltered reaches of a headwater stream. Freshwater Biology 48:123-134.
Hall, R. O. and J. L. Meyer. 1998. The trophic significance of bacteria in a detritus-based
stream food web. Ecology 79:1995-2012.
Pearson, R. G. and N. M. Connolly. 2000. Nutrient enhancement, food quality and community
dynamics in a tropical rainforest stream. Freshwater Biology 43:31-42.
Polis, G. A. and D. R. Strong. 1996. Food web complexity and community dynamics.
American Naturalist 147:813-846.
Ramirez, A. and C. M. Pringle. In review. Response of detrital consumers to phosphorus levels
in lowland tropical streams.
Rosemond, A. D., C. M. Pringle, A. Ramirez, and M. J. Paul. 2001. A test of top-down and
bottom-up control in a detritus-based food web. Ecology 82:2279-2293.

228
Rosemond, A. D., C. M. Pringle, A. Ramirez, M. J. Paul, and J. L. Meyer. 2002. Landscape
variation in phosphorus concentration and effects on detritus-based tropical streams.
Limnology and Oceanography 47:278-289.
Sterner R.W. and J. J. Elser. 2002. Ecological Stoichiometry. Princeton University Press,
Princeton, USA.


230
Appendix A. (Continued)
treatment dates of incubationmm(i)
mm(f)
T(°C)
degreedays g n (i) n (f)
%mortality
%mortality/d
Treatment 53 17 Mar - 30 Mar 2001 2.82 3.33 8.5 119 0.038 31 16 48.4 3.7Treatment 53 17 Jun - 27 Jun 2001 2.04 2.33 15.1 166 0.054 49 19 61.2 6.1Treatment 53 17 Jun - 27 Jun 2001 3.46 3.84 15.1 166 0.030 15 2 86.7 8.7Treatment 53 14 Aug - 22 Aug 2001 1.21 1.38 17.1 154 0.059 59 10 83.1 10.4Treatment 53 14 Aug - 22 Aug 2001 1.89 2.04 17.1 154 0.030 40 21 47.5 5.9Treatment 53 5 Dec - 20 Dec 2001 1.22 1.73 11.3 181 0.067 51 32 37.3 2.5Treatment 53 5 Dec - 20 Dec 2001 1.83 2.19 11.3 181 0.035 68 27 60.3 4.0Treatment 53 5 Dec - 20 Dec 2001 2.99 3.34 11.3 181 0.023 17 9 47.1 3.1Treatment 53 20 Jun - 2 Jul 2002 1.23 1.80 15.6 203 0.086 50 3 94.0 7.8Treatment 53 20 Jun - 2 Jul 2002 3.06 4.37 15.6 203 0.081 21 5 76.2 6.3Treatment 54 9 Sep - 17 Sep 2000 1.25 1.92 15.5 140 0.146 41 4 90.2 11.3Treatment 54 9 Sep - 17 Sep 2000 2.14 2.76 15.5 140 0.094 50 10 80.0 10.0Treatment 54 9 Sep - 17 Sep 2000 2.93 3.50 15.5 140 0.061 42 14 66.7 8.3Treatment 54 8 Dec - 20 Dec 2000 1.25 2.18 6.7 87 0.134 62 14 77.4 6.5Treatment 54 8 Dec - 20 Dec 2000 1.86 2.62 6.7 87 0.083 86 28 67.4 5.6Treatment 54 8 Dec - 20 Dec 2000 2.59 3.58 6.7 87 0.073 13 5 61.5 5.1Treatment 54 17 Mar - 30 Mar 2001 1.30 1.96 8.2 115 0.092 50 15 70.0 5.4Treatment 54 17 Mar - 30 Mar 2001 1.99 2.64 8.2 115 0.062 63 31 50.8 3.9Treatment 54 17 Mar - 30 Mar 2001 2.86 3.55 8.2 115 0.047 44 19 56.8 4.4Treatment 54 17 Jun - 27 Jun 2001 1.25 1.82 14.4 159 0.127 33 2 93.9 9.4Treatment 54 14 Aug - 22 Aug 2001 1.21 1.86 16.2 146 0.153 70 4 94.3 11.8Treatment 54 14 Aug - 22 Aug 2001 1.91 2.42 16.2 146 0.080 60 14 76.7 9.6Treatment 54 14 Aug - 22 Aug 2001 3.18 3.87 16.2 146 0.066 21 3 85.7 10.7Treatment 54 5 Dec - 20 Dec 2001 1.20 2.30 11.4 182 0.124 68 37 45.6 3.0Treatment 54 5 Dec - 20 Dec 2001 1.80 2.64 11.4 182 0.075 80 12 85.0 5.7Treatment 54 5 Dec - 20 Dec 2001 3.12 3.92 11.4 182 0.044 20 10 50.0 3.3Treatment 54 20 Jun - 2 Jul 2002 1.95 2.86 15.0 195 0.088 32 3 90.6 7.6

231
Appendix A. (Continued)
treatment dates of incubationmm(i)
mm(f)
T(°C)
degreedays g n (i) n (f)
%mortality
%mortality/d
Tallaperla spp.
Pretreat 53 3 Nov 99 - 9 Jan 00 4.30 4.94 9.3 634 0.0031 30 22 26.7 0.4Pretreat 53 3 Nov 99 - 9 Jan 00 8.30 8.52 9.3 634 0.0012 15 9 40.0 0.6Pretreat 53 7 Feb 00 - 3 Apr 00 4.50 5.34 9.8 559 0.0085 40 21 47.5 0.8Pretreat 53 7 Feb 00 - 3 Apr 00 6.20 6.86 9.8 559 0.0050 27 24 11.1 0.2Pretreat 53 23 Apr 00 - 20 Jun 00 3.20 3.95 14 827 0.0103 36 33 8.3 0.1Pretreat 53 23 Apr 00 - 20 Jun 00 5.30 6.23 14 827 0.0081 30 22 26.7 0.5Pretreat 54 3 Nov 99 - 9 Jan 00 4.30 5.22 10.1 688 0.0087 30 10 66.7 1.0Pretreat 54 3 Nov 99 - 9 Jan 00 8.20 8.24 10.1 688 0.0002 17 9 47.1 0.7Pretreat 54 7 Feb 00 - 3 Apr 00 4.50 5.28 9.6 549 0.0083 40 27 32.5 0.6Pretreat 54 7 Feb 00 - 3 Apr 00 6.20 7.02 9.6 549 0.0067 26 21 19.2 0.3Pretreat 54 23 Apr 00 - 20 Jun 00 3.30 3.80 13.5 798 0.0068 35 33 5.7 0.1Pretreat 54 23 Apr 00 - 20 Jun 00 5.20 5.98 13.5 798 0.0068 30 25 16.7 0.3
Treatment 53 26 Jul 00 - 29 Sep 00 2.80 3.62 16.7 1100 0.0118 20 7 65.0 1.0Treatment 53 26 Jul 00 - 29 Sep 00 5.66 6.22 16.7 1100 0.0042 18 7 61.1 0.9Treatment 53 26 Jul 00- 29 Sep 00 6.69 6.84 16.7 1100 0.0010 5 4 20.0 0.3Treatment 53 6 Nov 00 - 10 Jan 01 4.72 5.44 6.2 412 0.0064 9 5 44.4 0.7Treatment 53 6 Nov 00 - 10 Jan 01 6.25 6.54 6.2 412 0.0025 35 30 14.3 0.2Treatment 53 6 Nov 00 - 10 Jan 01 9.13 9.32 6.2 412 0.0009 6 2 66.7 1.0Treatment 53 10 Feb 01- 12 Apr 01 1.95 2.19 9.4 584 0.0052 39 23 41.0 0.7Treatment 53 10 Feb 01 - 12 Apr 01 5.60 6.29 9.4 584 0.0054 25 23 8.0 0.1Treatment 53 10 Feb 01 - 12 Apr 01 7.60 7.75 9.4 584 0.0009 10 7 30.0 0.5Treatment 53 20 May 01 - 13 Jul 01 4.07 4.72 14.8 813 0.0077 30 13 56.7 1.0Treatment 53 20 May 01 - 13 Jul 01 6.17 7.33 14.8 813 0.0092 20 8 60.0 1.1Treatment 53 4 Sep 01 - 7 Nov 01 4.82 5.54 13.3 784 0.0061 20 14 30.0 0.5Treatment 54 26 Jul 00 - 29 Sep 00 5.60 5.81 15.8 1046 0.0019 21 11 47.6 0.7Treatment 54 6 Nov 00 - 10 Jan 01 6.34 6.76 6.4 422 0.0032 30 6 80.0 1.2Treatment 54 10 Feb 01 - 12 Apr 01 1.95 2.56 8.9 551 0.0130 40 13 67.5 1.1

232
Appendix A. (Continued)
treatment dates of incubationmm(i)
mm(f)
T(°C)
degreedays g n (i) n (f)
%mortality
%mortality/d
Treatment 54 10 Feb 01 - 12 Apr 01 5.50 6.41 8.9 551 0.0069 25 12 52.0 0.9Treatment 54 10 Feb 01 - 12 Apr 01 8.10 8.10 8.9 551 0.0000 14 12 14.3 0.2Treatment 54 20 May 01 - 13 Jul 01 4.04 4.81 14.1 774 0.0094 30 8 73.3 1.4Treatment 54 20 May 01 - 13 Jul 01 6.16 7.87 14.1 774 0.0107 20 7 65.0 1.2Treatment 54 4 Sep 01 - 7 Nov 01 2.42 3.37 13.5 799 0.0151 27 3 88.9 1.4Treatment 54 4 Sep 01 - 7 Nov 01 4.71 5.82 13.5 799 0.0096 20 10 50.0 0.8

233
Appendix B. Abundance, biomass, and secondary production data. Mean annual abundance (A, no./m2), biomass (B, mg AFDMm-2), and production (P, mg AFDM m-2 y-1) of taxa in each functional feeding group in mixed substrate and bedrock outcrop habitats inthe reference stream (C53) and the treatment stream (C54). Insect orders are as follows: E = Ephemeroptera, P = Plecoptera, T =Trichoptera, C = Coleoptera, O = Odonata, and NI = non-insect. CPI = cohort production interval (Benke 1979) in days or, wherenoted, the assumed annual P/B value that was used for production calculations. Years are as follows: Pre-2 = September 1998 –August 1999, Pre-3 = September 1999 – August 2000, Enr-1 = September 2000 – August 2001, Enr-2 = September 2001 – August2002. Pre-1 data (October 1984 – September 1985) can be found in Lugthart and Wallace 1992.
Mixed Substrate Bedrock OutcropsFunctional group ortaxon
CPI Order Site Year A B P A B P
Scrapers Epeorus sp. 340 E C53 Pre 2 1 7 13 6 1 8
Pre 3 34 2 6 16 8 29Enr 1 0 0 0 14 5 41Enr 2 0 0 0 4 1 8
C54 Pre 2 0 0 0 2 <1 6Pre 3 4 <1 1 11 11 23Enr 1 4 16 19 18 53 146Enr 2 0 0 0 32 30 127
Baetis sp. 120 E C53 Pre 2 0 0 0 22 0 4Pre 3 0 0 0 132 2 36Enr 1 0 0 0 66 1 16Enr 2 17 <1 2 94 5 70
C54 Pre 2 0 0 0 36 1 20Pre 3 9 <1 1 41 1 18Enr 1 0 0 0 23 <1 6Enr 2 0 0 0 77 2 25

234
Appendix B (cont.)Mixed Substrate Bedrock Outcrops
Functional group ortaxon
CPI Order Site Year A B P A B P
Hydroptila sp. 365 T C53 Pre 2 0 0 0 26 4 9Pre 3 33 6 6 48 8 16Enr 1 4 1 2 58 10 19Enr 2 33 6 7 86 14 16
C54 Pre 2 0 0 0 56 9 15Pre 3 1 <1 <1 123 21 30Enr 1 0 0 0 58 10 20Enr 2 0 0 0 10 2 1
Neophylax sp. 213 T C53 Pre 2 0 0 0 13 0 2Pre 3 1 0 0 9 0 1Enr 1 1 <1 1 11 <1 1Enr 2 0 0 0 40 <1 4
C54 Pre 2 0 0 0 23 <1 3Pre 3 1 <1 2 12 2 10Enr 1 2 <1 2 43 1 12Enr 2 1 <1 <1 171 3 28
Ectopria sp. 365 C C53 Pre 2 7 2 12 26 5 25Pre 3 10 1 7 90 22 94Enr 1 6 1 3 61 16 54Enr 2 7 3 8 32 15 34
C54 Pre 2 2 <1 2 10 2 8Pre 3 5 2 4 6 8 14Enr 1 11 <1 3 60 15 38Enr 2 0 0 0 15 3 8

235
Appendix B (cont.)Mixed Substrate Bedrock Outcrops
Functional group ortaxon
CPI Order Site Year A B P A B P
Elmidae 365 C C53 Pre 2 0 0 0 20 1 3Pre 3 33 0 1 0 0 0Enr 1 0 0 0 0 0 0Enr 2 2 <1 <1 1 <1 <1
C54 Pre 2 0 0 0 6 <1 <1Pre 3 9 <1 1 7 1 1Enr 1 0 0 0 7 <1 1Enr 2 11 <1 1 3 <1 <1
Total Scapers C53 Pre 2 8 9 25 112 10 50Pre 3 112 9 19 294 39 175Enr 1 10 1 6 209 31 131Enr 2 60 8 16 257 36 131
C54 Pre 2 2 0 2 133 13 52Pre 3 29 2 9 200 44 96Enr 1 17 17 24 211 79 222Enr 2 12 1 1 308 40 190
Leuctra spp. 340 P C53 Pre 2 918 49 180 30 1 3Pre 3 1539 73 392 49 2 9Enr 1 1271 41 304 119 2 17Enr 2 1454 55 382 395 11 106
C54 Pre 2 297 17 99 116 4 26Pre 3 750 31 120 78 5 28Enr 1 3847 145 1145 83 5 29Enr 2 1056 55 349 43 1 12

236
Appendix B (cont.)Mixed Substrate Bedrock Outcrops
Functional group ortaxon
CPI Order Site Year A B P A B P
Tallaperla spp. 540 P C53 Pre 2 785 92 218 306 45 143Pre 3 1574 127 334 251 54 160Enr 1 573 161 442 465 96 275Enr 2 613 173 360 622 112 333
C54 Pre 2 239 51 81 292 37 90Pre 3 511 107 222 295 50 135Enr 1 681 171 335 258 35 91Enr 2 385 113 227 191 32 80
Lepidostoma spp. 246 T C53 Pre 2 196 19 144 19 <1 4Pre 3 592 46 387 6 <1 2Enr 1 607 39 381 13 1 7Enr 2 615 76 667 31 1 14
C54 Pre 2 171 6 54 26 <1 4Pre 3 396 74 533 9 <1 2Enr 1 365 109 725 16 <1 3Enr 2 402 83 765 65 2 25
Pycnopsyche spp. 275 T C53 Pre 2 323 63 895 47 6 94Pre 3 92 34 367 4 1 15Enr 1 318 95 706 15 <1 88Enr 2 263 88 680 72 1 61
C54 Pre 2 520 137 1349 60 2 76Pre 3 213 192 1356 6 0 5Enr 1 775 557 3497 10 0.2 115Enr 2 567 1152 8482 44 4 111

237
Appendix B (cont.)Mixed Substrate Bedrock Outcrops
Functional group ortaxon
CPI Order Site Year A B P A B P
Fattigia pele 664 T C53 Pre 2 112 158 233 0 0 0Pre 3 64 74 194 0 0 0Enr 1 95 133 306 0 0 0Enr 2 143 135 323 0 0 0
C54 Pre 2 167 55 152 0 0 0Pre 3 105 111 263 0 0 0Enr 1 264 149 435 0 0 0Enr 2 136 116 336 0 0 0
Psilotreta sp. 335 T C53 Pre 2 35 10 33 0 0 0Pre 3 15 7 26 0 0 0Enr 1 3 9 19 0 0 0Enr 2 5 5 20 0 0 0
C54 Pre 2 2 1 3 1 <1 <1Pre 3 10 11 55 0 0 0Enr 1 16 15 77 0 0 0Enr 2 15 41 100 0 0 0
Molophilus sp. 365 D C53 Pre 2 555 64 318 1 <1 1Pre 3 446 60 307 0 0 0Enr 1 189 33 179 1 1 4Enr 2 207 39 237 0 0 0
C54 Pre 2 116 23 86 0 0 0Pre 3 199 55 223 10 <1 1Enr 1 327 97 455 0 0 0Enr 2 156 70 325 6 0 5

238
Appendix B (cont.)Mixed Substrate Bedrock Outcrops
Functional group ortaxon
CPI Order Site Year A B P A B P
Tipula sp. 310 D C53 Pre 2 31 220 961 1 7 48Pre 3 45 190 1018 5 10 81Enr 1 55 230 1406 15 47 323Enr 2 67 261 1583 18 38 98
C54 Pre 2 44 134 721 3 14 109Pre 3 39 98 512 5 11 83Enr 1 63 233 1382 1 4 16Enr 2 75 328 1818 4 8 77
Lipsothrix sp. *5 D C53 Pre 2 1 2 8 0 0 0Pre 3 4 6 28 0 0 0Enr 1 1 <1 1 0 0 0Enr 2 0 0 0 0 0 0
C54 Pre 2 1 3 14 0 0 0Pre 3 0 0 0 0 0 0Enr 1 4 15 74 0 0 0Enr 2 0 0 0 0 0 0
Limonia sp. 340 D C53 Pre 2 2 1 3 0 0 0Pre 3 1 <1 1 0 0 0Enr 1 12 6 25 0 0 0Enr 2 9 6 24 0 0 0
C54 Pre 2 9 <1 2 0 0 0Pre 3 0 0 0 0 0 0Enr 1 7 3 10 0 0 0Enr 2 6 6 19 10 <1 2

239
Appendix B (cont.)Mixed Substrate Bedrock Outcrops
Functional group ortaxon
CPI Order Site Year A B P A B P
Anchytarsus sp. 1095 C C53 Pre 2 7 3 5 2 1 2Pre 3 23 7 13 0 0 0Enr 1 4 5 1 0 0 0Enr 2 13 10 14 0 0 0
C54 Pre 2 6 1 4 0 0 0Pre 3 5 8 10 0 0 0Enr 1 57 10 1 0 0 0Enr 2 8 6 8 0 0 0
Cambarus bartoni *5 NI C53 Pre 2 4 349 203 0 0 0Pre 3 8 715 415 0 0 0Enr 1 6 118 68 0 0 0Enr 2 3 119 69 0 0 0
C54 Pre 2 0 0 0 0 0 0Pre 3 2 249 144 0 0 0Enr 1 0 0 0 0 0 0Enr 2 0 0 0 0 0 0
Total Shredders C C53 Pre 2 2975 681 3198 406 59 407Pre 3 4393 623 3434 315 67 376Enr 1 3127 751 3327 628 147 438Enr 2 3387 849 4768 1139 164 1024
C54 Pre 2 1572 428 2636 499 59 395Pre 3 2229 686 3531 403 67 395Enr 1 6403 1504 7802 368 44 163Enr 2 2805 1970 12805 362 47 410

240
Appendix B (cont.)Mixed Substrate Bedrock Outcrops
Functional group ortaxon
CPI Order Site Year A B P A B P
Paraleptophlebia sp. 340 E C53 Pre 2 210 6 38 18 4 19Pre 3 265 15 109 11 1 8Enr 1 59 1 7 9 <1 1Enr 2 76 7 27 0 0 0
C54 Pre 2 89 4 26 53 3 17Pre 3 140 12 65 86 3 27Enr 1 148 9 56 1 0 1Enr 2 142 13 56 29 1 4
Serratella sp. 330 E C53 Pre 2 0 0 0 165 30 174Pre 3 129 4 51 99 24 154Enr 1 33 <1 9 156 28 218Enr 2 4 0 1 242 32 299
C54 Pre 2 27 1 42 400 33 189Pre 3 61 1 10 383 93 541Enr 1 31 4 19 623 221 1216Enr 2 52 9 57 459 89 596
Stenonema sp. 340 E C53 Pre 2 86 14 71 26 0 8Pre 3 129 21 120 1 <1 <1Enr 1 2 <1 3 44 11 43Enr 2 41 18 67 0 0 0
C54 Pre 2 17 4 25 1 <1 1Pre 3 9 8 37 5 1 6Enr 1 18 23 84 0 0 0Enr 2 82 53 234 6 1 4

241
Appendix B (cont.)Mixed Substrate Bedrock Outcrops
Functional group ortaxon
CPI Order Site Year A B P A B P
Amphinemura sp. 300 P C53 Pre 2 107 1 15 441 14 99Pre 3 211 10 66 297 25 136Enr 1 49 2 16 339 12 110Enr 2 188 5 79 479 25 283
C54 Pre 2 45 1 10 746 27 169Pre 3 131 8 22 959 33 254Enr 1 327 26 139 1298 52 474Enr 2 918 97 975 1101 44 488
Soyedina sp. 300 P C53 Pre 2 4 0 0 0 0 0Pre 3 0 0 0 0 0 0Enr 1 5 1 7 2 <1 3Enr 2 48 8 51 2 1 5
C54 Pre 2 0 0 0 1 <1 0Pre 3 0 0 0 0 0 0Enr 1 42 3 15 0 0 0Enr 2 53 11 54 6 1 3
Lype diversa 332 T C53 Pre 2 64 4 19 0 0 0Pre 3 258 12 71 1 <1 0Enr 1 58 7 48 4 <1 <1Enr 2 48 5 38 3 0 1
C54 Pre 2 22 5 19 0 0 0Pre 3 41 4 24 0 0 0Enr 1 34 15 66 1 <1 1Enr 2 113 31 163 1 <1 2

242
Appendix B (cont.)Mixed Substrate Bedrock Outcrops
Functional group ortaxon
CPI Order Site Year A B P A B P
Chironomidae ‡ D C53 Pre 2 42495 109 1005 9164 18 293 (non-Tanypodinae) Pre 3 50931 134 1704 7997 18 322
Enr 1 32079 83 1261 7422 19 333Enr 2 32143 98 1279 12751 35 582
C54 Pre 2 19252 80 803 12393 30 480Pre 3 30658 194 1457 18214 43 854Enr 1 58493 204 3968 15240 44 1097Enr 2 41919 180 2817 11389 28 764
Leptotarus sp. 365 D C53 Pre 2 13 107 536 0 0 0Pre 3 8 104 545 0 0 0Enr 1 2 162 1095 0 0 0Enr 2 0 0 0 0 0 0
C54 Pre 2 2 28 95 0 0 0Pre 3 1 48 435 0 0 0Enr 1 6 40 205 0 0 0Enr 2 11 71 260 0 0 0
Nymphomyiidae *5 D C53 Pre 2 0 0 0 7 0 0Pre 3 0 0 0 4 <1 <1Enr 1 0 0 0 1 0 0Enr 2 0 0 0 6 <1 <1
C54 Pre 2 3 <1 <1 102 1 3Pre 3 8 <1 <1 91 1 3Enr 1 6 <1 <1 90 1 3Enr 2 0 0 0 30 <1 1

243
Appendix B (cont.)Mixed Substrate Bedrock Outcrops
Functional group ortaxon
CPI Order Site Year A B P A B P
Ormosia sp. *5 D C53 Pre 2 4 1 3 0 0 0Pre 3 38 5 25 0 0 0Enr 1 3 3 14 0 0 0Enr 2 2 2 11 0 0 0
C54 Pre 2 4 0 0 0 0 0Pre 3 1 0 1 0 0 0Enr 1 20 5 24 0 0 0Enr 2 3 3 13 0 0 0
Sciaridae 365 D C53 Pre 2 547 11 56 3 <1 <1Pre 3 410 9 64 0 0 0Enr 1 259 8 43 0 0 0Enr 2 129 7 25 0 0 0
C54 Pre 2 246 6 24 2 <1 <1Pre 3 302 17 71 1 <1 <1Enr 1 1355 33 187 1 <1 <1Enr 2 75 4 15 0 0 0
Copepoda *18 NI C53 Pre 2 22990 23 414 659 1 13Pre 3 33732 34 607 390 <1 7Enr 1 16441 17 297 1652 2 31Enr 2 20665 21 372 2850 3 52
C54 Pre 2 12213 12 220 199 <1 4Pre 3 30563 31 551 287 <1 5Enr 1 59365 59 1069 1050 1 18Enr 2 43695 44 786 420 <1 7

244
Appendix B (cont.)Mixed Substrate Bedrock Outcrops
Functional group ortaxon
CPI Order Site Year A B P A B P
Nematoda *5 NI C53 Pre 2 14752 12 58 162 0 1Pre 3 13589 12 62 260 <1 2Enr 1 11117 12 62 266 <1 2Enr 2 10612 11 54 385 <1 2
C54 Pre 2 2053 2 9 36 <1 <1Pre 3 13744 15 73 169 <1 1Enr 1 26327 29 144 223 <1 2Enr 2 20510 21 106 529 1 4
Oligochaeta *5 NI C53 Pre 2 6519 80 398 350 1 5Pre 3 7020 102 509 119 <1 1Enr 1 4905 96 482 225 1 3Enr 2 4239 88 439 461 1 3
C54 Pre 2 1805 104 519 43 <1 1Pre 3 6201 153 767 192 1 7Enr 1 15636 201 1004 111 <1 2Enr 2 9849 235 1174 203 1 6
Total C-gatherers C53 Pre 2 87778 261 3572 10993 68 704Pre 3 106711 357 3389 9180 69 629Enr 1 65011 230 2248 10119 74 743Enr 2 68194 269 2442 17180 97 1227
C54 Pre 2 35777 220 1695 13976 94 863Pre 3 81858 442 3077 20388 175 1698Enr 1 161802 611 6775 18638 319 2813Enr 2 117410 700 6451 14173 165 1879

245
Appendix B (cont.)Mixed Substrate Bedrock Outcrops
Functional group ortaxon
CPI Order Site Year A B P A B P
Diplectrona modesta 332 T C53 Pre 2 297 10 58 36 5 36Pre 3 430 21 187 7 3 23Enr 1 183 12 82 25 2 24Enr 2 232 15 106 10 3 20
C54 Pre 2 128 18 108 62 10 48Pre 3 368 62 353 17 2 22Enr 1 517 59 320 1 1 2Enr 2 350 107 534 20 5 42
Diplectrona metaqui 332 T C53 Pre 2 4 1 5 1 1 1Pre 3 0 0 0 0 0 0Enr 1 1 3 8 0 0 0Enr 2 2 3 8 10 5 28
C54 Pre 2 0 0 0 0 0 0Pre 3 0 0 0 0 0 0Enr 1 1 1 5 0 0 0Enr 2 0 0 0 0 0 0
Parapsyche cardis 332 T C53 Pre 2 68 1 20 904 135 871Pre 3 1 1 2 1217 157 1343Enr 1 1 <1 1 388 106 742Enr 2 1 <1 1 414 88 694
C54 Pre 2 2 9 17 652 126 1000Pre 3 0 0 0 467 131 909Enr 1 0 0 0 404 112 759Enr 2 18 2 23 665 199 1422

246
Appendix B (cont.)Mixed Substrate Bedrock Outcrops
Functional group ortaxon
CPI Order Site Year A B P A B P
Wormaldia sp. 130 T C53 Pre 2 1 <1 3 6 1 12 (summer cohort) Pre 3 104 2 28 15 2 22
Enr 1 31 5 42 7 2 22Enr 2 17 3 58 25 2 48
C54 Pre 2 27 3 35 74 15 105Pre 3 15 4 29 14 3 24Enr 1 28 10 106 88 9 113Enr 2 16 3 41 23 1 28
Wormaldia sp. 236 T C53 Pre 2 3 0 1 7 1 3 (winter cohort) Pre 3 37 3 28 21 2 11
Enr 1 19 1 13 13 2 11Enr 2 80 3 47 55 5 61
C54 Pre 2 5 <1 2 36 5 31Pre 3 33 4 20 20 2 11Enr 1 106 14 94 92 5 46Enr 2 90 12 30 93 6 77
Dolophilodes distinctus 269 T C53 Pre 2 1 1 1 0 0 0Pre 3 1 3 6 0 0 0Enr 1 0 0 0 0 0 0Enr 2 0 0 0 0 0 0
C54 Pre 2 1 <1 2 1 <1 1Pre 3 0 0 0 0 0 0Enr 1 0 0 0 0 0 0Enr 2 0 0 0 10 6 28

247
Appendix B (cont.)Mixed Substrate Bedrock Outcrops
Functional group ortaxon
CPI Order Site Year A B P A B P
Simuliidae 180 D C53 Pre 2 11 <1 3 250 2 35Pre 3 34 <1 3 276 5 57Enr 1 8 <1 1 205 3 39Enr 2 8 <1 1 62 1 13
C54 Pre 2 0 0 0 125 2 19Pre 3 1 <1 <1 19 1 5Enr 1 38 2 16 109 4 46Enr 2 2 <1 2 53 3 26
Dixa sp. 365 D C53 Pre 2 332 1 6 64 0 2Pre 3 273 2 12 26 1 2Enr 1 107 2 12 208 1 5Enr 2 205 3 23 81 1 7
C54 Pre 2 42 <1 2 30 <1 1Pre 3 50 1 4 17 <1 1Enr 1 152 2 13 60 <1 2Enr 2 40 1 5 38 <1 3
Sphaeridae 280 NI C53 Pre 2 63 4 18 0 0 0Pre 3 30 5 23 0 0 0Enr 1 23 2 20 0 0 0Enr 2 29 7 36 0 0 0
C54 Pre 2 8 1 4 0 0 0Pre 3 18 2 14 0 0 0Enr 1 148 15 114 0 0 0Enr 2 106 9 70 0 0 0

248
Appendix B (cont.)Mixed Substrate Bedrock Outcrops
Functional group ortaxon
CPI Order Site Year A B P A B P
Total C-filterers C53 Pre 2 778 18 114 1268 145 960Pre 3 909 37 289 1562 169 1459Enr 1 373 26 177 845 115 842Enr 2 573 33 279 657 104 871
C54 Pre 2 212 32 170 979 158 1207Pre 3 484 72 420 554 138 972Enr 1 989 103 666 754 130 968Enr 2 621 134 706 902 220 1626
Cordulegaster sp. 1140 O C53 Pre 2 63 99 161 0 0 0Pre 3 32 191 339 0 0 0Enr 1 86 88 158 0 0 0Enr 2 23 46 121 0 0 0
C54 Pre 2 44 153 185 0 0 0Pre 3 79 151 370 0 0 0Enr 1 81 183 224 0 0 0Enr 2 27 218 223 0 0 0
Lanthus sp. 660 O C53 Pre 2 42 115 277 1 0 3Pre 3 89 256 670 1 9 14Enr 1 62 185 488 0 0 0Enr 2 61 164 567 4 47 138
C54 Pre 2 46 73 184 0 0 0Pre 3 159 272 674 1 <1 1Enr 1 65 191 439 0 0 0Enr 2 51 295 686 0 0 0

249
Appendix B (cont.)Mixed Substrate Bedrock Outcrops
Functional group ortaxon
CPI Order Site Year A B P A B P
Sweltsa sp. 630 P C53 Pre 2 18 1 2 1 <1 <1Pre 3 138 2 6 0 0 0Enr 1 8 1 4 0 0 0Enr 2 4 2 4 0 0 0
C54 Pre 2 16 1 1 0 0 0Pre 3 9 2 3 0 0 0Enr 1 2 3 2 0 0 0Enr 2 1 1 1 0 0 0
Beloneuria sp. 660 P C53 Pre 2 32 33 80 6 10 43Pre 3 95 77 114 5 <1 <1Enr 1 20 75 190 6 1 6Enr 2 51 130 320 38 7 37
C54 Pre 2 20 38 95 51 16 82Pre 3 179 182 566 233 13 61Enr 1 58 147 428 23 17 56Enr 2 29 117 290 16 6 24
Isoperla spp. 300 P C53 Pre 2 310 8 81 76 7 42Pre 3 154 5 57 40 6 50Enr 1 147 8 79 36 1 15Enr 2 38 3 36 22 4 35
C54 Pre 2 116 8 56 124 17 116Pre 3 149 12 36 184 27 125Enr 1 489 33 257 149 24 156Enr 2 271 51 368 188 26 198

250
Appendix B (cont.)Mixed Substrate Bedrock Outcrops
Functional group ortaxon
CPI Order Site Year A B P A B P
Malerikus hastatus 660 P C53 Pre 2 1 <1 <1 1 1 <1Pre 3 0 0 0 0 0 0Enr 1 0 0 0 0 0 0Enr 2 0 0 0 0 0 0
C54 Pre 2 5 2 7 2 1 2Pre 3 1 1 1 10 4 8Enr 1 0 0 0 0 0 0Enr 2 0 0 0 1 1 <1
Rhyacophila spp. 340 T C53 Pre 2 158 12 74 20 6 49Pre 3 305 17 130 41 4 36Enr 1 47 15 103 78 4 64Enr 2 87 12 94 41 7 64
C54 Pre 2 82 19 122 127 7 83Pre 3 71 36 177 122 29 178Enr 1 167 60 388 104 13 112Enr 2 176 57 424 180 20 169
Pseudogoera singularis 365 T C53 Pre 2 3 1 3 131 3 29Pre 3 2 <1 <1 62 4 20Enr 1 17 <1 2 56 1 9Enr 2 2 <1 2 67 4 16
C54 Pre 2 22 3 12 175 2 17Pre 3 14 15 43 168 9 90Enr 1 19 14 16 236 28 163Enr 2 44 23 132 274 19 101

251
Appendix B (cont.)Mixed Substrate Bedrock Outcrops
Functional group ortaxon
CPI Order Site Year A B P A B P
Ceratopognidae 365 D C53 Pre 2 4410 132 865 108 7 32Pre 3 7052 233 1272 110 3 16Enr 1 4172 144 983 105 3 25Enr 2 3704 154 794 89 3 23
C54 Pre 2 1651 78 427 106 9 35Pre 3 3909 194 1001 73 4 21Enr 1 7001 290 1850 51 2 13Enr 2 3568 195 1055 46 4 21
Hexatoma spp. 365 D C53 Pre 2 865 82 472 0 0 0Pre 3 1048 106 522 10 <1 1Enr 1 597 108 703 18 2 16Enr 2 312 46 334 1 <1 2
C54 Pre 2 454 67 364 6 1 7Pre 3 823 134 799 9 <1 18Enr 1 1087 183 1161 10 1 10Enr 2 348 108 666 6 <1 2
nr. Pedicia sp. 340 D C53 Pre 2 78 15 84 0 0 0Pre 3 78 14 92 0 0 0Enr 1 6 35 684 0 0 0Enr 2 70 30 186 0 0 0
C54 Pre 2 0 0 0 0 0 0Pre 3 5 21 62 0 0 0Enr 1 14 24 130 0 0 0Enr 2 3 3 20 0 0 0

252
Appendix B (cont.)Mixed Substrate Bedrock Outcrops
Functional group ortaxon
CPI Order Site Year A B P A B P
Pedicia sp. 365 D C53 Pre 2 8 28 88 0 0 0Pre 3 8 38 14 3 <1 1Enr 1 10 26 84 0 0 0Enr 2 4 30 78 5 1 10
C54 Pre 2 5 1 5 1 <1 <1Pre 3 5 52 172 0 0 0Enr 1 4 52 80 0 0 0Enr 2 6 50 64 0 0 0
Dicranota spp. 310 D C53 Pre 2 32 17 79 66 1 12Pre 3 277 10 86 42 1 11Enr 1 85 5 42 22 1 7Enr 2 85 4 37 91 2 25
C54 Pre 2 20 3 27 27 1 8Pre 3 77 7 36 97 1 21Enr 1 216 30 163 78 2 18Enr 2 142 37 235 132 4 44
Glutops sp. 365 D C53 Pre 2 5 13 39 0 0 0Pre 3 2 11 28 0 0 0Enr 1 2 19 32 0 0 0Enr 2 4 15 51 0 0 0
C54 Pre 2 17 42 148 0 0 0Pre 3 18 56 185 0 0 0Enr 1 11 53 155 0 0 0Enr 2 20 33 147 0 0 0

253
Appendix B (cont.)Mixed Substrate Bedrock Outcrops
Functional group ortaxon
CPI Order Site Year A B P A B P
Tanypodinae 340 D C53 Pre 2 3765 4 58 186 1 7Pre 3 5435 12 111 160 <1 4Enr 1 1585 6 50 170 1 5Enr 2 1449 7 51 219 1 8
C54 Pre 2 280 2 15 49 <1 3Pre 3 2038 15 97 233 1 6Enr 1 3057 18 125 177 1 7Enr 2 2477 22 143 45 <1 2
Empididae 340 D C53 Pre 2 370 2 23 104 2 12Pre 3 93 1 5 108 3 21Enr 1 154 2 13 67 2 13Enr 2 90 2 12 119 1 9
C54 Pre 2 79 <1 5 108 3 17Pre 3 156 2 16 185 5 28Enr 1 361 9 51 139 2 13Enr 2 141 7 35 75 1 7
Pilaria sp. 365 D C53 Pre 2 3 0 1 0 0 0Pre 3 0 0 0 0 0 0Enr 1 1 <1 <1 0 0 0Enr 2 0 0 0 0 0 0
C54 Pre 2 0 0 0 0 0 0Pre 3 0 0 0 0 0 0Enr 1 0 0 0 0 0 0Enr 2 1 <1 <1 0 0 0

254
Appendix B (cont.)Mixed Substrate Bedrock Outcrops
Functional group ortaxon
CPI Order Site Year A B P A B P
Pseudolimnolphila sp. 365 D C53 Pre 2 6 4 11 1 1 3Pre 3 48 5 37 0 0 0Enr 1 89 14 81 2 <1 5Enr 2 153 20 102 3 <1 1
C54 Pre 2 55 17 50 1 <1 <1Pre 3 109 41 175 0 0 0Enr 1 341 82 434 0 0 0Enr 2 339 182 676 10 <1 3
Rhabdomastix sp. *5 D C53 Pre 2 1 0 2 0 0 0Pre 3 3 2 9 0 0 0Enr 1 1 <1 2 0 0 0Enr 2 0 0 0 1 <1 1
C54 Pre 2 1 <1 1 1 2 9Pre 3 3 8 41 0 0 0Enr 1 0 0 0 0 0 0Enr 2 7 16 82 0 0 0
Dolichopodidae 300 D C53 Pre 2 10 9 33 0 0 0Pre 3 46 13 66 0 0 0Enr 1 7 6 21 0 0 0Enr 2 11 6 21 1 <1 3
C54 Pre 2 28 2 14 0 0 0Pre 3 78 25 126 0 0 0Enr 1 63 23 83 0 0 0Enr 2 12 6 25 0 0 0

255
Appendix B (cont.)Mixed Substrate Bedrock Outcrops
Functional group ortaxon
CPI Order Site Year A B P A B P
Turbellaria *5 NI C53 Pre 2 38 0 2 34 0 2Pre 3 364 3 15 98 1 6Enr 1 49 <1 2 40 1 4Enr 2 46 1 4 93 1 7
C54 Pre 2 61 1 4 16 <1 1Pre 3 28 <1 1 20 <1 2Enr 1 26 <1 2 12 <1 1Enr 2 60 1 5 21 <1 1
Acari *5 NI C53 Pre 2 2485 7 33 1726 5 23Pre 3 4820 13 64 1727 5 23Enr 1 1937 5 26 1130 3 15Enr 2 2118 6 28 750 2 10
C54 Pre 2 767 2 10 485 1 7Pre 3 1446 4 19 693 2 9Enr 1 3653 10 49 755 2 10Enr 2 1602 4 21 641 2 9
Total invertebrate predators C53 Pre 2 12703 582 2468 2461 44 257Pre 3 20088 1009 3635 2406 37 203Enr 1 9080 741 3745 1730 20 184Enr 2 8312 678 2839 1544 80 386
C54 Pre 2 3769 512 1732 1280 60 385Pre 3 9353 1232 4598 2026 96 567Enr 1 16712 1404 6036 1734 91 559Enr 2 9325 1426 5297 1636 83 581

256
Appendix B (cont.)Mixed Substrate Bedrock Outcrops
Functional group ortaxon
CPI Order Site Year A B P A B P
Eurycea sp. 365 NI C53 Pre 2 1 5 9 0 0 0Pre 3 2 11 40 0 0 0Enr 1 1 2 3 0 0 0Enr 2 1 2 8 0 0 0
C54 Pre 2 2 17 24 0 0 0Pre 3 2 18 15 2 6 35Enr 1 0 0 0 0 0 0Enr 2 1 4 5 0 0 0
Desmognathus spp. 880 NI C53 Pre 2 2 54 68 1 13 37Pre 3 3 68 120 2 47 56Enr 1 4 75 84 0 0 0Enr 2 2 55 119 0 0 0
C54 Pre 2 1 53 46 2 44 171Pre 3 2 62 82 0 0 0Enr 1 2 30 38 0 0 0Enr 2 2 37 89 1 85 140
Total vertebrate predators C53 Pre 2 3 59 77 1 13 37 (salamanders) Pre 3 4 79 160 2 47 56
Enr 1 4 77 88 0 0 0Enr 2 2 57 128 0 0 0
C54 Pre 1 3 70 70 2 44 171Pre 2 4 81 97 2 6 35Enr 1 2 30 38 0 0 0Enr 2 3 41 94 1 85 140

257
Appendix C. Invertebrate gut contents (raw proportions). Mean percent (%) by area of food types in the guts of primary consumers(adjusted for fungal content) in the reference stream (C53) and treatment stream (54).Stream/Functionalgroup/Taxon
Date Leaves Wood Fungi Amorphous Diatoms Animals
Reference stream Shredders Anchytarsus sp. 6/2000 21.6 14.4 1.2 62.4 0.4 0.0
3/2001 20.7 0.0 0.8 78.3 0.1 0.05/2001 32.1 7.1 1.5 57.4 1.8 0.08/2001 54.7 6.1 2.4 36.8 0.0 0.07/2002 40.0 0.0 1.6 58.1 0.2 0.0
Fattigia pele 6/1999 87.2 7.8 3.7 1.3 0.0 0.03/2000 78.0 16.5 3.6 1.9 0.0 0.06/2000 59.6 15.5 2.8 22.2 0.0 0.0
11/2000 80.1 5.7 3.4 10.5 0.3 0.03/2001 64.9 0.0 2.6 27.0 5.5 0.05/2001 91.9 2.2 3.8 2.2 0.0 0.08/2001 72.0 4.3 3.0 20.7 0.1 0.0
12/2001 78.1 8.1 3.4 10.3 0.1 0.03/2002 72.7 7.9 3.1 16.3 0.0 0.07/2002 73.9 13.3 3.3 9.0 0.6 0.0
Lepidostoma spp. 6/1999 82.1 11.5 3.6 2.8 0.0 0.03/2000 91.8 0.0 3.7 4.5 0.0 0.06/2000 61.5 13.9 2.8 21.8 0.0 0.0
11/2000 88.8 0.0 3.6 7.6 0.0 0.03/2001 68.5 2.3 2.8 26.2 0.2 0.05/2001 79.1 4.5 3.3 12.2 0.1 0.88/2001 80.8 0.0 3.3 15.9 0.0 0.0
12/2001 88.2 0.0 3.6 8.2 0.0 0.03/2002 90.8 0.0 3.7 5.5 0.0 0.07/2002 83.4 2.8 3.5 10.2 0.2 0.0
Leuctra spp. 3/2000 42.5 0.5 1.7 55.2 0.0 0.0

258
Appendix C (cont.)Stream/Functionalgroup/Taxon
Date Leaves Wood Fungi Amorphous Diatoms Animals
Leuctra spp. (cont.) 5/2001 36.7 0.0 1.5 61.9 0.0 0.08/2001 58.4 0.0 2.4 39.3 0.0 0.0
12/2001 50.0 0.0 2.0 47.8 0.2 0.03/2002 74.6 0.0 3.0 21.7 0.0 0.67/2002 68.8 2.3 2.9 25.8 0.3 0.0
Pycnopsyche spp. 6/1999 55.4 41.2 3.2 0.1 0.1 0.03/2000 92.8 3.0 3.8 0.3 0.0 0.06/2000 91.4 3.5 3.8 1.4 0.0 0.0
11/2000 82.6 1.9 3.4 11.5 0.5 0.03/2001 86.7 3.5 3.6 6.0 0.1 0.05/2001 78.6 10.0 3.4 7.7 0.2 0.0
12/2001 84.5 0.8 3.5 11.1 0.0 0.13/2002 85.3 2.4 3.5 8.7 0.0 0.07/2002 74.7 10.6 3.3 11.4 0.0 0.0
Tallaperla spp. 3/2000 85.6 4.7 3.6 5.9 0.2 0.06/2000 65.7 8.1 2.9 23.3 0.0 0.0
11/2000 60.5 3.8 2.6 33.2 0.0 0.03/2001 63.2 8.2 2.8 25.7 0.1 0.05/2001 56.3 0.7 2.3 39.8 0.9 0.08/2001 70.3 1.7 2.9 25.1 0.0 0.0
12/2001 65.8 2.5 2.7 28.9 0.0 0.03/2002 89.8 0.0 3.7 6.5 0.0 0.07/2002 82.4 0.0 3.4 14.2 0.1 0.0
Tipula spp. 6/1999 89.7 4.0 3.7 2.5 0.0 0.03/2000 83.0 12.8 3.7 0.5 0.0 0.06/2000 86.2 5.1 3.6 5.0 0.0 0.0
11/2000 83.4 3.9 3.5 9.1 0.0 0.03/2001 57.6 22.9 2.9 16.6 0.0 0.05/2001 74.1 3.0 3.1 19.7 0.2 0.0

259
Appendix C (cont.)Stream/Functionalgroup/Taxon
Date Leaves Wood Fungi Amorphous Diatoms Animals
Tipula spp. (cont.) 8/2001 75.4 10.7 3.3 10.6 0.0 0.012/2001 84.4 0.0 3.4 11.7 0.4 0.03/2002 93.3 0.4 3.8 2.3 0.1 0.07/2002 77.9 6.5 3.3 12.3 0.0 0.0
Enriched stream Shredders Anchytarsus sp. 3/2001 60.8 0.0 3.4 35.2 0.6 0.0
5/2001 67.4 10.7 5.0 16.6 0.3 0.07/2002 48.4 10.4 3.9 35.8 1.4 0.0
Fattigia pele 6/1999 81.9 10.2 3.6 4.3 0.0 0.03/2000 86.4 4.1 3.6 5.8 0.0 0.06/2000 77.6 11.0 3.4 8.0 0.0 0.0
11/2000 81.8 9.1 5.6 3.5 0.0 0.03/2001 85.8 0.0 4.8 6.1 3.3 0.05/2001 83.0 3.0 5.0 8.9 0.0 0.08/2001 64.5 7.3 4.5 23.7 0.0 0.0
12/2001 80.0 3.8 4.9 11.3 0.0 0.03/2002 69.7 0.0 3.9 26.4 0.0 0.07/2002 63.2 5.4 4.2 26.6 0.6 0.0
Lepidostoma spp. 6/1999 87.9 5.9 3.7 2.0 0.5 0.03/2000 85.0 1.7 3.5 9.9 0.0 0.06/2000 74.4 11.1 3.3 11.0 0.1 0.0
11/2000 83.9 5.7 5.4 5.0 0.1 0.03/2001 82.3 0.0 4.6 11.5 1.6 0.05/2001 80.7 2.7 4.9 8.7 3.1 0.08/2001 84.1 3.7 5.2 4.9 2.1 0.03/2002 74.3 3.7 4.6 17.4 0.0 0.07/2002 67.6 16.4 5.7 10.3 0.1 0.0
Leuctra spp. 3/2000 79.5 4.6 3.3 12.4 0.1 0.0

260
Appendix C (cont.)Stream/Functionalgroup/Taxon
Date Leaves Wood Fungi Amorphous Diatoms Animals
Leuctra spp. (cont.) 6/2000 10.9 0.0 0.4 86.1 2.6 0.011/2000 58.1 0.0 3.3 38.6 0.0 0.03/2001 71.3 0.0 4.0 23.4 1.3 0.05/2001 54.7 7.4 3.9 33.6 0.4 0.08/2001 79.6 3.2 4.9 12.3 0.0 0.0
12/2001 52.9 0.0 3.0 44.0 0.1 0.03/2002 51.7 12.1 4.3 31.7 0.2 0.07/2002 43.0 0.0 2.4 54.6 0.0 0.0
Pycnopsyche spp. 6/1999 68.1 23.4 3.3 5.2 0.0 0.03/2000 80.7 7.3 3.5 8.5 0.0 0.06/2000 75.8 17.1 3.5 3.6 0.0 0.0
11/2000 84.5 0.0 4.8 10.0 0.7 0.03/2001 80.0 1.9 4.7 3.9 9.4 0.05/2001 82.8 4.9 5.2 7.1 0.0 0.0
12/2001 84.1 1.3 4.9 9.7 0.0 0.03/2002 80.0 0.7 4.6 12.6 2.0 0.07/2002 79.9 4.1 5.0 11.1 0.0 0.0
Tallaperla spp. 6/1999 91.3 0.0 3.7 4.8 0.3 0.03/2000 84.1 0.4 3.4 12.0 0.1 0.06/2000 67.5 9.8 3.0 19.7 0.1 0.0
11/2000 83.6 3.0 5.1 8.4 0.0 0.03/2001 74.4 0.0 4.2 21.0 0.4 0.05/2001 74.3 9.4 5.3 10.6 0.4 0.0
12/2001 82.3 1.8 4.8 11.1 0.0 0.03/2002 87.4 0.0 4.9 7.4 0.2 0.07/2002 82.8 2.1 4.9 10.2 0.0 0.0
Tipula spp. 6/1999 95.1 0.5 3.9 0.5 0.0 0.03/2000 80.5 7.0 3.4 9.0 0.0 0.06/2000 70.9 11.4 3.2 14.3 0.2 0.0

261
Appendix C (cont.)Stream/Functionalgroup/Taxon
Date Leaves Wood Fungi Amorphous Diatoms Animals
Tipula spp. (cont.) 11/2000 88.1 0.3 5.0 6.0 0.6 0.03/2001 62.8 2.1 3.8 18.2 13.1 0.05/2001 81.0 2.1 4.8 11.9 0.1 0.0
12/2001 79.0 6.2 5.2 9.6 0.0 0.03/2002 73.2 6.4 4.9 15.5 0.1 0.07/2002 75.5 5.4 4.9 14.0 0.2 0.0
Reference stream Gatherers Amphinemura sp. 3/2000 32.6 9.4 1.5 55.5 0.9 0.0
6/2000 50.9 0.0 2.1 47.1 0.0 0.011/2000 23.3 0.0 0.9 75.7 0.0 0.05/2001 3.6 0.0 0.1 95.7 0.5 0.0
12/2001 14.2 0.0 0.6 83.4 1.8 0.0 Chironomidae 6/1999 19.2 0.0 0.8 77.1 2.9 0.0
11/2000 13.5 0.0 0.5 86.0 0.0 0.03/2001 19.3 0.0 0.8 79.9 0.0 0.05/2001 6.1 0.0 0.2 93.6 0.0 0.08/2001 25.0 0.0 1.0 73.6 0.4 0.0
12/2001 15.2 0.0 0.6 84.1 0.1 0.03/2002 21.9 0.0 0.9 77.2 0.0 0.07/2002 7.7 0.0 0.3 91.1 0.9 0.0
Oligochaetae 11/2000 28.0 13.8 1.5 55.0 1.8 0.05/2001 31.9 0.0 1.3 66.8 0.0 0.08/2001 19.6 0.0 0.8 79.7 0.0 0.0
12/2001 34.0 0.0 1.4 63.2 1.4 0.07/2002 58.3 0.0 2.4 36.8 2.6 0.0
Paraleptophlebia sp. 3/2000 0.0 0.0 0.0 99.6 0.4 0.06/2000 59.9 17.3 2.8 19.9 0.0 0.05/2001 6.8 0.0 0.3 92.8 0.2 0.0
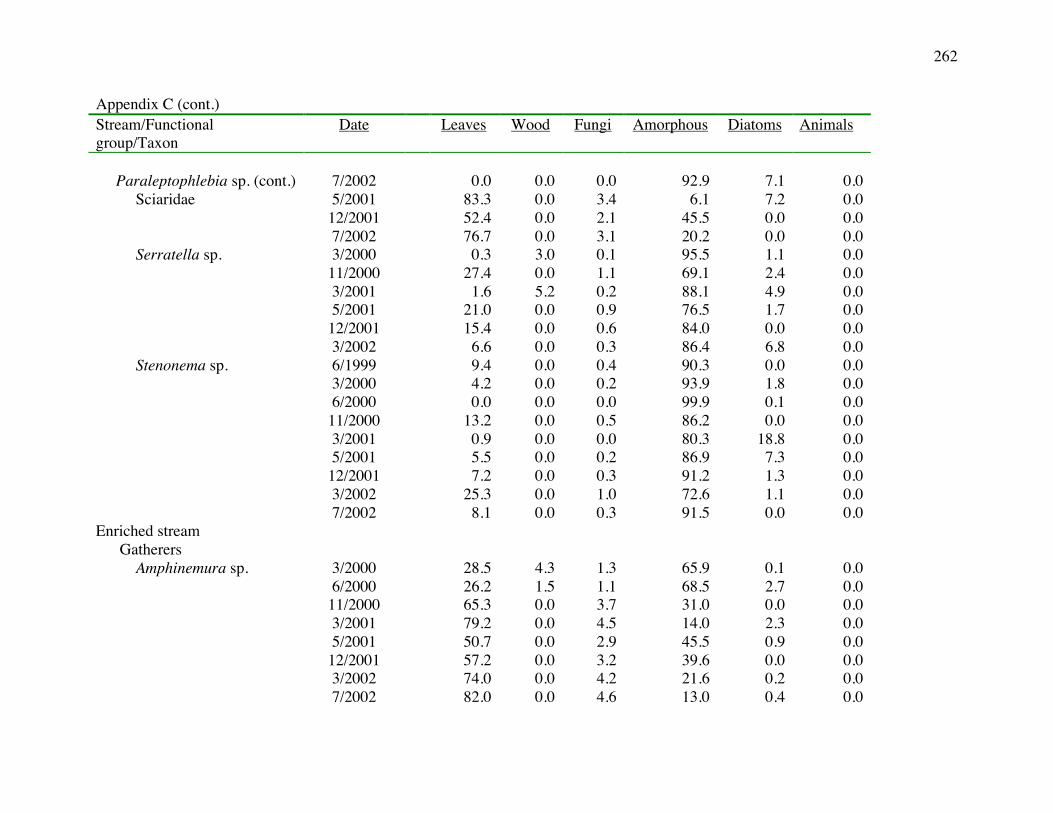
262
Appendix C (cont.)Stream/Functionalgroup/Taxon
Date Leaves Wood Fungi Amorphous Diatoms Animals
Paraleptophlebia sp. (cont.) 7/2002 0.0 0.0 0.0 92.9 7.1 0.0 Sciaridae 5/2001 83.3 0.0 3.4 6.1 7.2 0.0
12/2001 52.4 0.0 2.1 45.5 0.0 0.07/2002 76.7 0.0 3.1 20.2 0.0 0.0
Serratella sp. 3/2000 0.3 3.0 0.1 95.5 1.1 0.011/2000 27.4 0.0 1.1 69.1 2.4 0.03/2001 1.6 5.2 0.2 88.1 4.9 0.05/2001 21.0 0.0 0.9 76.5 1.7 0.0
12/2001 15.4 0.0 0.6 84.0 0.0 0.03/2002 6.6 0.0 0.3 86.4 6.8 0.0
Stenonema sp. 6/1999 9.4 0.0 0.4 90.3 0.0 0.03/2000 4.2 0.0 0.2 93.9 1.8 0.06/2000 0.0 0.0 0.0 99.9 0.1 0.0
11/2000 13.2 0.0 0.5 86.2 0.0 0.03/2001 0.9 0.0 0.0 80.3 18.8 0.05/2001 5.5 0.0 0.2 86.9 7.3 0.0
12/2001 7.2 0.0 0.3 91.2 1.3 0.03/2002 25.3 0.0 1.0 72.6 1.1 0.07/2002 8.1 0.0 0.3 91.5 0.0 0.0
Enriched stream Gatherers Amphinemura sp. 3/2000 28.5 4.3 1.3 65.9 0.1 0.0
6/2000 26.2 1.5 1.1 68.5 2.7 0.011/2000 65.3 0.0 3.7 31.0 0.0 0.03/2001 79.2 0.0 4.5 14.0 2.3 0.05/2001 50.7 0.0 2.9 45.5 0.9 0.0
12/2001 57.2 0.0 3.2 39.6 0.0 0.03/2002 74.0 0.0 4.2 21.6 0.2 0.07/2002 82.0 0.0 4.6 13.0 0.4 0.0

263
Appendix C (cont.)Stream/Functionalgroup/Taxon
Date Leaves Wood Fungi Amorphous Diatoms Animals
Chironomidae 6/1999 11.8 0.0 0.5 87.7 0.1 0.011/2000 9.7 0.0 0.5 89.4 0.3 0.03/2001 13.5 0.0 0.8 85.7 0.0 0.05/2001 7.0 0.0 0.4 92.6 0.0 0.08/2001 14.7 0.0 0.8 84.5 0.0 0.0
12/2001 14.0 0.0 0.8 85.3 0.0 0.03/2002 17.6 0.0 1.0 80.9 0.4 0.07/2002 22.1 0.0 1.2 76.7 0.0 0.0
Oligochaetae 3/2000 18.2 10.6 1.0 70.2 0.0 0.06/2000 5.0 9.8 0.4 84.2 0.6 0.0
11/2000 53.3 0.0 3.0 43.7 0.0 0.05/2001 27.0 0.0 1.5 71.5 0.0 0.07/2002 52.3 1.6 3.1 40.0 0.6 2.4
Paraleptophlebia sp. 3/2000 0.0 0.0 0.0 99.7 0.3 0.011/2000 1.5 0.0 0.1 98.3 0.2 0.05/2001 13.9 0.0 0.8 85.4 0.0 0.0
12/2001 9.4 0.0 0.5 89.7 0.4 0.03/2002 27.3 0.0 1.5 69.5 1.6 0.0
Sciaridae 7/2002 75.6 0.0 4.3 20.0 0.2 0.0 Serratella sp. 3/2000 9.2 0.0 0.4 84.8 5.7 0.0
6/2000 20.0 4.4 0.9 73.3 1.3 0.011/2000 21.4 0.0 1.2 74.9 2.5 0.03/2001 14.1 0.0 0.8 68.9 16.2 0.05/2001 32.1 1.4 2.0 64.4 0.1 0.0
12/2001 10.6 7.4 1.4 69.0 9.8 1.73/2002 13.0 0.0 0.7 75.7 10.6 0.0
Stenonema sp. 6/1999 12.4 0.0 0.5 84.4 2.7 0.03/2000 0.7 1.4 0.1 96.9 1.0 0.06/2000 3.6 0.5 0.2 94.0 1.7 0.0

264
Appendix C (cont.)Stream/Functionalgroup/Taxon
Date Leaves Wood Fungi Amorphous Diatoms Animals
Stenonema sp. (cont.) 11/2000 5.6 0.0 0.3 94.0 0.2 0.03/2001 0.3 1.5 0.2 86.2 11.8 0.05/2001 9.7 0.0 0.5 88.5 1.3 0.0
12/2001 7.4 3.2 0.8 88.6 0.0 0.03/2002 25.1 0.7 1.5 71.0 1.8 0.0
Reference stream Filterers Diplectrona spp. 6/1999 43.2 8.6 2.0 23.4 1.7 21.2
3/2000 61.7 5.5 2.6 24.6 0.4 5.26/2000 37.6 11.1 1.8 38.7 0.0 10.8
11/2000 39.9 7.2 1.8 48.6 1.0 1.63/2001 34.4 20.9 1.9 40.9 0.0 1.95/2001 42.4 2.0 1.8 47.0 0.7 6.18/2001 80.7 0.3 3.3 14.1 0.1 1.5
12/2001 50.1 5.6 2.2 41.2 0.4 0.5 Parapsyche cardis. 6/1999 34.7 6.6 1.6 35.5 0.3 21.4
3/2000 33.0 11.7 1.6 45.6 0.0 8.06/2000 30.0 4.8 1.3 37.2 0.2 26.5
11/2000 40.7 1.2 1.7 40.1 0.9 15.43/2001 32.9 5.2 1.5 56.5 2.9 1.15/2001 38.3 2.0 1.6 47.2 0.6 10.48/2001 68.3 2.5 2.8 13.3 0.1 13.0
12/2001 32.9 8.6 1.5 47.5 0.4 9.03/2002 63.9 0.6 2.6 25.3 2.3 5.37/2002 66.2 4.7 2.8 22.6 1.4 2.2
Simuliidae 6/1999 20.1 9.4 1.0 68.2 0.0 1.33/2000 0.2 0.0 0.0 98.3 1.5 0.06/2000 9.0 0.0 0.4 90.5 0.1 0.03/2001 0.0 0.0 0.0 95.7 4.3 0.0

265
Appendix C (cont.)Stream/Functionalgroup/Taxon
Date Leaves Wood Fungi Amorphous Diatoms Animals
Simuliidae (cont.) 5/2001 9.7 0.0 0.4 87.9 2.1 0.03/2002 10.6 0.0 0.4 86.1 2.8 0.0
Wormaldia spp. 3/2000 0.0 0.0 0.0 97.8 2.2 0.06/2000 0.0 0.0 0.0 98.8 1.2 0.0
11/2000 0.0 0.0 0.0 97.5 2.5 0.05/2001 1.0 0.0 0.0 95.4 3.5 0.08/2001 0.0 0.0 0.0 100.0 0.0 0.0
12/2001 0.0 0.0 0.0 100.0 0.0 0.0Enriched stream Filterers Diplectrona spp. 6/1999 66.3 2.4 2.8 21.1 1.0 6.4
3/2000 35.4 21.9 2.0 27.5 0.2 13.16/2000 27.1 16.5 1.5 51.6 0.0 3.3
11/2000 59.4 0.0 3.4 37.2 0.0 0.03/2001 52.4 4.5 3.5 36.0 1.8 1.95/2001 60.2 3.6 3.8 20.1 0.2 12.18/2001 65.7 0.0 3.7 28.1 0.2 2.2
12/2001 49.6 6.9 3.6 39.6 0.1 0.23/2002 46.3 6.8 3.4 39.5 0.5 3.57/2002 33.5 0.0 1.9 54.1 0.8 9.7
Parapsyche cardis. 6/1999 20.0 0.4 0.8 41.2 0.8 36.63/2000 56.5 10.3 2.5 23.3 0.2 7.2
11/2000 43.5 1.8 2.7 38.5 0.4 13.23/2001 49.4 2.8 3.1 18.6 0.3 25.75/2001 32.7 0.0 1.8 37.7 0.1 27.78/2001 46.6 0.0 2.6 28.8 0.5 21.5
12/2001 45.5 5.9 3.2 27.4 0.5 17.43/2002 45.0 0.0 2.5 23.3 0.1 29.17/2002 30.2 4.2 2.2 34.2 0.1 29.2

266
Appendix C (cont.)Stream/Functionalgroup/Taxon
Date Leaves Wood Fungi Amorphous Diatoms Animals
Simuliidae 6/1999 31.4 0.0 1.3 66.7 0.3 0.36/2000 5.9 0.0 0.2 88.1 5.8 0.03/2001 7.7 0.0 0.4 87.3 4.6 0.05/2001 2.5 0.0 0.1 92.8 4.5 0.03/2002 0.6 0.0 0.0 97.7 1.6 0.0
Wormaldia spp. 6/1999 6.3 0.0 0.3 93.4 0.0 0.03/2000 2.3 0.0 0.1 93.2 4.5 0.0
11/2000 0.7 0.0 0.0 98.9 0.4 0.05/2001 0.0 0.0 0.0 97.1 2.9 0.0
12/2001 4.6 0.0 0.3 94.9 0.2 0.03/2002 0.0 0.0 0.0 99.6 0.4 0.0
Reference stream Scrapers Baetis sp. 3/2000 0.0 0.0 0.0 97.0 3.0 0.0 Ectopria sp. 3/2000 0.0 0.0 0.0 89.4 10.6 0.0
3/2001 0.0 0.0 0.0 90.4 9.6 0.08/2001 16.5 0.0 0.7 68.2 14.6 0.03/2002 1.3 23.6 0.6 59.2 15.3 0.07/2002 3.3 2.3 0.2 76.1 18.2 0.0
Epeorus sp. 6/1999 0.0 0.0 0.0 83.1 16.9 0.03/2000 3.1 0.0 0.1 96.3 0.5 0.0
11/2000 16.1 0.0 0.7 83.2 0.0 0.03/2001 7.0 0.0 0.3 86.8 5.8 0.1
12/2001 0.0 0.0 0.0 92.6 7.4 0.03/2002 6.5 0.0 0.3 89.4 3.8 0.0
Neophylax sp. 3/2000 0.0 0.0 0.0 99.8 0.2 0.03/2001 0.0 0.0 0.0 72.7 27.3 0.03/2002 0.0 0.0 0.0 19.2 80.8 0.0

267
Appendix C (cont.)Stream/Functionalgroup/Taxon
Date Leaves Wood Fungi Amorphous Diatoms Animals
Enriched stream Scrapers Baetis sp. 6/2000 28.1 0.0 1.1 64.3 6.5 0.0
3/2002 1.7 0.0 0.1 93.7 4.6 0.0 Ectopria sp. 8/2001 10.6 0.0 0.6 75.9 12.9 0.0
3/2002 27.5 0.0 1.6 52.9 18.0 0.0 Epeorus sp. 6/1999 0.0 0.0 0.0 94.2 5.8 0.0
3/2000 0.0 2.3 0.1 93.3 4.3 0.06/2000 0.2 0.0 0.0 95.2 4.5 0.0
11/2000 0.7 0.0 0.0 90.7 8.5 0.03/2001 0.0 0.0 0.0 76.4 23.6 0.05/2001 3.6 0.0 0.2 93.3 2.9 0.08/2001 0.0 0.0 0.0 98.6 1.4 0.0
Epeorus sp. (cont.) 12/2001 2.0 0.0 0.1 91.7 6.2 0.03/2002 1.1 0.0 0.1 83.3 15.5 0.07/2002 8.4 0.0 0.5 68.1 23.0 0.0
Neophylax sp. 3/2001 0.0 0.0 0.0 27.1 72.9 0.05/2001 0.3 0.0 0.0 80.1 19.6 0.03/2002 2.4 0.0 0.1 93.2 4.3 0.0

268
Appendix D. Contribution of food types to invertebrate secondary production. Percent (%) contribution in the reference stream (C53)and treatment stream (54) before (Pre) and during (Enr-1, Enr-2) nutrient enrichment. Pre = September 1998 – June 2000, Enr-1 =July 2000 – August 2001, Enr-2 = September 2001 – August 2002.
Stream/Functional group/TaxonTreatment
period Leaves Wood Fungi Amorphous Diatoms Animals
Reference stream Shredders Anchytarsus sp. Pre 12.0 8.0 9.5 69.2 1.4 0.0
Enr 1 19.8 2.4 12.1 63.5 2.2 0.0Enr 2 22.2 0.0 12.7 64.5 0.6 0.0
Fattigia pele Pre 49.2 8.7 30.9 11.1 0.0 0.0Enr 1 47.0 1.9 27.4 18.3 5.3 0.0Enr 2 48.1 6.3 29.5 15.2 0.9 0.0
Lepidostoma spp. Pre 51.0 5.5 30.9 12.6 0.0 0.0Enr 1 49.2 1.1 28.4 19.2 0.3 1.9Enr 2 56.5 0.6 32.4 10.3 0.3 0.0
Leuctra sp. Pre 22.9 1.9 13.7 61.5 0.0 0.0Enr 1 27.0 0.0 15.4 57.5 0.0 0.0Enr 2 37.9 0.4 21.7 37.3 0.6 2.0
Pycnopsyche spp. Pre 54.0 10.7 34.3 0.8 0.1 0.0Enr 1 53.3 3.3 31.5 10.8 1.0 0.0Enr 2 51.6 3.6 30.6 13.6 0.2 0.4
Tallaperla spp. Pre 48.2 4.1 28.8 18.6 0.4 0.0Enr 1 37.6 2.2 22.1 37.2 0.9 0.0Enr 2 50.0 0.5 28.6 20.8 0.1 0.0
Tipula spp. Pre 57.3 4.9 34.3 3.5 0.0 0.0Enr 1 46.7 6.5 28.7 18.0 0.2 0.0Enr 2 54.8 1.5 31.7 11.3 0.7 0.0

269
Appendix D. (cont.)
Stream/Functional group/TaxonTreatment
period Leaves Wood Fungi Amorphous Diatoms Animals
Treatment stream Shredders Anchytarsus sp. Enr 1 27.9 2.3 25.8 42.8 1.2 0.0
Enr 2 18.8 4.0 21.2 52.7 3.3 0.0 Fattigia pele Pre 53.9 5.5 32.6 7.9 0.1 0.0
Enr 1 39.7 2.4 35.2 20.2 2.5 0.0Enr 2 32.6 1.4 28.0 37.4 0.5 0.0
Lepidostoma spp. Pre 53.5 4.0 31.8 9.9 0.8 0.0Enr 1 42.5 1.6 36.0 14.6 5.4 0.0Enr 2 34.5 4.9 35.0 25.6 0.1 0.0
Leuctra sp. Pre 25.0 1.3 14.7 54.5 4.6 0.0Enr 1 28.7 1.2 24.5 44.6 1.1 0.0Enr 2 18.6 1.5 17.1 62.5 0.3 0.0
Pycnopsyche spp. Pre 49.9 10.6 31.9 7.6 0.0 0.0Enr 1 41.2 1.1 34.3 13.2 10.2 0.0Enr 2 42.0 2.0 36.3 17.2 2.6 0.0
Tallaperla spp. Pre 51.7 2.2 30.1 15.5 0.6 0.0Enr 1 39.4 1.8 34.0 24.2 0.6 0.0Enr 2 41.0 1.2 34.2 20.9 0.3 2.5
Tipula spp. Pre 53.5 4.1 31.8 10.3 0.3 0.0Enr 1 37.0 1.3 31.3 20.6 9.8 0.0Enr 2 38.7 2.5 34.7 23.4 0.7 0.0
Reference stream Gatherers Amphinemura sp. Pre 23.6 2.7 14.3 57.9 1.6 0.0
Enr 1 6.2 0.0 3.5 89.3 1.0 0.0Enr 2 7.1 0.0 4.1 83.5 5.3 0.0

270
Appendix D. (cont.)
Stream/Functional group/TaxonTreatment
period Leaves Wood Fungi Amorphous Diatoms Animals
Gatherers (cont.) Chironomidae Pre 9.5 0.0 5.4 76.4 8.7 0.0
Enr 1 8.4 0.0 4.8 86.5 0.3 0.0Enr 2 7.7 0.0 4.4 86.9 1.0 0.0
Oligochaetae Pre 14.3 2.5 9.0 72.4 1.9 0.0Enr 1 25.0 0.0 14.3 54.3 6.5 0.0
Paraleptophlebia sp. Pre 16.7 4.8 11.1 66.6 0.7 0.0Enr 1 3.4 0.0 2.0 94.1 0.5 0.0Enr 2 0.0 0.0 0.0 81.3 18.7 0.0
Sciara sp. Pre 44.7 0.0 25.5 6.6 23.2 0.0Enr 1 38.7 0.0 22.0 39.3 0.0 0.0
Serratella sp. Pre 0.1 1.5 0.6 94.4 3.4 0.0Enr 1 8.3 0.9 5.0 77.0 8.9 0.0Enr 2 5.3 0.0 3.0 81.9 9.8 0.0
Stenonema sp. Pre 2.3 0.0 1.3 94.6 1.9 0.0Enr 1 2.8 0.0 1.6 73.0 22.6 0.0Enr 2 6.9 0.0 3.9 86.7 2.4 0.0
Treatment stream Gatherers Amphinemura sp. Pre 14.4 1.5 8.7 71.0 4.3 0.0
Enr 1 27.4 0.0 21.6 48.3 2.7 0.0Enr 2 32.0 0.0 25.2 42.3 0.5 0.0
Chironomidae Pre 6.1 0.0 3.5 90.2 0.3 0.0Enr 1 3.2 0.0 2.5 94.2 0.1 0.0Enr 2 5.4 0.0 4.2 90.1 0.3 0.0
Oligochaetae Pre 6.2 5.4 5.3 82.2 0.9 0.0Enr 1 13.8 0.0 10.9 75.3 0.0 0.0Enr 2 17.9 0.5 15.0 52.1 1.3 13.1

271
Appendix D. (cont.)
Stream/Functional group/TaxonTreatment
period Leaves Wood Fungi Amorphous Diatoms Animals
Gatherers (cont.) Paraleptophlebia sp. Pre 0.0 0.0 0.0 99.0 1.0 0.0
Enr 1 2.1 0.0 1.7 96.1 0.2 0.0Enr 2 5.4 0.0 4.2 88.6 1.8 0.0
Sciara sp. Enr 2 35.6 0.0 28.1 35.7 0.6 0.0 Serratella sp. Pre 7.1 1.1 4.4 77.2 10.2 0.0
Enr 1 6.6 0.1 5.4 76.9 11.0 0.0Enr 2 3.1 1.0 4.0 72.2 16.1 3.7
Stenonema sp. Pre 2.7 0.3 1.7 90.0 5.4 0.0Enr 1 1.4 0.1 1.3 90.2 7.0 0.0Enr 2 4.7 0.6 4.7 88.5 1.6 0.0
Reference stream Filterers Diplectrona spp. Pre 13.7 2.4 8.6 16.7 1.2 57.3
Enr 1 23.5 3.6 14.6 35.9 1.3 21.1Enr 2 28.0 3.1 17.0 46.1 1.3 4.4
Parapsyche cardis Pre 7.4 1.7 4.8 17.9 0.2 67.9Enr 1 14.1 0.8 8.3 24.6 2.1 50.0Enr 2 21.6 1.8 12.9 25.3 3.3 35.0
Simuliidae Pre 4.9 1.6 3.3 85.2 1.7 3.5Enr 1 2.3 0.0 1.3 87.3 9.0 0.0Enr 2 5.1 0.0 2.9 83.7 8.3 0.0
Wormaldia spp. Pre 0.0 0.0 0.0 95.1 4.9 0.0Enr 1 0.2 0.0 0.1 93.9 5.8 0.0Enr 2 0.0 0.0 0.0 100.0 0.0 0.0

272
Appendix D. (cont.)
Stream/Functional group/TaxonTreatment
period Leaves Wood Fungi Amorphous Diatoms Animals
Treatment stream Filterers Diplectrona spp. Pre 15.5 4.9 10.5 24.1 0.9 44.1
Enr 1 20.1 0.7 17.0 39.1 1.2 21.9Enr 2 13.0 1.4 12.5 50.7 0.8 21.6
Parapsyche cardis Pre 7.9 1.1 4.9 13.3 0.6 72.2Enr 1 7.8 0.2 6.5 21.3 0.3 63.9Enr 2 6.8 0.6 6.3 18.1 0.2 68.1
Simuliidae Pre 9.1 0.0 5.2 75.7 8.9 1.0Enr 1 1.3 0.0 1.1 90.3 7.2 0.0Enr 2 0.2 0.0 0.1 97.1 2.6 0.0
Wormaldia spp. Pre 2.1 0.0 1.2 90.3 6.5 0.0Enr 1 0.1 0.0 0.0 98.2 1.7 0.0Enr 2 0.6 0.0 0.5 98.5 0.4 0.0
Reference stream Scrapers Baetis sp. Pre 0.0 0.0 0.0 91.5 8.5 0.0 Ectopria sp. Pre 0.0 0.0 0.0 73.8 26.2 0.0
Enr 1 3.4 0.0 1.9 64.9 29.7 0.0Enr 2 0.9 5.0 2.2 52.7 39.2 0.0
Epeorus sp. Pre 0.7 0.0 0.4 76.7 22.3 0.0Enr 1 5.6 0.0 3.2 82.4 8.5 0.3Enr 2 1.5 0.0 0.8 82.5 15.1 0.0
Neophylax sp. Pre 0.0 0.0 0.0 99.4 0.6 0.0Enr 1 0.0 0.0 0.0 47.1 52.9 0.0Enr 2 0.0 0.0 0.0 7.3 92.7 0.0

273
Appendix D. (cont.)
Stream/Functional group/TaxonTreatment
period Leaves Wood Fungi Amorphous Diatoms Animals
Treatment stream ScrapersBaetis sp. Pre 13.3 0.0 7.6 60.8 18.3 0.0
Enr 2 0.4 0.0 0.3 92.1 7.1 0.0Ectopria sp. Enr 1 2.8 0.0 2.2 74.9 20.2 0.0
Enr 2 7.7 0.0 6.1 56.1 30.2 0.0Epeorus sp. Pre 0.0 0.4 0.1 86.1 13.4 0.0
Enr 1 0.3 0.0 0.2 85.8 13.7 0.0Enr 2 0.9 0.0 0.7 76.2 22.1 0.0
Neophylax sp. Enr 1 0.0 0.0 0.0 42.3 57.6 0.0Enr 2 0.6 0.0 0.5 92.2 6.7 0.0