CROSS TABS -...
361
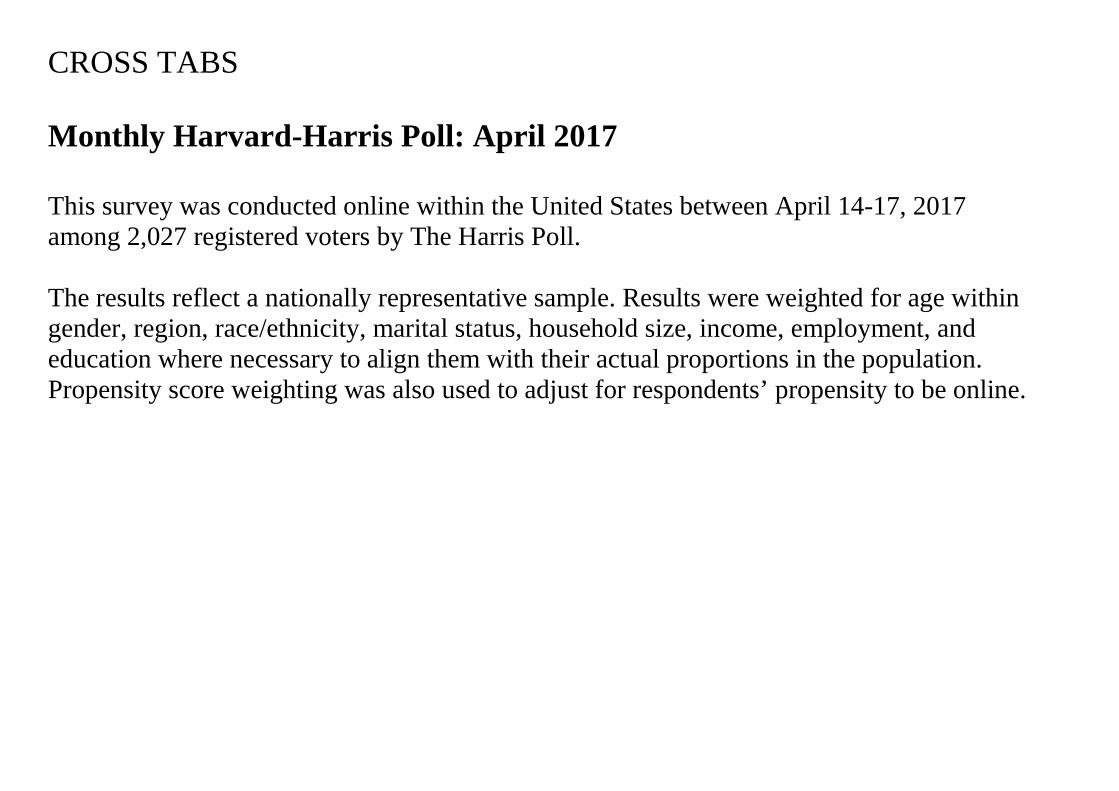
CROSS TABS Monthly Harvard-Harris Poll: April 2017 This survey was conducted online within the United States between April 14-17, 2017 among 2,027 registered voters by The Harris Poll. The results reflect a nationally representative sample. Results were weighted for age within gender, region, race/ethnicity, marital status, household size, income, employment, and education where necessary to align them with their actual proportions in the population. Propensity score weighting was also used to adjust for respondents’ propensity to be online.
Transcript of CROSS TABS -...
CROSS TABS Monthly Harvard-Harris Poll: April 2017 This survey was conducted online within the United States between April 14-17, 2017 among 2,027 registered voters by The Harris Poll. The results reflect a nationally representative sample. Results were weighted for age within gender, region, race/ethnicity, marital status, household size, income, employment, and education where necessary to align them with their actual proportions in the population. Propensity score weighting was also used to adjust for respondents’ propensity to be online.
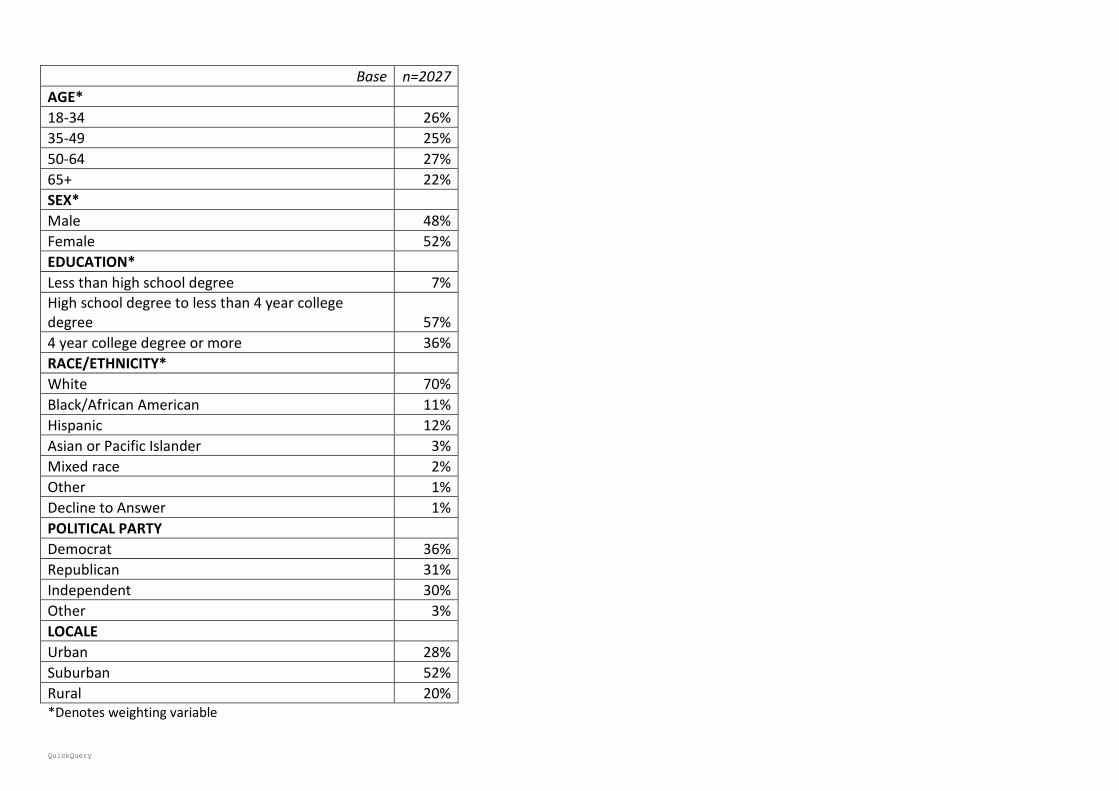
Base n=2027
AGE* 18-34 26% 35-49 25% 50-64 27% 65+ 22% SEX* Male 48% Female 52% EDUCATION* Less than high school degree 7% High school degree to less than 4 year college degree 57% 4 year college degree or more 36% RACE/ETHNICITY* White 70% Black/African American 11% Hispanic 12% Asian or Pacific Islander 3% Mixed race 2% Other 1% Decline to Answer 1% POLITICAL PARTY Democrat 36% Republican 31% Independent 30% Other 3% LOCALE Urban 28% Suburban 52% Rural 20% *Denotes weighting variable
QuickQuery
Page 1
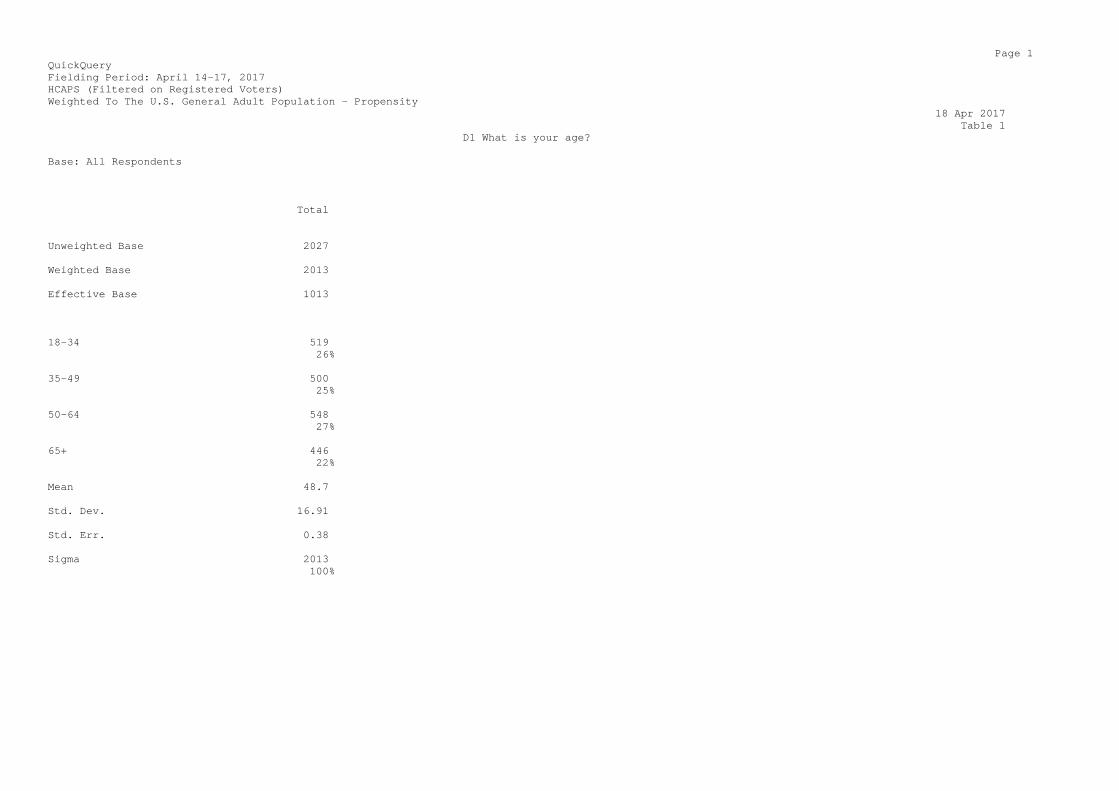
QuickQuery Fielding Period: April 14-17, 2017 HCAPS (Filtered on Registered Voters) Weighted To The U.S. General Adult Population - Propensity 18 Apr 2017 Table 1 D1 What is your age? Base: All Respondents Total Unweighted Base 2027 Weighted Base 2013 Effective Base 1013 18-34 519 26% 35-49 500 25% 50-64 548 27% 65+ 446 22% Mean 48.7 Std. Dev. 16.91 Std. Err. 0.38 Sigma 2013 100%
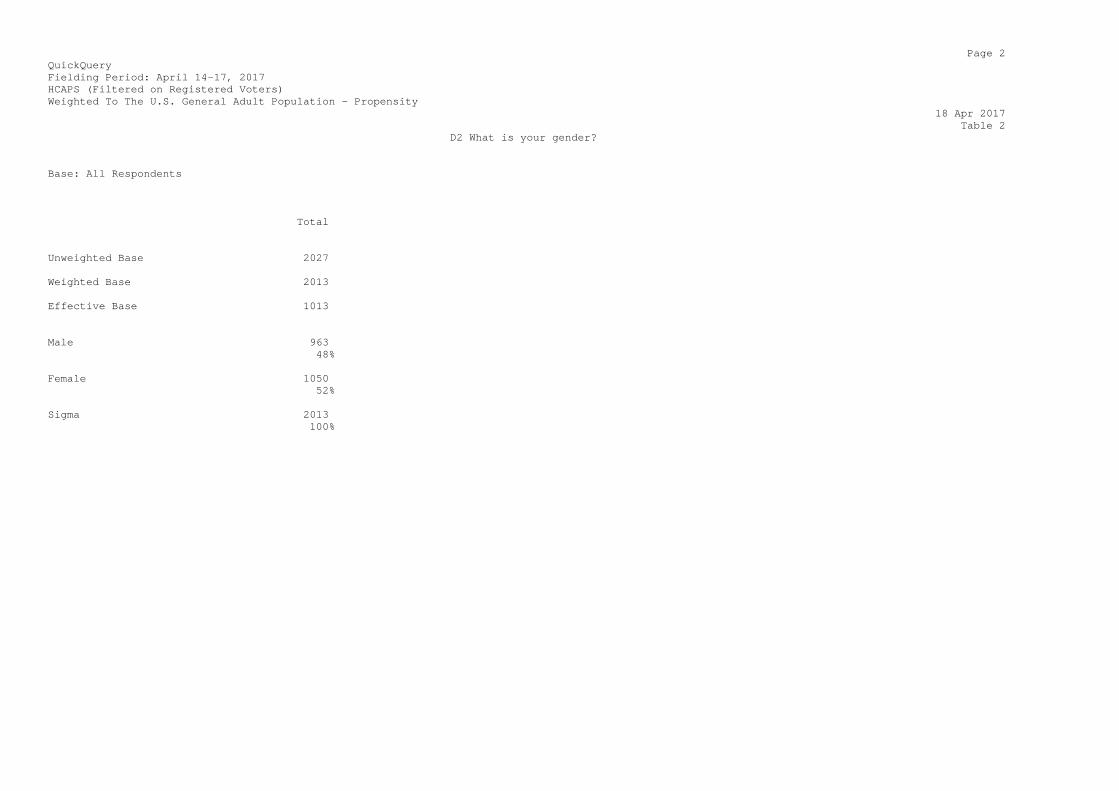
Page 2 QuickQuery Fielding Period: April 14-17, 2017 HCAPS (Filtered on Registered Voters) Weighted To The U.S. General Adult Population - Propensity 18 Apr 2017 Table 2 D2 What is your gender? Base: All Respondents Total Unweighted Base 2027 Weighted Base 2013 Effective Base 1013 Male 963 48% Female 1050 52% Sigma 2013 100%
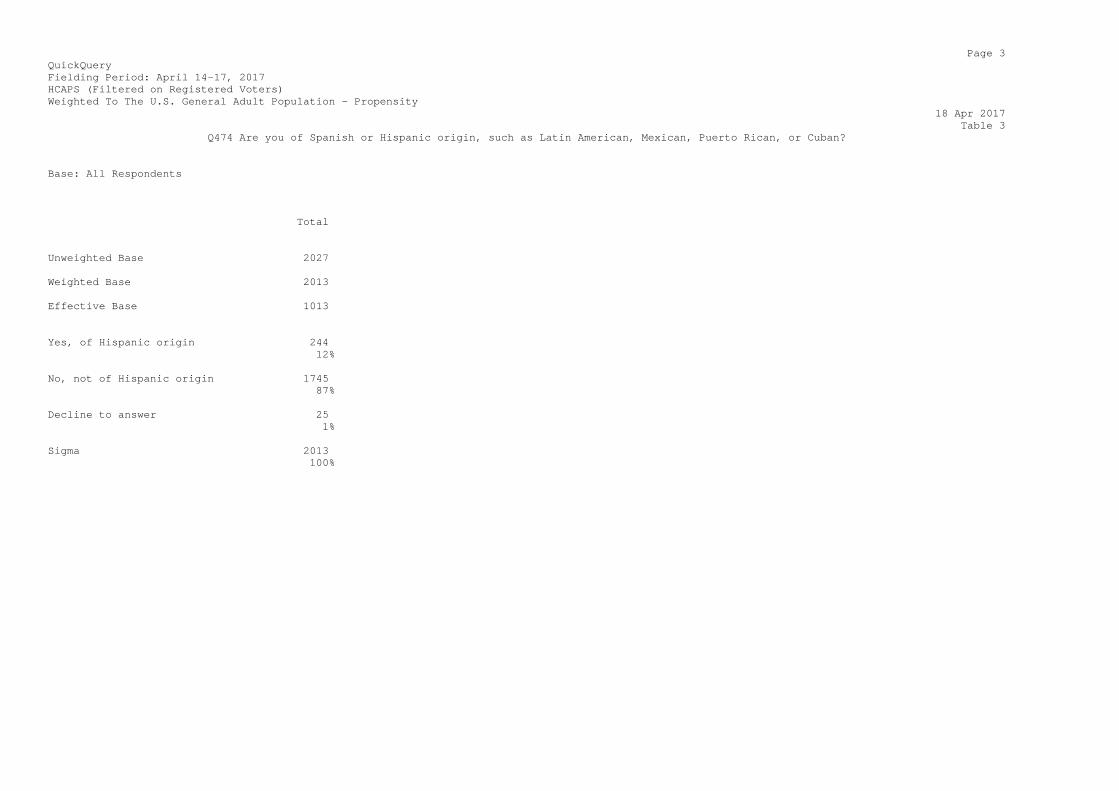
Page 3 QuickQuery Fielding Period: April 14-17, 2017 HCAPS (Filtered on Registered Voters) Weighted To The U.S. General Adult Population - Propensity 18 Apr 2017 Table 3 Q474 Are you of Spanish or Hispanic origin, such as Latin American, Mexican, Puerto Rican, or Cuban? Base: All Respondents Total Unweighted Base 2027 Weighted Base 2013 Effective Base 1013 Yes, of Hispanic origin 244 12% No, not of Hispanic origin 1745 87% Decline to answer 25 1% Sigma 2013 100%
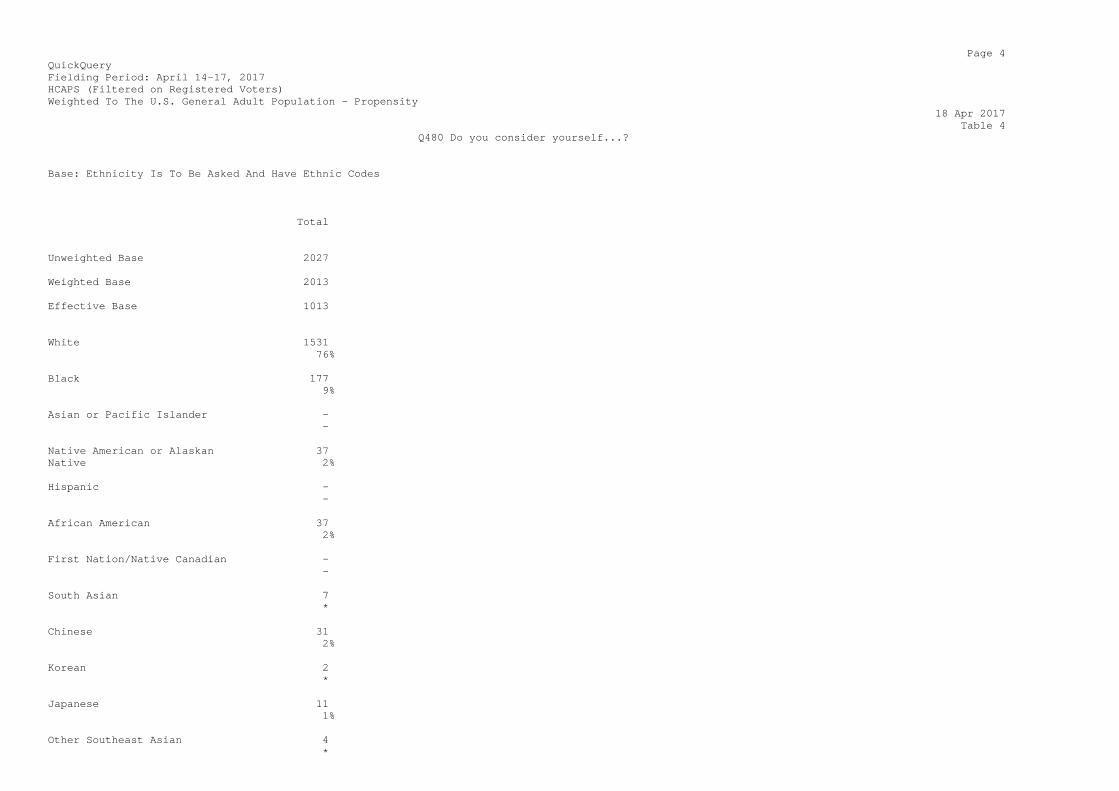
Page 4 QuickQuery Fielding Period: April 14-17, 2017 HCAPS (Filtered on Registered Voters) Weighted To The U.S. General Adult Population - Propensity 18 Apr 2017 Table 4 Q480 Do you consider yourself...? Base: Ethnicity Is To Be Asked And Have Ethnic Codes Total Unweighted Base 2027 Weighted Base 2013 Effective Base 1013 White 1531 76% Black 177 9% Asian or Pacific Islander - - Native American or Alaskan 37 Native 2% Hispanic - - African American 37 2% First Nation/Native Canadian - - South Asian 7 * Chinese 31 2% Korean 2 * Japanese 11 1% Other Southeast Asian 4 *

Filipino 8 * Arab/West Asian - - Mixed Race 84 4% Some other race 59 3% Decline to Answer 23 1%
Page 5 QuickQuery Fielding Period: April 14-17, 2017 HCAPS (Filtered on Registered Voters) Weighted To The U.S. General Adult Population - Propensity 18 Apr 2017 Table 4 Q480 Do you consider yourself...? Base: Ethnicity Is To Be Asked And Have Ethnic Codes Total Weighted Base 2013 Sigma 2013 100%
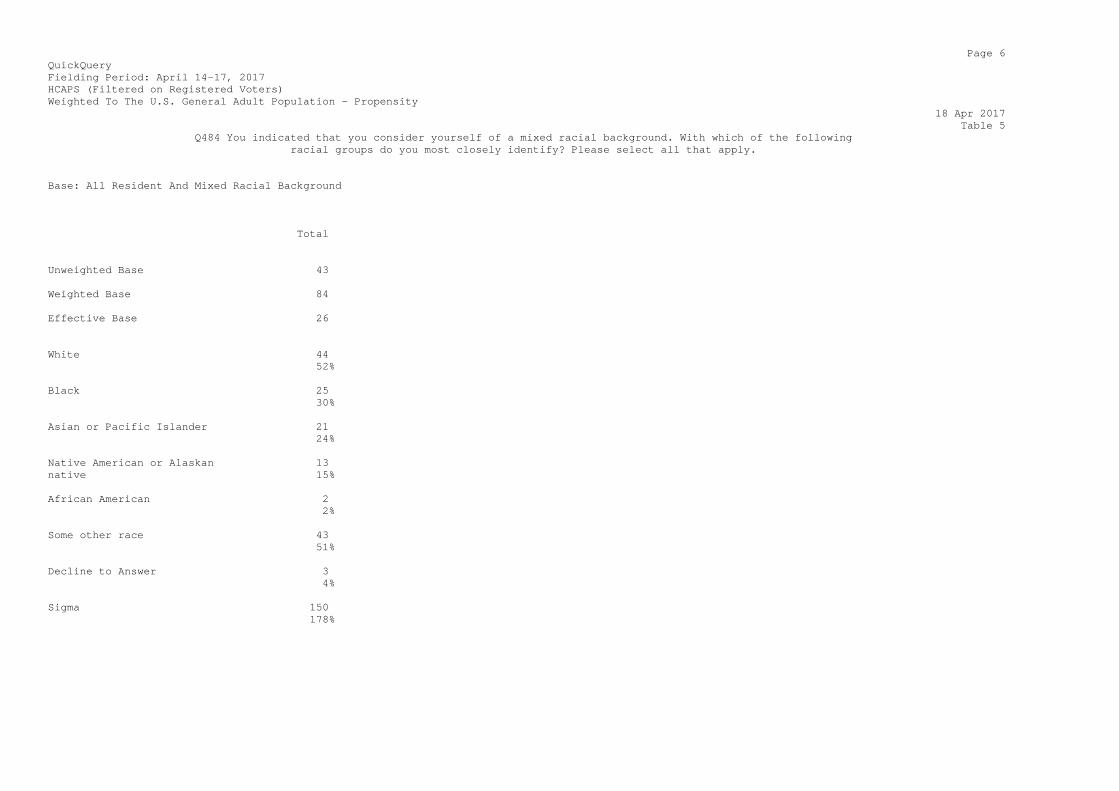
Page 6 QuickQuery Fielding Period: April 14-17, 2017 HCAPS (Filtered on Registered Voters) Weighted To The U.S. General Adult Population - Propensity 18 Apr 2017 Table 5 Q484 You indicated that you consider yourself of a mixed racial background. With which of the following racial groups do you most closely identify? Please select all that apply. Base: All Resident And Mixed Racial Background Total Unweighted Base 43 Weighted Base 84 Effective Base 26 White 44 52% Black 25 30% Asian or Pacific Islander 21 24% Native American or Alaskan 13 native 15% African American 2 2% Some other race 43 51% Decline to Answer 3 4% Sigma 150 178%
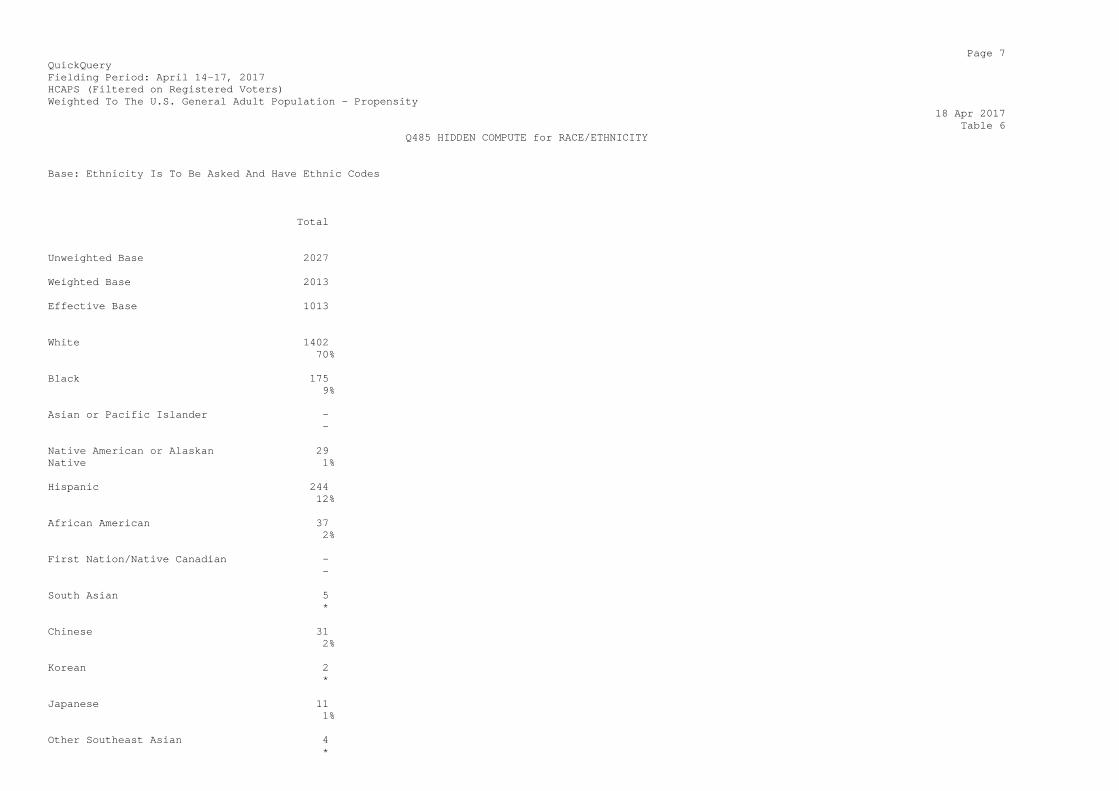
Page 7 QuickQuery Fielding Period: April 14-17, 2017 HCAPS (Filtered on Registered Voters) Weighted To The U.S. General Adult Population - Propensity 18 Apr 2017 Table 6 Q485 HIDDEN COMPUTE for RACE/ETHNICITY Base: Ethnicity Is To Be Asked And Have Ethnic Codes Total Unweighted Base 2027 Weighted Base 2013 Effective Base 1013 White 1402 70% Black 175 9% Asian or Pacific Islander - - Native American or Alaskan 29 Native 1% Hispanic 244 12% African American 37 2% First Nation/Native Canadian - - South Asian 5 * Chinese 31 2% Korean 2 * Japanese 11 1% Other Southeast Asian 4 *

Filipino 8 * Arab/West Asian - - Mixed Race 42 2% Some other race 6 * Decline to Answer 16 1%
Page 8 QuickQuery Fielding Period: April 14-17, 2017 HCAPS (Filtered on Registered Voters) Weighted To The U.S. General Adult Population - Propensity 18 Apr 2017 Table 6 Q485 HIDDEN COMPUTE for RACE/ETHNICITY Base: Ethnicity Is To Be Asked And Have Ethnic Codes Total Weighted Base 2013 Sigma 2013 100%
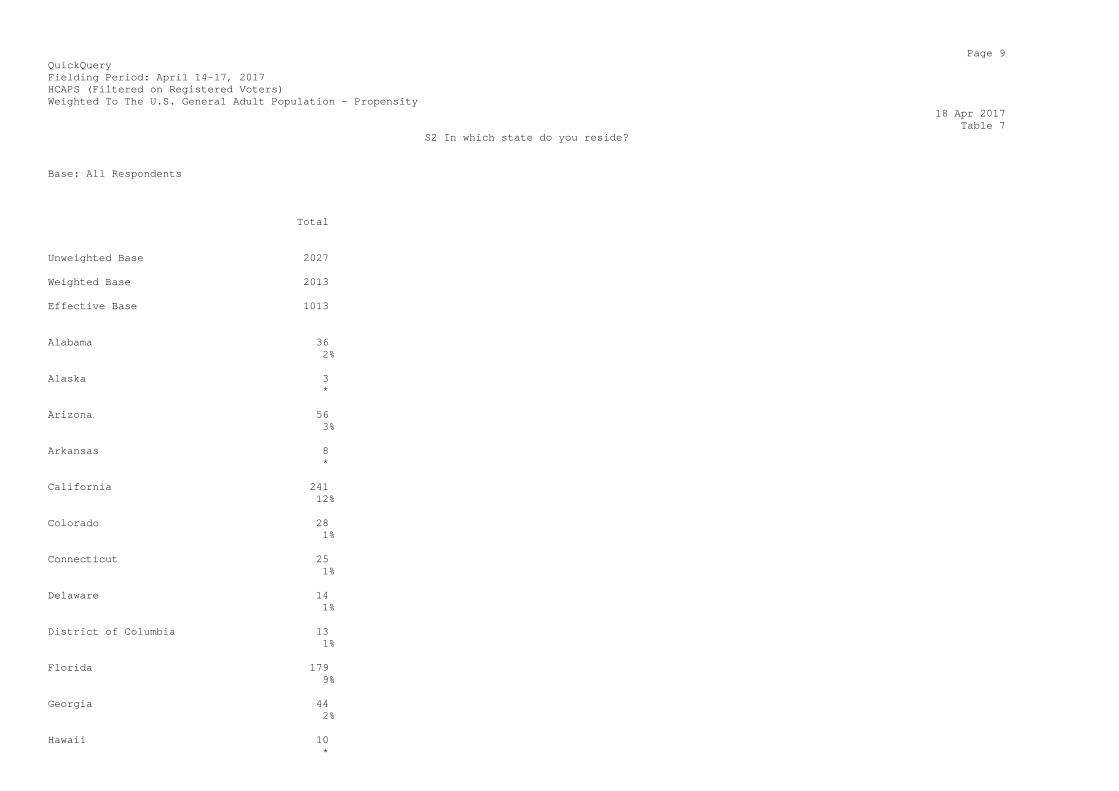
Page 9 QuickQuery Fielding Period: April 14-17, 2017 HCAPS (Filtered on Registered Voters) Weighted To The U.S. General Adult Population - Propensity 18 Apr 2017 Table 7 S2 In which state do you reside? Base: All Respondents Total Unweighted Base 2027 Weighted Base 2013 Effective Base 1013 Alabama 36 2% Alaska 3 * Arizona 56 3% Arkansas 8 * California 241 12% Colorado 28 1% Connecticut 25 1% Delaware 14 1% District of Columbia 13 1% Florida 179 9% Georgia 44 2% Hawaii 10 *

Idaho 9 * Illinois 75 4% Indiana 28 1% Iowa 26 1% Kansas 16 1%

Page 10 QuickQuery Fielding Period: April 14-17, 2017 HCAPS (Filtered on Registered Voters) Weighted To The U.S. General Adult Population - Propensity 18 Apr 2017 Table 7 S2 In which state do you reside? Base: All Respondents Total Weighted Base 2013 Kentucky 16 1% Louisiana 8 * Maine 8 * Maryland 22 1% Massachusetts 38 2% Michigan 47 2% Minnesota 55 3% Mississippi 6 * Missouri 34 2% Montana 3 * Nebraska 14 1% Nevada 31 2% New Hampshire 7 * New Jersey 64 3%
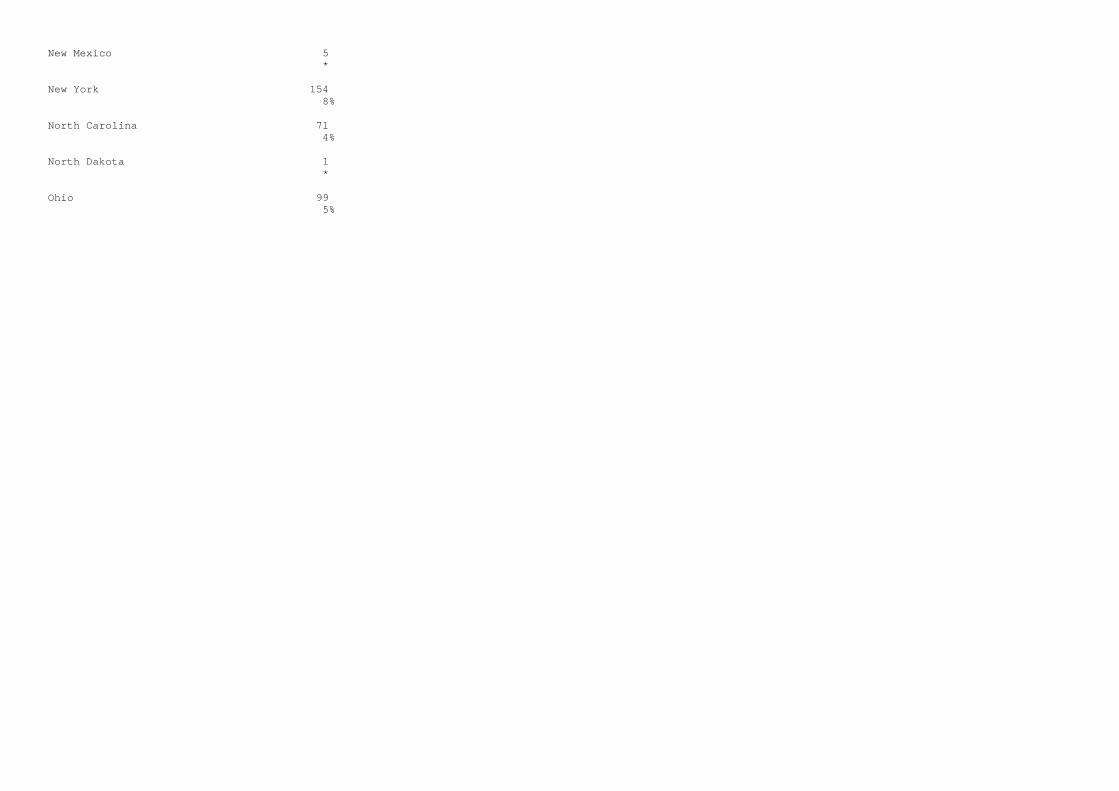
New Mexico 5 * New York 154 8% North Carolina 71 4% North Dakota 1 * Ohio 99 5%
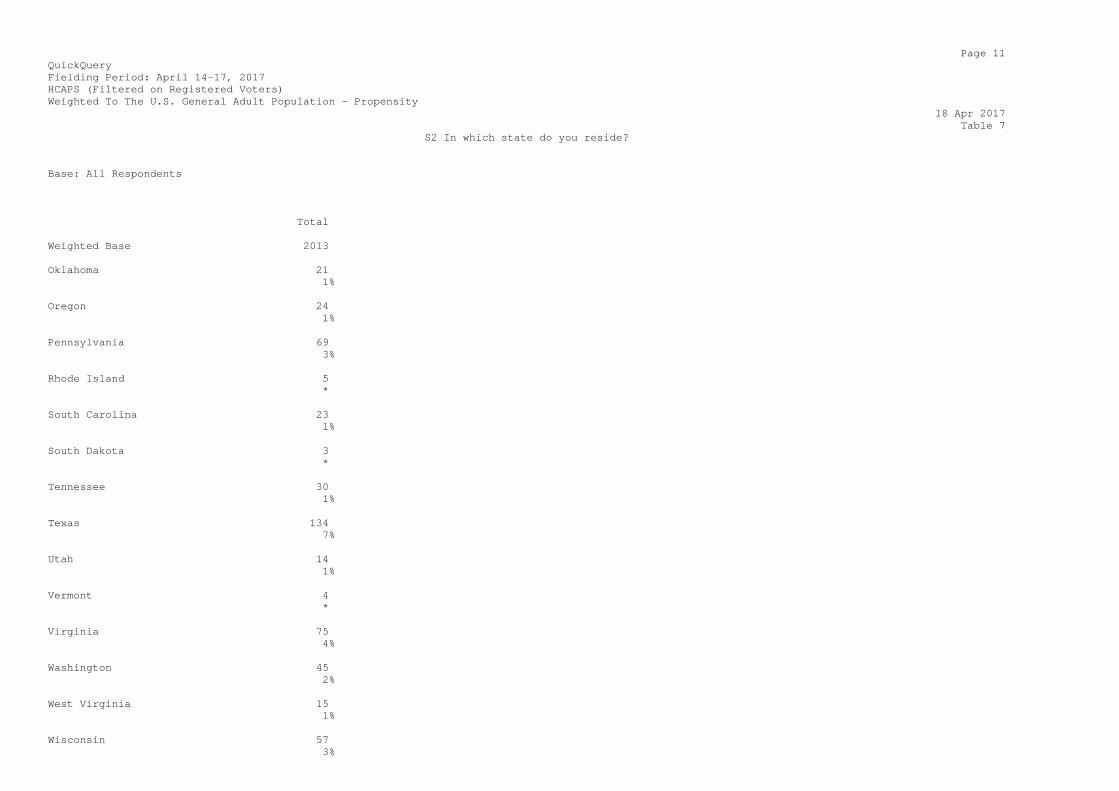
Page 11 QuickQuery Fielding Period: April 14-17, 2017 HCAPS (Filtered on Registered Voters) Weighted To The U.S. General Adult Population - Propensity 18 Apr 2017 Table 7 S2 In which state do you reside? Base: All Respondents Total Weighted Base 2013 Oklahoma 21 1% Oregon 24 1% Pennsylvania 69 3% Rhode Island 5 * South Carolina 23 1% South Dakota 3 * Tennessee 30 1% Texas 134 7% Utah 14 1% Vermont 4 * Virginia 75 4% Washington 45 2% West Virginia 15 1% Wisconsin 57 3%

Wyoming 3 * Sigma 2013 100%
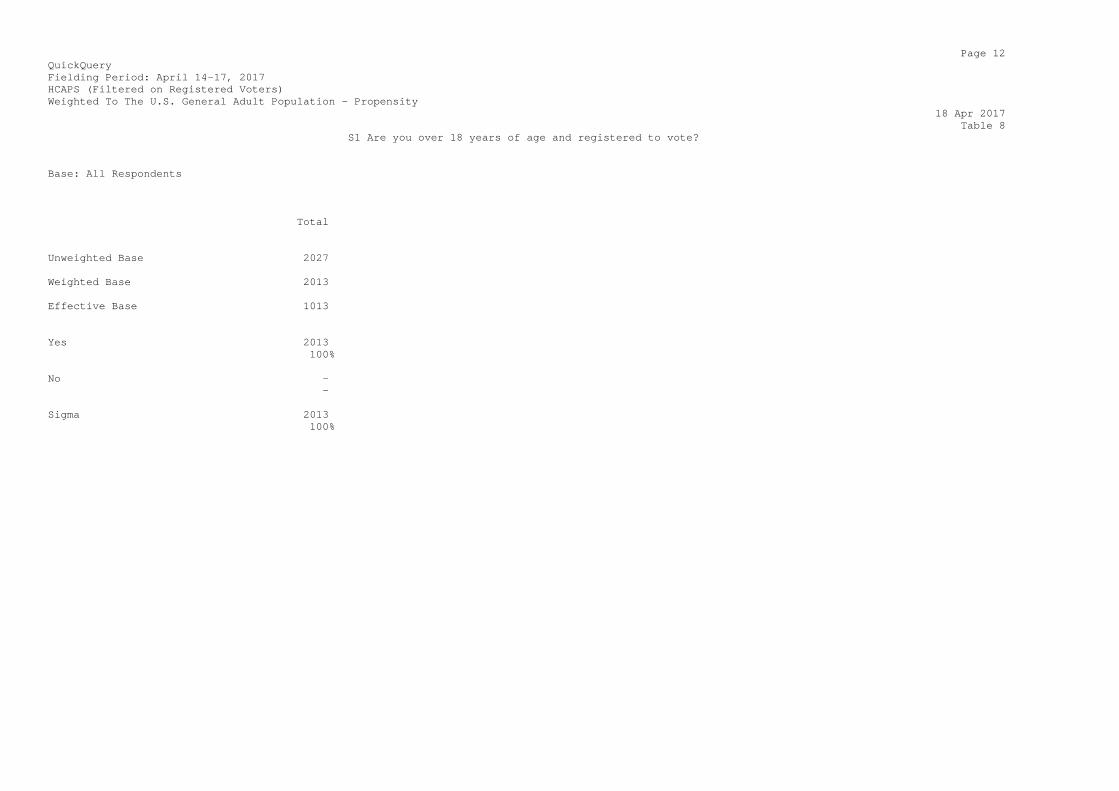
Page 12 QuickQuery Fielding Period: April 14-17, 2017 HCAPS (Filtered on Registered Voters) Weighted To The U.S. General Adult Population - Propensity 18 Apr 2017 Table 8 S1 Are you over 18 years of age and registered to vote? Base: All Respondents Total Unweighted Base 2027 Weighted Base 2013 Effective Base 1013 Yes 2013 100% No - - Sigma 2013 100%
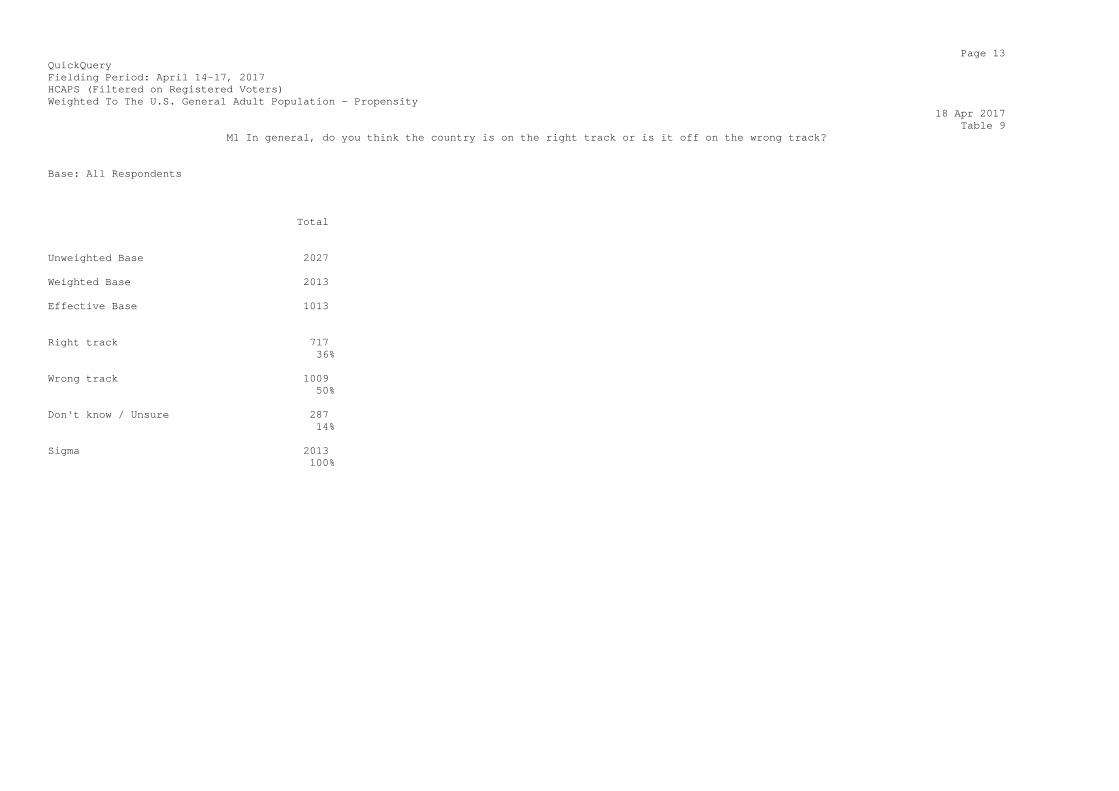
Page 13 QuickQuery Fielding Period: April 14-17, 2017 HCAPS (Filtered on Registered Voters) Weighted To The U.S. General Adult Population - Propensity 18 Apr 2017 Table 9 M1 In general, do you think the country is on the right track or is it off on the wrong track? Base: All Respondents Total Unweighted Base 2027 Weighted Base 2013 Effective Base 1013 Right track 717 36% Wrong track 1009 50% Don't know / Unsure 287 14% Sigma 2013 100%
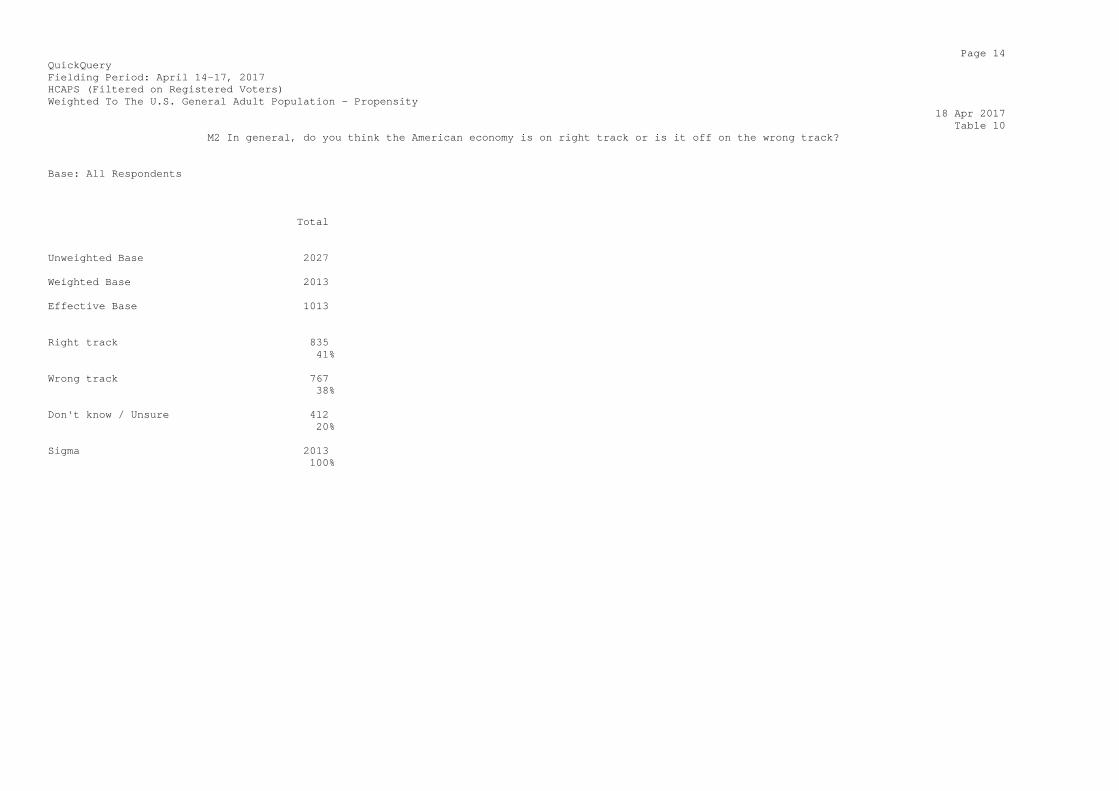
Page 14 QuickQuery Fielding Period: April 14-17, 2017 HCAPS (Filtered on Registered Voters) Weighted To The U.S. General Adult Population - Propensity 18 Apr 2017 Table 10 M2 In general, do you think the American economy is on right track or is it off on the wrong track? Base: All Respondents Total Unweighted Base 2027 Weighted Base 2013 Effective Base 1013 Right track 835 41% Wrong track 767 38% Don't know / Unsure 412 20% Sigma 2013 100%

Page 15 QuickQuery Fielding Period: April 14-17, 2017 HCAPS (Filtered on Registered Voters) Weighted To The U.S. General Adult Population - Propensity 18 Apr 2017 Table 11 M3 Do you approve or disapprove of the job Donald Trump is doing as President of the United States? Base: All Respondents Total Unweighted Base 2027 Weighted Base 2013 Effective Base 1013 Strongly/Somewhat Approve 966 (Net) 48% Strongly approve 452 22% Somewhat approve 514 26% Strongly/Somewhat Disapprove 1047 (Net) 52% Somewhat disapprove 293 15% Strongly disapprove 754 37% Sigma 2013 100%
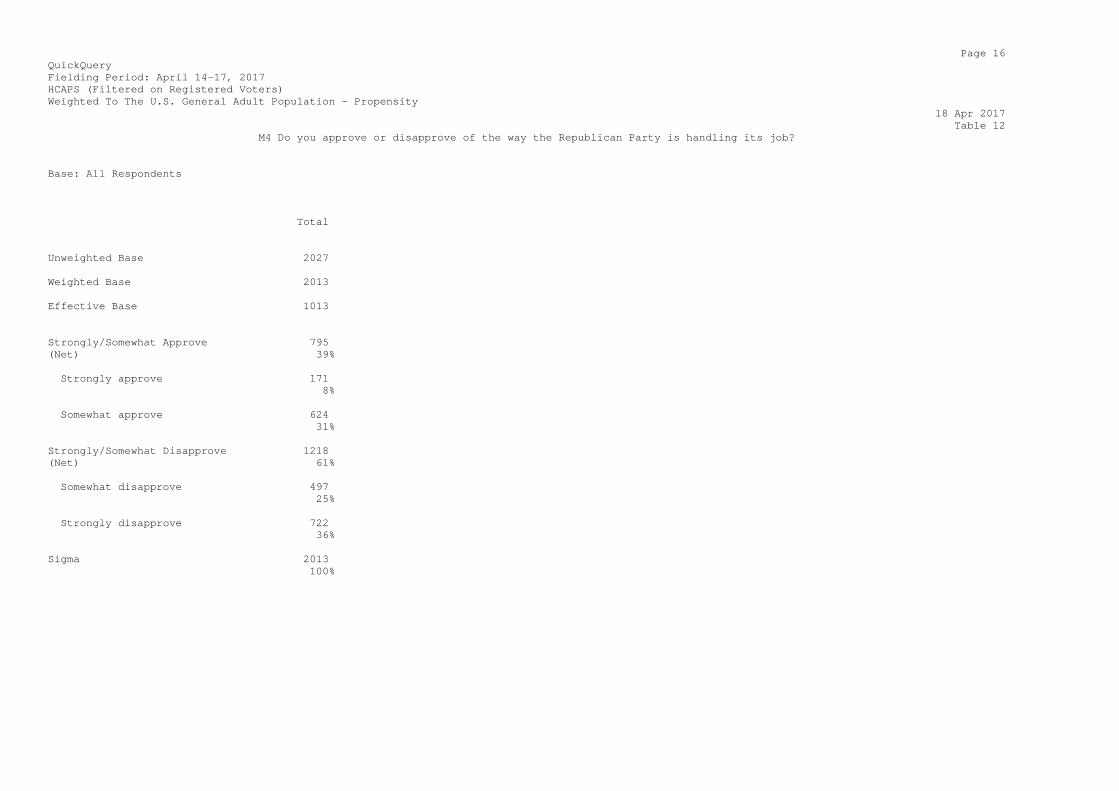
Page 16 QuickQuery Fielding Period: April 14-17, 2017 HCAPS (Filtered on Registered Voters) Weighted To The U.S. General Adult Population - Propensity 18 Apr 2017 Table 12 M4 Do you approve or disapprove of the way the Republican Party is handling its job? Base: All Respondents Total Unweighted Base 2027 Weighted Base 2013 Effective Base 1013 Strongly/Somewhat Approve 795 (Net) 39% Strongly approve 171 8% Somewhat approve 624 31% Strongly/Somewhat Disapprove 1218 (Net) 61% Somewhat disapprove 497 25% Strongly disapprove 722 36% Sigma 2013 100%
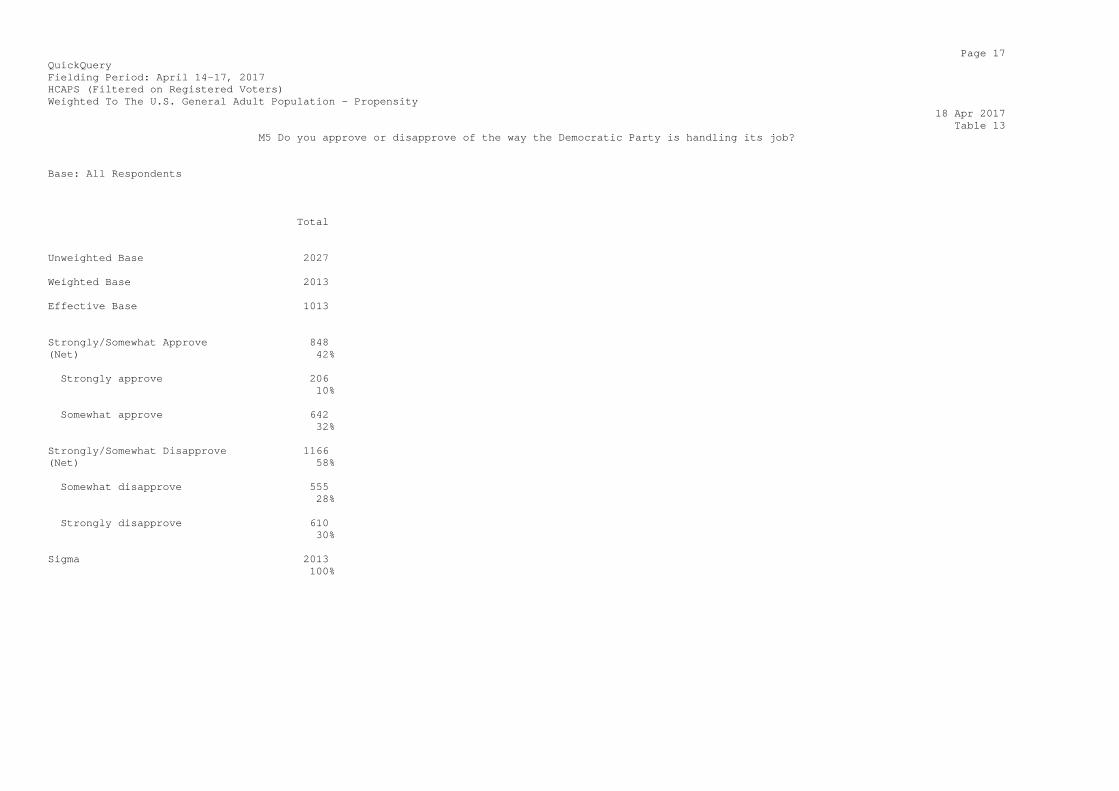
Page 17 QuickQuery Fielding Period: April 14-17, 2017 HCAPS (Filtered on Registered Voters) Weighted To The U.S. General Adult Population - Propensity 18 Apr 2017 Table 13 M5 Do you approve or disapprove of the way the Democratic Party is handling its job? Base: All Respondents Total Unweighted Base 2027 Weighted Base 2013 Effective Base 1013 Strongly/Somewhat Approve 848 (Net) 42% Strongly approve 206 10% Somewhat approve 642 32% Strongly/Somewhat Disapprove 1166 (Net) 58% Somewhat disapprove 555 28% Strongly disapprove 610 30% Sigma 2013 100%
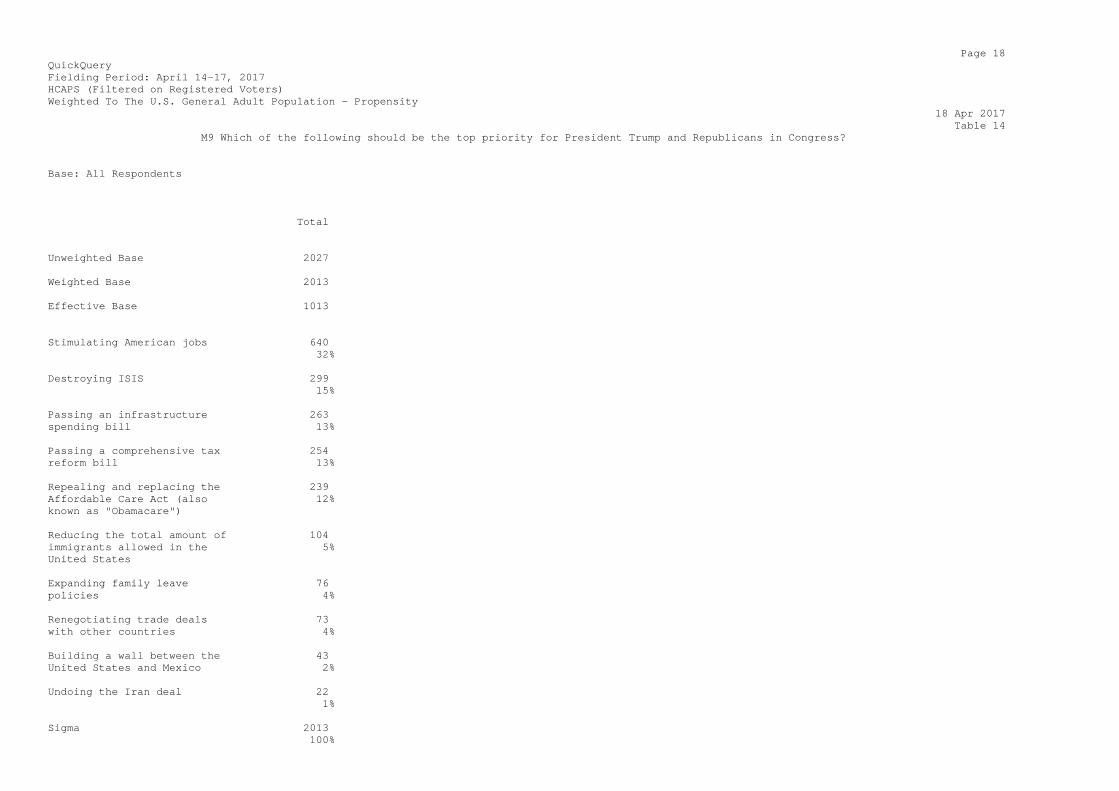
Page 18 QuickQuery Fielding Period: April 14-17, 2017 HCAPS (Filtered on Registered Voters) Weighted To The U.S. General Adult Population - Propensity 18 Apr 2017 Table 14 M9 Which of the following should be the top priority for President Trump and Republicans in Congress? Base: All Respondents Total Unweighted Base 2027 Weighted Base 2013 Effective Base 1013 Stimulating American jobs 640 32% Destroying ISIS 299 15% Passing an infrastructure 263 spending bill 13% Passing a comprehensive tax 254 reform bill 13% Repealing and replacing the 239 Affordable Care Act (also 12% known as "Obamacare") Reducing the total amount of 104 immigrants allowed in the 5% United States Expanding family leave 76 policies 4% Renegotiating trade deals 73 with other countries 4% Building a wall between the 43 United States and Mexico 2% Undoing the Iran deal 22 1% Sigma 2013 100%
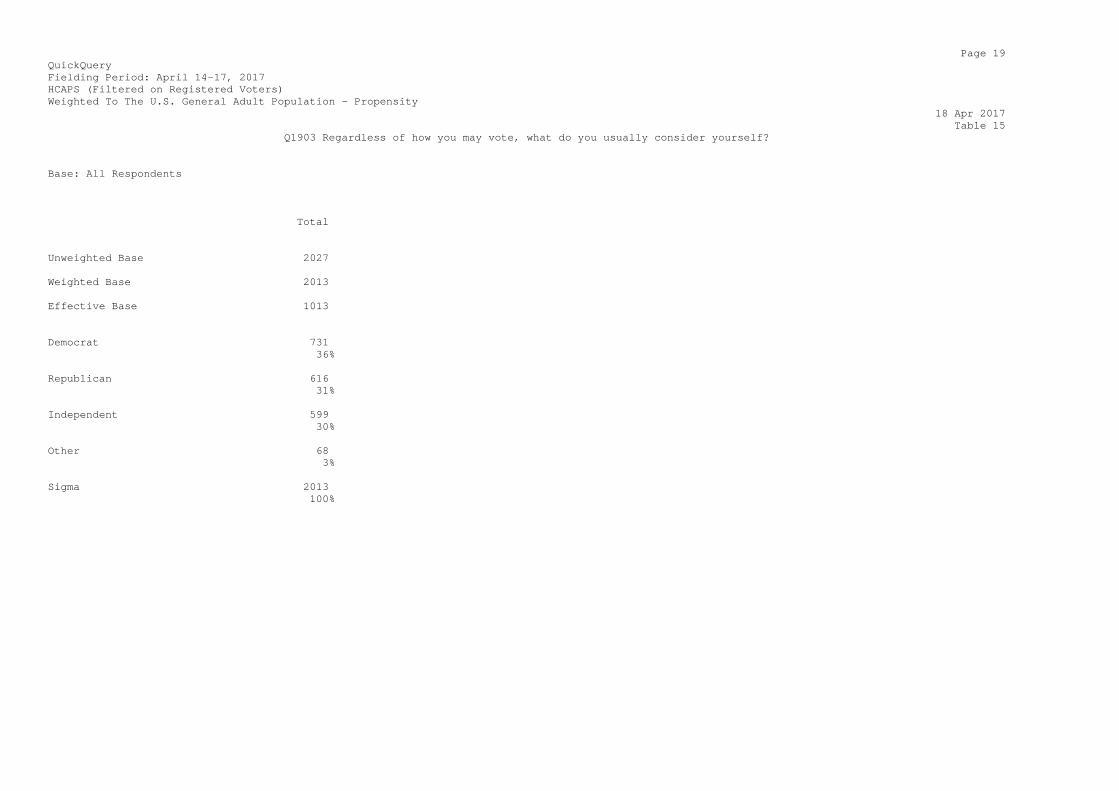
Page 19 QuickQuery Fielding Period: April 14-17, 2017 HCAPS (Filtered on Registered Voters) Weighted To The U.S. General Adult Population - Propensity 18 Apr 2017 Table 15 Q1903 Regardless of how you may vote, what do you usually consider yourself? Base: All Respondents Total Unweighted Base 2027 Weighted Base 2013 Effective Base 1013 Democrat 731 36% Republican 616 31% Independent 599 30% Other 68 3% Sigma 2013 100%
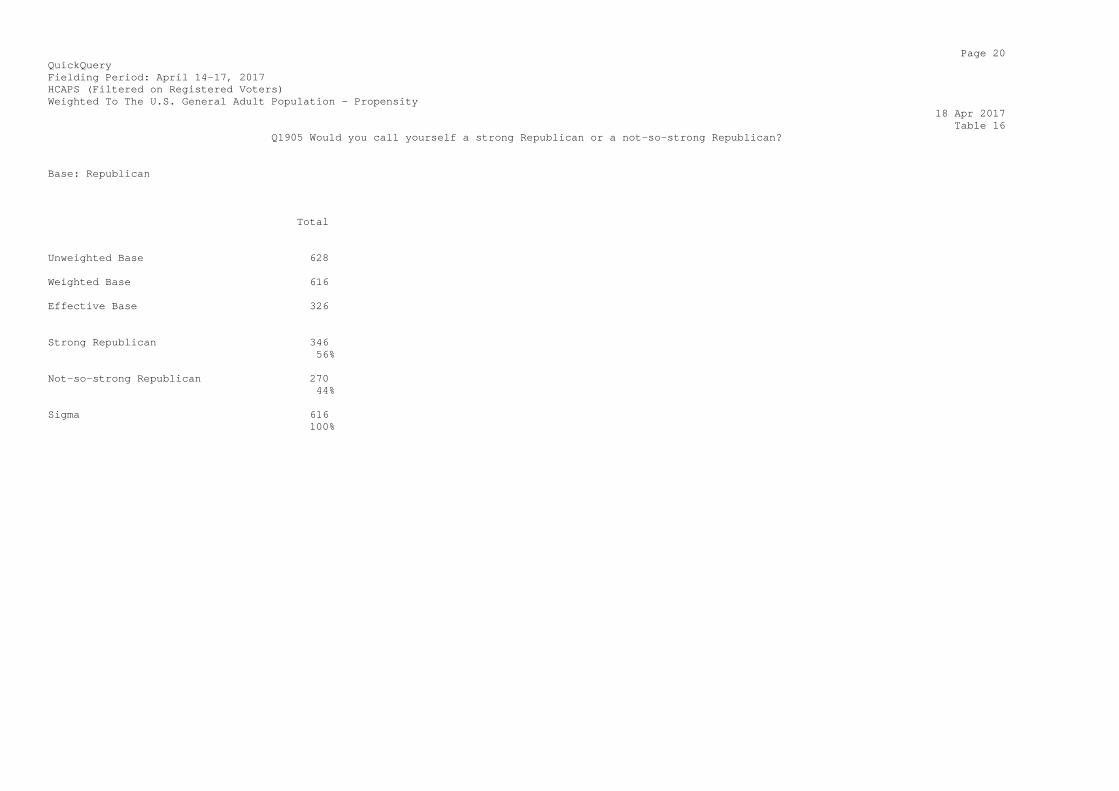
Page 20 QuickQuery Fielding Period: April 14-17, 2017 HCAPS (Filtered on Registered Voters) Weighted To The U.S. General Adult Population - Propensity 18 Apr 2017 Table 16 Q1905 Would you call yourself a strong Republican or a not-so-strong Republican? Base: Republican Total Unweighted Base 628 Weighted Base 616 Effective Base 326 Strong Republican 346 56% Not-so-strong Republican 270 44% Sigma 616 100%
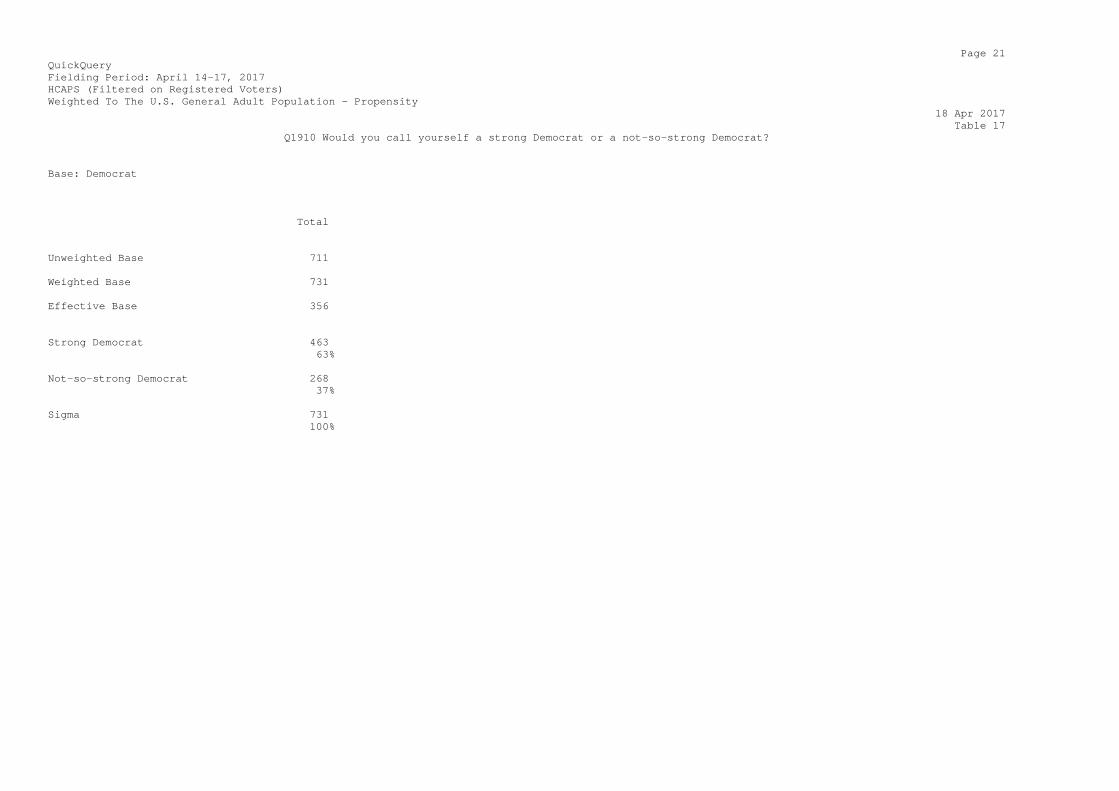
Page 21 QuickQuery Fielding Period: April 14-17, 2017 HCAPS (Filtered on Registered Voters) Weighted To The U.S. General Adult Population - Propensity 18 Apr 2017 Table 17 Q1910 Would you call yourself a strong Democrat or a not-so-strong Democrat? Base: Democrat Total Unweighted Base 711 Weighted Base 731 Effective Base 356 Strong Democrat 463 63% Not-so-strong Democrat 268 37% Sigma 731 100%
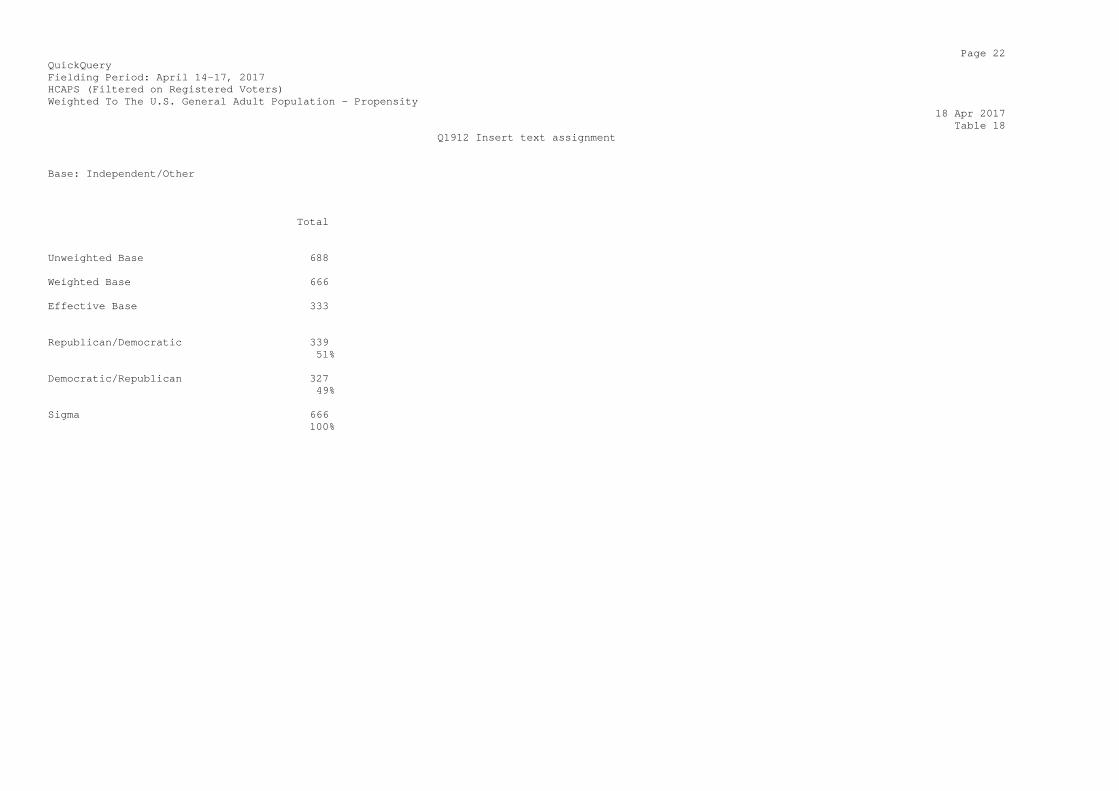
Page 22 QuickQuery Fielding Period: April 14-17, 2017 HCAPS (Filtered on Registered Voters) Weighted To The U.S. General Adult Population - Propensity 18 Apr 2017 Table 18 Q1912 Insert text assignment Base: Independent/Other Total Unweighted Base 688 Weighted Base 666 Effective Base 333 Republican/Democratic 339 51% Democratic/Republican 327 49% Sigma 666 100%
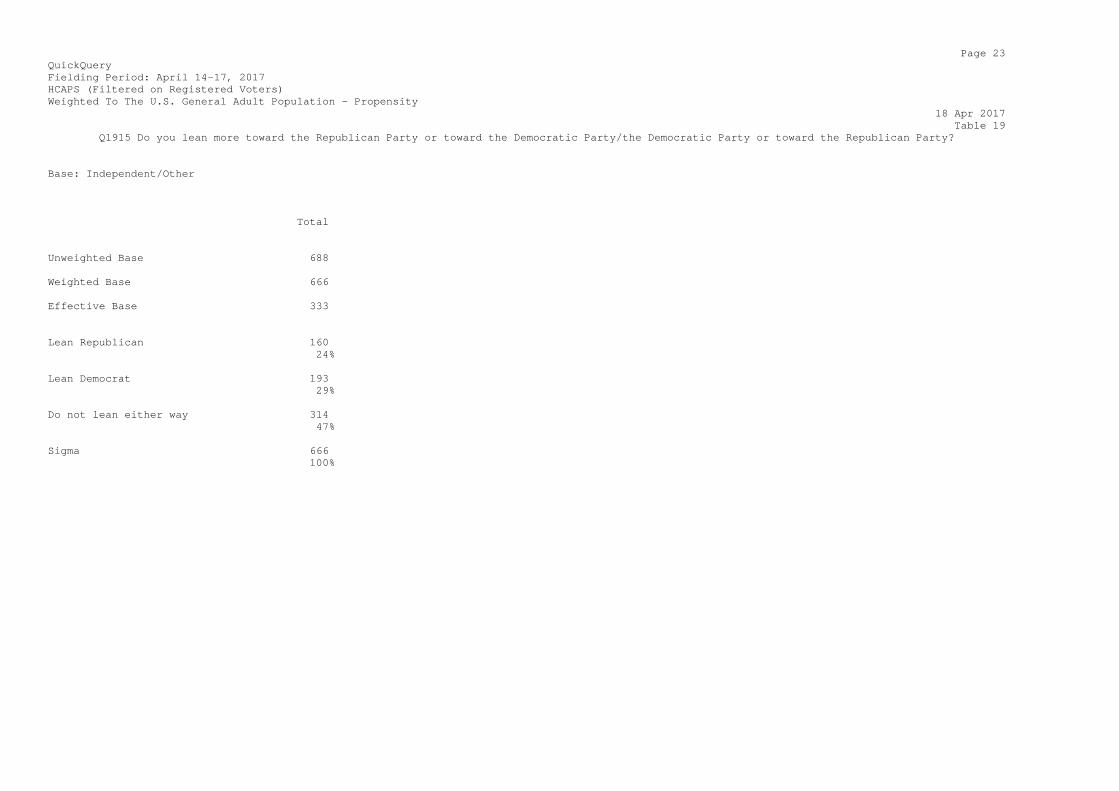
Page 23 QuickQuery Fielding Period: April 14-17, 2017 HCAPS (Filtered on Registered Voters) Weighted To The U.S. General Adult Population - Propensity 18 Apr 2017 Table 19 Q1915 Do you lean more toward the Republican Party or toward the Democratic Party/the Democratic Party or toward the Republican Party? Base: Independent/Other Total Unweighted Base 688 Weighted Base 666 Effective Base 333 Lean Republican 160 24% Lean Democrat 193 29% Do not lean either way 314 47% Sigma 666 100%
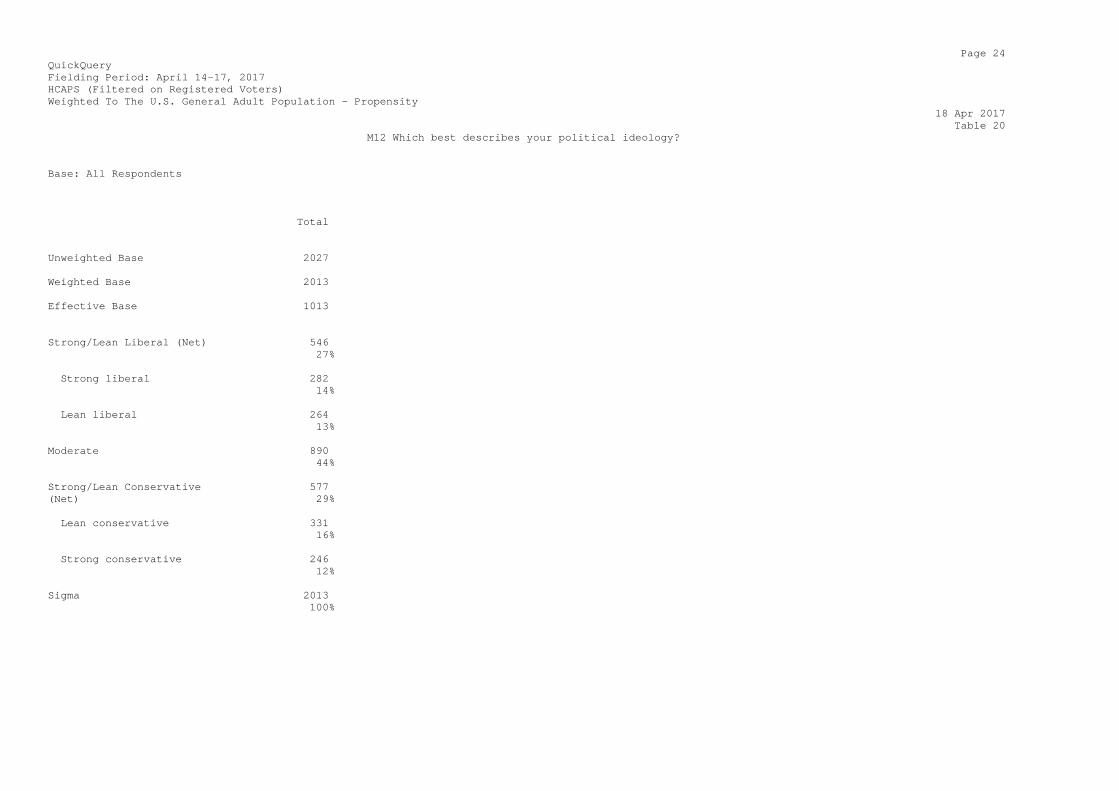
Page 24 QuickQuery Fielding Period: April 14-17, 2017 HCAPS (Filtered on Registered Voters) Weighted To The U.S. General Adult Population - Propensity 18 Apr 2017 Table 20 M12 Which best describes your political ideology? Base: All Respondents Total Unweighted Base 2027 Weighted Base 2013 Effective Base 1013 Strong/Lean Liberal (Net) 546 27% Strong liberal 282 14% Lean liberal 264 13% Moderate 890 44% Strong/Lean Conservative 577 (Net) 29% Lean conservative 331 16% Strong conservative 246 12% Sigma 2013 100%
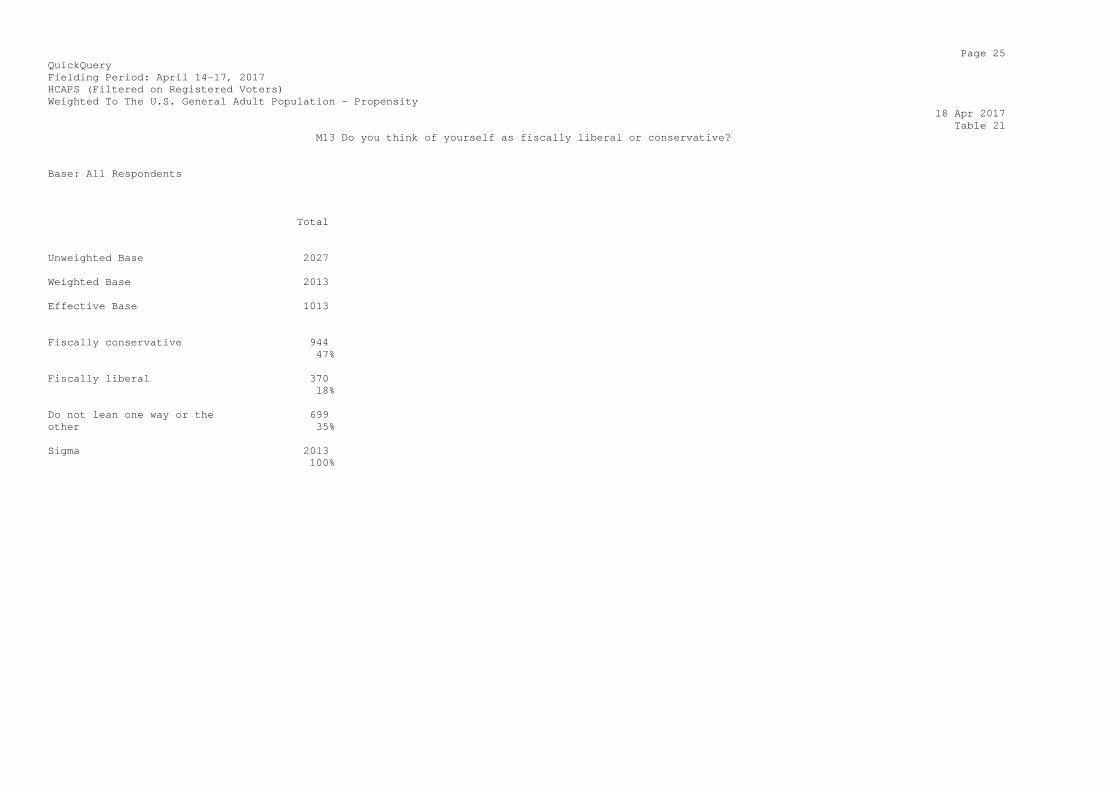
Page 25 QuickQuery Fielding Period: April 14-17, 2017 HCAPS (Filtered on Registered Voters) Weighted To The U.S. General Adult Population - Propensity 18 Apr 2017 Table 21 M13 Do you think of yourself as fiscally liberal or conservative? Base: All Respondents Total Unweighted Base 2027 Weighted Base 2013 Effective Base 1013 Fiscally conservative 944 47% Fiscally liberal 370 18% Do not lean one way or the 699 other 35% Sigma 2013 100%
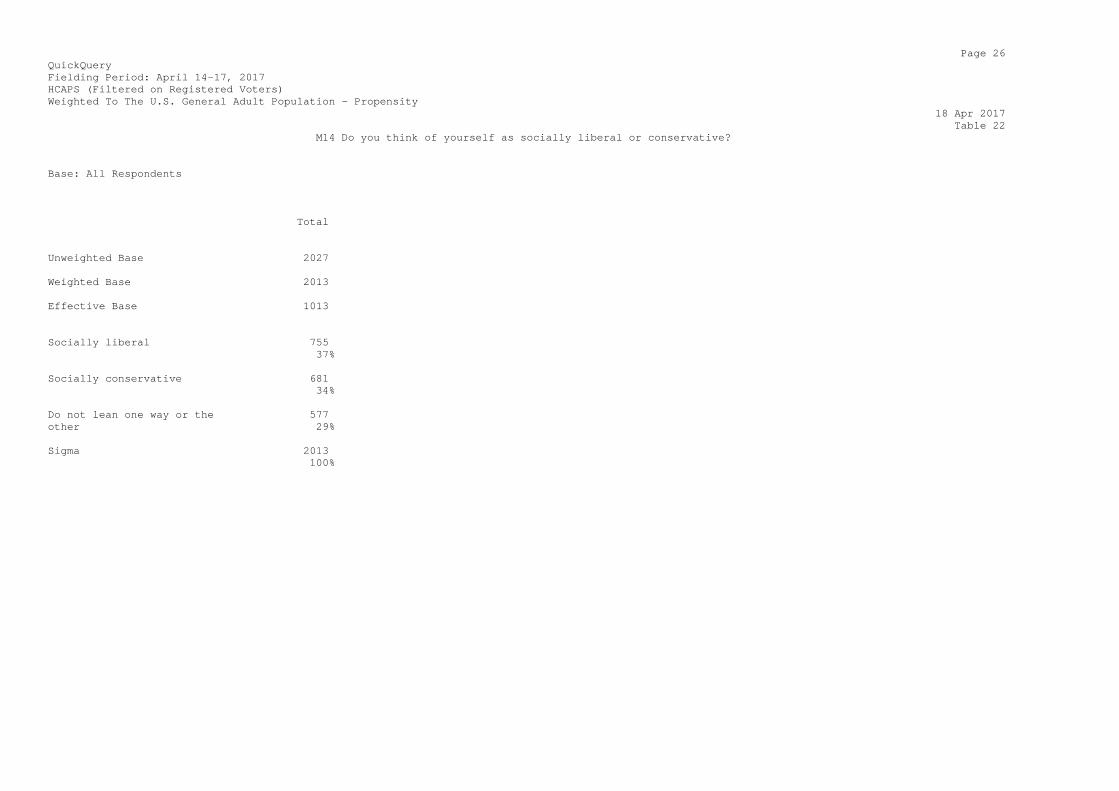
Page 26 QuickQuery Fielding Period: April 14-17, 2017 HCAPS (Filtered on Registered Voters) Weighted To The U.S. General Adult Population - Propensity 18 Apr 2017 Table 22 M14 Do you think of yourself as socially liberal or conservative? Base: All Respondents Total Unweighted Base 2027 Weighted Base 2013 Effective Base 1013 Socially liberal 755 37% Socially conservative 681 34% Do not lean one way or the 577 other 29% Sigma 2013 100%
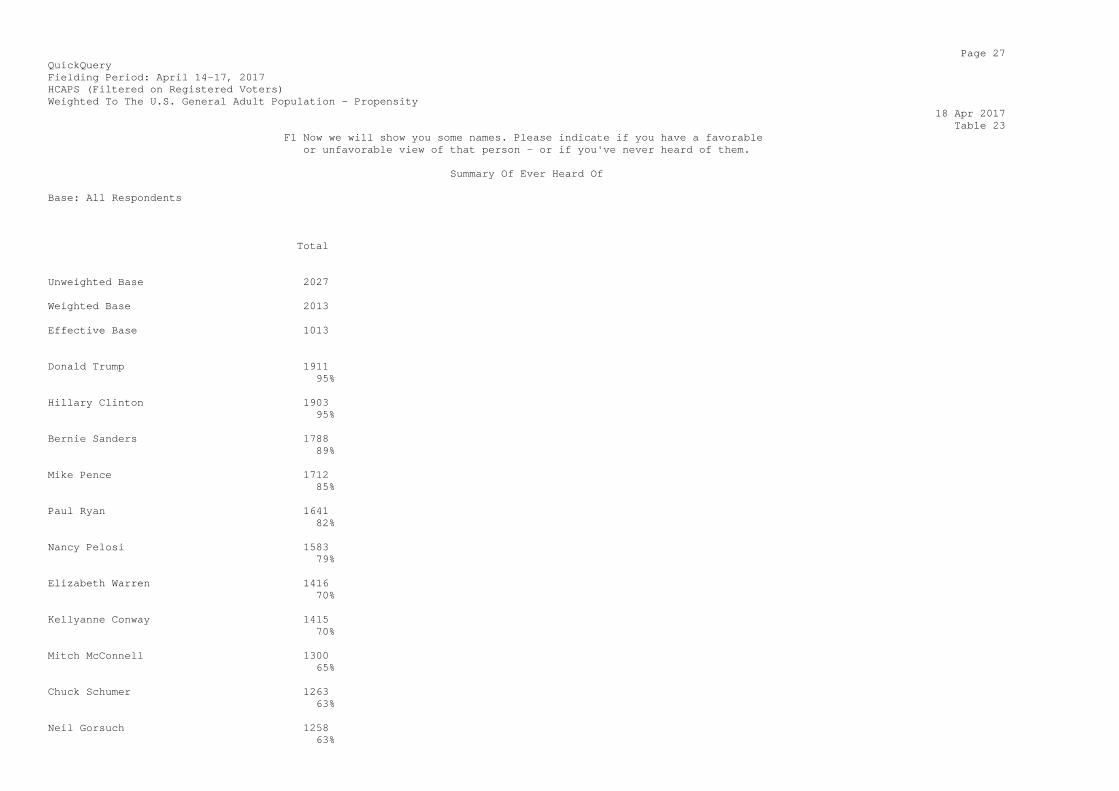
Page 27 QuickQuery Fielding Period: April 14-17, 2017 HCAPS (Filtered on Registered Voters) Weighted To The U.S. General Adult Population - Propensity 18 Apr 2017 Table 23 F1 Now we will show you some names. Please indicate if you have a favorable or unfavorable view of that person - or if you've never heard of them. Summary Of Ever Heard Of Base: All Respondents Total Unweighted Base 2027 Weighted Base 2013 Effective Base 1013 Donald Trump 1911 95% Hillary Clinton 1903 95% Bernie Sanders 1788 89% Mike Pence 1712 85% Paul Ryan 1641 82% Nancy Pelosi 1583 79% Elizabeth Warren 1416 70% Kellyanne Conway 1415 70% Mitch McConnell 1300 65% Chuck Schumer 1263 63% Neil Gorsuch 1258 63%

Stephen Bannon 1235 61% Rex Tillerson 1181 59% Jared Kushner 1140 57% Jim Comey 1084 54% H. R. Macmaster 656 33%
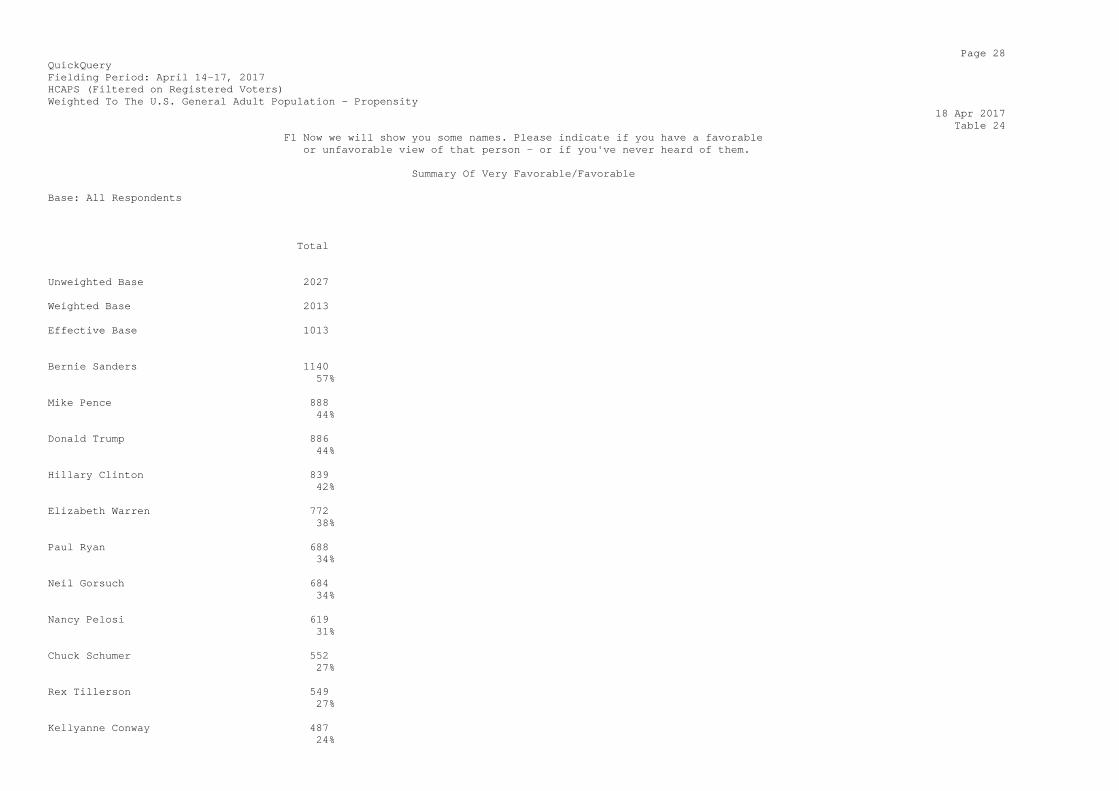
Page 28 QuickQuery Fielding Period: April 14-17, 2017 HCAPS (Filtered on Registered Voters) Weighted To The U.S. General Adult Population - Propensity 18 Apr 2017 Table 24 F1 Now we will show you some names. Please indicate if you have a favorable or unfavorable view of that person - or if you've never heard of them. Summary Of Very Favorable/Favorable Base: All Respondents Total Unweighted Base 2027 Weighted Base 2013 Effective Base 1013 Bernie Sanders 1140 57% Mike Pence 888 44% Donald Trump 886 44% Hillary Clinton 839 42% Elizabeth Warren 772 38% Paul Ryan 688 34% Neil Gorsuch 684 34% Nancy Pelosi 619 31% Chuck Schumer 552 27% Rex Tillerson 549 27% Kellyanne Conway 487 24%

Jared Kushner 465 23% Mitch McConnell 462 23% H. R. Macmaster 399 20% Jim Comey 365 18% Stephen Bannon 332 16%
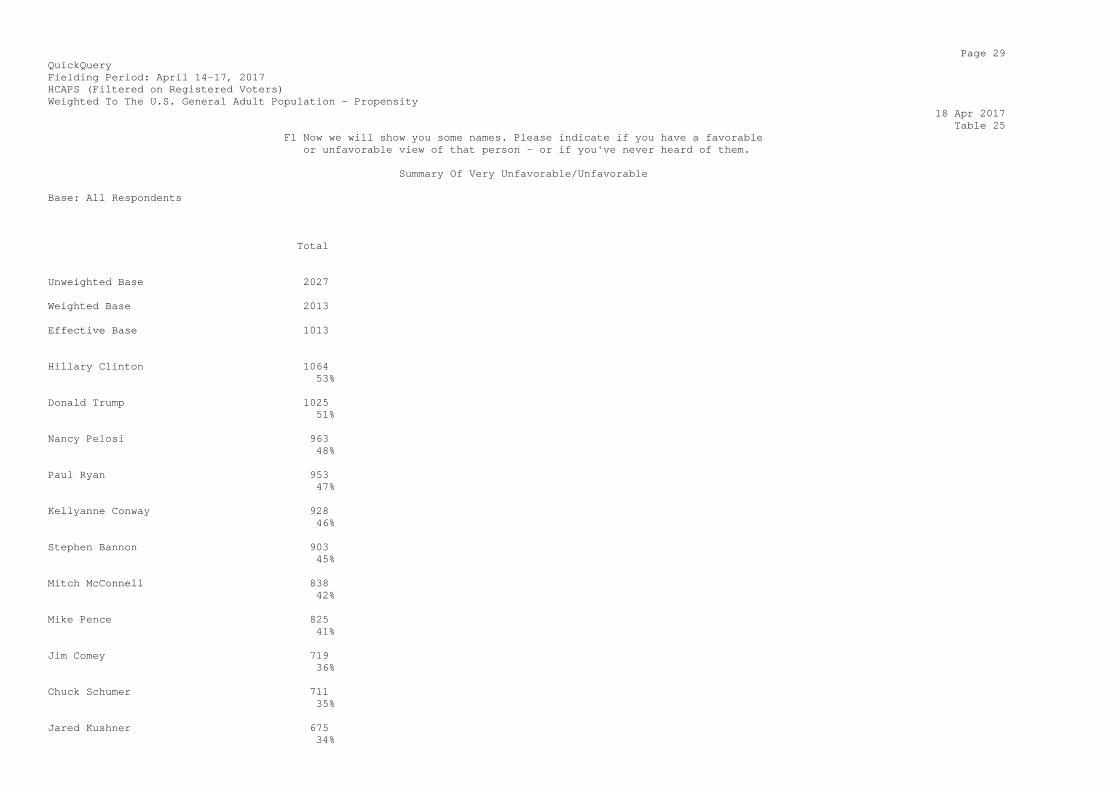
Page 29 QuickQuery Fielding Period: April 14-17, 2017 HCAPS (Filtered on Registered Voters) Weighted To The U.S. General Adult Population - Propensity 18 Apr 2017 Table 25 F1 Now we will show you some names. Please indicate if you have a favorable or unfavorable view of that person - or if you've never heard of them. Summary Of Very Unfavorable/Unfavorable Base: All Respondents Total Unweighted Base 2027 Weighted Base 2013 Effective Base 1013 Hillary Clinton 1064 53% Donald Trump 1025 51% Nancy Pelosi 963 48% Paul Ryan 953 47% Kellyanne Conway 928 46% Stephen Bannon 903 45% Mitch McConnell 838 42% Mike Pence 825 41% Jim Comey 719 36% Chuck Schumer 711 35% Jared Kushner 675 34%

Bernie Sanders 648 32% Elizabeth Warren 644 32% Rex Tillerson 632 31% Neil Gorsuch 574 29% H. R. Macmaster 257 13%

Page 30 QuickQuery Fielding Period: April 14-17, 2017 HCAPS (Filtered on Registered Voters) Weighted To The U.S. General Adult Population - Propensity 18 Apr 2017 Table 26 F1_1 Now we will show you some names. Please indicate if you have a favorable or unfavorable view of that person - or if you've never heard of them. Hillary Clinton Base: All Respondents Total Unweighted Base 2027 Weighted Base 2013 Effective Base 1013 Ever Heard Of (Net) 1903 95% Very Favorable/Favorable 839 (Sub-Net) 42% Very favorable 360 18% Favorable 479 24% Very Unfavorable/ 1064 Unfavorable (Sub-Net) 53% Unfavorable 327 16% Very unfavorable 737 37% Never heard of them 15 1% No opinion 96 5% Sigma 2013 100%
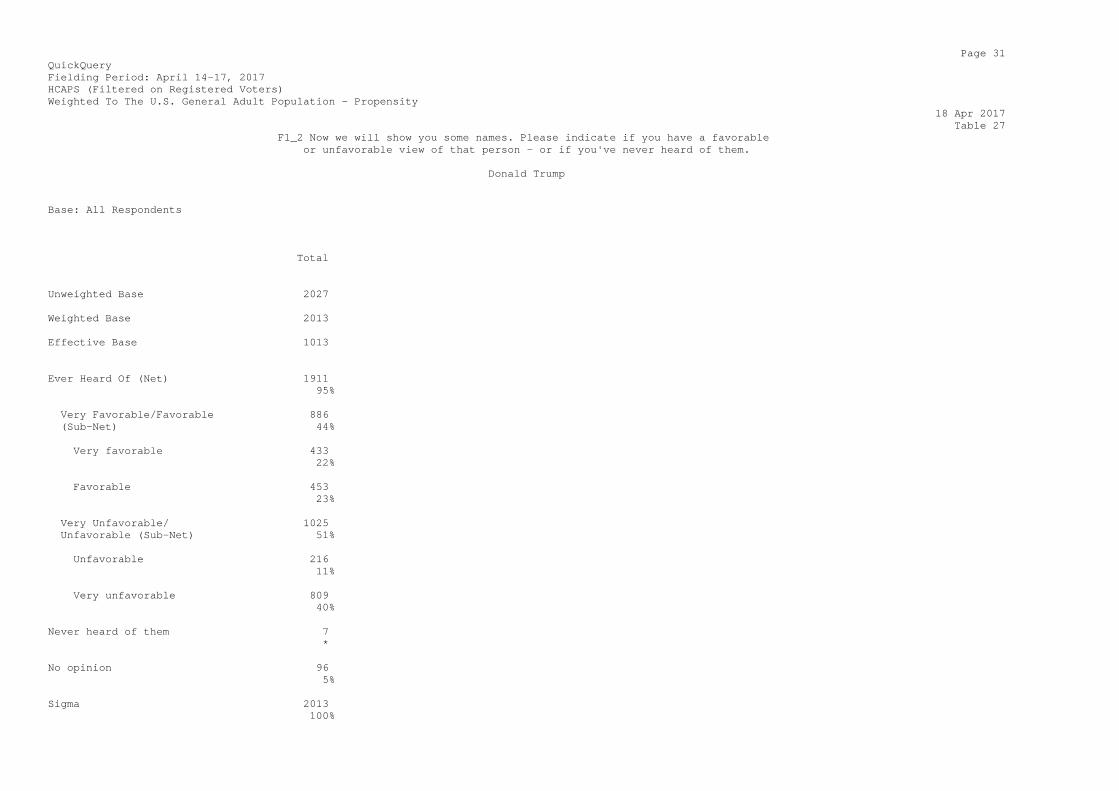
Page 31 QuickQuery Fielding Period: April 14-17, 2017 HCAPS (Filtered on Registered Voters) Weighted To The U.S. General Adult Population - Propensity 18 Apr 2017 Table 27 F1_2 Now we will show you some names. Please indicate if you have a favorable or unfavorable view of that person - or if you've never heard of them. Donald Trump Base: All Respondents Total Unweighted Base 2027 Weighted Base 2013 Effective Base 1013 Ever Heard Of (Net) 1911 95% Very Favorable/Favorable 886 (Sub-Net) 44% Very favorable 433 22% Favorable 453 23% Very Unfavorable/ 1025 Unfavorable (Sub-Net) 51% Unfavorable 216 11% Very unfavorable 809 40% Never heard of them 7 * No opinion 96 5% Sigma 2013 100%
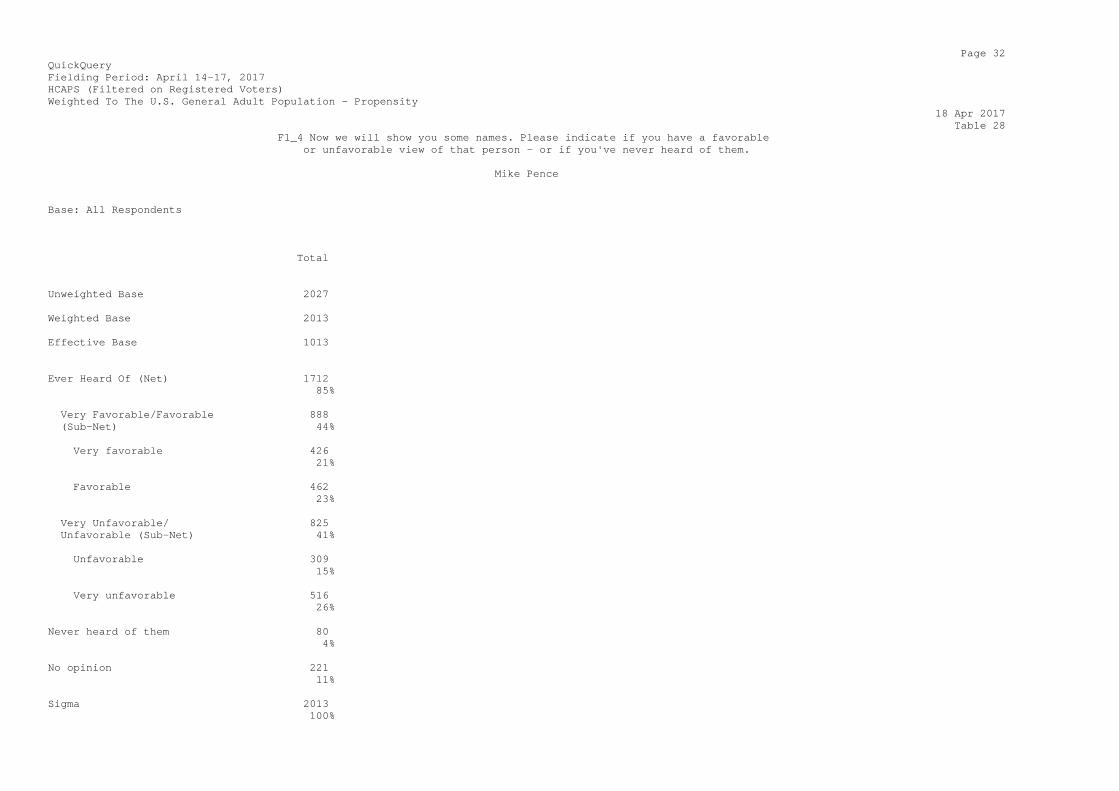
Page 32 QuickQuery Fielding Period: April 14-17, 2017 HCAPS (Filtered on Registered Voters) Weighted To The U.S. General Adult Population - Propensity 18 Apr 2017 Table 28 F1_4 Now we will show you some names. Please indicate if you have a favorable or unfavorable view of that person - or if you've never heard of them. Mike Pence Base: All Respondents Total Unweighted Base 2027 Weighted Base 2013 Effective Base 1013 Ever Heard Of (Net) 1712 85% Very Favorable/Favorable 888 (Sub-Net) 44% Very favorable 426 21% Favorable 462 23% Very Unfavorable/ 825 Unfavorable (Sub-Net) 41% Unfavorable 309 15% Very unfavorable 516 26% Never heard of them 80 4% No opinion 221 11% Sigma 2013 100%

Page 33 QuickQuery Fielding Period: April 14-17, 2017 HCAPS (Filtered on Registered Voters) Weighted To The U.S. General Adult Population - Propensity 18 Apr 2017 Table 29 F1_8 Now we will show you some names. Please indicate if you have a favorable or unfavorable view of that person - or if you've never heard of them. Paul Ryan Base: All Respondents Total Unweighted Base 2027 Weighted Base 2013 Effective Base 1013 Ever Heard Of (Net) 1641 82% Very Favorable/Favorable 688 (Sub-Net) 34% Very favorable 181 9% Favorable 507 25% Very Unfavorable/ 953 Unfavorable (Sub-Net) 47% Unfavorable 444 22% Very unfavorable 509 25% Never heard of them 100 5% No opinion 272 14% Sigma 2013 100%
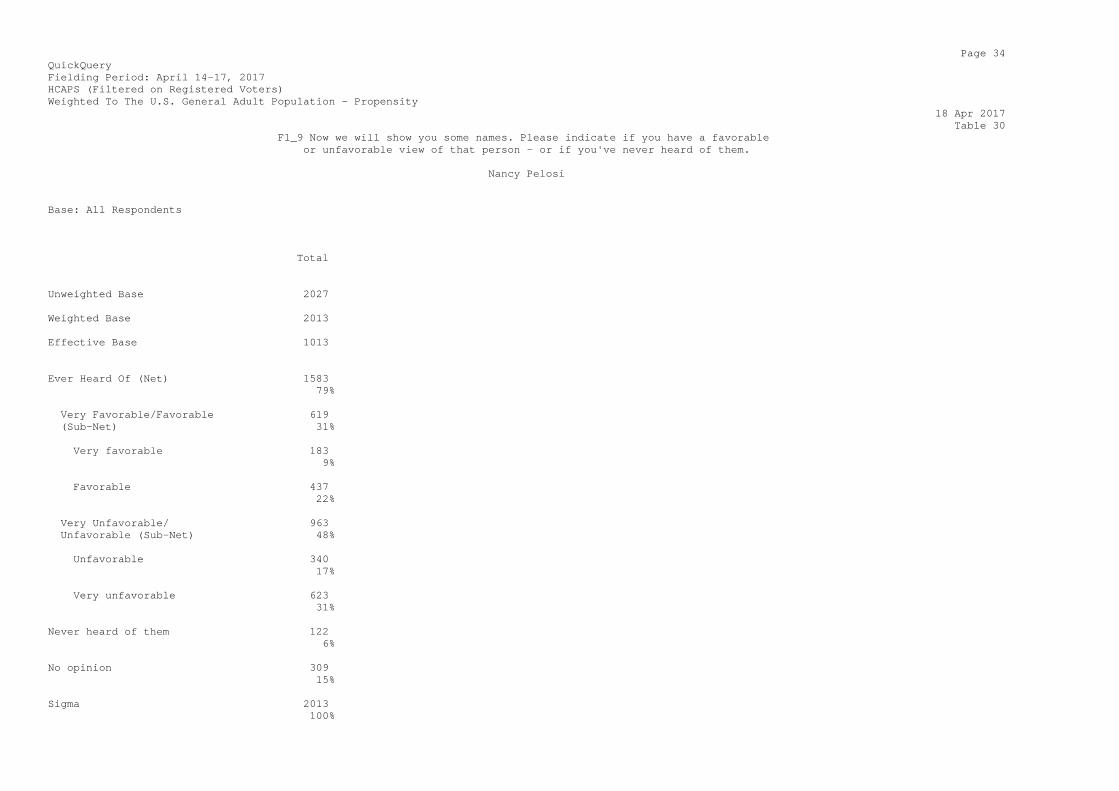
Page 34 QuickQuery Fielding Period: April 14-17, 2017 HCAPS (Filtered on Registered Voters) Weighted To The U.S. General Adult Population - Propensity 18 Apr 2017 Table 30 F1_9 Now we will show you some names. Please indicate if you have a favorable or unfavorable view of that person - or if you've never heard of them. Nancy Pelosi Base: All Respondents Total Unweighted Base 2027 Weighted Base 2013 Effective Base 1013 Ever Heard Of (Net) 1583 79% Very Favorable/Favorable 619 (Sub-Net) 31% Very favorable 183 9% Favorable 437 22% Very Unfavorable/ 963 Unfavorable (Sub-Net) 48% Unfavorable 340 17% Very unfavorable 623 31% Never heard of them 122 6% No opinion 309 15% Sigma 2013 100%

Page 35 QuickQuery Fielding Period: April 14-17, 2017 HCAPS (Filtered on Registered Voters) Weighted To The U.S. General Adult Population - Propensity 18 Apr 2017 Table 31 F1_10 Now we will show you some names. Please indicate if you have a favorable or unfavorable view of that person - or if you've never heard of them. Mitch McConnell Base: All Respondents Total Unweighted Base 2027 Weighted Base 2013 Effective Base 1013 Ever Heard Of (Net) 1300 65% Very Favorable/Favorable 462 (Sub-Net) 23% Very favorable 75 4% Favorable 387 19% Very Unfavorable/ 838 Unfavorable (Sub-Net) 42% Unfavorable 313 16% Very unfavorable 524 26% Never heard of them 304 15% No opinion 410 20% Sigma 2013 100%
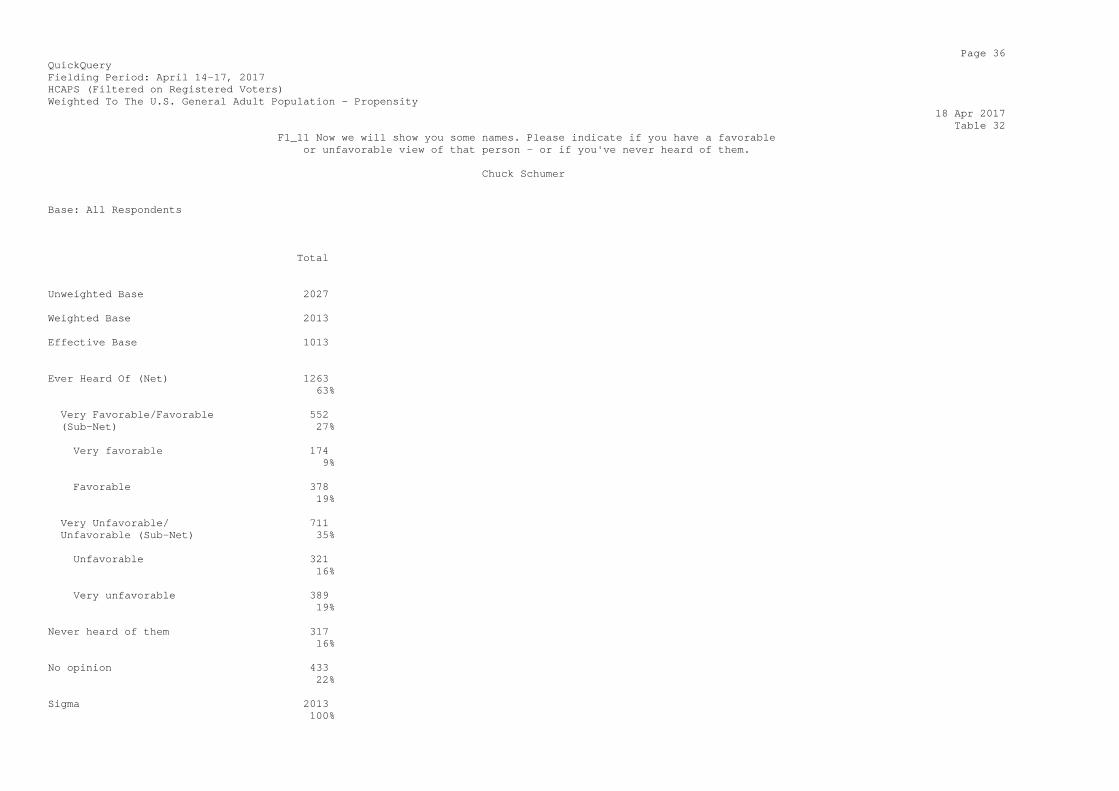
Page 36 QuickQuery Fielding Period: April 14-17, 2017 HCAPS (Filtered on Registered Voters) Weighted To The U.S. General Adult Population - Propensity 18 Apr 2017 Table 32 F1_11 Now we will show you some names. Please indicate if you have a favorable or unfavorable view of that person - or if you've never heard of them. Chuck Schumer Base: All Respondents Total Unweighted Base 2027 Weighted Base 2013 Effective Base 1013 Ever Heard Of (Net) 1263 63% Very Favorable/Favorable 552 (Sub-Net) 27% Very favorable 174 9% Favorable 378 19% Very Unfavorable/ 711 Unfavorable (Sub-Net) 35% Unfavorable 321 16% Very unfavorable 389 19% Never heard of them 317 16% No opinion 433 22% Sigma 2013 100%

Page 37 QuickQuery Fielding Period: April 14-17, 2017 HCAPS (Filtered on Registered Voters) Weighted To The U.S. General Adult Population - Propensity 18 Apr 2017 Table 33 F1_12 Now we will show you some names. Please indicate if you have a favorable or unfavorable view of that person - or if you've never heard of them. Bernie Sanders Base: All Respondents Total Unweighted Base 2027 Weighted Base 2013 Effective Base 1013 Ever Heard Of (Net) 1788 89% Very Favorable/Favorable 1140 (Sub-Net) 57% Very favorable 487 24% Favorable 653 32% Very Unfavorable/ 648 Unfavorable (Sub-Net) 32% Unfavorable 306 15% Very unfavorable 342 17% Never heard of them 23 1% No opinion 202 10% Sigma 2013 100%
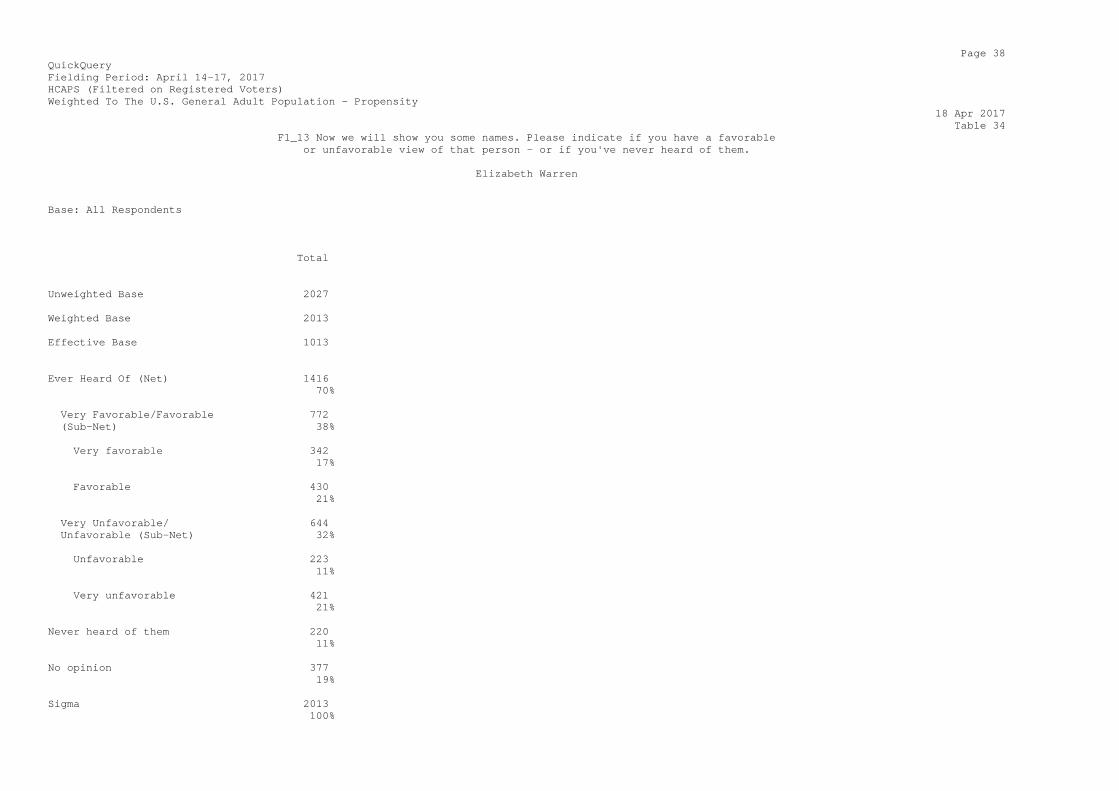
Page 38 QuickQuery Fielding Period: April 14-17, 2017 HCAPS (Filtered on Registered Voters) Weighted To The U.S. General Adult Population - Propensity 18 Apr 2017 Table 34 F1_13 Now we will show you some names. Please indicate if you have a favorable or unfavorable view of that person - or if you've never heard of them. Elizabeth Warren Base: All Respondents Total Unweighted Base 2027 Weighted Base 2013 Effective Base 1013 Ever Heard Of (Net) 1416 70% Very Favorable/Favorable 772 (Sub-Net) 38% Very favorable 342 17% Favorable 430 21% Very Unfavorable/ 644 Unfavorable (Sub-Net) 32% Unfavorable 223 11% Very unfavorable 421 21% Never heard of them 220 11% No opinion 377 19% Sigma 2013 100%

Page 39 QuickQuery Fielding Period: April 14-17, 2017 HCAPS (Filtered on Registered Voters) Weighted To The U.S. General Adult Population - Propensity 18 Apr 2017 Table 35 F1_21 Now we will show you some names. Please indicate if you have a favorable or unfavorable view of that person - or if you've never heard of them. Stephen Bannon Base: All Respondents Total Unweighted Base 2027 Weighted Base 2013 Effective Base 1013 Ever Heard Of (Net) 1235 61% Very Favorable/Favorable 332 (Sub-Net) 16% Very favorable 110 5% Favorable 221 11% Very Unfavorable/ 903 Unfavorable (Sub-Net) 45% Unfavorable 260 13% Very unfavorable 644 32% Never heard of them 351 17% No opinion 428 21% Sigma 2013 100%

Page 40 QuickQuery Fielding Period: April 14-17, 2017 HCAPS (Filtered on Registered Voters) Weighted To The U.S. General Adult Population - Propensity 18 Apr 2017 Table 36 F1_22 Now we will show you some names. Please indicate if you have a favorable or unfavorable view of that person - or if you've never heard of them. Kellyanne Conway Base: All Respondents Total Unweighted Base 2027 Weighted Base 2013 Effective Base 1013 Ever Heard Of (Net) 1415 70% Very Favorable/Favorable 487 (Sub-Net) 24% Very favorable 166 8% Favorable 321 16% Very Unfavorable/ 928 Unfavorable (Sub-Net) 46% Unfavorable 269 13% Very unfavorable 659 33% Never heard of them 276 14% No opinion 323 16% Sigma 2013 100%
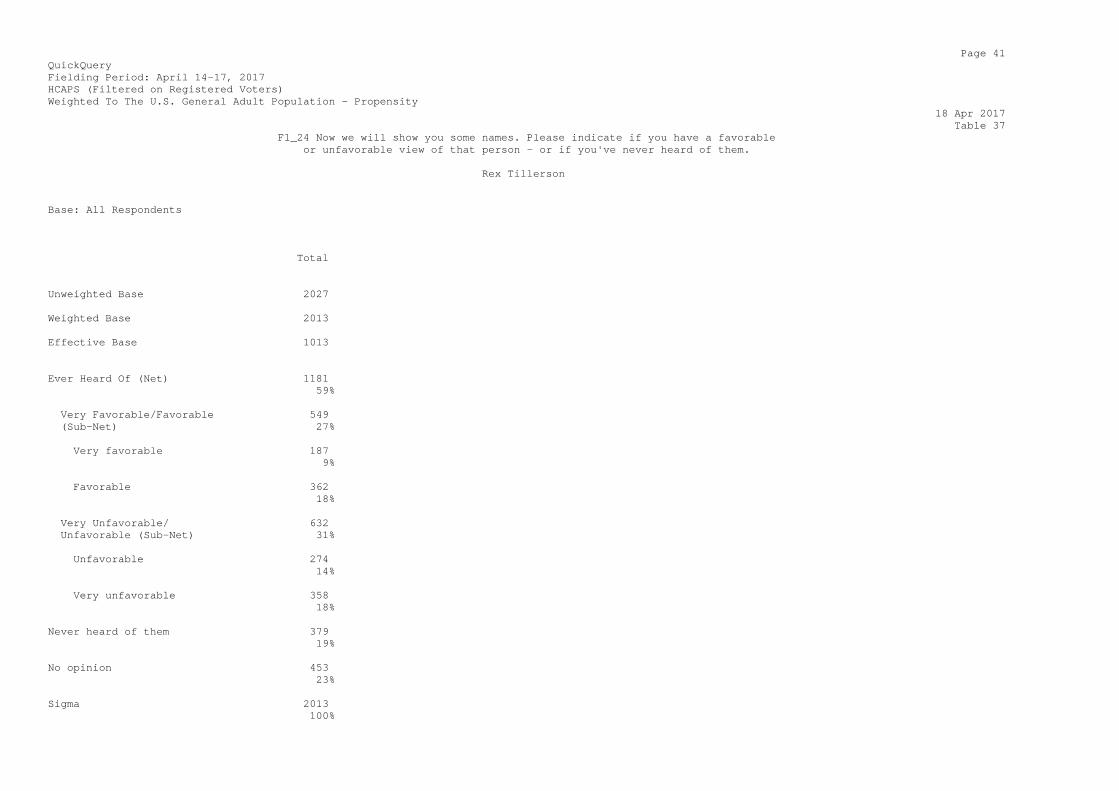
Page 41 QuickQuery Fielding Period: April 14-17, 2017 HCAPS (Filtered on Registered Voters) Weighted To The U.S. General Adult Population - Propensity 18 Apr 2017 Table 37 F1_24 Now we will show you some names. Please indicate if you have a favorable or unfavorable view of that person - or if you've never heard of them. Rex Tillerson Base: All Respondents Total Unweighted Base 2027 Weighted Base 2013 Effective Base 1013 Ever Heard Of (Net) 1181 59% Very Favorable/Favorable 549 (Sub-Net) 27% Very favorable 187 9% Favorable 362 18% Very Unfavorable/ 632 Unfavorable (Sub-Net) 31% Unfavorable 274 14% Very unfavorable 358 18% Never heard of them 379 19% No opinion 453 23% Sigma 2013 100%

Page 42 QuickQuery Fielding Period: April 14-17, 2017 HCAPS (Filtered on Registered Voters) Weighted To The U.S. General Adult Population - Propensity 18 Apr 2017 Table 38 F1_25 Now we will show you some names. Please indicate if you have a favorable or unfavorable view of that person - or if you've never heard of them. Jim Comey Base: All Respondents Total Unweighted Base 2027 Weighted Base 2013 Effective Base 1013 Ever Heard Of (Net) 1084 54% Very Favorable/Favorable 365 (Sub-Net) 18% Very favorable 74 4% Favorable 292 14% Very Unfavorable/ 719 Unfavorable (Sub-Net) 36% Unfavorable 448 22% Very unfavorable 271 13% Never heard of them 421 21% No opinion 508 25% Sigma 2013 100%

Page 43 QuickQuery Fielding Period: April 14-17, 2017 HCAPS (Filtered on Registered Voters) Weighted To The U.S. General Adult Population - Propensity 18 Apr 2017 Table 39 F1_26 Now we will show you some names. Please indicate if you have a favorable or unfavorable view of that person - or if you've never heard of them. Jared Kushner Base: All Respondents Total Unweighted Base 2027 Weighted Base 2013 Effective Base 1013 Ever Heard Of (Net) 1140 57% Very Favorable/Favorable 465 (Sub-Net) 23% Very favorable 104 5% Favorable 361 18% Very Unfavorable/ 675 Unfavorable (Sub-Net) 34% Unfavorable 329 16% Very unfavorable 347 17% Never heard of them 392 19% No opinion 481 24% Sigma 2013 100%

Page 44 QuickQuery Fielding Period: April 14-17, 2017 HCAPS (Filtered on Registered Voters) Weighted To The U.S. General Adult Population - Propensity 18 Apr 2017 Table 40 F1_27 Now we will show you some names. Please indicate if you have a favorable or unfavorable view of that person - or if you've never heard of them. H. R. Macmaster Base: All Respondents Total Unweighted Base 2027 Weighted Base 2013 Effective Base 1013 Ever Heard Of (Net) 656 33% Very Favorable/Favorable 399 (Sub-Net) 20% Very favorable 128 6% Favorable 271 13% Very Unfavorable/ 257 Unfavorable (Sub-Net) 13% Unfavorable 138 7% Very unfavorable 119 6% Never heard of them 790 39% No opinion 567 28% Sigma 2013 100%

Page 45 QuickQuery Fielding Period: April 14-17, 2017 HCAPS (Filtered on Registered Voters) Weighted To The U.S. General Adult Population - Propensity 18 Apr 2017 Table 41 F1_28 Now we will show you some names. Please indicate if you have a favorable or unfavorable view of that person - or if you've never heard of them. Neil Gorsuch Base: All Respondents Total Unweighted Base 2027 Weighted Base 2013 Effective Base 1013 Ever Heard Of (Net) 1258 63% Very Favorable/Favorable 684 (Sub-Net) 34% Very favorable 339 17% Favorable 345 17% Very Unfavorable/ 574 Unfavorable (Sub-Net) 29% Unfavorable 273 14% Very unfavorable 301 15% Never heard of them 319 16% No opinion 436 22% Sigma 2013 100%
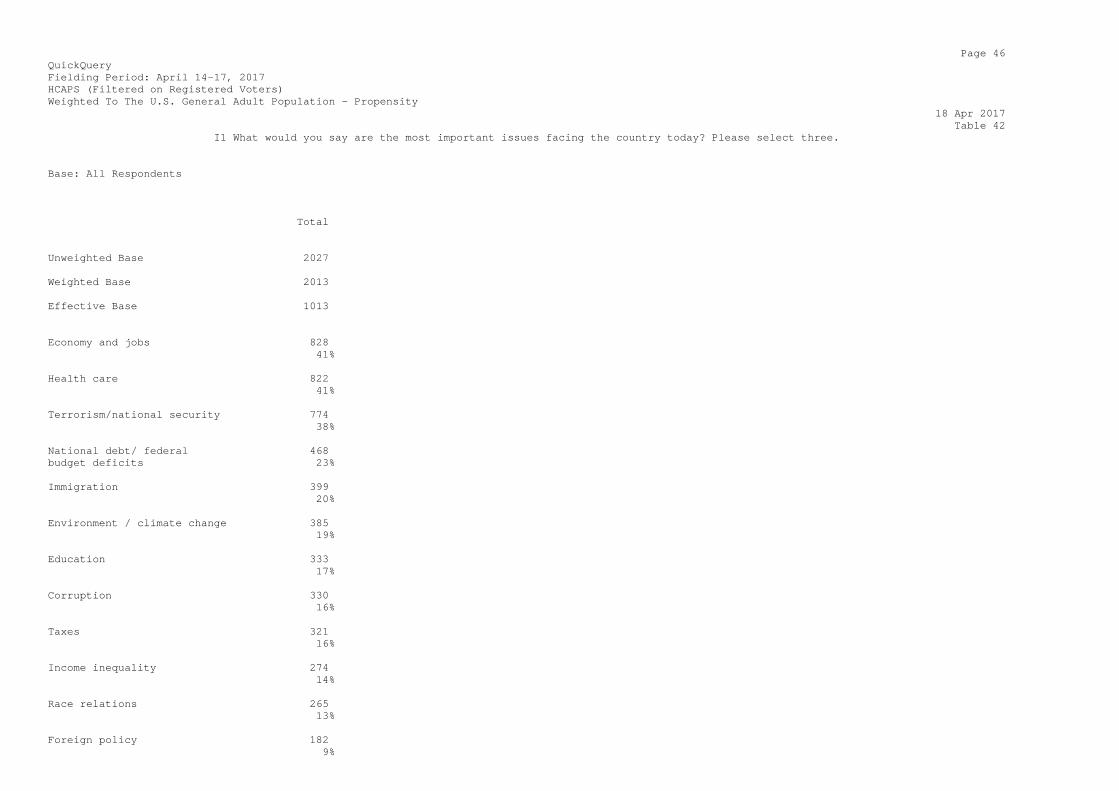
Page 46 QuickQuery Fielding Period: April 14-17, 2017 HCAPS (Filtered on Registered Voters) Weighted To The U.S. General Adult Population - Propensity 18 Apr 2017 Table 42 I1 What would you say are the most important issues facing the country today? Please select three. Base: All Respondents Total Unweighted Base 2027 Weighted Base 2013 Effective Base 1013 Economy and jobs 828 41% Health care 822 41% Terrorism/national security 774 38% National debt/ federal 468 budget deficits 23% Immigration 399 20% Environment / climate change 385 19% Education 333 17% Corruption 330 16% Taxes 321 16% Income inequality 274 14% Race relations 265 13% Foreign policy 182 9%
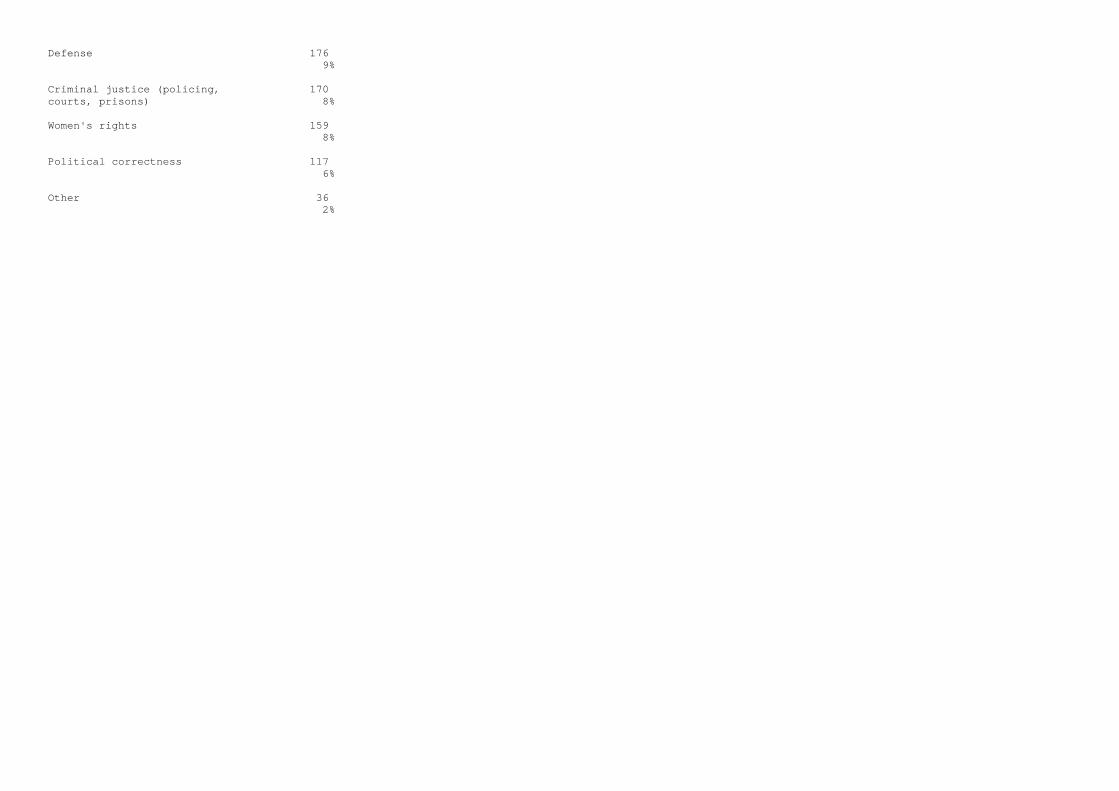
Defense 176 9% Criminal justice (policing, 170 courts, prisons) 8% Women's rights 159 8% Political correctness 117 6% Other 36 2%
Page 47 QuickQuery Fielding Period: April 14-17, 2017 HCAPS (Filtered on Registered Voters) Weighted To The U.S. General Adult Population - Propensity 18 Apr 2017 Table 42 I1 What would you say are the most important issues facing the country today? Please select three. Base: All Respondents Total Weighted Base 2013 Sigma 6040 300%
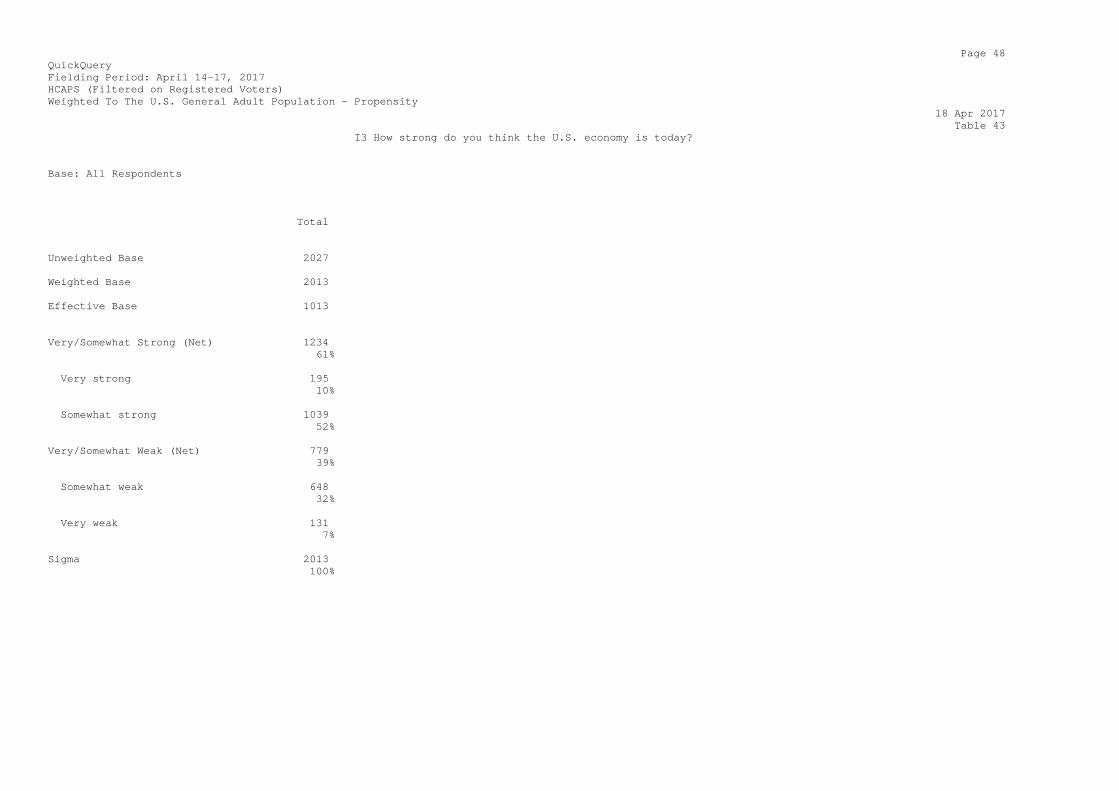
Page 48 QuickQuery Fielding Period: April 14-17, 2017 HCAPS (Filtered on Registered Voters) Weighted To The U.S. General Adult Population - Propensity 18 Apr 2017 Table 43 I3 How strong do you think the U.S. economy is today? Base: All Respondents Total Unweighted Base 2027 Weighted Base 2013 Effective Base 1013 Very/Somewhat Strong (Net) 1234 61% Very strong 195 10% Somewhat strong 1039 52% Very/Somewhat Weak (Net) 779 39% Somewhat weak 648 32% Very weak 131 7% Sigma 2013 100%
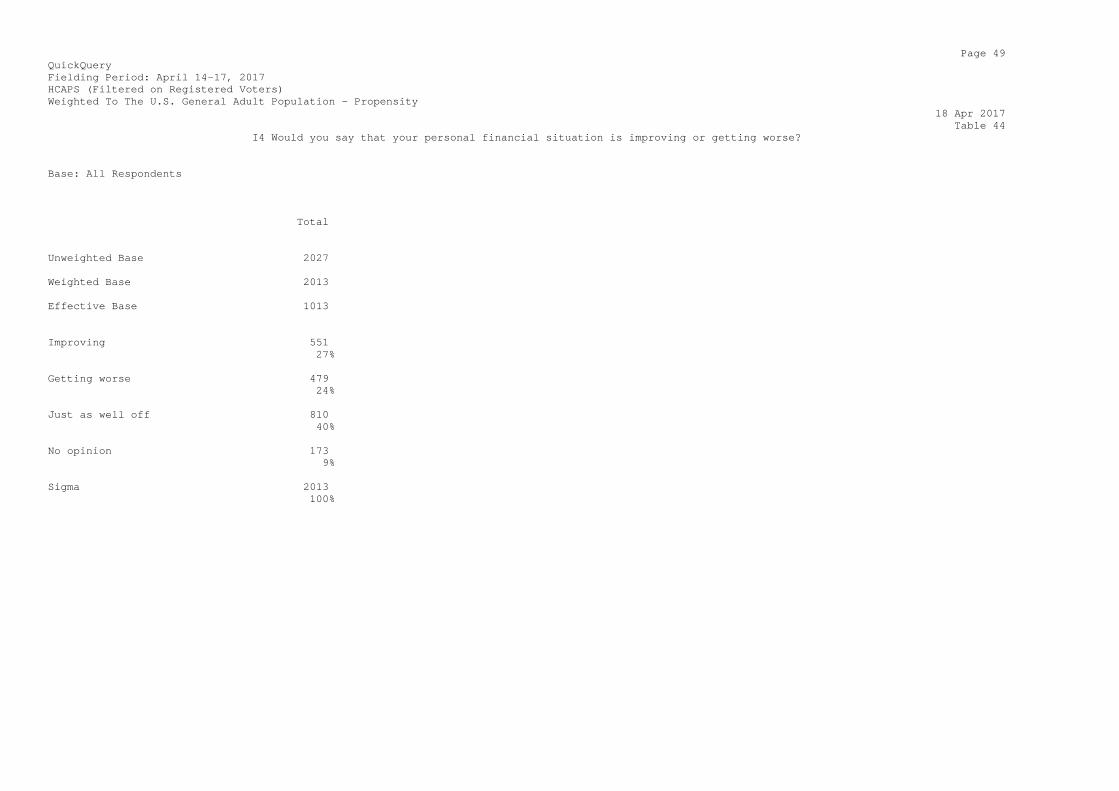
Page 49 QuickQuery Fielding Period: April 14-17, 2017 HCAPS (Filtered on Registered Voters) Weighted To The U.S. General Adult Population - Propensity 18 Apr 2017 Table 44 I4 Would you say that your personal financial situation is improving or getting worse? Base: All Respondents Total Unweighted Base 2027 Weighted Base 2013 Effective Base 1013 Improving 551 27% Getting worse 479 24% Just as well off 810 40% No opinion 173 9% Sigma 2013 100%
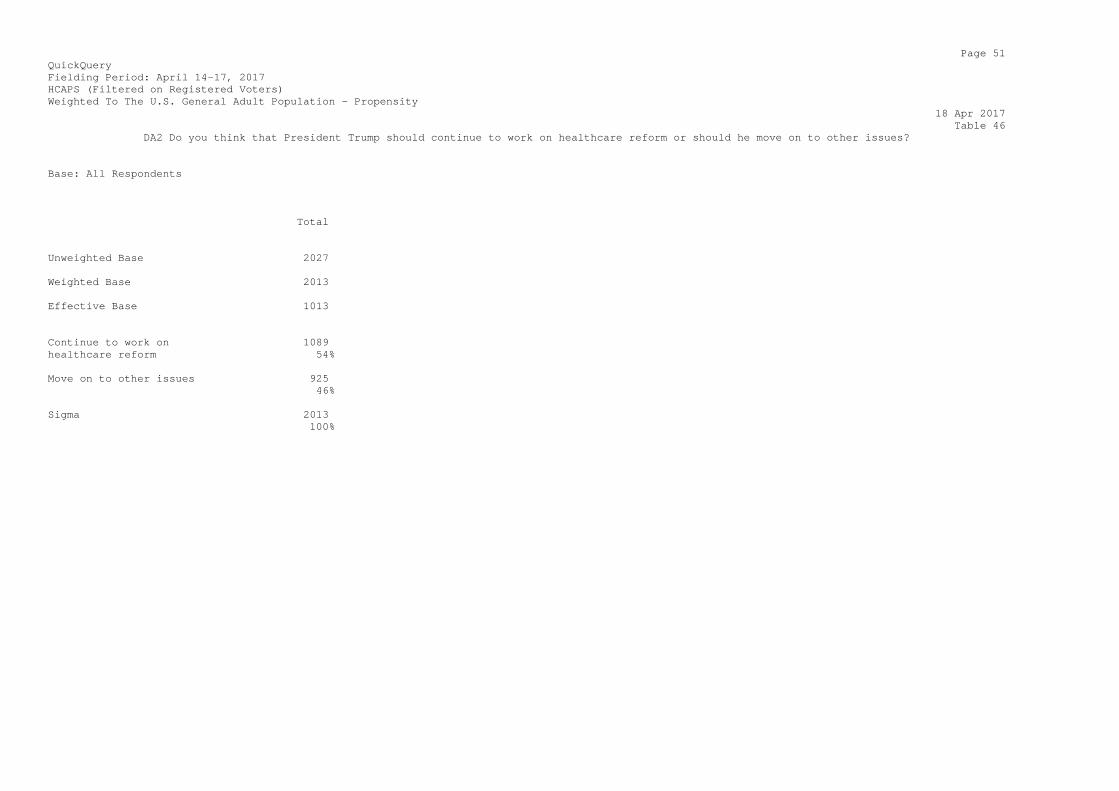
Page 51 QuickQuery Fielding Period: April 14-17, 2017 HCAPS (Filtered on Registered Voters) Weighted To The U.S. General Adult Population - Propensity 18 Apr 2017 Table 46 DA2 Do you think that President Trump should continue to work on healthcare reform or should he move on to other issues? Base: All Respondents Total Unweighted Base 2027 Weighted Base 2013 Effective Base 1013 Continue to work on 1089 healthcare reform 54% Move on to other issues 925 46% Sigma 2013 100%

Page 52 QuickQuery Fielding Period: April 14-17, 2017 HCAPS (Filtered on Registered Voters) Weighted To The U.S. General Adult Population - Propensity 18 Apr 2017 Table 47 DA3 Do you approve or disapprove of the confirmation of Neil Gorsuch to the Supreme Court? Base: All Respondents Total Unweighted Base 2027 Weighted Base 2013 Effective Base 1013 Approve 1108 55% Disapprove 905 45% Sigma 2013 100%
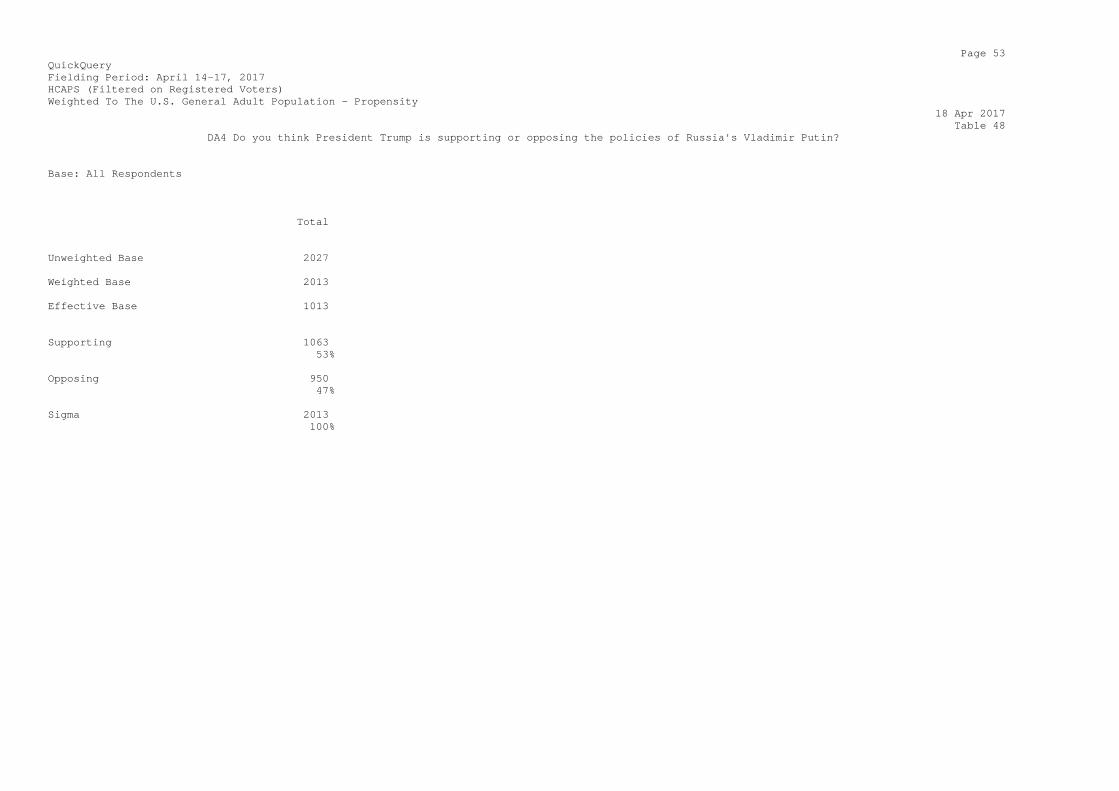
Page 53 QuickQuery Fielding Period: April 14-17, 2017 HCAPS (Filtered on Registered Voters) Weighted To The U.S. General Adult Population - Propensity 18 Apr 2017 Table 48 DA4 Do you think President Trump is supporting or opposing the policies of Russia's Vladimir Putin? Base: All Respondents Total Unweighted Base 2027 Weighted Base 2013 Effective Base 1013 Supporting 1063 53% Opposing 950 47% Sigma 2013 100%

Page 54 QuickQuery Fielding Period: April 14-17, 2017 HCAPS (Filtered on Registered Voters) Weighted To The U.S. General Adult Population - Propensity 18 Apr 2017 Table 49 DA5 Compared to President Obama, do you think President Trump is a stronger leader, weaker leader or about the same? Base: All Respondents Total Unweighted Base 2027 Weighted Base 2013 Effective Base 1013 Stronger 864 43% Weaker 885 44% About the same 265 13% Sigma 2013 100%
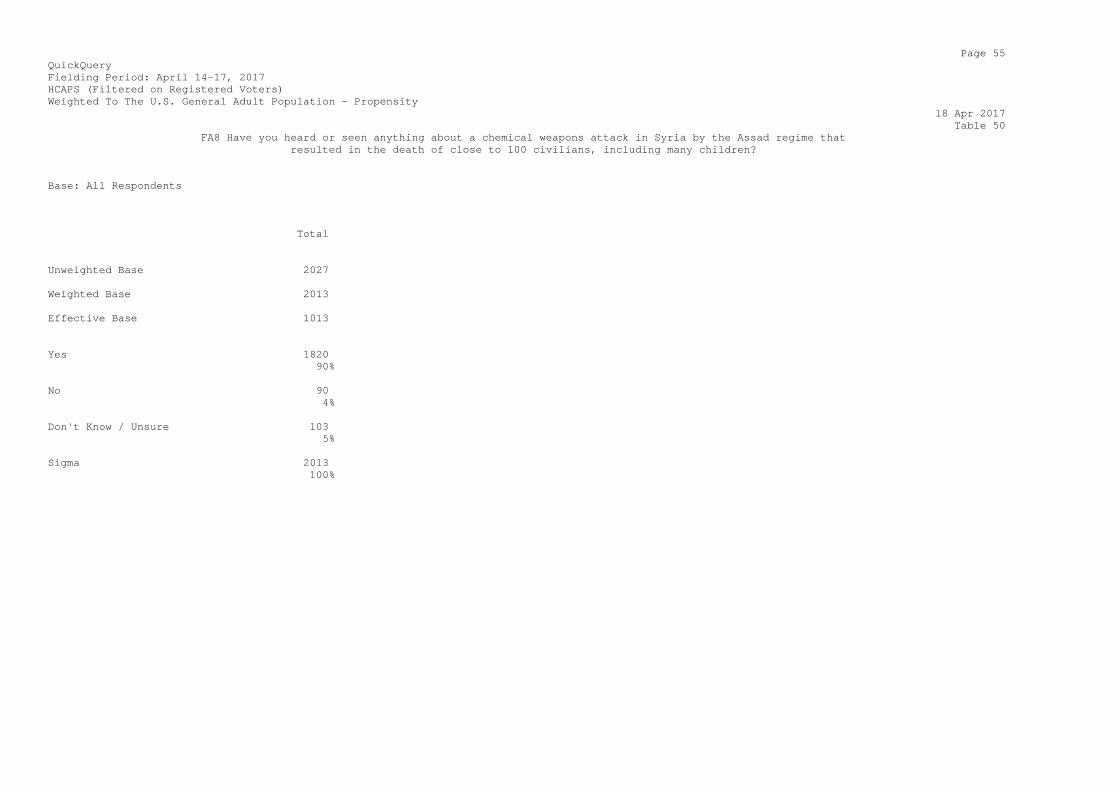
Page 55 QuickQuery Fielding Period: April 14-17, 2017 HCAPS (Filtered on Registered Voters) Weighted To The U.S. General Adult Population - Propensity 18 Apr 2017 Table 50 FA8 Have you heard or seen anything about a chemical weapons attack in Syria by the Assad regime that resulted in the death of close to 100 civilians, including many children? Base: All Respondents Total Unweighted Base 2027 Weighted Base 2013 Effective Base 1013 Yes 1820 90% No 90 4% Don't Know / Unsure 103 5% Sigma 2013 100%
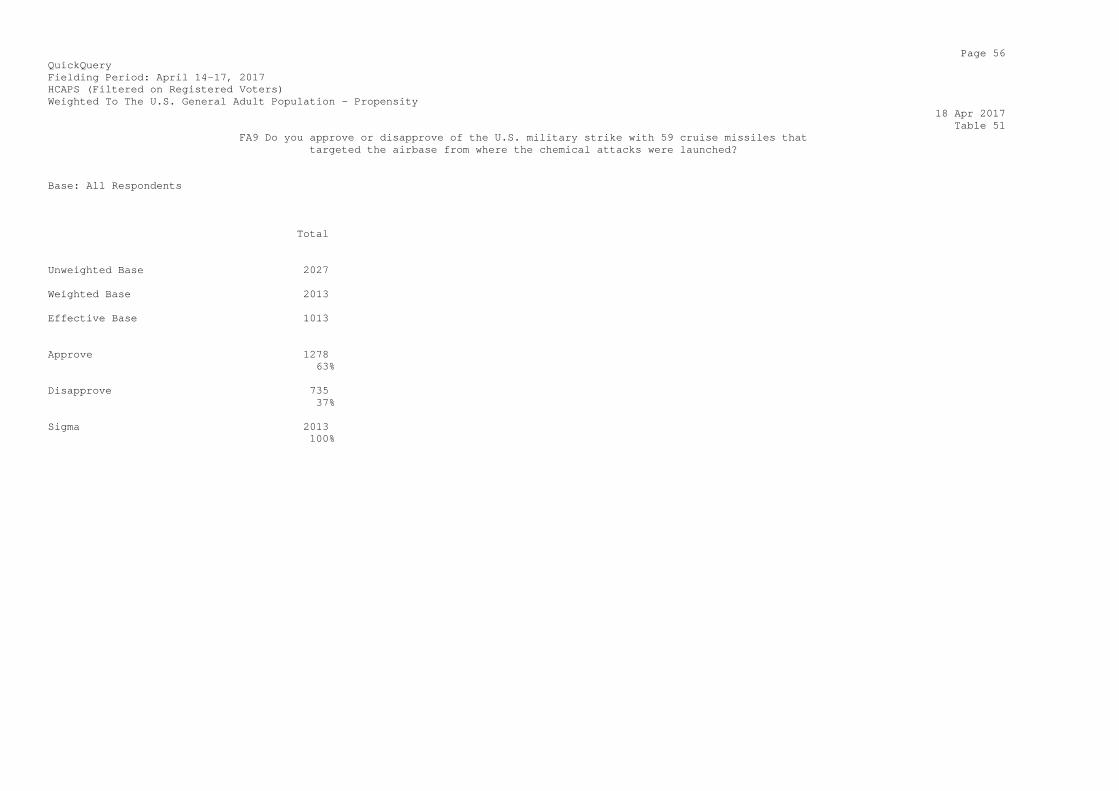
Page 56 QuickQuery Fielding Period: April 14-17, 2017 HCAPS (Filtered on Registered Voters) Weighted To The U.S. General Adult Population - Propensity 18 Apr 2017 Table 51 FA9 Do you approve or disapprove of the U.S. military strike with 59 cruise missiles that targeted the airbase from where the chemical attacks were launched? Base: All Respondents Total Unweighted Base 2027 Weighted Base 2013 Effective Base 1013 Approve 1278 63% Disapprove 735 37% Sigma 2013 100%
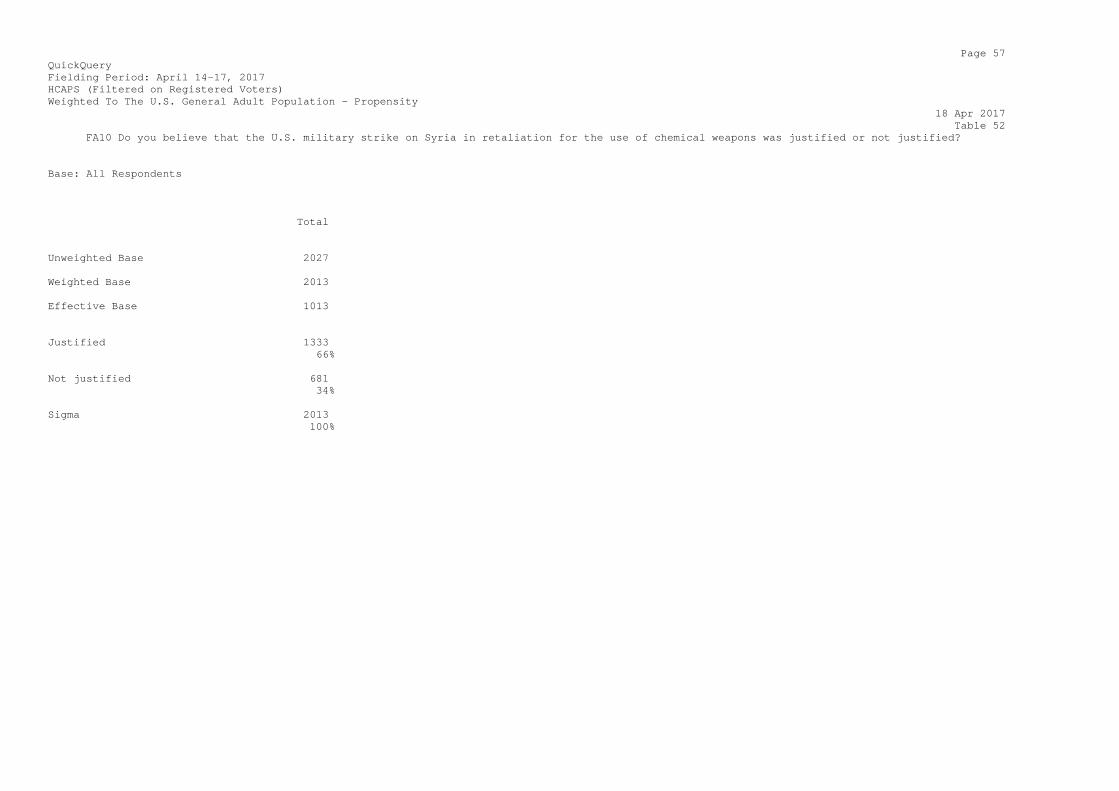
Page 57 QuickQuery Fielding Period: April 14-17, 2017 HCAPS (Filtered on Registered Voters) Weighted To The U.S. General Adult Population - Propensity 18 Apr 2017 Table 52 FA10 Do you believe that the U.S. military strike on Syria in retaliation for the use of chemical weapons was justified or not justified? Base: All Respondents Total Unweighted Base 2027 Weighted Base 2013 Effective Base 1013 Justified 1333 66% Not justified 681 34% Sigma 2013 100%

Page 58 QuickQuery Fielding Period: April 14-17, 2017 HCAPS (Filtered on Registered Voters) Weighted To The U.S. General Adult Population - Propensity 18 Apr 2017 Table 53 FA11 Do you believe that the U.S. military strike on Syria in retaliation for the use of chemical weapons was not enough, too much, or just about right? Base: All Respondents Total Unweighted Base 2027 Weighted Base 2013 Effective Base 1013 Not enough 518 26% Too much 660 33% Just about right 835 41% Sigma 2013 100%
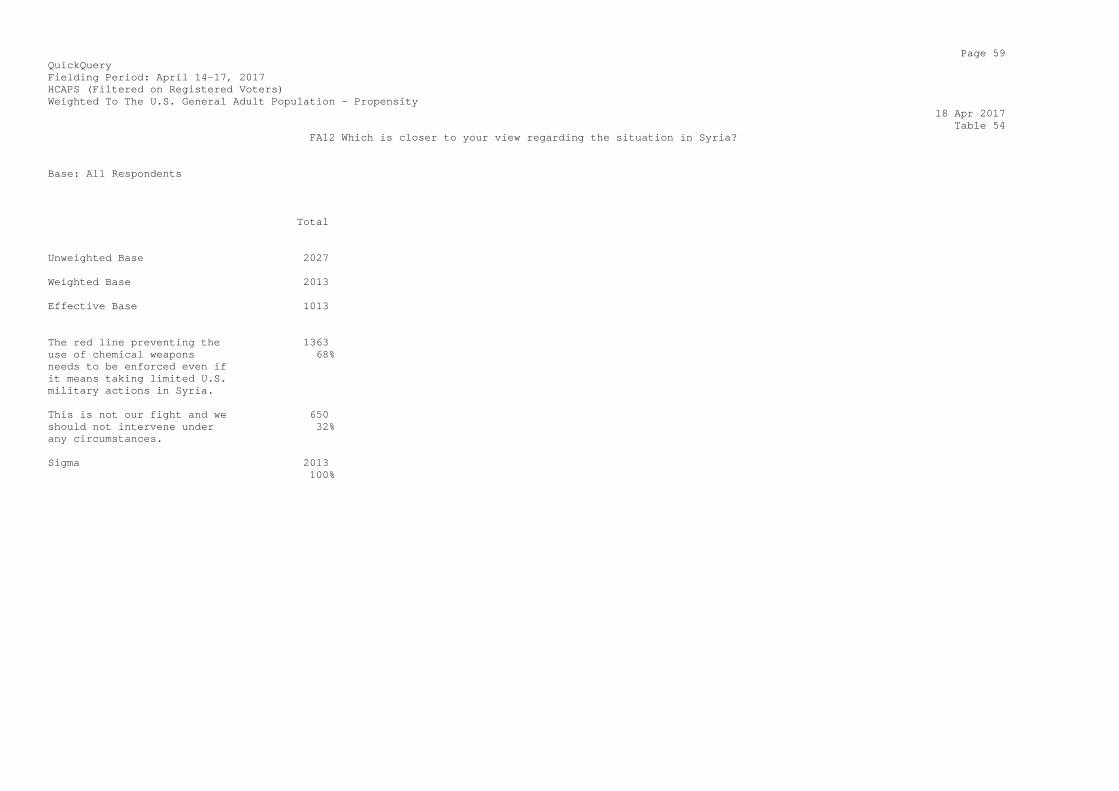
Page 59 QuickQuery Fielding Period: April 14-17, 2017 HCAPS (Filtered on Registered Voters) Weighted To The U.S. General Adult Population - Propensity 18 Apr 2017 Table 54 FA12 Which is closer to your view regarding the situation in Syria? Base: All Respondents Total Unweighted Base 2027 Weighted Base 2013 Effective Base 1013 The red line preventing the 1363 use of chemical weapons 68% needs to be enforced even if it means taking limited U.S. military actions in Syria. This is not our fight and we 650 should not intervene under 32% any circumstances. Sigma 2013 100%
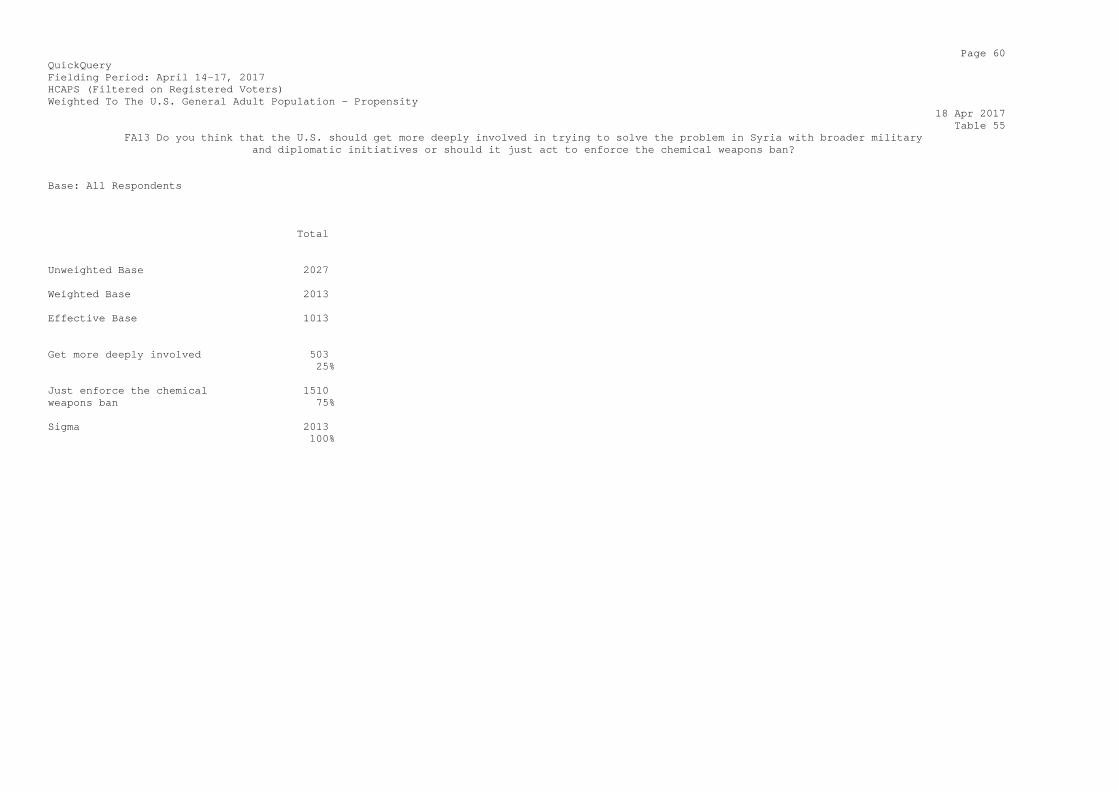
Page 60 QuickQuery Fielding Period: April 14-17, 2017 HCAPS (Filtered on Registered Voters) Weighted To The U.S. General Adult Population - Propensity 18 Apr 2017 Table 55 FA13 Do you think that the U.S. should get more deeply involved in trying to solve the problem in Syria with broader military and diplomatic initiatives or should it just act to enforce the chemical weapons ban? Base: All Respondents Total Unweighted Base 2027 Weighted Base 2013 Effective Base 1013 Get more deeply involved 503 25% Just enforce the chemical 1510 weapons ban 75% Sigma 2013 100%
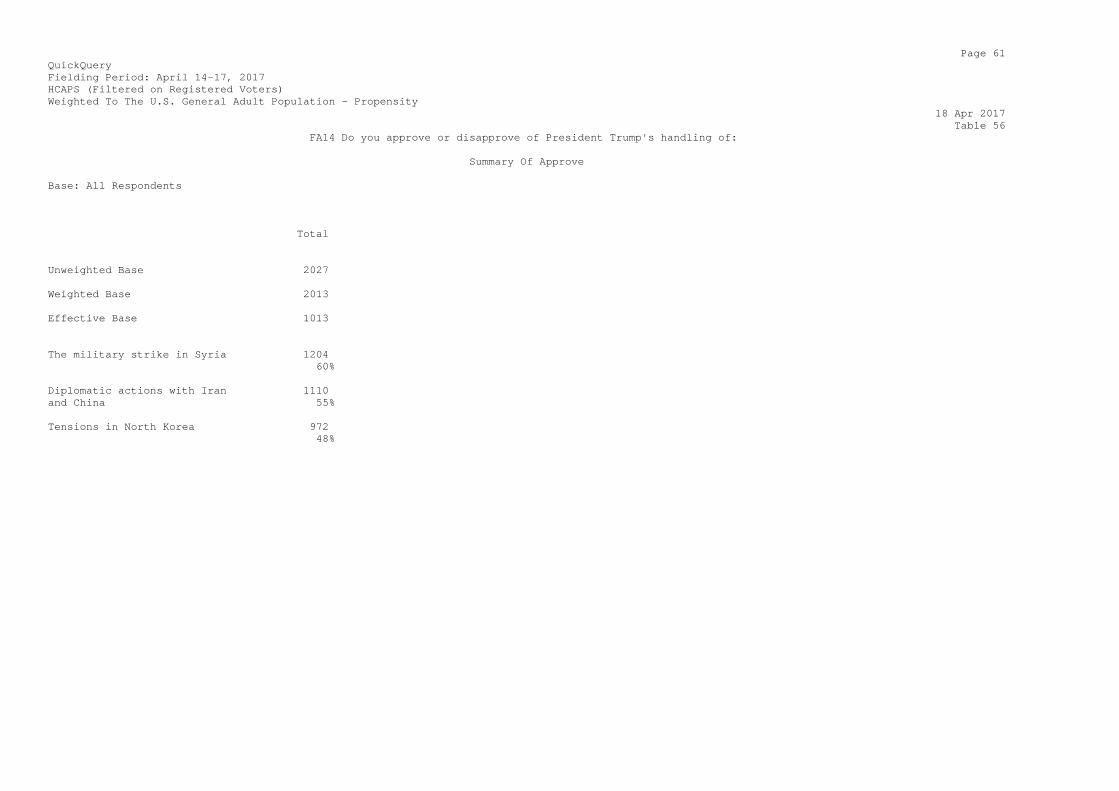
Page 61 QuickQuery Fielding Period: April 14-17, 2017 HCAPS (Filtered on Registered Voters) Weighted To The U.S. General Adult Population - Propensity 18 Apr 2017 Table 56 FA14 Do you approve or disapprove of President Trump's handling of: Summary Of Approve Base: All Respondents Total Unweighted Base 2027 Weighted Base 2013 Effective Base 1013 The military strike in Syria 1204 60% Diplomatic actions with Iran 1110 and China 55% Tensions in North Korea 972 48%
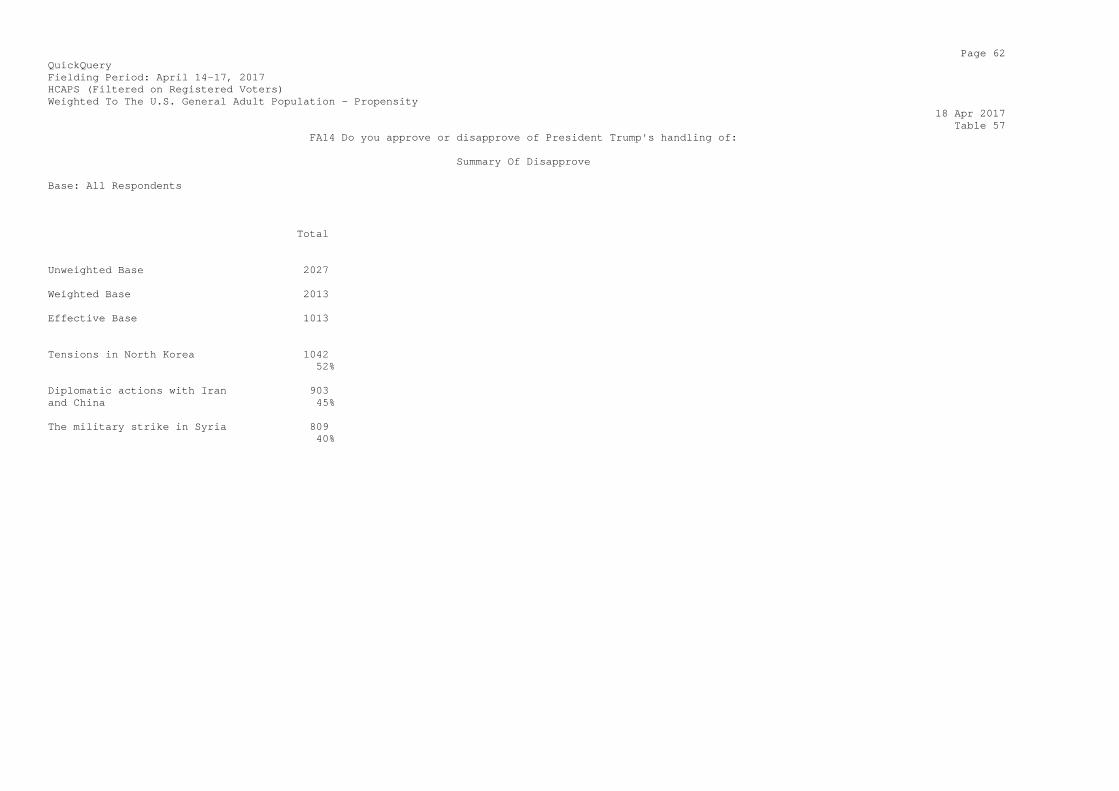
Page 62 QuickQuery Fielding Period: April 14-17, 2017 HCAPS (Filtered on Registered Voters) Weighted To The U.S. General Adult Population - Propensity 18 Apr 2017 Table 57 FA14 Do you approve or disapprove of President Trump's handling of: Summary Of Disapprove Base: All Respondents Total Unweighted Base 2027 Weighted Base 2013 Effective Base 1013 Tensions in North Korea 1042 52% Diplomatic actions with Iran 903 and China 45% The military strike in Syria 809 40%
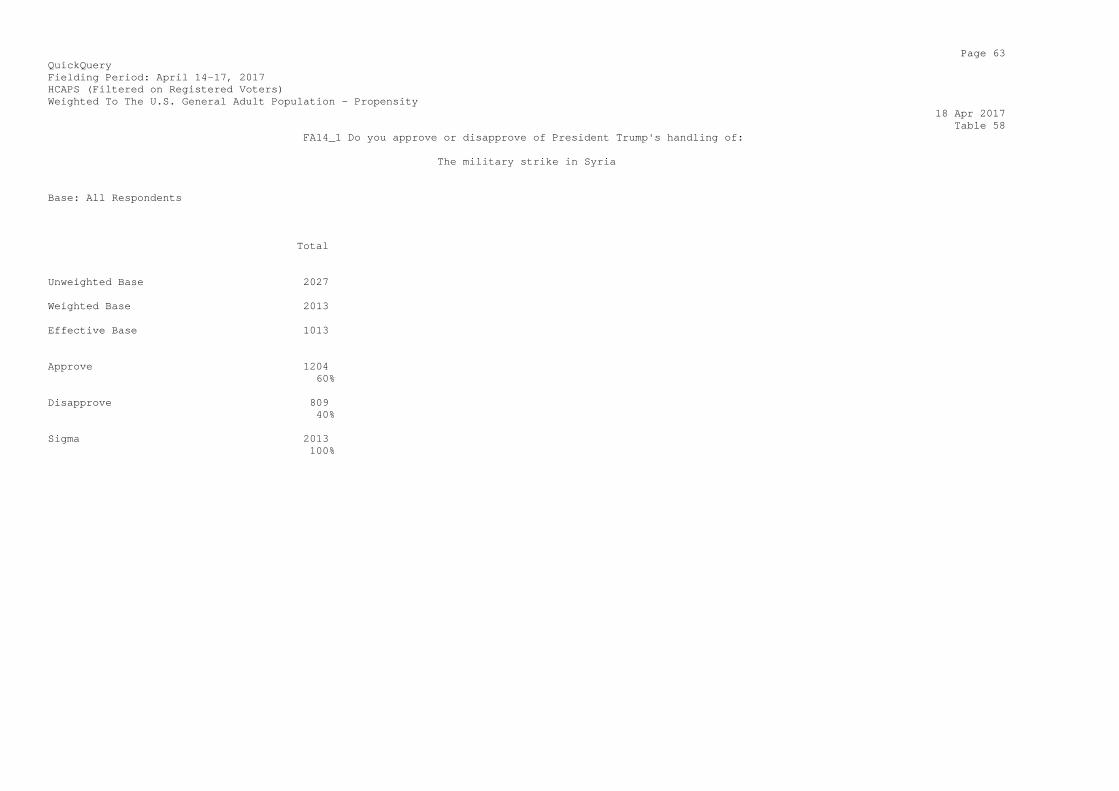
Page 63 QuickQuery Fielding Period: April 14-17, 2017 HCAPS (Filtered on Registered Voters) Weighted To The U.S. General Adult Population - Propensity 18 Apr 2017 Table 58 FA14_1 Do you approve or disapprove of President Trump's handling of: The military strike in Syria Base: All Respondents Total Unweighted Base 2027 Weighted Base 2013 Effective Base 1013 Approve 1204 60% Disapprove 809 40% Sigma 2013 100%

Page 64 QuickQuery Fielding Period: April 14-17, 2017 HCAPS (Filtered on Registered Voters) Weighted To The U.S. General Adult Population - Propensity 18 Apr 2017 Table 59 FA14_2 Do you approve or disapprove of President Trump's handling of: Diplomatic actions with Iran and China Base: All Respondents Total Unweighted Base 2027 Weighted Base 2013 Effective Base 1013 Approve 1110 55% Disapprove 903 45% Sigma 2013 100%

Page 65 QuickQuery Fielding Period: April 14-17, 2017 HCAPS (Filtered on Registered Voters) Weighted To The U.S. General Adult Population - Propensity 18 Apr 2017 Table 60 FA14_3 Do you approve or disapprove of President Trump's handling of: Tensions in North Korea Base: All Respondents Total Unweighted Base 2027 Weighted Base 2013 Effective Base 1013 Approve 972 48% Disapprove 1042 52% Sigma 2013 100%
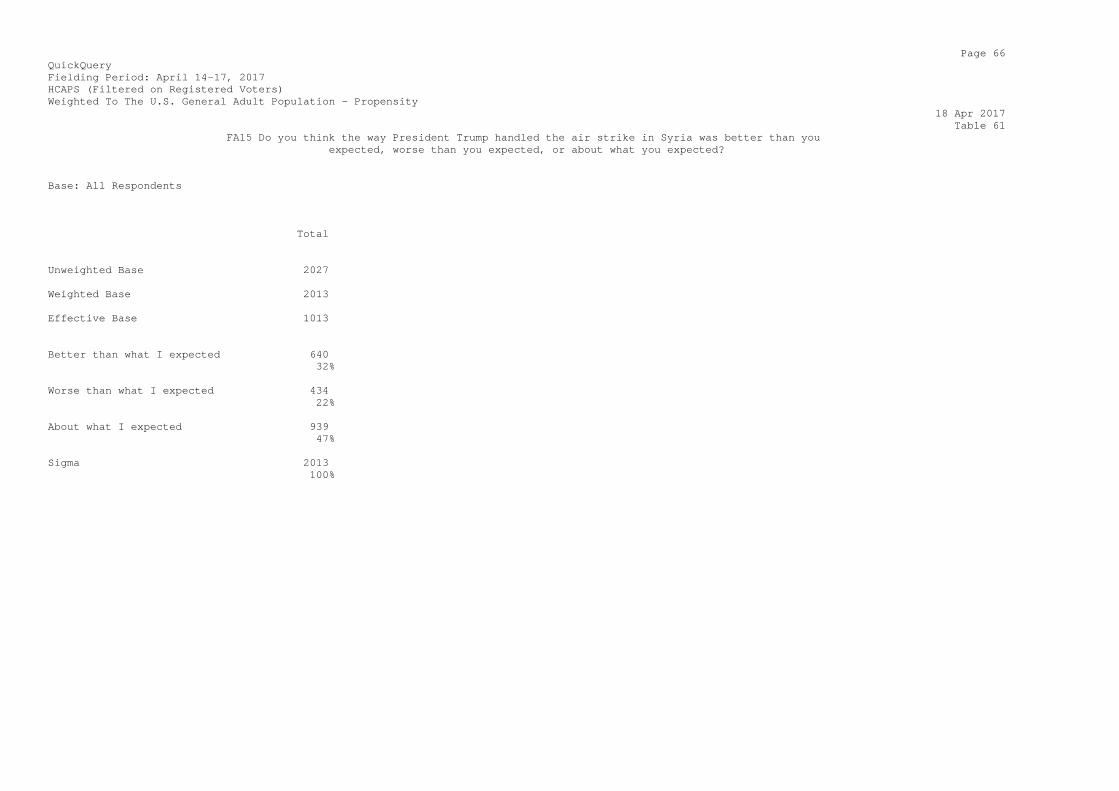
Page 66 QuickQuery Fielding Period: April 14-17, 2017 HCAPS (Filtered on Registered Voters) Weighted To The U.S. General Adult Population - Propensity 18 Apr 2017 Table 61 FA15 Do you think the way President Trump handled the air strike in Syria was better than you expected, worse than you expected, or about what you expected? Base: All Respondents Total Unweighted Base 2027 Weighted Base 2013 Effective Base 1013 Better than what I expected 640 32% Worse than what I expected 434 22% About what I expected 939 47% Sigma 2013 100%
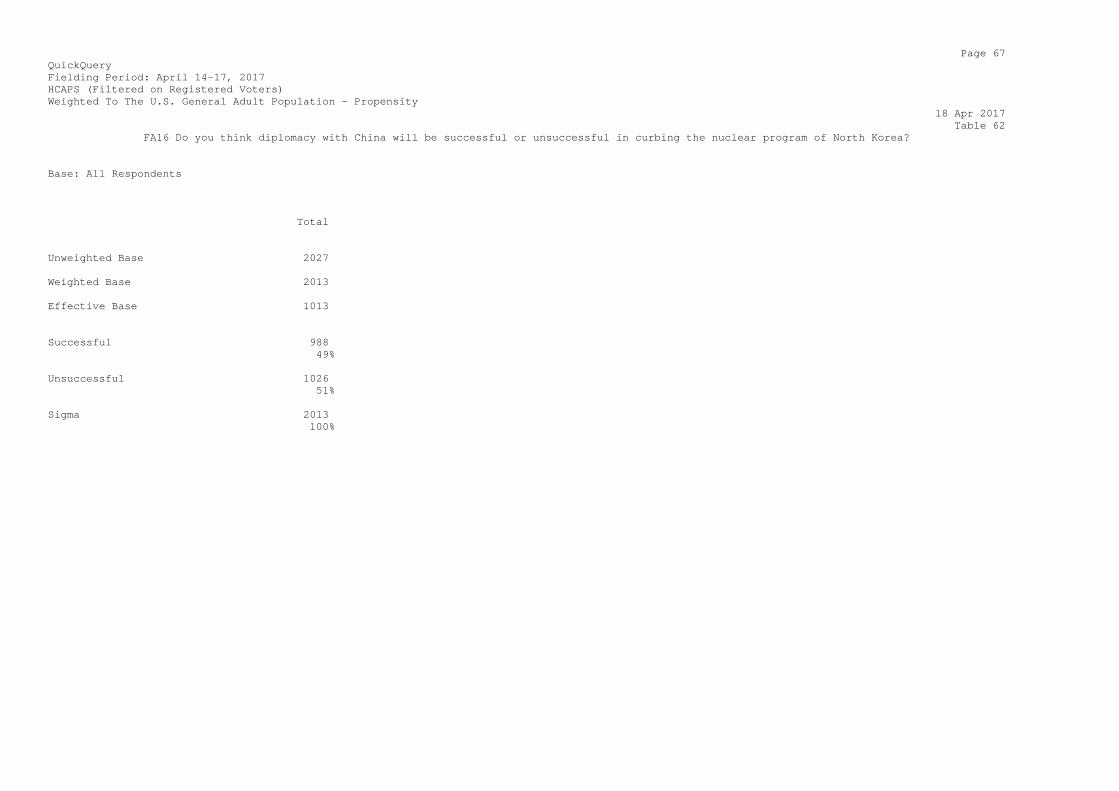
Page 67 QuickQuery Fielding Period: April 14-17, 2017 HCAPS (Filtered on Registered Voters) Weighted To The U.S. General Adult Population - Propensity 18 Apr 2017 Table 62 FA16 Do you think diplomacy with China will be successful or unsuccessful in curbing the nuclear program of North Korea? Base: All Respondents Total Unweighted Base 2027 Weighted Base 2013 Effective Base 1013 Successful 988 49% Unsuccessful 1026 51% Sigma 2013 100%
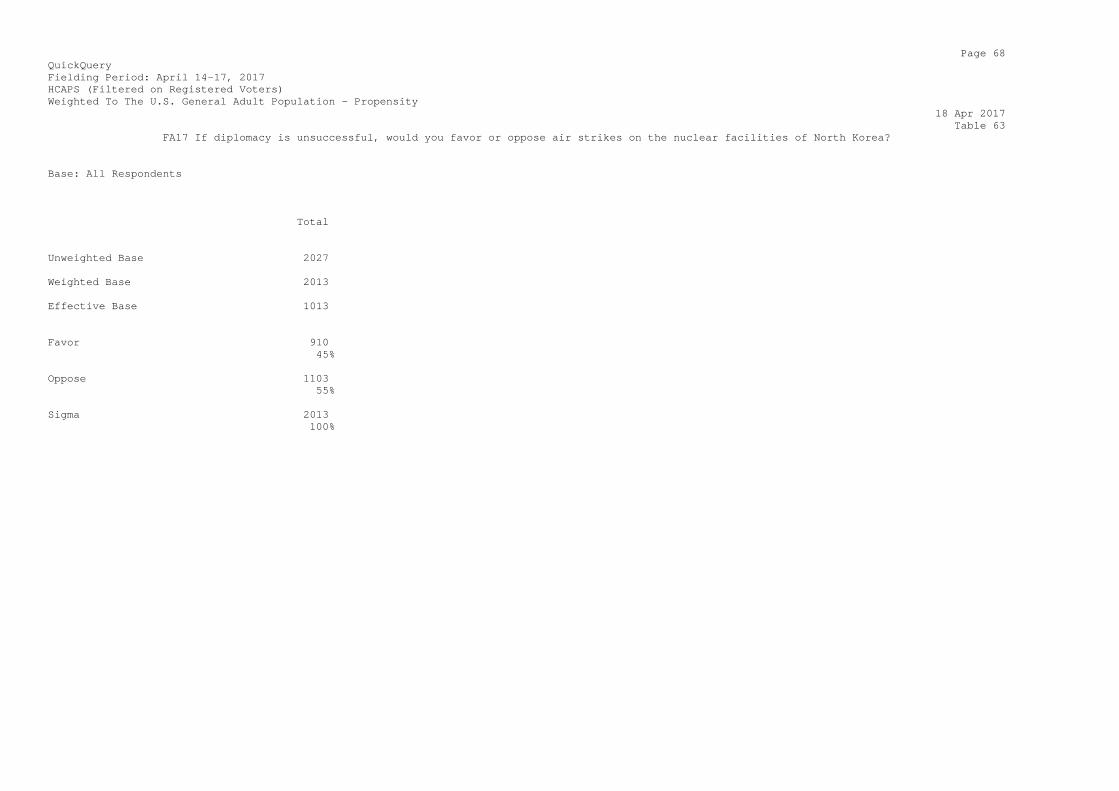
Page 68 QuickQuery Fielding Period: April 14-17, 2017 HCAPS (Filtered on Registered Voters) Weighted To The U.S. General Adult Population - Propensity 18 Apr 2017 Table 63 FA17 If diplomacy is unsuccessful, would you favor or oppose air strikes on the nuclear facilities of North Korea? Base: All Respondents Total Unweighted Base 2027 Weighted Base 2013 Effective Base 1013 Favor 910 45% Oppose 1103 55% Sigma 2013 100%
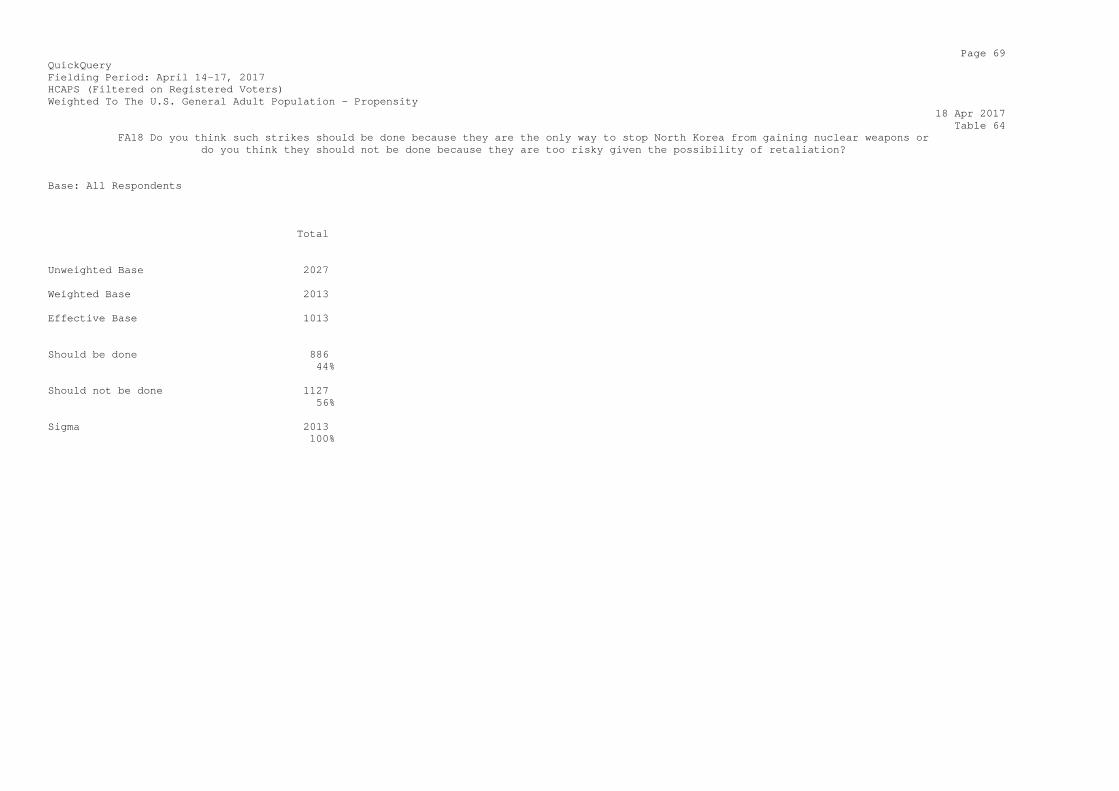
Page 69 QuickQuery Fielding Period: April 14-17, 2017 HCAPS (Filtered on Registered Voters) Weighted To The U.S. General Adult Population - Propensity 18 Apr 2017 Table 64 FA18 Do you think such strikes should be done because they are the only way to stop North Korea from gaining nuclear weapons or do you think they should not be done because they are too risky given the possibility of retaliation? Base: All Respondents Total Unweighted Base 2027 Weighted Base 2013 Effective Base 1013 Should be done 886 44% Should not be done 1127 56% Sigma 2013 100%

Page 70 QuickQuery Fielding Period: April 14-17, 2017 HCAPS (Filtered on Registered Voters) Weighted To The U.S. General Adult Population - Propensity 18 Apr 2017 Table 65 FA19 Do you believe that President Obama's national security advisor, Susan Rice, was unmasking intelligence involving the Trump campaign and transition officials for political purposes or do you believe any unmasking was just for national security purposes? Base: All Respondents Total Unweighted Base 2027 Weighted Base 2013 Effective Base 1013 Political purposes 1009 50% National security purposes 1004 50% Sigma 2013 100%
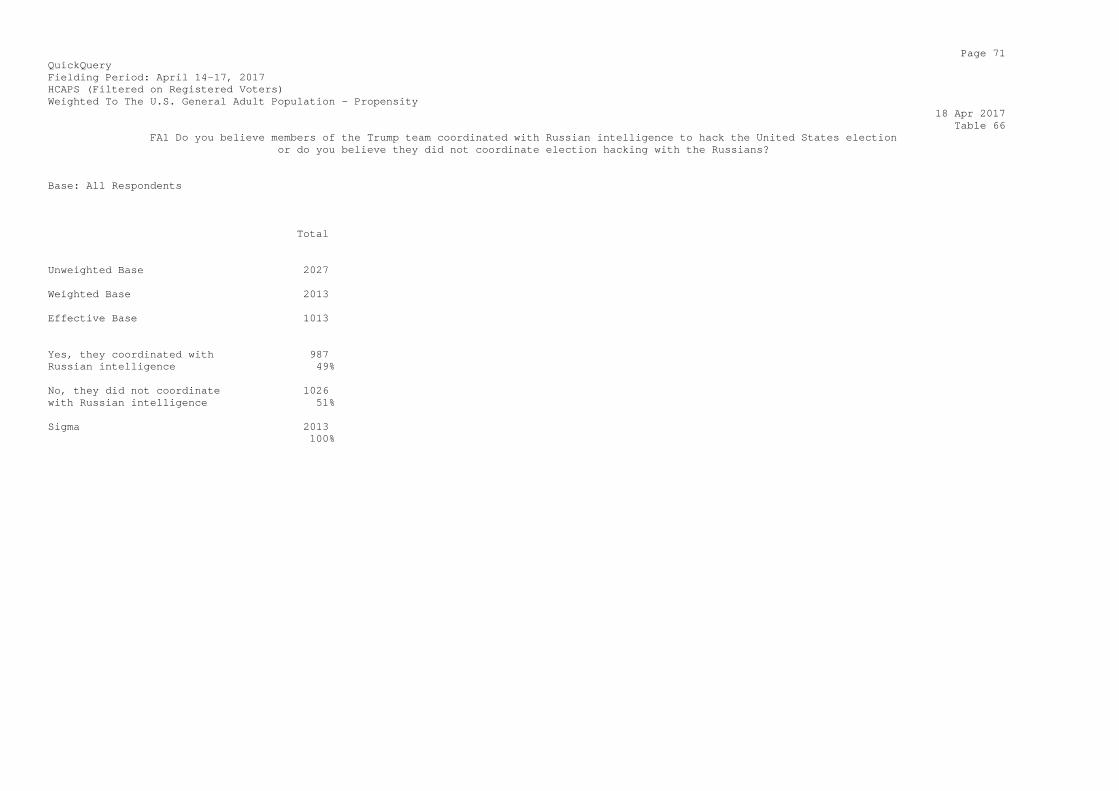
Page 71 QuickQuery Fielding Period: April 14-17, 2017 HCAPS (Filtered on Registered Voters) Weighted To The U.S. General Adult Population - Propensity 18 Apr 2017 Table 66 FA1 Do you believe members of the Trump team coordinated with Russian intelligence to hack the United States election or do you believe they did not coordinate election hacking with the Russians? Base: All Respondents Total Unweighted Base 2027 Weighted Base 2013 Effective Base 1013 Yes, they coordinated with 987 Russian intelligence 49% No, they did not coordinate 1026 with Russian intelligence 51% Sigma 2013 100%
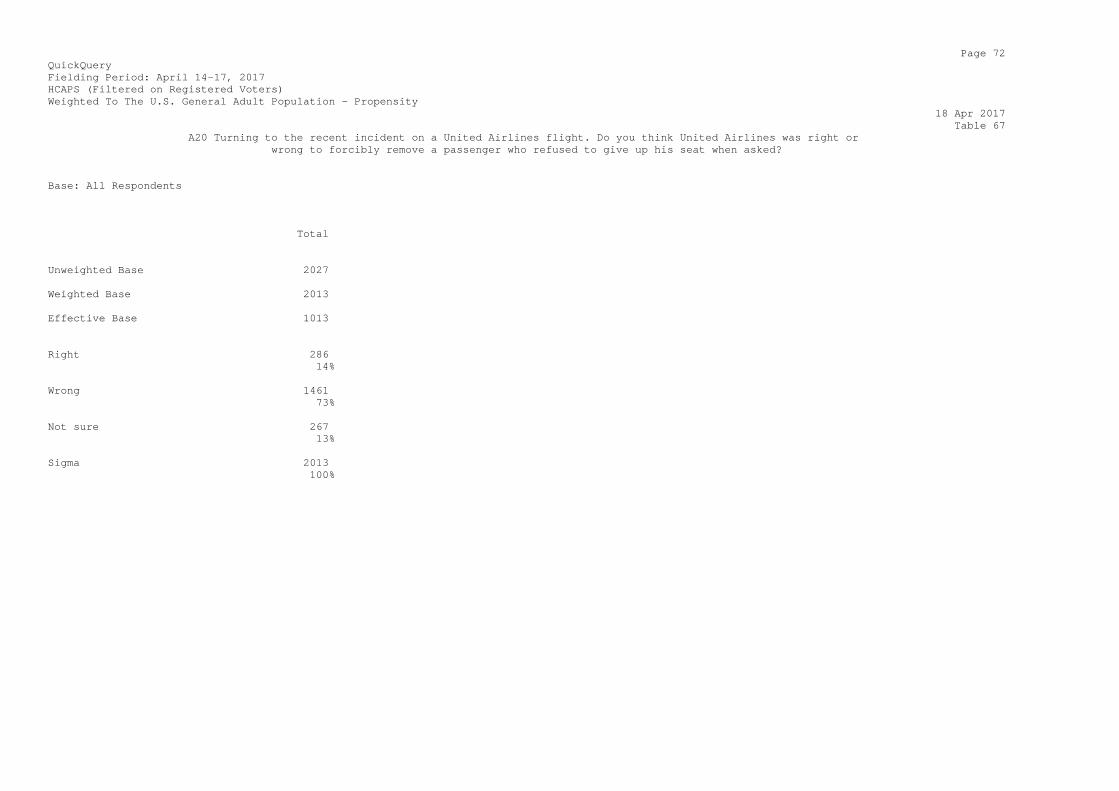
Page 72 QuickQuery Fielding Period: April 14-17, 2017 HCAPS (Filtered on Registered Voters) Weighted To The U.S. General Adult Population - Propensity 18 Apr 2017 Table 67 A20 Turning to the recent incident on a United Airlines flight. Do you think United Airlines was right or wrong to forcibly remove a passenger who refused to give up his seat when asked? Base: All Respondents Total Unweighted Base 2027 Weighted Base 2013 Effective Base 1013 Right 286 14% Wrong 1461 73% Not sure 267 13% Sigma 2013 100%
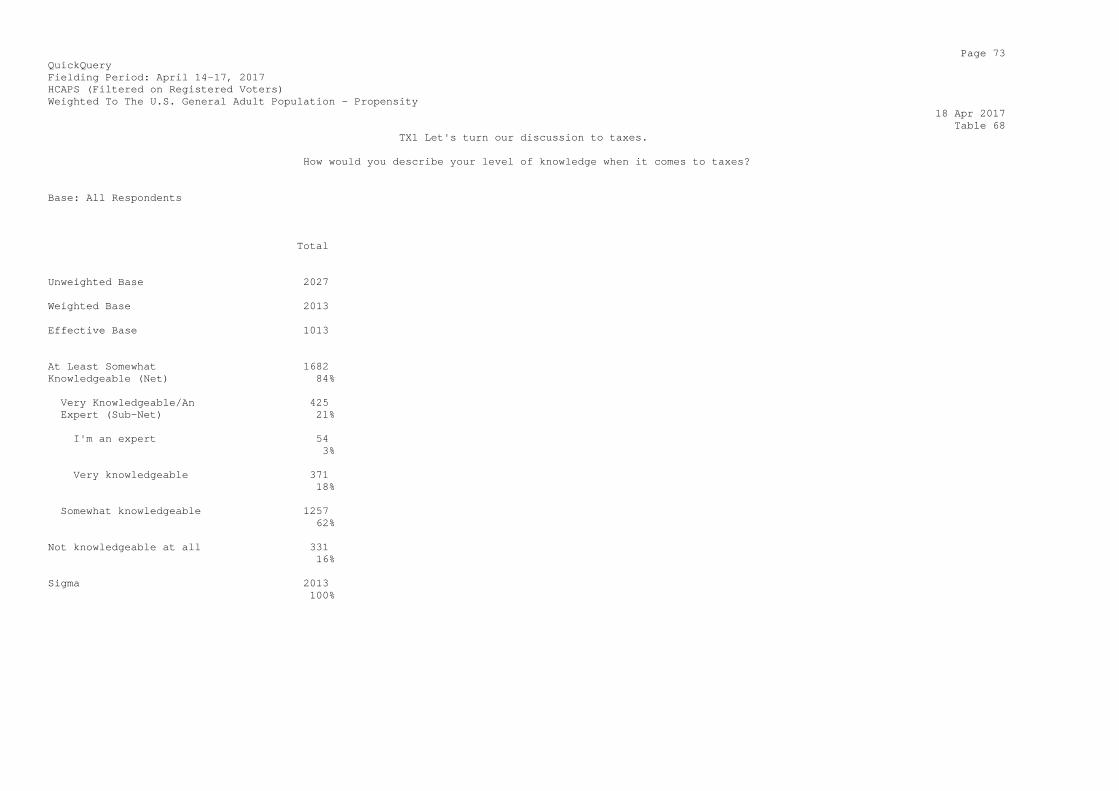
Page 73 QuickQuery Fielding Period: April 14-17, 2017 HCAPS (Filtered on Registered Voters) Weighted To The U.S. General Adult Population - Propensity 18 Apr 2017 Table 68 TX1 Let's turn our discussion to taxes. How would you describe your level of knowledge when it comes to taxes? Base: All Respondents Total Unweighted Base 2027 Weighted Base 2013 Effective Base 1013 At Least Somewhat 1682 Knowledgeable (Net) 84% Very Knowledgeable/An 425 Expert (Sub-Net) 21% I'm an expert 54 3% Very knowledgeable 371 18% Somewhat knowledgeable 1257 62% Not knowledgeable at all 331 16% Sigma 2013 100%
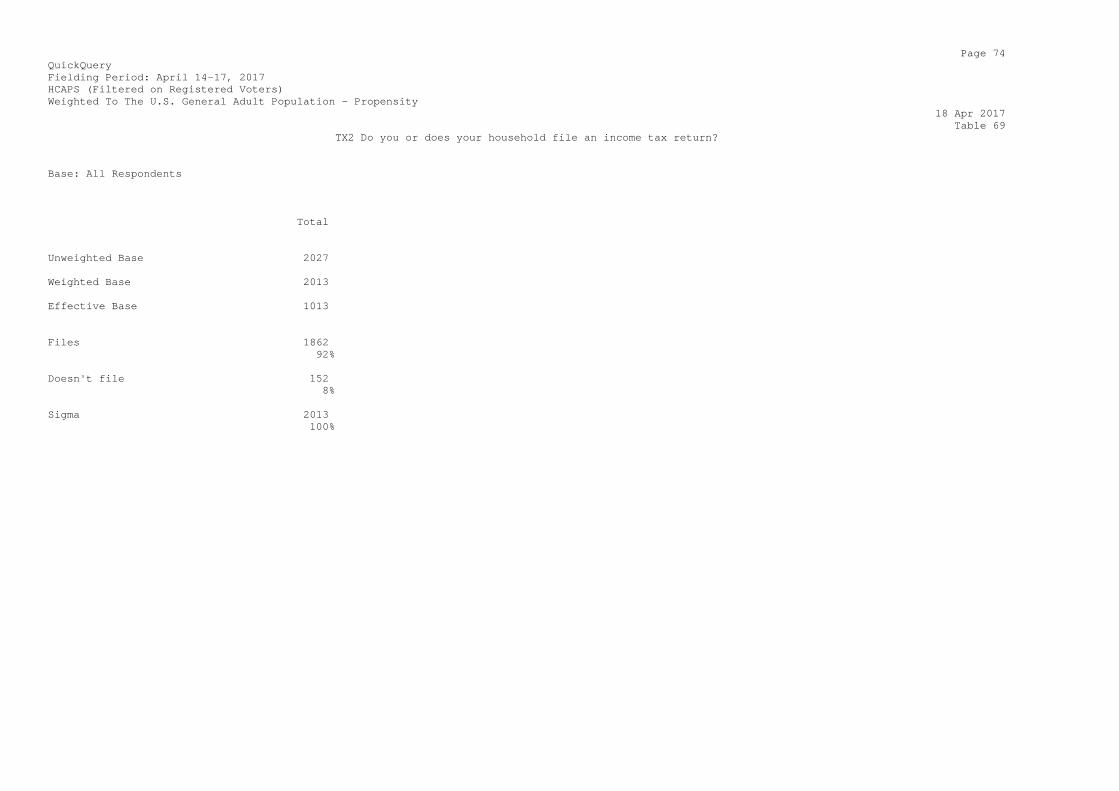
Page 74 QuickQuery Fielding Period: April 14-17, 2017 HCAPS (Filtered on Registered Voters) Weighted To The U.S. General Adult Population - Propensity 18 Apr 2017 Table 69 TX2 Do you or does your household file an income tax return? Base: All Respondents Total Unweighted Base 2027 Weighted Base 2013 Effective Base 1013 Files 1862 92% Doesn't file 152 8% Sigma 2013 100%

Page 75 QuickQuery Fielding Period: April 14-17, 2017 HCAPS (Filtered on Registered Voters) Weighted To The U.S. General Adult Population - Propensity 18 Apr 2017 Table 70 TX3 Who generally completes the tax return(s) for your household? Base: Files Tax Return Total Unweighted Base 1844 Weighted Base 1862 Effective Base 928 Myself 851 46% A professional tax preparer 738 40% Someone else in my household 272 15% Sigma 1862 100%
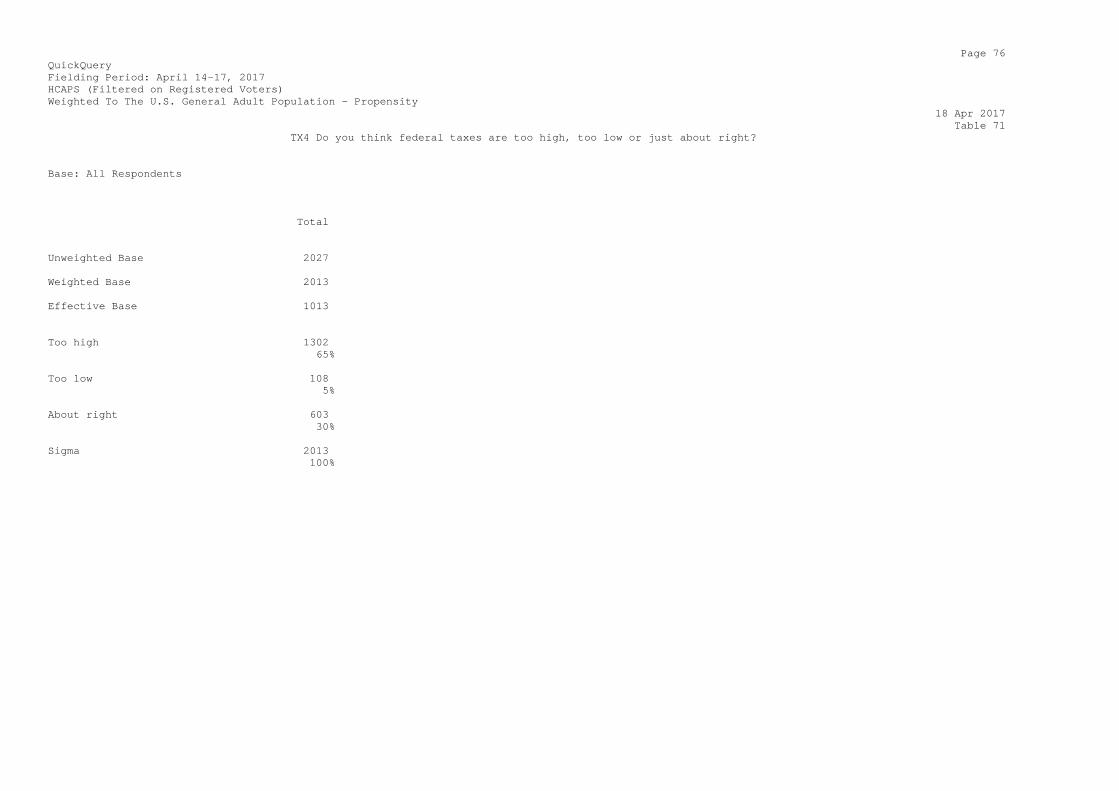
Page 76 QuickQuery Fielding Period: April 14-17, 2017 HCAPS (Filtered on Registered Voters) Weighted To The U.S. General Adult Population - Propensity 18 Apr 2017 Table 71 TX4 Do you think federal taxes are too high, too low or just about right? Base: All Respondents Total Unweighted Base 2027 Weighted Base 2013 Effective Base 1013 Too high 1302 65% Too low 108 5% About right 603 30% Sigma 2013 100%
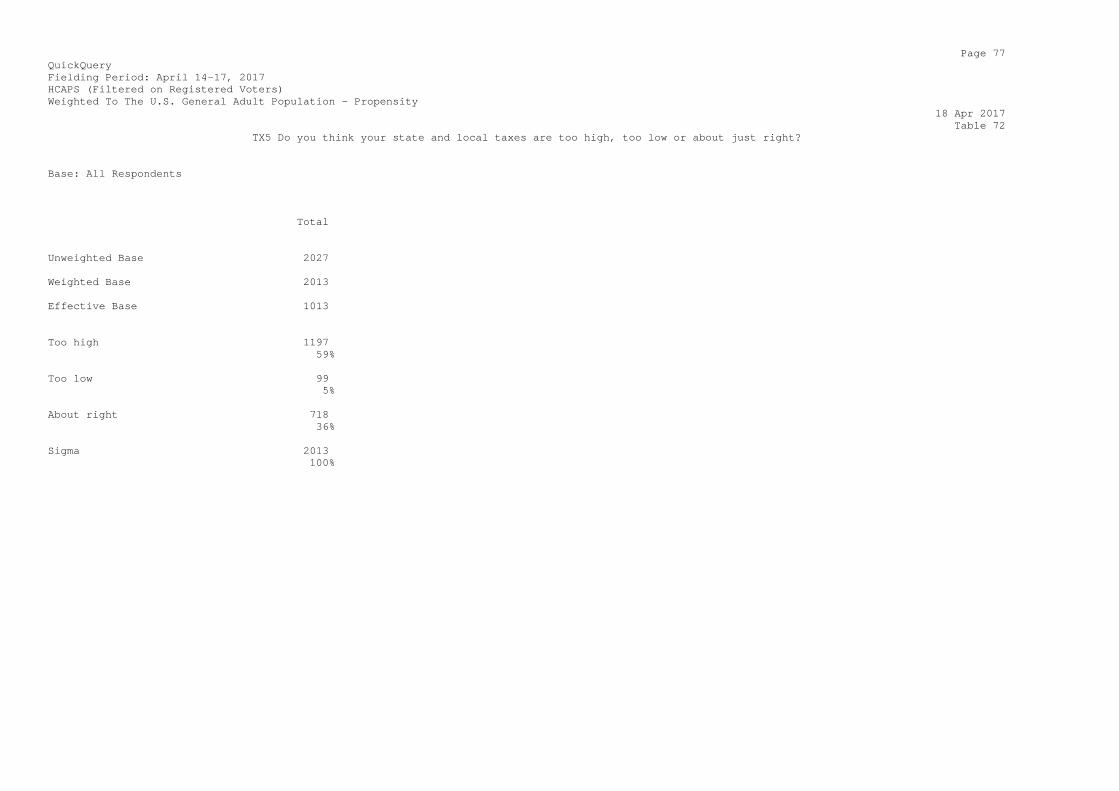
Page 77 QuickQuery Fielding Period: April 14-17, 2017 HCAPS (Filtered on Registered Voters) Weighted To The U.S. General Adult Population - Propensity 18 Apr 2017 Table 72 TX5 Do you think your state and local taxes are too high, too low or about just right? Base: All Respondents Total Unweighted Base 2027 Weighted Base 2013 Effective Base 1013 Too high 1197 59% Too low 99 5% About right 718 36% Sigma 2013 100%
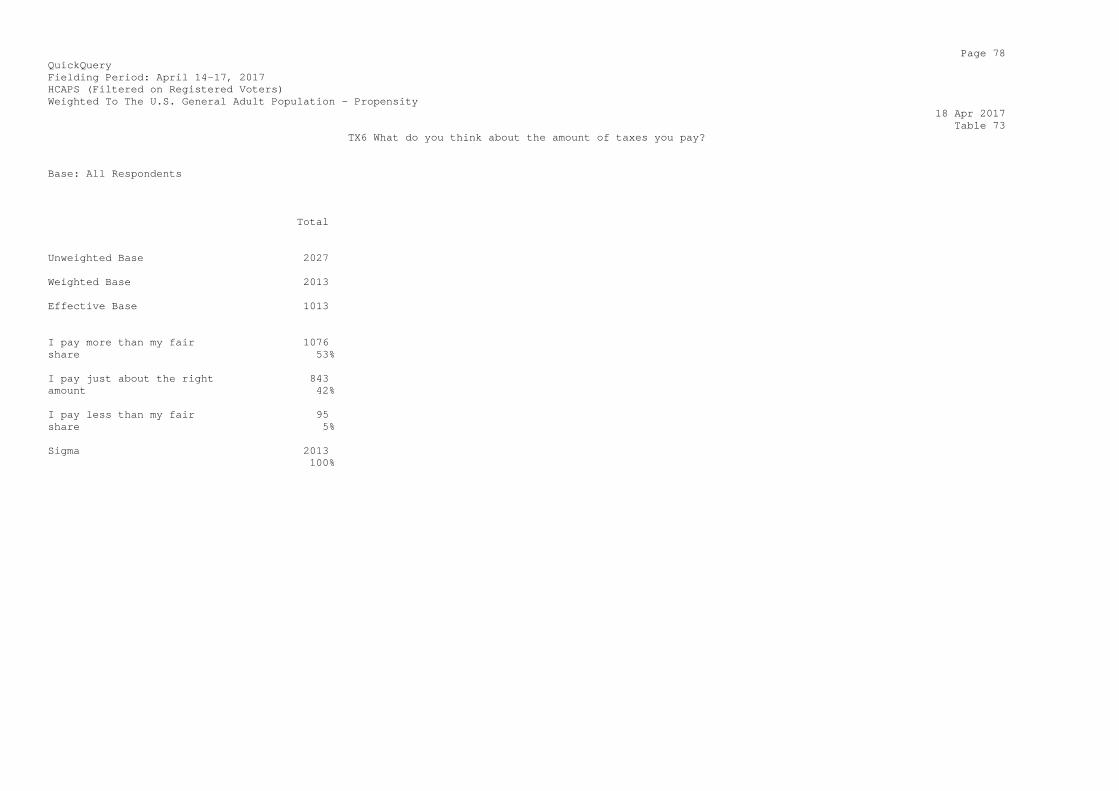
Page 78 QuickQuery Fielding Period: April 14-17, 2017 HCAPS (Filtered on Registered Voters) Weighted To The U.S. General Adult Population - Propensity 18 Apr 2017 Table 73 TX6 What do you think about the amount of taxes you pay? Base: All Respondents Total Unweighted Base 2027 Weighted Base 2013 Effective Base 1013 I pay more than my fair 1076 share 53% I pay just about the right 843 amount 42% I pay less than my fair 95 share 5% Sigma 2013 100%
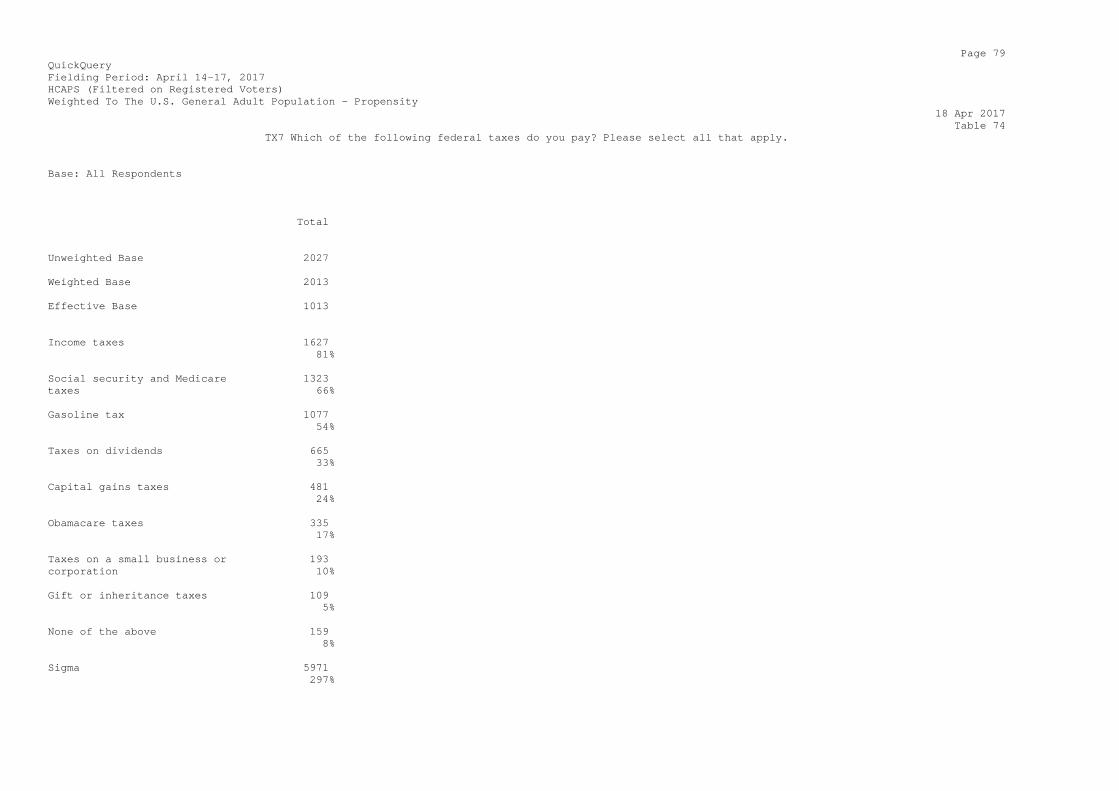
Page 79 QuickQuery Fielding Period: April 14-17, 2017 HCAPS (Filtered on Registered Voters) Weighted To The U.S. General Adult Population - Propensity 18 Apr 2017 Table 74 TX7 Which of the following federal taxes do you pay? Please select all that apply. Base: All Respondents Total Unweighted Base 2027 Weighted Base 2013 Effective Base 1013 Income taxes 1627 81% Social security and Medicare 1323 taxes 66% Gasoline tax 1077 54% Taxes on dividends 665 33% Capital gains taxes 481 24% Obamacare taxes 335 17% Taxes on a small business or 193 corporation 10% Gift or inheritance taxes 109 5% None of the above 159 8% Sigma 5971 297%
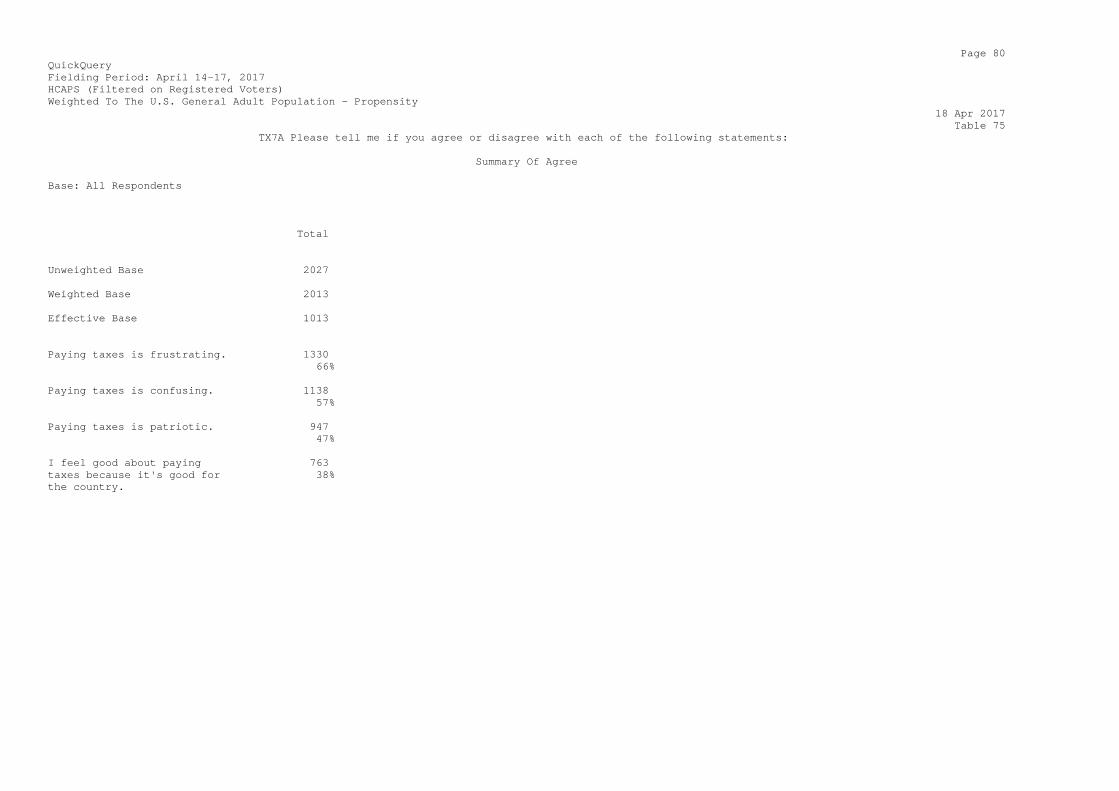
Page 80 QuickQuery Fielding Period: April 14-17, 2017 HCAPS (Filtered on Registered Voters) Weighted To The U.S. General Adult Population - Propensity 18 Apr 2017 Table 75 TX7A Please tell me if you agree or disagree with each of the following statements: Summary Of Agree Base: All Respondents Total Unweighted Base 2027 Weighted Base 2013 Effective Base 1013 Paying taxes is frustrating. 1330 66% Paying taxes is confusing. 1138 57% Paying taxes is patriotic. 947 47% I feel good about paying 763 taxes because it's good for 38% the country.
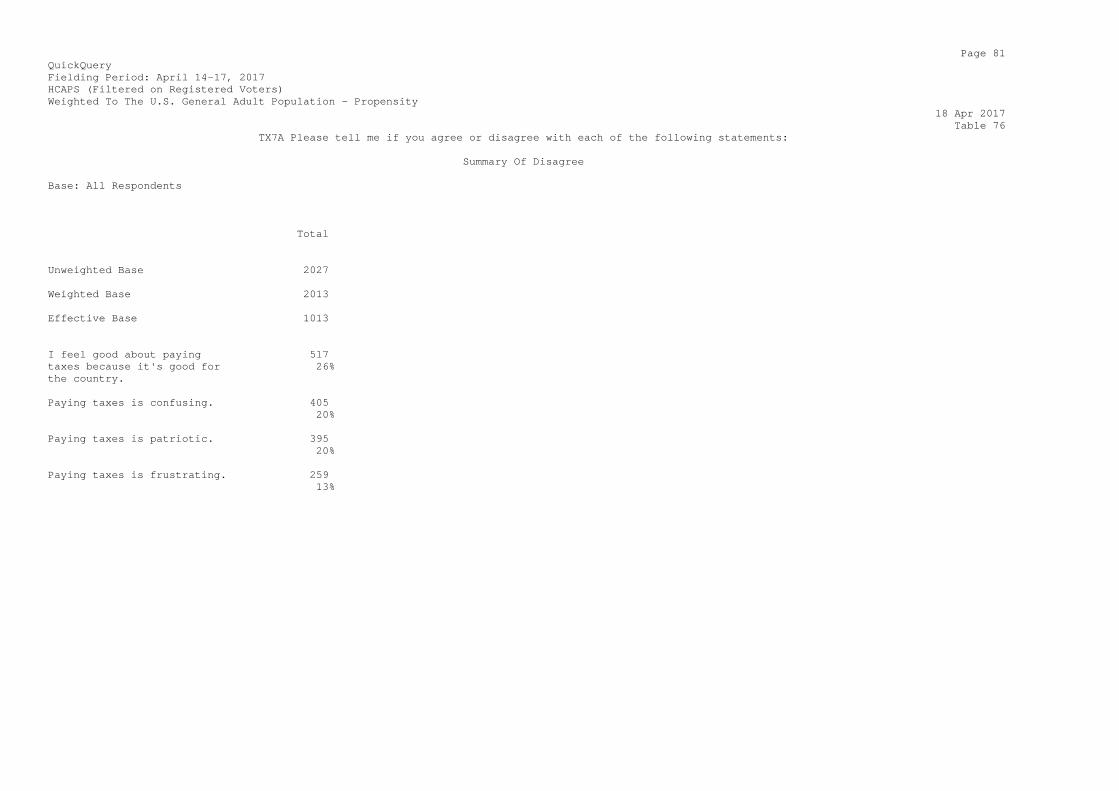
Page 81 QuickQuery Fielding Period: April 14-17, 2017 HCAPS (Filtered on Registered Voters) Weighted To The U.S. General Adult Population - Propensity 18 Apr 2017 Table 76 TX7A Please tell me if you agree or disagree with each of the following statements: Summary Of Disagree Base: All Respondents Total Unweighted Base 2027 Weighted Base 2013 Effective Base 1013 I feel good about paying 517 taxes because it's good for 26% the country. Paying taxes is confusing. 405 20% Paying taxes is patriotic. 395 20% Paying taxes is frustrating. 259 13%

Page 82 QuickQuery Fielding Period: April 14-17, 2017 HCAPS (Filtered on Registered Voters) Weighted To The U.S. General Adult Population - Propensity 18 Apr 2017 Table 77 TX7A_1 Please tell me if you agree or disagree with each of the following statements: Paying taxes is patriotic. Base: All Respondents Total Unweighted Base 2027 Weighted Base 2013 Effective Base 1013 Agree (Net) 947 47% Strongly agree 310 15% Agree 637 32% Neither agree nor disagree 671 33% Disagree (Net) 395 20% Disagree 242 12% Strong disagree 153 8% Sigma 2013 100%
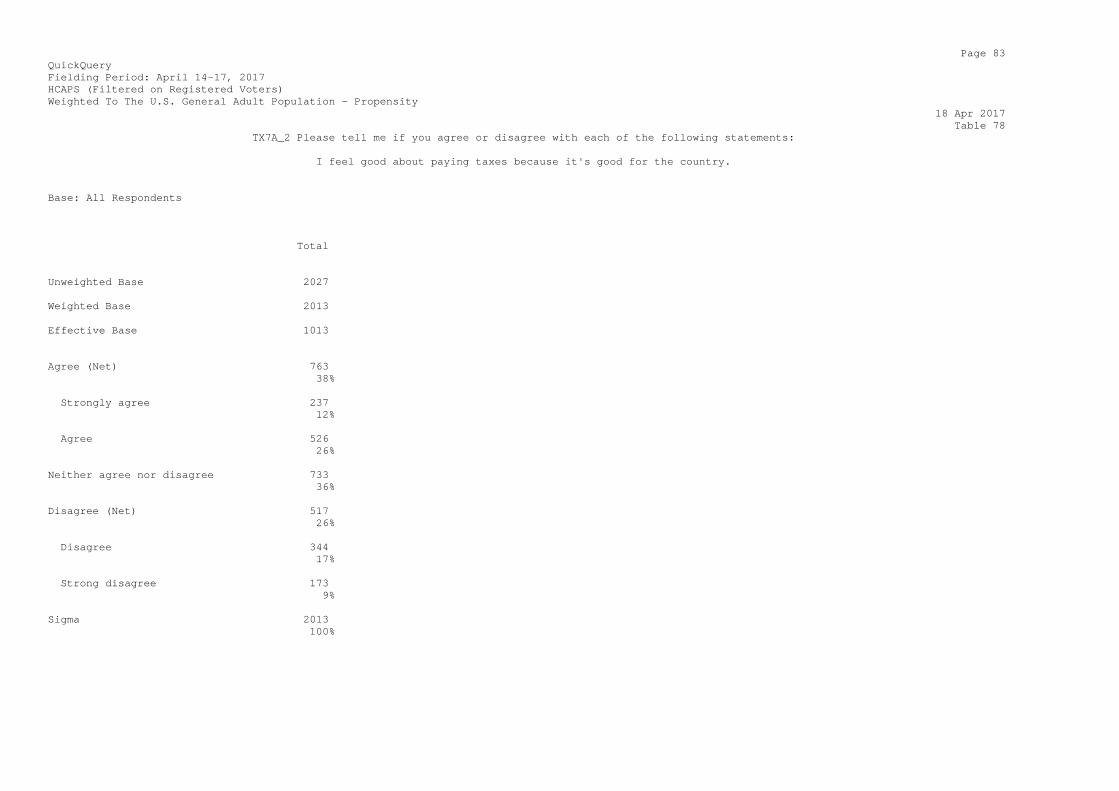
Page 83 QuickQuery Fielding Period: April 14-17, 2017 HCAPS (Filtered on Registered Voters) Weighted To The U.S. General Adult Population - Propensity 18 Apr 2017 Table 78 TX7A_2 Please tell me if you agree or disagree with each of the following statements: I feel good about paying taxes because it's good for the country. Base: All Respondents Total Unweighted Base 2027 Weighted Base 2013 Effective Base 1013 Agree (Net) 763 38% Strongly agree 237 12% Agree 526 26% Neither agree nor disagree 733 36% Disagree (Net) 517 26% Disagree 344 17% Strong disagree 173 9% Sigma 2013 100%

Page 84 QuickQuery Fielding Period: April 14-17, 2017 HCAPS (Filtered on Registered Voters) Weighted To The U.S. General Adult Population - Propensity 18 Apr 2017 Table 79 TX7A_3 Please tell me if you agree or disagree with each of the following statements: Paying taxes is frustrating. Base: All Respondents Total Unweighted Base 2027 Weighted Base 2013 Effective Base 1013 Agree (Net) 1330 66% Strongly agree 575 29% Agree 755 37% Neither agree nor disagree 424 21% Disagree (Net) 259 13% Disagree 187 9% Strong disagree 72 4% Sigma 2013 100%
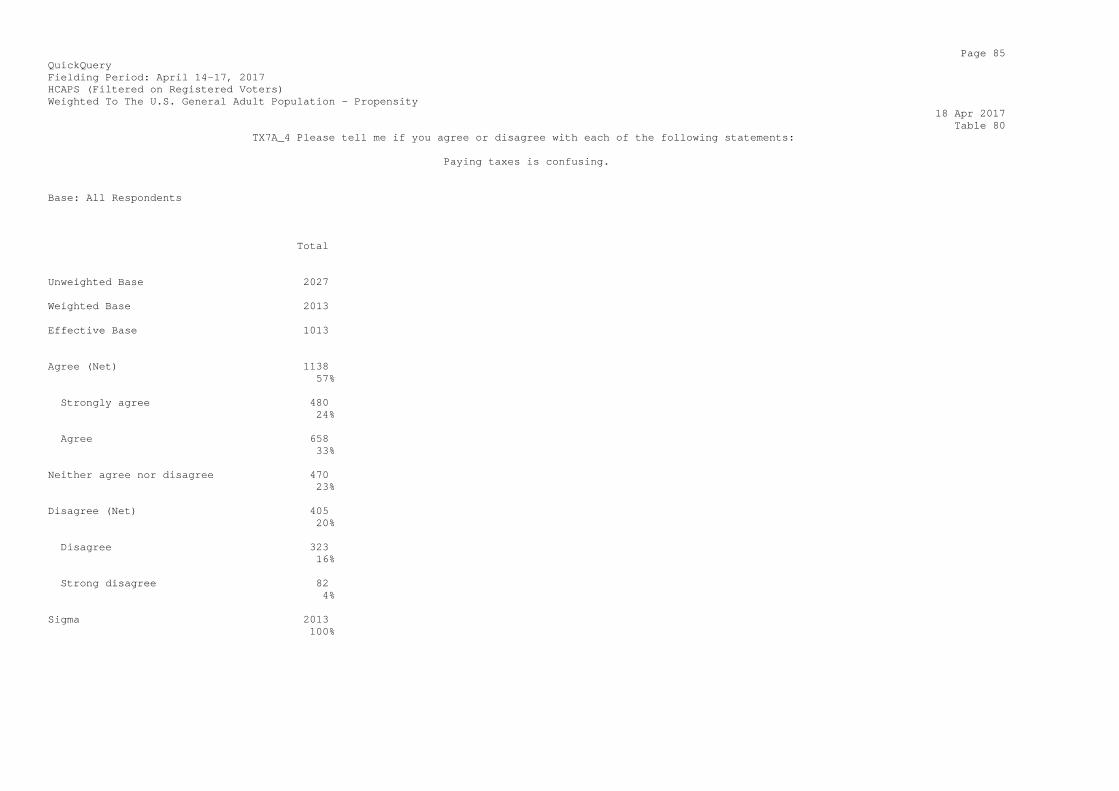
Page 85 QuickQuery Fielding Period: April 14-17, 2017 HCAPS (Filtered on Registered Voters) Weighted To The U.S. General Adult Population - Propensity 18 Apr 2017 Table 80 TX7A_4 Please tell me if you agree or disagree with each of the following statements: Paying taxes is confusing. Base: All Respondents Total Unweighted Base 2027 Weighted Base 2013 Effective Base 1013 Agree (Net) 1138 57% Strongly agree 480 24% Agree 658 33% Neither agree nor disagree 470 23% Disagree (Net) 405 20% Disagree 323 16% Strong disagree 82 4% Sigma 2013 100%
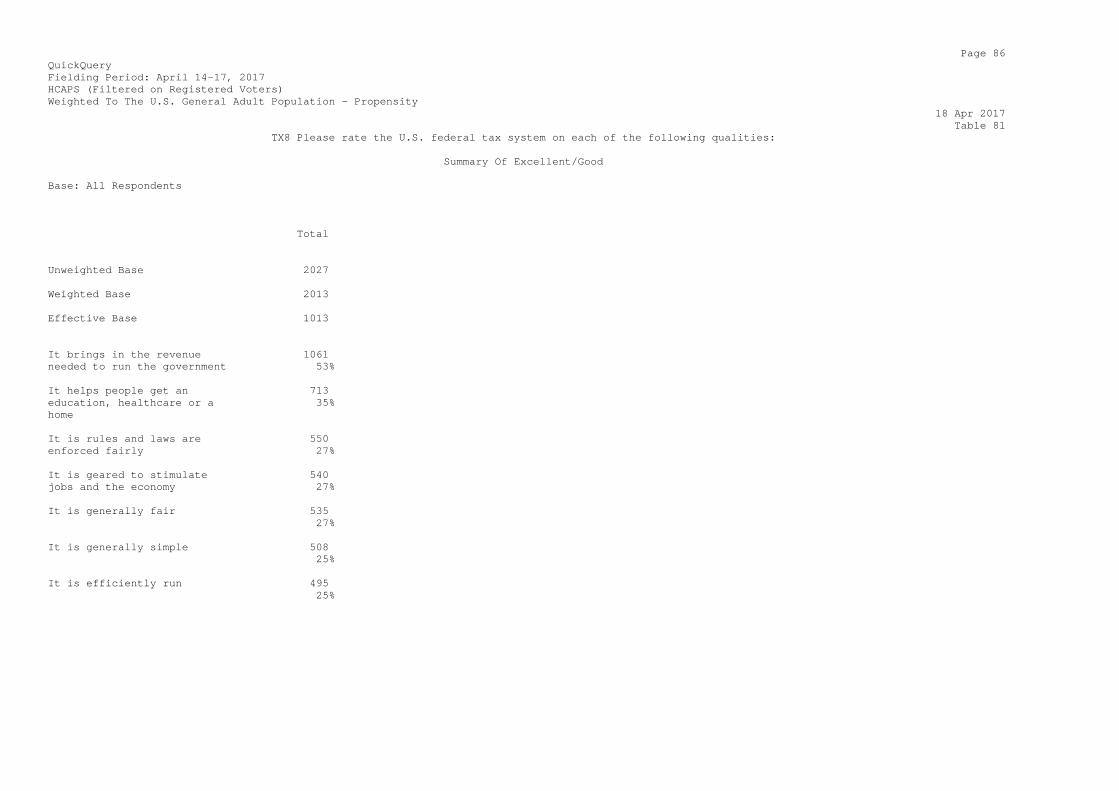
Page 86 QuickQuery Fielding Period: April 14-17, 2017 HCAPS (Filtered on Registered Voters) Weighted To The U.S. General Adult Population - Propensity 18 Apr 2017 Table 81 TX8 Please rate the U.S. federal tax system on each of the following qualities: Summary Of Excellent/Good Base: All Respondents Total Unweighted Base 2027 Weighted Base 2013 Effective Base 1013 It brings in the revenue 1061 needed to run the government 53% It helps people get an 713 education, healthcare or a 35% home It is rules and laws are 550 enforced fairly 27% It is geared to stimulate 540 jobs and the economy 27% It is generally fair 535 27% It is generally simple 508 25% It is efficiently run 495 25%
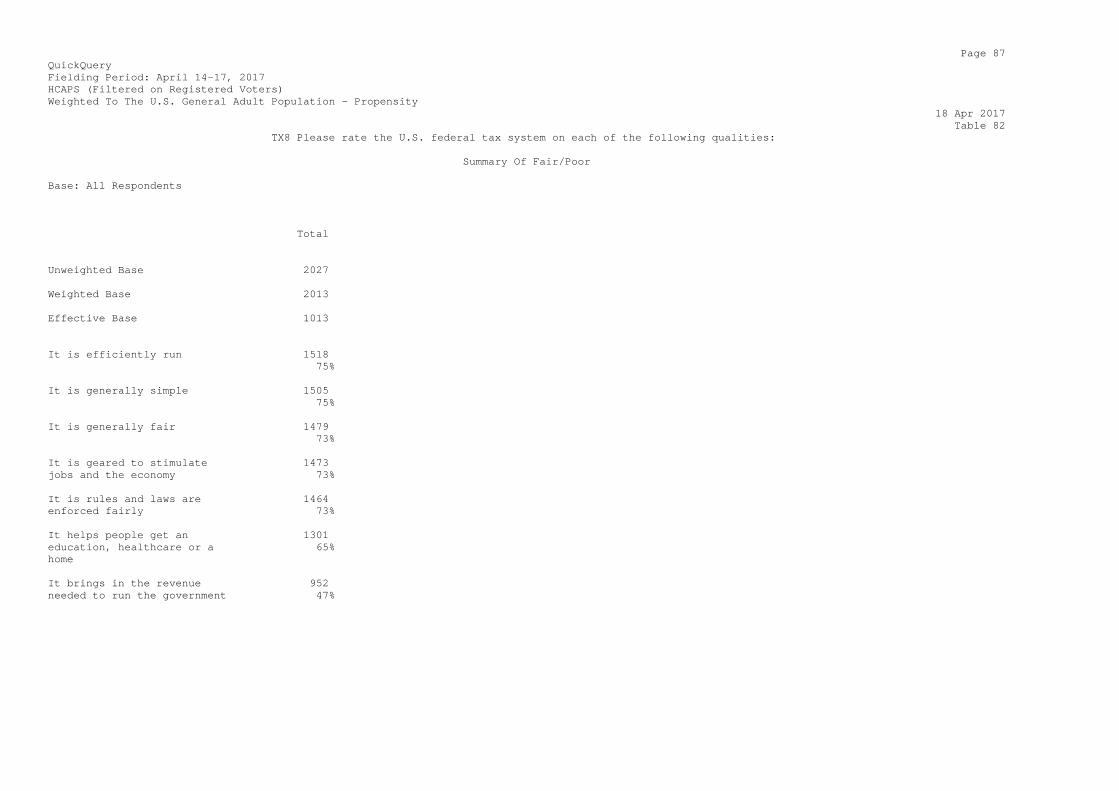
Page 87 QuickQuery Fielding Period: April 14-17, 2017 HCAPS (Filtered on Registered Voters) Weighted To The U.S. General Adult Population - Propensity 18 Apr 2017 Table 82 TX8 Please rate the U.S. federal tax system on each of the following qualities: Summary Of Fair/Poor Base: All Respondents Total Unweighted Base 2027 Weighted Base 2013 Effective Base 1013 It is efficiently run 1518 75% It is generally simple 1505 75% It is generally fair 1479 73% It is geared to stimulate 1473 jobs and the economy 73% It is rules and laws are 1464 enforced fairly 73% It helps people get an 1301 education, healthcare or a 65% home It brings in the revenue 952 needed to run the government 47%
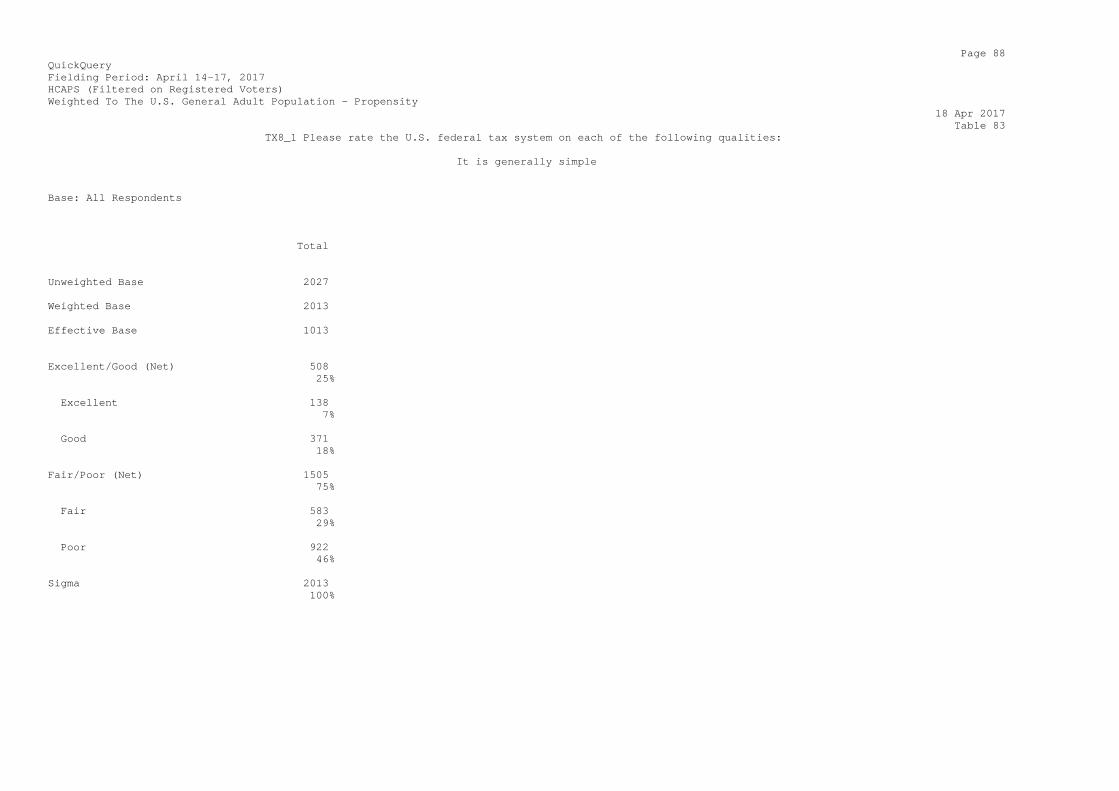
Page 88 QuickQuery Fielding Period: April 14-17, 2017 HCAPS (Filtered on Registered Voters) Weighted To The U.S. General Adult Population - Propensity 18 Apr 2017 Table 83 TX8_1 Please rate the U.S. federal tax system on each of the following qualities: It is generally simple Base: All Respondents Total Unweighted Base 2027 Weighted Base 2013 Effective Base 1013 Excellent/Good (Net) 508 25% Excellent 138 7% Good 371 18% Fair/Poor (Net) 1505 75% Fair 583 29% Poor 922 46% Sigma 2013 100%
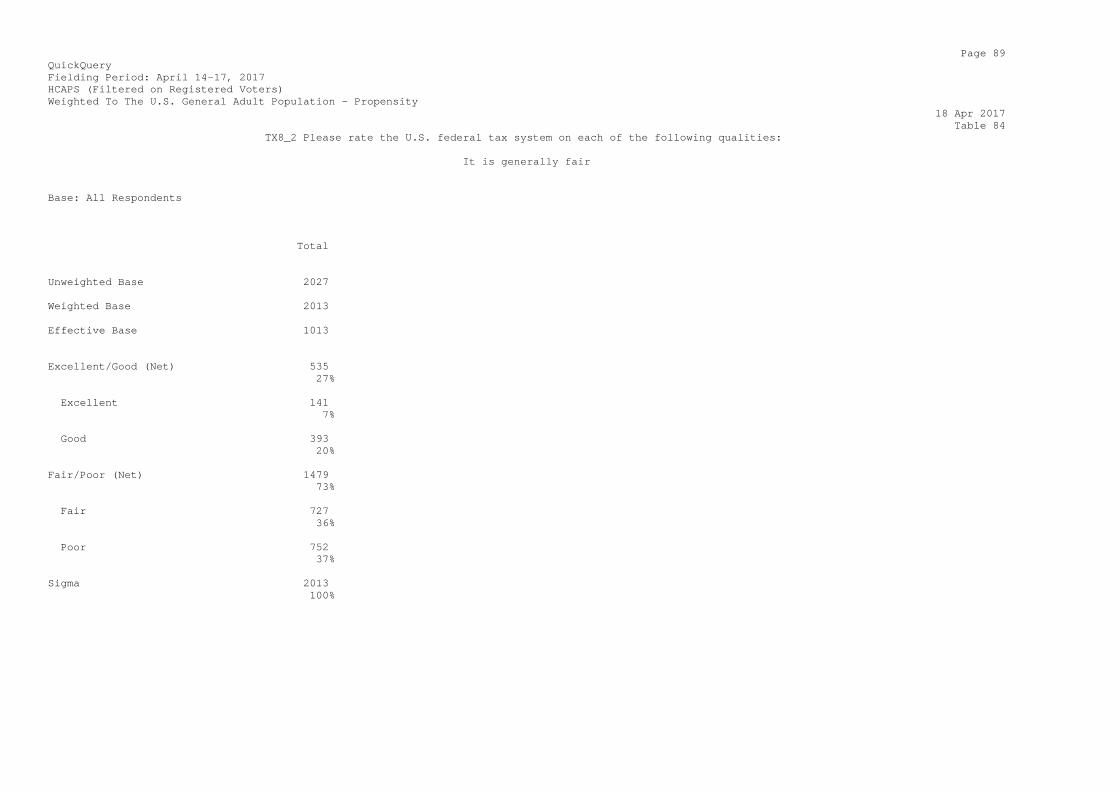
Page 89 QuickQuery Fielding Period: April 14-17, 2017 HCAPS (Filtered on Registered Voters) Weighted To The U.S. General Adult Population - Propensity 18 Apr 2017 Table 84 TX8_2 Please rate the U.S. federal tax system on each of the following qualities: It is generally fair Base: All Respondents Total Unweighted Base 2027 Weighted Base 2013 Effective Base 1013 Excellent/Good (Net) 535 27% Excellent 141 7% Good 393 20% Fair/Poor (Net) 1479 73% Fair 727 36% Poor 752 37% Sigma 2013 100%

Page 90 QuickQuery Fielding Period: April 14-17, 2017 HCAPS (Filtered on Registered Voters) Weighted To The U.S. General Adult Population - Propensity 18 Apr 2017 Table 85 TX8_3 Please rate the U.S. federal tax system on each of the following qualities: It is efficiently run Base: All Respondents Total Unweighted Base 2027 Weighted Base 2013 Effective Base 1013 Excellent/Good (Net) 495 25% Excellent 156 8% Good 339 17% Fair/Poor (Net) 1518 75% Fair 628 31% Poor 890 44% Sigma 2013 100%
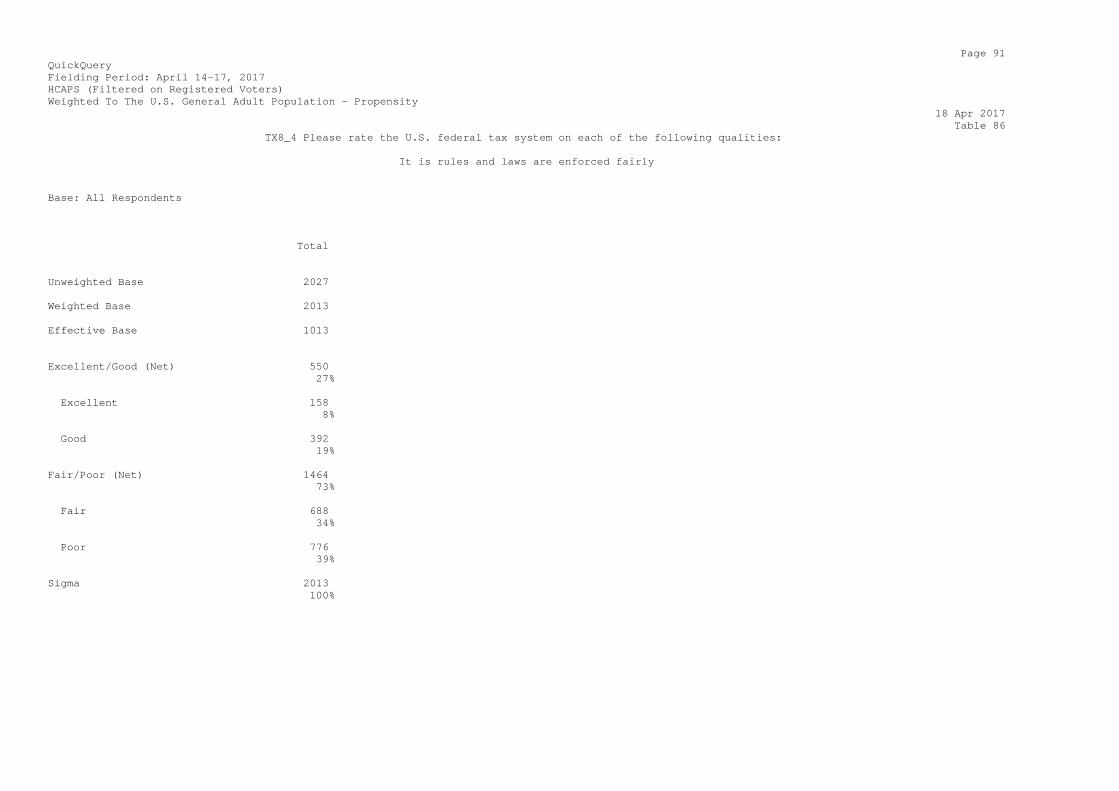
Page 91 QuickQuery Fielding Period: April 14-17, 2017 HCAPS (Filtered on Registered Voters) Weighted To The U.S. General Adult Population - Propensity 18 Apr 2017 Table 86 TX8_4 Please rate the U.S. federal tax system on each of the following qualities: It is rules and laws are enforced fairly Base: All Respondents Total Unweighted Base 2027 Weighted Base 2013 Effective Base 1013 Excellent/Good (Net) 550 27% Excellent 158 8% Good 392 19% Fair/Poor (Net) 1464 73% Fair 688 34% Poor 776 39% Sigma 2013 100%
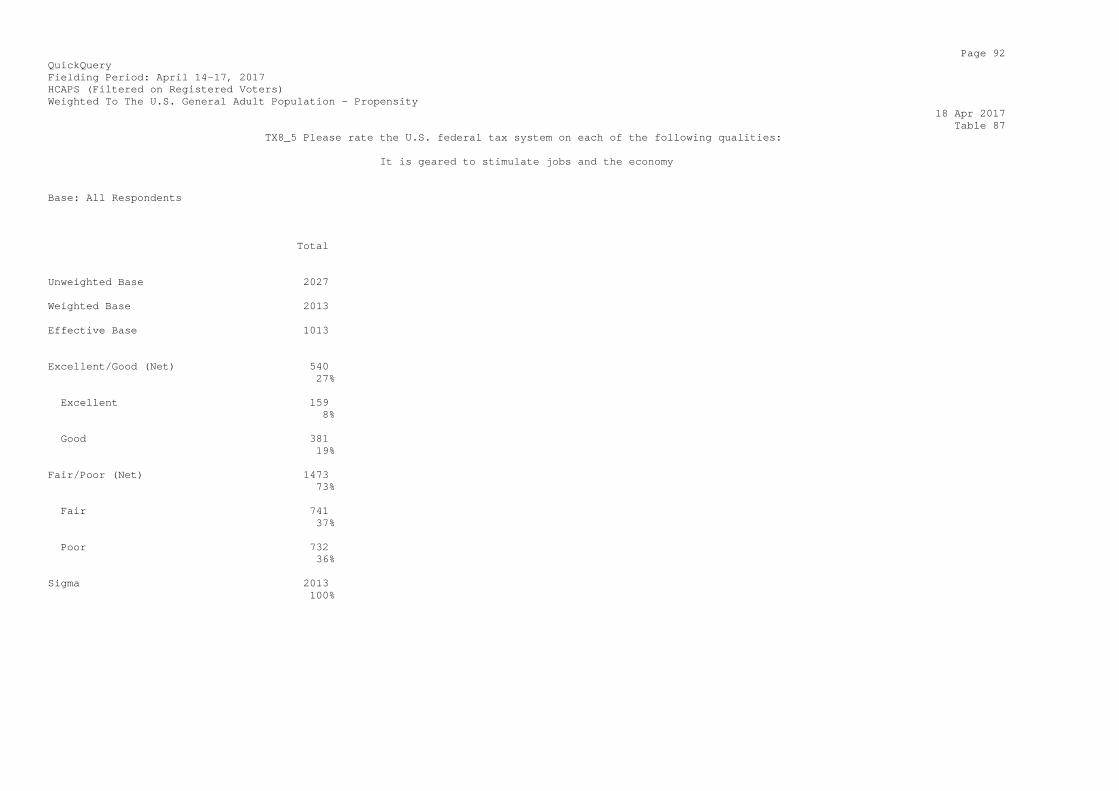
Page 92 QuickQuery Fielding Period: April 14-17, 2017 HCAPS (Filtered on Registered Voters) Weighted To The U.S. General Adult Population - Propensity 18 Apr 2017 Table 87 TX8_5 Please rate the U.S. federal tax system on each of the following qualities: It is geared to stimulate jobs and the economy Base: All Respondents Total Unweighted Base 2027 Weighted Base 2013 Effective Base 1013 Excellent/Good (Net) 540 27% Excellent 159 8% Good 381 19% Fair/Poor (Net) 1473 73% Fair 741 37% Poor 732 36% Sigma 2013 100%
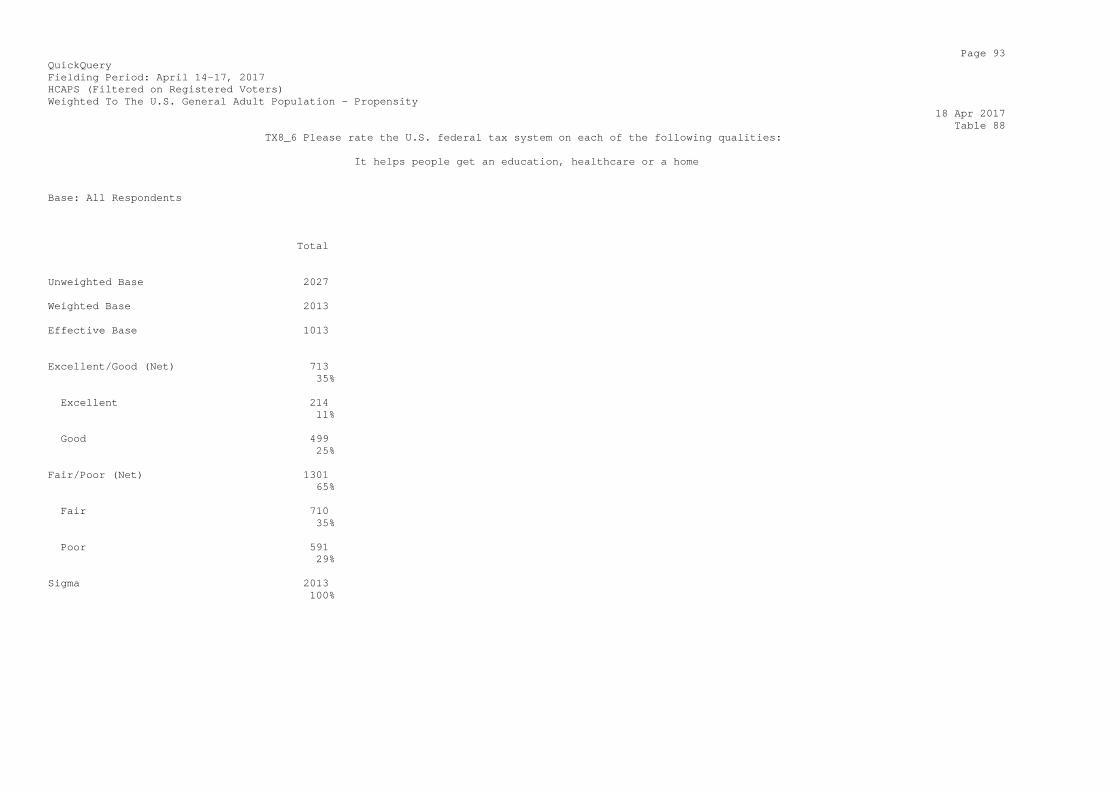
Page 93 QuickQuery Fielding Period: April 14-17, 2017 HCAPS (Filtered on Registered Voters) Weighted To The U.S. General Adult Population - Propensity 18 Apr 2017 Table 88 TX8_6 Please rate the U.S. federal tax system on each of the following qualities: It helps people get an education, healthcare or a home Base: All Respondents Total Unweighted Base 2027 Weighted Base 2013 Effective Base 1013 Excellent/Good (Net) 713 35% Excellent 214 11% Good 499 25% Fair/Poor (Net) 1301 65% Fair 710 35% Poor 591 29% Sigma 2013 100%
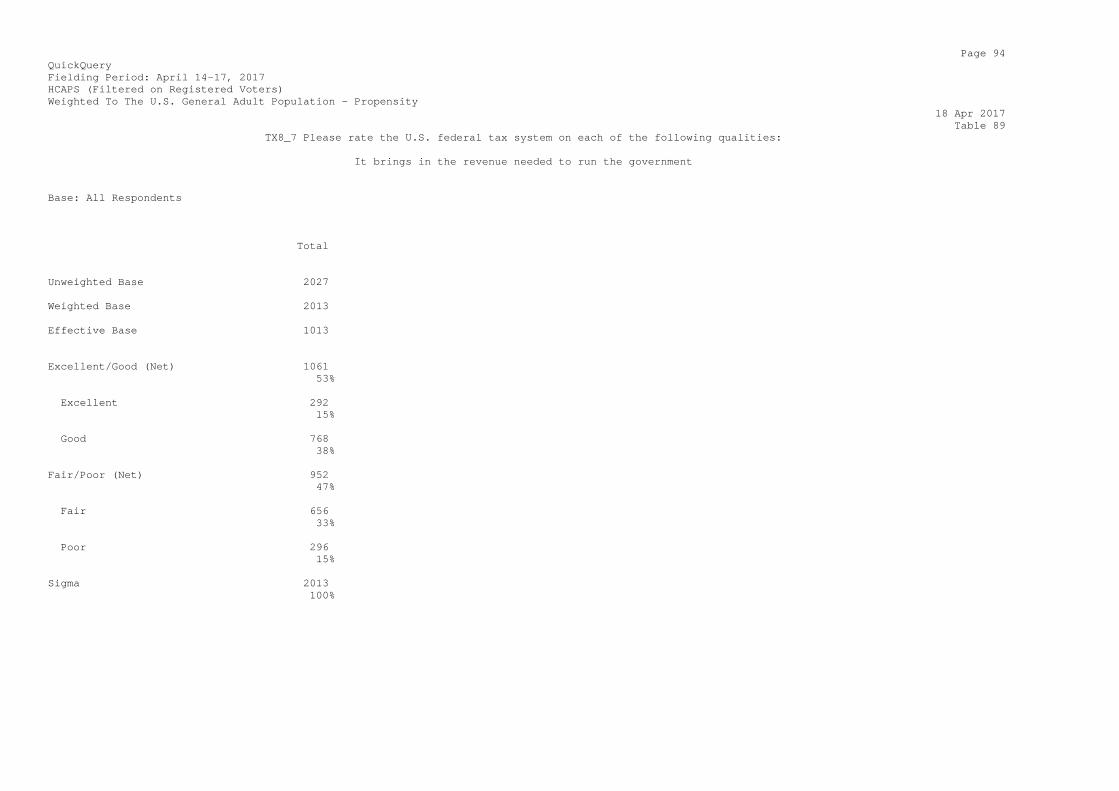
Page 94 QuickQuery Fielding Period: April 14-17, 2017 HCAPS (Filtered on Registered Voters) Weighted To The U.S. General Adult Population - Propensity 18 Apr 2017 Table 89 TX8_7 Please rate the U.S. federal tax system on each of the following qualities: It brings in the revenue needed to run the government Base: All Respondents Total Unweighted Base 2027 Weighted Base 2013 Effective Base 1013 Excellent/Good (Net) 1061 53% Excellent 292 15% Good 768 38% Fair/Poor (Net) 952 47% Fair 656 33% Poor 296 15% Sigma 2013 100%
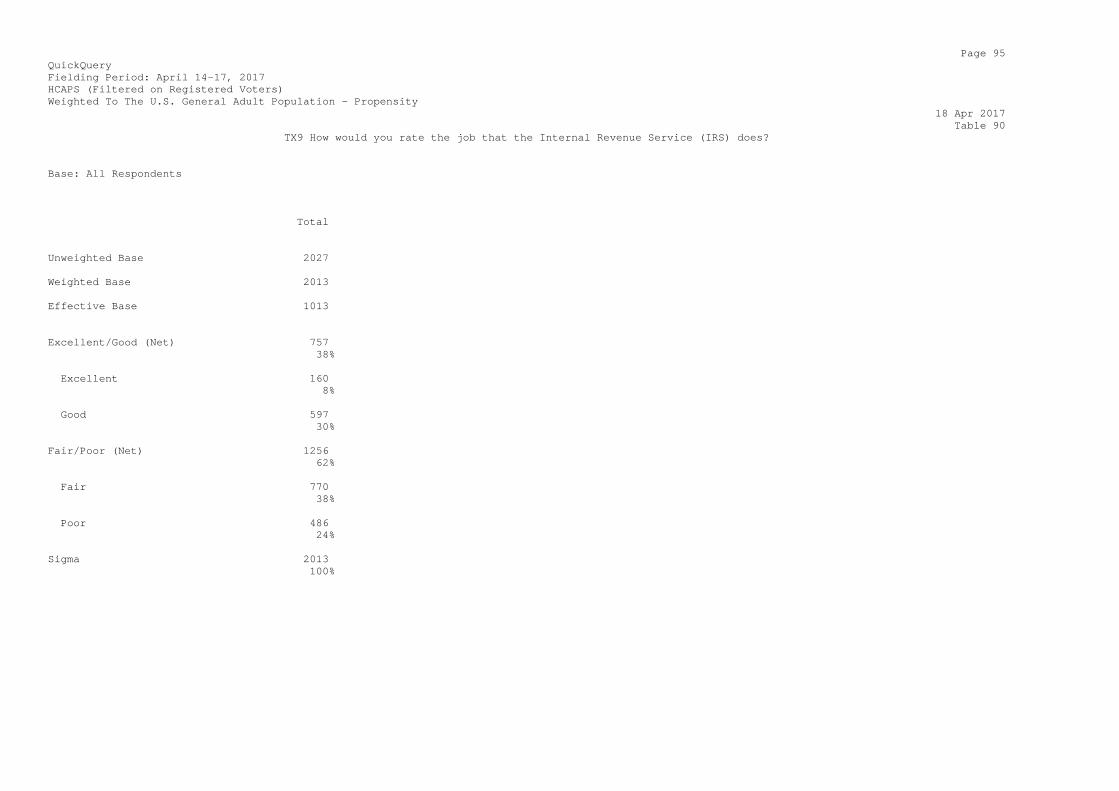
Page 95 QuickQuery Fielding Period: April 14-17, 2017 HCAPS (Filtered on Registered Voters) Weighted To The U.S. General Adult Population - Propensity 18 Apr 2017 Table 90 TX9 How would you rate the job that the Internal Revenue Service (IRS) does? Base: All Respondents Total Unweighted Base 2027 Weighted Base 2013 Effective Base 1013 Excellent/Good (Net) 757 38% Excellent 160 8% Good 597 30% Fair/Poor (Net) 1256 62% Fair 770 38% Poor 486 24% Sigma 2013 100%
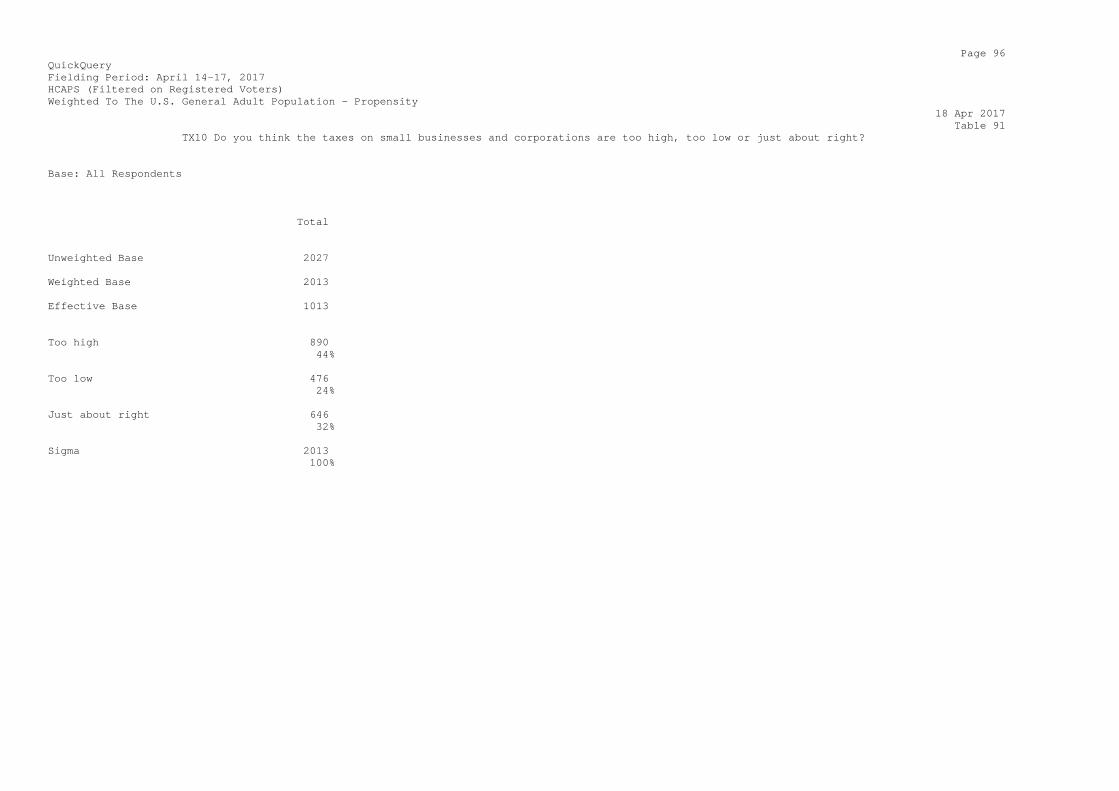
Page 96 QuickQuery Fielding Period: April 14-17, 2017 HCAPS (Filtered on Registered Voters) Weighted To The U.S. General Adult Population - Propensity 18 Apr 2017 Table 91 TX10 Do you think the taxes on small businesses and corporations are too high, too low or just about right? Base: All Respondents Total Unweighted Base 2027 Weighted Base 2013 Effective Base 1013 Too high 890 44% Too low 476 24% Just about right 646 32% Sigma 2013 100%
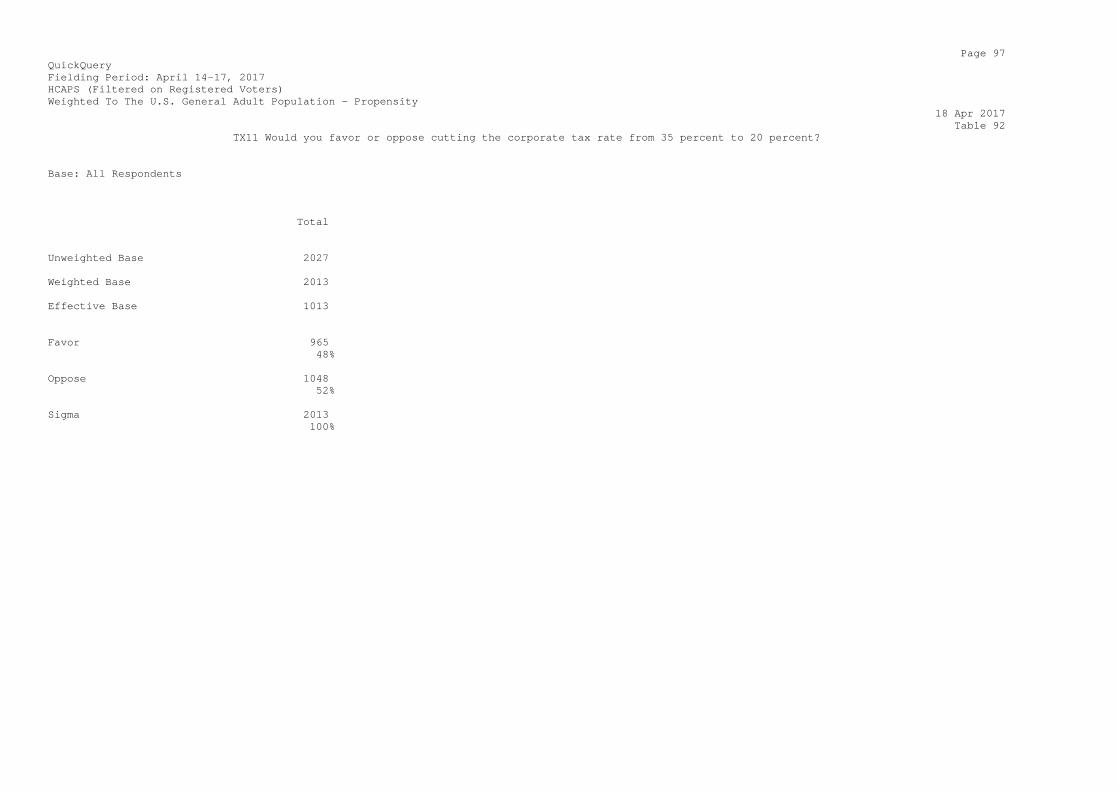
Page 97 QuickQuery Fielding Period: April 14-17, 2017 HCAPS (Filtered on Registered Voters) Weighted To The U.S. General Adult Population - Propensity 18 Apr 2017 Table 92 TX11 Would you favor or oppose cutting the corporate tax rate from 35 percent to 20 percent? Base: All Respondents Total Unweighted Base 2027 Weighted Base 2013 Effective Base 1013 Favor 965 48% Oppose 1048 52% Sigma 2013 100%
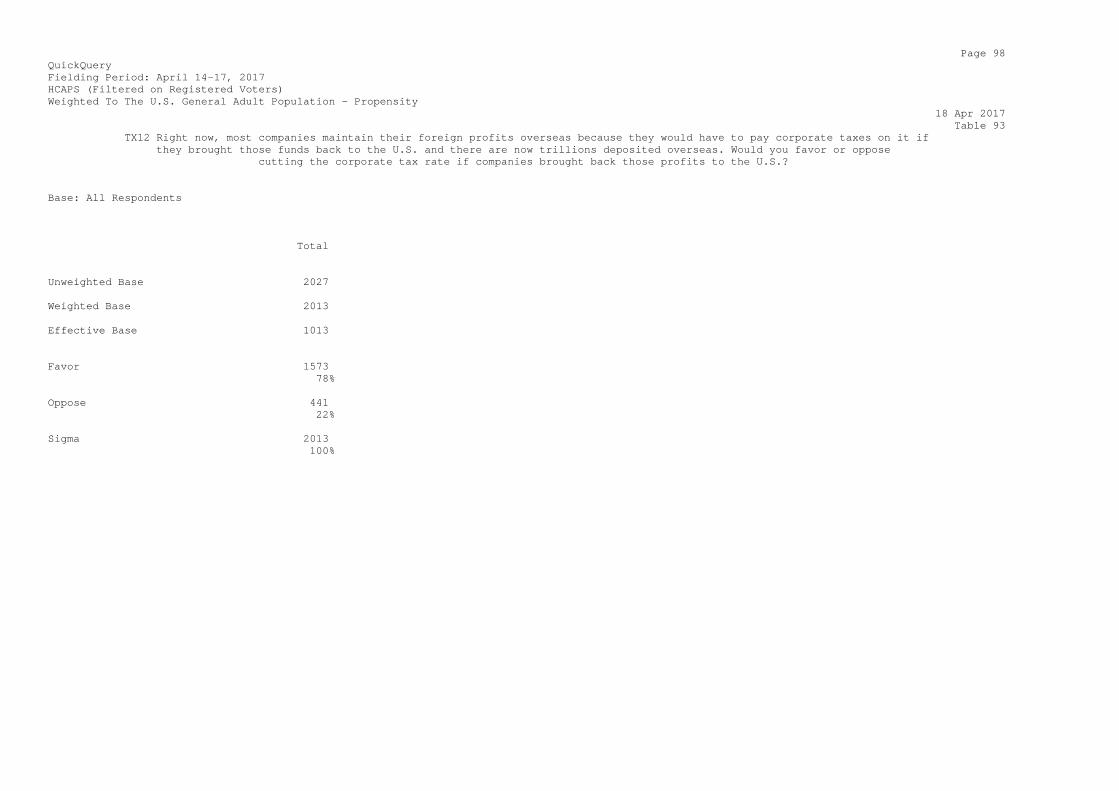
Page 98 QuickQuery Fielding Period: April 14-17, 2017 HCAPS (Filtered on Registered Voters) Weighted To The U.S. General Adult Population - Propensity 18 Apr 2017 Table 93 TX12 Right now, most companies maintain their foreign profits overseas because they would have to pay corporate taxes on it if they brought those funds back to the U.S. and there are now trillions deposited overseas. Would you favor or oppose cutting the corporate tax rate if companies brought back those profits to the U.S.? Base: All Respondents Total Unweighted Base 2027 Weighted Base 2013 Effective Base 1013 Favor 1573 78% Oppose 441 22% Sigma 2013 100%
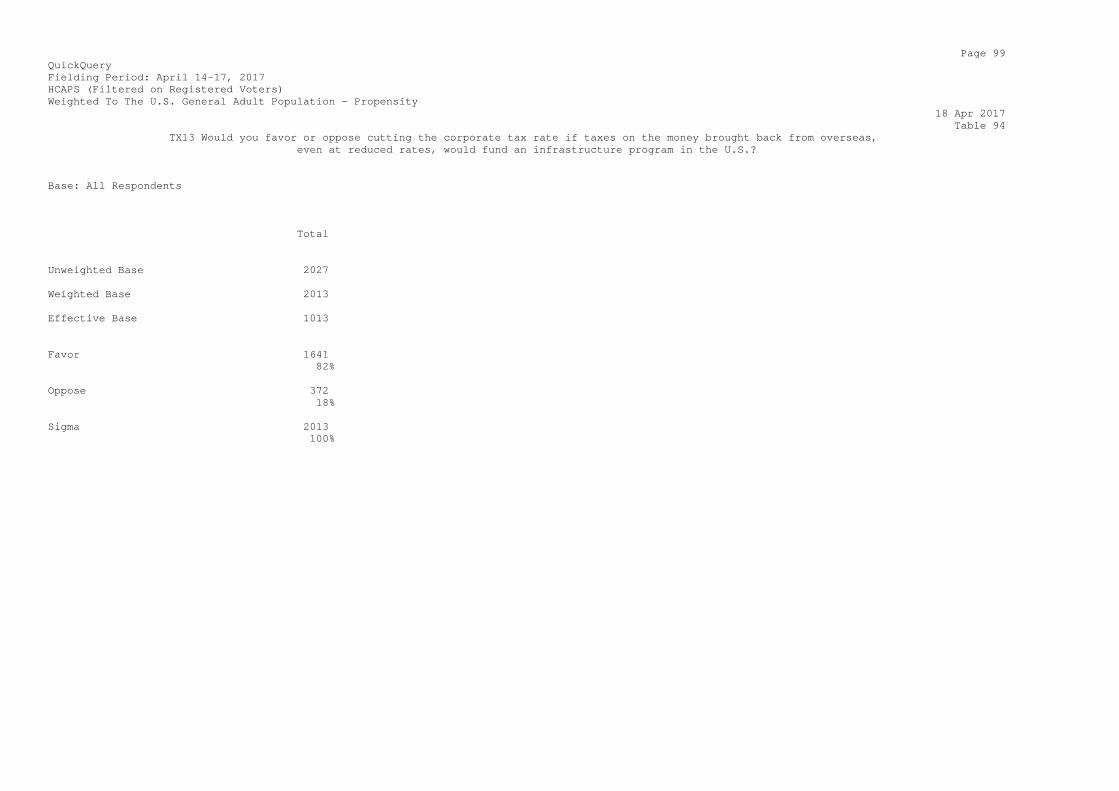
Page 99 QuickQuery Fielding Period: April 14-17, 2017 HCAPS (Filtered on Registered Voters) Weighted To The U.S. General Adult Population - Propensity 18 Apr 2017 Table 94 TX13 Would you favor or oppose cutting the corporate tax rate if taxes on the money brought back from overseas, even at reduced rates, would fund an infrastructure program in the U.S.? Base: All Respondents Total Unweighted Base 2027 Weighted Base 2013 Effective Base 1013 Favor 1641 82% Oppose 372 18% Sigma 2013 100%
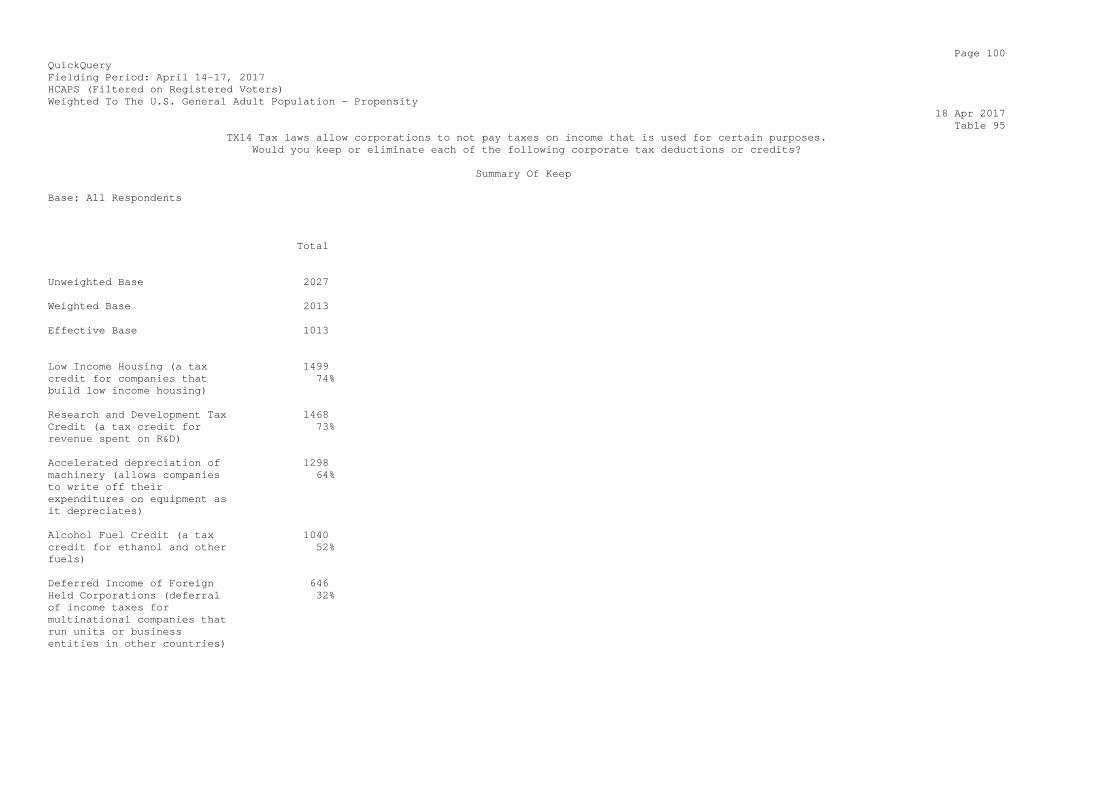
Page 100 QuickQuery Fielding Period: April 14-17, 2017 HCAPS (Filtered on Registered Voters) Weighted To The U.S. General Adult Population - Propensity 18 Apr 2017 Table 95 TX14 Tax laws allow corporations to not pay taxes on income that is used for certain purposes. Would you keep or eliminate each of the following corporate tax deductions or credits? Summary Of Keep Base: All Respondents Total Unweighted Base 2027 Weighted Base 2013 Effective Base 1013 Low Income Housing (a tax 1499 credit for companies that 74% build low income housing) Research and Development Tax 1468 Credit (a tax credit for 73% revenue spent on R&D) Accelerated depreciation of 1298 machinery (allows companies 64% to write off their expenditures on equipment as it depreciates) Alcohol Fuel Credit (a tax 1040 credit for ethanol and other 52% fuels) Deferred Income of Foreign 646 Held Corporations (deferral 32% of income taxes for multinational companies that run units or business entities in other countries)
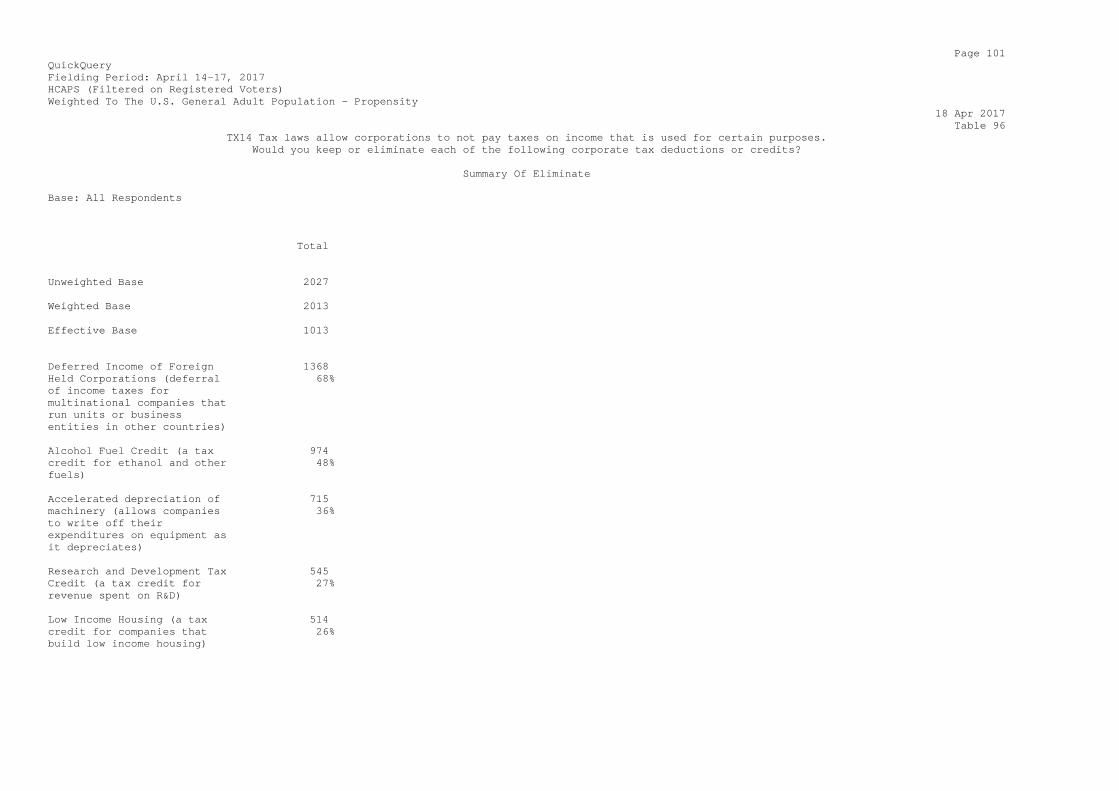
Page 101 QuickQuery Fielding Period: April 14-17, 2017 HCAPS (Filtered on Registered Voters) Weighted To The U.S. General Adult Population - Propensity 18 Apr 2017 Table 96 TX14 Tax laws allow corporations to not pay taxes on income that is used for certain purposes. Would you keep or eliminate each of the following corporate tax deductions or credits? Summary Of Eliminate Base: All Respondents Total Unweighted Base 2027 Weighted Base 2013 Effective Base 1013 Deferred Income of Foreign 1368 Held Corporations (deferral 68% of income taxes for multinational companies that run units or business entities in other countries) Alcohol Fuel Credit (a tax 974 credit for ethanol and other 48% fuels) Accelerated depreciation of 715 machinery (allows companies 36% to write off their expenditures on equipment as it depreciates) Research and Development Tax 545 Credit (a tax credit for 27% revenue spent on R&D) Low Income Housing (a tax 514 credit for companies that 26% build low income housing)
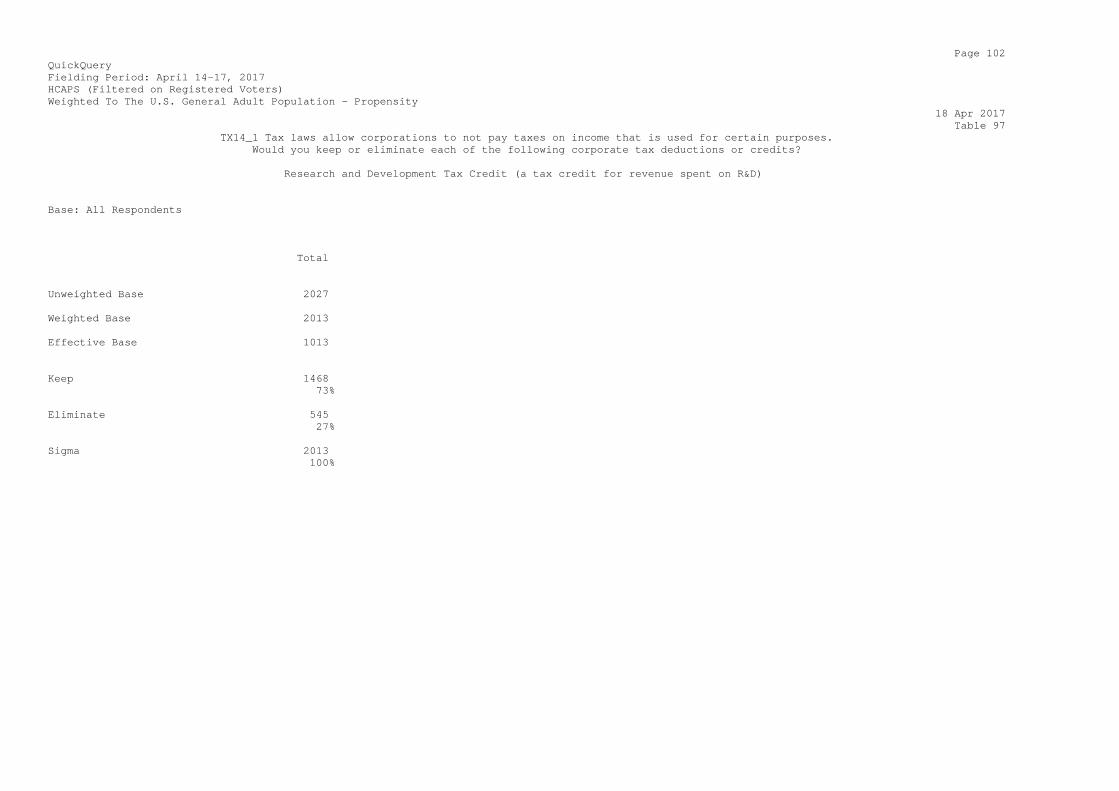
Page 102 QuickQuery Fielding Period: April 14-17, 2017 HCAPS (Filtered on Registered Voters) Weighted To The U.S. General Adult Population - Propensity 18 Apr 2017 Table 97 TX14_1 Tax laws allow corporations to not pay taxes on income that is used for certain purposes. Would you keep or eliminate each of the following corporate tax deductions or credits? Research and Development Tax Credit (a tax credit for revenue spent on R&D) Base: All Respondents Total Unweighted Base 2027 Weighted Base 2013 Effective Base 1013 Keep 1468 73% Eliminate 545 27% Sigma 2013 100%
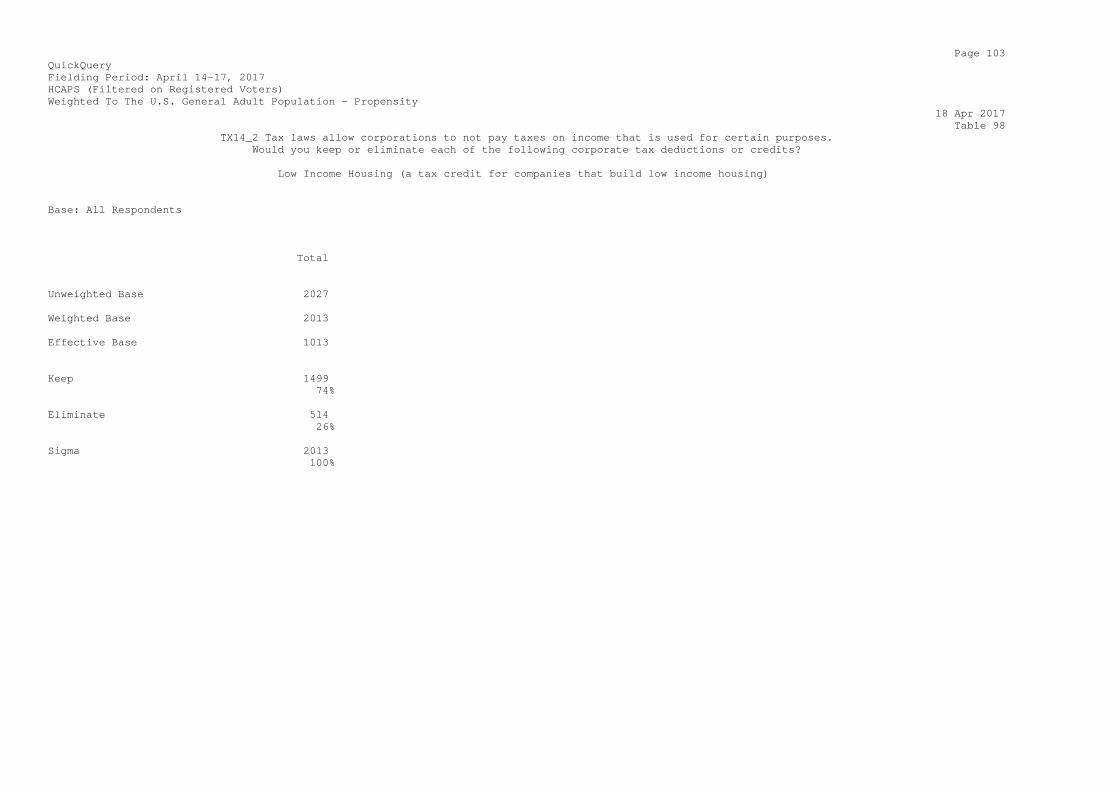
Page 103 QuickQuery Fielding Period: April 14-17, 2017 HCAPS (Filtered on Registered Voters) Weighted To The U.S. General Adult Population - Propensity 18 Apr 2017 Table 98 TX14_2 Tax laws allow corporations to not pay taxes on income that is used for certain purposes. Would you keep or eliminate each of the following corporate tax deductions or credits? Low Income Housing (a tax credit for companies that build low income housing) Base: All Respondents Total Unweighted Base 2027 Weighted Base 2013 Effective Base 1013 Keep 1499 74% Eliminate 514 26% Sigma 2013 100%

Page 104 QuickQuery Fielding Period: April 14-17, 2017 HCAPS (Filtered on Registered Voters) Weighted To The U.S. General Adult Population - Propensity 18 Apr 2017 Table 99 TX14_3 Tax laws allow corporations to not pay taxes on income that is used for certain purposes. Would you keep or eliminate each of the following corporate tax deductions or credits? Alcohol Fuel Credit (a tax credit for ethanol and other fuels) Base: All Respondents Total Unweighted Base 2027 Weighted Base 2013 Effective Base 1013 Keep 1040 52% Eliminate 974 48% Sigma 2013 100%
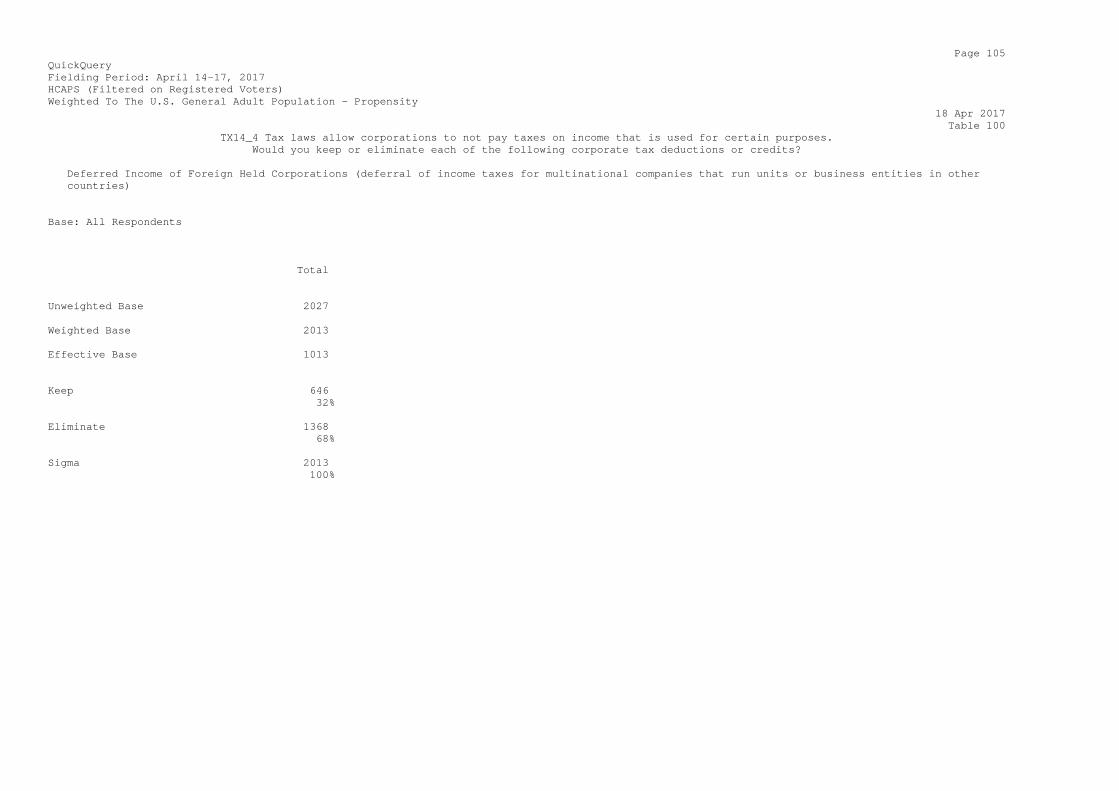
Page 105 QuickQuery Fielding Period: April 14-17, 2017 HCAPS (Filtered on Registered Voters) Weighted To The U.S. General Adult Population - Propensity 18 Apr 2017 Table 100 TX14_4 Tax laws allow corporations to not pay taxes on income that is used for certain purposes. Would you keep or eliminate each of the following corporate tax deductions or credits? Deferred Income of Foreign Held Corporations (deferral of income taxes for multinational companies that run units or business entities in other countries) Base: All Respondents Total Unweighted Base 2027 Weighted Base 2013 Effective Base 1013 Keep 646 32% Eliminate 1368 68% Sigma 2013 100%
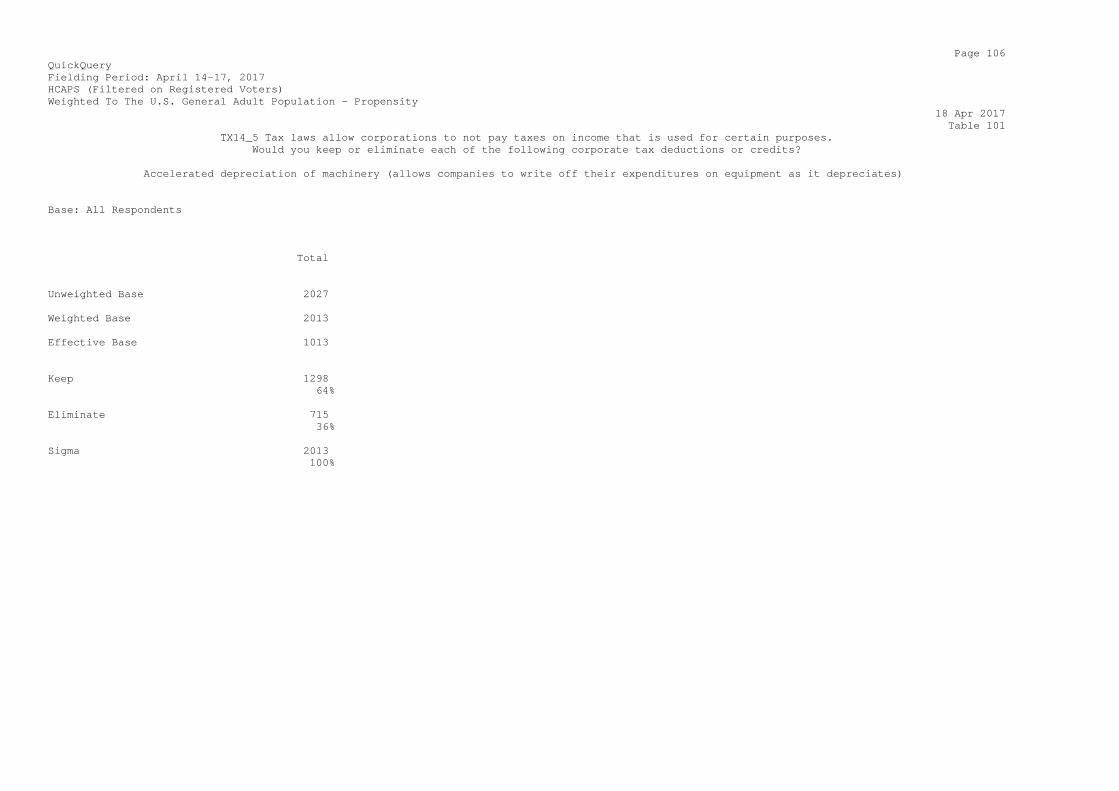
Page 106 QuickQuery Fielding Period: April 14-17, 2017 HCAPS (Filtered on Registered Voters) Weighted To The U.S. General Adult Population - Propensity 18 Apr 2017 Table 101 TX14_5 Tax laws allow corporations to not pay taxes on income that is used for certain purposes. Would you keep or eliminate each of the following corporate tax deductions or credits? Accelerated depreciation of machinery (allows companies to write off their expenditures on equipment as it depreciates) Base: All Respondents Total Unweighted Base 2027 Weighted Base 2013 Effective Base 1013 Keep 1298 64% Eliminate 715 36% Sigma 2013 100%
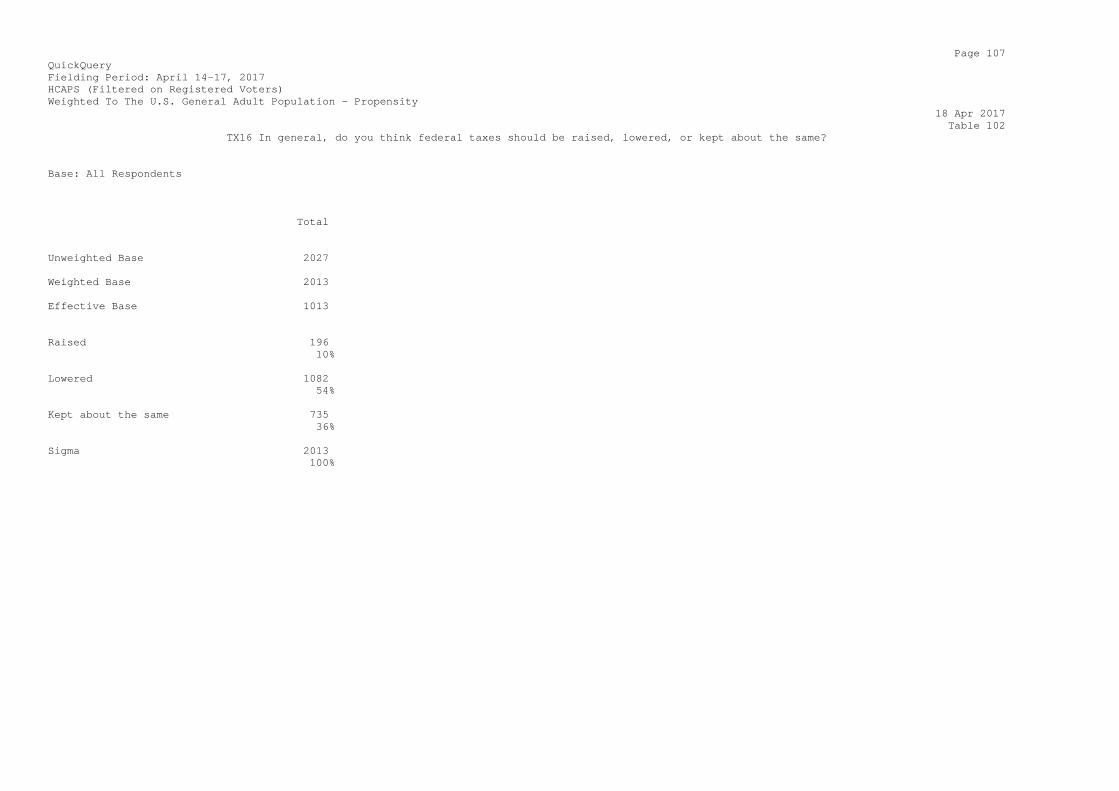
Page 107 QuickQuery Fielding Period: April 14-17, 2017 HCAPS (Filtered on Registered Voters) Weighted To The U.S. General Adult Population - Propensity 18 Apr 2017 Table 102 TX16 In general, do you think federal taxes should be raised, lowered, or kept about the same? Base: All Respondents Total Unweighted Base 2027 Weighted Base 2013 Effective Base 1013 Raised 196 10% Lowered 1082 54% Kept about the same 735 36% Sigma 2013 100%

Page 108 QuickQuery Fielding Period: April 14-17, 2017 HCAPS (Filtered on Registered Voters) Weighted To The U.S. General Adult Population - Propensity 18 Apr 2017 Table 103 TX17A Should any changes to the tax system be revenue neutral, be designed to raise more revenue to reduce the deficit, or be designed to raise less revenue to shrink the size of government? Base: Assigned To TX17A Total Unweighted Base 492 Weighted Base 456 Effective Base 247 Revenue neutral 146 32% Raise more revenue to reduce 163 the deficit 36% Raise less revenue to shrink 146 the size of the government 32% Sigma 456 100%
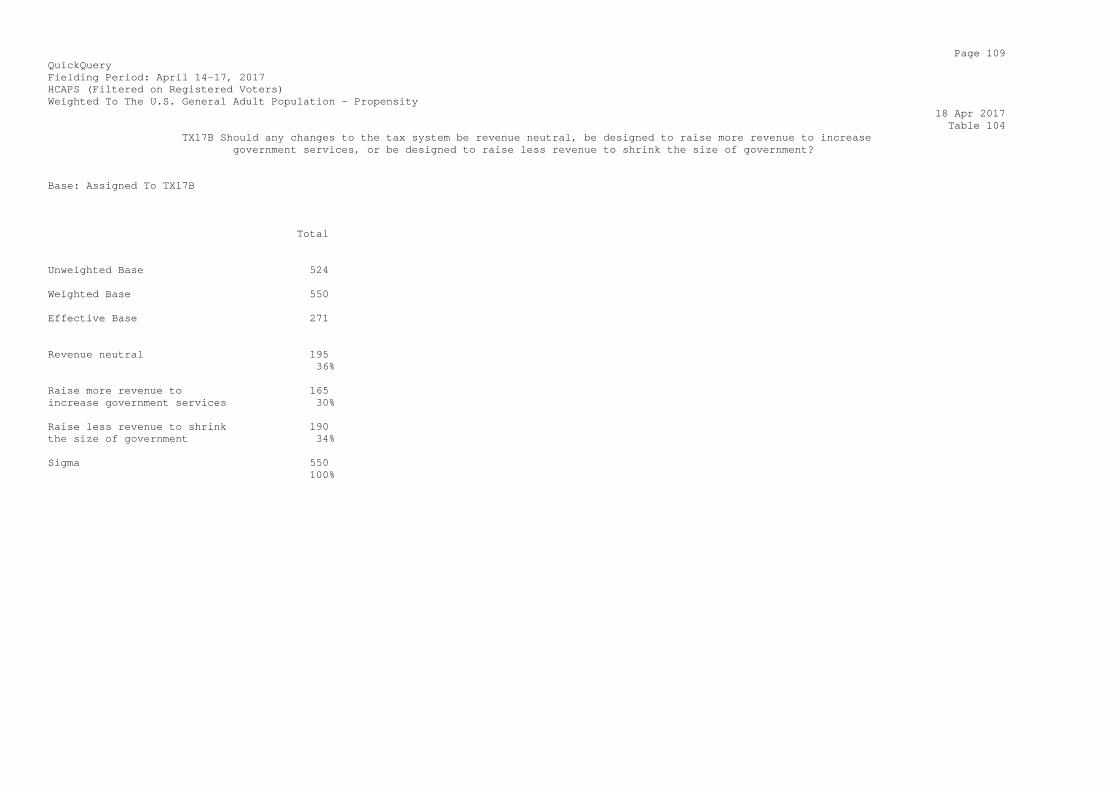
Page 109 QuickQuery Fielding Period: April 14-17, 2017 HCAPS (Filtered on Registered Voters) Weighted To The U.S. General Adult Population - Propensity 18 Apr 2017 Table 104 TX17B Should any changes to the tax system be revenue neutral, be designed to raise more revenue to increase government services, or be designed to raise less revenue to shrink the size of government? Base: Assigned To TX17B Total Unweighted Base 524 Weighted Base 550 Effective Base 271 Revenue neutral 195 36% Raise more revenue to 165 increase government services 30% Raise less revenue to shrink 190 the size of government 34% Sigma 550 100%
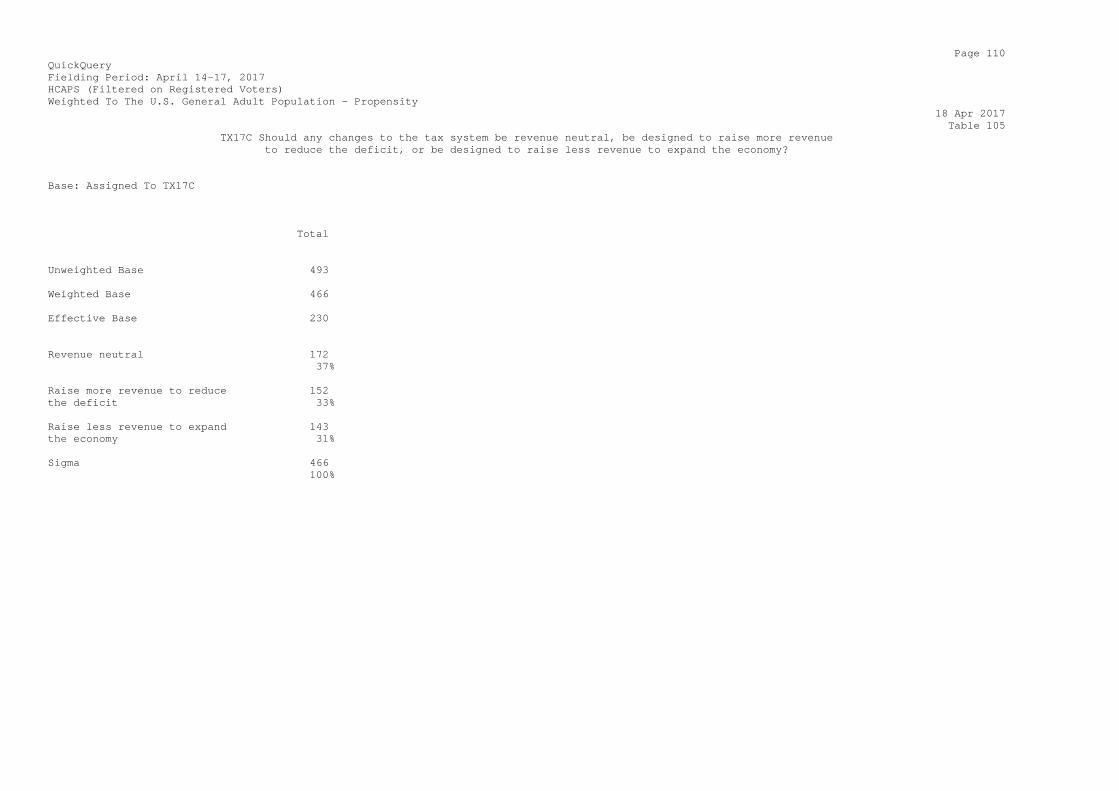
Page 110 QuickQuery Fielding Period: April 14-17, 2017 HCAPS (Filtered on Registered Voters) Weighted To The U.S. General Adult Population - Propensity 18 Apr 2017 Table 105 TX17C Should any changes to the tax system be revenue neutral, be designed to raise more revenue to reduce the deficit, or be designed to raise less revenue to expand the economy? Base: Assigned To TX17C Total Unweighted Base 493 Weighted Base 466 Effective Base 230 Revenue neutral 172 37% Raise more revenue to reduce 152 the deficit 33% Raise less revenue to expand 143 the economy 31% Sigma 466 100%
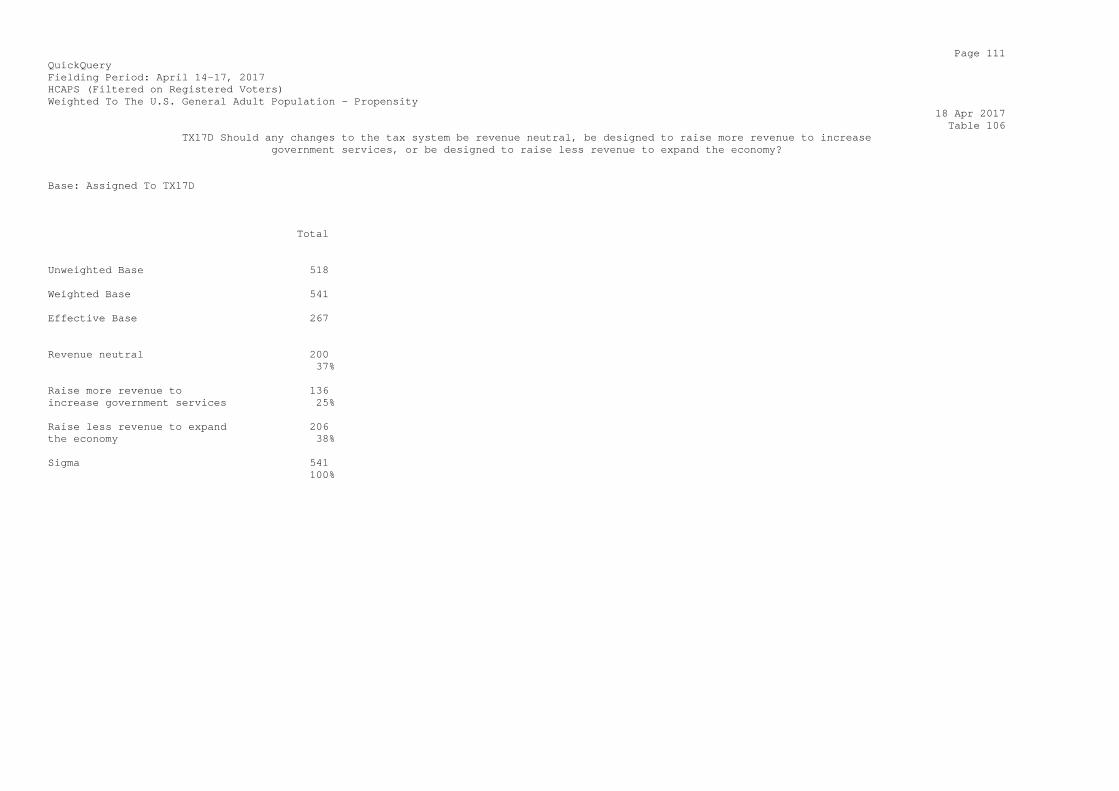
Page 111 QuickQuery Fielding Period: April 14-17, 2017 HCAPS (Filtered on Registered Voters) Weighted To The U.S. General Adult Population - Propensity 18 Apr 2017 Table 106 TX17D Should any changes to the tax system be revenue neutral, be designed to raise more revenue to increase government services, or be designed to raise less revenue to expand the economy? Base: Assigned To TX17D Total Unweighted Base 518 Weighted Base 541 Effective Base 267 Revenue neutral 200 37% Raise more revenue to 136 increase government services 25% Raise less revenue to expand 206 the economy 38% Sigma 541 100%

Page 112 QuickQuery Fielding Period: April 14-17, 2017 HCAPS (Filtered on Registered Voters) Weighted To The U.S. General Adult Population - Propensity 18 Apr 2017 Table 107 TX18 Please indicate whether you support or oppose each of the following tax proposals. Summary Of Support Base: All Respondents Total Unweighted Base 2027 Weighted Base 2013 Effective Base 1013 Reducing the federal tax 1478 brackets to a zero percent 73% tax for families under 30k, 15% for families earning 30k to 45k, 25% for families earning up to 125k, and 33% above 125k Eliminating gift and 1324 inheritance taxes 66% Limiting itemized deductions 1315 including those for 65% charitable and state and local taxes to $200,000 Replacing personal and 1178 dependent exceptions with a 59% higher standard deduction Eliminating the alternative 1114 minimum tax 55%
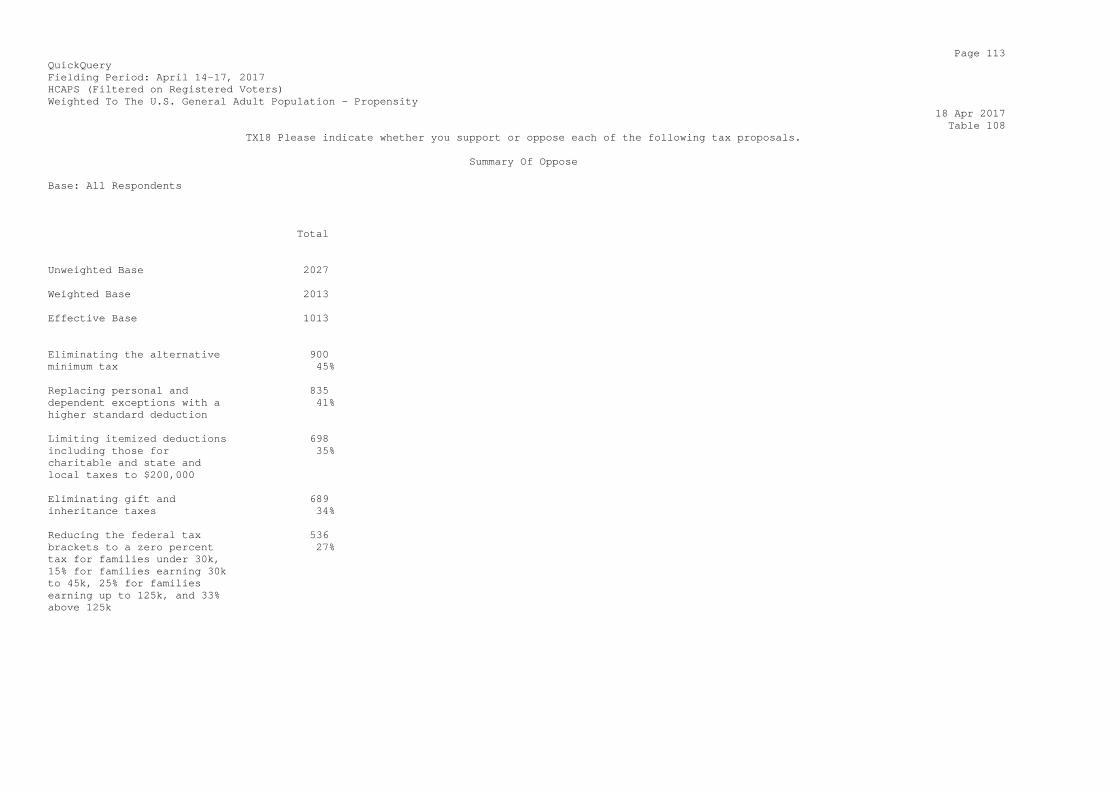
Page 113 QuickQuery Fielding Period: April 14-17, 2017 HCAPS (Filtered on Registered Voters) Weighted To The U.S. General Adult Population - Propensity 18 Apr 2017 Table 108 TX18 Please indicate whether you support or oppose each of the following tax proposals. Summary Of Oppose Base: All Respondents Total Unweighted Base 2027 Weighted Base 2013 Effective Base 1013 Eliminating the alternative 900 minimum tax 45% Replacing personal and 835 dependent exceptions with a 41% higher standard deduction Limiting itemized deductions 698 including those for 35% charitable and state and local taxes to $200,000 Eliminating gift and 689 inheritance taxes 34% Reducing the federal tax 536 brackets to a zero percent 27% tax for families under 30k, 15% for families earning 30k to 45k, 25% for families earning up to 125k, and 33% above 125k
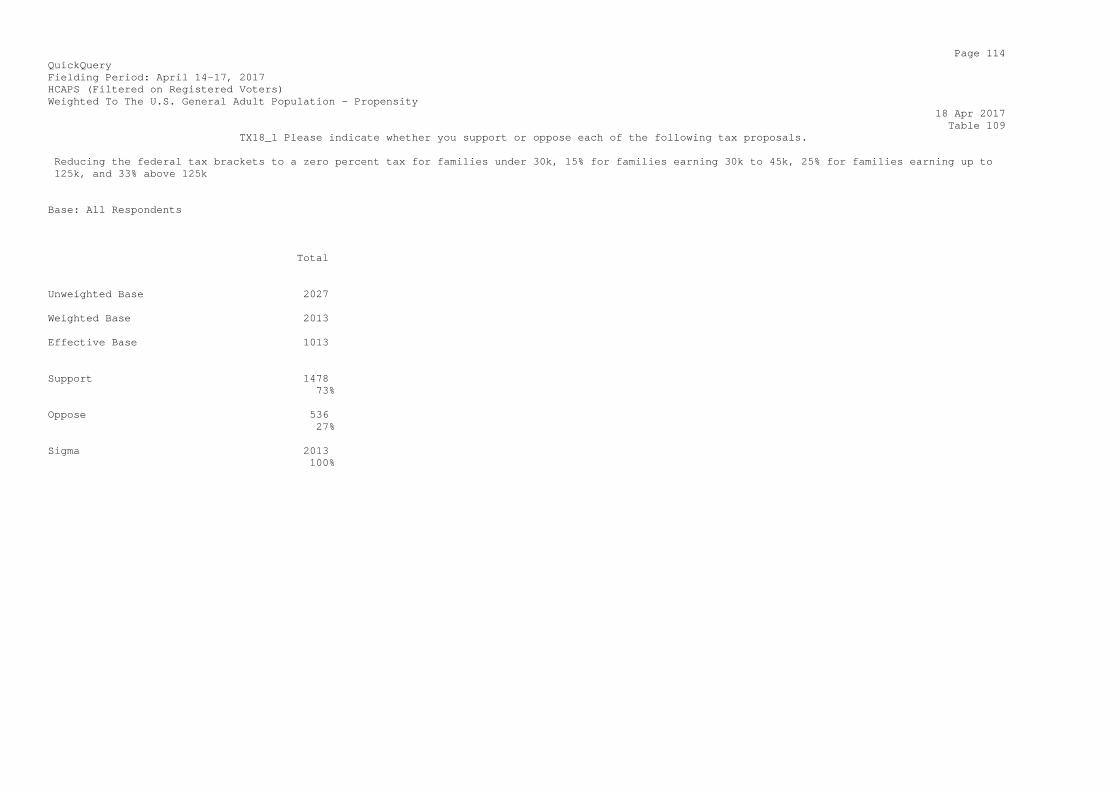
Page 114 QuickQuery Fielding Period: April 14-17, 2017 HCAPS (Filtered on Registered Voters) Weighted To The U.S. General Adult Population - Propensity 18 Apr 2017 Table 109 TX18_1 Please indicate whether you support or oppose each of the following tax proposals. Reducing the federal tax brackets to a zero percent tax for families under 30k, 15% for families earning 30k to 45k, 25% for families earning up to 125k, and 33% above 125k Base: All Respondents Total Unweighted Base 2027 Weighted Base 2013 Effective Base 1013 Support 1478 73% Oppose 536 27% Sigma 2013 100%

Page 115 QuickQuery Fielding Period: April 14-17, 2017 HCAPS (Filtered on Registered Voters) Weighted To The U.S. General Adult Population - Propensity 18 Apr 2017 Table 110 TX18_2 Please indicate whether you support or oppose each of the following tax proposals. Eliminating gift and inheritance taxes Base: All Respondents Total Unweighted Base 2027 Weighted Base 2013 Effective Base 1013 Support 1324 66% Oppose 689 34% Sigma 2013 100%
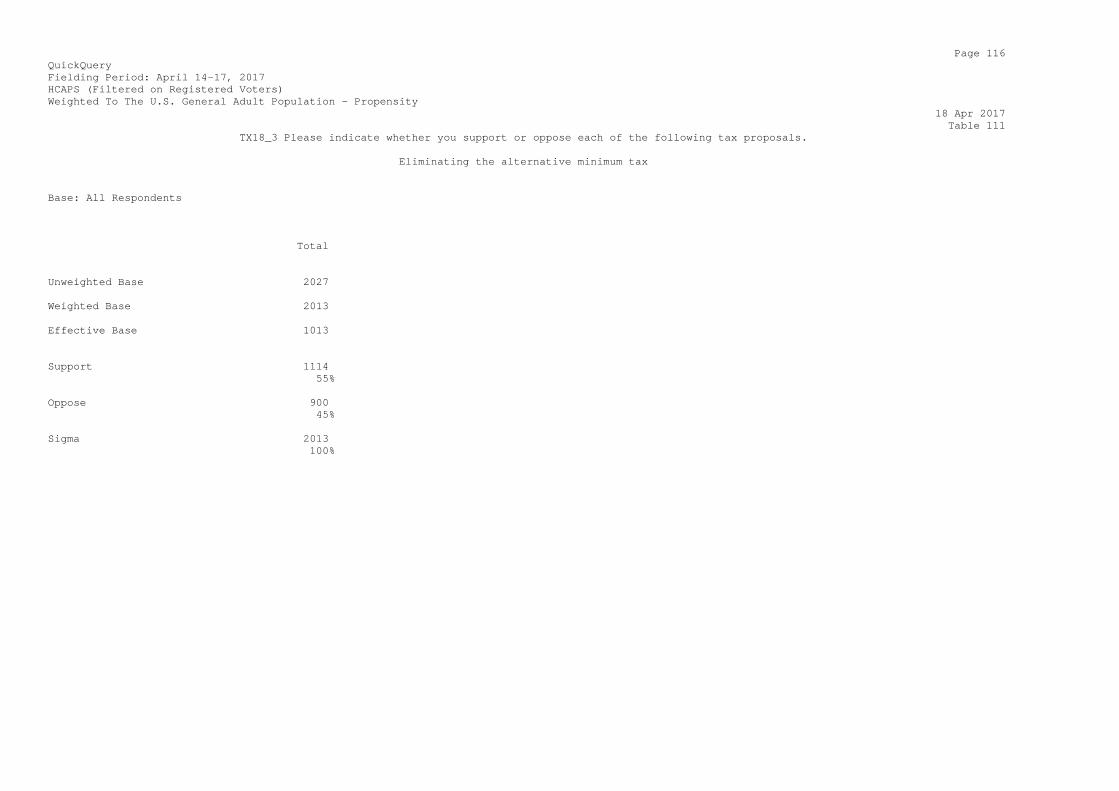
Page 116 QuickQuery Fielding Period: April 14-17, 2017 HCAPS (Filtered on Registered Voters) Weighted To The U.S. General Adult Population - Propensity 18 Apr 2017 Table 111 TX18_3 Please indicate whether you support or oppose each of the following tax proposals. Eliminating the alternative minimum tax Base: All Respondents Total Unweighted Base 2027 Weighted Base 2013 Effective Base 1013 Support 1114 55% Oppose 900 45% Sigma 2013 100%

Page 117 QuickQuery Fielding Period: April 14-17, 2017 HCAPS (Filtered on Registered Voters) Weighted To The U.S. General Adult Population - Propensity 18 Apr 2017 Table 112 TX18_4 Please indicate whether you support or oppose each of the following tax proposals. Replacing personal and dependent exceptions with a higher standard deduction Base: All Respondents Total Unweighted Base 2027 Weighted Base 2013 Effective Base 1013 Support 1178 59% Oppose 835 41% Sigma 2013 100%
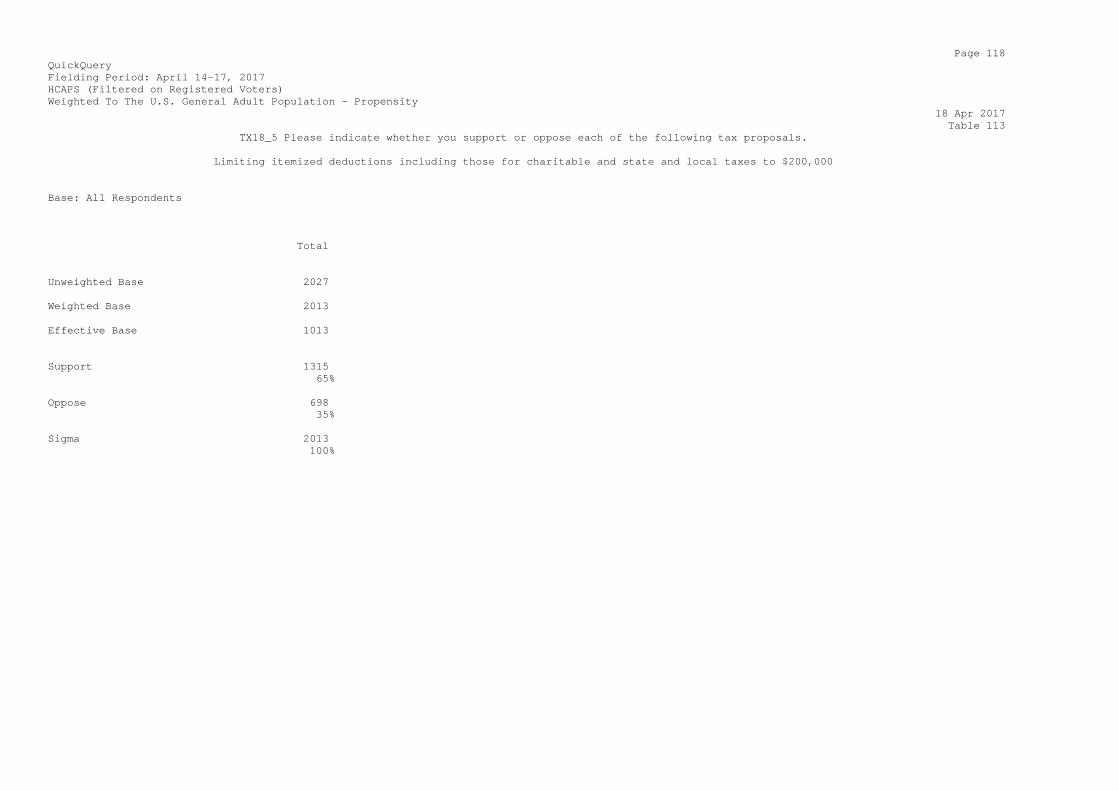
Page 118 QuickQuery Fielding Period: April 14-17, 2017 HCAPS (Filtered on Registered Voters) Weighted To The U.S. General Adult Population - Propensity 18 Apr 2017 Table 113 TX18_5 Please indicate whether you support or oppose each of the following tax proposals. Limiting itemized deductions including those for charitable and state and local taxes to $200,000 Base: All Respondents Total Unweighted Base 2027 Weighted Base 2013 Effective Base 1013 Support 1315 65% Oppose 698 35% Sigma 2013 100%
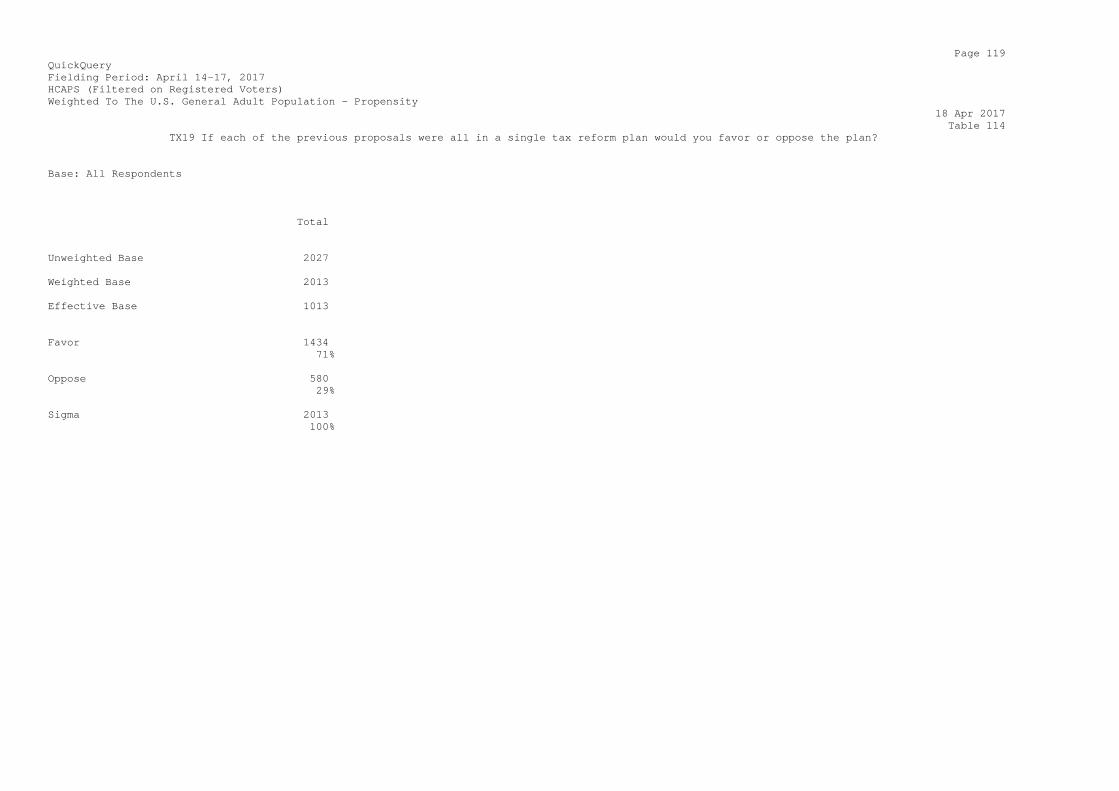
Page 119 QuickQuery Fielding Period: April 14-17, 2017 HCAPS (Filtered on Registered Voters) Weighted To The U.S. General Adult Population - Propensity 18 Apr 2017 Table 114 TX19 If each of the previous proposals were all in a single tax reform plan would you favor or oppose the plan? Base: All Respondents Total Unweighted Base 2027 Weighted Base 2013 Effective Base 1013 Favor 1434 71% Oppose 580 29% Sigma 2013 100%
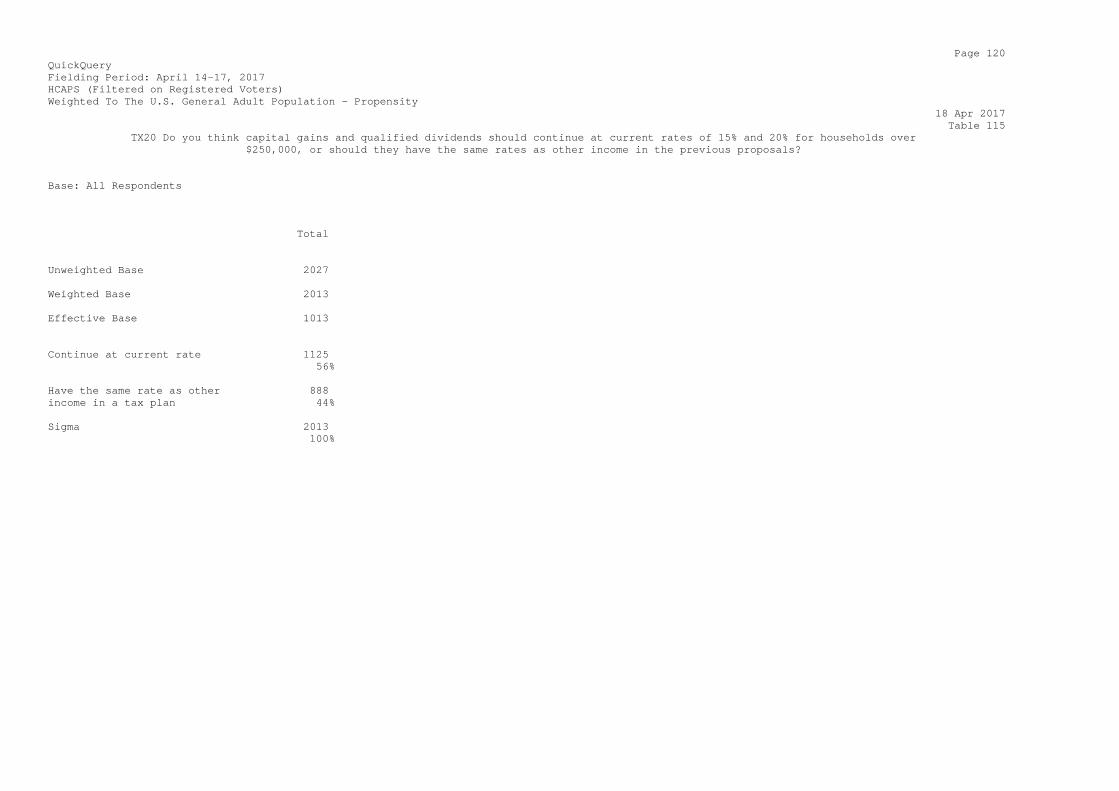
Page 120 QuickQuery Fielding Period: April 14-17, 2017 HCAPS (Filtered on Registered Voters) Weighted To The U.S. General Adult Population - Propensity 18 Apr 2017 Table 115 TX20 Do you think capital gains and qualified dividends should continue at current rates of 15% and 20% for households over $250,000, or should they have the same rates as other income in the previous proposals? Base: All Respondents Total Unweighted Base 2027 Weighted Base 2013 Effective Base 1013 Continue at current rate 1125 56% Have the same rate as other 888 income in a tax plan 44% Sigma 2013 100%
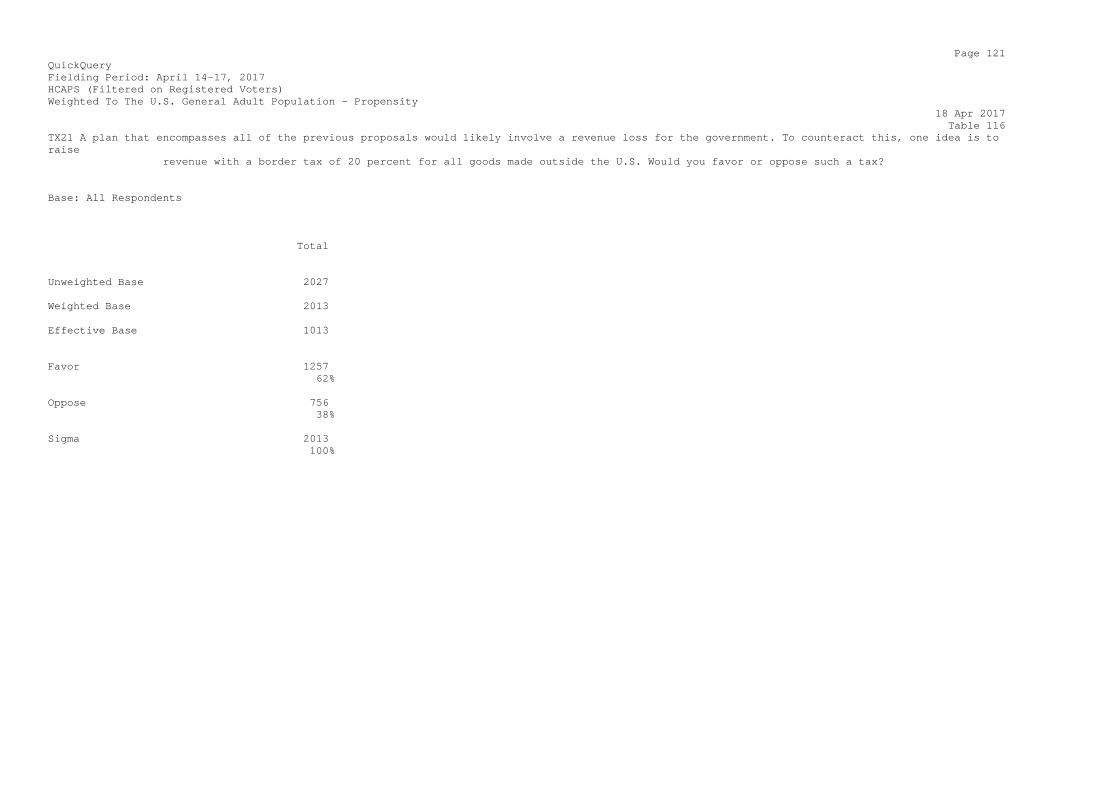
Page 121 QuickQuery Fielding Period: April 14-17, 2017 HCAPS (Filtered on Registered Voters) Weighted To The U.S. General Adult Population - Propensity 18 Apr 2017 Table 116 TX21 A plan that encompasses all of the previous proposals would likely involve a revenue loss for the government. To counteract this, one idea is to raise revenue with a border tax of 20 percent for all goods made outside the U.S. Would you favor or oppose such a tax? Base: All Respondents Total Unweighted Base 2027 Weighted Base 2013 Effective Base 1013 Favor 1257 62% Oppose 756 38% Sigma 2013 100%
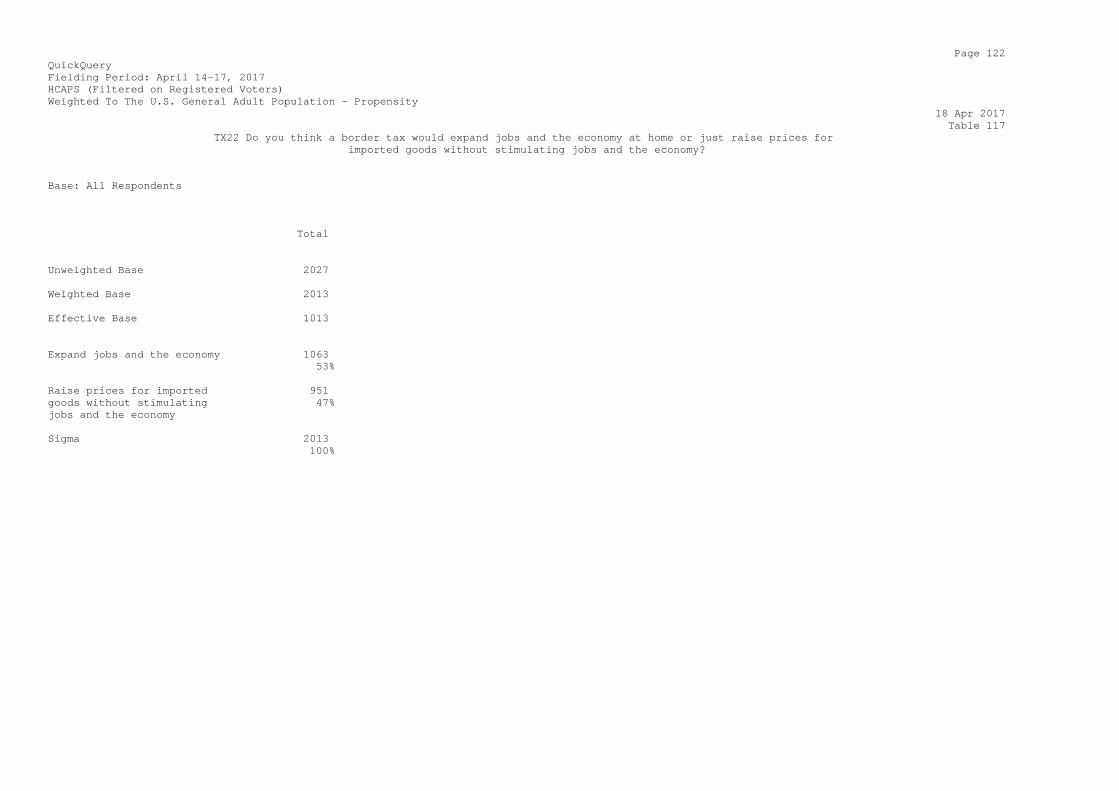
Page 122 QuickQuery Fielding Period: April 14-17, 2017 HCAPS (Filtered on Registered Voters) Weighted To The U.S. General Adult Population - Propensity 18 Apr 2017 Table 117 TX22 Do you think a border tax would expand jobs and the economy at home or just raise prices for imported goods without stimulating jobs and the economy? Base: All Respondents Total Unweighted Base 2027 Weighted Base 2013 Effective Base 1013 Expand jobs and the economy 1063 53% Raise prices for imported 951 goods without stimulating 47% jobs and the economy Sigma 2013 100%
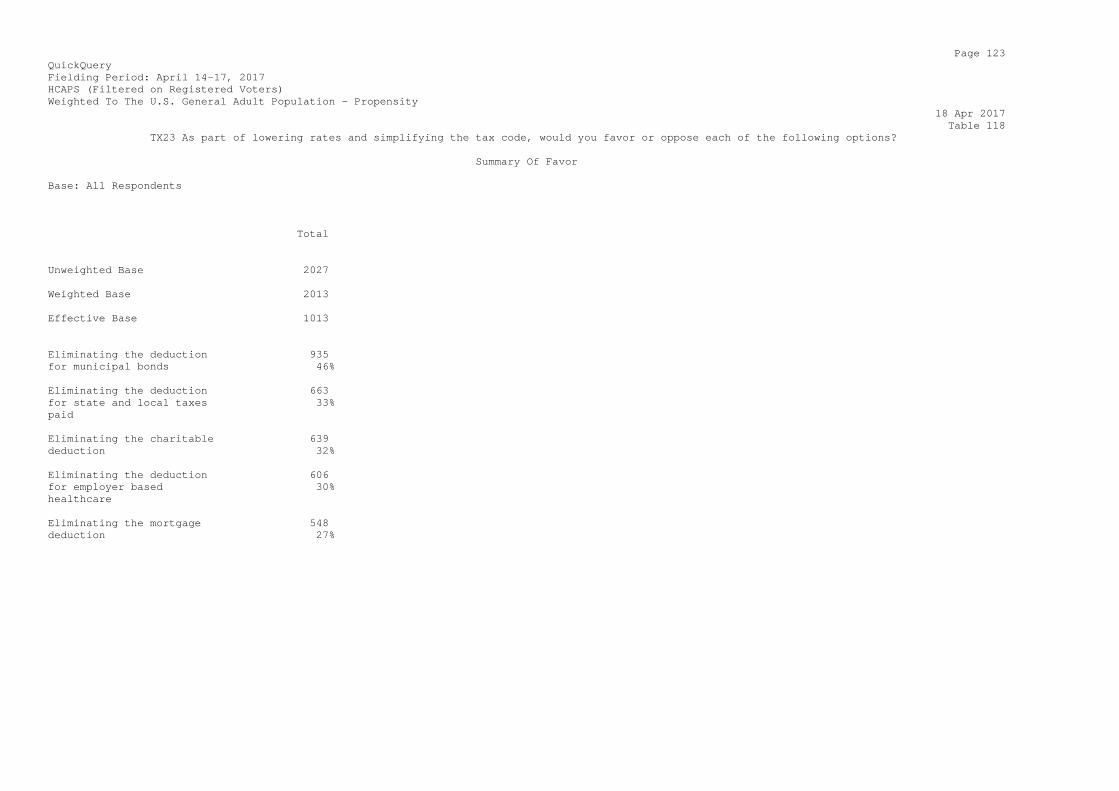
Page 123 QuickQuery Fielding Period: April 14-17, 2017 HCAPS (Filtered on Registered Voters) Weighted To The U.S. General Adult Population - Propensity 18 Apr 2017 Table 118 TX23 As part of lowering rates and simplifying the tax code, would you favor or oppose each of the following options? Summary Of Favor Base: All Respondents Total Unweighted Base 2027 Weighted Base 2013 Effective Base 1013 Eliminating the deduction 935 for municipal bonds 46% Eliminating the deduction 663 for state and local taxes 33% paid Eliminating the charitable 639 deduction 32% Eliminating the deduction 606 for employer based 30% healthcare Eliminating the mortgage 548 deduction 27%
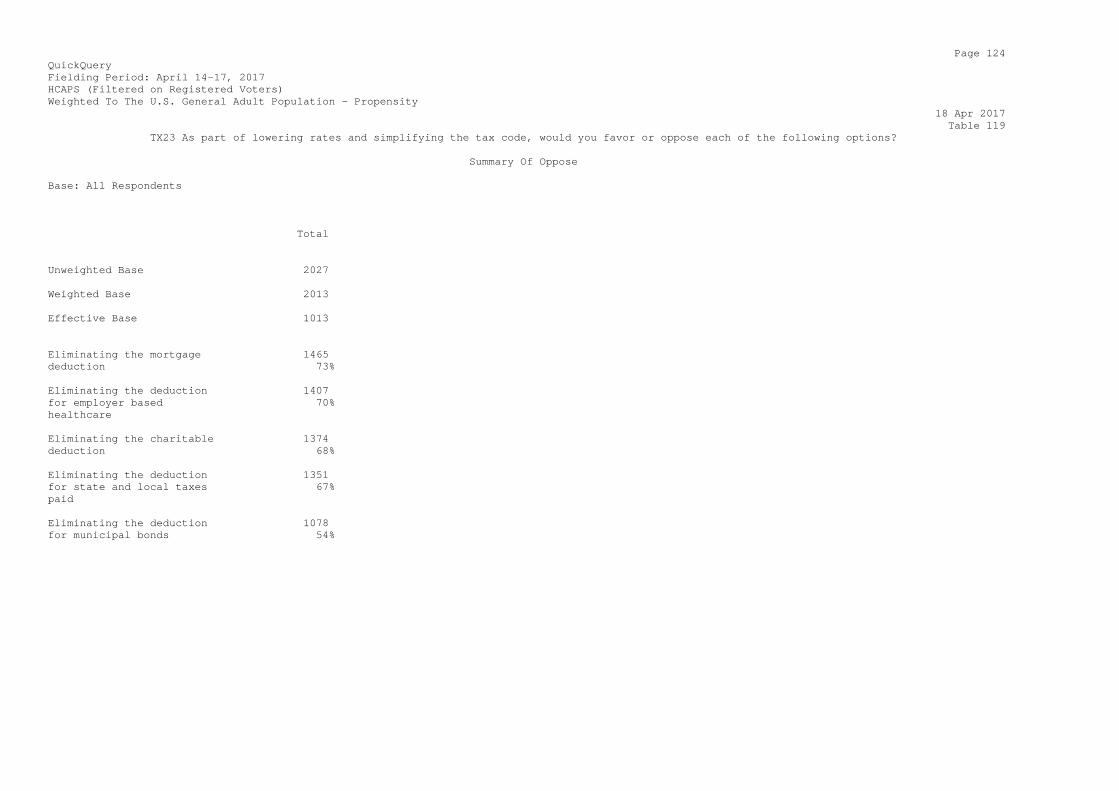
Page 124 QuickQuery Fielding Period: April 14-17, 2017 HCAPS (Filtered on Registered Voters) Weighted To The U.S. General Adult Population - Propensity 18 Apr 2017 Table 119 TX23 As part of lowering rates and simplifying the tax code, would you favor or oppose each of the following options? Summary Of Oppose Base: All Respondents Total Unweighted Base 2027 Weighted Base 2013 Effective Base 1013 Eliminating the mortgage 1465 deduction 73% Eliminating the deduction 1407 for employer based 70% healthcare Eliminating the charitable 1374 deduction 68% Eliminating the deduction 1351 for state and local taxes 67% paid Eliminating the deduction 1078 for municipal bonds 54%
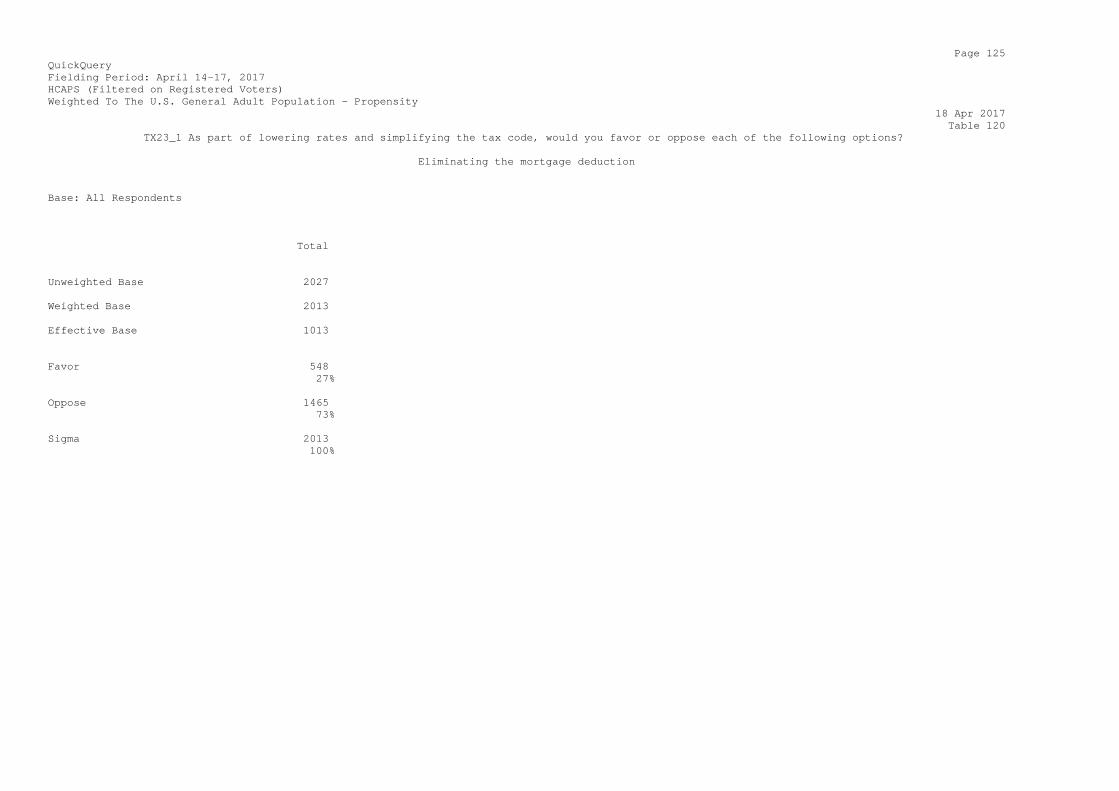
Page 125 QuickQuery Fielding Period: April 14-17, 2017 HCAPS (Filtered on Registered Voters) Weighted To The U.S. General Adult Population - Propensity 18 Apr 2017 Table 120 TX23_1 As part of lowering rates and simplifying the tax code, would you favor or oppose each of the following options? Eliminating the mortgage deduction Base: All Respondents Total Unweighted Base 2027 Weighted Base 2013 Effective Base 1013 Favor 548 27% Oppose 1465 73% Sigma 2013 100%
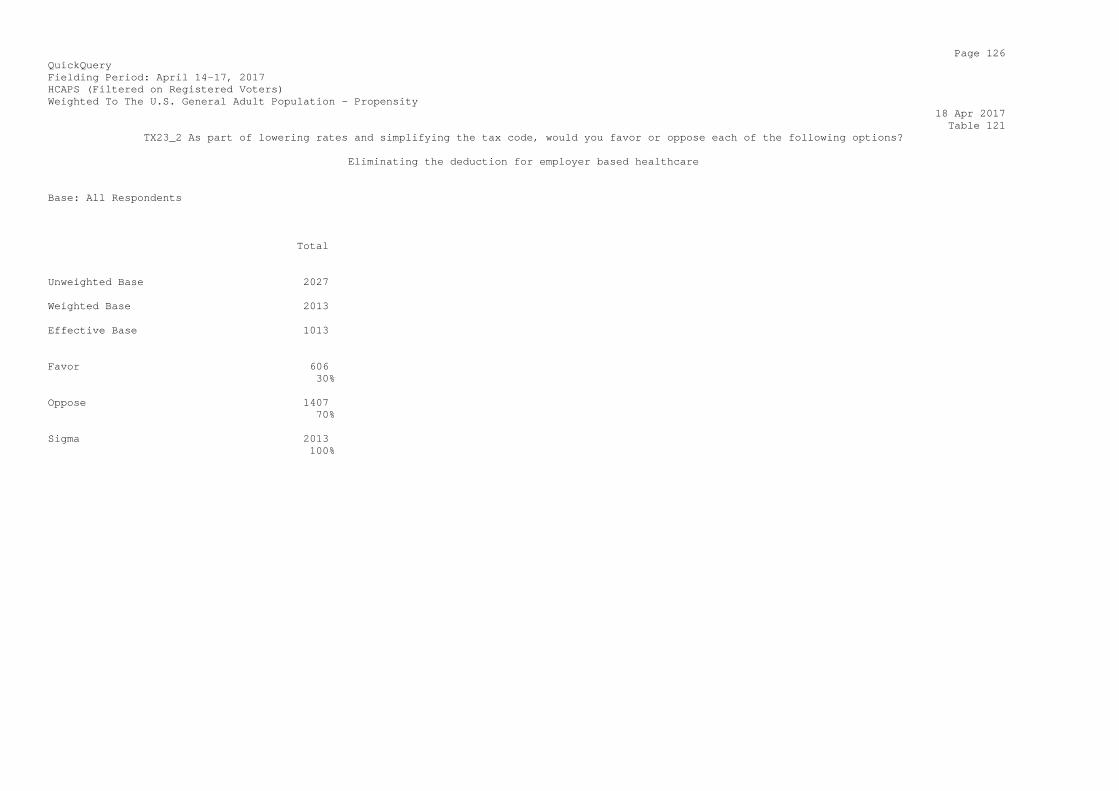
Page 126 QuickQuery Fielding Period: April 14-17, 2017 HCAPS (Filtered on Registered Voters) Weighted To The U.S. General Adult Population - Propensity 18 Apr 2017 Table 121 TX23_2 As part of lowering rates and simplifying the tax code, would you favor or oppose each of the following options? Eliminating the deduction for employer based healthcare Base: All Respondents Total Unweighted Base 2027 Weighted Base 2013 Effective Base 1013 Favor 606 30% Oppose 1407 70% Sigma 2013 100%
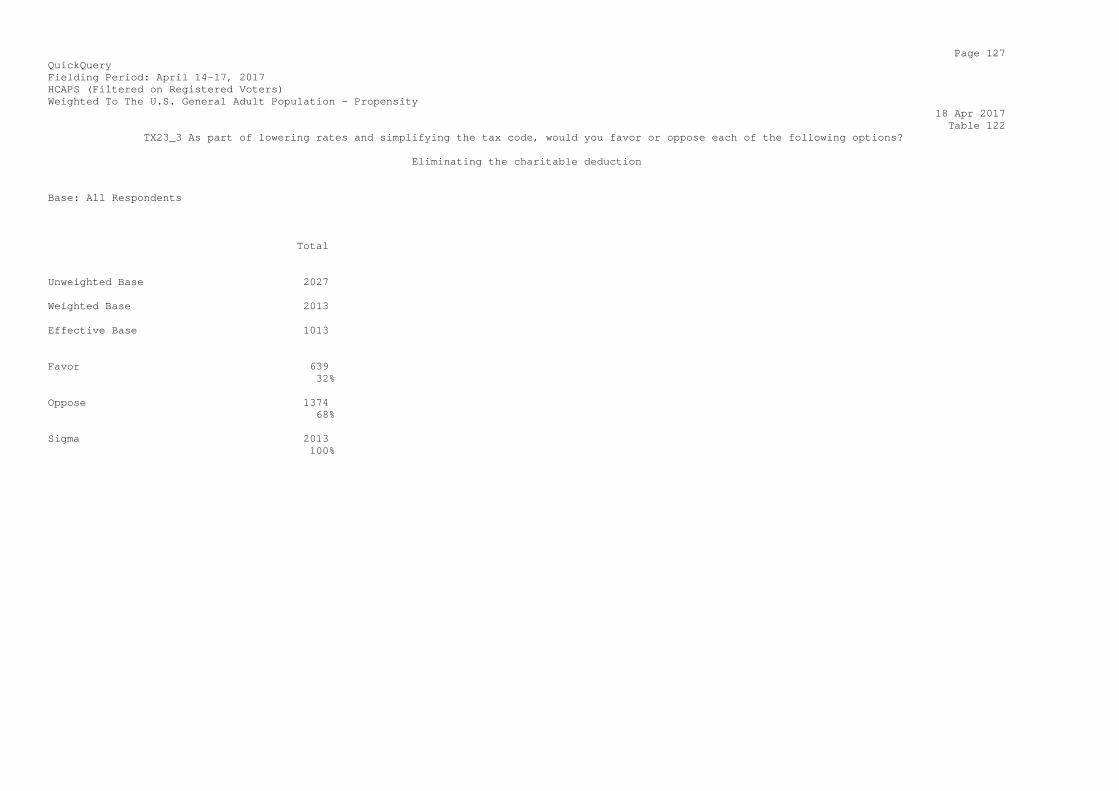
Page 127 QuickQuery Fielding Period: April 14-17, 2017 HCAPS (Filtered on Registered Voters) Weighted To The U.S. General Adult Population - Propensity 18 Apr 2017 Table 122 TX23_3 As part of lowering rates and simplifying the tax code, would you favor or oppose each of the following options? Eliminating the charitable deduction Base: All Respondents Total Unweighted Base 2027 Weighted Base 2013 Effective Base 1013 Favor 639 32% Oppose 1374 68% Sigma 2013 100%

Page 128 QuickQuery Fielding Period: April 14-17, 2017 HCAPS (Filtered on Registered Voters) Weighted To The U.S. General Adult Population - Propensity 18 Apr 2017 Table 123 TX23_4 As part of lowering rates and simplifying the tax code, would you favor or oppose each of the following options? Eliminating the deduction for municipal bonds Base: All Respondents Total Unweighted Base 2027 Weighted Base 2013 Effective Base 1013 Favor 935 46% Oppose 1078 54% Sigma 2013 100%
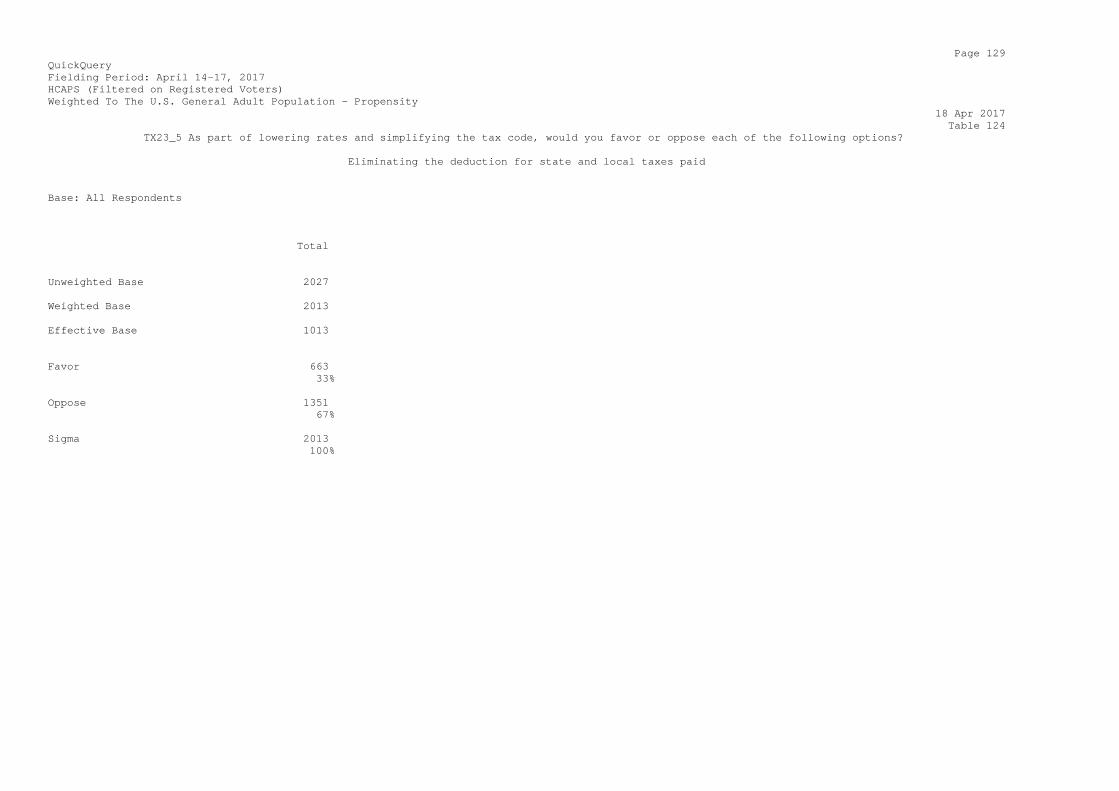
Page 129 QuickQuery Fielding Period: April 14-17, 2017 HCAPS (Filtered on Registered Voters) Weighted To The U.S. General Adult Population - Propensity 18 Apr 2017 Table 124 TX23_5 As part of lowering rates and simplifying the tax code, would you favor or oppose each of the following options? Eliminating the deduction for state and local taxes paid Base: All Respondents Total Unweighted Base 2027 Weighted Base 2013 Effective Base 1013 Favor 663 33% Oppose 1351 67% Sigma 2013 100%
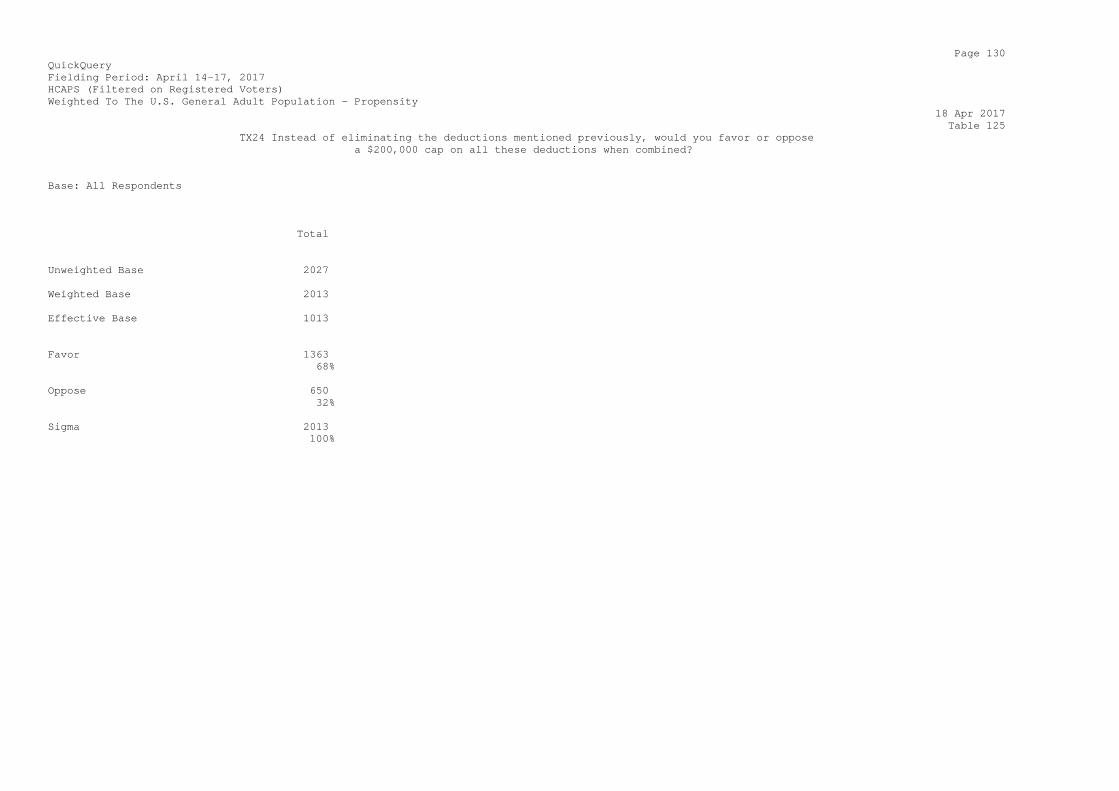
Page 130 QuickQuery Fielding Period: April 14-17, 2017 HCAPS (Filtered on Registered Voters) Weighted To The U.S. General Adult Population - Propensity 18 Apr 2017 Table 125 TX24 Instead of eliminating the deductions mentioned previously, would you favor or oppose a $200,000 cap on all these deductions when combined? Base: All Respondents Total Unweighted Base 2027 Weighted Base 2013 Effective Base 1013 Favor 1363 68% Oppose 650 32% Sigma 2013 100%
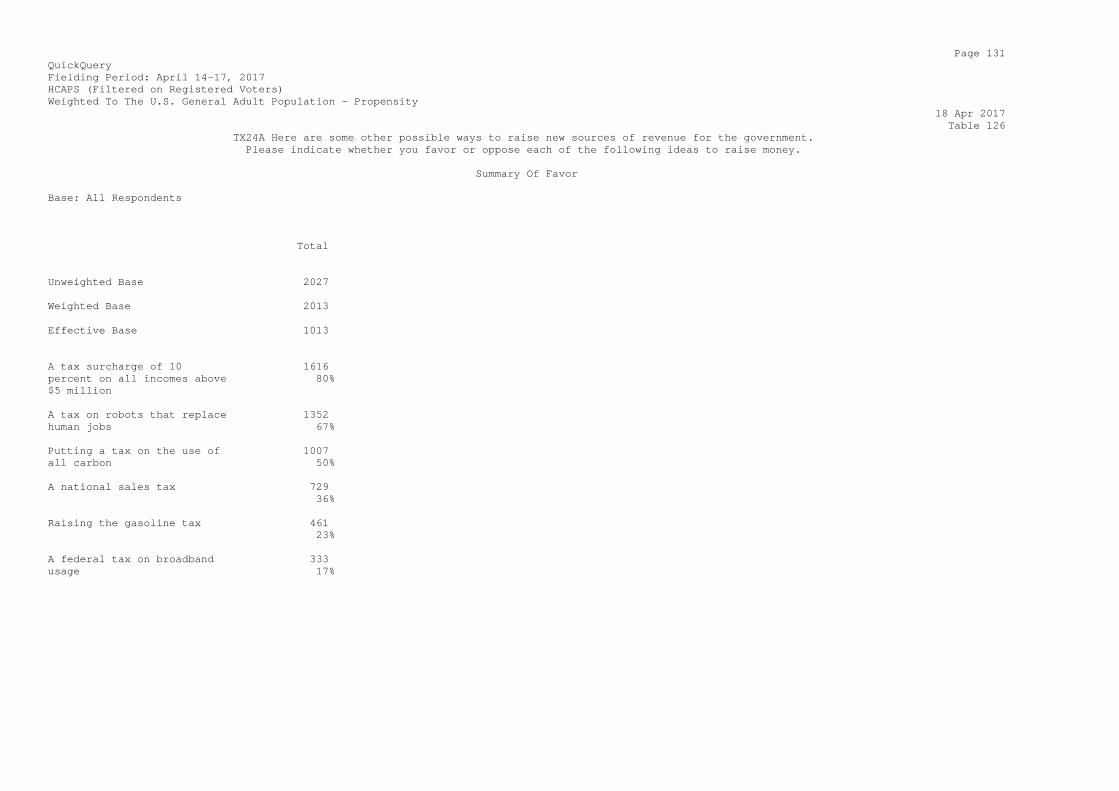
Page 131 QuickQuery Fielding Period: April 14-17, 2017 HCAPS (Filtered on Registered Voters) Weighted To The U.S. General Adult Population - Propensity 18 Apr 2017 Table 126 TX24A Here are some other possible ways to raise new sources of revenue for the government. Please indicate whether you favor or oppose each of the following ideas to raise money. Summary Of Favor Base: All Respondents Total Unweighted Base 2027 Weighted Base 2013 Effective Base 1013 A tax surcharge of 10 1616 percent on all incomes above 80% $5 million A tax on robots that replace 1352 human jobs 67% Putting a tax on the use of 1007 all carbon 50% A national sales tax 729 36% Raising the gasoline tax 461 23% A federal tax on broadband 333 usage 17%
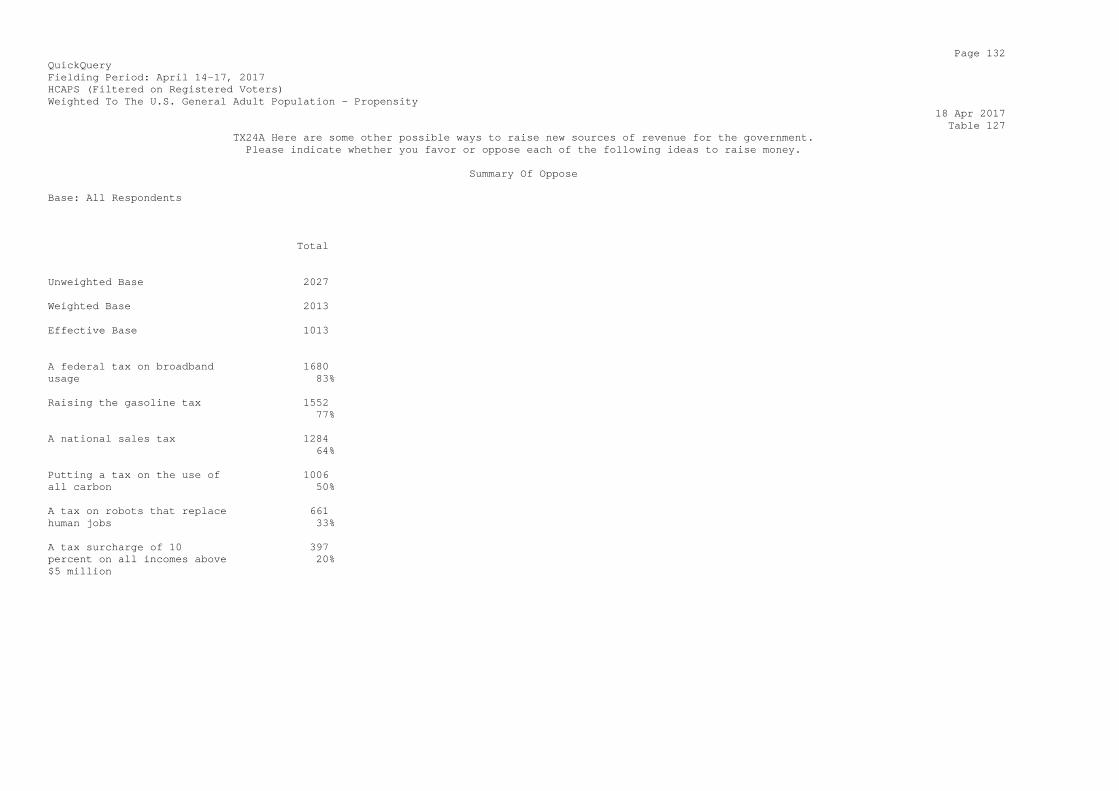
Page 132 QuickQuery Fielding Period: April 14-17, 2017 HCAPS (Filtered on Registered Voters) Weighted To The U.S. General Adult Population - Propensity 18 Apr 2017 Table 127 TX24A Here are some other possible ways to raise new sources of revenue for the government. Please indicate whether you favor or oppose each of the following ideas to raise money. Summary Of Oppose Base: All Respondents Total Unweighted Base 2027 Weighted Base 2013 Effective Base 1013 A federal tax on broadband 1680 usage 83% Raising the gasoline tax 1552 77% A national sales tax 1284 64% Putting a tax on the use of 1006 all carbon 50% A tax on robots that replace 661 human jobs 33% A tax surcharge of 10 397 percent on all incomes above 20% $5 million

Page 133 QuickQuery Fielding Period: April 14-17, 2017 HCAPS (Filtered on Registered Voters) Weighted To The U.S. General Adult Population - Propensity 18 Apr 2017 Table 128 TX24A_1 Here are some other possible ways to raise new sources of revenue for the government. Please indicate whether you favor or oppose each of the following ideas to raise money. A federal tax on broadband usage Base: All Respondents Total Unweighted Base 2027 Weighted Base 2013 Effective Base 1013 Favor 333 17% Oppose 1680 83% Sigma 2013 100%

Page 134 QuickQuery Fielding Period: April 14-17, 2017 HCAPS (Filtered on Registered Voters) Weighted To The U.S. General Adult Population - Propensity 18 Apr 2017 Table 129 TX24A_2 Here are some other possible ways to raise new sources of revenue for the government. Please indicate whether you favor or oppose each of the following ideas to raise money. A tax on robots that replace human jobs Base: All Respondents Total Unweighted Base 2027 Weighted Base 2013 Effective Base 1013 Favor 1352 67% Oppose 661 33% Sigma 2013 100%
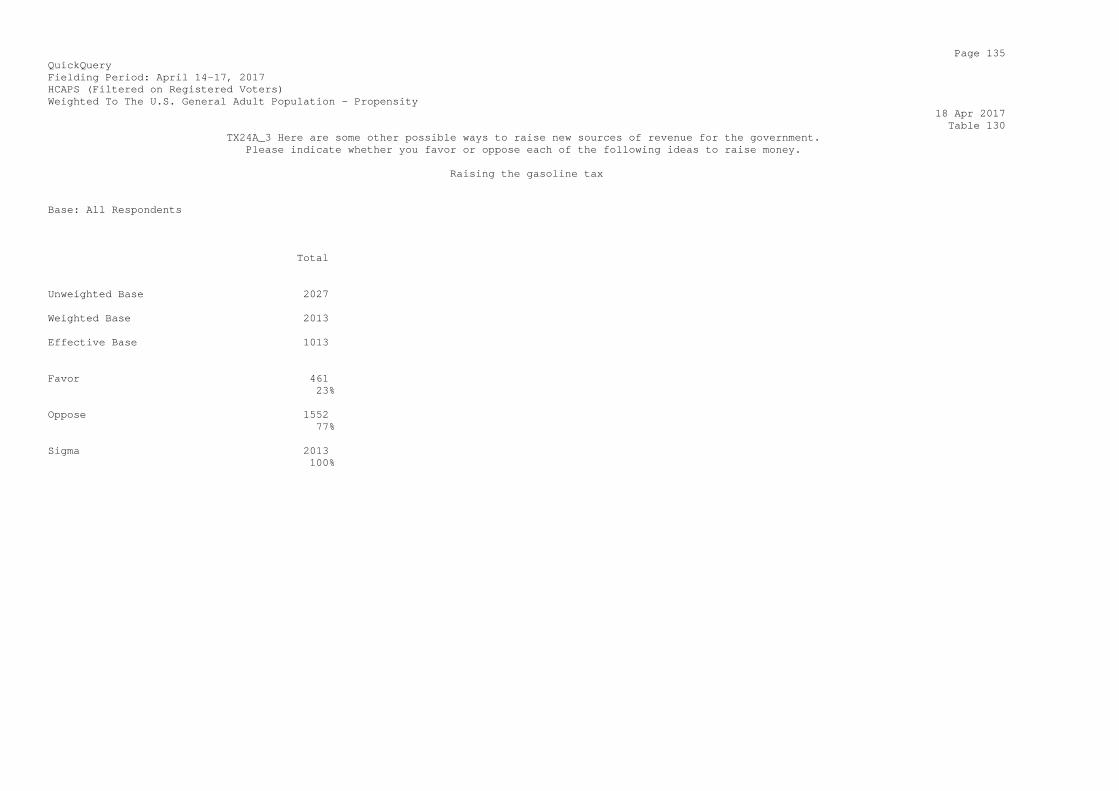
Page 135 QuickQuery Fielding Period: April 14-17, 2017 HCAPS (Filtered on Registered Voters) Weighted To The U.S. General Adult Population - Propensity 18 Apr 2017 Table 130 TX24A_3 Here are some other possible ways to raise new sources of revenue for the government. Please indicate whether you favor or oppose each of the following ideas to raise money. Raising the gasoline tax Base: All Respondents Total Unweighted Base 2027 Weighted Base 2013 Effective Base 1013 Favor 461 23% Oppose 1552 77% Sigma 2013 100%
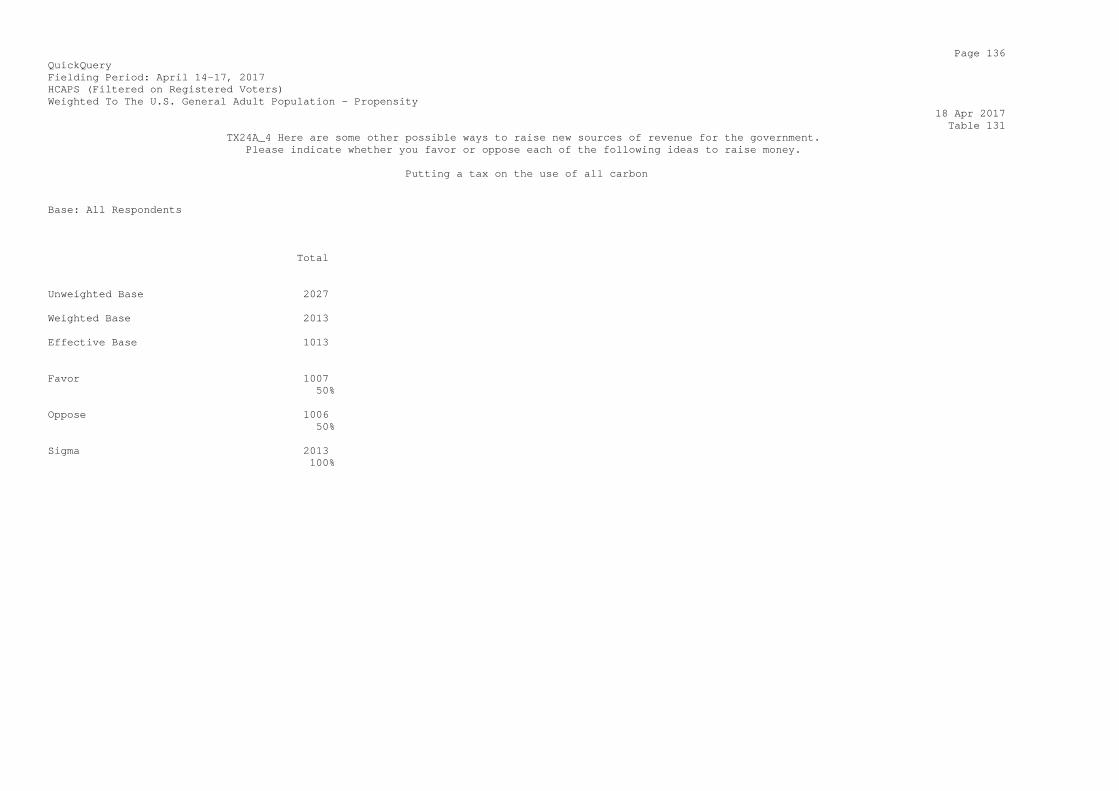
Page 136 QuickQuery Fielding Period: April 14-17, 2017 HCAPS (Filtered on Registered Voters) Weighted To The U.S. General Adult Population - Propensity 18 Apr 2017 Table 131 TX24A_4 Here are some other possible ways to raise new sources of revenue for the government. Please indicate whether you favor or oppose each of the following ideas to raise money. Putting a tax on the use of all carbon Base: All Respondents Total Unweighted Base 2027 Weighted Base 2013 Effective Base 1013 Favor 1007 50% Oppose 1006 50% Sigma 2013 100%

Page 137 QuickQuery Fielding Period: April 14-17, 2017 HCAPS (Filtered on Registered Voters) Weighted To The U.S. General Adult Population - Propensity 18 Apr 2017 Table 132 TX24A_5 Here are some other possible ways to raise new sources of revenue for the government. Please indicate whether you favor or oppose each of the following ideas to raise money. A tax surcharge of 10 percent on all incomes above $5 million Base: All Respondents Total Unweighted Base 2027 Weighted Base 2013 Effective Base 1013 Favor 1616 80% Oppose 397 20% Sigma 2013 100%
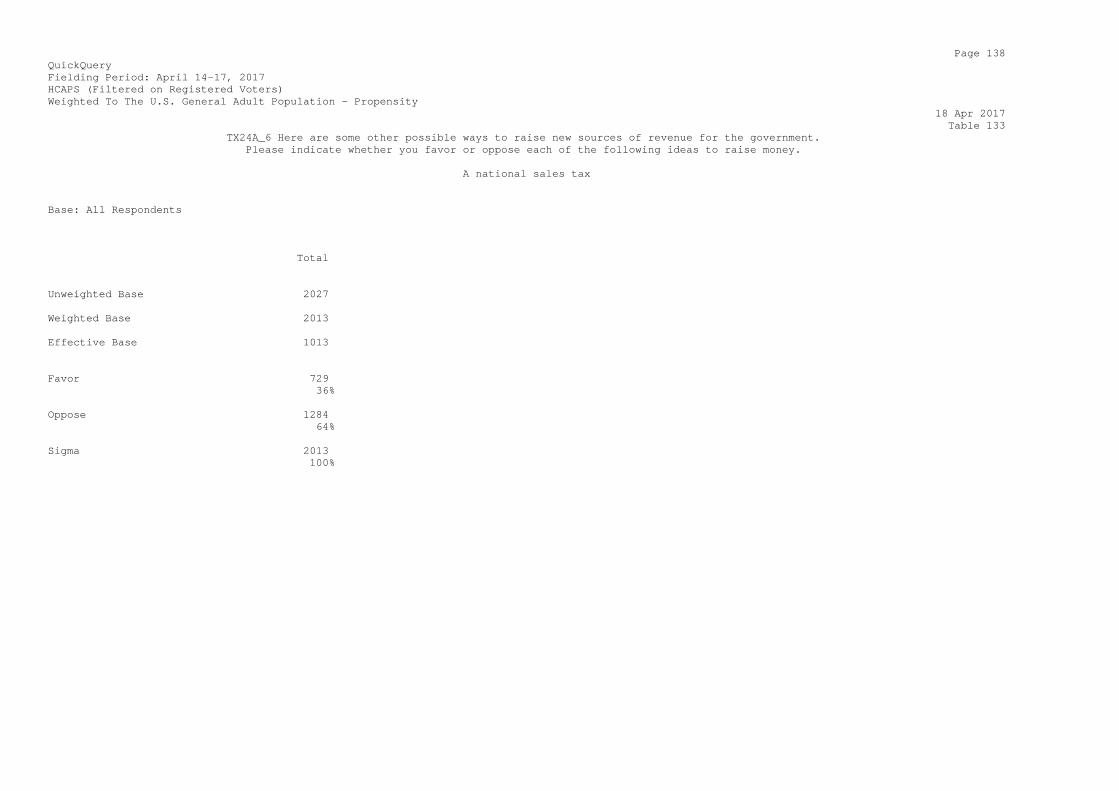
Page 138 QuickQuery Fielding Period: April 14-17, 2017 HCAPS (Filtered on Registered Voters) Weighted To The U.S. General Adult Population - Propensity 18 Apr 2017 Table 133 TX24A_6 Here are some other possible ways to raise new sources of revenue for the government. Please indicate whether you favor or oppose each of the following ideas to raise money. A national sales tax Base: All Respondents Total Unweighted Base 2027 Weighted Base 2013 Effective Base 1013 Favor 729 36% Oppose 1284 64% Sigma 2013 100%
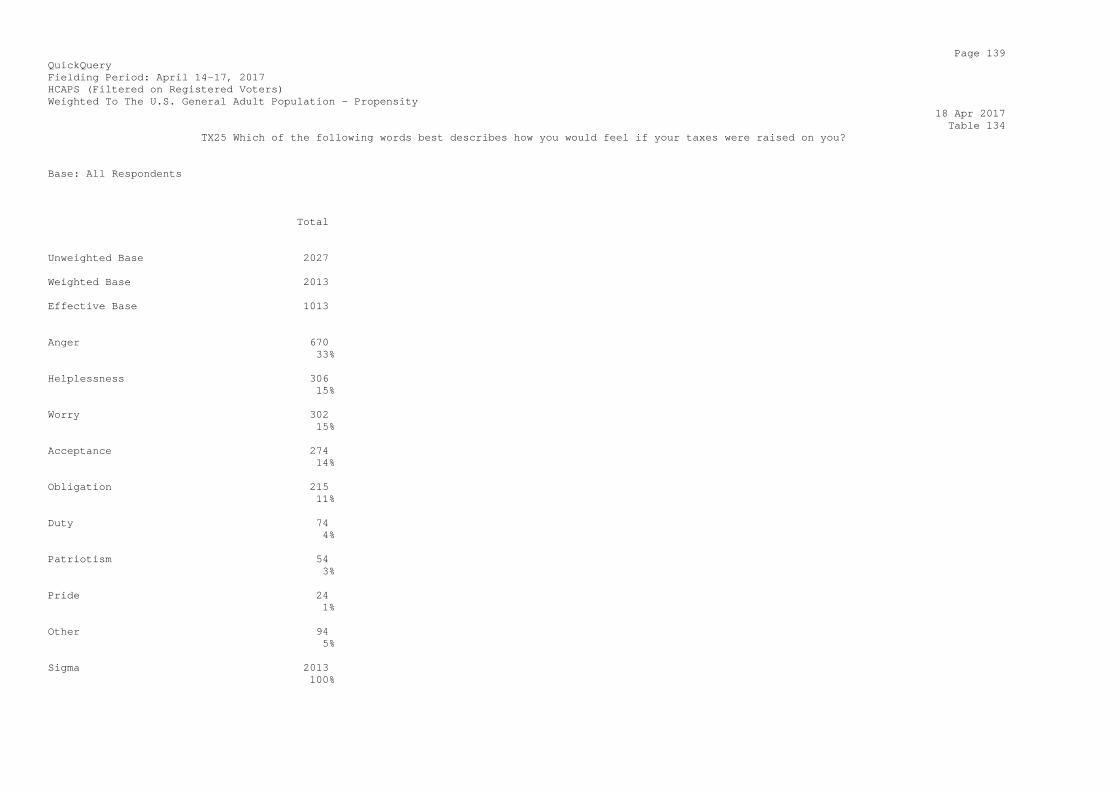
Page 139 QuickQuery Fielding Period: April 14-17, 2017 HCAPS (Filtered on Registered Voters) Weighted To The U.S. General Adult Population - Propensity 18 Apr 2017 Table 134 TX25 Which of the following words best describes how you would feel if your taxes were raised on you? Base: All Respondents Total Unweighted Base 2027 Weighted Base 2013 Effective Base 1013 Anger 670 33% Helplessness 306 15% Worry 302 15% Acceptance 274 14% Obligation 215 11% Duty 74 4% Patriotism 54 3% Pride 24 1% Other 94 5% Sigma 2013 100%
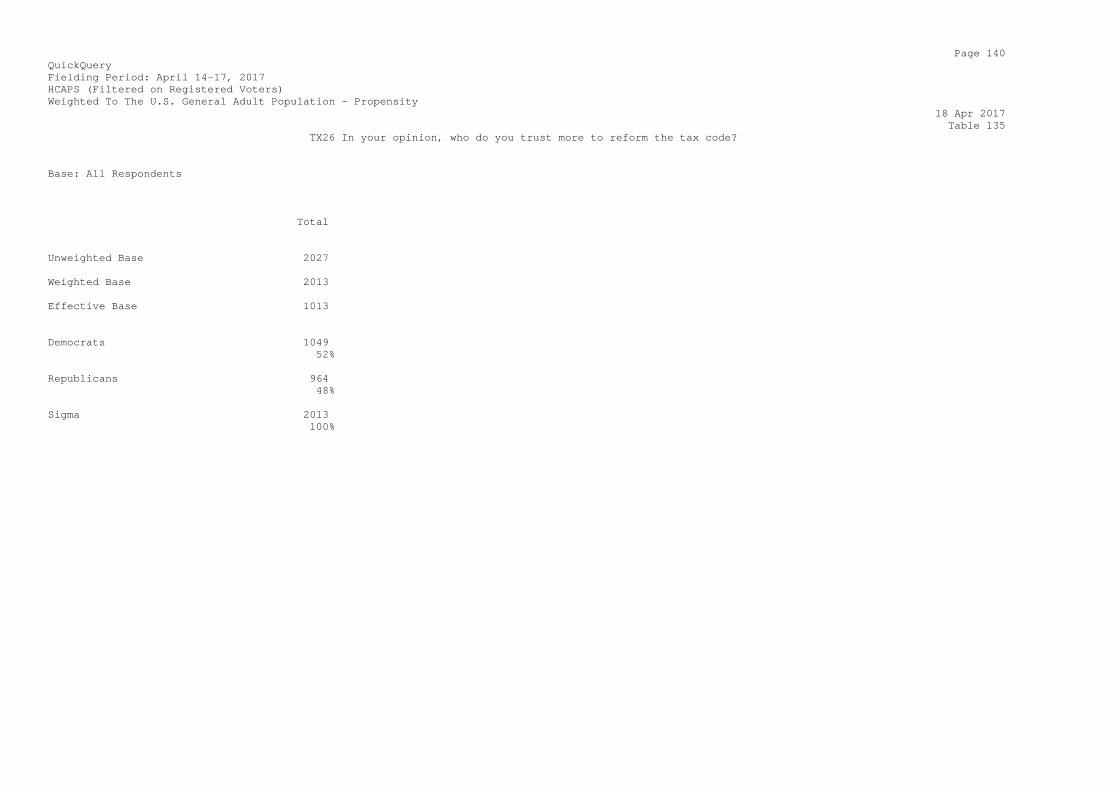
Page 140 QuickQuery Fielding Period: April 14-17, 2017 HCAPS (Filtered on Registered Voters) Weighted To The U.S. General Adult Population - Propensity 18 Apr 2017 Table 135 TX26 In your opinion, who do you trust more to reform the tax code? Base: All Respondents Total Unweighted Base 2027 Weighted Base 2013 Effective Base 1013 Democrats 1049 52% Republicans 964 48% Sigma 2013 100%
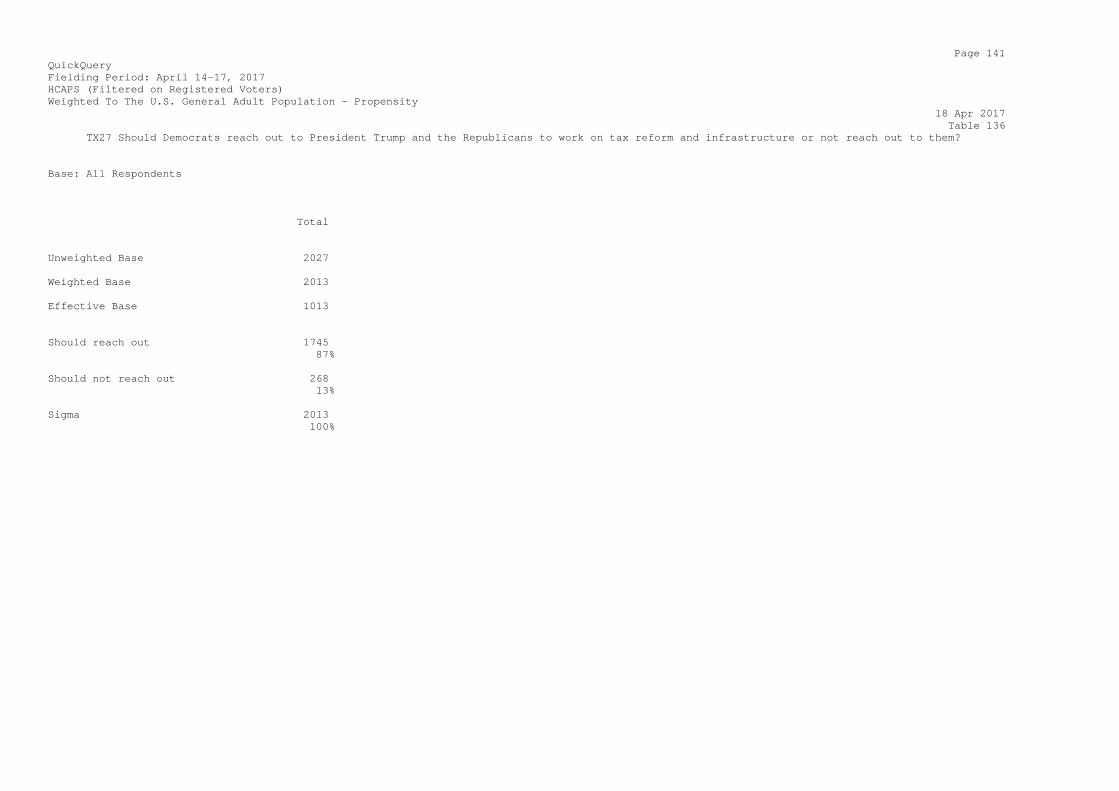
Page 141 QuickQuery Fielding Period: April 14-17, 2017 HCAPS (Filtered on Registered Voters) Weighted To The U.S. General Adult Population - Propensity 18 Apr 2017 Table 136 TX27 Should Democrats reach out to President Trump and the Republicans to work on tax reform and infrastructure or not reach out to them? Base: All Respondents Total Unweighted Base 2027 Weighted Base 2013 Effective Base 1013 Should reach out 1745 87% Should not reach out 268 13% Sigma 2013 100%
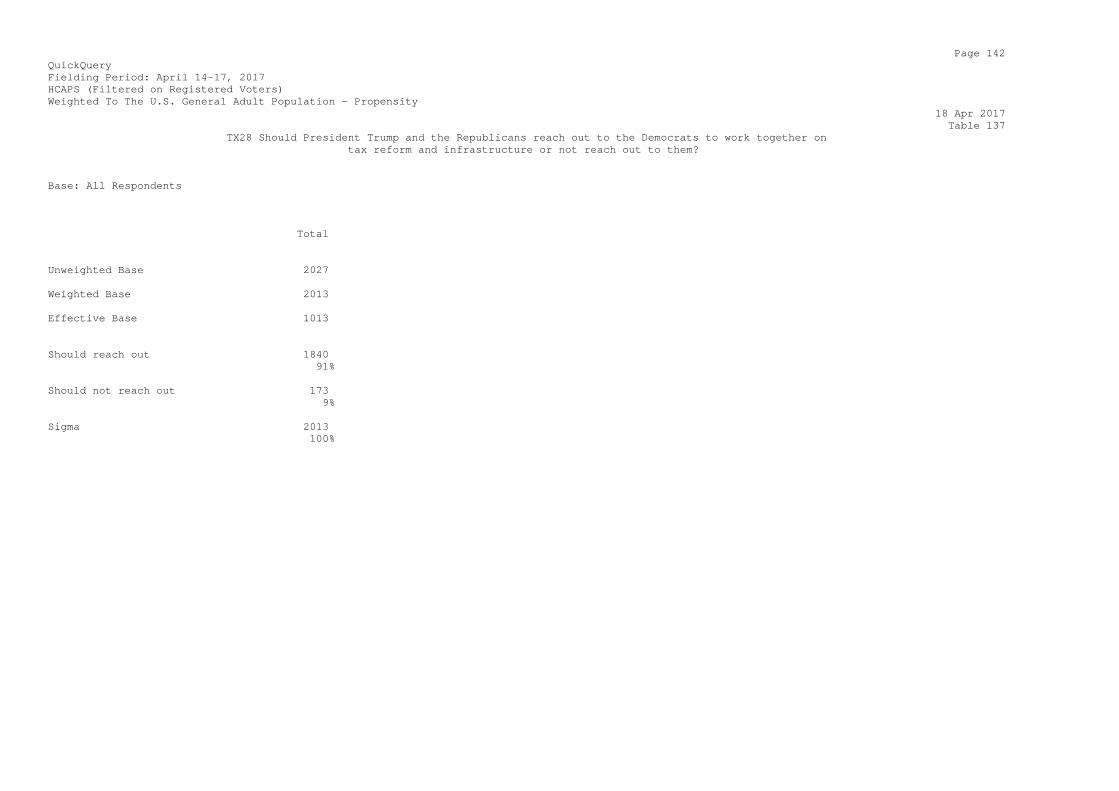
Page 142 QuickQuery Fielding Period: April 14-17, 2017 HCAPS (Filtered on Registered Voters) Weighted To The U.S. General Adult Population - Propensity 18 Apr 2017 Table 137 TX28 Should President Trump and the Republicans reach out to the Democrats to work together on tax reform and infrastructure or not reach out to them? Base: All Respondents Total Unweighted Base 2027 Weighted Base 2013 Effective Base 1013 Should reach out 1840 91% Should not reach out 173 9% Sigma 2013 100%

Page 143 QuickQuery Fielding Period: April 14-17, 2017 HCAPS (Filtered on Registered Voters) Weighted To The U.S. General Adult Population - Propensity 18 Apr 2017 Table 138 TX29 Do you think it is possible for the two major parties and the President to work together on tax reform and infrastructure or is that not possible? Base: All Respondents Total Unweighted Base 2027 Weighted Base 2013 Effective Base 1013 Possible 1253 62% Not possible 760 38% Sigma 2013 100%
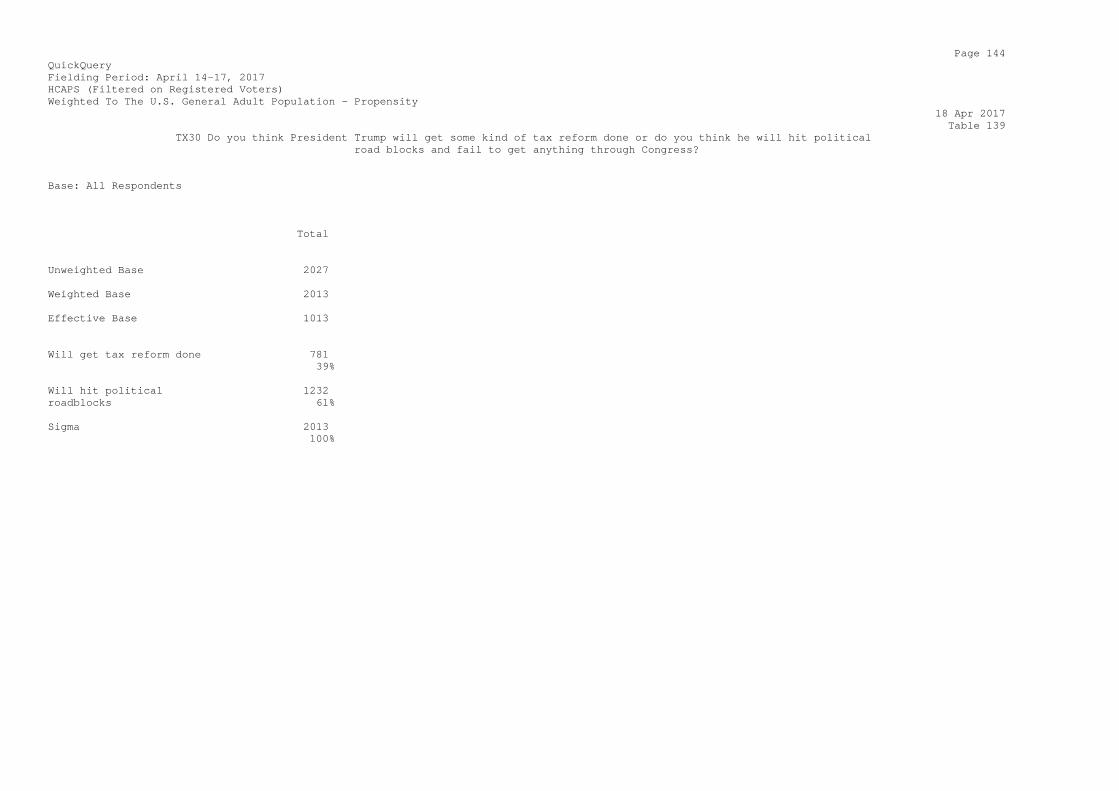
Page 144 QuickQuery Fielding Period: April 14-17, 2017 HCAPS (Filtered on Registered Voters) Weighted To The U.S. General Adult Population - Propensity 18 Apr 2017 Table 139 TX30 Do you think President Trump will get some kind of tax reform done or do you think he will hit political road blocks and fail to get anything through Congress? Base: All Respondents Total Unweighted Base 2027 Weighted Base 2013 Effective Base 1013 Will get tax reform done 781 39% Will hit political 1232 roadblocks 61% Sigma 2013 100%
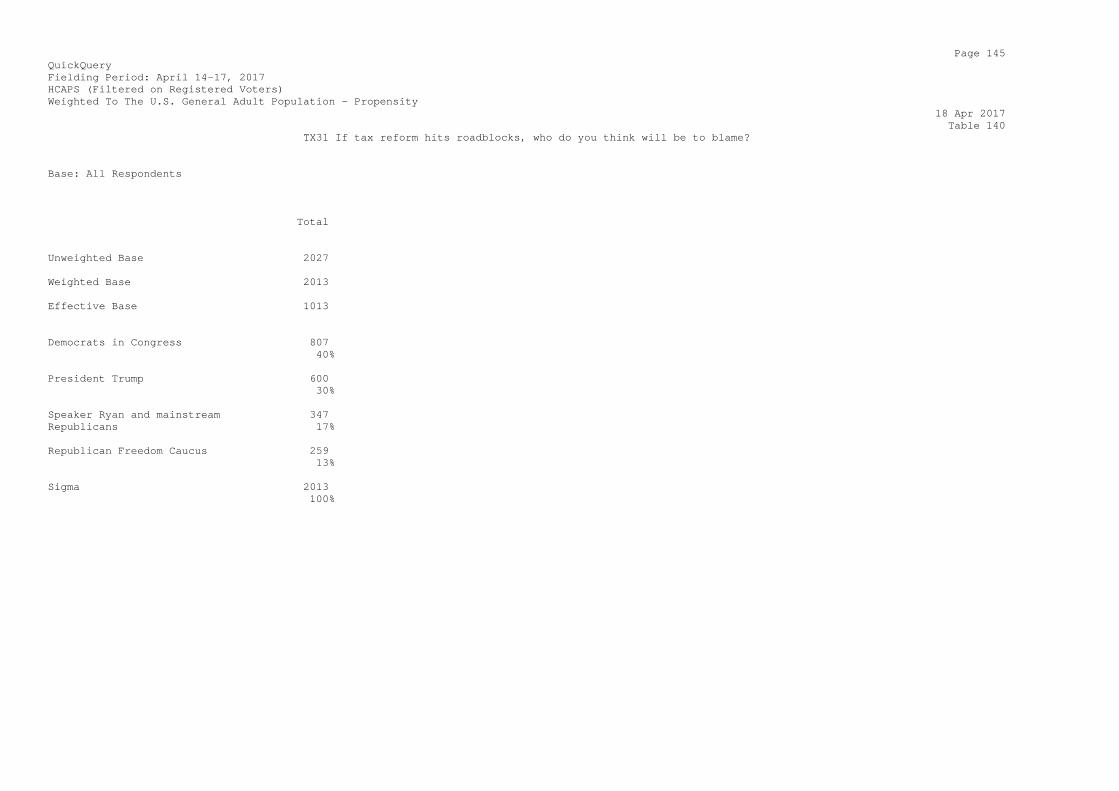
Page 145 QuickQuery Fielding Period: April 14-17, 2017 HCAPS (Filtered on Registered Voters) Weighted To The U.S. General Adult Population - Propensity 18 Apr 2017 Table 140 TX31 If tax reform hits roadblocks, who do you think will be to blame? Base: All Respondents Total Unweighted Base 2027 Weighted Base 2013 Effective Base 1013 Democrats in Congress 807 40% President Trump 600 30% Speaker Ryan and mainstream 347 Republicans 17% Republican Freedom Caucus 259 13% Sigma 2013 100%
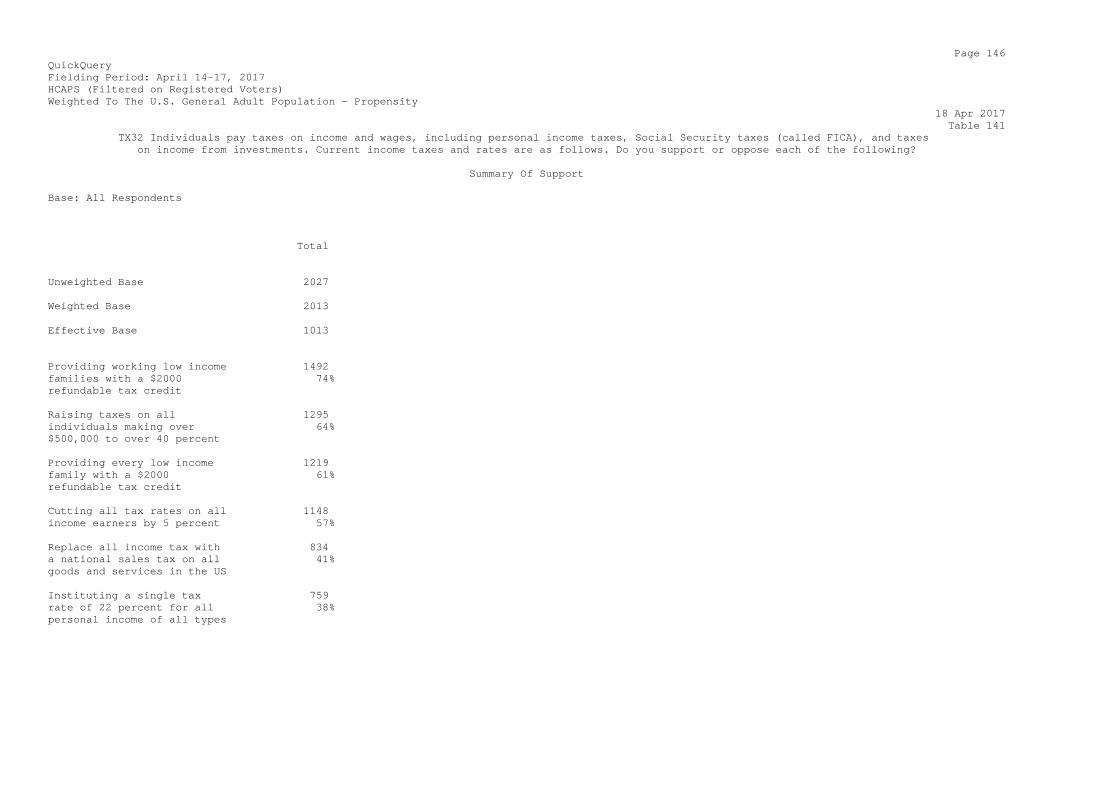
Page 146 QuickQuery Fielding Period: April 14-17, 2017 HCAPS (Filtered on Registered Voters) Weighted To The U.S. General Adult Population - Propensity 18 Apr 2017 Table 141 TX32 Individuals pay taxes on income and wages, including personal income taxes, Social Security taxes (called FICA), and taxes on income from investments. Current income taxes and rates are as follows. Do you support or oppose each of the following? Summary Of Support Base: All Respondents Total Unweighted Base 2027 Weighted Base 2013 Effective Base 1013 Providing working low income 1492 families with a $2000 74% refundable tax credit Raising taxes on all 1295 individuals making over 64% $500,000 to over 40 percent Providing every low income 1219 family with a $2000 61% refundable tax credit Cutting all tax rates on all 1148 income earners by 5 percent 57% Replace all income tax with 834 a national sales tax on all 41% goods and services in the US Instituting a single tax 759 rate of 22 percent for all 38% personal income of all types
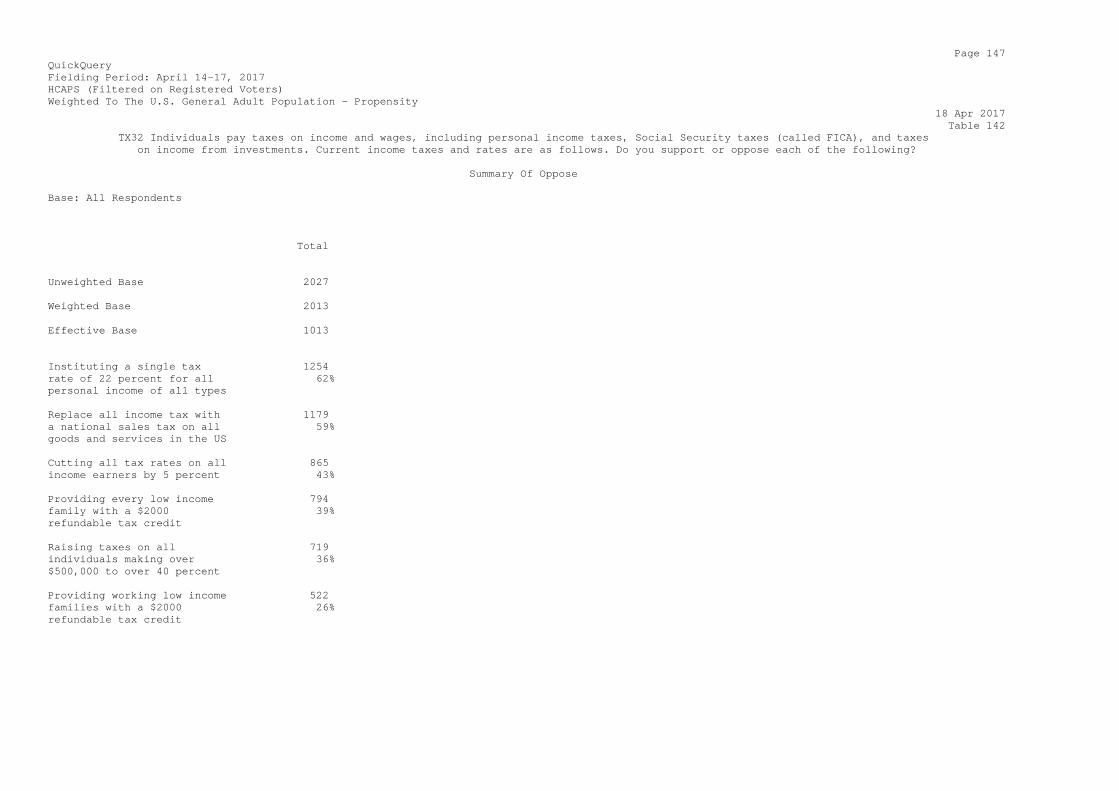
Page 147 QuickQuery Fielding Period: April 14-17, 2017 HCAPS (Filtered on Registered Voters) Weighted To The U.S. General Adult Population - Propensity 18 Apr 2017 Table 142 TX32 Individuals pay taxes on income and wages, including personal income taxes, Social Security taxes (called FICA), and taxes on income from investments. Current income taxes and rates are as follows. Do you support or oppose each of the following? Summary Of Oppose Base: All Respondents Total Unweighted Base 2027 Weighted Base 2013 Effective Base 1013 Instituting a single tax 1254 rate of 22 percent for all 62% personal income of all types Replace all income tax with 1179 a national sales tax on all 59% goods and services in the US Cutting all tax rates on all 865 income earners by 5 percent 43% Providing every low income 794 family with a $2000 39% refundable tax credit Raising taxes on all 719 individuals making over 36% $500,000 to over 40 percent Providing working low income 522 families with a $2000 26% refundable tax credit

Page 148 QuickQuery Fielding Period: April 14-17, 2017 HCAPS (Filtered on Registered Voters) Weighted To The U.S. General Adult Population - Propensity 18 Apr 2017 Table 143 TX32_1 Individuals pay taxes on income and wages, including personal income taxes, Social Security taxes (called FICA), and taxes on income from investments. Current income taxes and rates are as follows. Do you support or oppose each of the following? Instituting a single tax rate of 22 percent for all personal income of all types Base: All Respondents Total Unweighted Base 2027 Weighted Base 2013 Effective Base 1013 Support 759 38% Oppose 1254 62% Sigma 2013 100%

Page 149 QuickQuery Fielding Period: April 14-17, 2017 HCAPS (Filtered on Registered Voters) Weighted To The U.S. General Adult Population - Propensity 18 Apr 2017 Table 144 TX32_2 Individuals pay taxes on income and wages, including personal income taxes, Social Security taxes (called FICA), and taxes on income from investments. Current income taxes and rates are as follows. Do you support or oppose each of the following? Providing every low income family with a $2000 refundable tax credit Base: All Respondents Total Unweighted Base 2027 Weighted Base 2013 Effective Base 1013 Support 1219 61% Oppose 794 39% Sigma 2013 100%

Page 150 QuickQuery Fielding Period: April 14-17, 2017 HCAPS (Filtered on Registered Voters) Weighted To The U.S. General Adult Population - Propensity 18 Apr 2017 Table 145 TX32_3 Individuals pay taxes on income and wages, including personal income taxes, Social Security taxes (called FICA), and taxes on income from investments. Current income taxes and rates are as follows. Do you support or oppose each of the following? Providing working low income families with a $2000 refundable tax credit Base: All Respondents Total Unweighted Base 2027 Weighted Base 2013 Effective Base 1013 Support 1492 74% Oppose 522 26% Sigma 2013 100%
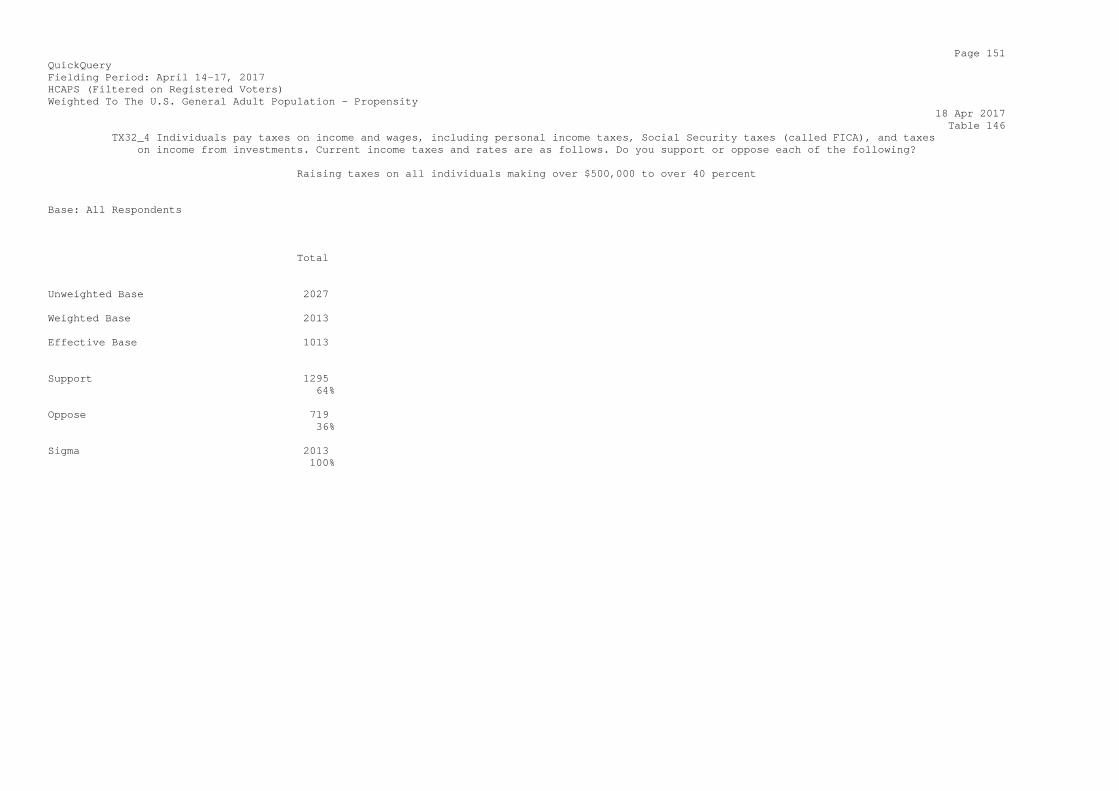
Page 151 QuickQuery Fielding Period: April 14-17, 2017 HCAPS (Filtered on Registered Voters) Weighted To The U.S. General Adult Population - Propensity 18 Apr 2017 Table 146 TX32_4 Individuals pay taxes on income and wages, including personal income taxes, Social Security taxes (called FICA), and taxes on income from investments. Current income taxes and rates are as follows. Do you support or oppose each of the following? Raising taxes on all individuals making over $500,000 to over 40 percent Base: All Respondents Total Unweighted Base 2027 Weighted Base 2013 Effective Base 1013 Support 1295 64% Oppose 719 36% Sigma 2013 100%

Page 152 QuickQuery Fielding Period: April 14-17, 2017 HCAPS (Filtered on Registered Voters) Weighted To The U.S. General Adult Population - Propensity 18 Apr 2017 Table 147 TX32_5 Individuals pay taxes on income and wages, including personal income taxes, Social Security taxes (called FICA), and taxes on income from investments. Current income taxes and rates are as follows. Do you support or oppose each of the following? Cutting all tax rates on all income earners by 5 percent Base: All Respondents Total Unweighted Base 2027 Weighted Base 2013 Effective Base 1013 Support 1148 57% Oppose 865 43% Sigma 2013 100%

Page 153 QuickQuery Fielding Period: April 14-17, 2017 HCAPS (Filtered on Registered Voters) Weighted To The U.S. General Adult Population - Propensity 18 Apr 2017 Table 148 TX32_6 Individuals pay taxes on income and wages, including personal income taxes, Social Security taxes (called FICA), and taxes on income from investments. Current income taxes and rates are as follows. Do you support or oppose each of the following? Replace all income tax with a national sales tax on all goods and services in the US Base: All Respondents Total Unweighted Base 2027 Weighted Base 2013 Effective Base 1013 Support 834 41% Oppose 1179 59% Sigma 2013 100%
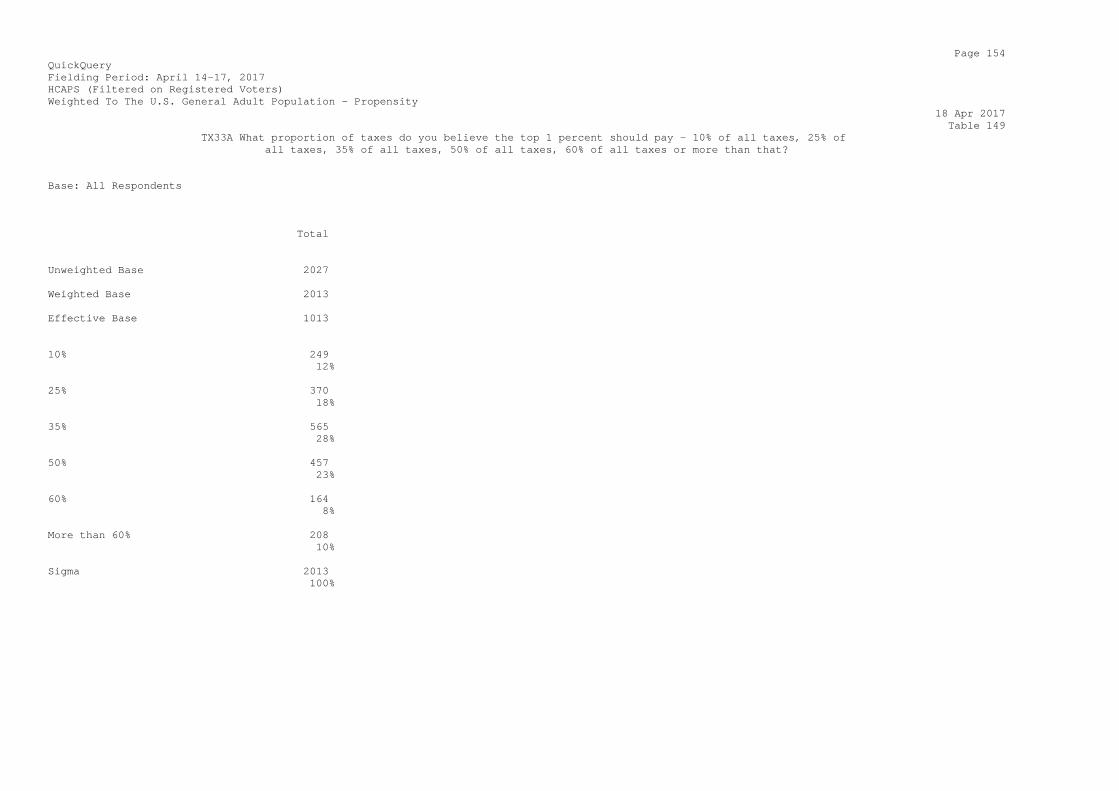
Page 154 QuickQuery Fielding Period: April 14-17, 2017 HCAPS (Filtered on Registered Voters) Weighted To The U.S. General Adult Population - Propensity 18 Apr 2017 Table 149 TX33A What proportion of taxes do you believe the top 1 percent should pay - 10% of all taxes, 25% of all taxes, 35% of all taxes, 50% of all taxes, 60% of all taxes or more than that? Base: All Respondents Total Unweighted Base 2027 Weighted Base 2013 Effective Base 1013 10% 249 12% 25% 370 18% 35% 565 28% 50% 457 23% 60% 164 8% More than 60% 208 10% Sigma 2013 100%
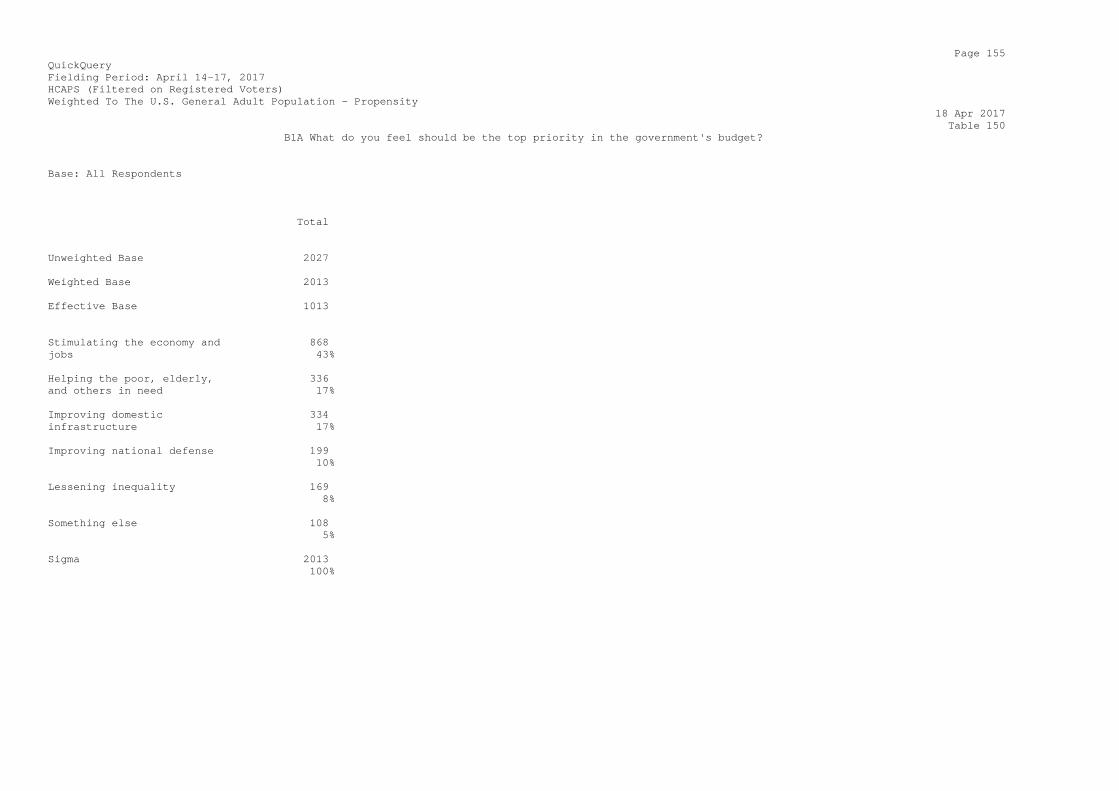
Page 155 QuickQuery Fielding Period: April 14-17, 2017 HCAPS (Filtered on Registered Voters) Weighted To The U.S. General Adult Population - Propensity 18 Apr 2017 Table 150 B1A What do you feel should be the top priority in the government's budget? Base: All Respondents Total Unweighted Base 2027 Weighted Base 2013 Effective Base 1013 Stimulating the economy and 868 jobs 43% Helping the poor, elderly, 336 and others in need 17% Improving domestic 334 infrastructure 17% Improving national defense 199 10% Lessening inequality 169 8% Something else 108 5% Sigma 2013 100%
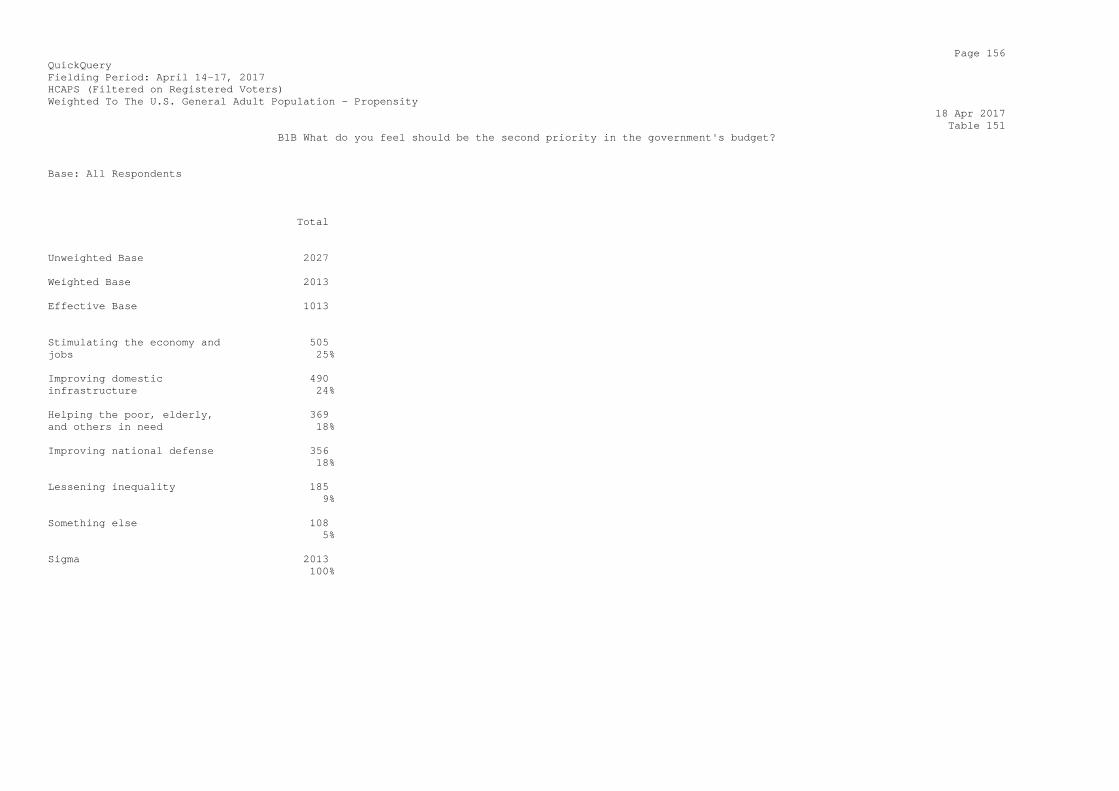
Page 156 QuickQuery Fielding Period: April 14-17, 2017 HCAPS (Filtered on Registered Voters) Weighted To The U.S. General Adult Population - Propensity 18 Apr 2017 Table 151 B1B What do you feel should be the second priority in the government's budget? Base: All Respondents Total Unweighted Base 2027 Weighted Base 2013 Effective Base 1013 Stimulating the economy and 505 jobs 25% Improving domestic 490 infrastructure 24% Helping the poor, elderly, 369 and others in need 18% Improving national defense 356 18% Lessening inequality 185 9% Something else 108 5% Sigma 2013 100%
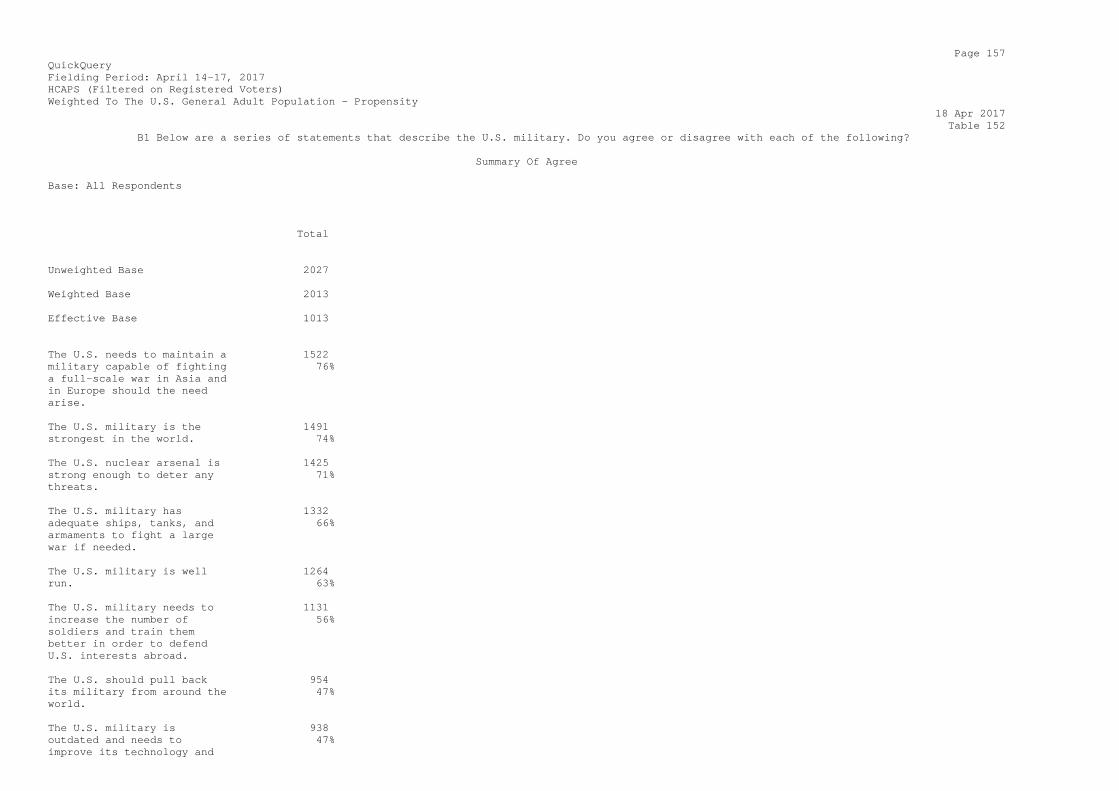
Page 157 QuickQuery Fielding Period: April 14-17, 2017 HCAPS (Filtered on Registered Voters) Weighted To The U.S. General Adult Population - Propensity 18 Apr 2017 Table 152 B1 Below are a series of statements that describe the U.S. military. Do you agree or disagree with each of the following? Summary Of Agree Base: All Respondents Total Unweighted Base 2027 Weighted Base 2013 Effective Base 1013 The U.S. needs to maintain a 1522 military capable of fighting 76% a full-scale war in Asia and in Europe should the need arise. The U.S. military is the 1491 strongest in the world. 74% The U.S. nuclear arsenal is 1425 strong enough to deter any 71% threats. The U.S. military has 1332 adequate ships, tanks, and 66% armaments to fight a large war if needed. The U.S. military is well 1264 run. 63% The U.S. military needs to 1131 increase the number of 56% soldiers and train them better in order to defend U.S. interests abroad. The U.S. should pull back 954 its military from around the 47% world. The U.S. military is 938 outdated and needs to 47% improve its technology and

equipment. The U.S. needs to increase 829 and improve its nuclear 41% weapons. The U.S. government does a 566 good job taking care of the 28% needs of US military veterans.
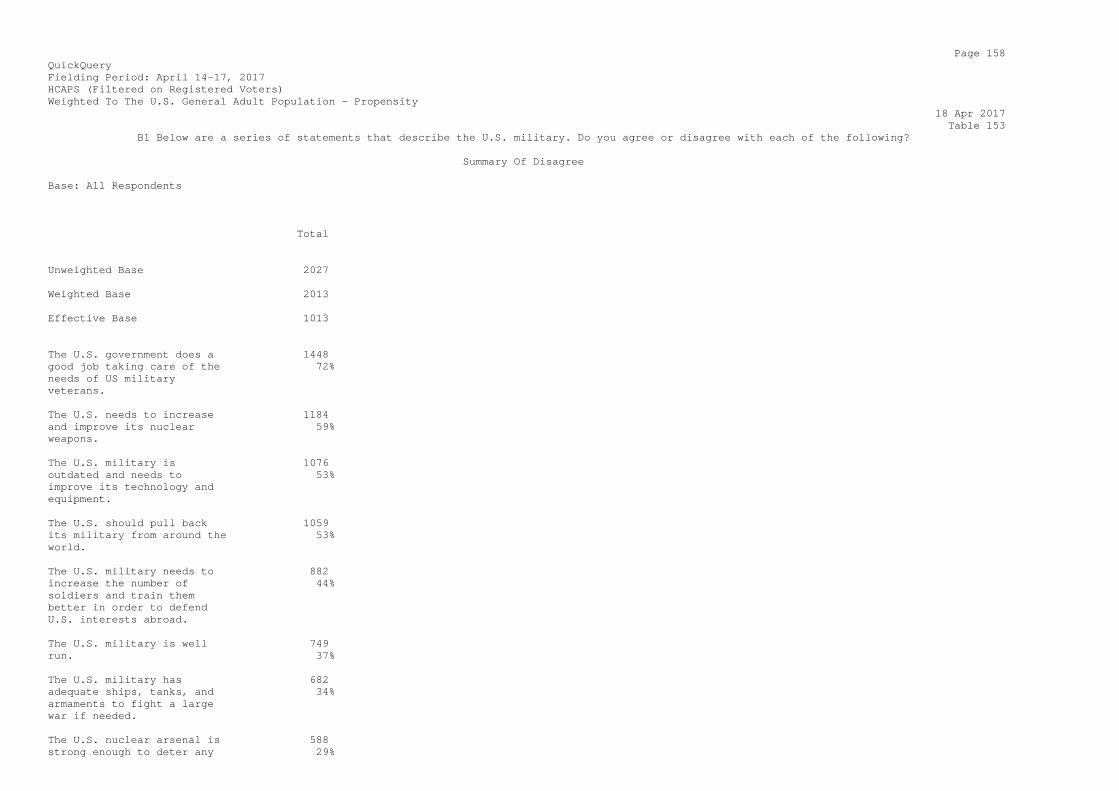
Page 158 QuickQuery Fielding Period: April 14-17, 2017 HCAPS (Filtered on Registered Voters) Weighted To The U.S. General Adult Population - Propensity 18 Apr 2017 Table 153 B1 Below are a series of statements that describe the U.S. military. Do you agree or disagree with each of the following? Summary Of Disagree Base: All Respondents Total Unweighted Base 2027 Weighted Base 2013 Effective Base 1013 The U.S. government does a 1448 good job taking care of the 72% needs of US military veterans. The U.S. needs to increase 1184 and improve its nuclear 59% weapons. The U.S. military is 1076 outdated and needs to 53% improve its technology and equipment. The U.S. should pull back 1059 its military from around the 53% world. The U.S. military needs to 882 increase the number of 44% soldiers and train them better in order to defend U.S. interests abroad. The U.S. military is well 749 run. 37% The U.S. military has 682 adequate ships, tanks, and 34% armaments to fight a large war if needed. The U.S. nuclear arsenal is 588 strong enough to deter any 29%

threats. The U.S. military is the 522 strongest in the world. 26% The U.S. needs to maintain a 491 military capable of fighting 24% a full-scale war in Asia and in Europe should the need arise.
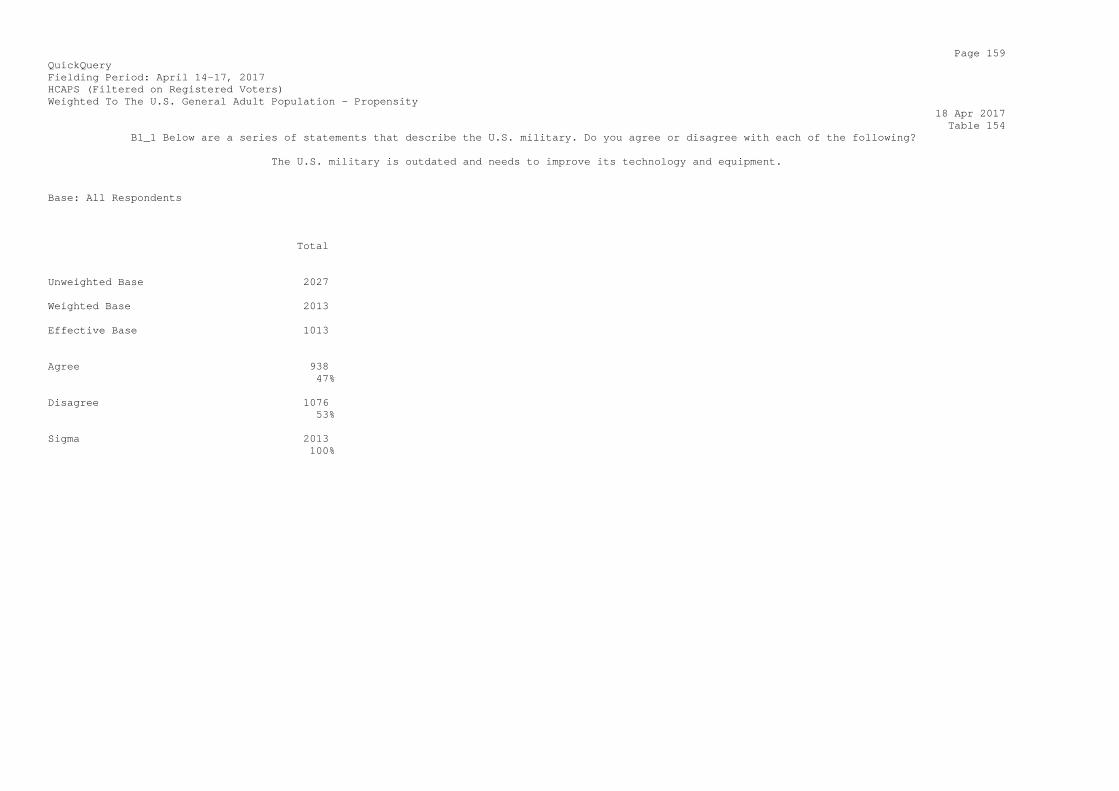
Page 159 QuickQuery Fielding Period: April 14-17, 2017 HCAPS (Filtered on Registered Voters) Weighted To The U.S. General Adult Population - Propensity 18 Apr 2017 Table 154 B1_1 Below are a series of statements that describe the U.S. military. Do you agree or disagree with each of the following? The U.S. military is outdated and needs to improve its technology and equipment. Base: All Respondents Total Unweighted Base 2027 Weighted Base 2013 Effective Base 1013 Agree 938 47% Disagree 1076 53% Sigma 2013 100%
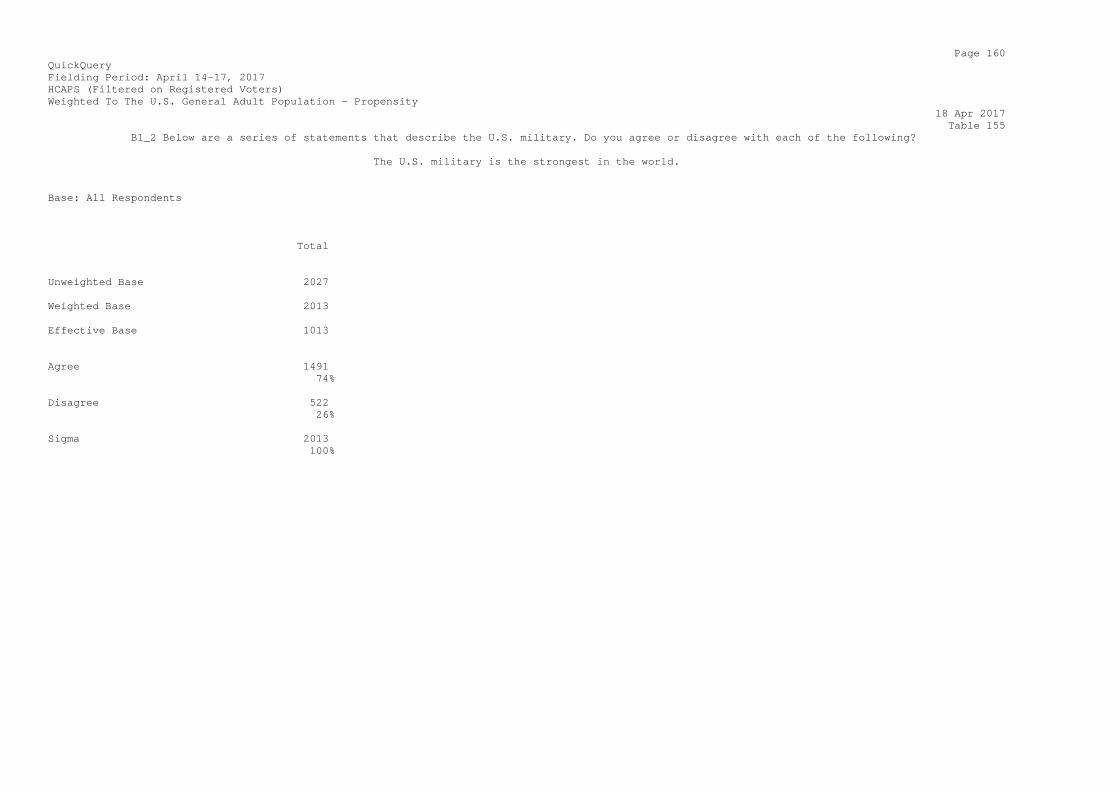
Page 160 QuickQuery Fielding Period: April 14-17, 2017 HCAPS (Filtered on Registered Voters) Weighted To The U.S. General Adult Population - Propensity 18 Apr 2017 Table 155 B1_2 Below are a series of statements that describe the U.S. military. Do you agree or disagree with each of the following? The U.S. military is the strongest in the world. Base: All Respondents Total Unweighted Base 2027 Weighted Base 2013 Effective Base 1013 Agree 1491 74% Disagree 522 26% Sigma 2013 100%
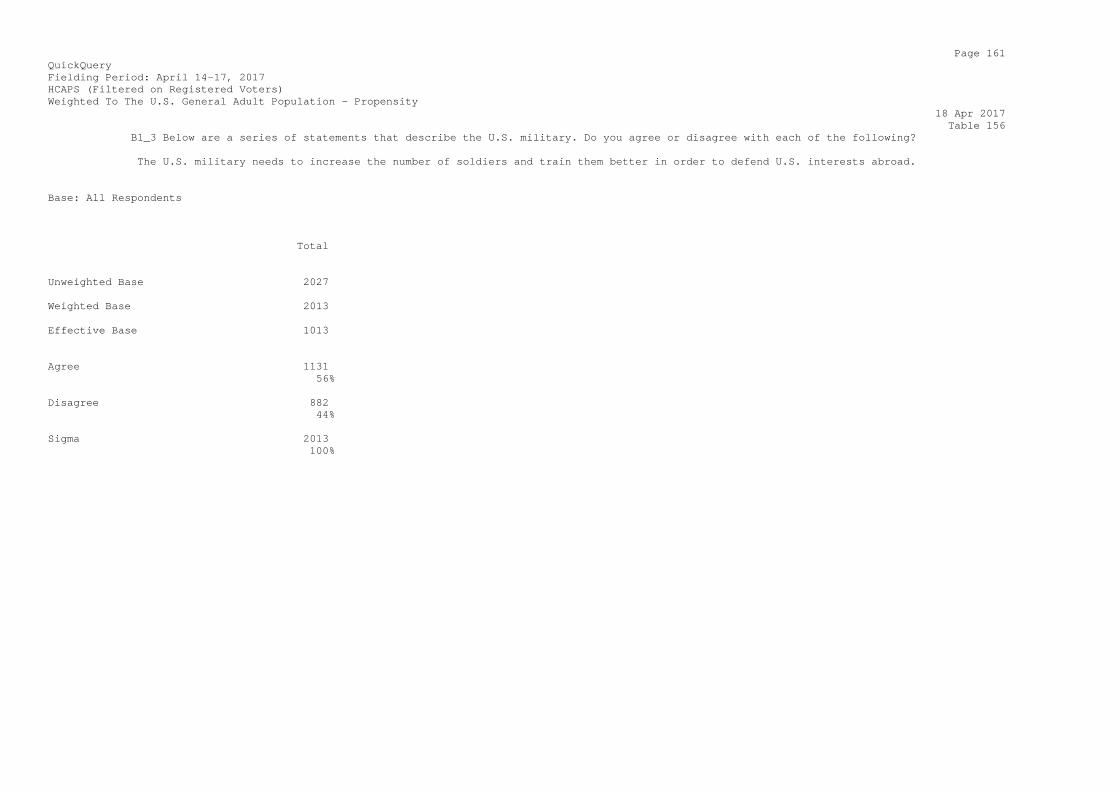
Page 161 QuickQuery Fielding Period: April 14-17, 2017 HCAPS (Filtered on Registered Voters) Weighted To The U.S. General Adult Population - Propensity 18 Apr 2017 Table 156 B1_3 Below are a series of statements that describe the U.S. military. Do you agree or disagree with each of the following? The U.S. military needs to increase the number of soldiers and train them better in order to defend U.S. interests abroad. Base: All Respondents Total Unweighted Base 2027 Weighted Base 2013 Effective Base 1013 Agree 1131 56% Disagree 882 44% Sigma 2013 100%
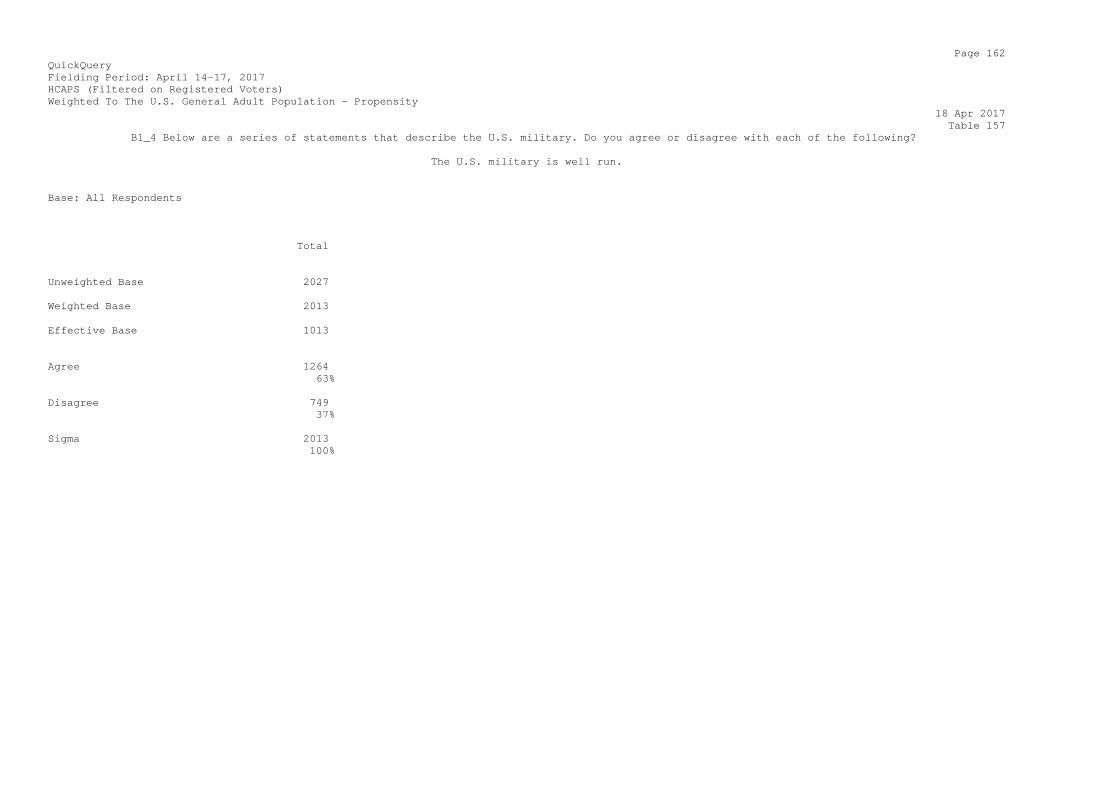
Page 162 QuickQuery Fielding Period: April 14-17, 2017 HCAPS (Filtered on Registered Voters) Weighted To The U.S. General Adult Population - Propensity 18 Apr 2017 Table 157 B1_4 Below are a series of statements that describe the U.S. military. Do you agree or disagree with each of the following? The U.S. military is well run. Base: All Respondents Total Unweighted Base 2027 Weighted Base 2013 Effective Base 1013 Agree 1264 63% Disagree 749 37% Sigma 2013 100%
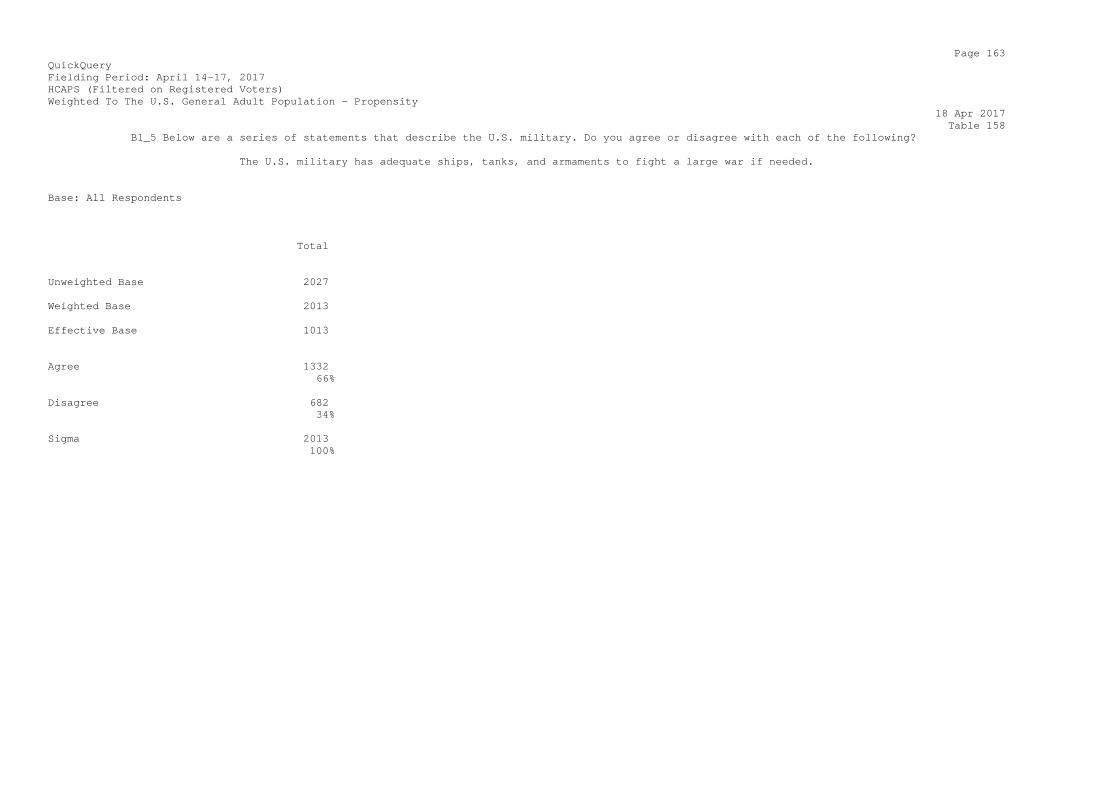
Page 163 QuickQuery Fielding Period: April 14-17, 2017 HCAPS (Filtered on Registered Voters) Weighted To The U.S. General Adult Population - Propensity 18 Apr 2017 Table 158 B1_5 Below are a series of statements that describe the U.S. military. Do you agree or disagree with each of the following? The U.S. military has adequate ships, tanks, and armaments to fight a large war if needed. Base: All Respondents Total Unweighted Base 2027 Weighted Base 2013 Effective Base 1013 Agree 1332 66% Disagree 682 34% Sigma 2013 100%
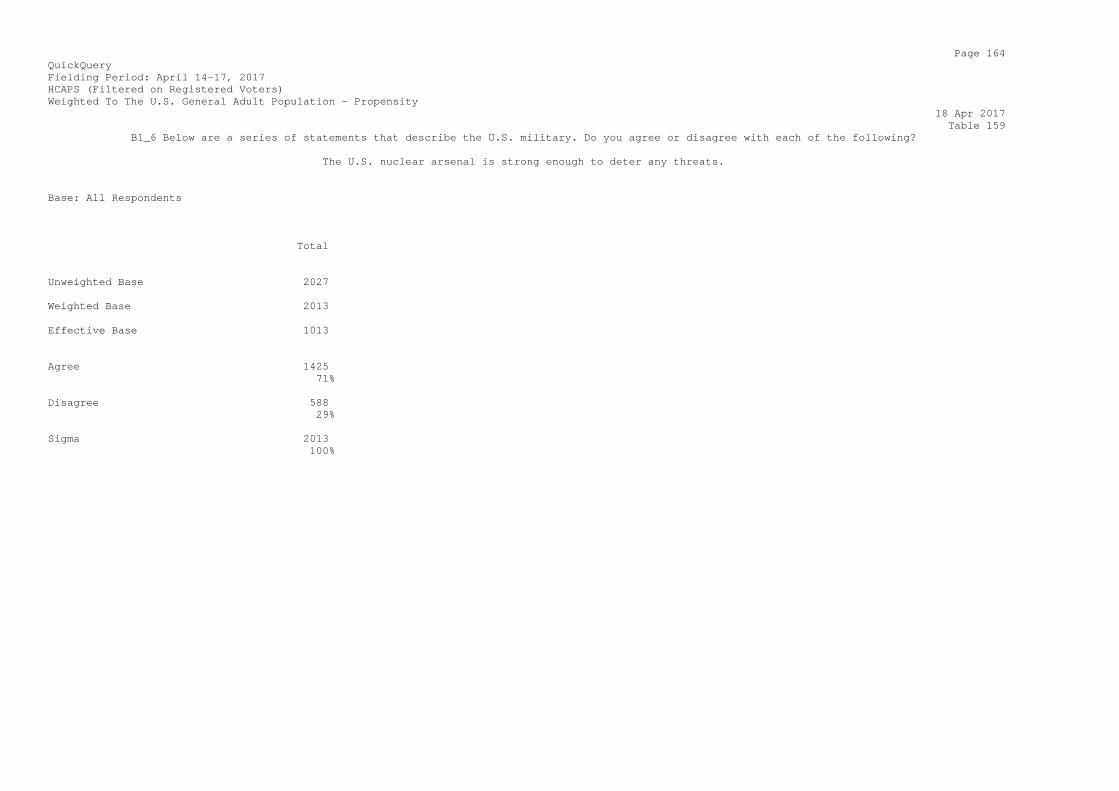
Page 164 QuickQuery Fielding Period: April 14-17, 2017 HCAPS (Filtered on Registered Voters) Weighted To The U.S. General Adult Population - Propensity 18 Apr 2017 Table 159 B1_6 Below are a series of statements that describe the U.S. military. Do you agree or disagree with each of the following? The U.S. nuclear arsenal is strong enough to deter any threats. Base: All Respondents Total Unweighted Base 2027 Weighted Base 2013 Effective Base 1013 Agree 1425 71% Disagree 588 29% Sigma 2013 100%
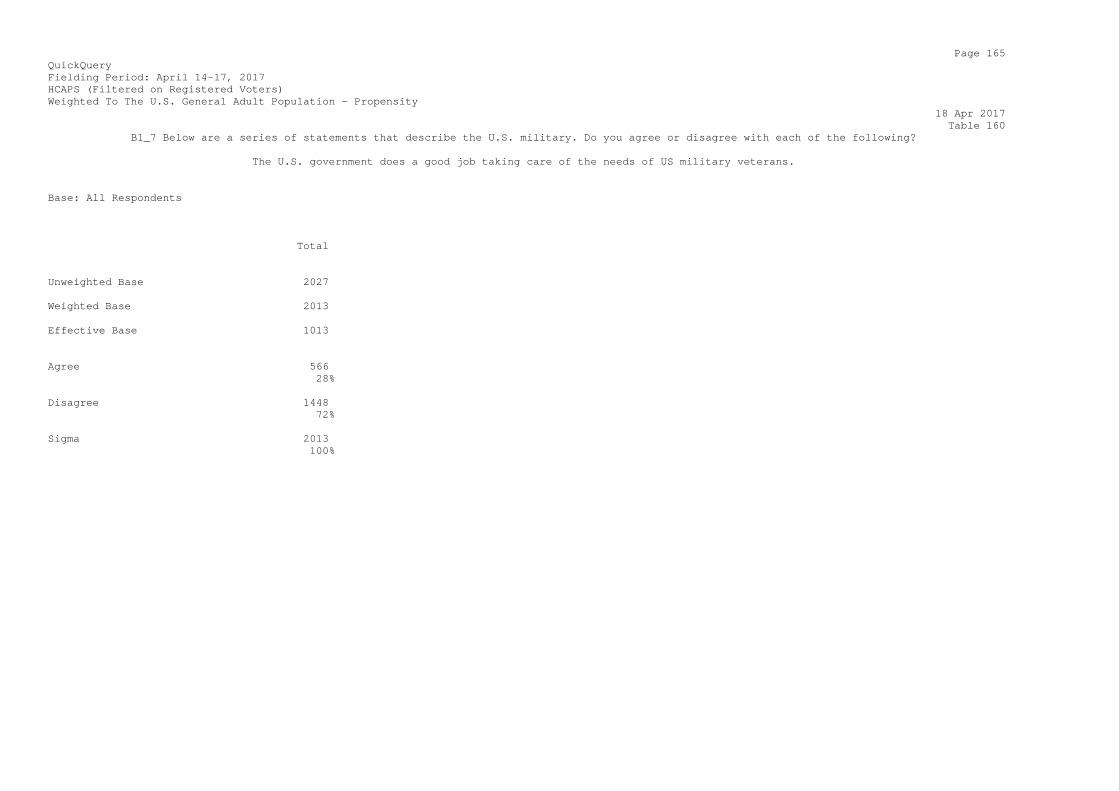
Page 165 QuickQuery Fielding Period: April 14-17, 2017 HCAPS (Filtered on Registered Voters) Weighted To The U.S. General Adult Population - Propensity 18 Apr 2017 Table 160 B1_7 Below are a series of statements that describe the U.S. military. Do you agree or disagree with each of the following? The U.S. government does a good job taking care of the needs of US military veterans. Base: All Respondents Total Unweighted Base 2027 Weighted Base 2013 Effective Base 1013 Agree 566 28% Disagree 1448 72% Sigma 2013 100%
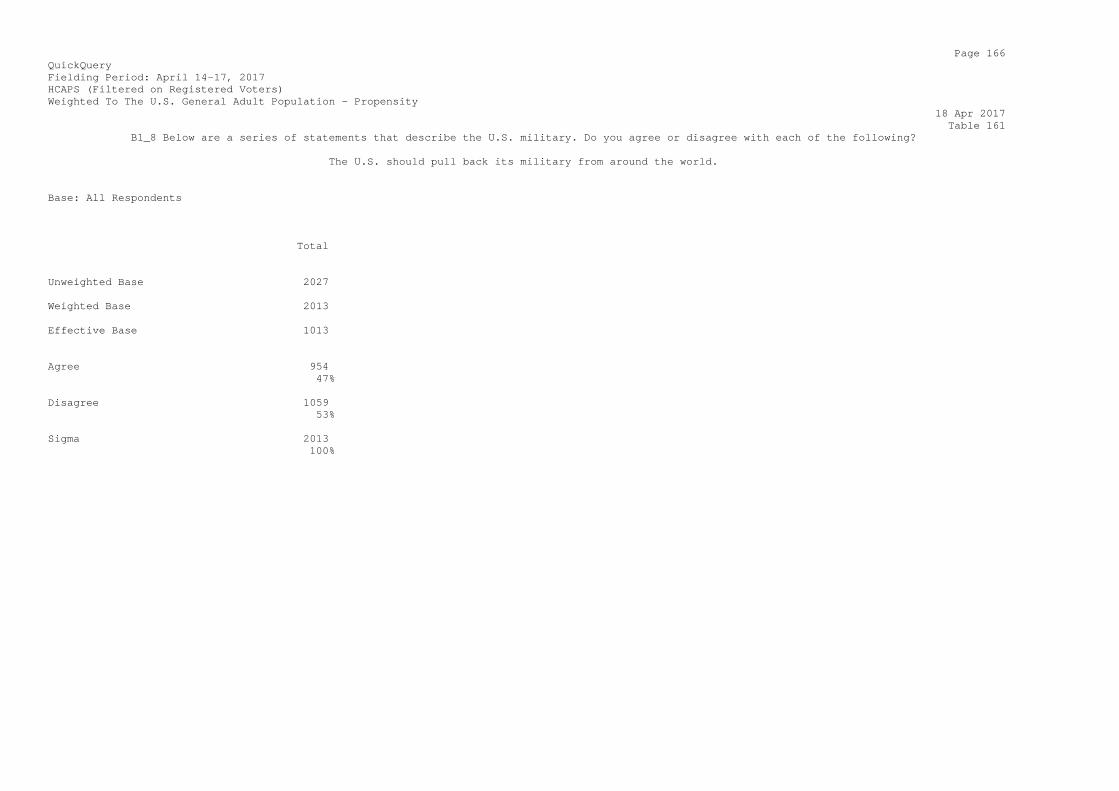
Page 166 QuickQuery Fielding Period: April 14-17, 2017 HCAPS (Filtered on Registered Voters) Weighted To The U.S. General Adult Population - Propensity 18 Apr 2017 Table 161 B1_8 Below are a series of statements that describe the U.S. military. Do you agree or disagree with each of the following? The U.S. should pull back its military from around the world. Base: All Respondents Total Unweighted Base 2027 Weighted Base 2013 Effective Base 1013 Agree 954 47% Disagree 1059 53% Sigma 2013 100%
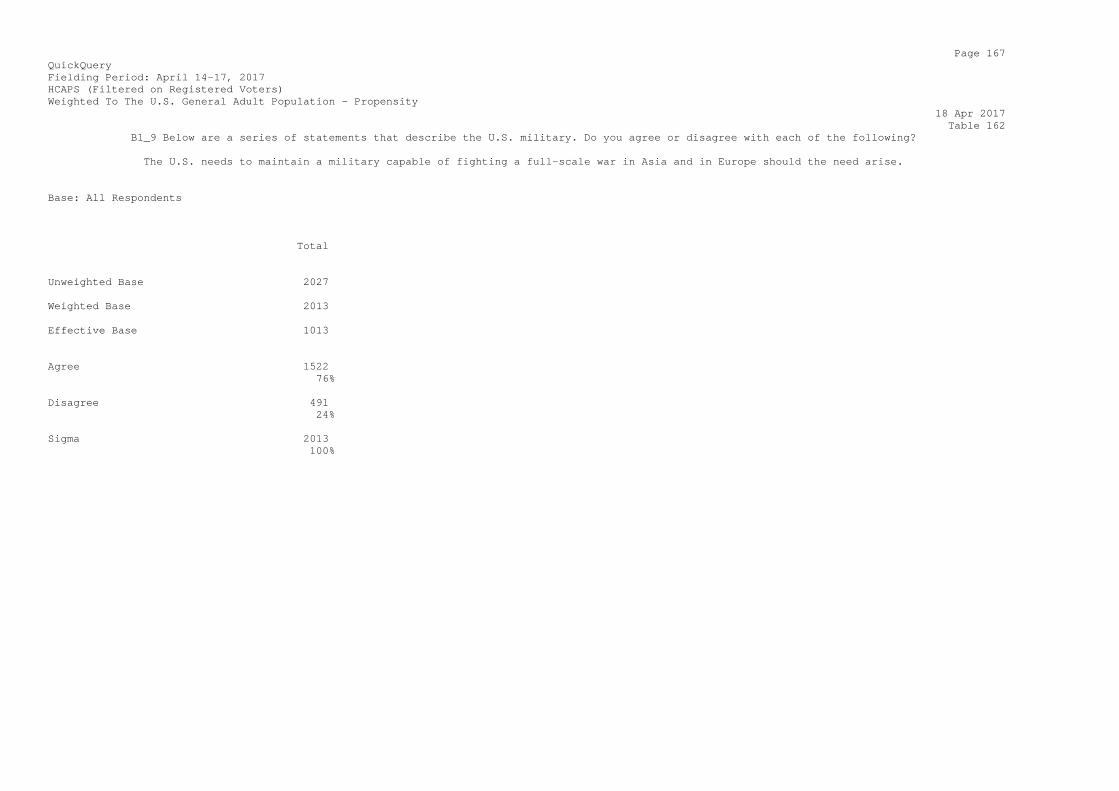
Page 167 QuickQuery Fielding Period: April 14-17, 2017 HCAPS (Filtered on Registered Voters) Weighted To The U.S. General Adult Population - Propensity 18 Apr 2017 Table 162 B1_9 Below are a series of statements that describe the U.S. military. Do you agree or disagree with each of the following? The U.S. needs to maintain a military capable of fighting a full-scale war in Asia and in Europe should the need arise. Base: All Respondents Total Unweighted Base 2027 Weighted Base 2013 Effective Base 1013 Agree 1522 76% Disagree 491 24% Sigma 2013 100%
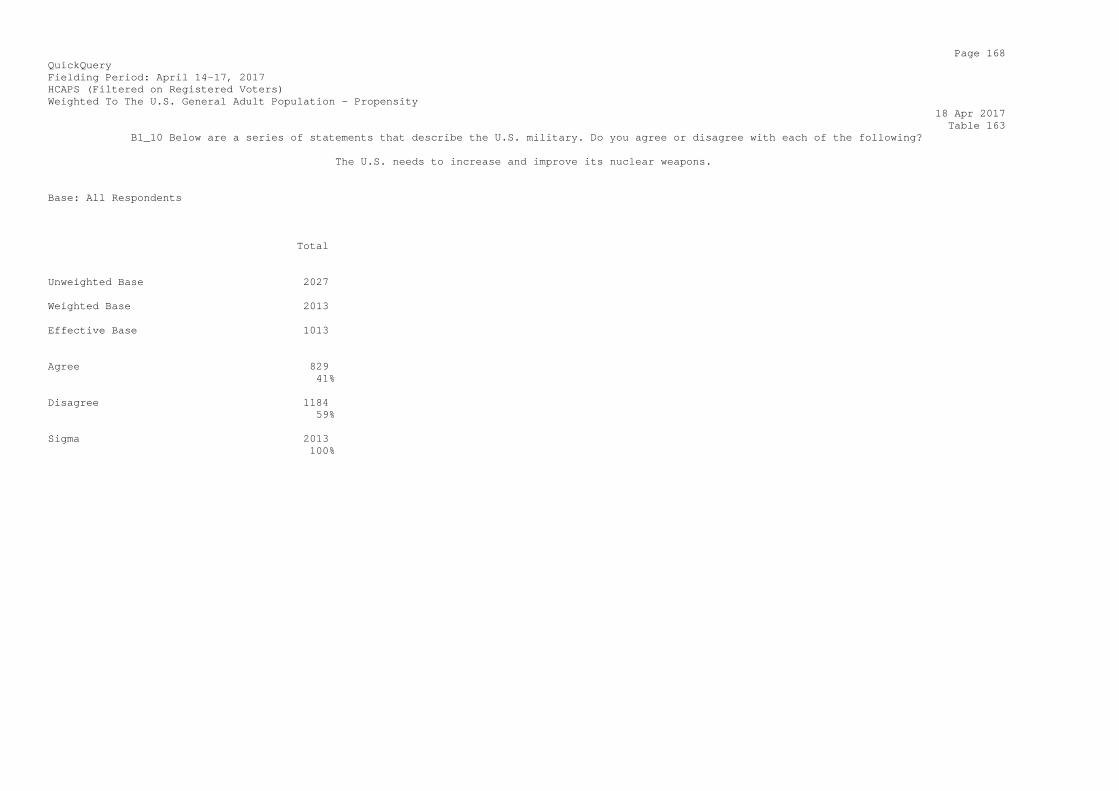
Page 168 QuickQuery Fielding Period: April 14-17, 2017 HCAPS (Filtered on Registered Voters) Weighted To The U.S. General Adult Population - Propensity 18 Apr 2017 Table 163 B1_10 Below are a series of statements that describe the U.S. military. Do you agree or disagree with each of the following? The U.S. needs to increase and improve its nuclear weapons. Base: All Respondents Total Unweighted Base 2027 Weighted Base 2013 Effective Base 1013 Agree 829 41% Disagree 1184 59% Sigma 2013 100%
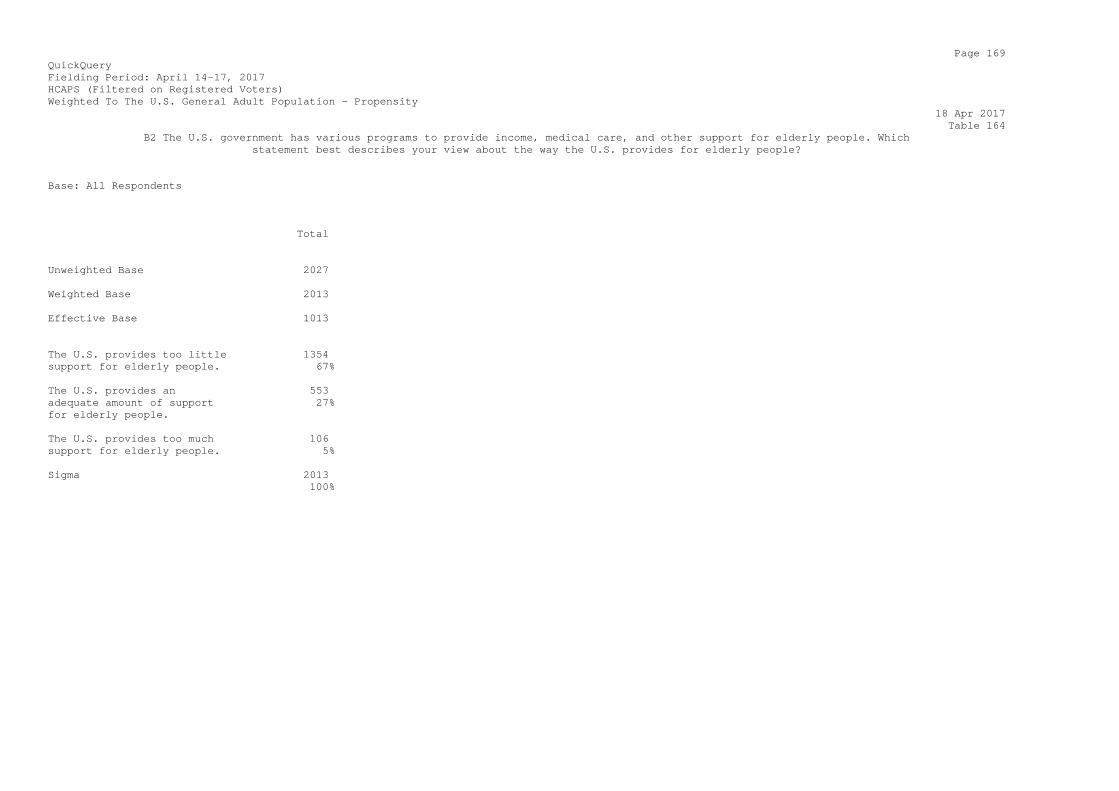
Page 169 QuickQuery Fielding Period: April 14-17, 2017 HCAPS (Filtered on Registered Voters) Weighted To The U.S. General Adult Population - Propensity 18 Apr 2017 Table 164 B2 The U.S. government has various programs to provide income, medical care, and other support for elderly people. Which statement best describes your view about the way the U.S. provides for elderly people? Base: All Respondents Total Unweighted Base 2027 Weighted Base 2013 Effective Base 1013 The U.S. provides too little 1354 support for elderly people. 67% The U.S. provides an 553 adequate amount of support 27% for elderly people. The U.S. provides too much 106 support for elderly people. 5% Sigma 2013 100%
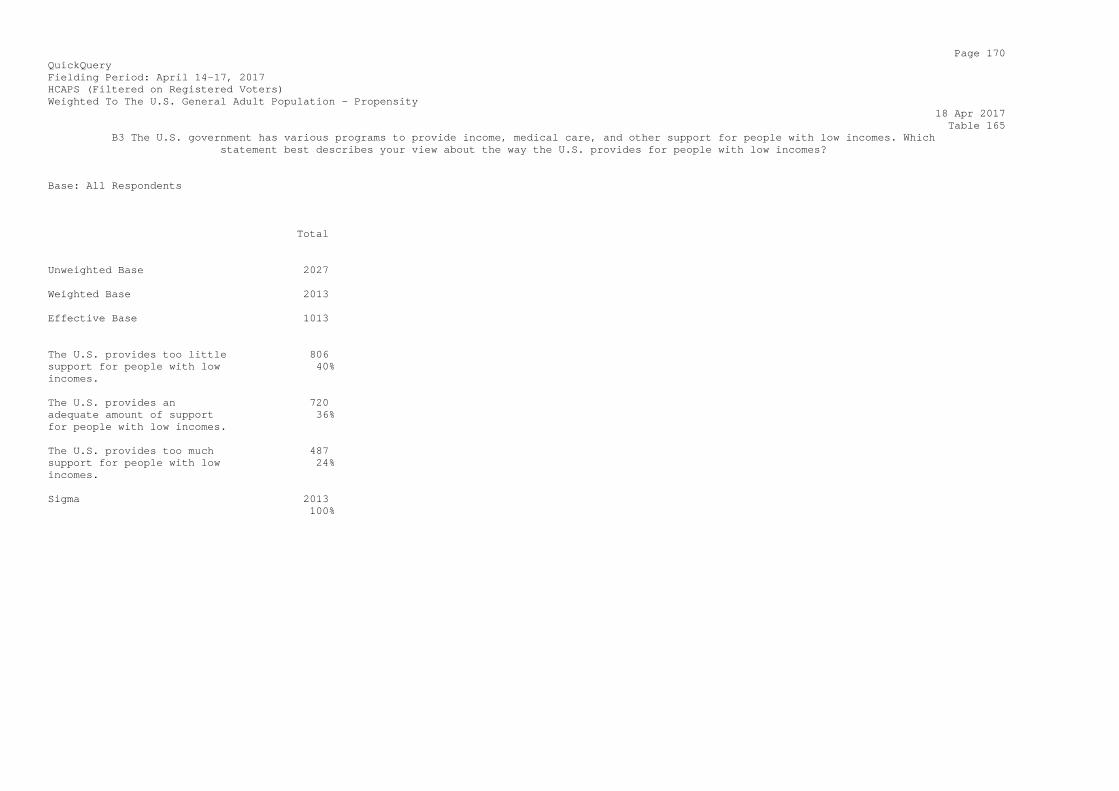
Page 170 QuickQuery Fielding Period: April 14-17, 2017 HCAPS (Filtered on Registered Voters) Weighted To The U.S. General Adult Population - Propensity 18 Apr 2017 Table 165 B3 The U.S. government has various programs to provide income, medical care, and other support for people with low incomes. Which statement best describes your view about the way the U.S. provides for people with low incomes? Base: All Respondents Total Unweighted Base 2027 Weighted Base 2013 Effective Base 1013 The U.S. provides too little 806 support for people with low 40% incomes. The U.S. provides an 720 adequate amount of support 36% for people with low incomes. The U.S. provides too much 487 support for people with low 24% incomes. Sigma 2013 100%
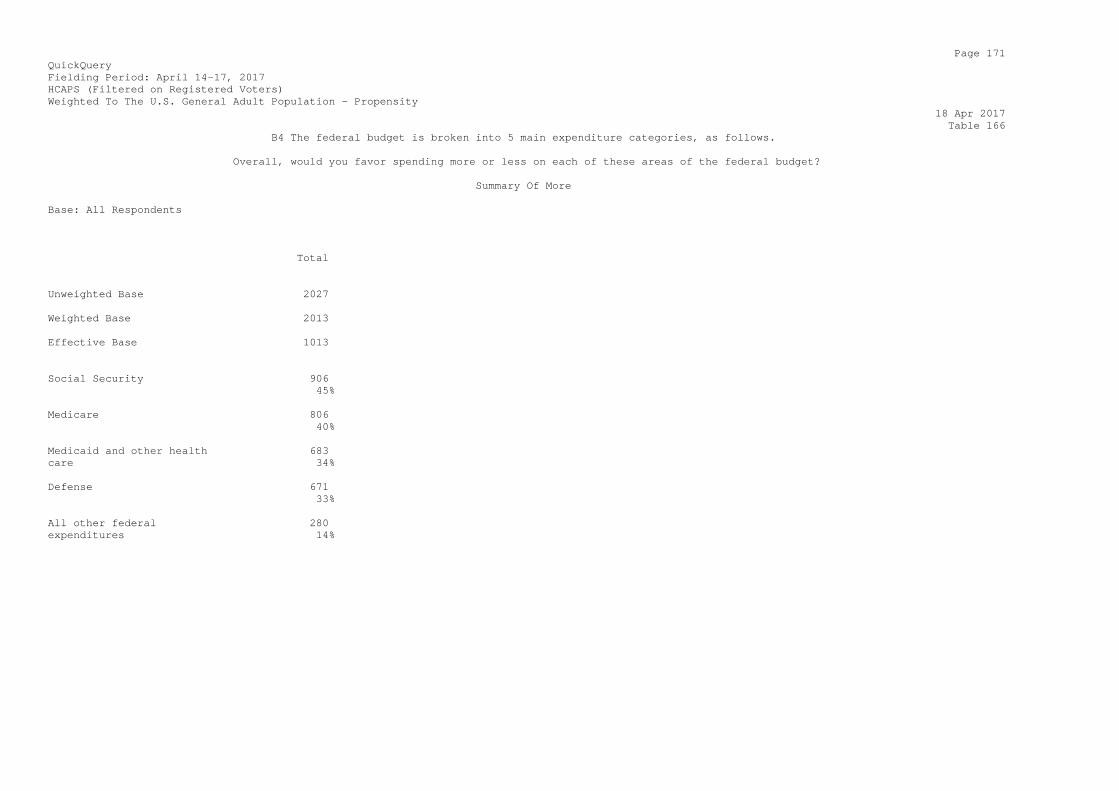
Page 171 QuickQuery Fielding Period: April 14-17, 2017 HCAPS (Filtered on Registered Voters) Weighted To The U.S. General Adult Population - Propensity 18 Apr 2017 Table 166 B4 The federal budget is broken into 5 main expenditure categories, as follows. Overall, would you favor spending more or less on each of these areas of the federal budget? Summary Of More Base: All Respondents Total Unweighted Base 2027 Weighted Base 2013 Effective Base 1013 Social Security 906 45% Medicare 806 40% Medicaid and other health 683 care 34% Defense 671 33% All other federal 280 expenditures 14%
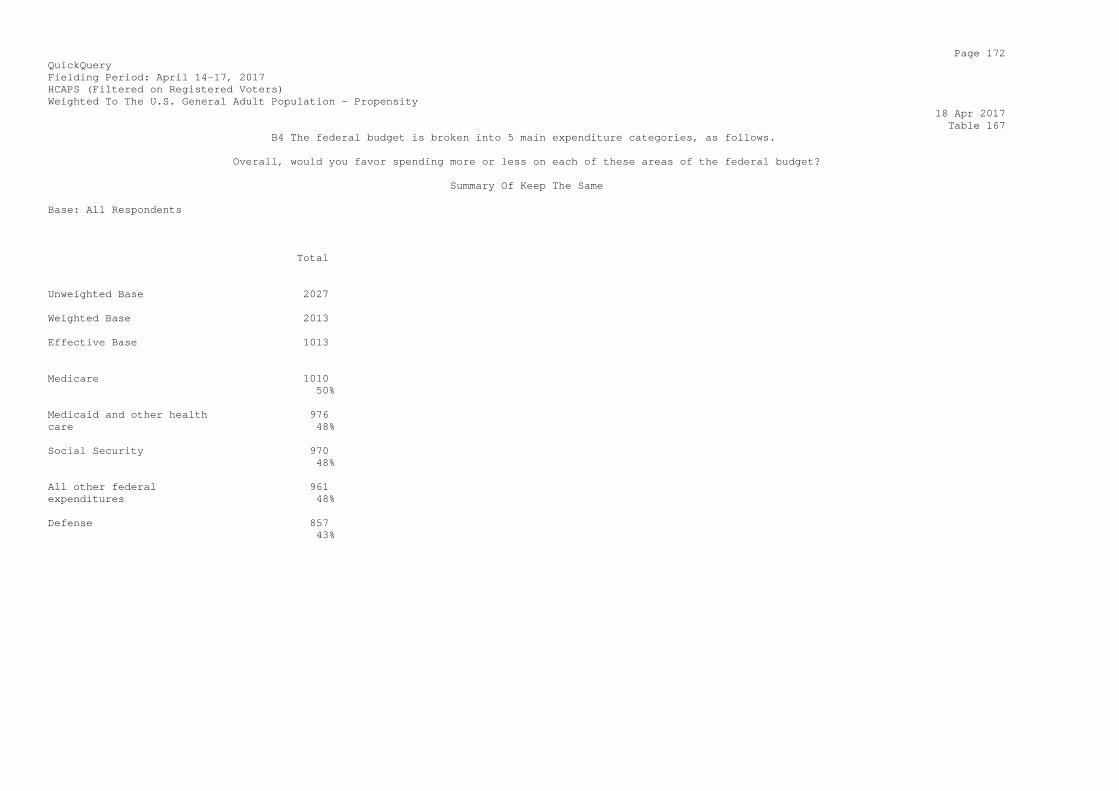
Page 172 QuickQuery Fielding Period: April 14-17, 2017 HCAPS (Filtered on Registered Voters) Weighted To The U.S. General Adult Population - Propensity 18 Apr 2017 Table 167 B4 The federal budget is broken into 5 main expenditure categories, as follows. Overall, would you favor spending more or less on each of these areas of the federal budget? Summary Of Keep The Same Base: All Respondents Total Unweighted Base 2027 Weighted Base 2013 Effective Base 1013 Medicare 1010 50% Medicaid and other health 976 care 48% Social Security 970 48% All other federal 961 expenditures 48% Defense 857 43%
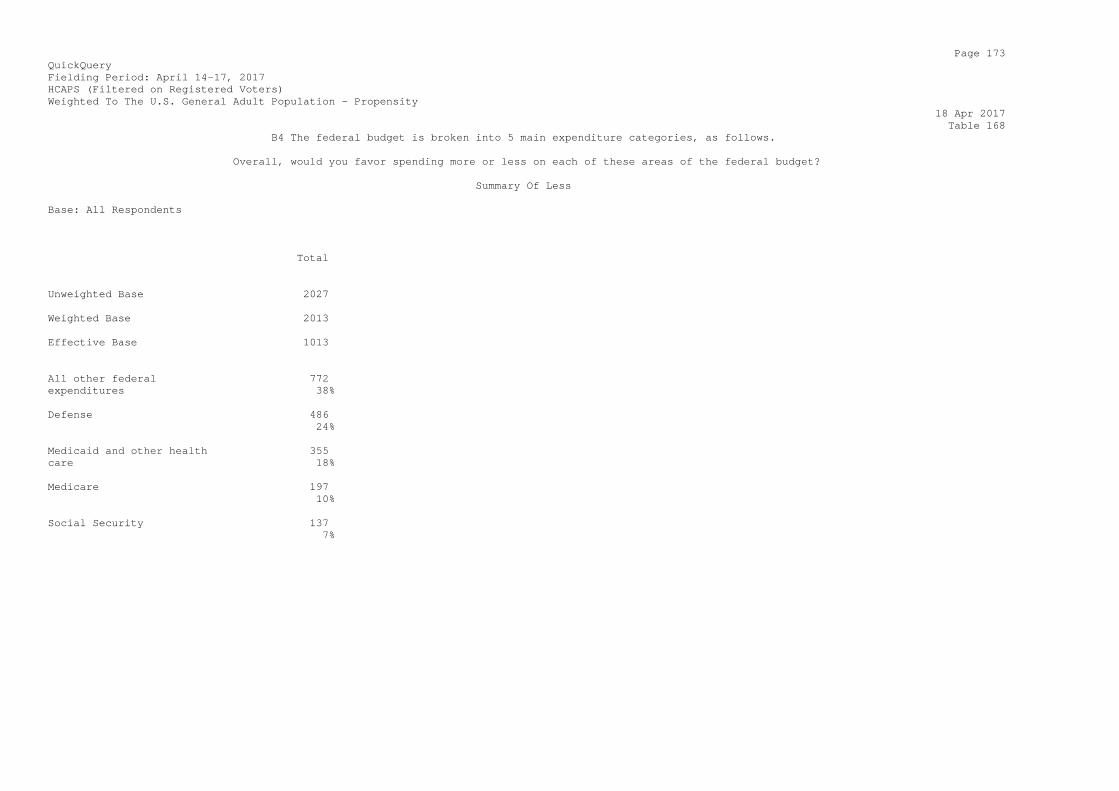
Page 173 QuickQuery Fielding Period: April 14-17, 2017 HCAPS (Filtered on Registered Voters) Weighted To The U.S. General Adult Population - Propensity 18 Apr 2017 Table 168 B4 The federal budget is broken into 5 main expenditure categories, as follows. Overall, would you favor spending more or less on each of these areas of the federal budget? Summary Of Less Base: All Respondents Total Unweighted Base 2027 Weighted Base 2013 Effective Base 1013 All other federal 772 expenditures 38% Defense 486 24% Medicaid and other health 355 care 18% Medicare 197 10% Social Security 137 7%
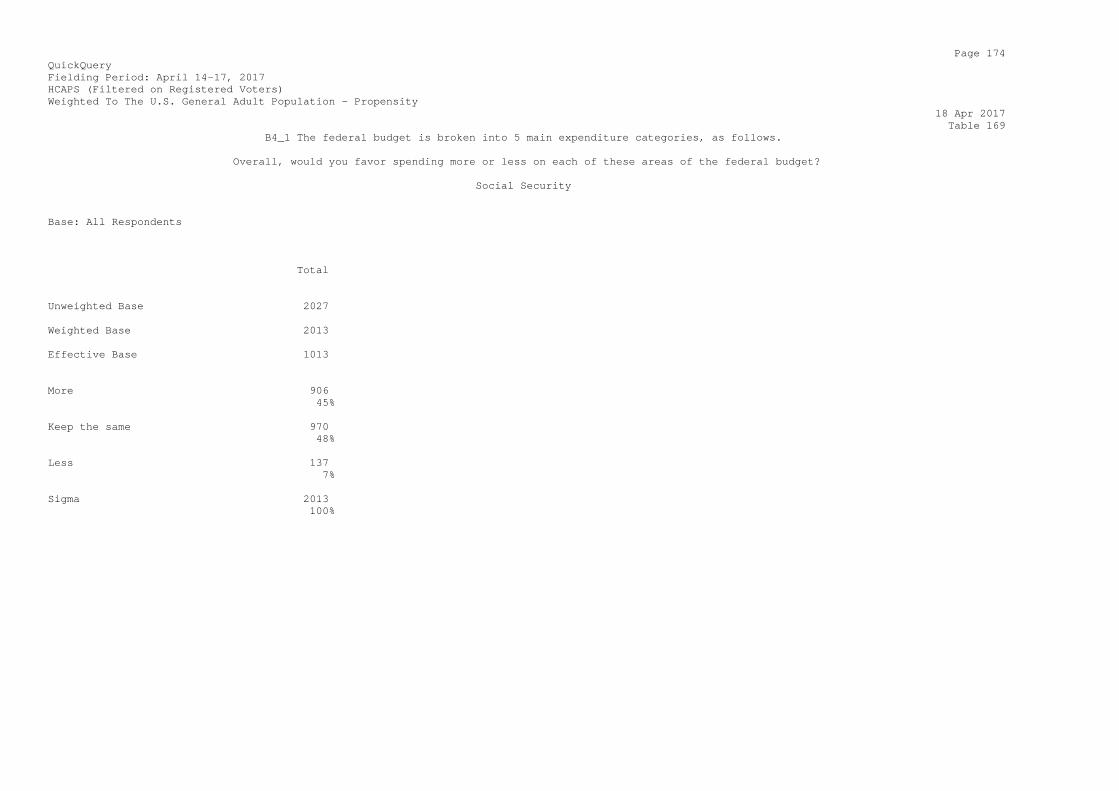
Page 174 QuickQuery Fielding Period: April 14-17, 2017 HCAPS (Filtered on Registered Voters) Weighted To The U.S. General Adult Population - Propensity 18 Apr 2017 Table 169 B4_1 The federal budget is broken into 5 main expenditure categories, as follows. Overall, would you favor spending more or less on each of these areas of the federal budget? Social Security Base: All Respondents Total Unweighted Base 2027 Weighted Base 2013 Effective Base 1013 More 906 45% Keep the same 970 48% Less 137 7% Sigma 2013 100%

Page 175 QuickQuery Fielding Period: April 14-17, 2017 HCAPS (Filtered on Registered Voters) Weighted To The U.S. General Adult Population - Propensity 18 Apr 2017 Table 170 B4_2 The federal budget is broken into 5 main expenditure categories, as follows. Overall, would you favor spending more or less on each of these areas of the federal budget? Defense Base: All Respondents Total Unweighted Base 2027 Weighted Base 2013 Effective Base 1013 More 671 33% Keep the same 857 43% Less 486 24% Sigma 2013 100%

Page 176 QuickQuery Fielding Period: April 14-17, 2017 HCAPS (Filtered on Registered Voters) Weighted To The U.S. General Adult Population - Propensity 18 Apr 2017 Table 171 B4_3 The federal budget is broken into 5 main expenditure categories, as follows. Overall, would you favor spending more or less on each of these areas of the federal budget? Medicare Base: All Respondents Total Unweighted Base 2027 Weighted Base 2013 Effective Base 1013 More 806 40% Keep the same 1010 50% Less 197 10% Sigma 2013 100%
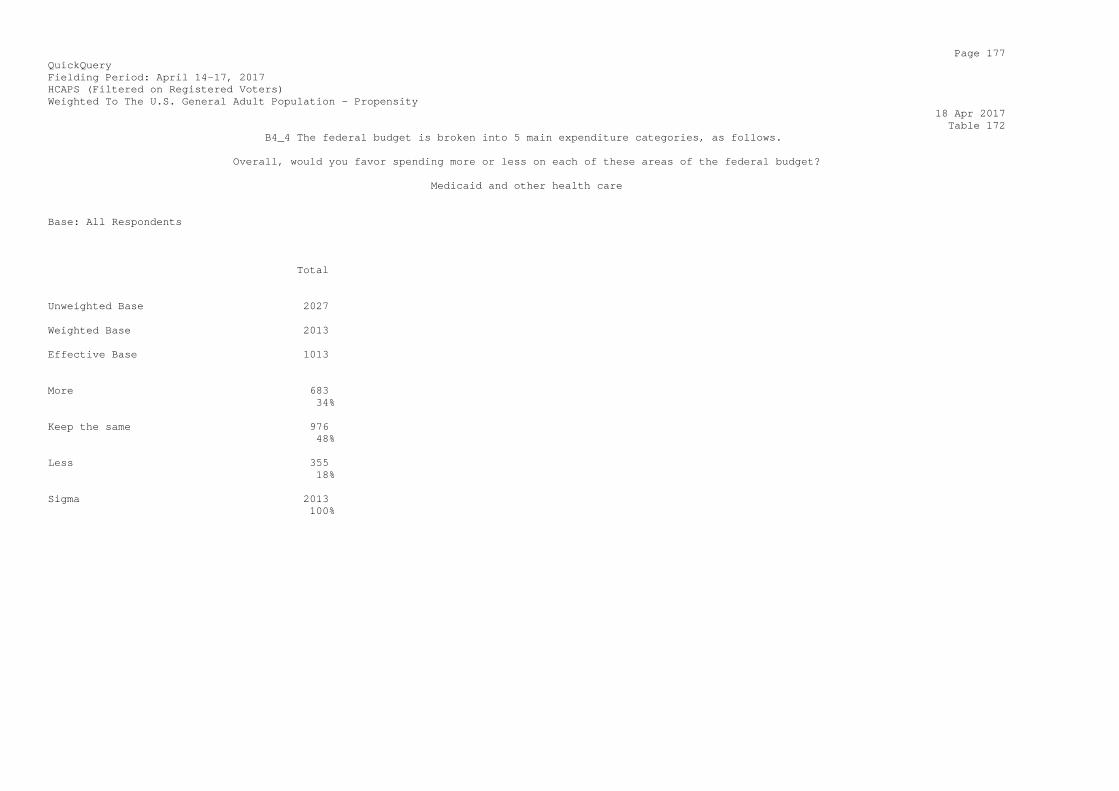
Page 177 QuickQuery Fielding Period: April 14-17, 2017 HCAPS (Filtered on Registered Voters) Weighted To The U.S. General Adult Population - Propensity 18 Apr 2017 Table 172 B4_4 The federal budget is broken into 5 main expenditure categories, as follows. Overall, would you favor spending more or less on each of these areas of the federal budget? Medicaid and other health care Base: All Respondents Total Unweighted Base 2027 Weighted Base 2013 Effective Base 1013 More 683 34% Keep the same 976 48% Less 355 18% Sigma 2013 100%
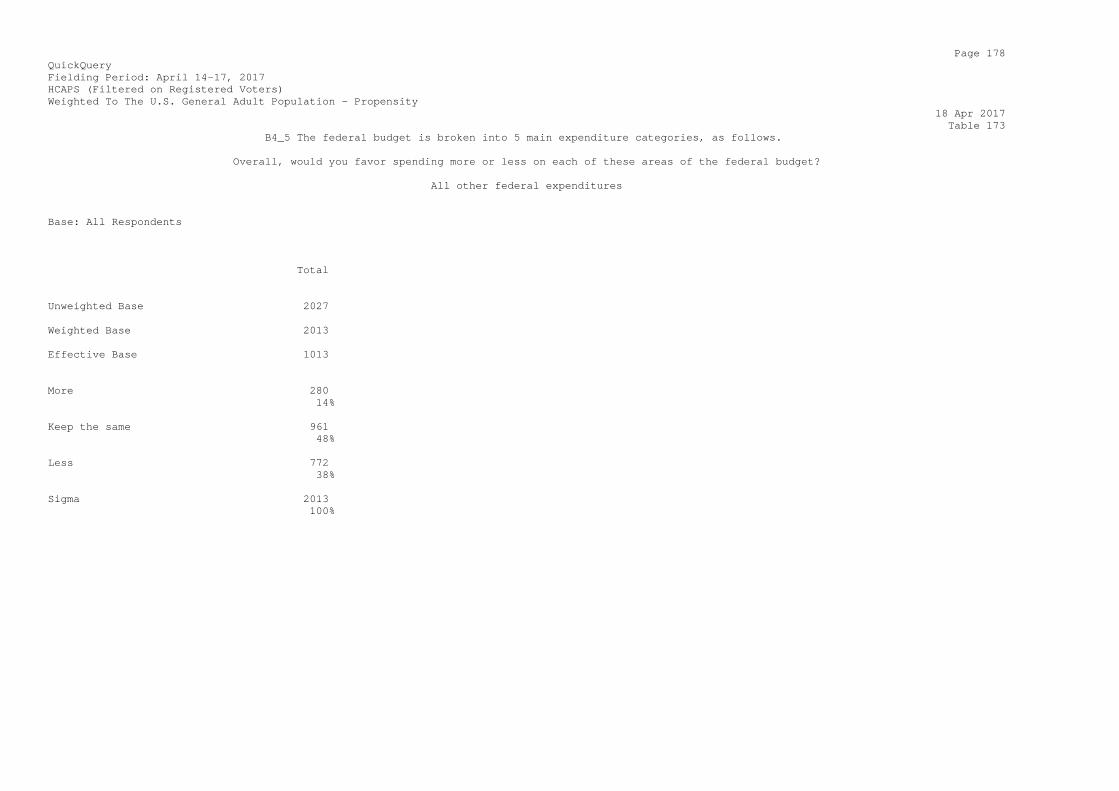
Page 178 QuickQuery Fielding Period: April 14-17, 2017 HCAPS (Filtered on Registered Voters) Weighted To The U.S. General Adult Population - Propensity 18 Apr 2017 Table 173 B4_5 The federal budget is broken into 5 main expenditure categories, as follows. Overall, would you favor spending more or less on each of these areas of the federal budget? All other federal expenditures Base: All Respondents Total Unweighted Base 2027 Weighted Base 2013 Effective Base 1013 More 280 14% Keep the same 961 48% Less 772 38% Sigma 2013 100%

Page 179 QuickQuery Fielding Period: April 14-17, 2017 HCAPS (Filtered on Registered Voters) Weighted To The U.S. General Adult Population - Propensity 18 Apr 2017 Table 174 B5 One proposal for the coming budget is to increase defense spending by 10 percent, leave Social Security and Medicare expenditures unchanged, and decrease all other expenditures by 10 percent. Do you support or oppose this proposal? Base: All Respondents Total Unweighted Base 2027 Weighted Base 2013 Effective Base 1013 Support 1057 53% Oppose 956 47% Sigma 2013 100%
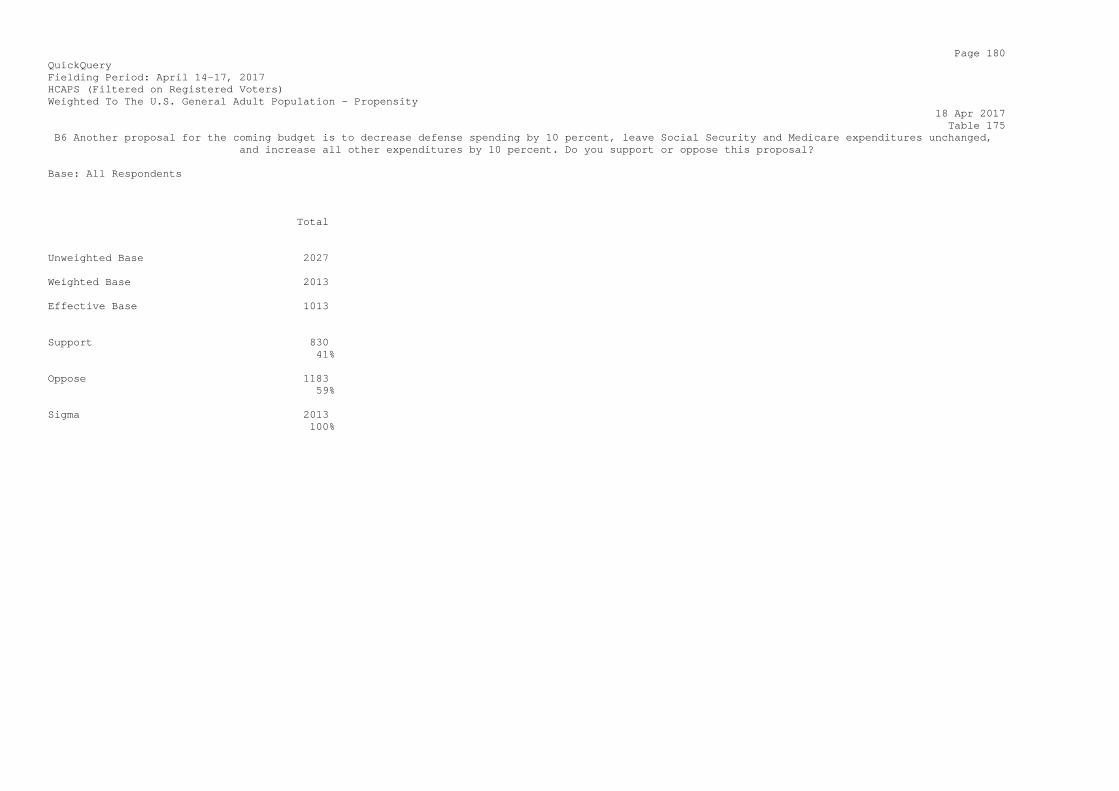
Page 180 QuickQuery Fielding Period: April 14-17, 2017 HCAPS (Filtered on Registered Voters) Weighted To The U.S. General Adult Population - Propensity 18 Apr 2017 Table 175 B6 Another proposal for the coming budget is to decrease defense spending by 10 percent, leave Social Security and Medicare expenditures unchanged, and increase all other expenditures by 10 percent. Do you support or oppose this proposal? Base: All Respondents Total Unweighted Base 2027 Weighted Base 2013 Effective Base 1013 Support 830 41% Oppose 1183 59% Sigma 2013 100%
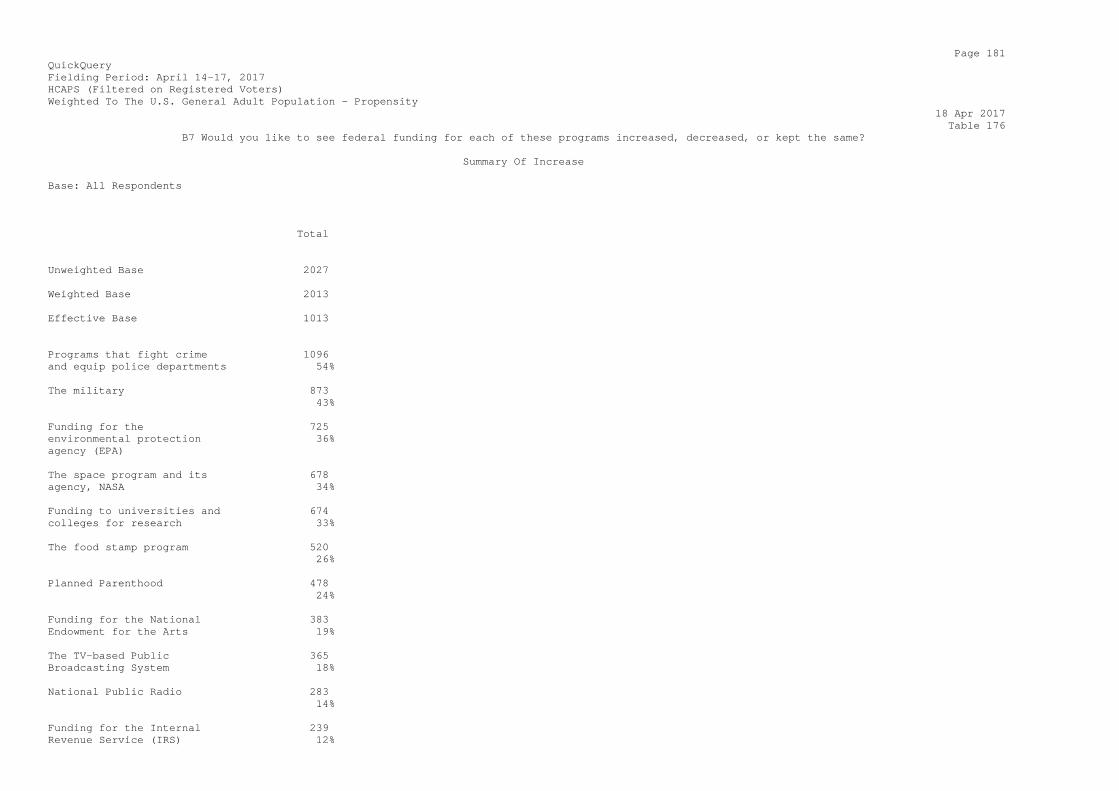
Page 181 QuickQuery Fielding Period: April 14-17, 2017 HCAPS (Filtered on Registered Voters) Weighted To The U.S. General Adult Population - Propensity 18 Apr 2017 Table 176 B7 Would you like to see federal funding for each of these programs increased, decreased, or kept the same? Summary Of Increase Base: All Respondents Total Unweighted Base 2027 Weighted Base 2013 Effective Base 1013 Programs that fight crime 1096 and equip police departments 54% The military 873 43% Funding for the 725 environmental protection 36% agency (EPA) The space program and its 678 agency, NASA 34% Funding to universities and 674 colleges for research 33% The food stamp program 520 26% Planned Parenthood 478 24% Funding for the National 383 Endowment for the Arts 19% The TV-based Public 365 Broadcasting System 18% National Public Radio 283 14% Funding for the Internal 239 Revenue Service (IRS) 12%

Foreign aid programs 220 11%
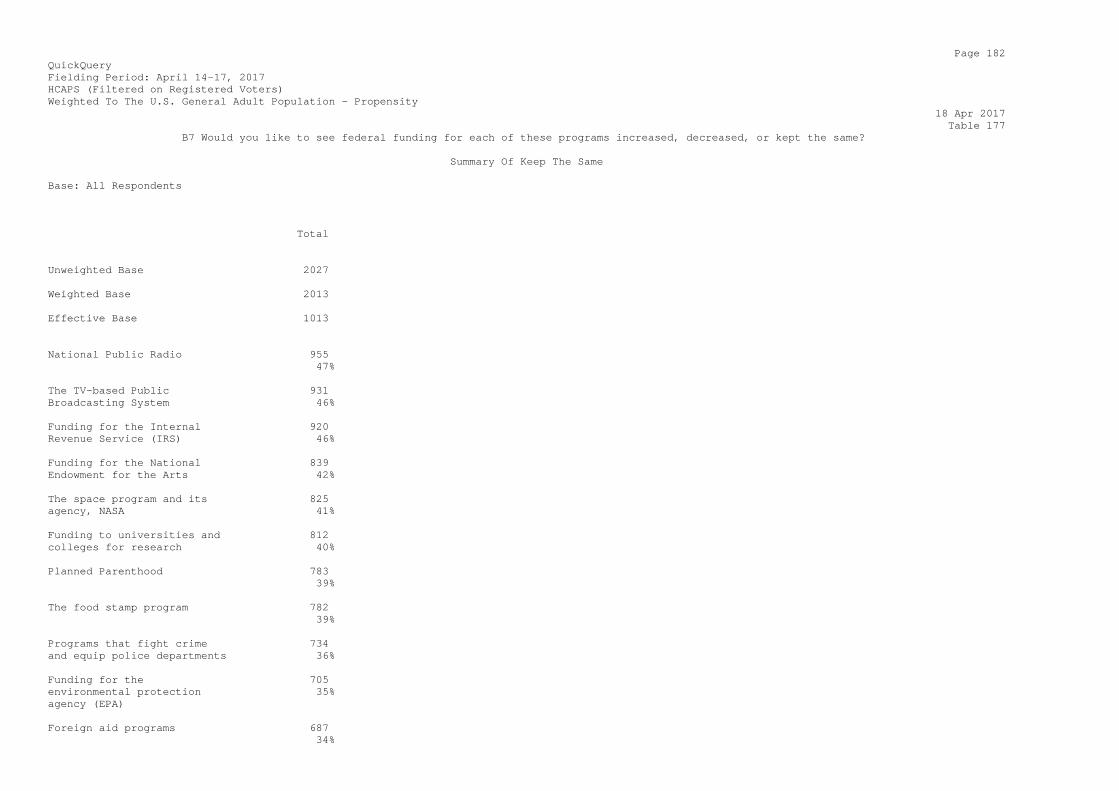
Page 182 QuickQuery Fielding Period: April 14-17, 2017 HCAPS (Filtered on Registered Voters) Weighted To The U.S. General Adult Population - Propensity 18 Apr 2017 Table 177 B7 Would you like to see federal funding for each of these programs increased, decreased, or kept the same? Summary Of Keep The Same Base: All Respondents Total Unweighted Base 2027 Weighted Base 2013 Effective Base 1013 National Public Radio 955 47% The TV-based Public 931 Broadcasting System 46% Funding for the Internal 920 Revenue Service (IRS) 46% Funding for the National 839 Endowment for the Arts 42% The space program and its 825 agency, NASA 41% Funding to universities and 812 colleges for research 40% Planned Parenthood 783 39% The food stamp program 782 39% Programs that fight crime 734 and equip police departments 36% Funding for the 705 environmental protection 35% agency (EPA) Foreign aid programs 687 34%

The military 649 32%
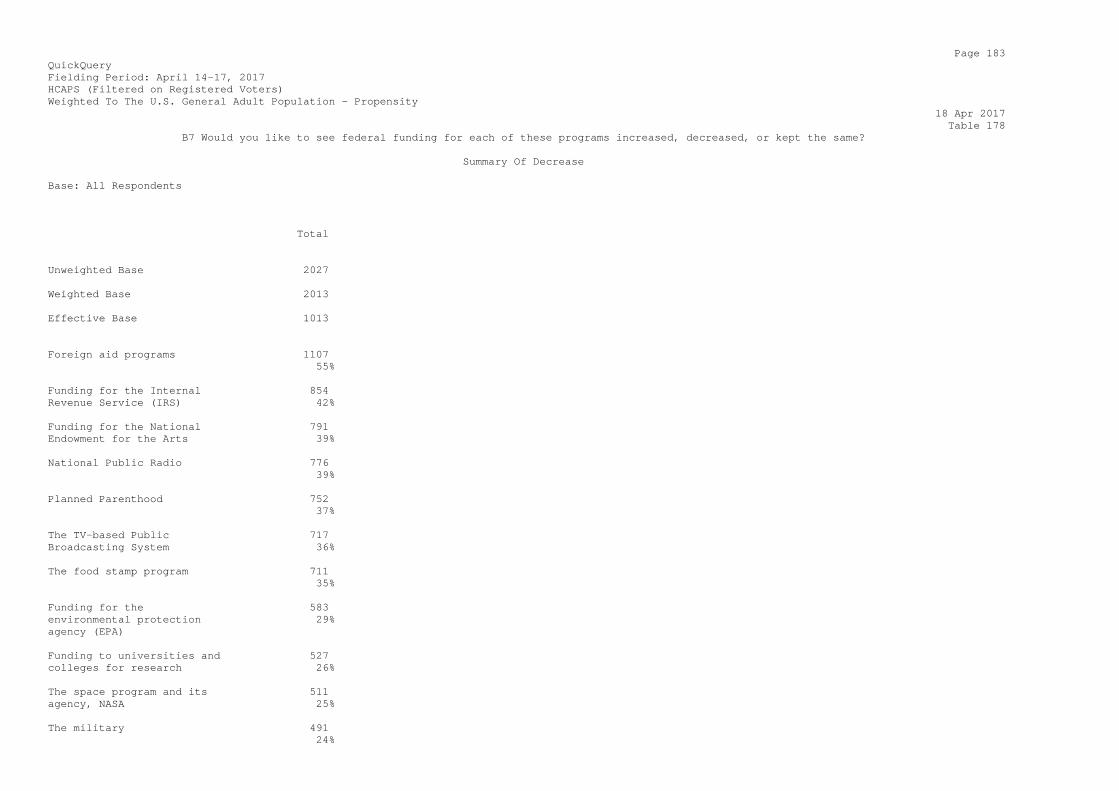
Page 183 QuickQuery Fielding Period: April 14-17, 2017 HCAPS (Filtered on Registered Voters) Weighted To The U.S. General Adult Population - Propensity 18 Apr 2017 Table 178 B7 Would you like to see federal funding for each of these programs increased, decreased, or kept the same? Summary Of Decrease Base: All Respondents Total Unweighted Base 2027 Weighted Base 2013 Effective Base 1013 Foreign aid programs 1107 55% Funding for the Internal 854 Revenue Service (IRS) 42% Funding for the National 791 Endowment for the Arts 39% National Public Radio 776 39% Planned Parenthood 752 37% The TV-based Public 717 Broadcasting System 36% The food stamp program 711 35% Funding for the 583 environmental protection 29% agency (EPA) Funding to universities and 527 colleges for research 26% The space program and its 511 agency, NASA 25% The military 491 24%

Programs that fight crime 184 and equip police departments 9%
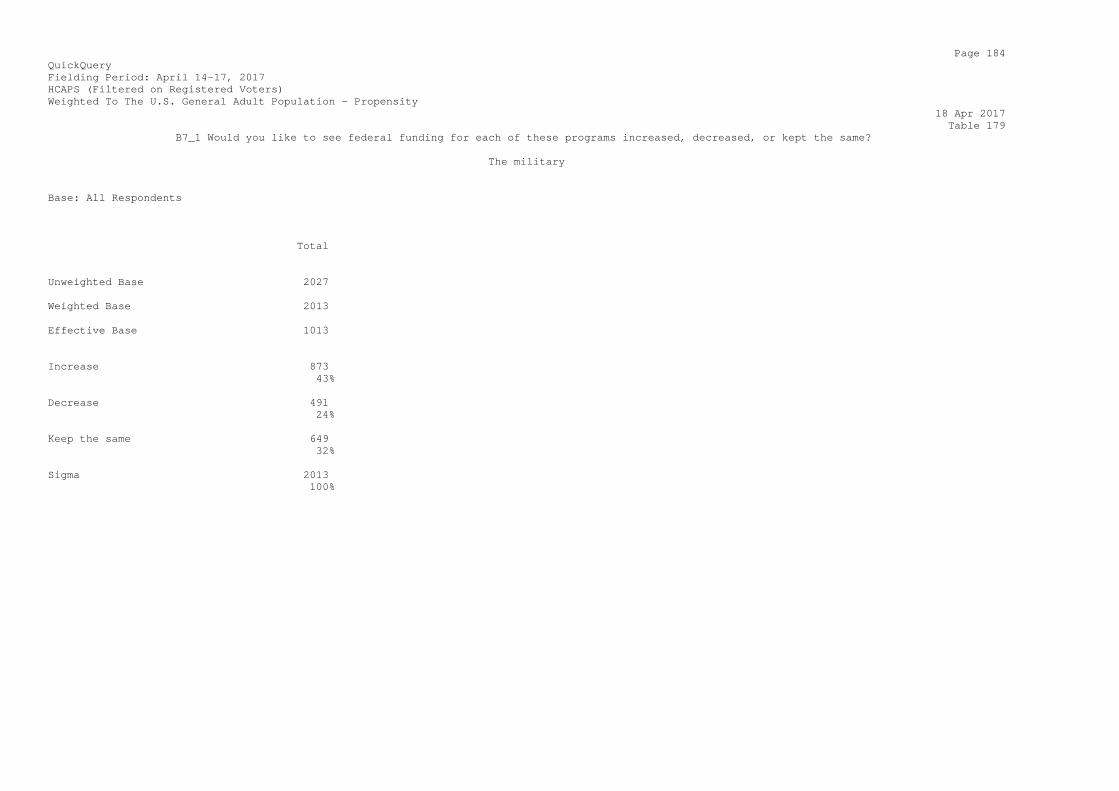
Page 184 QuickQuery Fielding Period: April 14-17, 2017 HCAPS (Filtered on Registered Voters) Weighted To The U.S. General Adult Population - Propensity 18 Apr 2017 Table 179 B7_1 Would you like to see federal funding for each of these programs increased, decreased, or kept the same? The military Base: All Respondents Total Unweighted Base 2027 Weighted Base 2013 Effective Base 1013 Increase 873 43% Decrease 491 24% Keep the same 649 32% Sigma 2013 100%
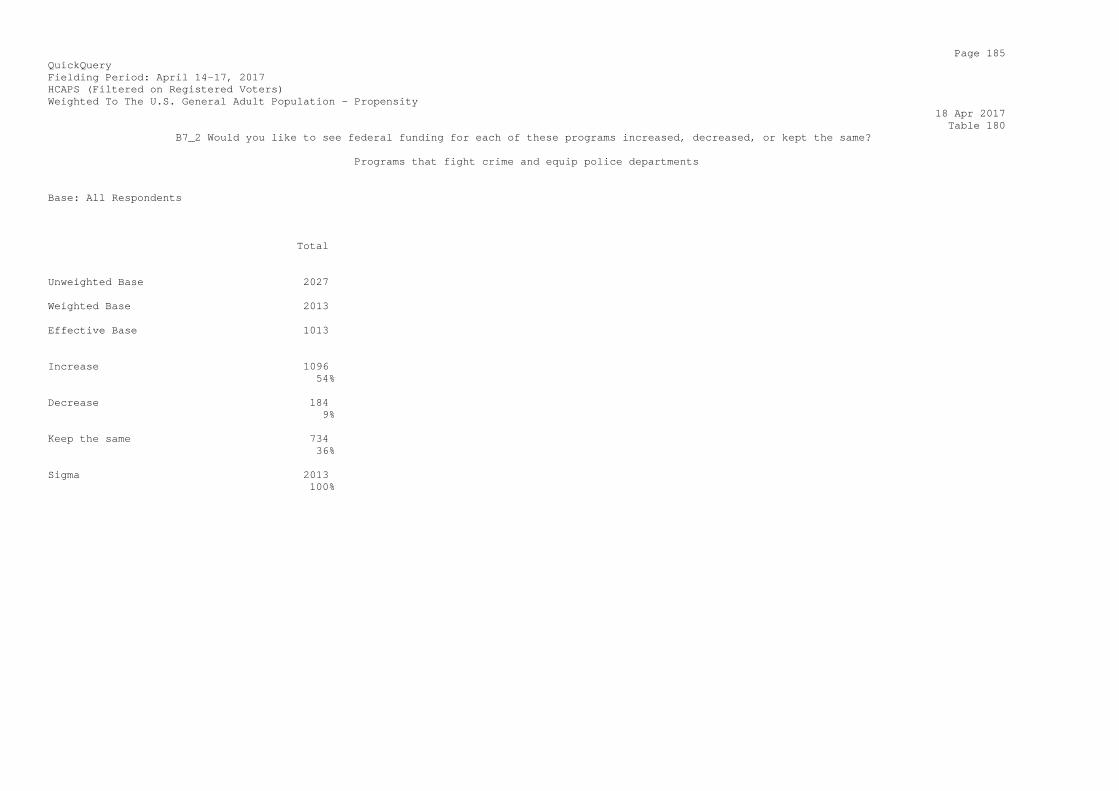
Page 185 QuickQuery Fielding Period: April 14-17, 2017 HCAPS (Filtered on Registered Voters) Weighted To The U.S. General Adult Population - Propensity 18 Apr 2017 Table 180 B7_2 Would you like to see federal funding for each of these programs increased, decreased, or kept the same? Programs that fight crime and equip police departments Base: All Respondents Total Unweighted Base 2027 Weighted Base 2013 Effective Base 1013 Increase 1096 54% Decrease 184 9% Keep the same 734 36% Sigma 2013 100%

Page 186 QuickQuery Fielding Period: April 14-17, 2017 HCAPS (Filtered on Registered Voters) Weighted To The U.S. General Adult Population - Propensity 18 Apr 2017 Table 181 B7_3 Would you like to see federal funding for each of these programs increased, decreased, or kept the same? Planned Parenthood Base: All Respondents Total Unweighted Base 2027 Weighted Base 2013 Effective Base 1013 Increase 478 24% Decrease 752 37% Keep the same 783 39% Sigma 2013 100%

Page 187 QuickQuery Fielding Period: April 14-17, 2017 HCAPS (Filtered on Registered Voters) Weighted To The U.S. General Adult Population - Propensity 18 Apr 2017 Table 182 B7_4 Would you like to see federal funding for each of these programs increased, decreased, or kept the same? The TV-based Public Broadcasting System Base: All Respondents Total Unweighted Base 2027 Weighted Base 2013 Effective Base 1013 Increase 365 18% Decrease 717 36% Keep the same 931 46% Sigma 2013 100%

Page 188 QuickQuery Fielding Period: April 14-17, 2017 HCAPS (Filtered on Registered Voters) Weighted To The U.S. General Adult Population - Propensity 18 Apr 2017 Table 183 B7_5 Would you like to see federal funding for each of these programs increased, decreased, or kept the same? National Public Radio Base: All Respondents Total Unweighted Base 2027 Weighted Base 2013 Effective Base 1013 Increase 283 14% Decrease 776 39% Keep the same 955 47% Sigma 2013 100%

Page 189 QuickQuery Fielding Period: April 14-17, 2017 HCAPS (Filtered on Registered Voters) Weighted To The U.S. General Adult Population - Propensity 18 Apr 2017 Table 184 B7_6 Would you like to see federal funding for each of these programs increased, decreased, or kept the same? Funding to universities and colleges for research Base: All Respondents Total Unweighted Base 2027 Weighted Base 2013 Effective Base 1013 Increase 674 33% Decrease 527 26% Keep the same 812 40% Sigma 2013 100%

Page 190 QuickQuery Fielding Period: April 14-17, 2017 HCAPS (Filtered on Registered Voters) Weighted To The U.S. General Adult Population - Propensity 18 Apr 2017 Table 185 B7_7 Would you like to see federal funding for each of these programs increased, decreased, or kept the same? Funding for the National Endowment for the Arts Base: All Respondents Total Unweighted Base 2027 Weighted Base 2013 Effective Base 1013 Increase 383 19% Decrease 791 39% Keep the same 839 42% Sigma 2013 100%

Page 191 QuickQuery Fielding Period: April 14-17, 2017 HCAPS (Filtered on Registered Voters) Weighted To The U.S. General Adult Population - Propensity 18 Apr 2017 Table 186 B7_8 Would you like to see federal funding for each of these programs increased, decreased, or kept the same? Funding for the Internal Revenue Service (IRS) Base: All Respondents Total Unweighted Base 2027 Weighted Base 2013 Effective Base 1013 Increase 239 12% Decrease 854 42% Keep the same 920 46% Sigma 2013 100%

Page 192 QuickQuery Fielding Period: April 14-17, 2017 HCAPS (Filtered on Registered Voters) Weighted To The U.S. General Adult Population - Propensity 18 Apr 2017 Table 187 B7_9 Would you like to see federal funding for each of these programs increased, decreased, or kept the same? Funding for the environmental protection agency (EPA) Base: All Respondents Total Unweighted Base 2027 Weighted Base 2013 Effective Base 1013 Increase 725 36% Decrease 583 29% Keep the same 705 35% Sigma 2013 100%
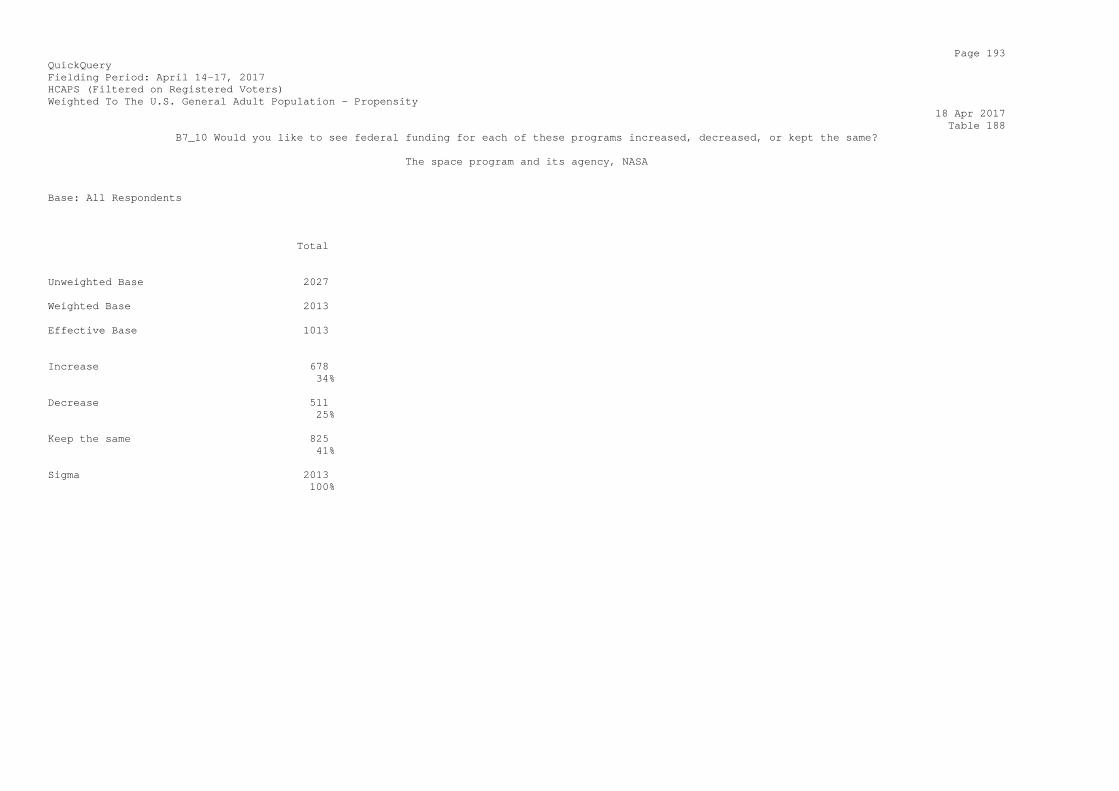
Page 193 QuickQuery Fielding Period: April 14-17, 2017 HCAPS (Filtered on Registered Voters) Weighted To The U.S. General Adult Population - Propensity 18 Apr 2017 Table 188 B7_10 Would you like to see federal funding for each of these programs increased, decreased, or kept the same? The space program and its agency, NASA Base: All Respondents Total Unweighted Base 2027 Weighted Base 2013 Effective Base 1013 Increase 678 34% Decrease 511 25% Keep the same 825 41% Sigma 2013 100%
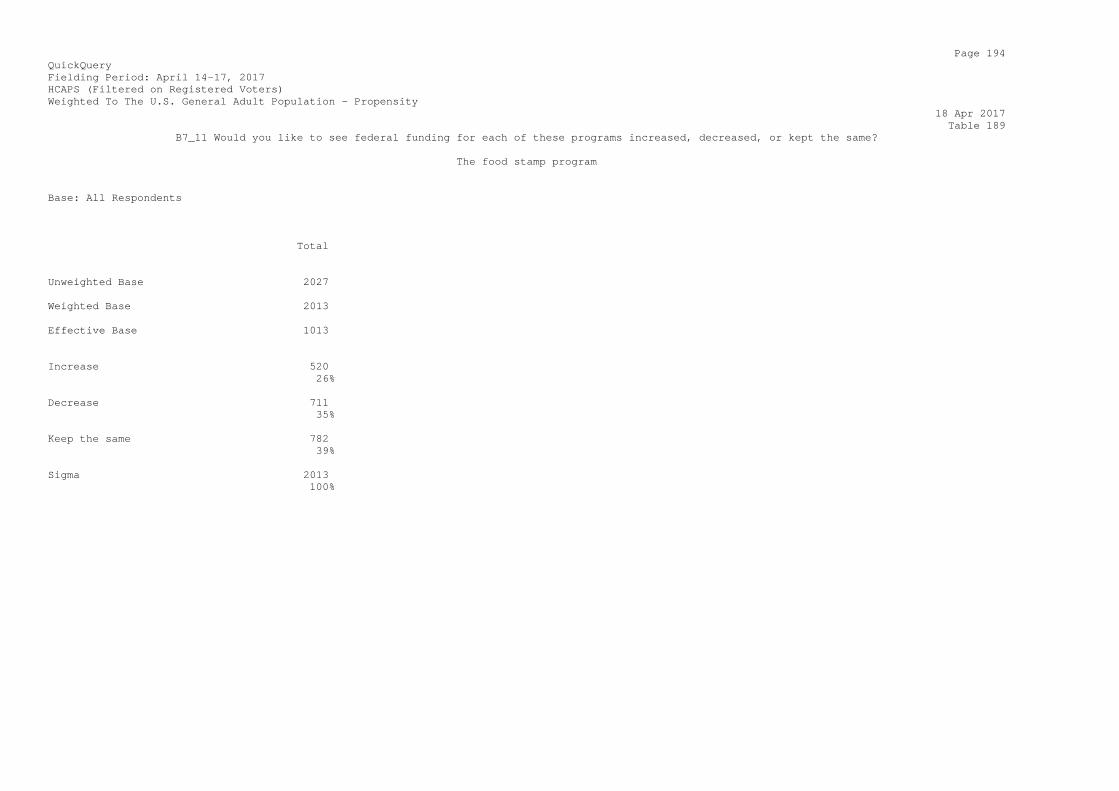
Page 194 QuickQuery Fielding Period: April 14-17, 2017 HCAPS (Filtered on Registered Voters) Weighted To The U.S. General Adult Population - Propensity 18 Apr 2017 Table 189 B7_11 Would you like to see federal funding for each of these programs increased, decreased, or kept the same? The food stamp program Base: All Respondents Total Unweighted Base 2027 Weighted Base 2013 Effective Base 1013 Increase 520 26% Decrease 711 35% Keep the same 782 39% Sigma 2013 100%
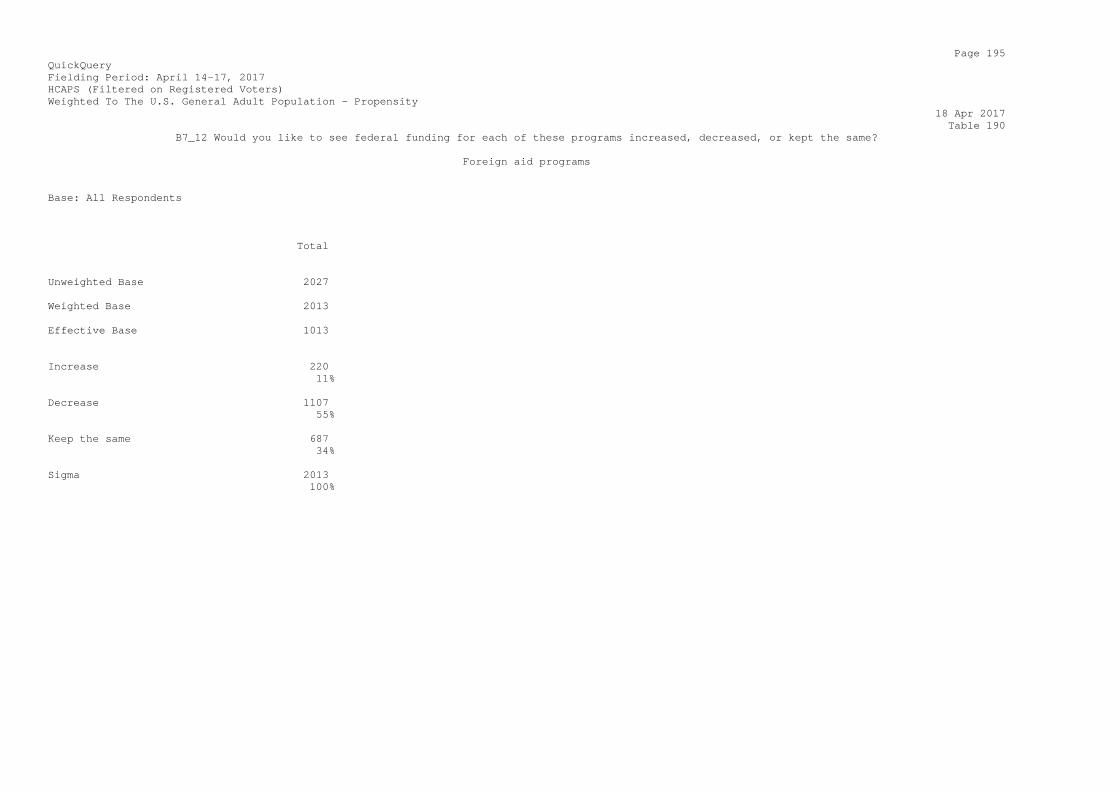
Page 195 QuickQuery Fielding Period: April 14-17, 2017 HCAPS (Filtered on Registered Voters) Weighted To The U.S. General Adult Population - Propensity 18 Apr 2017 Table 190 B7_12 Would you like to see federal funding for each of these programs increased, decreased, or kept the same? Foreign aid programs Base: All Respondents Total Unweighted Base 2027 Weighted Base 2013 Effective Base 1013 Increase 220 11% Decrease 1107 55% Keep the same 687 34% Sigma 2013 100%
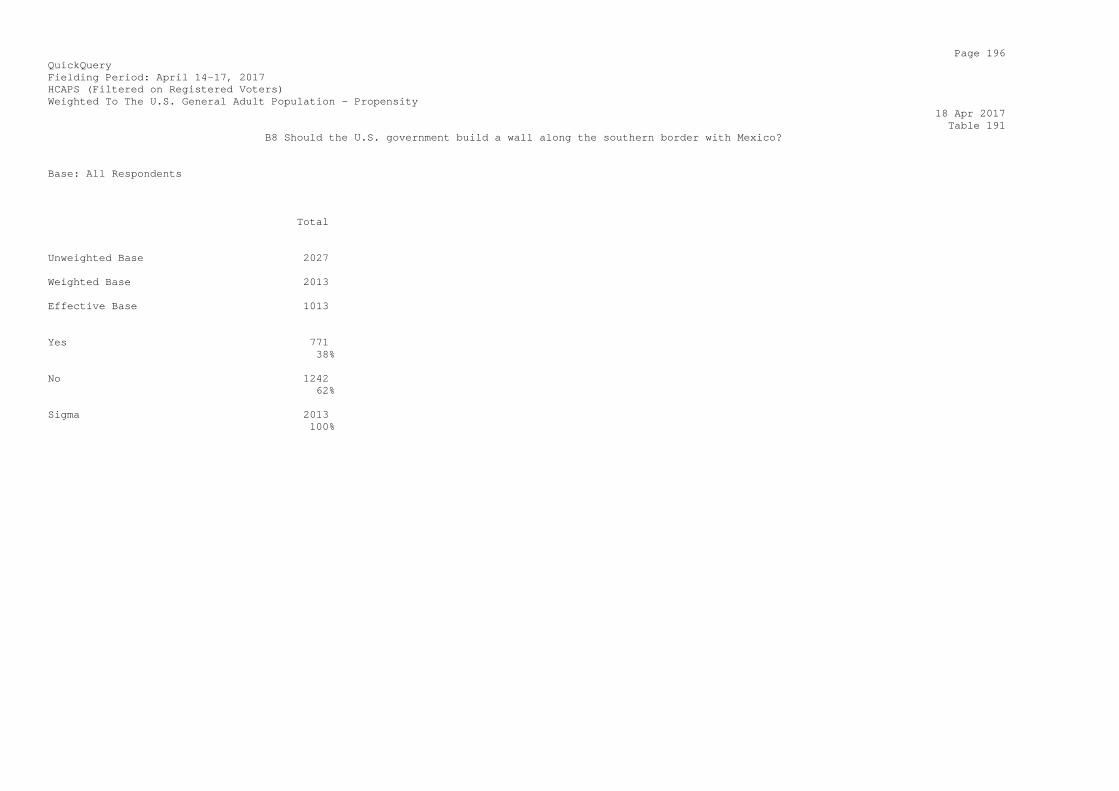
Page 196 QuickQuery Fielding Period: April 14-17, 2017 HCAPS (Filtered on Registered Voters) Weighted To The U.S. General Adult Population - Propensity 18 Apr 2017 Table 191 B8 Should the U.S. government build a wall along the southern border with Mexico? Base: All Respondents Total Unweighted Base 2027 Weighted Base 2013 Effective Base 1013 Yes 771 38% No 1242 62% Sigma 2013 100%
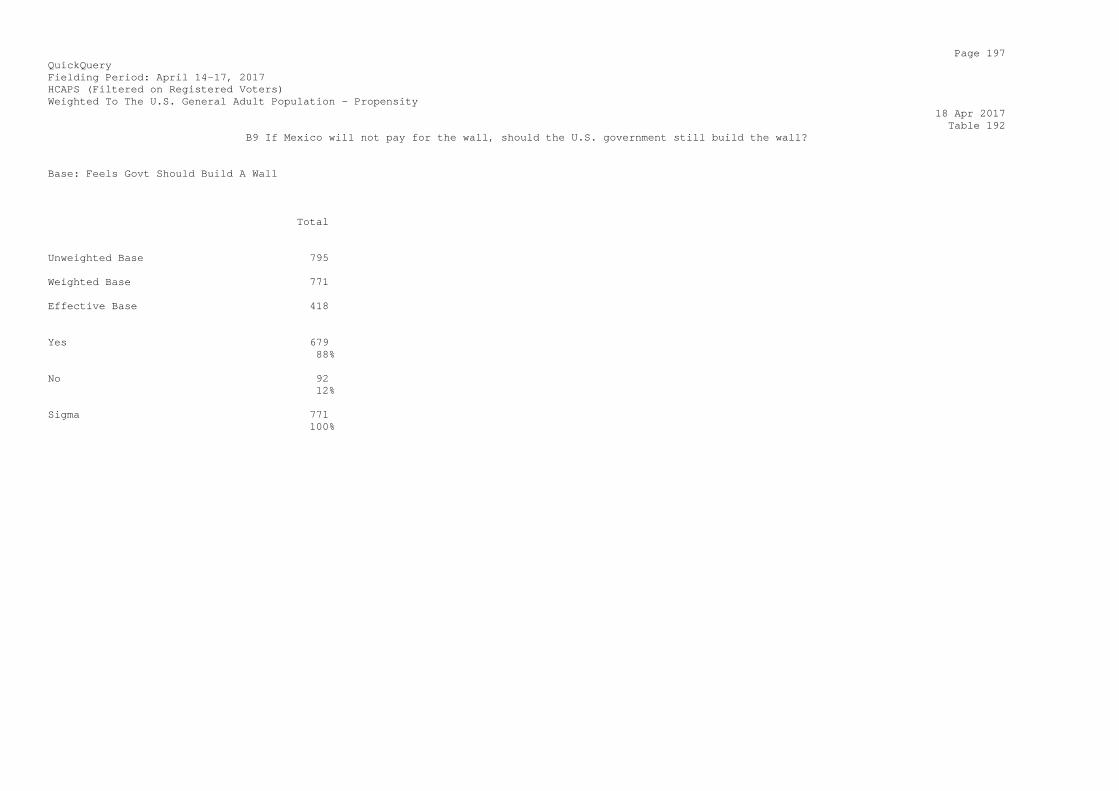
Page 197 QuickQuery Fielding Period: April 14-17, 2017 HCAPS (Filtered on Registered Voters) Weighted To The U.S. General Adult Population - Propensity 18 Apr 2017 Table 192 B9 If Mexico will not pay for the wall, should the U.S. government still build the wall? Base: Feels Govt Should Build A Wall Total Unweighted Base 795 Weighted Base 771 Effective Base 418 Yes 679 88% No 92 12% Sigma 771 100%
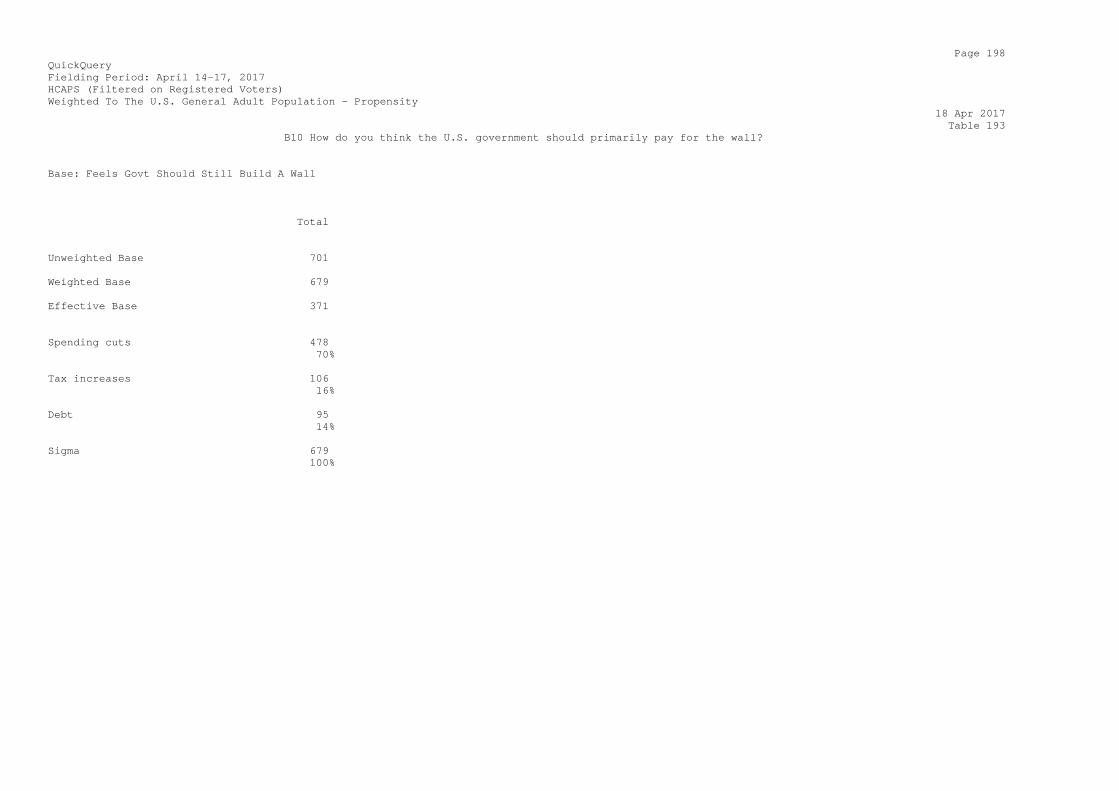
Page 198 QuickQuery Fielding Period: April 14-17, 2017 HCAPS (Filtered on Registered Voters) Weighted To The U.S. General Adult Population - Propensity 18 Apr 2017 Table 193 B10 How do you think the U.S. government should primarily pay for the wall? Base: Feels Govt Should Still Build A Wall Total Unweighted Base 701 Weighted Base 679 Effective Base 371 Spending cuts 478 70% Tax increases 106 16% Debt 95 14% Sigma 679 100%
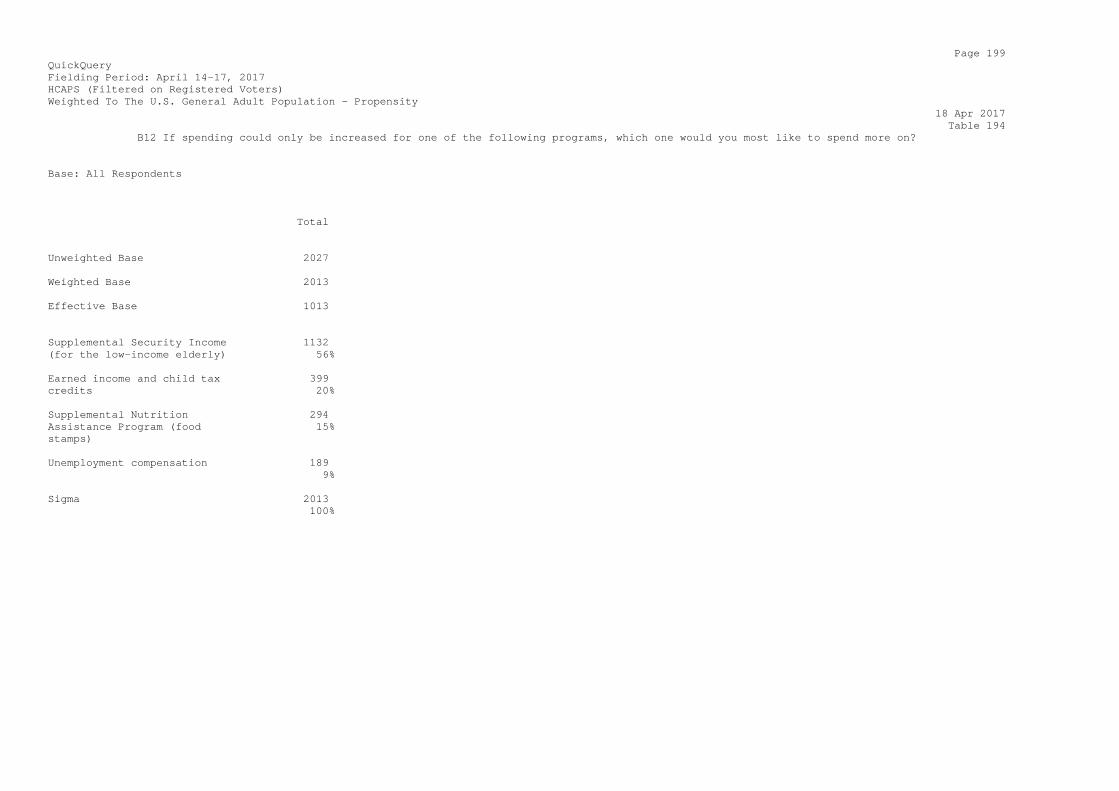
Page 199 QuickQuery Fielding Period: April 14-17, 2017 HCAPS (Filtered on Registered Voters) Weighted To The U.S. General Adult Population - Propensity 18 Apr 2017 Table 194 B12 If spending could only be increased for one of the following programs, which one would you most like to spend more on? Base: All Respondents Total Unweighted Base 2027 Weighted Base 2013 Effective Base 1013 Supplemental Security Income 1132 (for the low-income elderly) 56% Earned income and child tax 399 credits 20% Supplemental Nutrition 294 Assistance Program (food 15% stamps) Unemployment compensation 189 9% Sigma 2013 100%
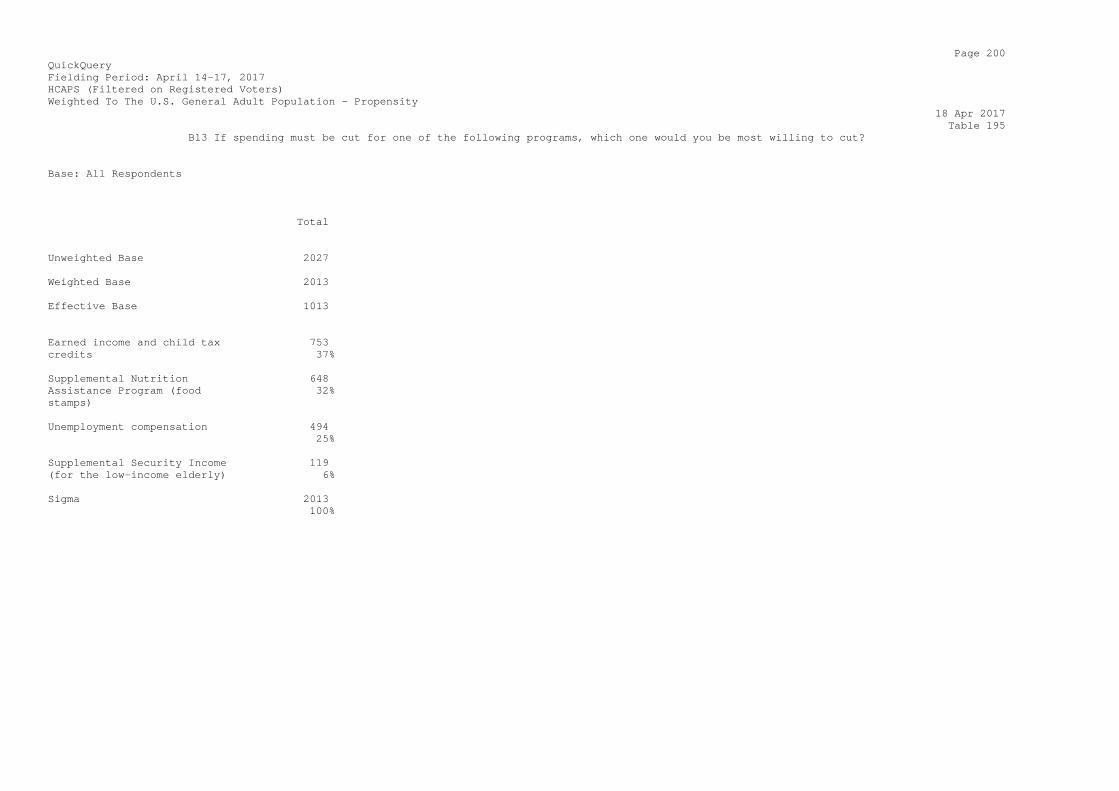
Page 200 QuickQuery Fielding Period: April 14-17, 2017 HCAPS (Filtered on Registered Voters) Weighted To The U.S. General Adult Population - Propensity 18 Apr 2017 Table 195 B13 If spending must be cut for one of the following programs, which one would you be most willing to cut? Base: All Respondents Total Unweighted Base 2027 Weighted Base 2013 Effective Base 1013 Earned income and child tax 753 credits 37% Supplemental Nutrition 648 Assistance Program (food 32% stamps) Unemployment compensation 494 25% Supplemental Security Income 119 (for the low-income elderly) 6% Sigma 2013 100%
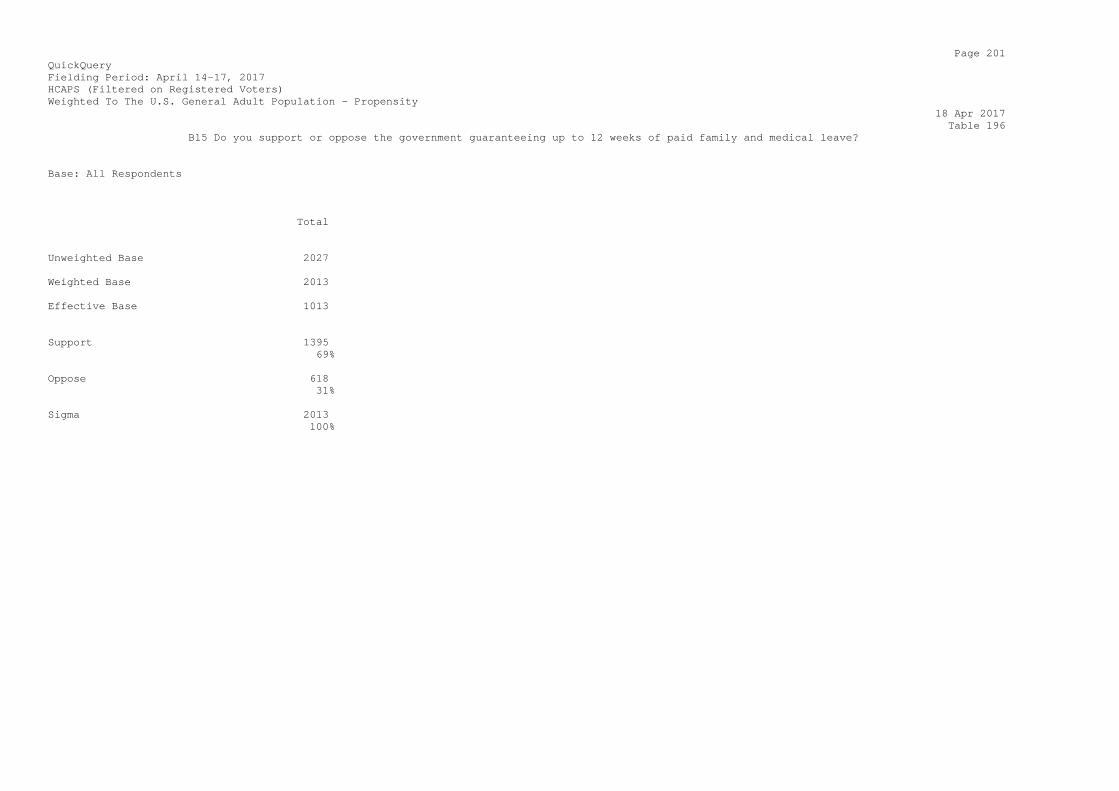
Page 201 QuickQuery Fielding Period: April 14-17, 2017 HCAPS (Filtered on Registered Voters) Weighted To The U.S. General Adult Population - Propensity 18 Apr 2017 Table 196 B15 Do you support or oppose the government guaranteeing up to 12 weeks of paid family and medical leave? Base: All Respondents Total Unweighted Base 2027 Weighted Base 2013 Effective Base 1013 Support 1395 69% Oppose 618 31% Sigma 2013 100%
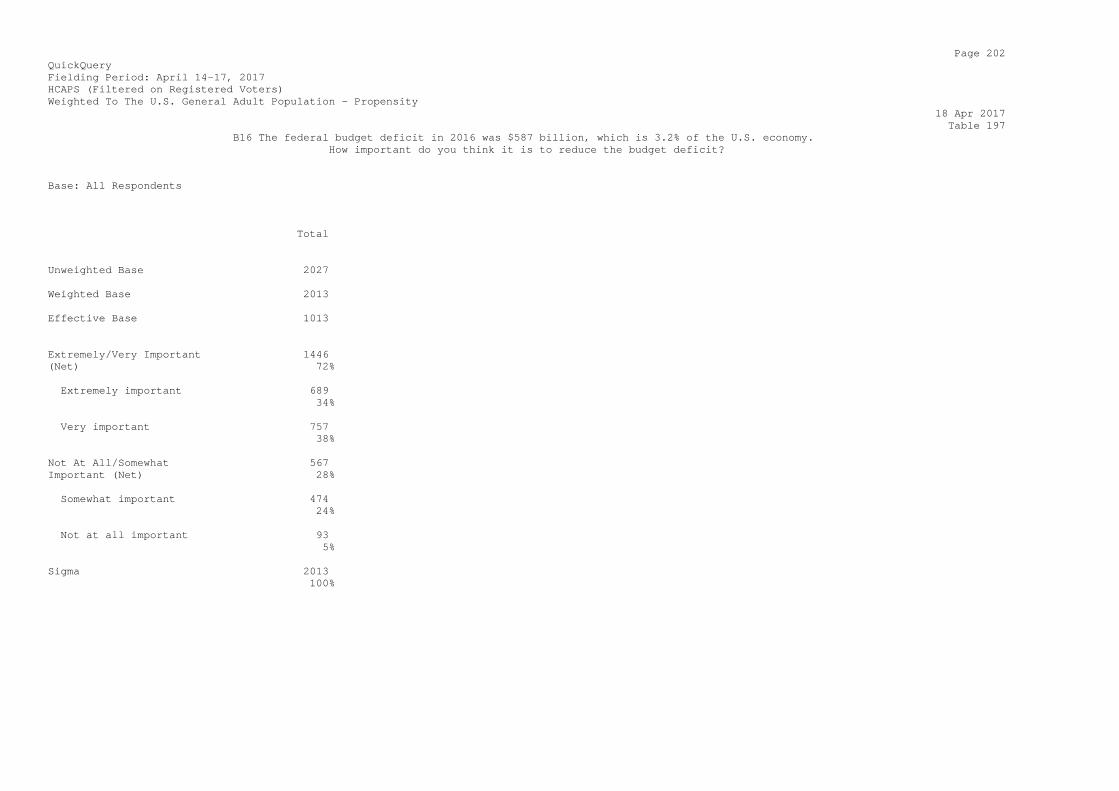
Page 202 QuickQuery Fielding Period: April 14-17, 2017 HCAPS (Filtered on Registered Voters) Weighted To The U.S. General Adult Population - Propensity 18 Apr 2017 Table 197 B16 The federal budget deficit in 2016 was $587 billion, which is 3.2% of the U.S. economy. How important do you think it is to reduce the budget deficit? Base: All Respondents Total Unweighted Base 2027 Weighted Base 2013 Effective Base 1013 Extremely/Very Important 1446 (Net) 72% Extremely important 689 34% Very important 757 38% Not At All/Somewhat 567 Important (Net) 28% Somewhat important 474 24% Not at all important 93 5% Sigma 2013 100%
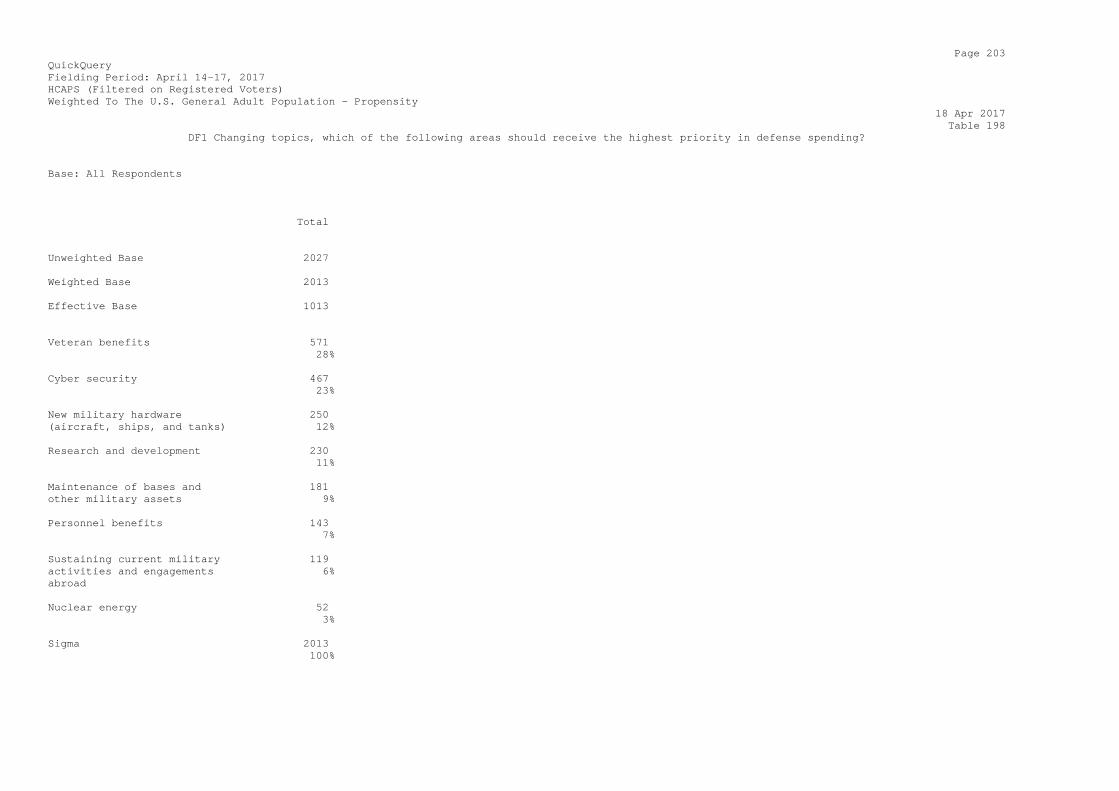
Page 203 QuickQuery Fielding Period: April 14-17, 2017 HCAPS (Filtered on Registered Voters) Weighted To The U.S. General Adult Population - Propensity 18 Apr 2017 Table 198 DF1 Changing topics, which of the following areas should receive the highest priority in defense spending? Base: All Respondents Total Unweighted Base 2027 Weighted Base 2013 Effective Base 1013 Veteran benefits 571 28% Cyber security 467 23% New military hardware 250 (aircraft, ships, and tanks) 12% Research and development 230 11% Maintenance of bases and 181 other military assets 9% Personnel benefits 143 7% Sustaining current military 119 activities and engagements 6% abroad Nuclear energy 52 3% Sigma 2013 100%
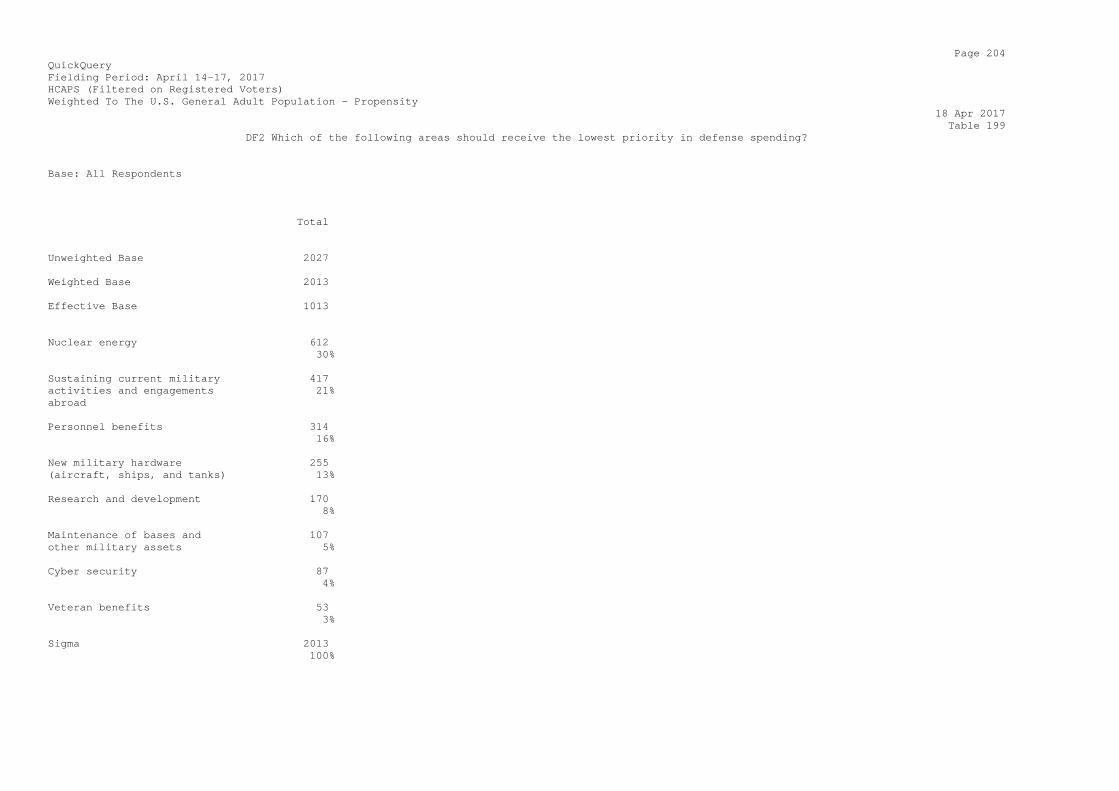
Page 204 QuickQuery Fielding Period: April 14-17, 2017 HCAPS (Filtered on Registered Voters) Weighted To The U.S. General Adult Population - Propensity 18 Apr 2017 Table 199 DF2 Which of the following areas should receive the lowest priority in defense spending? Base: All Respondents Total Unweighted Base 2027 Weighted Base 2013 Effective Base 1013 Nuclear energy 612 30% Sustaining current military 417 activities and engagements 21% abroad Personnel benefits 314 16% New military hardware 255 (aircraft, ships, and tanks) 13% Research and development 170 8% Maintenance of bases and 107 other military assets 5% Cyber security 87 4% Veteran benefits 53 3% Sigma 2013 100%
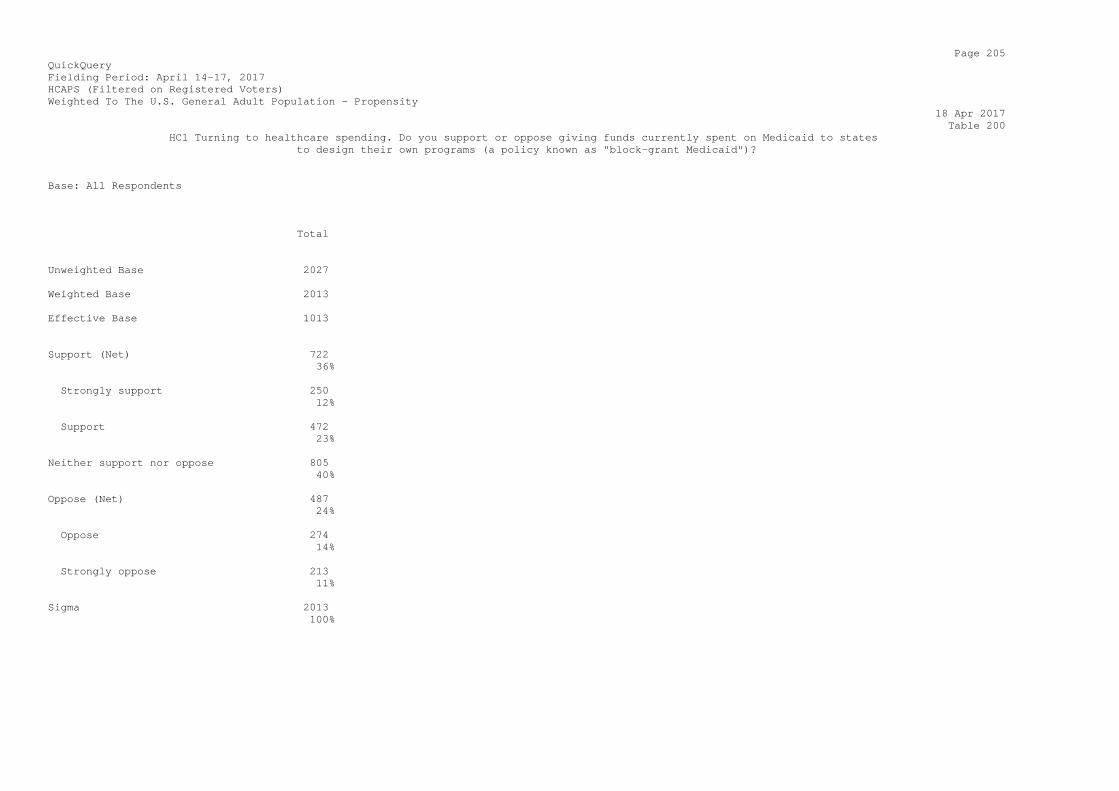
Page 205 QuickQuery Fielding Period: April 14-17, 2017 HCAPS (Filtered on Registered Voters) Weighted To The U.S. General Adult Population - Propensity 18 Apr 2017 Table 200 HC1 Turning to healthcare spending. Do you support or oppose giving funds currently spent on Medicaid to states to design their own programs (a policy known as "block-grant Medicaid")? Base: All Respondents Total Unweighted Base 2027 Weighted Base 2013 Effective Base 1013 Support (Net) 722 36% Strongly support 250 12% Support 472 23% Neither support nor oppose 805 40% Oppose (Net) 487 24% Oppose 274 14% Strongly oppose 213 11% Sigma 2013 100%
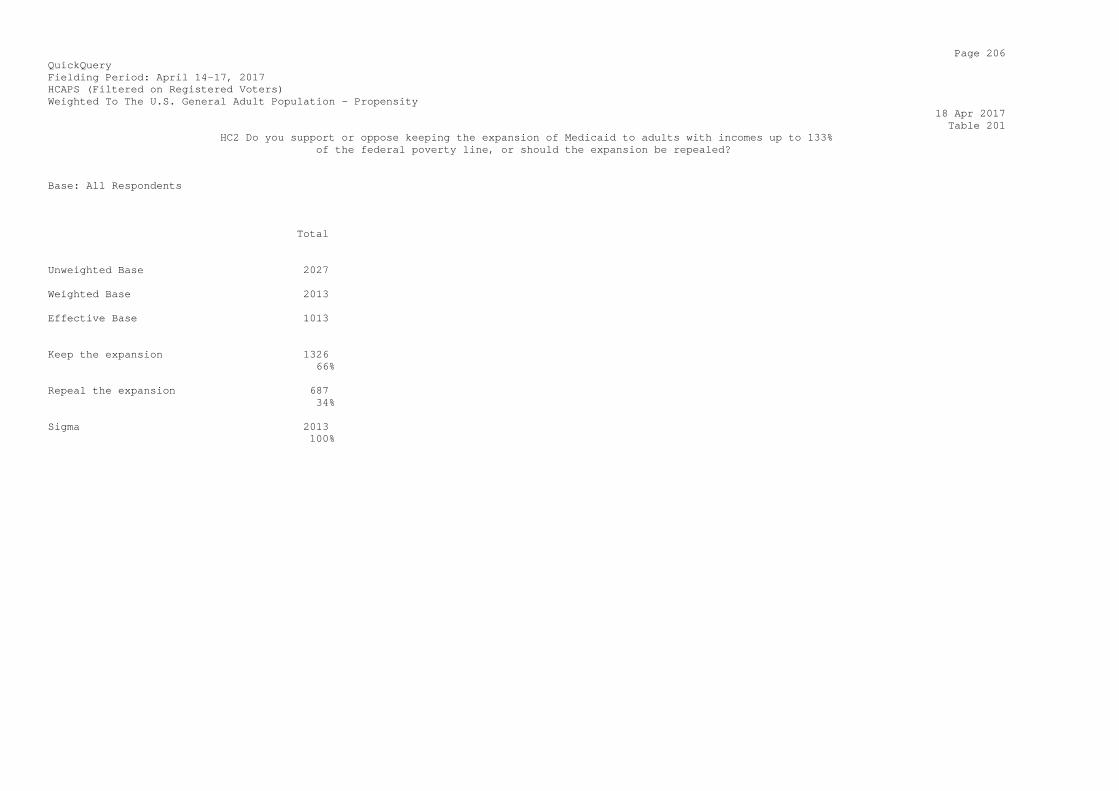
Page 206 QuickQuery Fielding Period: April 14-17, 2017 HCAPS (Filtered on Registered Voters) Weighted To The U.S. General Adult Population - Propensity 18 Apr 2017 Table 201 HC2 Do you support or oppose keeping the expansion of Medicaid to adults with incomes up to 133% of the federal poverty line, or should the expansion be repealed? Base: All Respondents Total Unweighted Base 2027 Weighted Base 2013 Effective Base 1013 Keep the expansion 1326 66% Repeal the expansion 687 34% Sigma 2013 100%
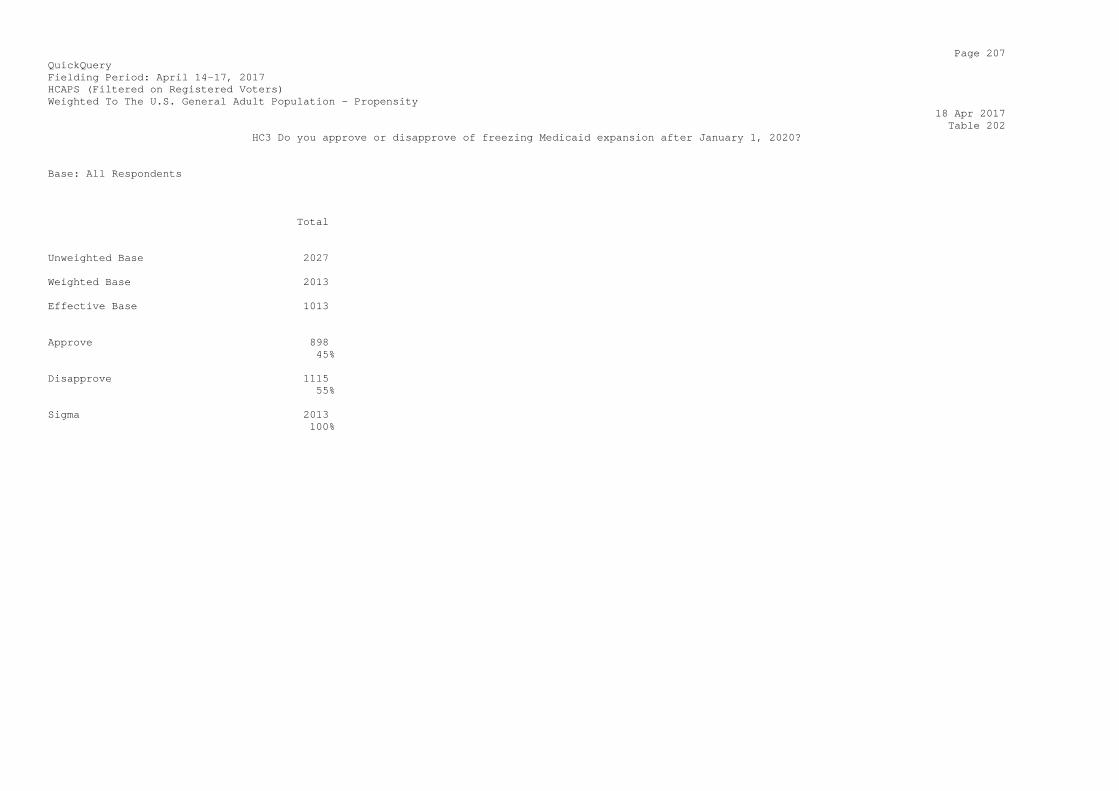
Page 207 QuickQuery Fielding Period: April 14-17, 2017 HCAPS (Filtered on Registered Voters) Weighted To The U.S. General Adult Population - Propensity 18 Apr 2017 Table 202 HC3 Do you approve or disapprove of freezing Medicaid expansion after January 1, 2020? Base: All Respondents Total Unweighted Base 2027 Weighted Base 2013 Effective Base 1013 Approve 898 45% Disapprove 1115 55% Sigma 2013 100%
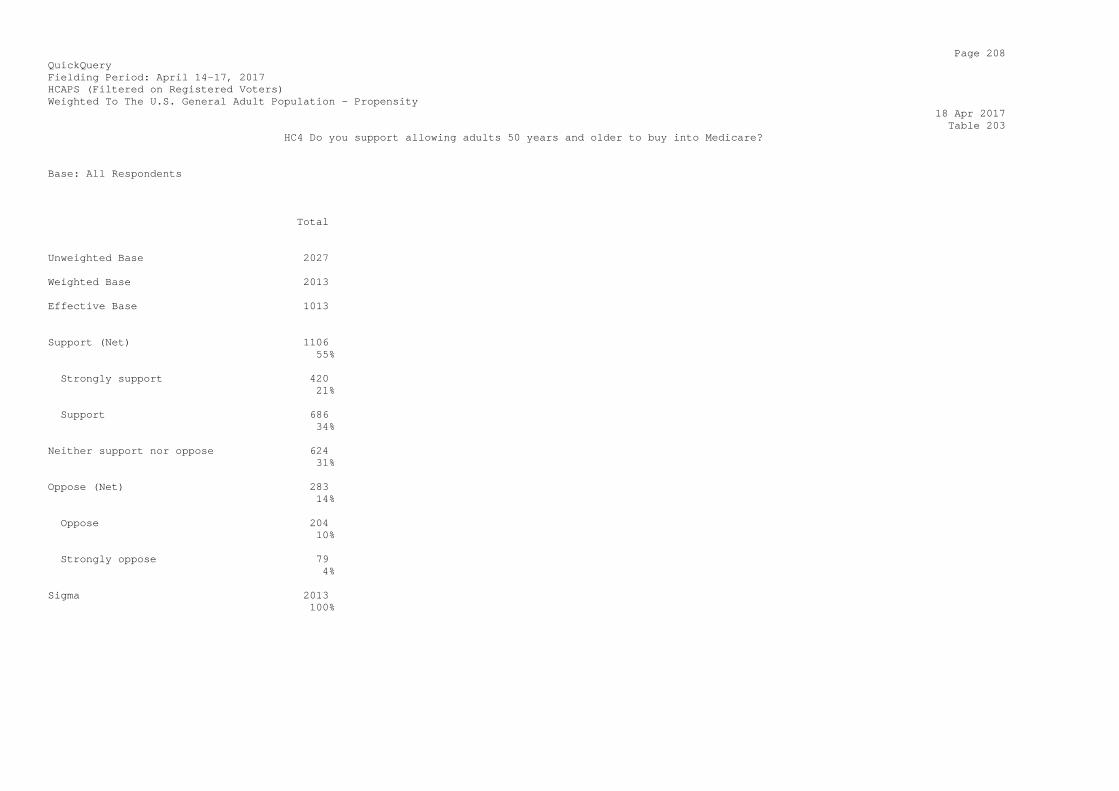
Page 208 QuickQuery Fielding Period: April 14-17, 2017 HCAPS (Filtered on Registered Voters) Weighted To The U.S. General Adult Population - Propensity 18 Apr 2017 Table 203 HC4 Do you support allowing adults 50 years and older to buy into Medicare? Base: All Respondents Total Unweighted Base 2027 Weighted Base 2013 Effective Base 1013 Support (Net) 1106 55% Strongly support 420 21% Support 686 34% Neither support nor oppose 624 31% Oppose (Net) 283 14% Oppose 204 10% Strongly oppose 79 4% Sigma 2013 100%
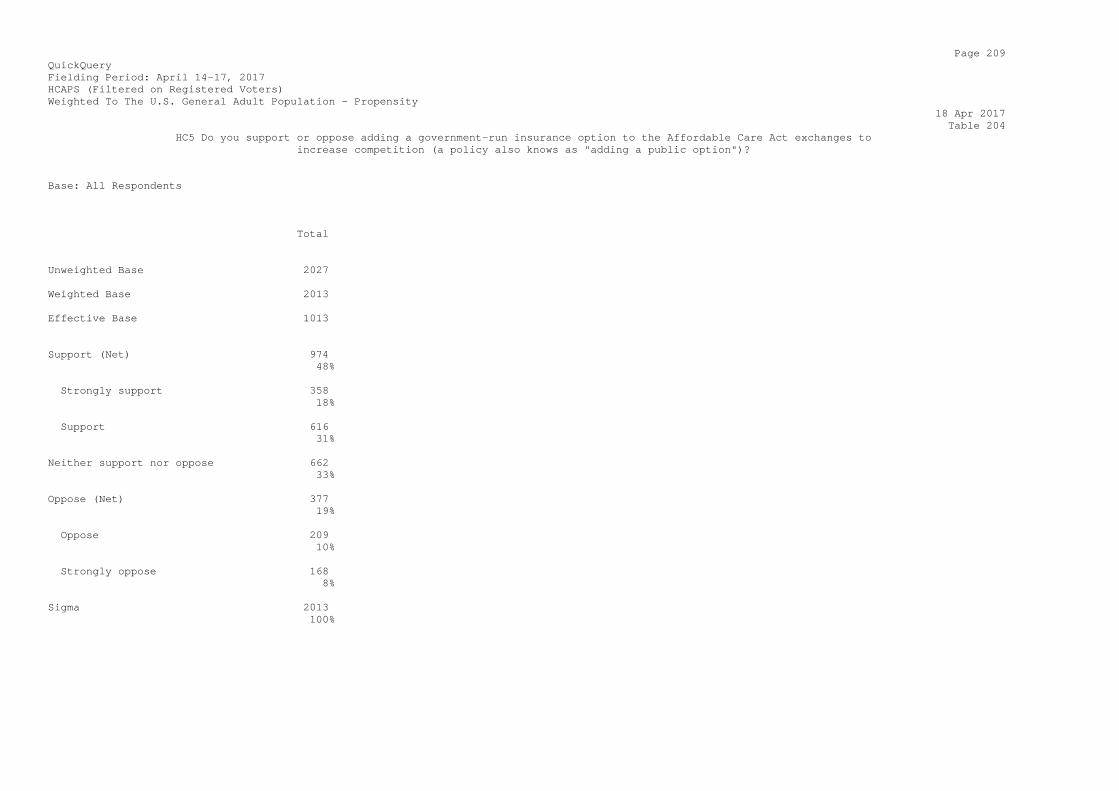
Page 209 QuickQuery Fielding Period: April 14-17, 2017 HCAPS (Filtered on Registered Voters) Weighted To The U.S. General Adult Population - Propensity 18 Apr 2017 Table 204 HC5 Do you support or oppose adding a government-run insurance option to the Affordable Care Act exchanges to increase competition (a policy also knows as "adding a public option")? Base: All Respondents Total Unweighted Base 2027 Weighted Base 2013 Effective Base 1013 Support (Net) 974 48% Strongly support 358 18% Support 616 31% Neither support nor oppose 662 33% Oppose (Net) 377 19% Oppose 209 10% Strongly oppose 168 8% Sigma 2013 100%
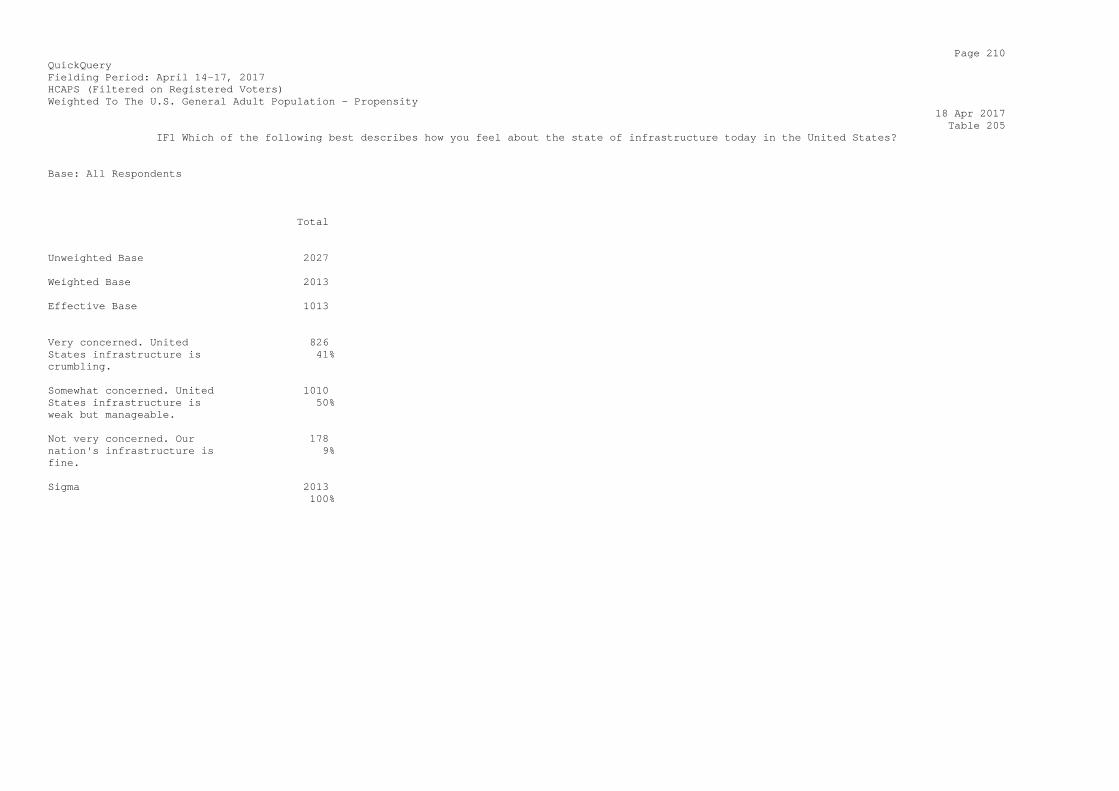
Page 210 QuickQuery Fielding Period: April 14-17, 2017 HCAPS (Filtered on Registered Voters) Weighted To The U.S. General Adult Population - Propensity 18 Apr 2017 Table 205 IF1 Which of the following best describes how you feel about the state of infrastructure today in the United States? Base: All Respondents Total Unweighted Base 2027 Weighted Base 2013 Effective Base 1013 Very concerned. United 826 States infrastructure is 41% crumbling. Somewhat concerned. United 1010 States infrastructure is 50% weak but manageable. Not very concerned. Our 178 nation's infrastructure is 9% fine. Sigma 2013 100%

Page 211 QuickQuery Fielding Period: April 14-17, 2017 HCAPS (Filtered on Registered Voters) Weighted To The U.S. General Adult Population - Propensity 18 Apr 2017 Table 206 IF2 The administration asked congress for a 1 trillion dollar infrastructure package. Do you think this proposal will be a step forward or a step backward for the country? Base: All Respondents Total Unweighted Base 2027 Weighted Base 2013 Effective Base 1013 Step forward 1513 75% Step backward 501 25% Sigma 2013 100%
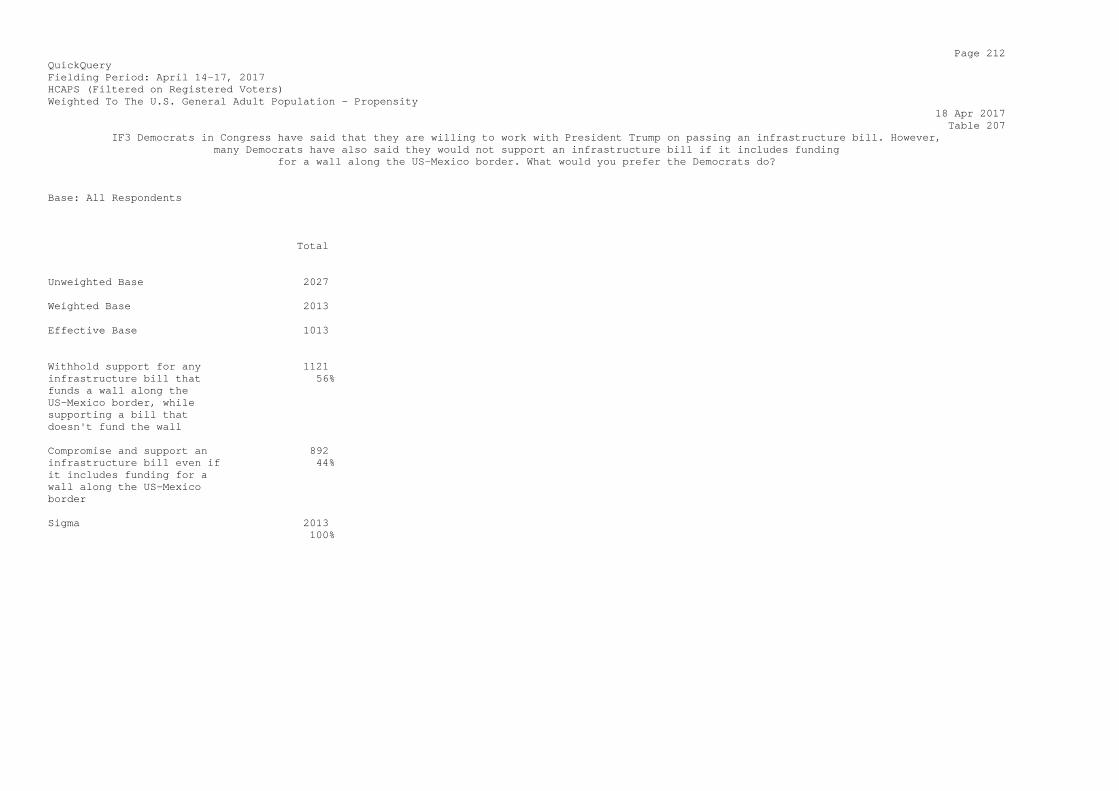
Page 212 QuickQuery Fielding Period: April 14-17, 2017 HCAPS (Filtered on Registered Voters) Weighted To The U.S. General Adult Population - Propensity 18 Apr 2017 Table 207 IF3 Democrats in Congress have said that they are willing to work with President Trump on passing an infrastructure bill. However, many Democrats have also said they would not support an infrastructure bill if it includes funding for a wall along the US-Mexico border. What would you prefer the Democrats do? Base: All Respondents Total Unweighted Base 2027 Weighted Base 2013 Effective Base 1013 Withhold support for any 1121 infrastructure bill that 56% funds a wall along the US-Mexico border, while supporting a bill that doesn't fund the wall Compromise and support an 892 infrastructure bill even if 44% it includes funding for a wall along the US-Mexico border Sigma 2013 100%
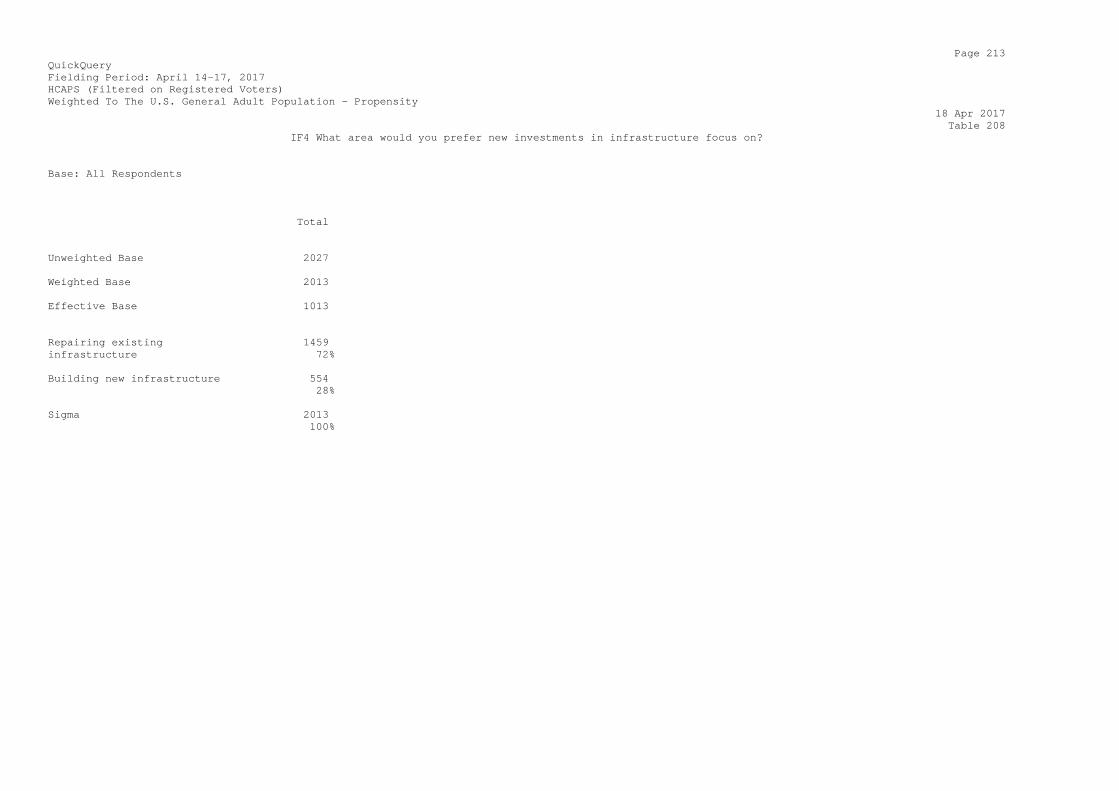
Page 213 QuickQuery Fielding Period: April 14-17, 2017 HCAPS (Filtered on Registered Voters) Weighted To The U.S. General Adult Population - Propensity 18 Apr 2017 Table 208 IF4 What area would you prefer new investments in infrastructure focus on? Base: All Respondents Total Unweighted Base 2027 Weighted Base 2013 Effective Base 1013 Repairing existing 1459 infrastructure 72% Building new infrastructure 554 28% Sigma 2013 100%
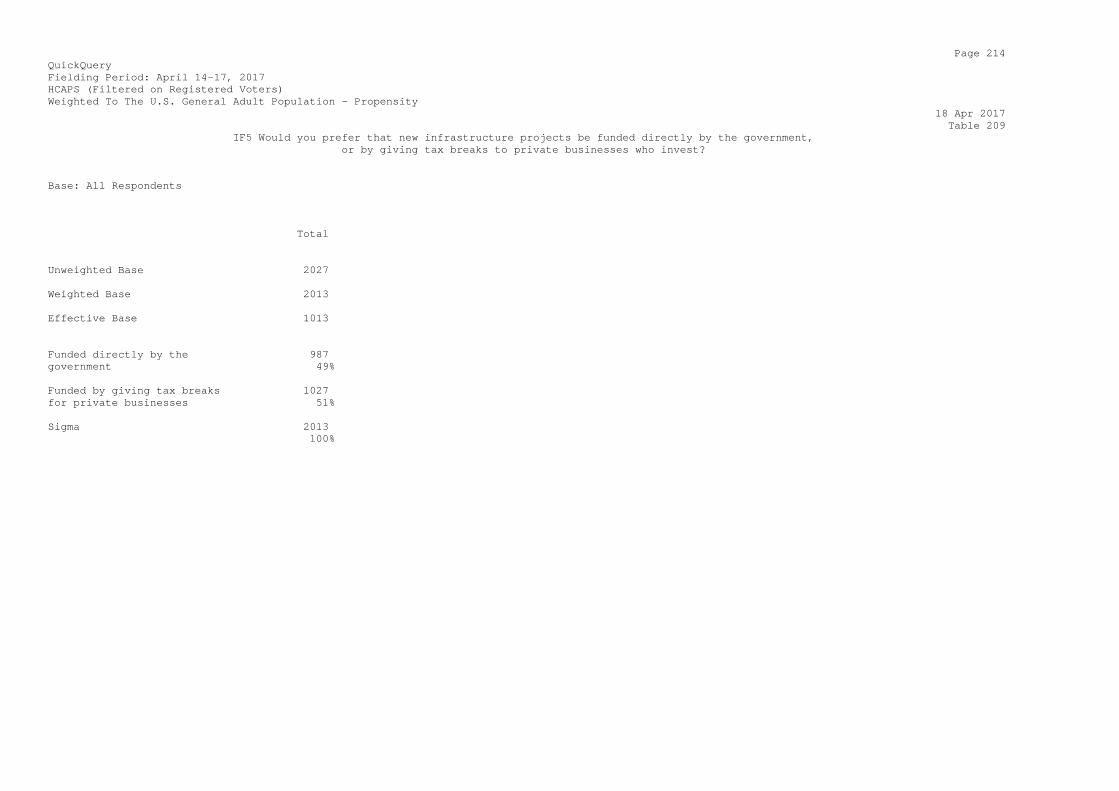
Page 214 QuickQuery Fielding Period: April 14-17, 2017 HCAPS (Filtered on Registered Voters) Weighted To The U.S. General Adult Population - Propensity 18 Apr 2017 Table 209 IF5 Would you prefer that new infrastructure projects be funded directly by the government, or by giving tax breaks to private businesses who invest? Base: All Respondents Total Unweighted Base 2027 Weighted Base 2013 Effective Base 1013 Funded directly by the 987 government 49% Funded by giving tax breaks 1027 for private businesses 51% Sigma 2013 100%
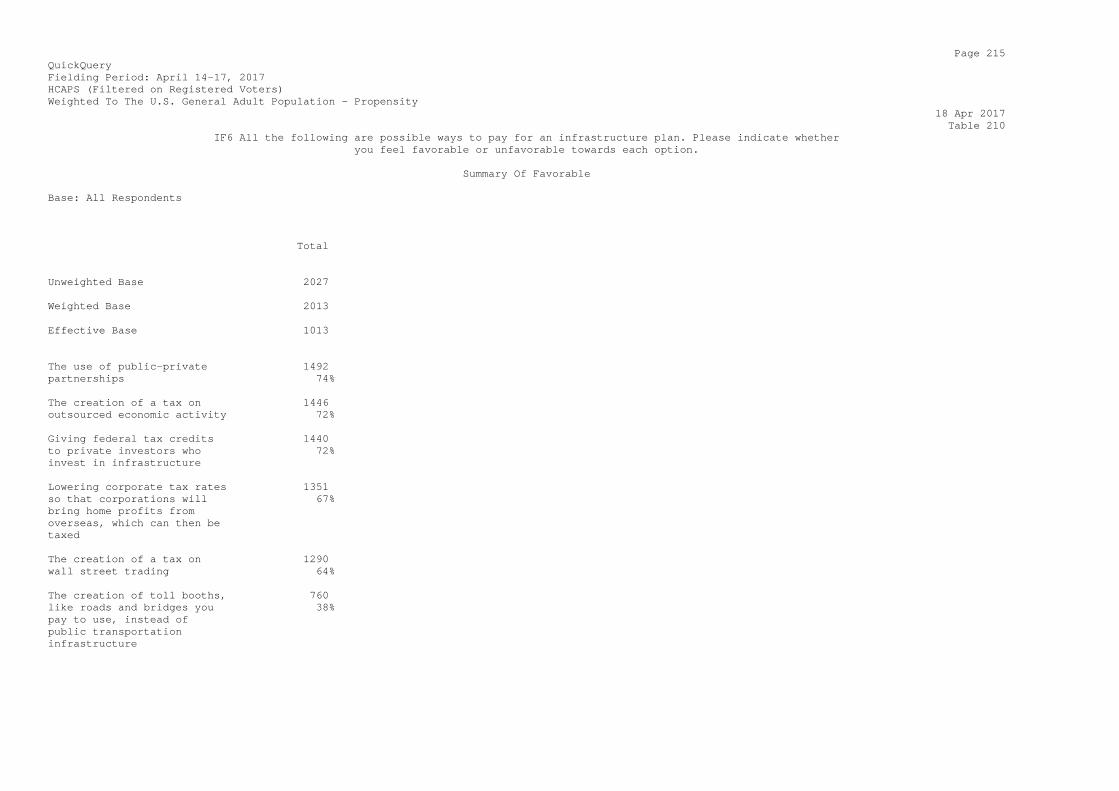
Page 215 QuickQuery Fielding Period: April 14-17, 2017 HCAPS (Filtered on Registered Voters) Weighted To The U.S. General Adult Population - Propensity 18 Apr 2017 Table 210 IF6 All the following are possible ways to pay for an infrastructure plan. Please indicate whether you feel favorable or unfavorable towards each option. Summary Of Favorable Base: All Respondents Total Unweighted Base 2027 Weighted Base 2013 Effective Base 1013 The use of public-private 1492 partnerships 74% The creation of a tax on 1446 outsourced economic activity 72% Giving federal tax credits 1440 to private investors who 72% invest in infrastructure Lowering corporate tax rates 1351 so that corporations will 67% bring home profits from overseas, which can then be taxed The creation of a tax on 1290 wall street trading 64% The creation of toll booths, 760 like roads and bridges you 38% pay to use, instead of public transportation infrastructure
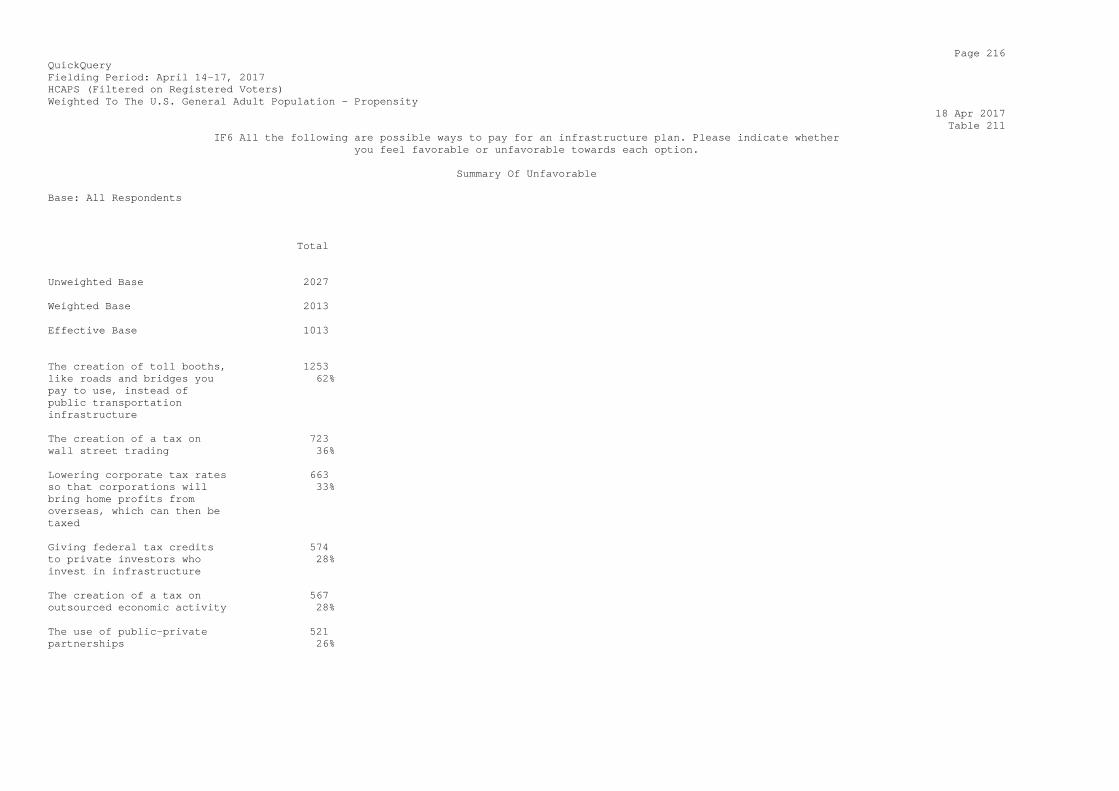
Page 216 QuickQuery Fielding Period: April 14-17, 2017 HCAPS (Filtered on Registered Voters) Weighted To The U.S. General Adult Population - Propensity 18 Apr 2017 Table 211 IF6 All the following are possible ways to pay for an infrastructure plan. Please indicate whether you feel favorable or unfavorable towards each option. Summary Of Unfavorable Base: All Respondents Total Unweighted Base 2027 Weighted Base 2013 Effective Base 1013 The creation of toll booths, 1253 like roads and bridges you 62% pay to use, instead of public transportation infrastructure The creation of a tax on 723 wall street trading 36% Lowering corporate tax rates 663 so that corporations will 33% bring home profits from overseas, which can then be taxed Giving federal tax credits 574 to private investors who 28% invest in infrastructure The creation of a tax on 567 outsourced economic activity 28% The use of public-private 521 partnerships 26%

Page 217 QuickQuery Fielding Period: April 14-17, 2017 HCAPS (Filtered on Registered Voters) Weighted To The U.S. General Adult Population - Propensity 18 Apr 2017 Table 212 IF6_1 All the following are possible ways to pay for an infrastructure plan. Please indicate whether you feel favorable or unfavorable towards each option. The use of public-private partnerships Base: All Respondents Total Unweighted Base 2027 Weighted Base 2013 Effective Base 1013 Favorable 1492 74% Unfavorable 521 26% Sigma 2013 100%

Page 218 QuickQuery Fielding Period: April 14-17, 2017 HCAPS (Filtered on Registered Voters) Weighted To The U.S. General Adult Population - Propensity 18 Apr 2017 Table 213 IF6_2 All the following are possible ways to pay for an infrastructure plan. Please indicate whether you feel favorable or unfavorable towards each option. Giving federal tax credits to private investors who invest in infrastructure Base: All Respondents Total Unweighted Base 2027 Weighted Base 2013 Effective Base 1013 Favorable 1440 72% Unfavorable 574 28% Sigma 2013 100%
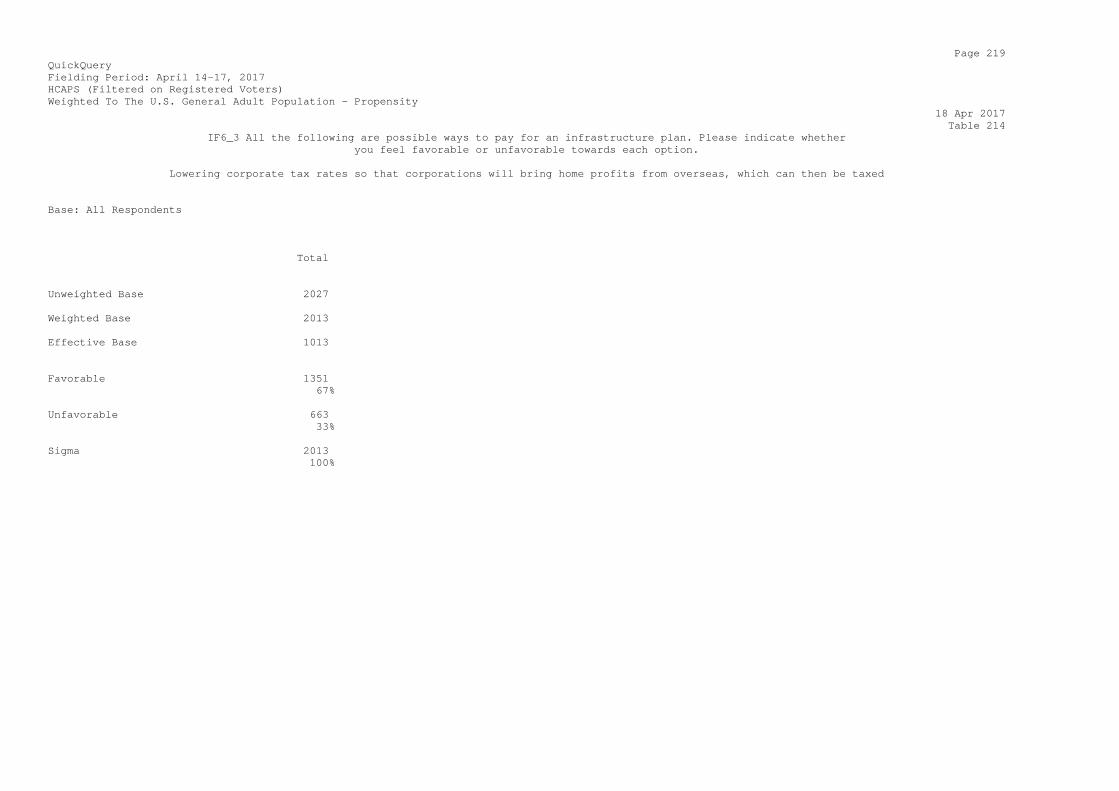
Page 219 QuickQuery Fielding Period: April 14-17, 2017 HCAPS (Filtered on Registered Voters) Weighted To The U.S. General Adult Population - Propensity 18 Apr 2017 Table 214 IF6_3 All the following are possible ways to pay for an infrastructure plan. Please indicate whether you feel favorable or unfavorable towards each option. Lowering corporate tax rates so that corporations will bring home profits from overseas, which can then be taxed Base: All Respondents Total Unweighted Base 2027 Weighted Base 2013 Effective Base 1013 Favorable 1351 67% Unfavorable 663 33% Sigma 2013 100%
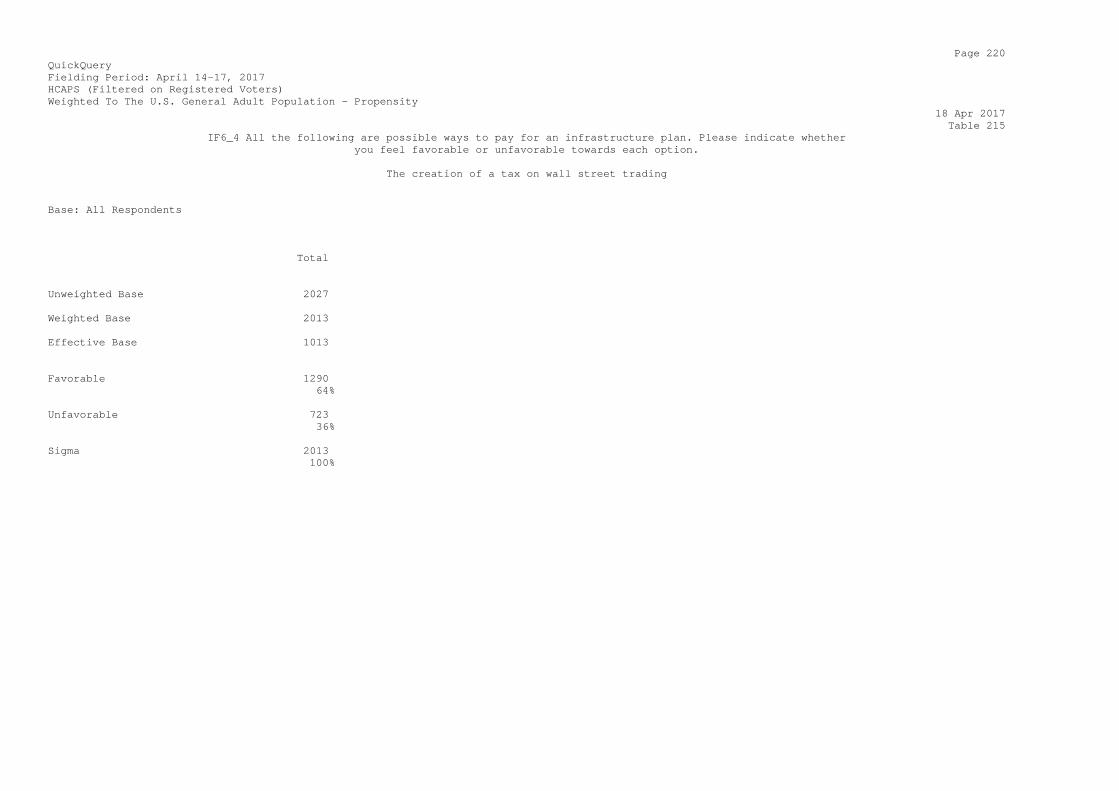
Page 220 QuickQuery Fielding Period: April 14-17, 2017 HCAPS (Filtered on Registered Voters) Weighted To The U.S. General Adult Population - Propensity 18 Apr 2017 Table 215 IF6_4 All the following are possible ways to pay for an infrastructure plan. Please indicate whether you feel favorable or unfavorable towards each option. The creation of a tax on wall street trading Base: All Respondents Total Unweighted Base 2027 Weighted Base 2013 Effective Base 1013 Favorable 1290 64% Unfavorable 723 36% Sigma 2013 100%

Page 221 QuickQuery Fielding Period: April 14-17, 2017 HCAPS (Filtered on Registered Voters) Weighted To The U.S. General Adult Population - Propensity 18 Apr 2017 Table 216 IF6_5 All the following are possible ways to pay for an infrastructure plan. Please indicate whether you feel favorable or unfavorable towards each option. The creation of a tax on outsourced economic activity Base: All Respondents Total Unweighted Base 2027 Weighted Base 2013 Effective Base 1013 Favorable 1446 72% Unfavorable 567 28% Sigma 2013 100%

Page 222 QuickQuery Fielding Period: April 14-17, 2017 HCAPS (Filtered on Registered Voters) Weighted To The U.S. General Adult Population - Propensity 18 Apr 2017 Table 217 IF6_6 All the following are possible ways to pay for an infrastructure plan. Please indicate whether you feel favorable or unfavorable towards each option. The creation of toll booths, like roads and bridges you pay to use, instead of public transportation infrastructure Base: All Respondents Total Unweighted Base 2027 Weighted Base 2013 Effective Base 1013 Favorable 760 38% Unfavorable 1253 62% Sigma 2013 100%
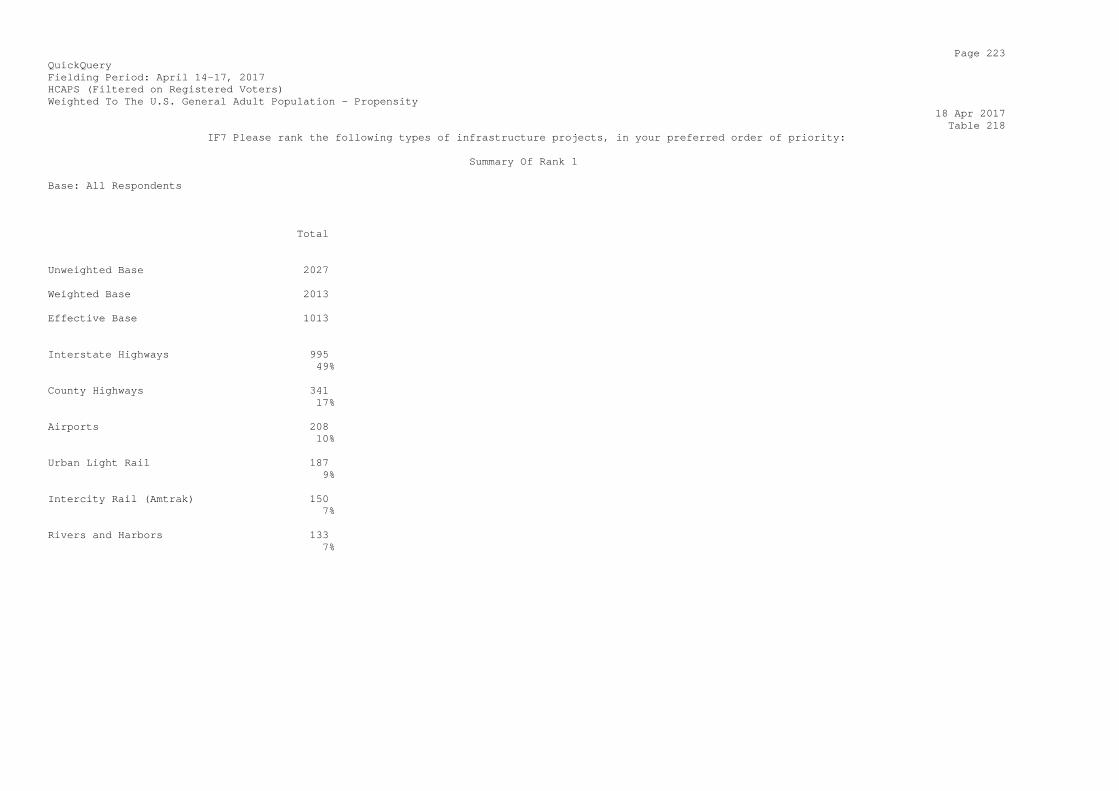
Page 223 QuickQuery Fielding Period: April 14-17, 2017 HCAPS (Filtered on Registered Voters) Weighted To The U.S. General Adult Population - Propensity 18 Apr 2017 Table 218 IF7 Please rank the following types of infrastructure projects, in your preferred order of priority: Summary Of Rank 1 Base: All Respondents Total Unweighted Base 2027 Weighted Base 2013 Effective Base 1013 Interstate Highways 995 49% County Highways 341 17% Airports 208 10% Urban Light Rail 187 9% Intercity Rail (Amtrak) 150 7% Rivers and Harbors 133 7%
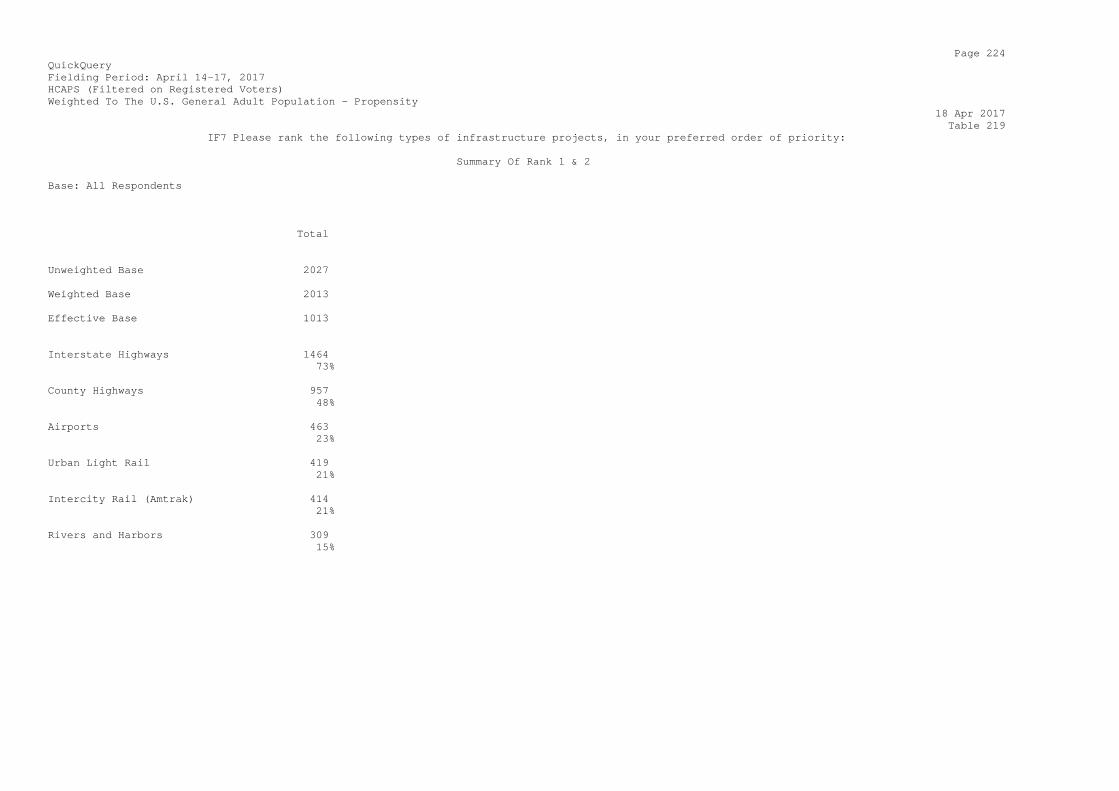
Page 224 QuickQuery Fielding Period: April 14-17, 2017 HCAPS (Filtered on Registered Voters) Weighted To The U.S. General Adult Population - Propensity 18 Apr 2017 Table 219 IF7 Please rank the following types of infrastructure projects, in your preferred order of priority: Summary Of Rank 1 & 2 Base: All Respondents Total Unweighted Base 2027 Weighted Base 2013 Effective Base 1013 Interstate Highways 1464 73% County Highways 957 48% Airports 463 23% Urban Light Rail 419 21% Intercity Rail (Amtrak) 414 21% Rivers and Harbors 309 15%
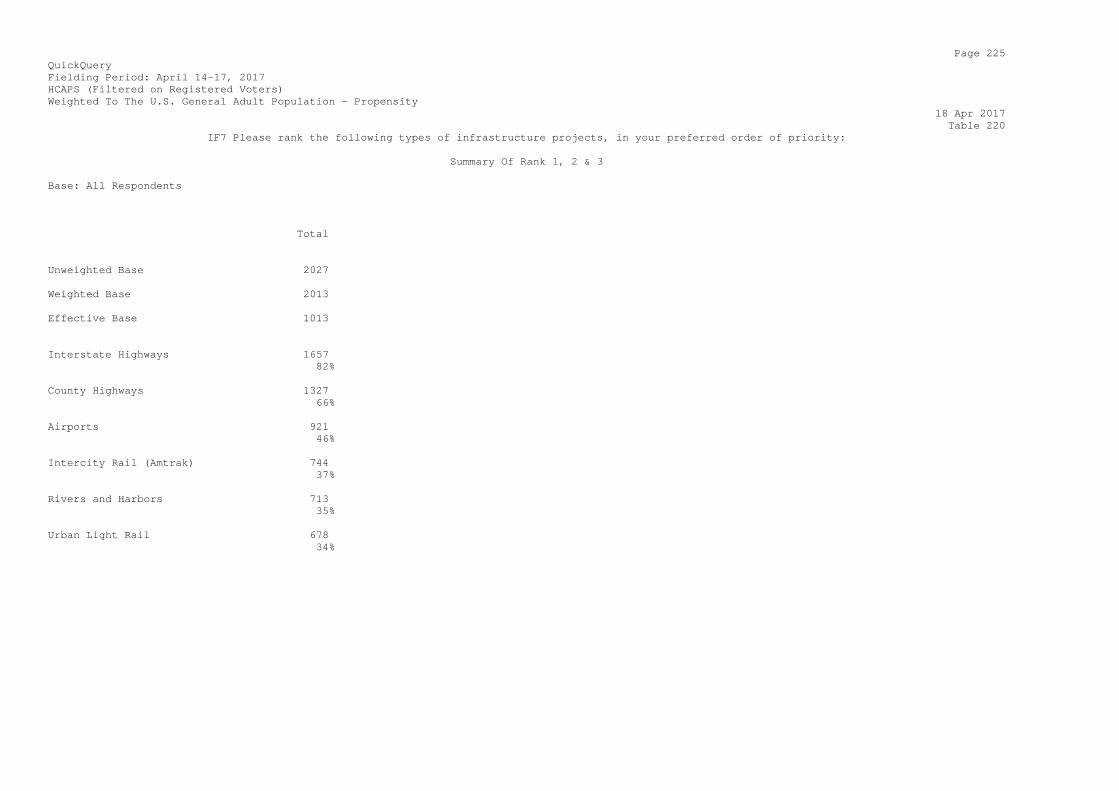
Page 225 QuickQuery Fielding Period: April 14-17, 2017 HCAPS (Filtered on Registered Voters) Weighted To The U.S. General Adult Population - Propensity 18 Apr 2017 Table 220 IF7 Please rank the following types of infrastructure projects, in your preferred order of priority: Summary Of Rank 1, 2 & 3 Base: All Respondents Total Unweighted Base 2027 Weighted Base 2013 Effective Base 1013 Interstate Highways 1657 82% County Highways 1327 66% Airports 921 46% Intercity Rail (Amtrak) 744 37% Rivers and Harbors 713 35% Urban Light Rail 678 34%
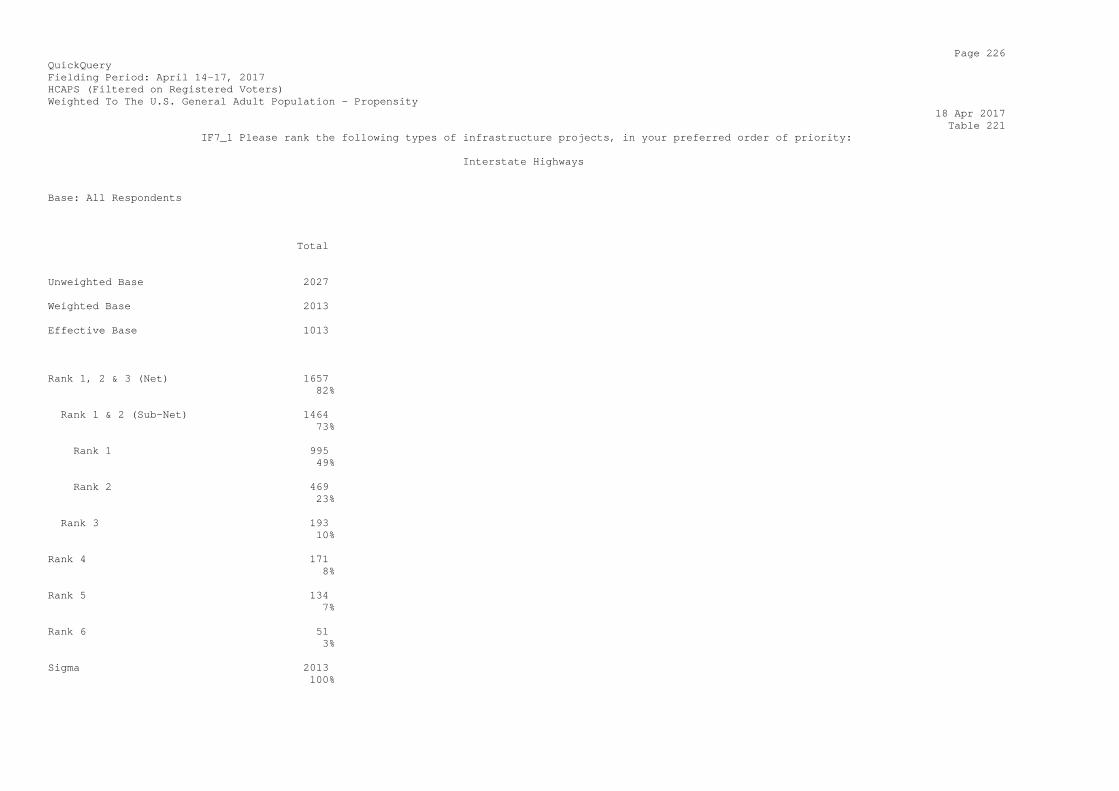
Page 226 QuickQuery Fielding Period: April 14-17, 2017 HCAPS (Filtered on Registered Voters) Weighted To The U.S. General Adult Population - Propensity 18 Apr 2017 Table 221 IF7_1 Please rank the following types of infrastructure projects, in your preferred order of priority: Interstate Highways Base: All Respondents Total Unweighted Base 2027 Weighted Base 2013 Effective Base 1013 Rank 1, 2 & 3 (Net) 1657 82% Rank 1 & 2 (Sub-Net) 1464 73% Rank 1 995 49% Rank 2 469 23% Rank 3 193 10% Rank 4 171 8% Rank 5 134 7% Rank 6 51 3% Sigma 2013 100%

Page 227 QuickQuery Fielding Period: April 14-17, 2017 HCAPS (Filtered on Registered Voters) Weighted To The U.S. General Adult Population - Propensity 18 Apr 2017 Table 222 IF7_2 Please rank the following types of infrastructure projects, in your preferred order of priority: County Highways Base: All Respondents Total Unweighted Base 2027 Weighted Base 2013 Effective Base 1013 Rank 1, 2 & 3 (Net) 1327 66% Rank 1 & 2 (Sub-Net) 957 48% Rank 1 341 17% Rank 2 616 31% Rank 3 370 18% Rank 4 296 15% Rank 5 172 9% Rank 6 219 11% Sigma 2013 100%

Page 228 QuickQuery Fielding Period: April 14-17, 2017 HCAPS (Filtered on Registered Voters) Weighted To The U.S. General Adult Population - Propensity 18 Apr 2017 Table 223 IF7_3 Please rank the following types of infrastructure projects, in your preferred order of priority: Urban Light Rail Base: All Respondents Total Unweighted Base 2027 Weighted Base 2013 Effective Base 1013 Rank 1, 2 & 3 (Net) 678 34% Rank 1 & 2 (Sub-Net) 419 21% Rank 1 187 9% Rank 2 232 12% Rank 3 260 13% Rank 4 337 17% Rank 5 492 24% Rank 6 506 25% Sigma 2013 100%

Page 229 QuickQuery Fielding Period: April 14-17, 2017 HCAPS (Filtered on Registered Voters) Weighted To The U.S. General Adult Population - Propensity 18 Apr 2017 Table 224 IF7_4 Please rank the following types of infrastructure projects, in your preferred order of priority: Intercity Rail (Amtrak) Base: All Respondents Total Unweighted Base 2027 Weighted Base 2013 Effective Base 1013 Rank 1, 2 & 3 (Net) 744 37% Rank 1 & 2 (Sub-Net) 414 21% Rank 1 150 7% Rank 2 265 13% Rank 3 329 16% Rank 4 417 21% Rank 5 509 25% Rank 6 343 17% Sigma 2013 100%

Page 230 QuickQuery Fielding Period: April 14-17, 2017 HCAPS (Filtered on Registered Voters) Weighted To The U.S. General Adult Population - Propensity 18 Apr 2017 Table 225 IF7_5 Please rank the following types of infrastructure projects, in your preferred order of priority: Airports Base: All Respondents Total Unweighted Base 2027 Weighted Base 2013 Effective Base 1013 Rank 1, 2 & 3 (Net) 921 46% Rank 1 & 2 (Sub-Net) 463 23% Rank 1 208 10% Rank 2 255 13% Rank 3 458 23% Rank 4 411 20% Rank 5 312 16% Rank 6 369 18% Sigma 2013 100%
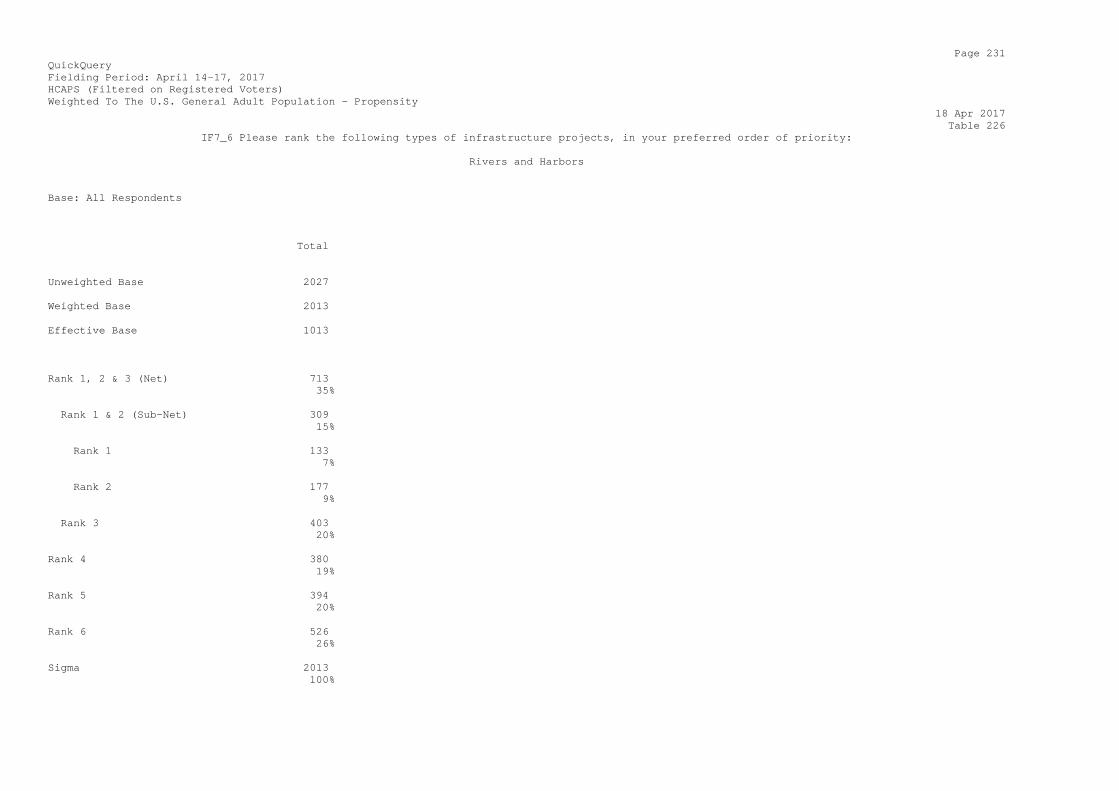
Page 231 QuickQuery Fielding Period: April 14-17, 2017 HCAPS (Filtered on Registered Voters) Weighted To The U.S. General Adult Population - Propensity 18 Apr 2017 Table 226 IF7_6 Please rank the following types of infrastructure projects, in your preferred order of priority: Rivers and Harbors Base: All Respondents Total Unweighted Base 2027 Weighted Base 2013 Effective Base 1013 Rank 1, 2 & 3 (Net) 713 35% Rank 1 & 2 (Sub-Net) 309 15% Rank 1 133 7% Rank 2 177 9% Rank 3 403 20% Rank 4 380 19% Rank 5 394 20% Rank 6 526 26% Sigma 2013 100%
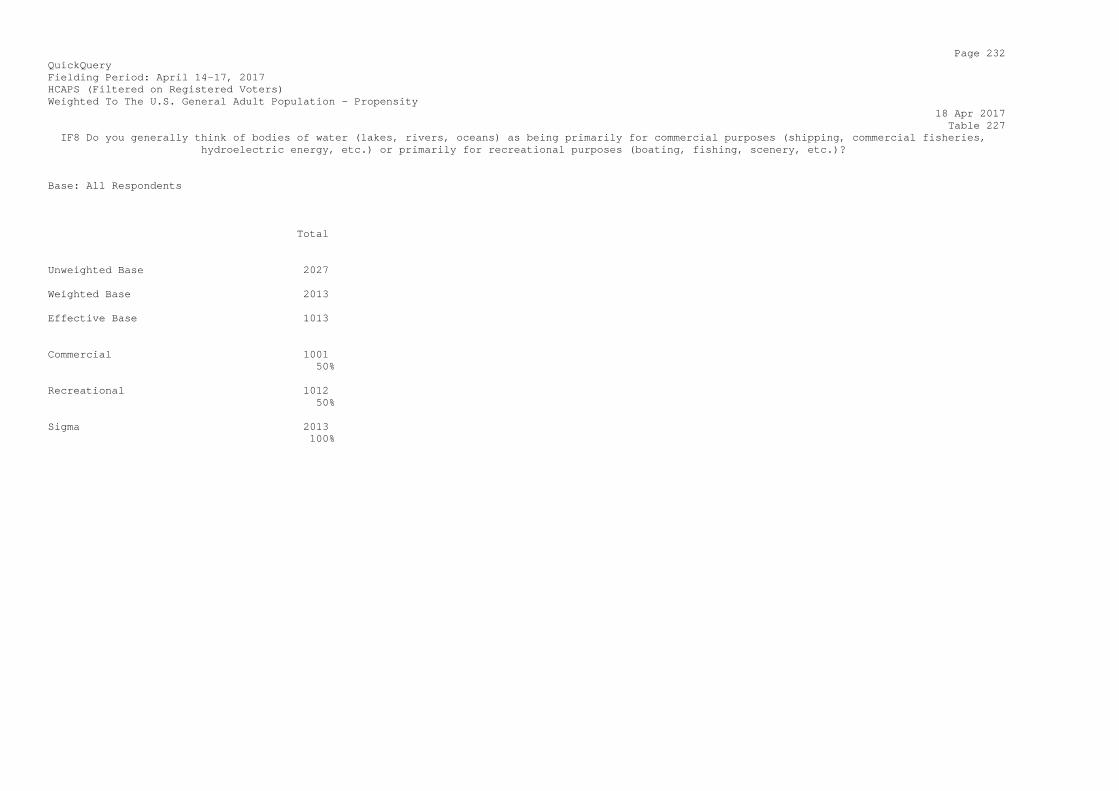
Page 232 QuickQuery Fielding Period: April 14-17, 2017 HCAPS (Filtered on Registered Voters) Weighted To The U.S. General Adult Population - Propensity 18 Apr 2017 Table 227 IF8 Do you generally think of bodies of water (lakes, rivers, oceans) as being primarily for commercial purposes (shipping, commercial fisheries, hydroelectric energy, etc.) or primarily for recreational purposes (boating, fishing, scenery, etc.)? Base: All Respondents Total Unweighted Base 2027 Weighted Base 2013 Effective Base 1013 Commercial 1001 50% Recreational 1012 50% Sigma 2013 100%
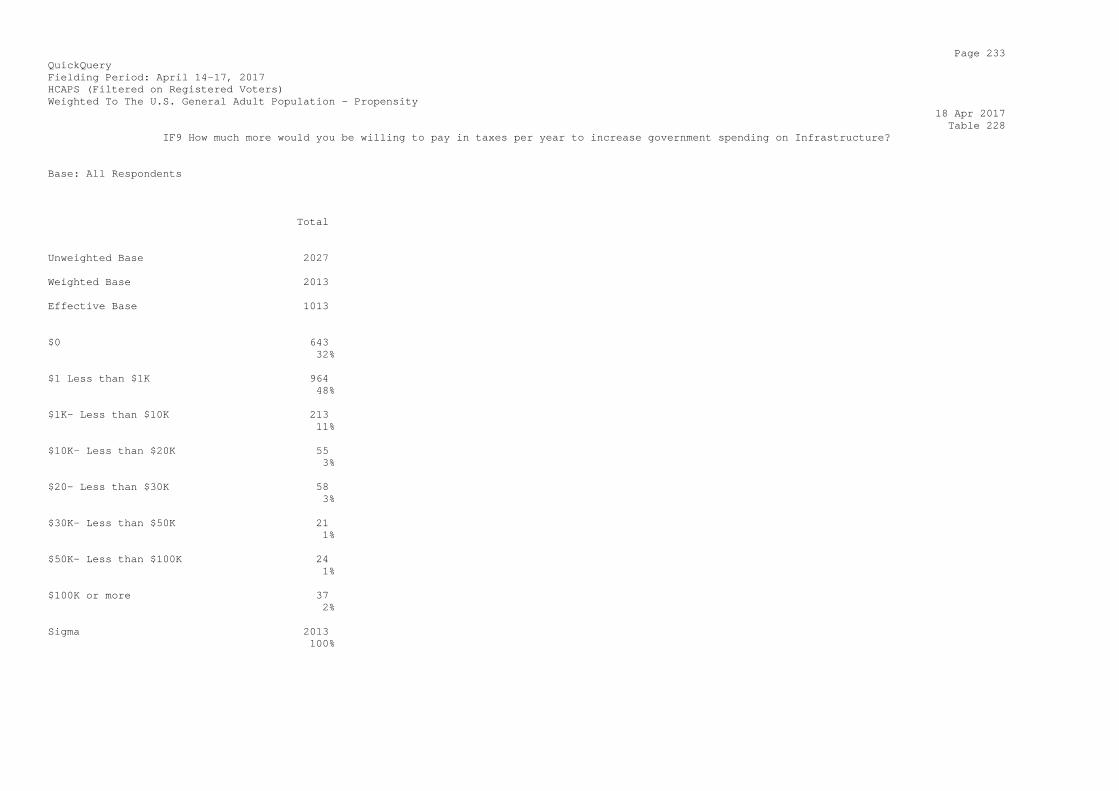
Page 233 QuickQuery Fielding Period: April 14-17, 2017 HCAPS (Filtered on Registered Voters) Weighted To The U.S. General Adult Population - Propensity 18 Apr 2017 Table 228 IF9 How much more would you be willing to pay in taxes per year to increase government spending on Infrastructure? Base: All Respondents Total Unweighted Base 2027 Weighted Base 2013 Effective Base 1013 $0 643 32% $1 Less than $1K 964 48% $1K- Less than $10K 213 11% $10K- Less than $20K 55 3% $20- Less than $30K 58 3% $30K- Less than $50K 21 1% $50K- Less than $100K 24 1% $100K or more 37 2% Sigma 2013 100%
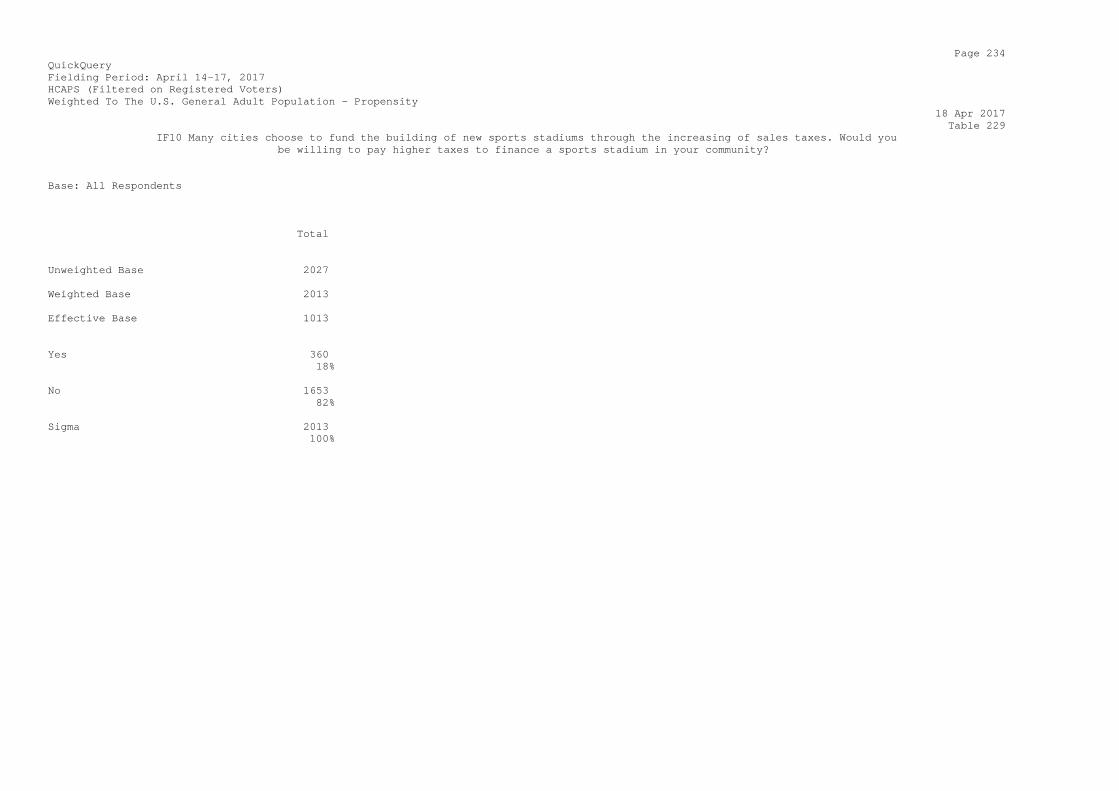
Page 234 QuickQuery Fielding Period: April 14-17, 2017 HCAPS (Filtered on Registered Voters) Weighted To The U.S. General Adult Population - Propensity 18 Apr 2017 Table 229 IF10 Many cities choose to fund the building of new sports stadiums through the increasing of sales taxes. Would you be willing to pay higher taxes to finance a sports stadium in your community? Base: All Respondents Total Unweighted Base 2027 Weighted Base 2013 Effective Base 1013 Yes 360 18% No 1653 82% Sigma 2013 100%
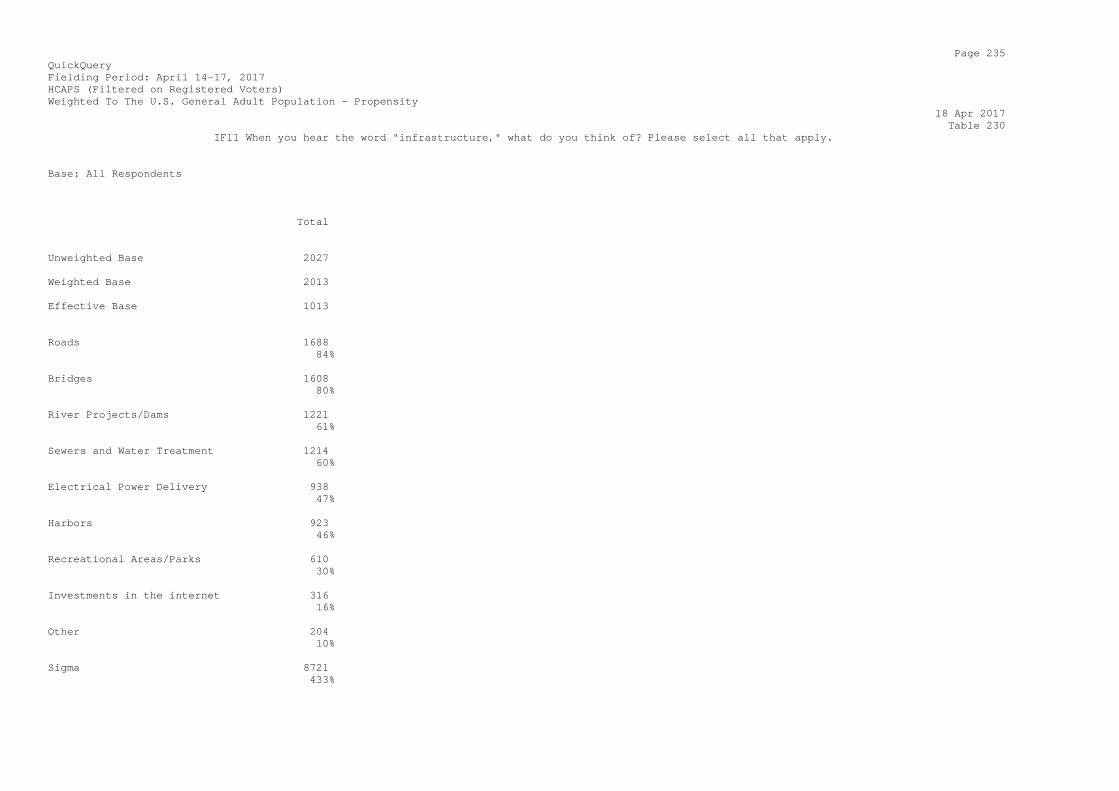
Page 235 QuickQuery Fielding Period: April 14-17, 2017 HCAPS (Filtered on Registered Voters) Weighted To The U.S. General Adult Population - Propensity 18 Apr 2017 Table 230 IF11 When you hear the word "infrastructure," what do you think of? Please select all that apply. Base: All Respondents Total Unweighted Base 2027 Weighted Base 2013 Effective Base 1013 Roads 1688 84% Bridges 1608 80% River Projects/Dams 1221 61% Sewers and Water Treatment 1214 60% Electrical Power Delivery 938 47% Harbors 923 46% Recreational Areas/Parks 610 30% Investments in the internet 316 16% Other 204 10% Sigma 8721 433%
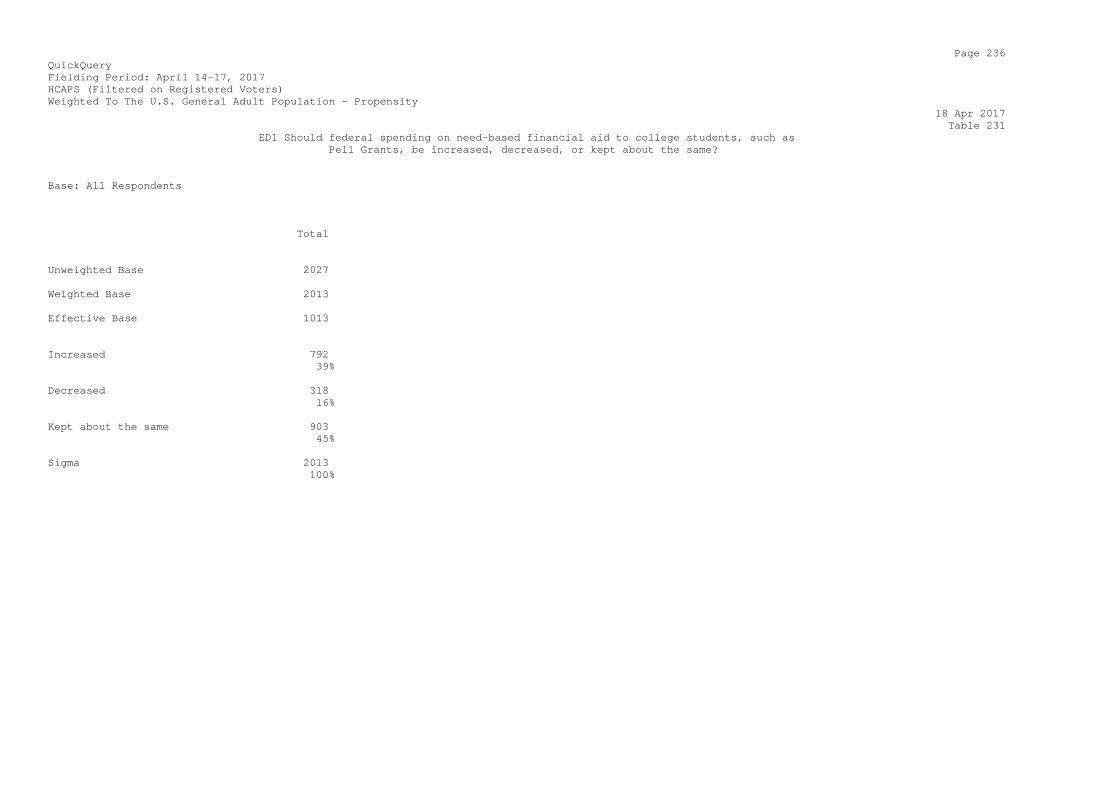
Page 236 QuickQuery Fielding Period: April 14-17, 2017 HCAPS (Filtered on Registered Voters) Weighted To The U.S. General Adult Population - Propensity 18 Apr 2017 Table 231 ED1 Should federal spending on need-based financial aid to college students, such as Pell Grants, be increased, decreased, or kept about the same? Base: All Respondents Total Unweighted Base 2027 Weighted Base 2013 Effective Base 1013 Increased 792 39% Decreased 318 16% Kept about the same 903 45% Sigma 2013 100%
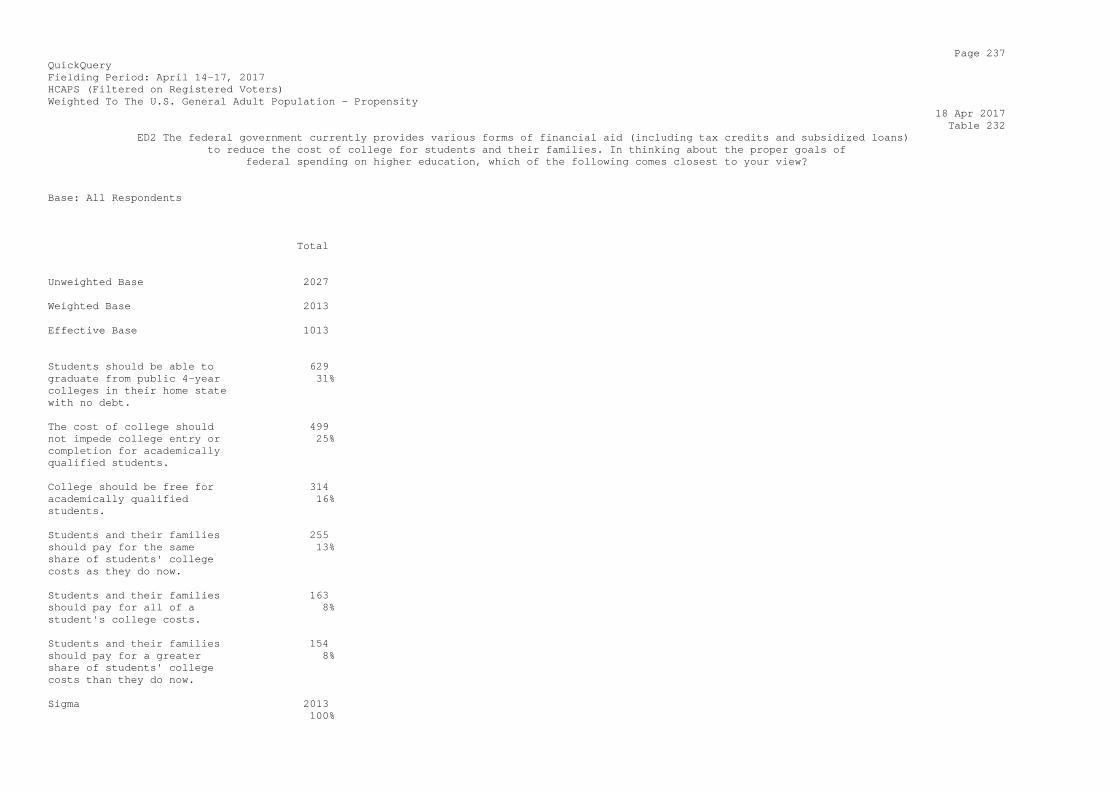
Page 237 QuickQuery Fielding Period: April 14-17, 2017 HCAPS (Filtered on Registered Voters) Weighted To The U.S. General Adult Population - Propensity 18 Apr 2017 Table 232 ED2 The federal government currently provides various forms of financial aid (including tax credits and subsidized loans) to reduce the cost of college for students and their families. In thinking about the proper goals of federal spending on higher education, which of the following comes closest to your view? Base: All Respondents Total Unweighted Base 2027 Weighted Base 2013 Effective Base 1013 Students should be able to 629 graduate from public 4-year 31% colleges in their home state with no debt. The cost of college should 499 not impede college entry or 25% completion for academically qualified students. College should be free for 314 academically qualified 16% students. Students and their families 255 should pay for the same 13% share of students' college costs as they do now. Students and their families 163 should pay for all of a 8% student's college costs. Students and their families 154 should pay for a greater 8% share of students' college costs than they do now. Sigma 2013 100%
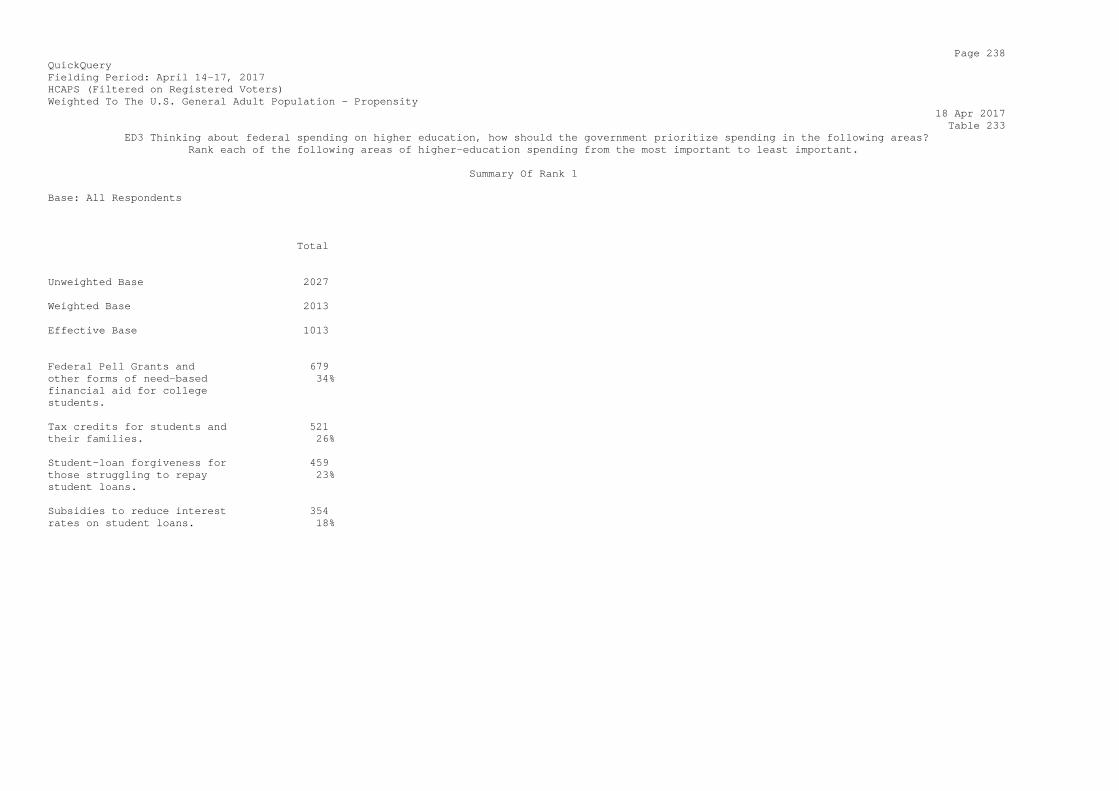
Page 238 QuickQuery Fielding Period: April 14-17, 2017 HCAPS (Filtered on Registered Voters) Weighted To The U.S. General Adult Population - Propensity 18 Apr 2017 Table 233 ED3 Thinking about federal spending on higher education, how should the government prioritize spending in the following areas? Rank each of the following areas of higher-education spending from the most important to least important. Summary Of Rank 1 Base: All Respondents Total Unweighted Base 2027 Weighted Base 2013 Effective Base 1013 Federal Pell Grants and 679 other forms of need-based 34% financial aid for college students. Tax credits for students and 521 their families. 26% Student-loan forgiveness for 459 those struggling to repay 23% student loans. Subsidies to reduce interest 354 rates on student loans. 18%

Page 239 QuickQuery Fielding Period: April 14-17, 2017 HCAPS (Filtered on Registered Voters) Weighted To The U.S. General Adult Population - Propensity 18 Apr 2017 Table 234 ED3 Thinking about federal spending on higher education, how should the government prioritize spending in the following areas? Rank each of the following areas of higher-education spending from the most important to least important. Summary Of Rank 1 & 2 Base: All Respondents Total Unweighted Base 2027 Weighted Base 2013 Effective Base 1013 Federal Pell Grants and 1204 other forms of need-based 60% financial aid for college students. Tax credits for students and 1063 their families. 53% Subsidies to reduce interest 944 rates on student loans. 47% Student-loan forgiveness for 816 those struggling to repay 41% student loans.

Page 240 QuickQuery Fielding Period: April 14-17, 2017 HCAPS (Filtered on Registered Voters) Weighted To The U.S. General Adult Population - Propensity 18 Apr 2017 Table 235 ED3 Thinking about federal spending on higher education, how should the government prioritize spending in the following areas? Rank each of the following areas of higher-education spending from the most important to least important. Summary Of Rank 1, 2 & 3 Base: All Respondents Total Unweighted Base 2027 Weighted Base 2013 Effective Base 1013 Federal Pell Grants and 1698 other forms of need-based 84% financial aid for college students. Subsidies to reduce interest 1615 rates on student loans. 80% Tax credits for students and 1570 their families. 78% Student-loan forgiveness for 1156 those struggling to repay 57% student loans.
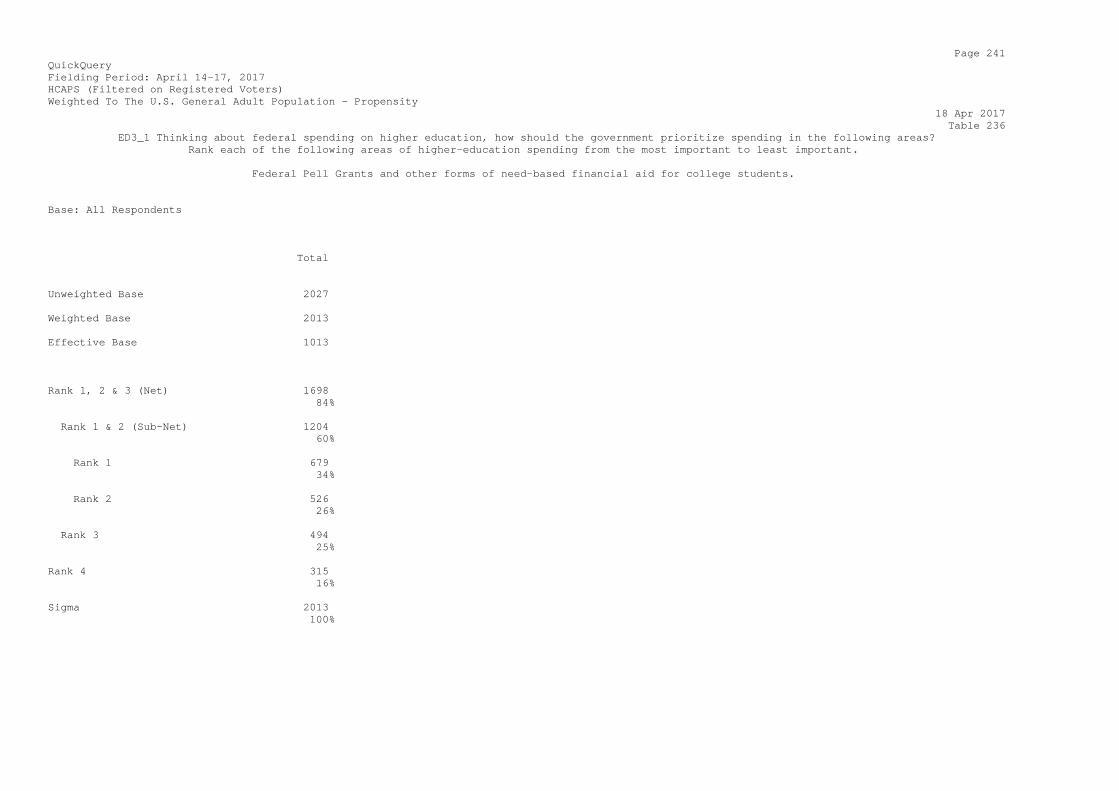
Page 241 QuickQuery Fielding Period: April 14-17, 2017 HCAPS (Filtered on Registered Voters) Weighted To The U.S. General Adult Population - Propensity 18 Apr 2017 Table 236 ED3_1 Thinking about federal spending on higher education, how should the government prioritize spending in the following areas? Rank each of the following areas of higher-education spending from the most important to least important. Federal Pell Grants and other forms of need-based financial aid for college students. Base: All Respondents Total Unweighted Base 2027 Weighted Base 2013 Effective Base 1013 Rank 1, 2 & 3 (Net) 1698 84% Rank 1 & 2 (Sub-Net) 1204 60% Rank 1 679 34% Rank 2 526 26% Rank 3 494 25% Rank 4 315 16% Sigma 2013 100%

Page 242 QuickQuery Fielding Period: April 14-17, 2017 HCAPS (Filtered on Registered Voters) Weighted To The U.S. General Adult Population - Propensity 18 Apr 2017 Table 237 ED3_2 Thinking about federal spending on higher education, how should the government prioritize spending in the following areas? Rank each of the following areas of higher-education spending from the most important to least important. Tax credits for students and their families. Base: All Respondents Total Unweighted Base 2027 Weighted Base 2013 Effective Base 1013 Rank 1, 2 & 3 (Net) 1570 78% Rank 1 & 2 (Sub-Net) 1063 53% Rank 1 521 26% Rank 2 542 27% Rank 3 508 25% Rank 4 443 22% Sigma 2013 100%

Page 243 QuickQuery Fielding Period: April 14-17, 2017 HCAPS (Filtered on Registered Voters) Weighted To The U.S. General Adult Population - Propensity 18 Apr 2017 Table 238 ED3_3 Thinking about federal spending on higher education, how should the government prioritize spending in the following areas? Rank each of the following areas of higher-education spending from the most important to least important. Subsidies to reduce interest rates on student loans. Base: All Respondents Total Unweighted Base 2027 Weighted Base 2013 Effective Base 1013 Rank 1, 2 & 3 (Net) 1615 80% Rank 1 & 2 (Sub-Net) 944 47% Rank 1 354 18% Rank 2 589 29% Rank 3 672 33% Rank 4 398 20% Sigma 2013 100%
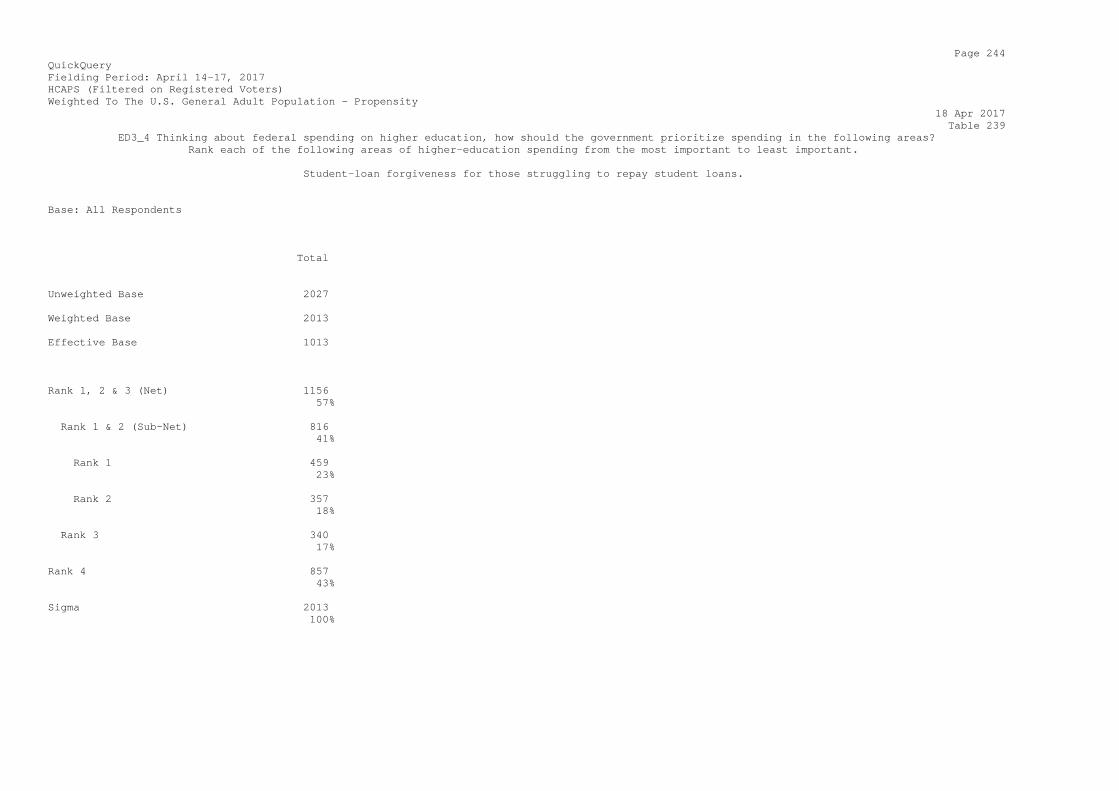
Page 244 QuickQuery Fielding Period: April 14-17, 2017 HCAPS (Filtered on Registered Voters) Weighted To The U.S. General Adult Population - Propensity 18 Apr 2017 Table 239 ED3_4 Thinking about federal spending on higher education, how should the government prioritize spending in the following areas? Rank each of the following areas of higher-education spending from the most important to least important. Student-loan forgiveness for those struggling to repay student loans. Base: All Respondents Total Unweighted Base 2027 Weighted Base 2013 Effective Base 1013 Rank 1, 2 & 3 (Net) 1156 57% Rank 1 & 2 (Sub-Net) 816 41% Rank 1 459 23% Rank 2 357 18% Rank 3 340 17% Rank 4 857 43% Sigma 2013 100%
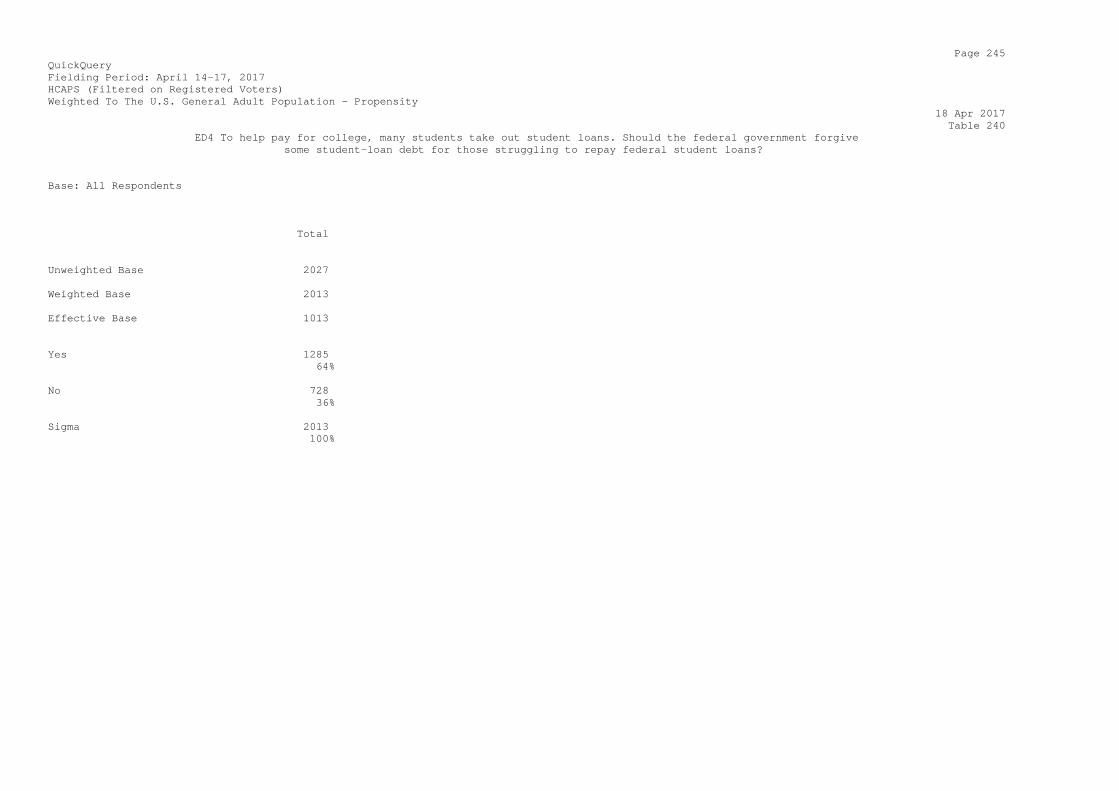
Page 245 QuickQuery Fielding Period: April 14-17, 2017 HCAPS (Filtered on Registered Voters) Weighted To The U.S. General Adult Population - Propensity 18 Apr 2017 Table 240 ED4 To help pay for college, many students take out student loans. Should the federal government forgive some student-loan debt for those struggling to repay federal student loans? Base: All Respondents Total Unweighted Base 2027 Weighted Base 2013 Effective Base 1013 Yes 1285 64% No 728 36% Sigma 2013 100%
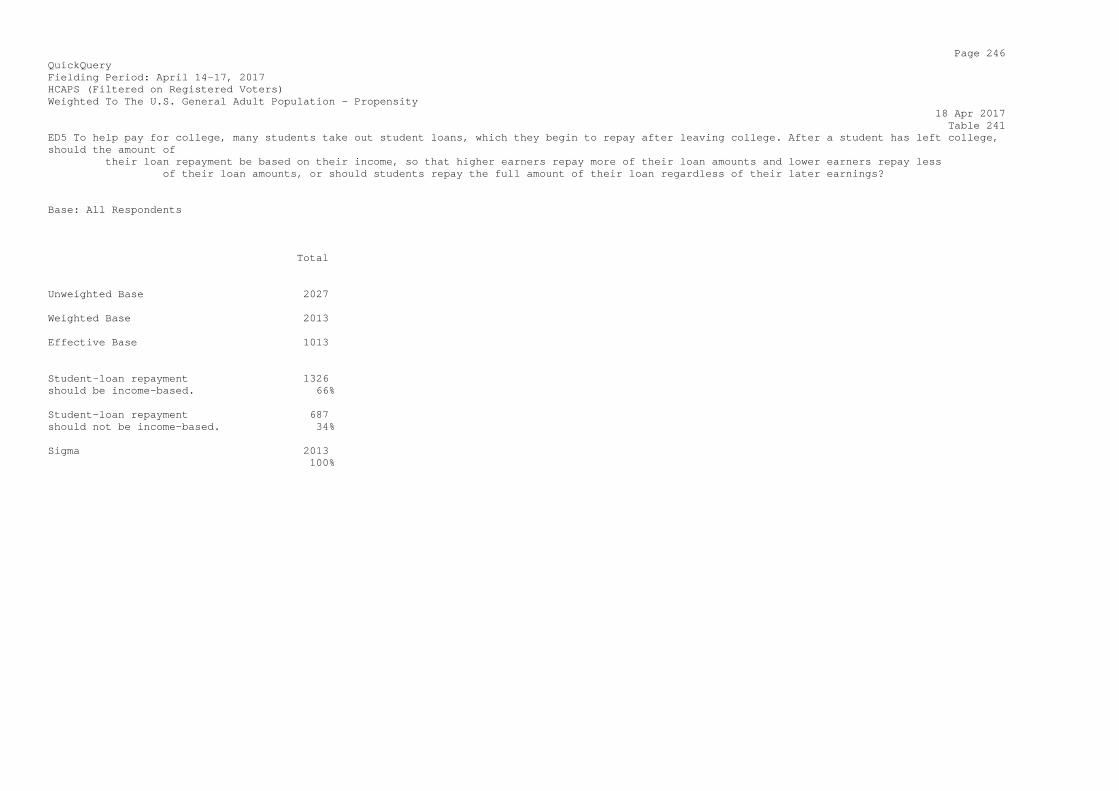
Page 246 QuickQuery Fielding Period: April 14-17, 2017 HCAPS (Filtered on Registered Voters) Weighted To The U.S. General Adult Population - Propensity 18 Apr 2017 Table 241 ED5 To help pay for college, many students take out student loans, which they begin to repay after leaving college. After a student has left college, should the amount of their loan repayment be based on their income, so that higher earners repay more of their loan amounts and lower earners repay less of their loan amounts, or should students repay the full amount of their loan regardless of their later earnings? Base: All Respondents Total Unweighted Base 2027 Weighted Base 2013 Effective Base 1013 Student-loan repayment 1326 should be income-based. 66% Student-loan repayment 687 should not be income-based. 34% Sigma 2013 100%
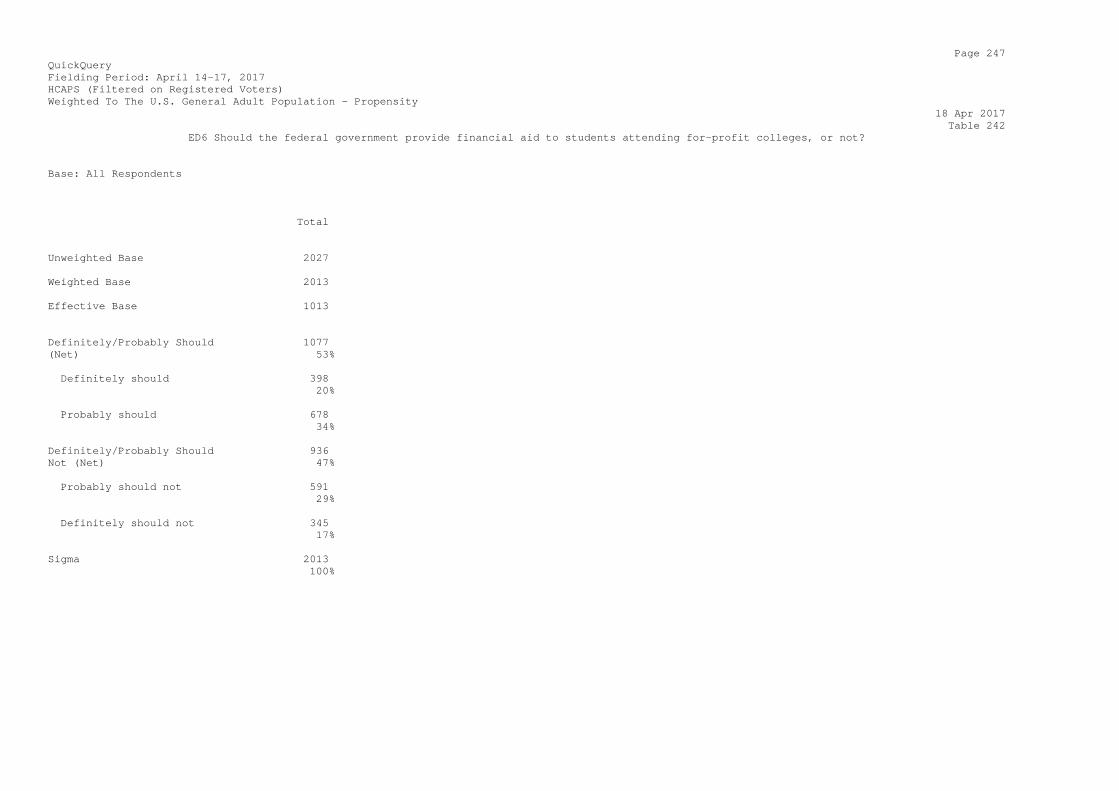
Page 247 QuickQuery Fielding Period: April 14-17, 2017 HCAPS (Filtered on Registered Voters) Weighted To The U.S. General Adult Population - Propensity 18 Apr 2017 Table 242 ED6 Should the federal government provide financial aid to students attending for-profit colleges, or not? Base: All Respondents Total Unweighted Base 2027 Weighted Base 2013 Effective Base 1013 Definitely/Probably Should 1077 (Net) 53% Definitely should 398 20% Probably should 678 34% Definitely/Probably Should 936 Not (Net) 47% Probably should not 591 29% Definitely should not 345 17% Sigma 2013 100%
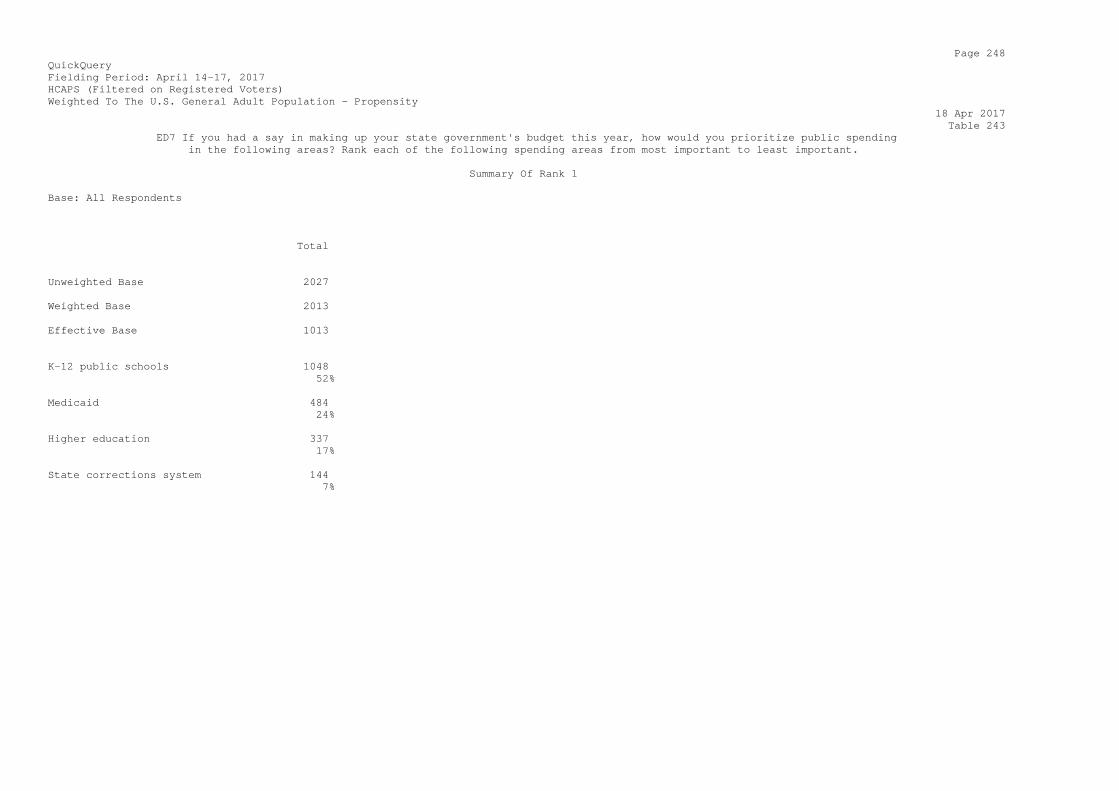
Page 248 QuickQuery Fielding Period: April 14-17, 2017 HCAPS (Filtered on Registered Voters) Weighted To The U.S. General Adult Population - Propensity 18 Apr 2017 Table 243 ED7 If you had a say in making up your state government's budget this year, how would you prioritize public spending in the following areas? Rank each of the following spending areas from most important to least important. Summary Of Rank 1 Base: All Respondents Total Unweighted Base 2027 Weighted Base 2013 Effective Base 1013 K-12 public schools 1048 52% Medicaid 484 24% Higher education 337 17% State corrections system 144 7%
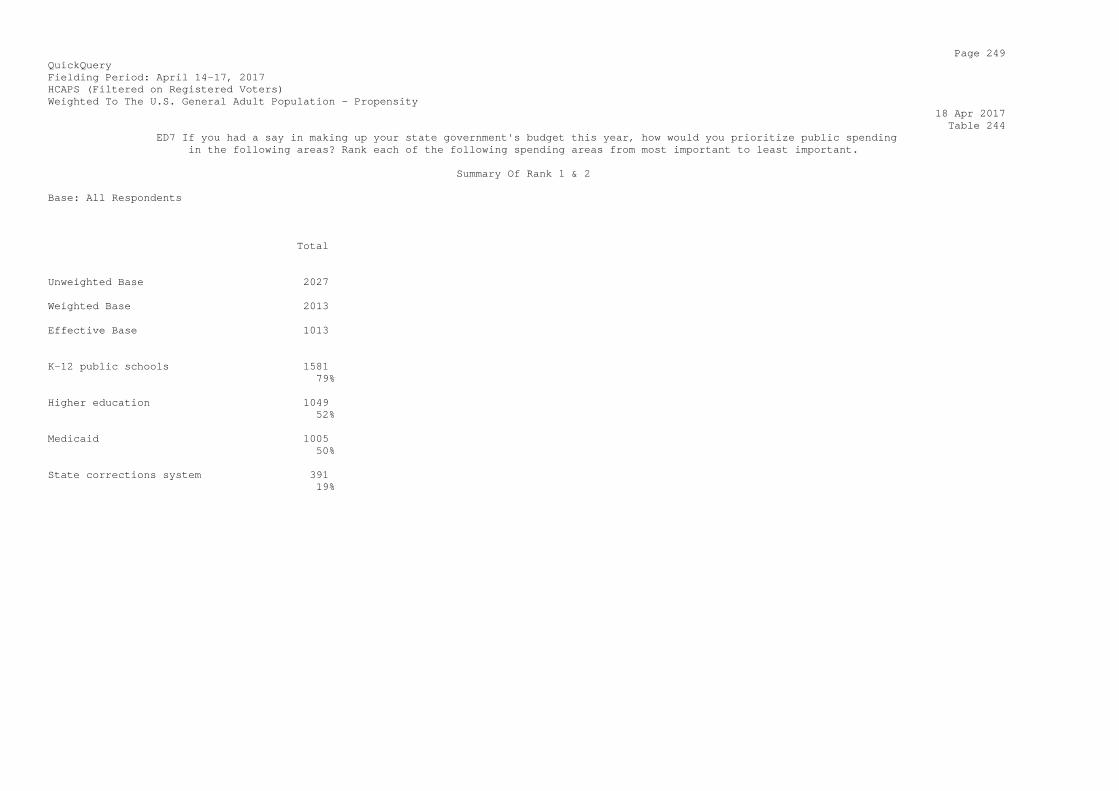
Page 249 QuickQuery Fielding Period: April 14-17, 2017 HCAPS (Filtered on Registered Voters) Weighted To The U.S. General Adult Population - Propensity 18 Apr 2017 Table 244 ED7 If you had a say in making up your state government's budget this year, how would you prioritize public spending in the following areas? Rank each of the following spending areas from most important to least important. Summary Of Rank 1 & 2 Base: All Respondents Total Unweighted Base 2027 Weighted Base 2013 Effective Base 1013 K-12 public schools 1581 79% Higher education 1049 52% Medicaid 1005 50% State corrections system 391 19%
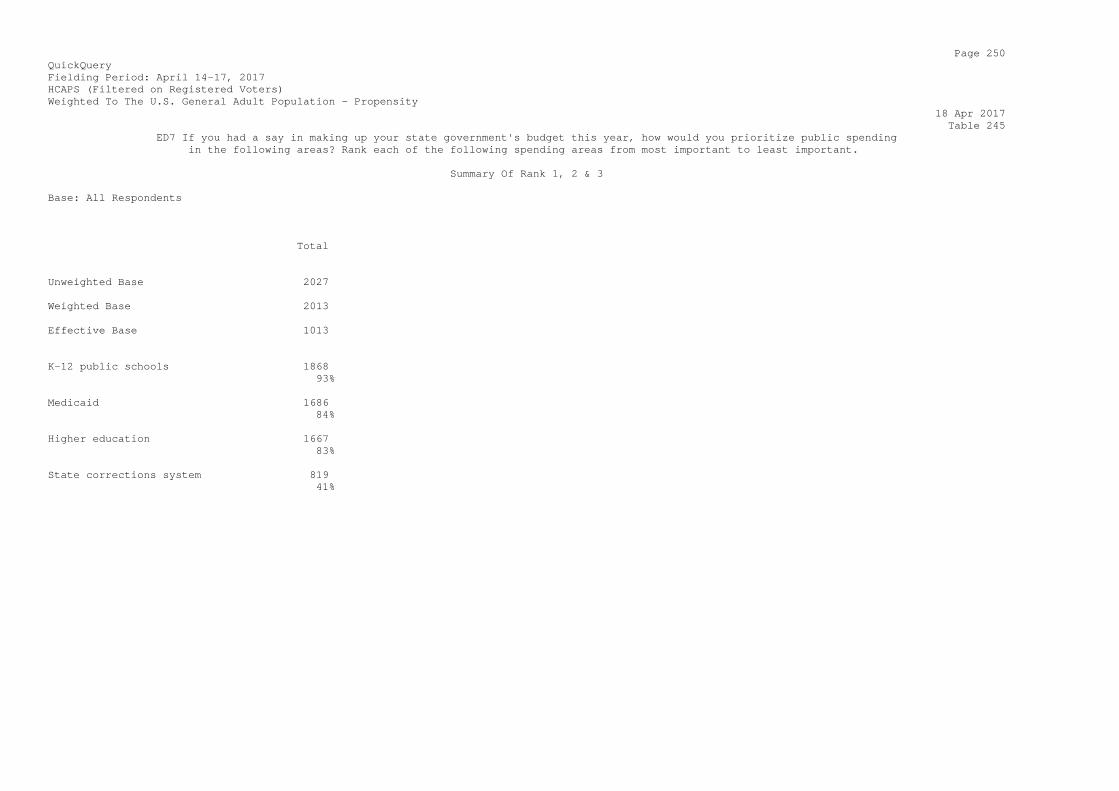
Page 250 QuickQuery Fielding Period: April 14-17, 2017 HCAPS (Filtered on Registered Voters) Weighted To The U.S. General Adult Population - Propensity 18 Apr 2017 Table 245 ED7 If you had a say in making up your state government's budget this year, how would you prioritize public spending in the following areas? Rank each of the following spending areas from most important to least important. Summary Of Rank 1, 2 & 3 Base: All Respondents Total Unweighted Base 2027 Weighted Base 2013 Effective Base 1013 K-12 public schools 1868 93% Medicaid 1686 84% Higher education 1667 83% State corrections system 819 41%

Page 251 QuickQuery Fielding Period: April 14-17, 2017 HCAPS (Filtered on Registered Voters) Weighted To The U.S. General Adult Population - Propensity 18 Apr 2017 Table 246 ED7_1 If you had a say in making up your state government's budget this year, how would you prioritize public spending in the following areas? Rank each of the following spending areas from most important to least important. Medicaid Base: All Respondents Total Unweighted Base 2027 Weighted Base 2013 Effective Base 1013 Rank 1, 2 & 3 (Net) 1686 84% Rank 1 & 2 (Sub-Net) 1005 50% Rank 1 484 24% Rank 2 521 26% Rank 3 681 34% Rank 4 327 16% Sigma 2013 100%

Page 252 QuickQuery Fielding Period: April 14-17, 2017 HCAPS (Filtered on Registered Voters) Weighted To The U.S. General Adult Population - Propensity 18 Apr 2017 Table 247 ED7_2 If you had a say in making up your state government's budget this year, how would you prioritize public spending in the following areas? Rank each of the following spending areas from most important to least important. K-12 public schools Base: All Respondents Total Unweighted Base 2027 Weighted Base 2013 Effective Base 1013 Rank 1, 2 & 3 (Net) 1868 93% Rank 1 & 2 (Sub-Net) 1581 79% Rank 1 1048 52% Rank 2 533 26% Rank 3 287 14% Rank 4 145 7% Sigma 2013 100%
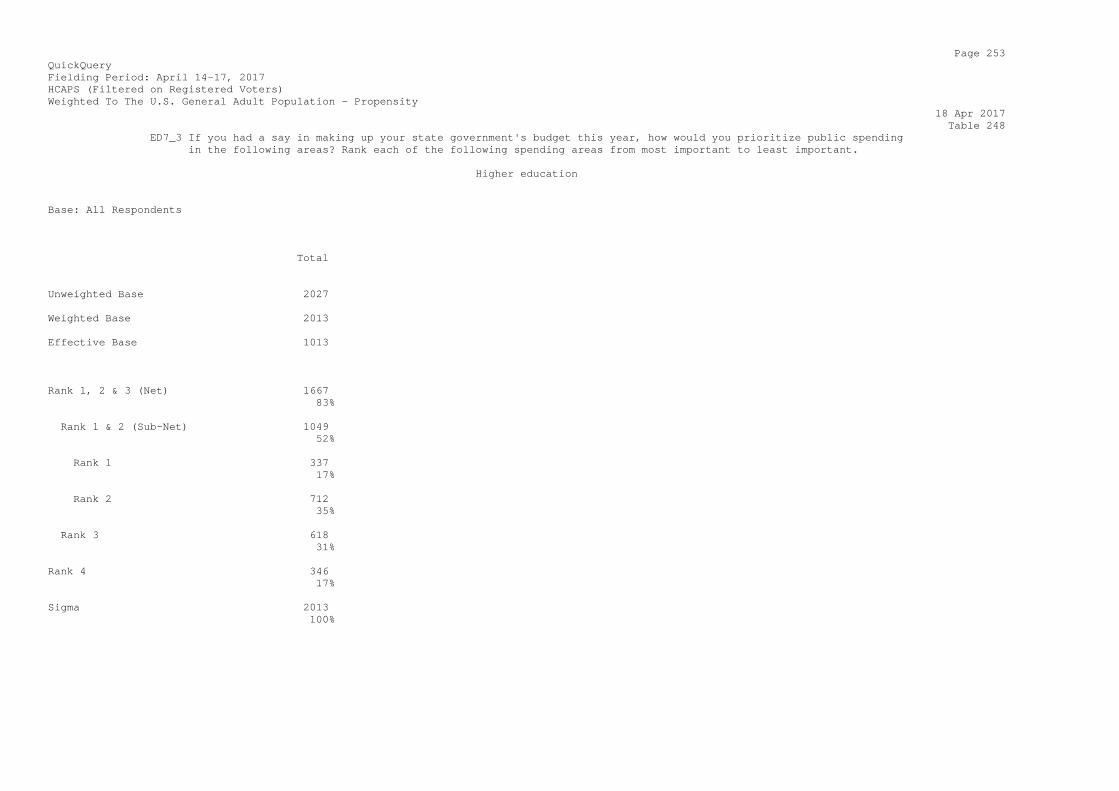
Page 253 QuickQuery Fielding Period: April 14-17, 2017 HCAPS (Filtered on Registered Voters) Weighted To The U.S. General Adult Population - Propensity 18 Apr 2017 Table 248 ED7_3 If you had a say in making up your state government's budget this year, how would you prioritize public spending in the following areas? Rank each of the following spending areas from most important to least important. Higher education Base: All Respondents Total Unweighted Base 2027 Weighted Base 2013 Effective Base 1013 Rank 1, 2 & 3 (Net) 1667 83% Rank 1 & 2 (Sub-Net) 1049 52% Rank 1 337 17% Rank 2 712 35% Rank 3 618 31% Rank 4 346 17% Sigma 2013 100%

Page 254 QuickQuery Fielding Period: April 14-17, 2017 HCAPS (Filtered on Registered Voters) Weighted To The U.S. General Adult Population - Propensity 18 Apr 2017 Table 249 ED7_4 If you had a say in making up your state government's budget this year, how would you prioritize public spending in the following areas? Rank each of the following spending areas from most important to least important. State corrections system Base: All Respondents Total Unweighted Base 2027 Weighted Base 2013 Effective Base 1013 Rank 1, 2 & 3 (Net) 819 41% Rank 1 & 2 (Sub-Net) 391 19% Rank 1 144 7% Rank 2 247 12% Rank 3 427 21% Rank 4 1195 59% Sigma 2013 100%
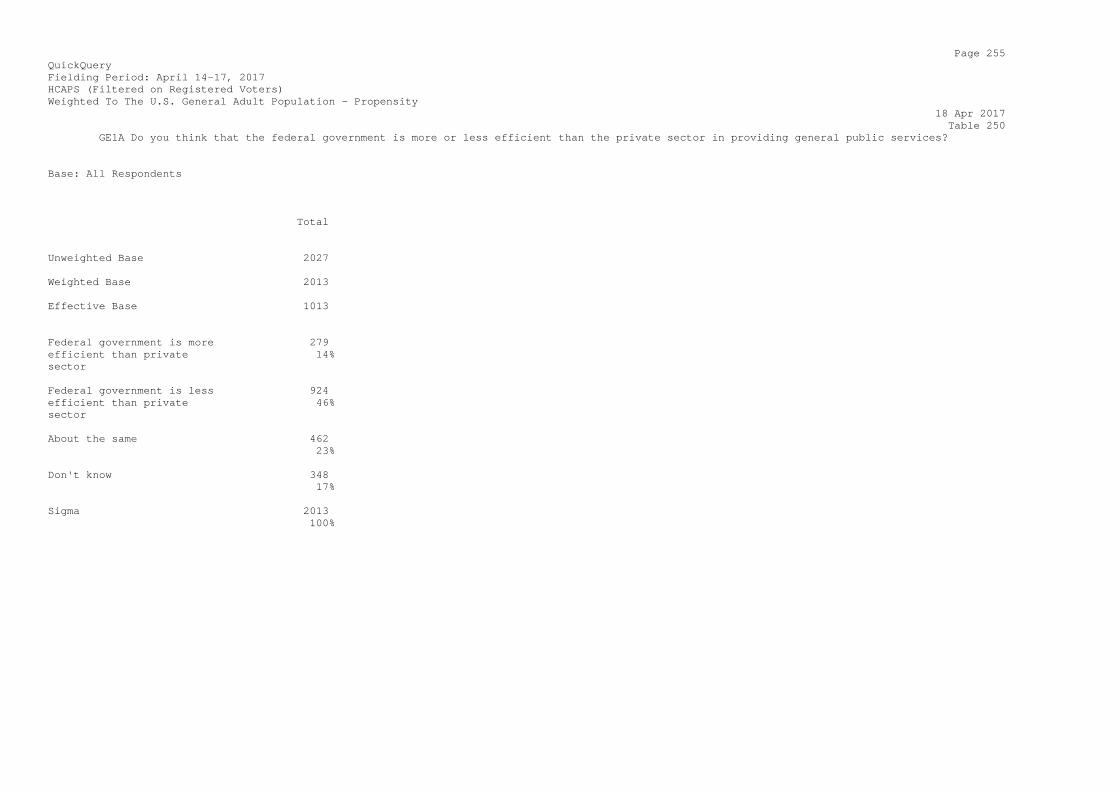
Page 255 QuickQuery Fielding Period: April 14-17, 2017 HCAPS (Filtered on Registered Voters) Weighted To The U.S. General Adult Population - Propensity 18 Apr 2017 Table 250 GE1A Do you think that the federal government is more or less efficient than the private sector in providing general public services? Base: All Respondents Total Unweighted Base 2027 Weighted Base 2013 Effective Base 1013 Federal government is more 279 efficient than private 14% sector Federal government is less 924 efficient than private 46% sector About the same 462 23% Don't know 348 17% Sigma 2013 100%
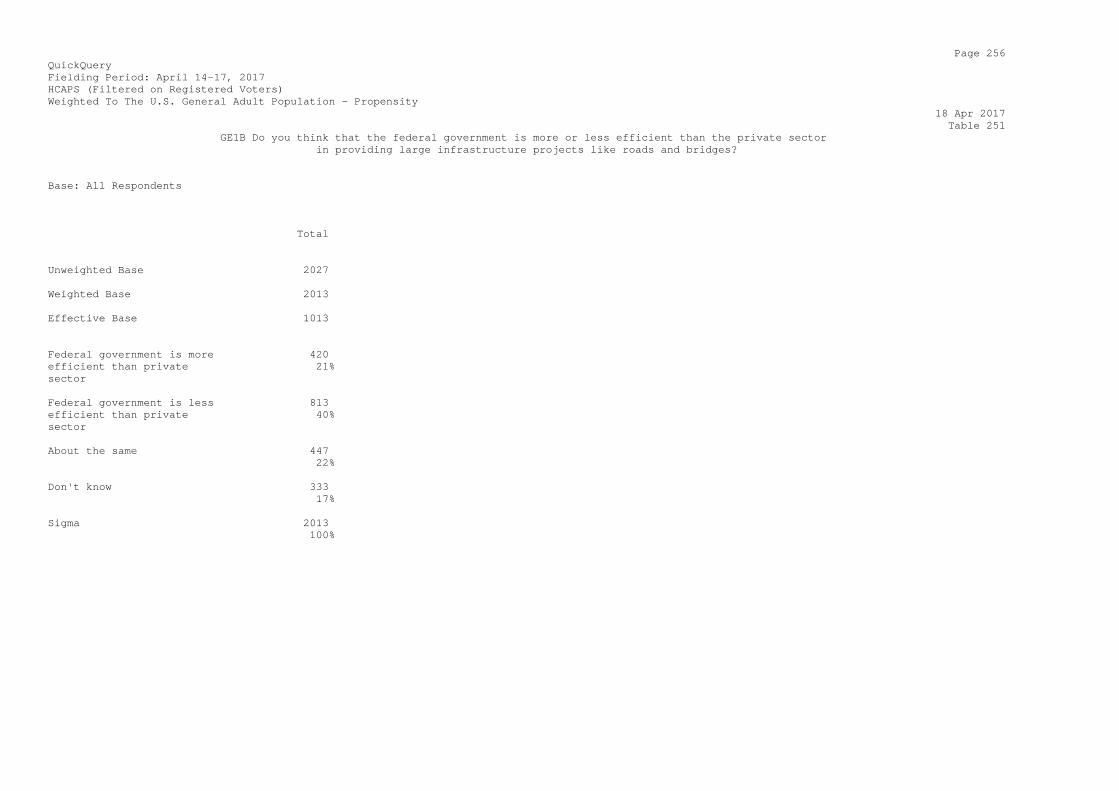
Page 256 QuickQuery Fielding Period: April 14-17, 2017 HCAPS (Filtered on Registered Voters) Weighted To The U.S. General Adult Population - Propensity 18 Apr 2017 Table 251 GE1B Do you think that the federal government is more or less efficient than the private sector in providing large infrastructure projects like roads and bridges? Base: All Respondents Total Unweighted Base 2027 Weighted Base 2013 Effective Base 1013 Federal government is more 420 efficient than private 21% sector Federal government is less 813 efficient than private 40% sector About the same 447 22% Don't know 333 17% Sigma 2013 100%
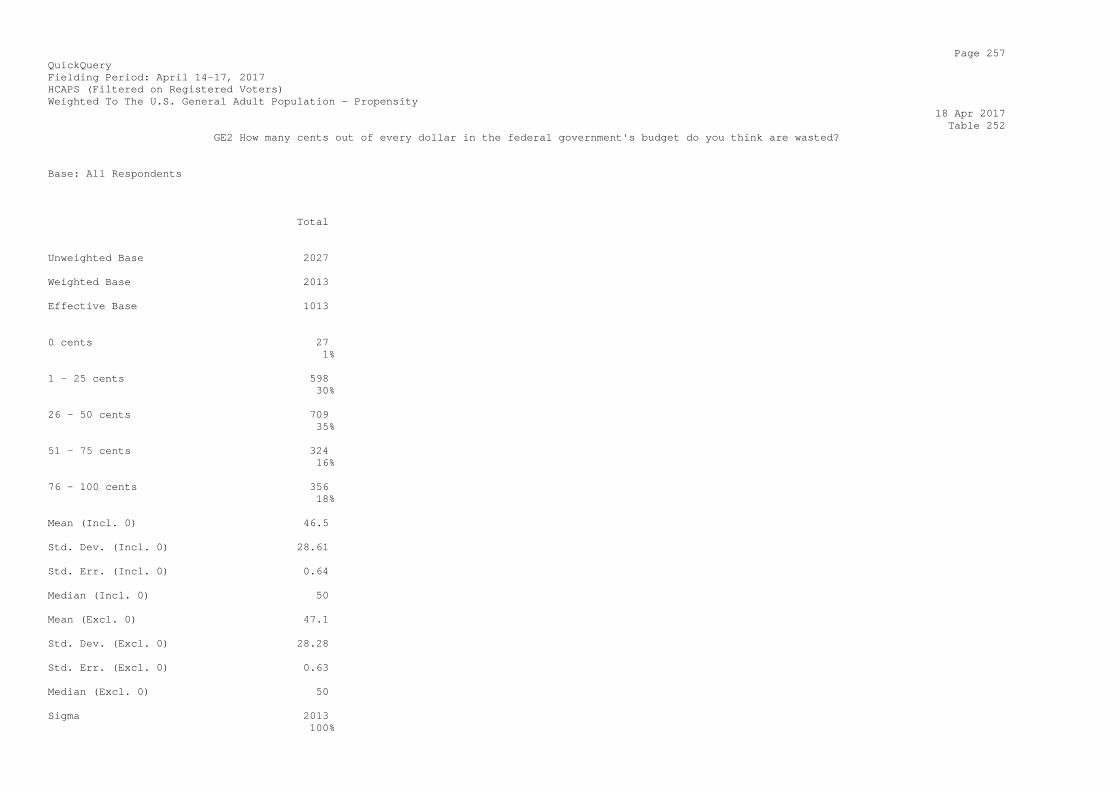
Page 257 QuickQuery Fielding Period: April 14-17, 2017 HCAPS (Filtered on Registered Voters) Weighted To The U.S. General Adult Population - Propensity 18 Apr 2017 Table 252 GE2 How many cents out of every dollar in the federal government's budget do you think are wasted? Base: All Respondents Total Unweighted Base 2027 Weighted Base 2013 Effective Base 1013 0 cents 27 1% 1 - 25 cents 598 30% 26 - 50 cents 709 35% 51 - 75 cents 324 16% 76 - 100 cents 356 18% Mean (Incl. 0) 46.5 Std. Dev. (Incl. 0) 28.61 Std. Err. (Incl. 0) 0.64 Median (Incl. 0) 50 Mean (Excl. 0) 47.1 Std. Dev. (Excl. 0) 28.28 Std. Err. (Excl. 0) 0.63 Median (Excl. 0) 50 Sigma 2013 100%
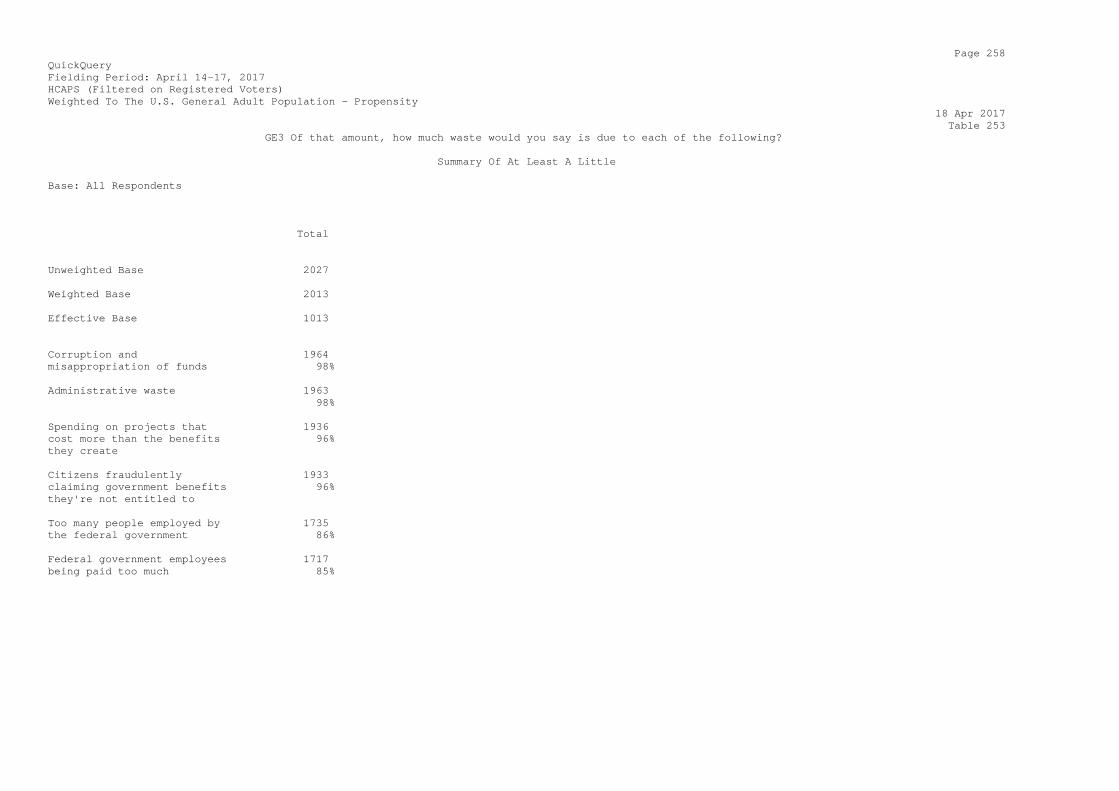
Page 258 QuickQuery Fielding Period: April 14-17, 2017 HCAPS (Filtered on Registered Voters) Weighted To The U.S. General Adult Population - Propensity 18 Apr 2017 Table 253 GE3 Of that amount, how much waste would you say is due to each of the following? Summary Of At Least A Little Base: All Respondents Total Unweighted Base 2027 Weighted Base 2013 Effective Base 1013 Corruption and 1964 misappropriation of funds 98% Administrative waste 1963 98% Spending on projects that 1936 cost more than the benefits 96% they create Citizens fraudulently 1933 claiming government benefits 96% they're not entitled to Too many people employed by 1735 the federal government 86% Federal government employees 1717 being paid too much 85%
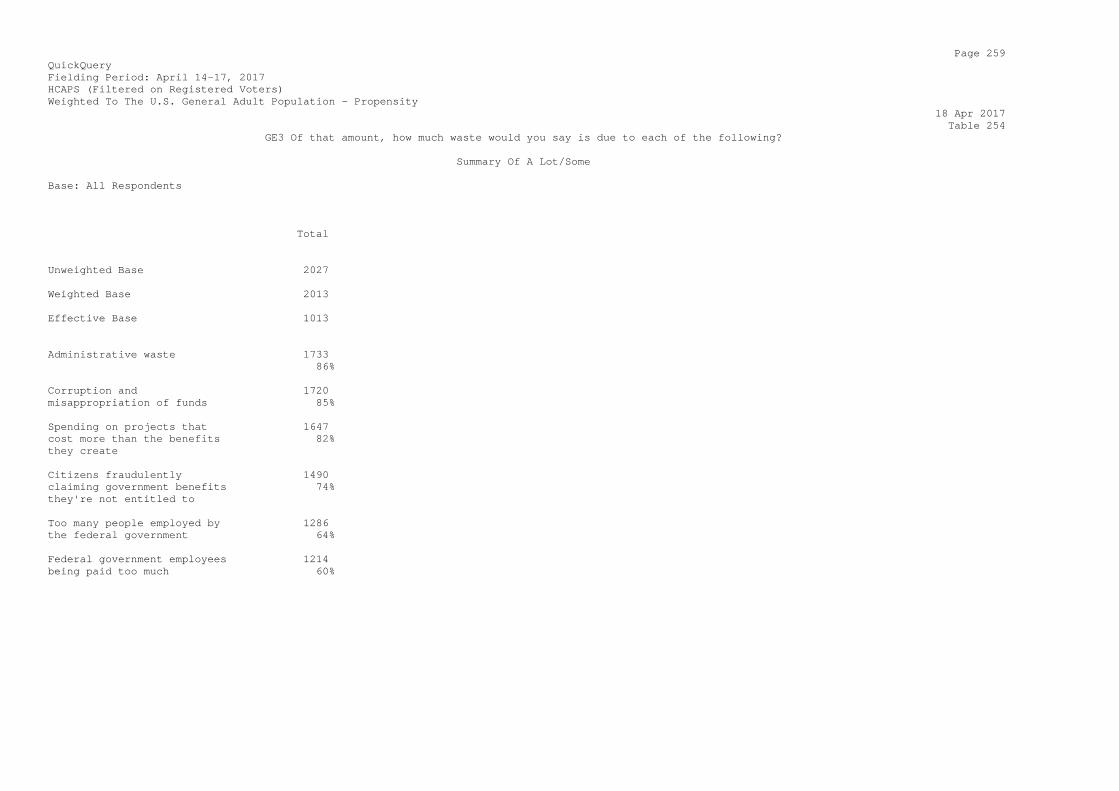
Page 259 QuickQuery Fielding Period: April 14-17, 2017 HCAPS (Filtered on Registered Voters) Weighted To The U.S. General Adult Population - Propensity 18 Apr 2017 Table 254 GE3 Of that amount, how much waste would you say is due to each of the following? Summary Of A Lot/Some Base: All Respondents Total Unweighted Base 2027 Weighted Base 2013 Effective Base 1013 Administrative waste 1733 86% Corruption and 1720 misappropriation of funds 85% Spending on projects that 1647 cost more than the benefits 82% they create Citizens fraudulently 1490 claiming government benefits 74% they're not entitled to Too many people employed by 1286 the federal government 64% Federal government employees 1214 being paid too much 60%
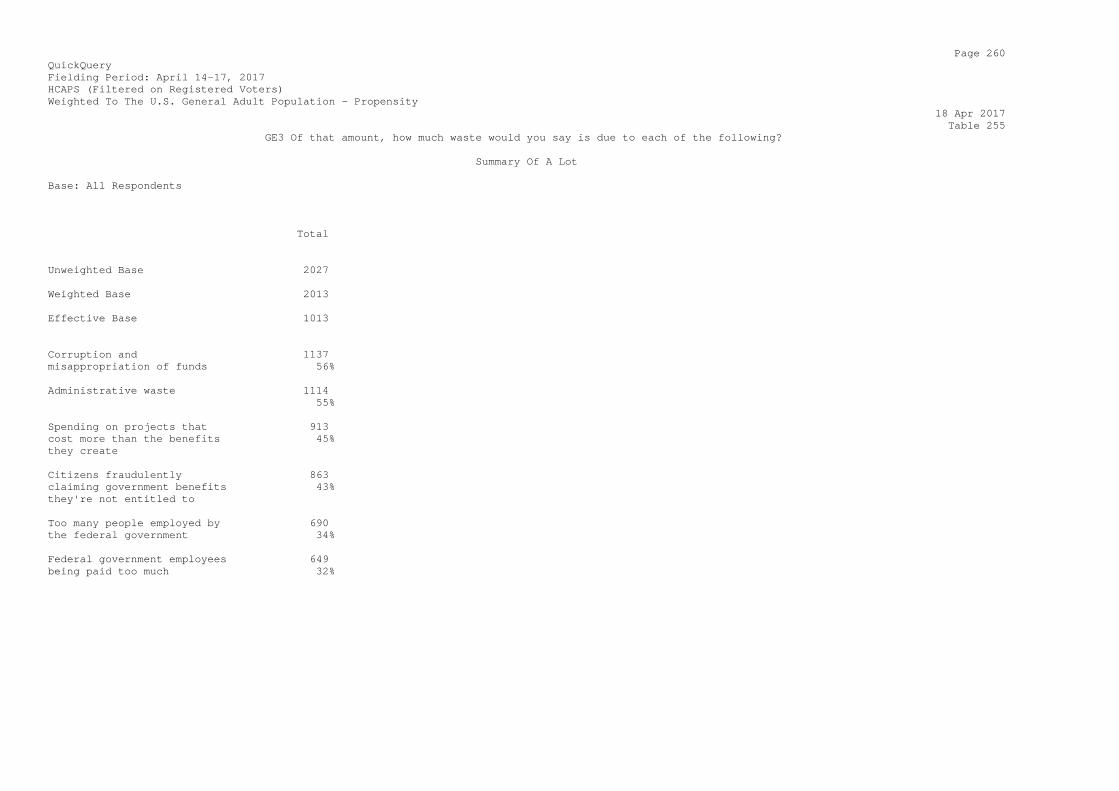
Page 260 QuickQuery Fielding Period: April 14-17, 2017 HCAPS (Filtered on Registered Voters) Weighted To The U.S. General Adult Population - Propensity 18 Apr 2017 Table 255 GE3 Of that amount, how much waste would you say is due to each of the following? Summary Of A Lot Base: All Respondents Total Unweighted Base 2027 Weighted Base 2013 Effective Base 1013 Corruption and 1137 misappropriation of funds 56% Administrative waste 1114 55% Spending on projects that 913 cost more than the benefits 45% they create Citizens fraudulently 863 claiming government benefits 43% they're not entitled to Too many people employed by 690 the federal government 34% Federal government employees 649 being paid too much 32%
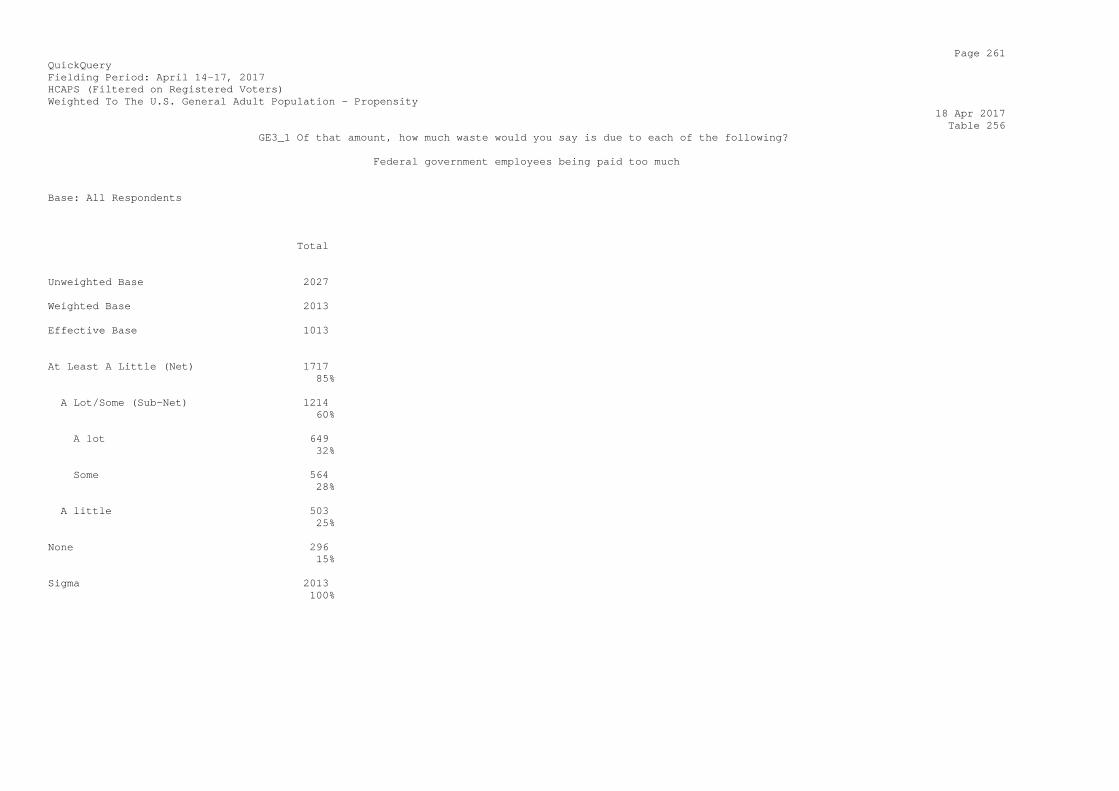
Page 261 QuickQuery Fielding Period: April 14-17, 2017 HCAPS (Filtered on Registered Voters) Weighted To The U.S. General Adult Population - Propensity 18 Apr 2017 Table 256 GE3_1 Of that amount, how much waste would you say is due to each of the following? Federal government employees being paid too much Base: All Respondents Total Unweighted Base 2027 Weighted Base 2013 Effective Base 1013 At Least A Little (Net) 1717 85% A Lot/Some (Sub-Net) 1214 60% A lot 649 32% Some 564 28% A little 503 25% None 296 15% Sigma 2013 100%
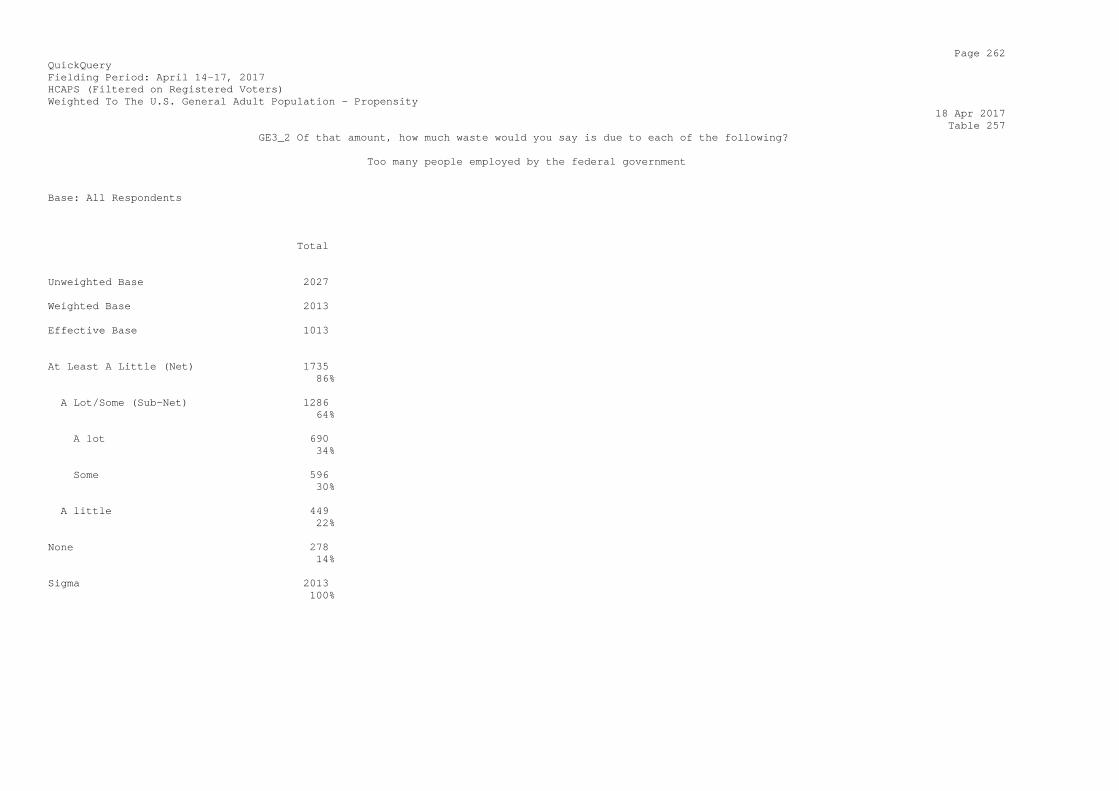
Page 262 QuickQuery Fielding Period: April 14-17, 2017 HCAPS (Filtered on Registered Voters) Weighted To The U.S. General Adult Population - Propensity 18 Apr 2017 Table 257 GE3_2 Of that amount, how much waste would you say is due to each of the following? Too many people employed by the federal government Base: All Respondents Total Unweighted Base 2027 Weighted Base 2013 Effective Base 1013 At Least A Little (Net) 1735 86% A Lot/Some (Sub-Net) 1286 64% A lot 690 34% Some 596 30% A little 449 22% None 278 14% Sigma 2013 100%
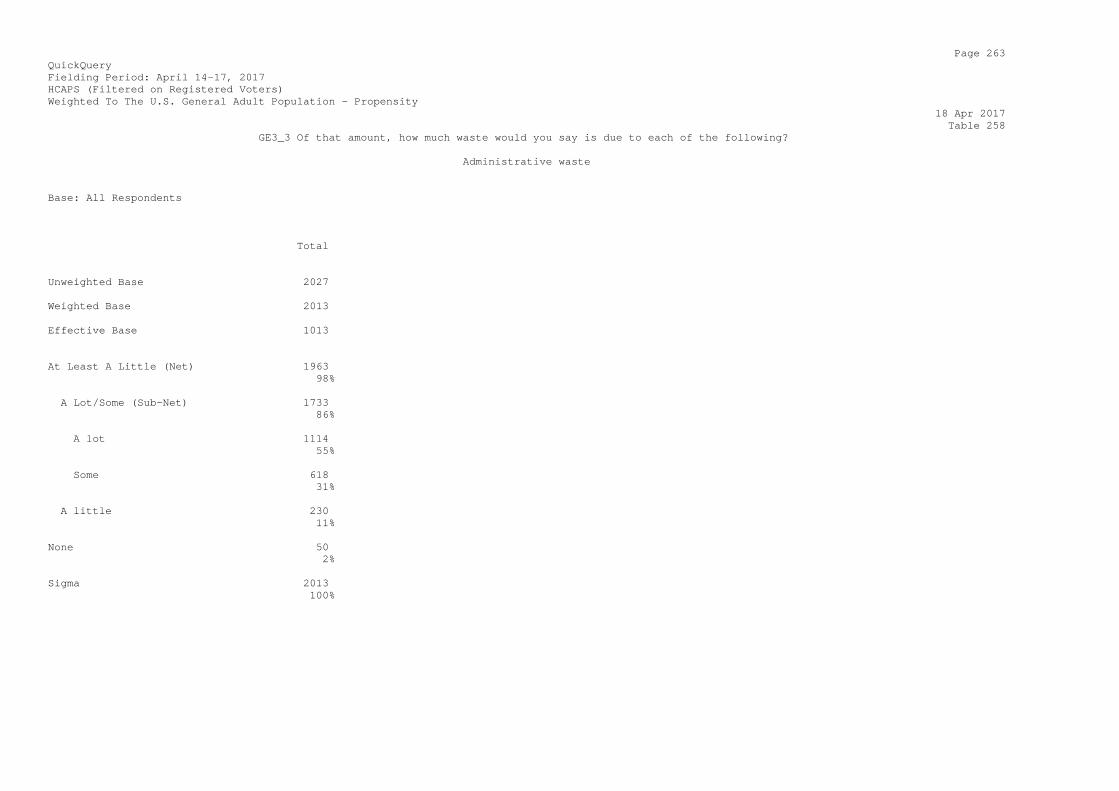
Page 263 QuickQuery Fielding Period: April 14-17, 2017 HCAPS (Filtered on Registered Voters) Weighted To The U.S. General Adult Population - Propensity 18 Apr 2017 Table 258 GE3_3 Of that amount, how much waste would you say is due to each of the following? Administrative waste Base: All Respondents Total Unweighted Base 2027 Weighted Base 2013 Effective Base 1013 At Least A Little (Net) 1963 98% A Lot/Some (Sub-Net) 1733 86% A lot 1114 55% Some 618 31% A little 230 11% None 50 2% Sigma 2013 100%

Page 264 QuickQuery Fielding Period: April 14-17, 2017 HCAPS (Filtered on Registered Voters) Weighted To The U.S. General Adult Population - Propensity 18 Apr 2017 Table 259 GE3_4 Of that amount, how much waste would you say is due to each of the following? Corruption and misappropriation of funds Base: All Respondents Total Unweighted Base 2027 Weighted Base 2013 Effective Base 1013 At Least A Little (Net) 1964 98% A Lot/Some (Sub-Net) 1720 85% A lot 1137 56% Some 583 29% A little 244 12% None 49 2% Sigma 2013 100%
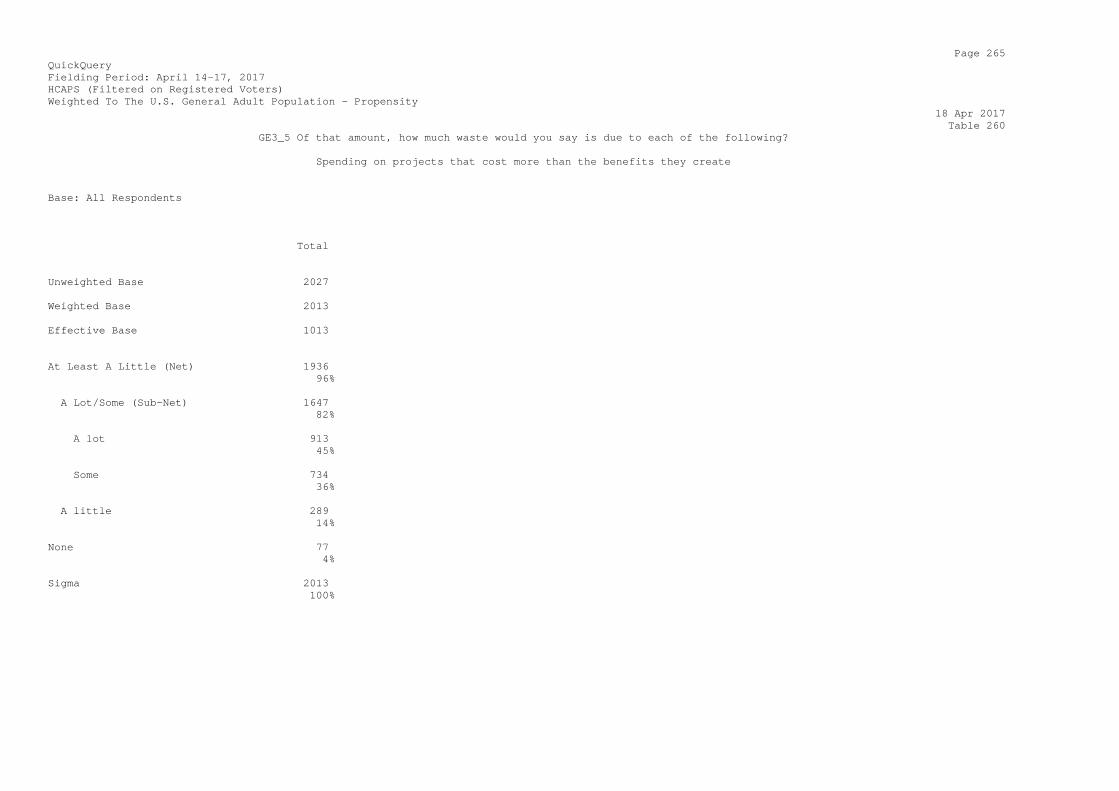
Page 265 QuickQuery Fielding Period: April 14-17, 2017 HCAPS (Filtered on Registered Voters) Weighted To The U.S. General Adult Population - Propensity 18 Apr 2017 Table 260 GE3_5 Of that amount, how much waste would you say is due to each of the following? Spending on projects that cost more than the benefits they create Base: All Respondents Total Unweighted Base 2027 Weighted Base 2013 Effective Base 1013 At Least A Little (Net) 1936 96% A Lot/Some (Sub-Net) 1647 82% A lot 913 45% Some 734 36% A little 289 14% None 77 4% Sigma 2013 100%
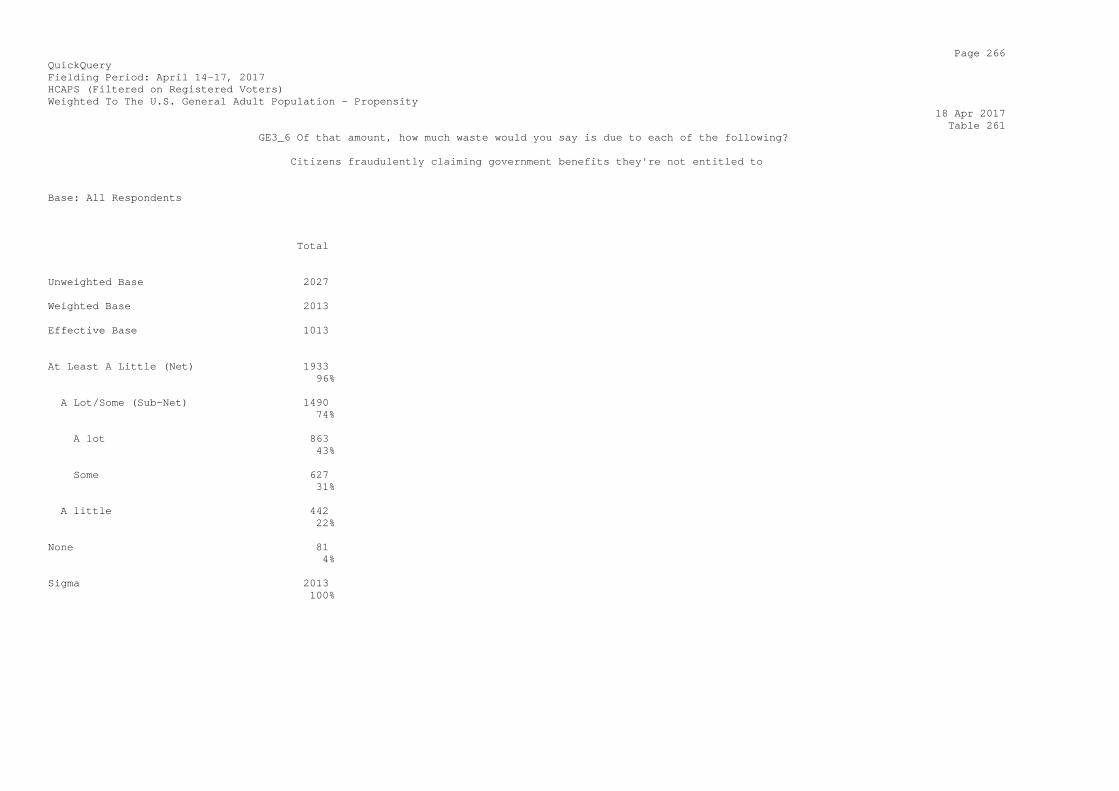
Page 266 QuickQuery Fielding Period: April 14-17, 2017 HCAPS (Filtered on Registered Voters) Weighted To The U.S. General Adult Population - Propensity 18 Apr 2017 Table 261 GE3_6 Of that amount, how much waste would you say is due to each of the following? Citizens fraudulently claiming government benefits they're not entitled to Base: All Respondents Total Unweighted Base 2027 Weighted Base 2013 Effective Base 1013 At Least A Little (Net) 1933 96% A Lot/Some (Sub-Net) 1490 74% A lot 863 43% Some 627 31% A little 442 22% None 81 4% Sigma 2013 100%
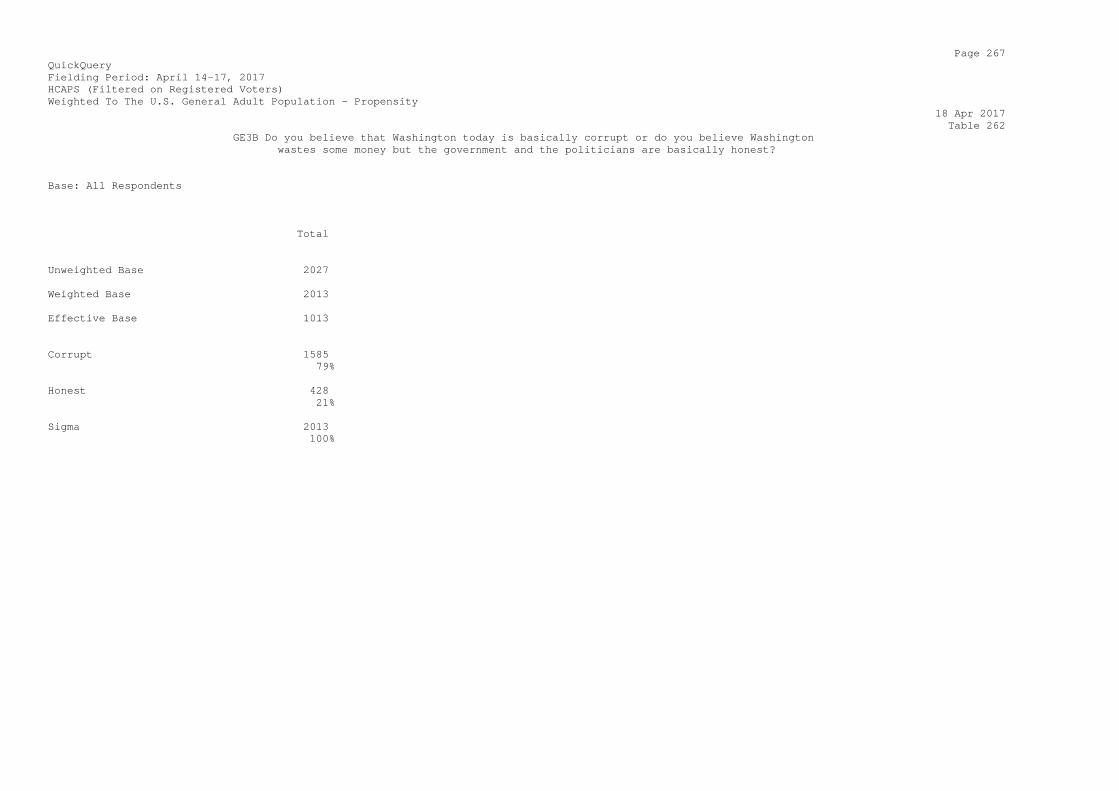
Page 267 QuickQuery Fielding Period: April 14-17, 2017 HCAPS (Filtered on Registered Voters) Weighted To The U.S. General Adult Population - Propensity 18 Apr 2017 Table 262 GE3B Do you believe that Washington today is basically corrupt or do you believe Washington wastes some money but the government and the politicians are basically honest? Base: All Respondents Total Unweighted Base 2027 Weighted Base 2013 Effective Base 1013 Corrupt 1585 79% Honest 428 21% Sigma 2013 100%
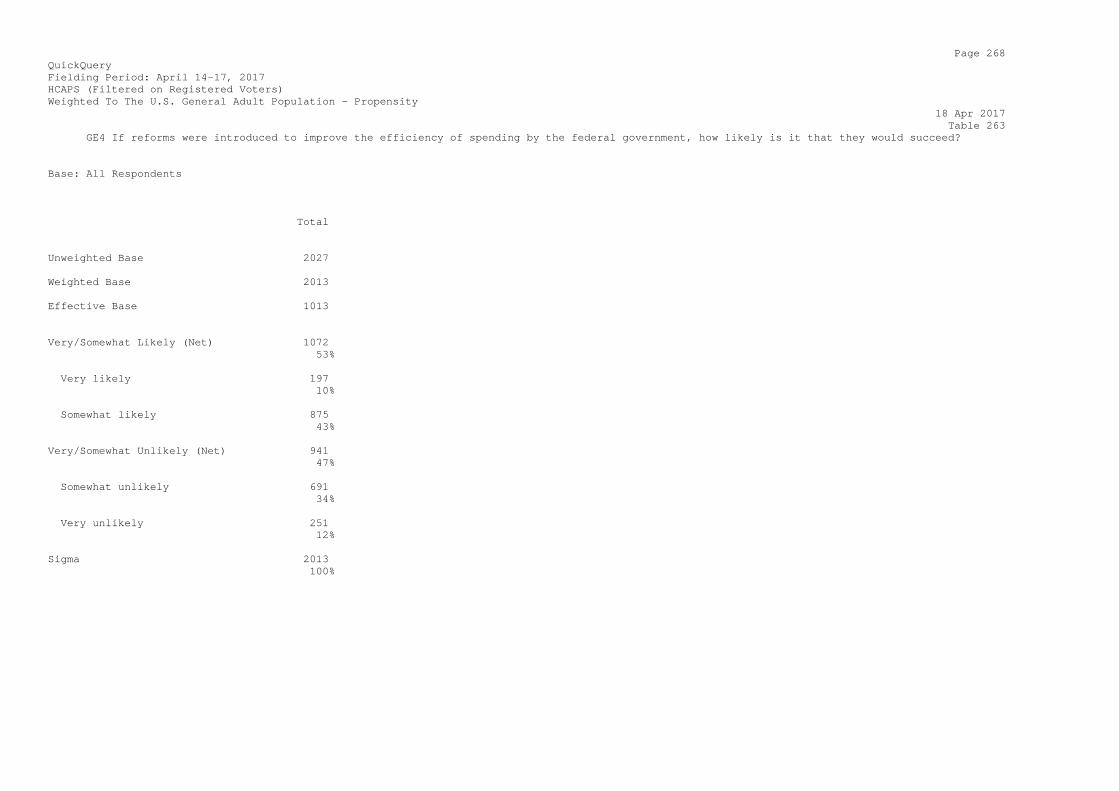
Page 268 QuickQuery Fielding Period: April 14-17, 2017 HCAPS (Filtered on Registered Voters) Weighted To The U.S. General Adult Population - Propensity 18 Apr 2017 Table 263 GE4 If reforms were introduced to improve the efficiency of spending by the federal government, how likely is it that they would succeed? Base: All Respondents Total Unweighted Base 2027 Weighted Base 2013 Effective Base 1013 Very/Somewhat Likely (Net) 1072 53% Very likely 197 10% Somewhat likely 875 43% Very/Somewhat Unlikely (Net) 941 47% Somewhat unlikely 691 34% Very unlikely 251 12% Sigma 2013 100%
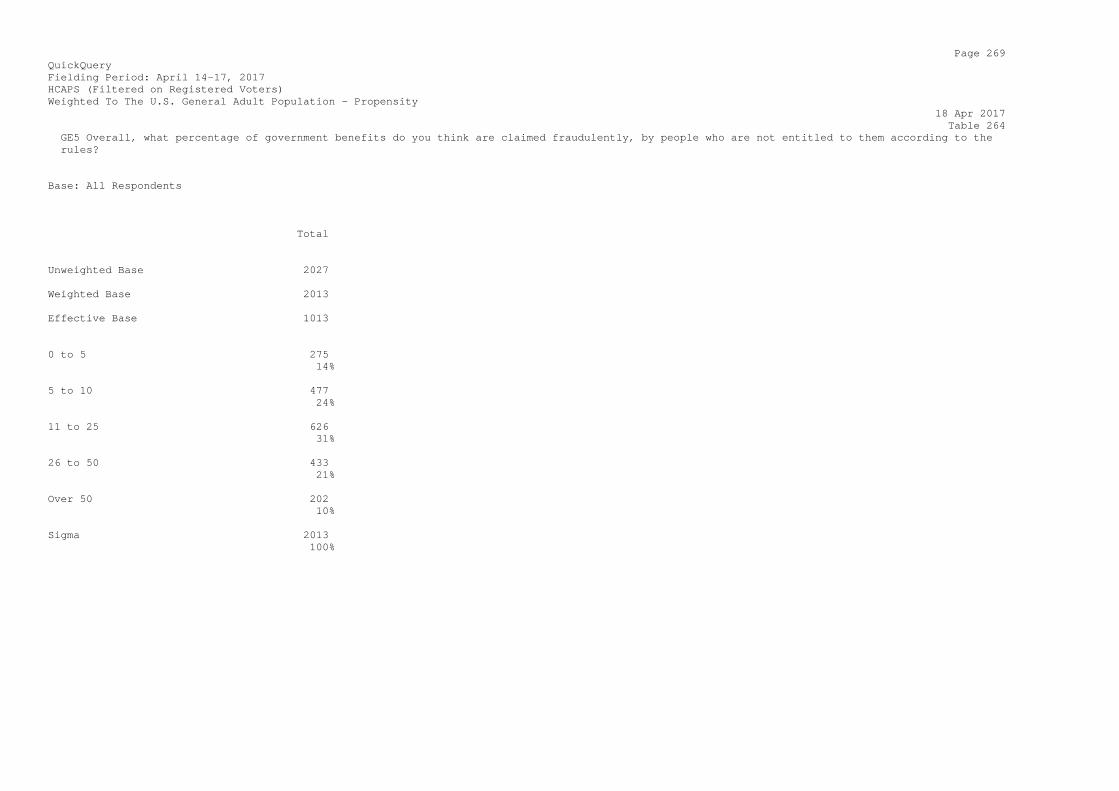
Page 269 QuickQuery Fielding Period: April 14-17, 2017 HCAPS (Filtered on Registered Voters) Weighted To The U.S. General Adult Population - Propensity 18 Apr 2017 Table 264 GE5 Overall, what percentage of government benefits do you think are claimed fraudulently, by people who are not entitled to them according to the rules? Base: All Respondents Total Unweighted Base 2027 Weighted Base 2013 Effective Base 1013 0 to 5 275 14% 5 to 10 477 24% 11 to 25 626 31% 26 to 50 433 21% Over 50 202 10% Sigma 2013 100%
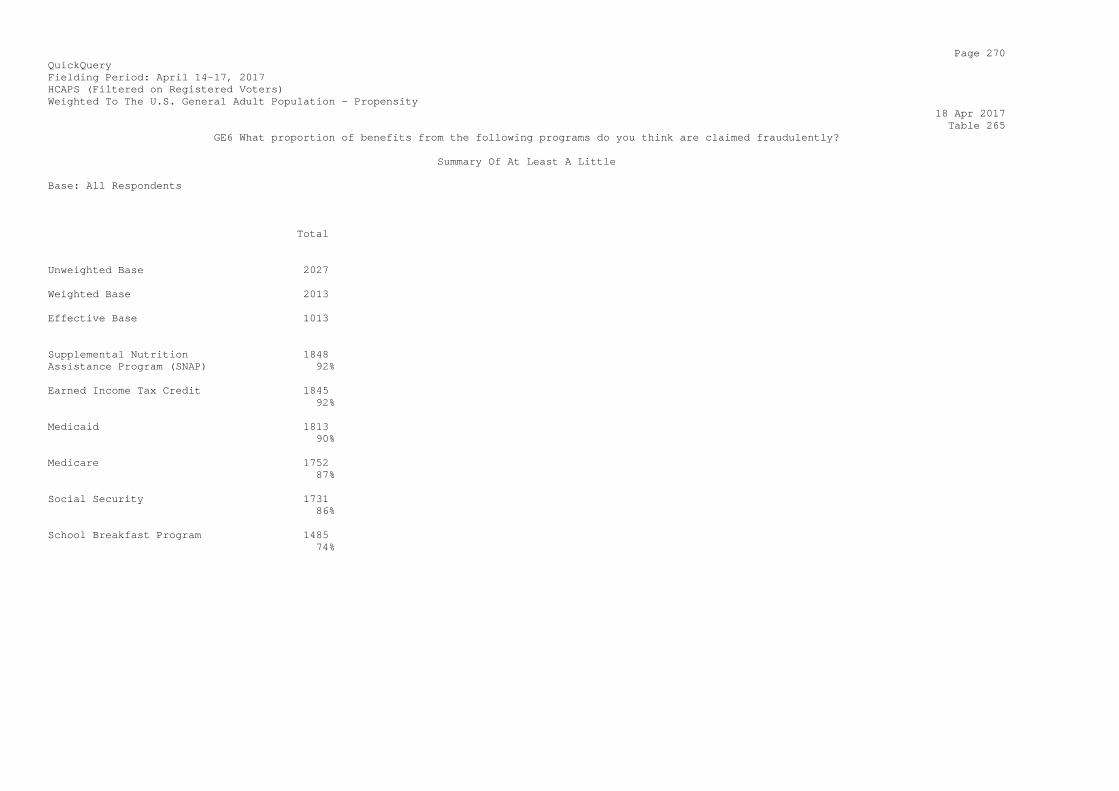
Page 270 QuickQuery Fielding Period: April 14-17, 2017 HCAPS (Filtered on Registered Voters) Weighted To The U.S. General Adult Population - Propensity 18 Apr 2017 Table 265 GE6 What proportion of benefits from the following programs do you think are claimed fraudulently? Summary Of At Least A Little Base: All Respondents Total Unweighted Base 2027 Weighted Base 2013 Effective Base 1013 Supplemental Nutrition 1848 Assistance Program (SNAP) 92% Earned Income Tax Credit 1845 92% Medicaid 1813 90% Medicare 1752 87% Social Security 1731 86% School Breakfast Program 1485 74%

Page 271 QuickQuery Fielding Period: April 14-17, 2017 HCAPS (Filtered on Registered Voters) Weighted To The U.S. General Adult Population - Propensity 18 Apr 2017 Table 266 GE6 What proportion of benefits from the following programs do you think are claimed fraudulently? Summary Of A Lot/Some Base: All Respondents Total Unweighted Base 2027 Weighted Base 2013 Effective Base 1013 Supplemental Nutrition 1328 Assistance Program (SNAP) 66% Medicaid 1239 62% Earned Income Tax Credit 1182 59% Medicare 1048 52% Social Security 1007 50% School Breakfast Program 837 42%
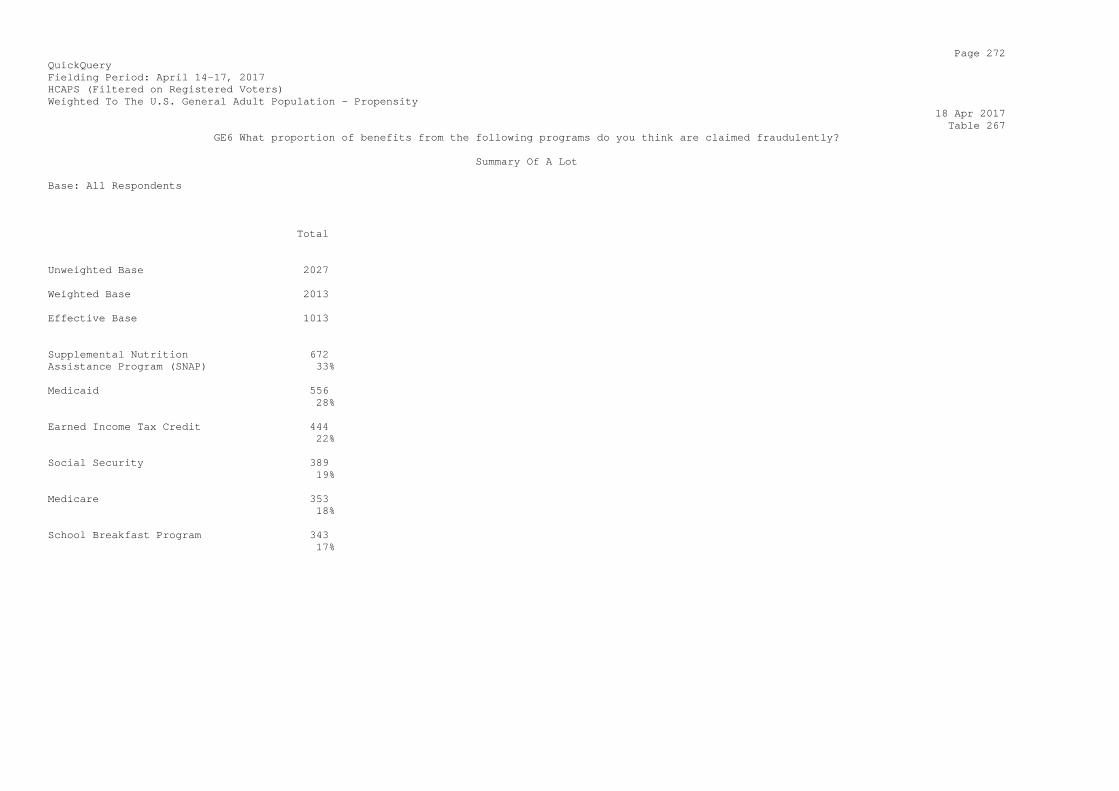
Page 272 QuickQuery Fielding Period: April 14-17, 2017 HCAPS (Filtered on Registered Voters) Weighted To The U.S. General Adult Population - Propensity 18 Apr 2017 Table 267 GE6 What proportion of benefits from the following programs do you think are claimed fraudulently? Summary Of A Lot Base: All Respondents Total Unweighted Base 2027 Weighted Base 2013 Effective Base 1013 Supplemental Nutrition 672 Assistance Program (SNAP) 33% Medicaid 556 28% Earned Income Tax Credit 444 22% Social Security 389 19% Medicare 353 18% School Breakfast Program 343 17%
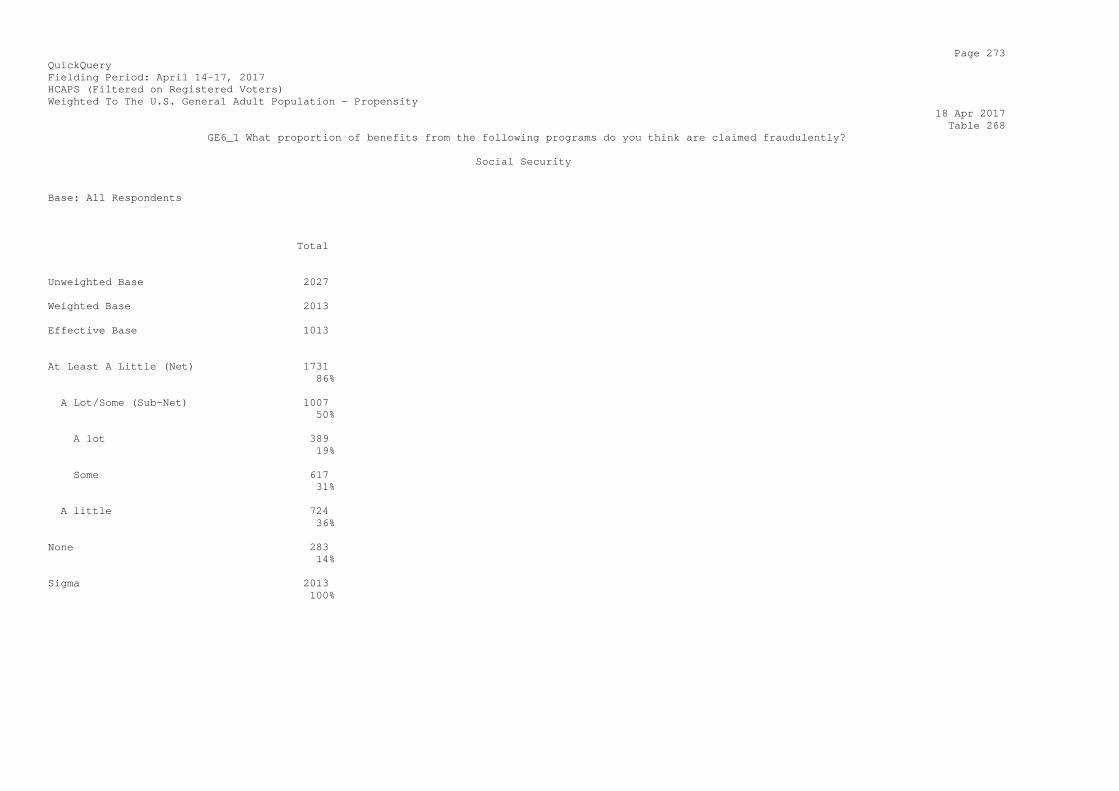
Page 273 QuickQuery Fielding Period: April 14-17, 2017 HCAPS (Filtered on Registered Voters) Weighted To The U.S. General Adult Population - Propensity 18 Apr 2017 Table 268 GE6_1 What proportion of benefits from the following programs do you think are claimed fraudulently? Social Security Base: All Respondents Total Unweighted Base 2027 Weighted Base 2013 Effective Base 1013 At Least A Little (Net) 1731 86% A Lot/Some (Sub-Net) 1007 50% A lot 389 19% Some 617 31% A little 724 36% None 283 14% Sigma 2013 100%

Page 274 QuickQuery Fielding Period: April 14-17, 2017 HCAPS (Filtered on Registered Voters) Weighted To The U.S. General Adult Population - Propensity 18 Apr 2017 Table 269 GE6_2 What proportion of benefits from the following programs do you think are claimed fraudulently? Medicare Base: All Respondents Total Unweighted Base 2027 Weighted Base 2013 Effective Base 1013 At Least A Little (Net) 1752 87% A Lot/Some (Sub-Net) 1048 52% A lot 353 18% Some 696 35% A little 704 35% None 261 13% Sigma 2013 100%

Page 275 QuickQuery Fielding Period: April 14-17, 2017 HCAPS (Filtered on Registered Voters) Weighted To The U.S. General Adult Population - Propensity 18 Apr 2017 Table 270 GE6_3 What proportion of benefits from the following programs do you think are claimed fraudulently? Medicaid Base: All Respondents Total Unweighted Base 2027 Weighted Base 2013 Effective Base 1013 At Least A Little (Net) 1813 90% A Lot/Some (Sub-Net) 1239 62% A lot 556 28% Some 683 34% A little 573 28% None 200 10% Sigma 2013 100%

Page 276 QuickQuery Fielding Period: April 14-17, 2017 HCAPS (Filtered on Registered Voters) Weighted To The U.S. General Adult Population - Propensity 18 Apr 2017 Table 271 GE6_4 What proportion of benefits from the following programs do you think are claimed fraudulently? Earned Income Tax Credit Base: All Respondents Total Unweighted Base 2027 Weighted Base 2013 Effective Base 1013 At Least A Little (Net) 1845 92% A Lot/Some (Sub-Net) 1182 59% A lot 444 22% Some 738 37% A little 663 33% None 169 8% Sigma 2013 100%

Page 277 QuickQuery Fielding Period: April 14-17, 2017 HCAPS (Filtered on Registered Voters) Weighted To The U.S. General Adult Population - Propensity 18 Apr 2017 Table 272 GE6_5 What proportion of benefits from the following programs do you think are claimed fraudulently? Supplemental Nutrition Assistance Program (SNAP) Base: All Respondents Total Unweighted Base 2027 Weighted Base 2013 Effective Base 1013 At Least A Little (Net) 1848 92% A Lot/Some (Sub-Net) 1328 66% A lot 672 33% Some 656 33% A little 520 26% None 165 8% Sigma 2013 100%

Page 278 QuickQuery Fielding Period: April 14-17, 2017 HCAPS (Filtered on Registered Voters) Weighted To The U.S. General Adult Population - Propensity 18 Apr 2017 Table 273 GE6_6 What proportion of benefits from the following programs do you think are claimed fraudulently? School Breakfast Program Base: All Respondents Total Unweighted Base 2027 Weighted Base 2013 Effective Base 1013 At Least A Little (Net) 1485 74% A Lot/Some (Sub-Net) 837 42% A lot 343 17% Some 493 25% A little 649 32% None 528 26% Sigma 2013 100%
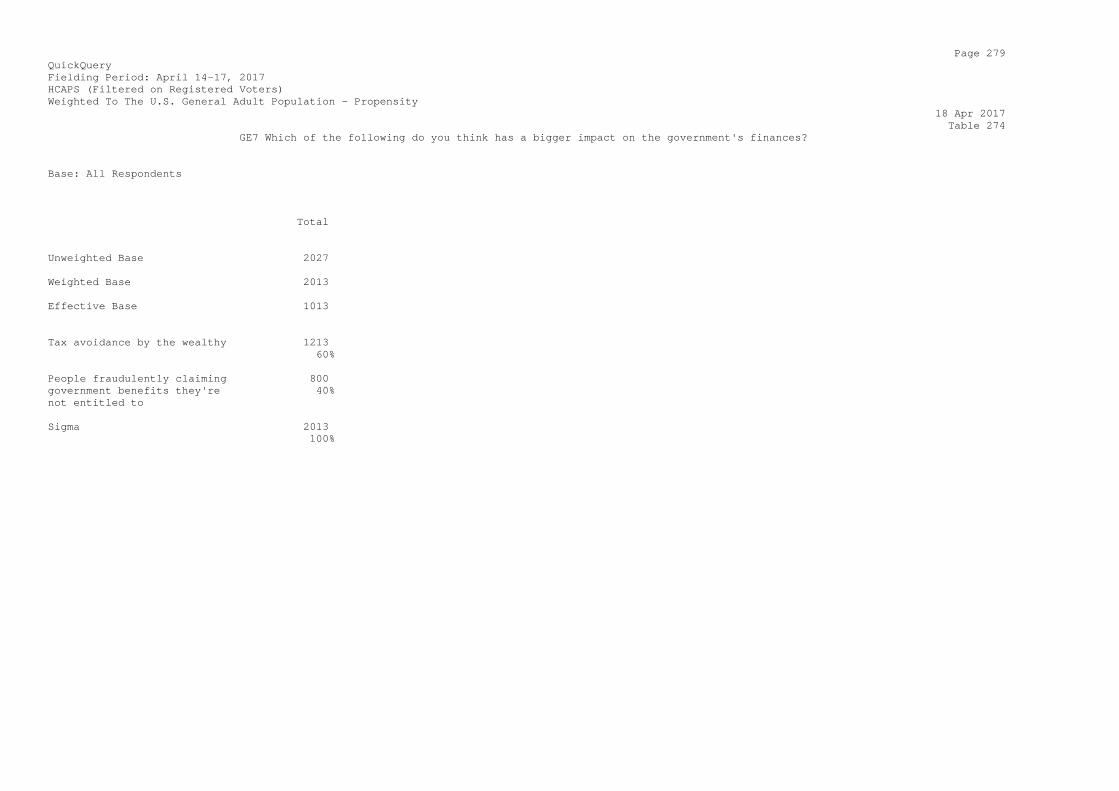
Page 279 QuickQuery Fielding Period: April 14-17, 2017 HCAPS (Filtered on Registered Voters) Weighted To The U.S. General Adult Population - Propensity 18 Apr 2017 Table 274 GE7 Which of the following do you think has a bigger impact on the government's finances? Base: All Respondents Total Unweighted Base 2027 Weighted Base 2013 Effective Base 1013 Tax avoidance by the wealthy 1213 60% People fraudulently claiming 800 government benefits they're 40% not entitled to Sigma 2013 100%
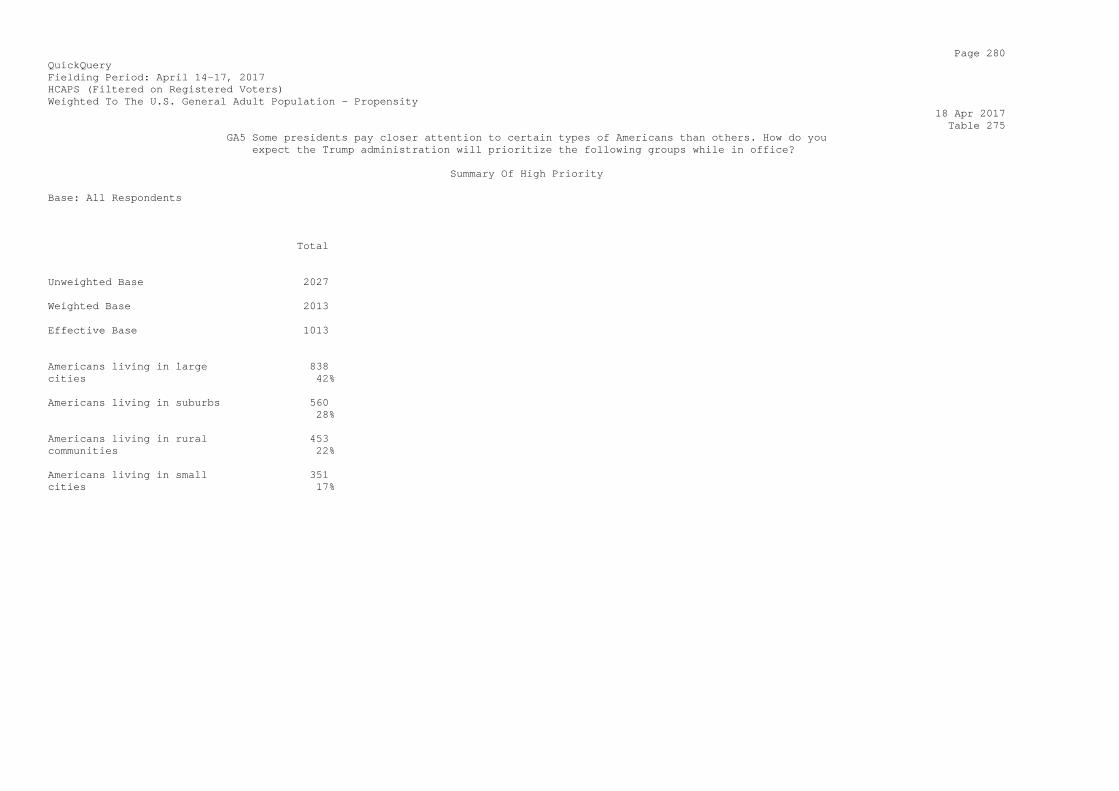
Page 280 QuickQuery Fielding Period: April 14-17, 2017 HCAPS (Filtered on Registered Voters) Weighted To The U.S. General Adult Population - Propensity 18 Apr 2017 Table 275 GA5 Some presidents pay closer attention to certain types of Americans than others. How do you expect the Trump administration will prioritize the following groups while in office? Summary Of High Priority Base: All Respondents Total Unweighted Base 2027 Weighted Base 2013 Effective Base 1013 Americans living in large 838 cities 42% Americans living in suburbs 560 28% Americans living in rural 453 communities 22% Americans living in small 351 cities 17%
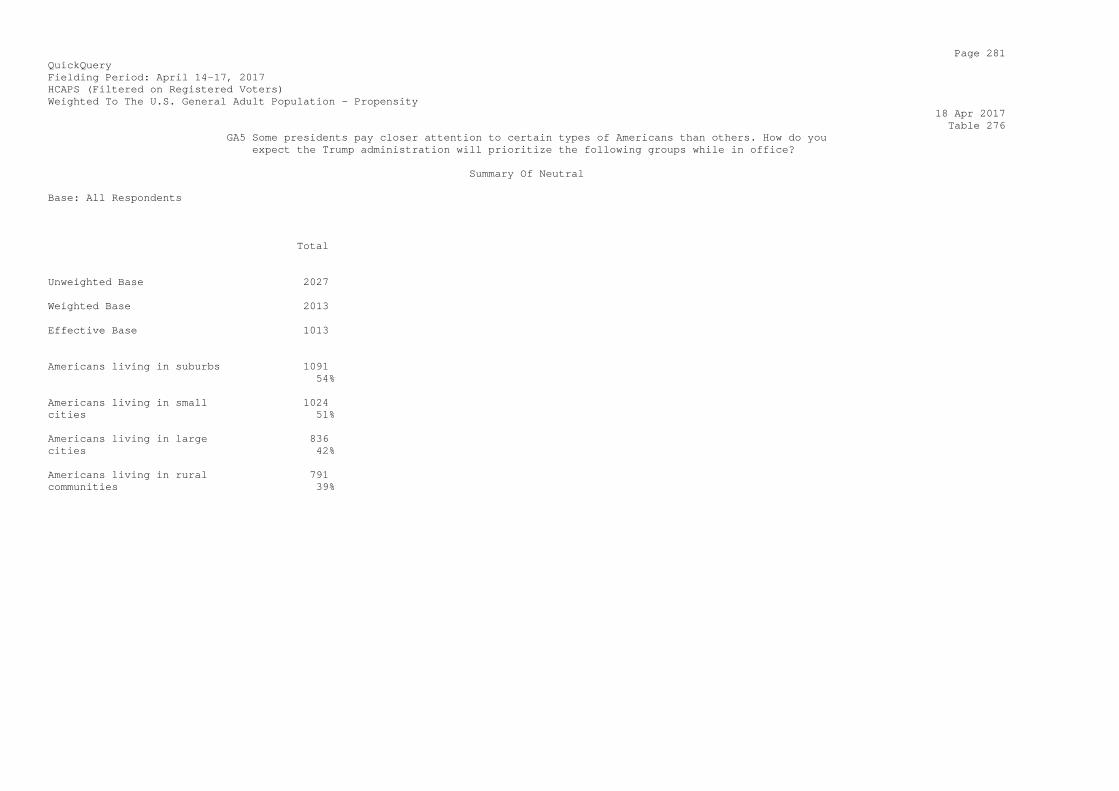
Page 281 QuickQuery Fielding Period: April 14-17, 2017 HCAPS (Filtered on Registered Voters) Weighted To The U.S. General Adult Population - Propensity 18 Apr 2017 Table 276 GA5 Some presidents pay closer attention to certain types of Americans than others. How do you expect the Trump administration will prioritize the following groups while in office? Summary Of Neutral Base: All Respondents Total Unweighted Base 2027 Weighted Base 2013 Effective Base 1013 Americans living in suburbs 1091 54% Americans living in small 1024 cities 51% Americans living in large 836 cities 42% Americans living in rural 791 communities 39%
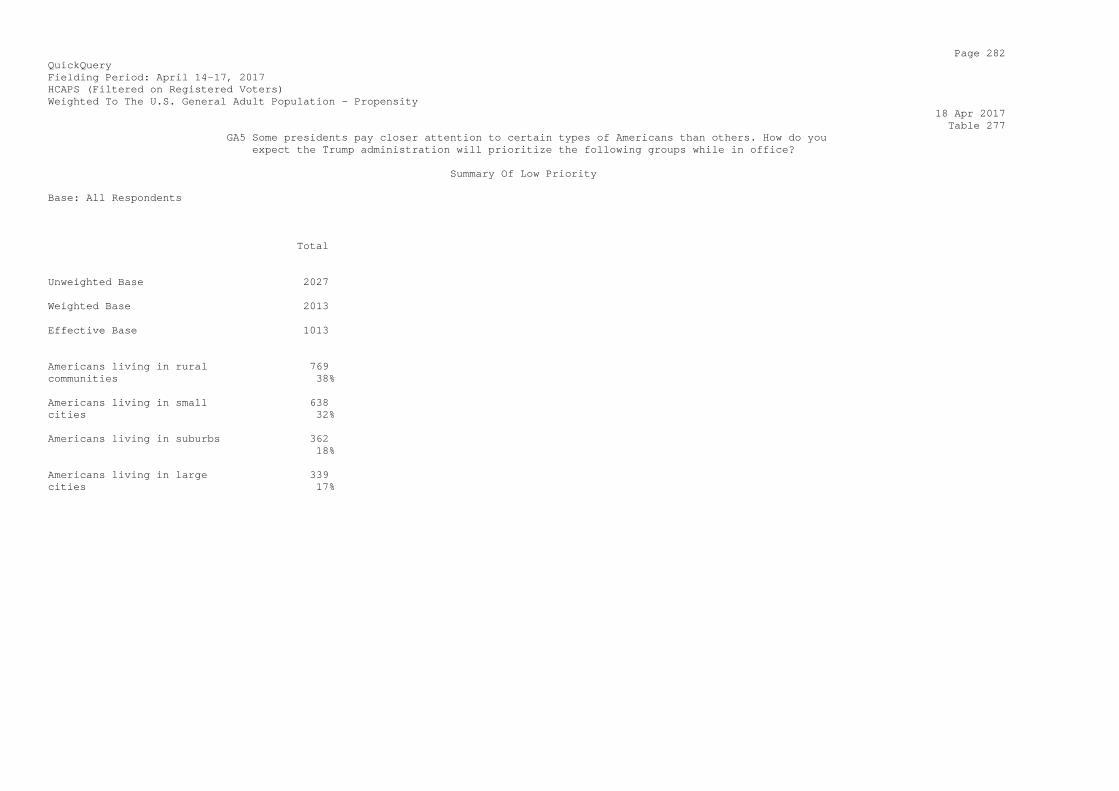
Page 282 QuickQuery Fielding Period: April 14-17, 2017 HCAPS (Filtered on Registered Voters) Weighted To The U.S. General Adult Population - Propensity 18 Apr 2017 Table 277 GA5 Some presidents pay closer attention to certain types of Americans than others. How do you expect the Trump administration will prioritize the following groups while in office? Summary Of Low Priority Base: All Respondents Total Unweighted Base 2027 Weighted Base 2013 Effective Base 1013 Americans living in rural 769 communities 38% Americans living in small 638 cities 32% Americans living in suburbs 362 18% Americans living in large 339 cities 17%
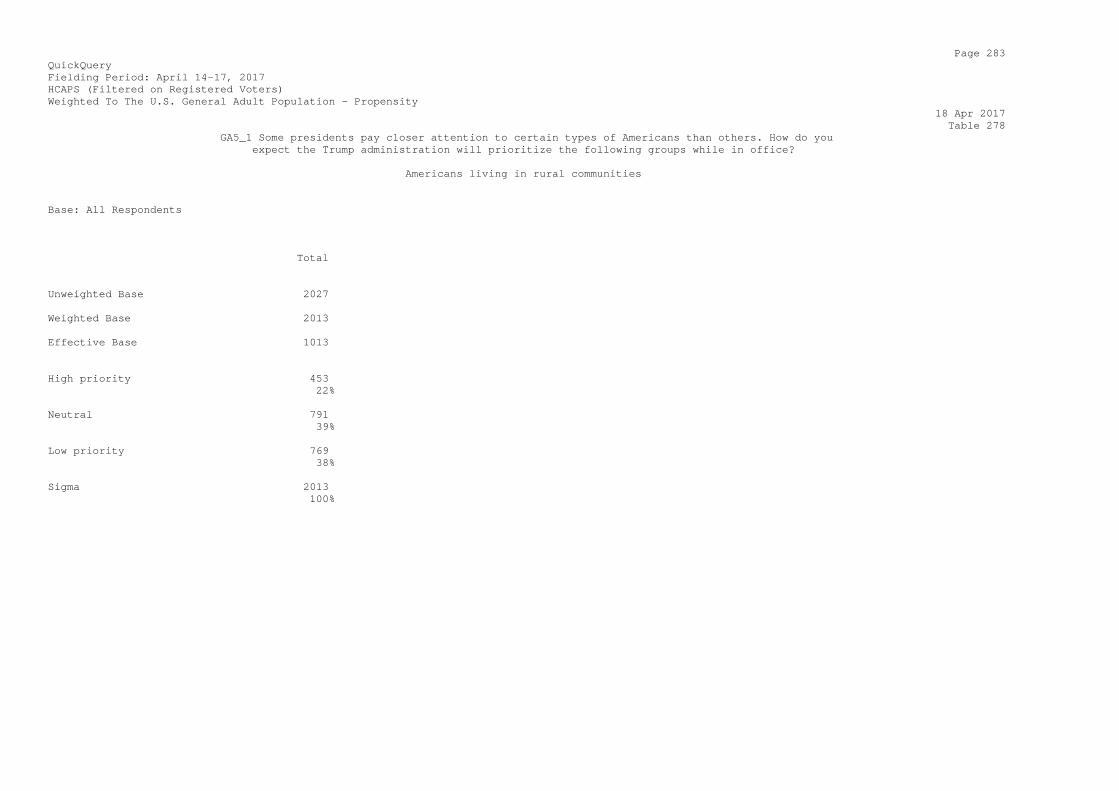
Page 283 QuickQuery Fielding Period: April 14-17, 2017 HCAPS (Filtered on Registered Voters) Weighted To The U.S. General Adult Population - Propensity 18 Apr 2017 Table 278 GA5_1 Some presidents pay closer attention to certain types of Americans than others. How do you expect the Trump administration will prioritize the following groups while in office? Americans living in rural communities Base: All Respondents Total Unweighted Base 2027 Weighted Base 2013 Effective Base 1013 High priority 453 22% Neutral 791 39% Low priority 769 38% Sigma 2013 100%
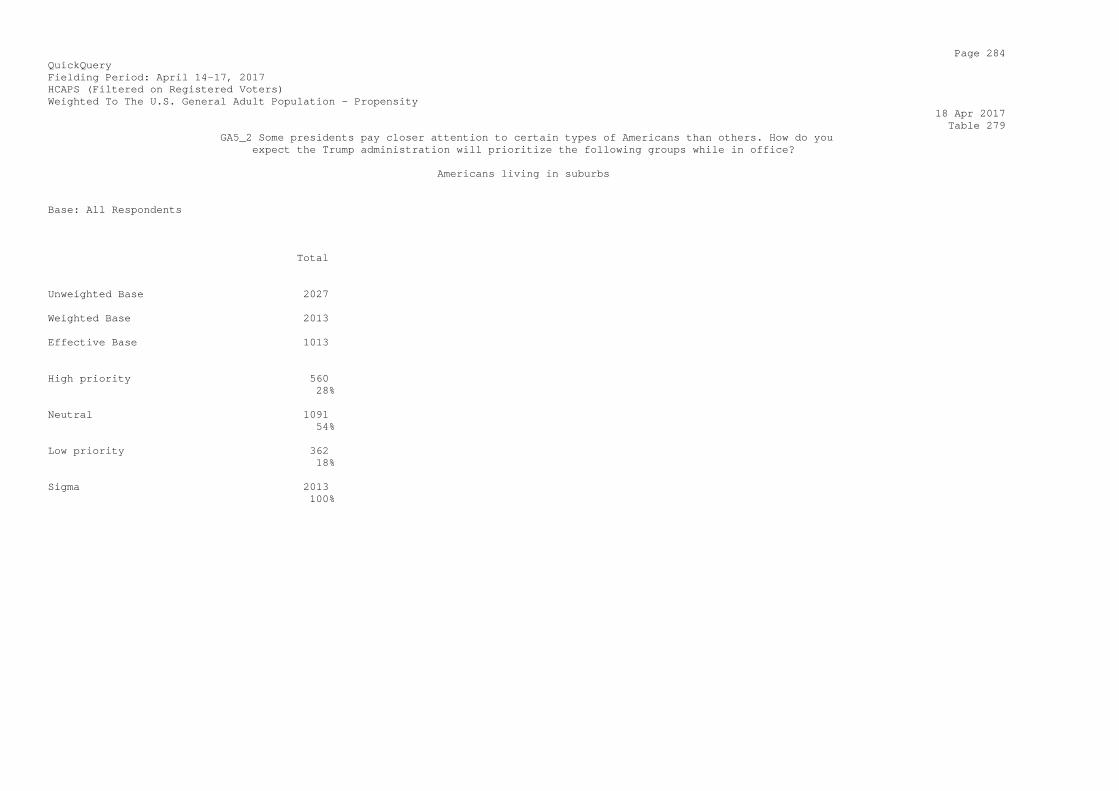
Page 284 QuickQuery Fielding Period: April 14-17, 2017 HCAPS (Filtered on Registered Voters) Weighted To The U.S. General Adult Population - Propensity 18 Apr 2017 Table 279 GA5_2 Some presidents pay closer attention to certain types of Americans than others. How do you expect the Trump administration will prioritize the following groups while in office? Americans living in suburbs Base: All Respondents Total Unweighted Base 2027 Weighted Base 2013 Effective Base 1013 High priority 560 28% Neutral 1091 54% Low priority 362 18% Sigma 2013 100%

Page 285 QuickQuery Fielding Period: April 14-17, 2017 HCAPS (Filtered on Registered Voters) Weighted To The U.S. General Adult Population - Propensity 18 Apr 2017 Table 280 GA5_3 Some presidents pay closer attention to certain types of Americans than others. How do you expect the Trump administration will prioritize the following groups while in office? Americans living in small cities Base: All Respondents Total Unweighted Base 2027 Weighted Base 2013 Effective Base 1013 High priority 351 17% Neutral 1024 51% Low priority 638 32% Sigma 2013 100%

Page 286 QuickQuery Fielding Period: April 14-17, 2017 HCAPS (Filtered on Registered Voters) Weighted To The U.S. General Adult Population - Propensity 18 Apr 2017 Table 281 GA5_4 Some presidents pay closer attention to certain types of Americans than others. How do you expect the Trump administration will prioritize the following groups while in office? Americans living in large cities Base: All Respondents Total Unweighted Base 2027 Weighted Base 2013 Effective Base 1013 High priority 838 42% Neutral 836 42% Low priority 339 17% Sigma 2013 100%

Page 287 QuickQuery Fielding Period: April 14-17, 2017 HCAPS (Filtered on Registered Voters) Weighted To The U.S. General Adult Population - Propensity 18 Apr 2017 Table 282 GA6 Within your state, do you think the following areas receive government spending (including state and federal) that is less than, about the same as, or more than what they contribute in taxes? Summary Of Receives Less Base: All Respondents Total Unweighted Base 2027 Weighted Base 2013 Effective Base 1013 Rural areas 884 44% Suburban areas 544 27% Urban areas 495 25%
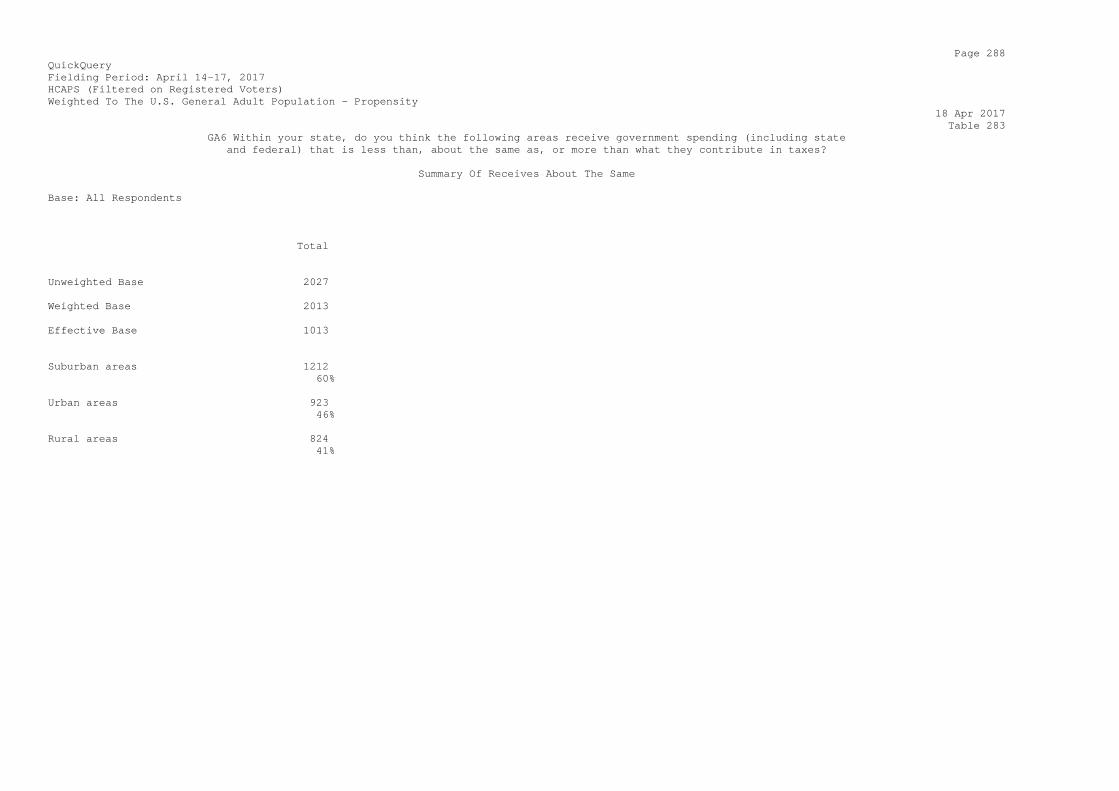
Page 288 QuickQuery Fielding Period: April 14-17, 2017 HCAPS (Filtered on Registered Voters) Weighted To The U.S. General Adult Population - Propensity 18 Apr 2017 Table 283 GA6 Within your state, do you think the following areas receive government spending (including state and federal) that is less than, about the same as, or more than what they contribute in taxes? Summary Of Receives About The Same Base: All Respondents Total Unweighted Base 2027 Weighted Base 2013 Effective Base 1013 Suburban areas 1212 60% Urban areas 923 46% Rural areas 824 41%

Page 289 QuickQuery Fielding Period: April 14-17, 2017 HCAPS (Filtered on Registered Voters) Weighted To The U.S. General Adult Population - Propensity 18 Apr 2017 Table 284 GA6 Within your state, do you think the following areas receive government spending (including state and federal) that is less than, about the same as, or more than what they contribute in taxes? Summary Of Receives More Base: All Respondents Total Unweighted Base 2027 Weighted Base 2013 Effective Base 1013 Urban areas 595 30% Rural areas 304 15% Suburban areas 258 13%

Page 290 QuickQuery Fielding Period: April 14-17, 2017 HCAPS (Filtered on Registered Voters) Weighted To The U.S. General Adult Population - Propensity 18 Apr 2017 Table 285 GA6_1 Within your state, do you think the following areas receive government spending (including state and federal) that is less than, about the same as, or more than what they contribute in taxes? Rural areas Base: All Respondents Total Unweighted Base 2027 Weighted Base 2013 Effective Base 1013 Receives less than what they 884 contribute 44% Receives about the same as 824 what they contribute 41% Receives more than what they 304 contribute 15% Sigma 2013 100%
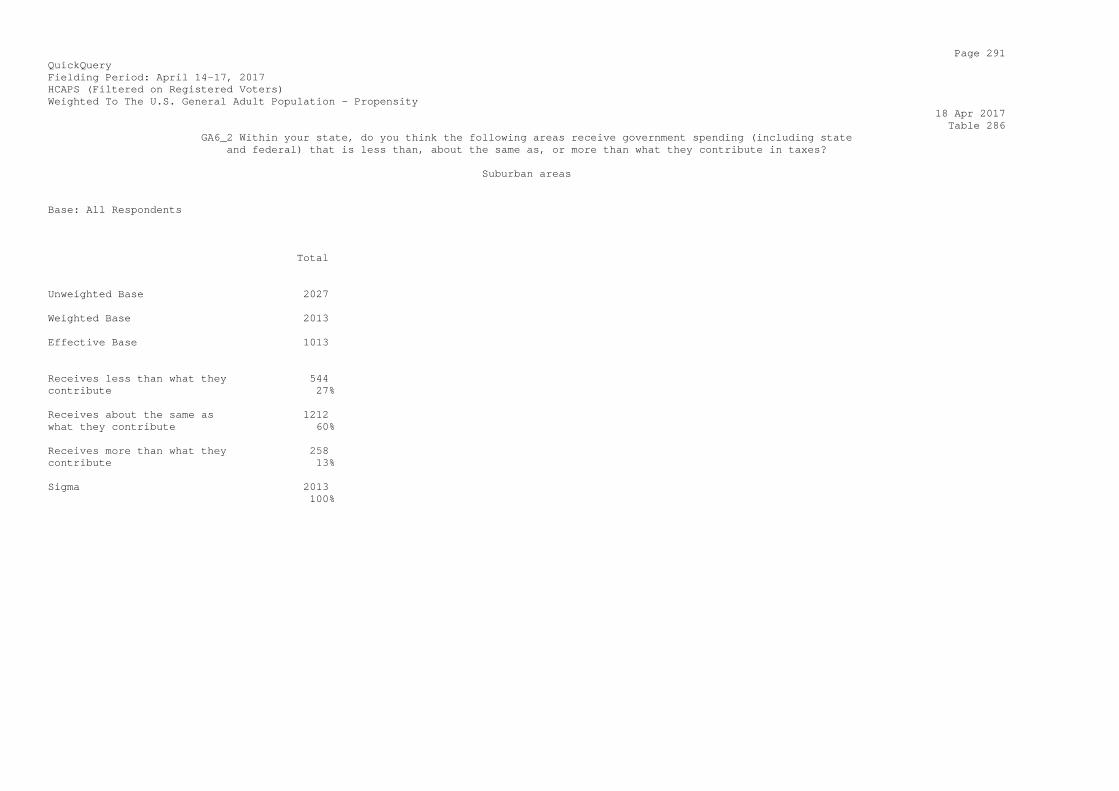
Page 291 QuickQuery Fielding Period: April 14-17, 2017 HCAPS (Filtered on Registered Voters) Weighted To The U.S. General Adult Population - Propensity 18 Apr 2017 Table 286 GA6_2 Within your state, do you think the following areas receive government spending (including state and federal) that is less than, about the same as, or more than what they contribute in taxes? Suburban areas Base: All Respondents Total Unweighted Base 2027 Weighted Base 2013 Effective Base 1013 Receives less than what they 544 contribute 27% Receives about the same as 1212 what they contribute 60% Receives more than what they 258 contribute 13% Sigma 2013 100%
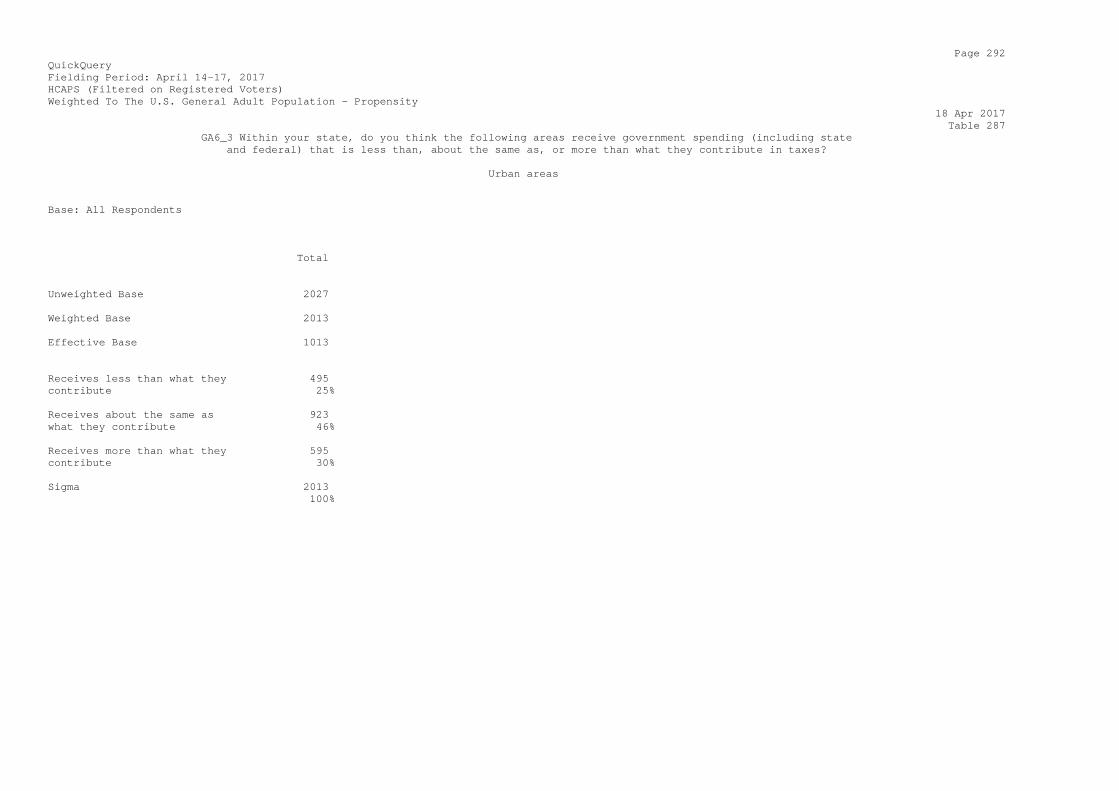
Page 292 QuickQuery Fielding Period: April 14-17, 2017 HCAPS (Filtered on Registered Voters) Weighted To The U.S. General Adult Population - Propensity 18 Apr 2017 Table 287 GA6_3 Within your state, do you think the following areas receive government spending (including state and federal) that is less than, about the same as, or more than what they contribute in taxes? Urban areas Base: All Respondents Total Unweighted Base 2027 Weighted Base 2013 Effective Base 1013 Receives less than what they 495 contribute 25% Receives about the same as 923 what they contribute 46% Receives more than what they 595 contribute 30% Sigma 2013 100%
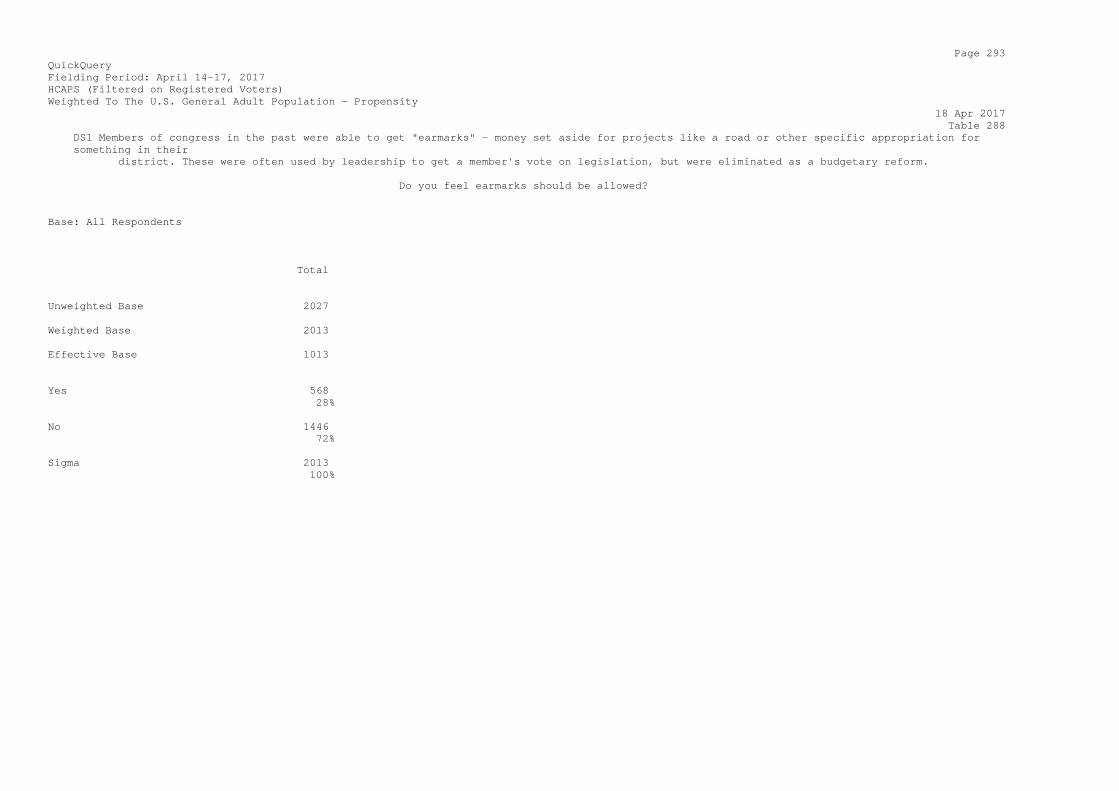
Page 293 QuickQuery Fielding Period: April 14-17, 2017 HCAPS (Filtered on Registered Voters) Weighted To The U.S. General Adult Population - Propensity 18 Apr 2017 Table 288 DS1 Members of congress in the past were able to get "earmarks" - money set aside for projects like a road or other specific appropriation for something in their district. These were often used by leadership to get a member's vote on legislation, but were eliminated as a budgetary reform. Do you feel earmarks should be allowed? Base: All Respondents Total Unweighted Base 2027 Weighted Base 2013 Effective Base 1013 Yes 568 28% No 1446 72% Sigma 2013 100%
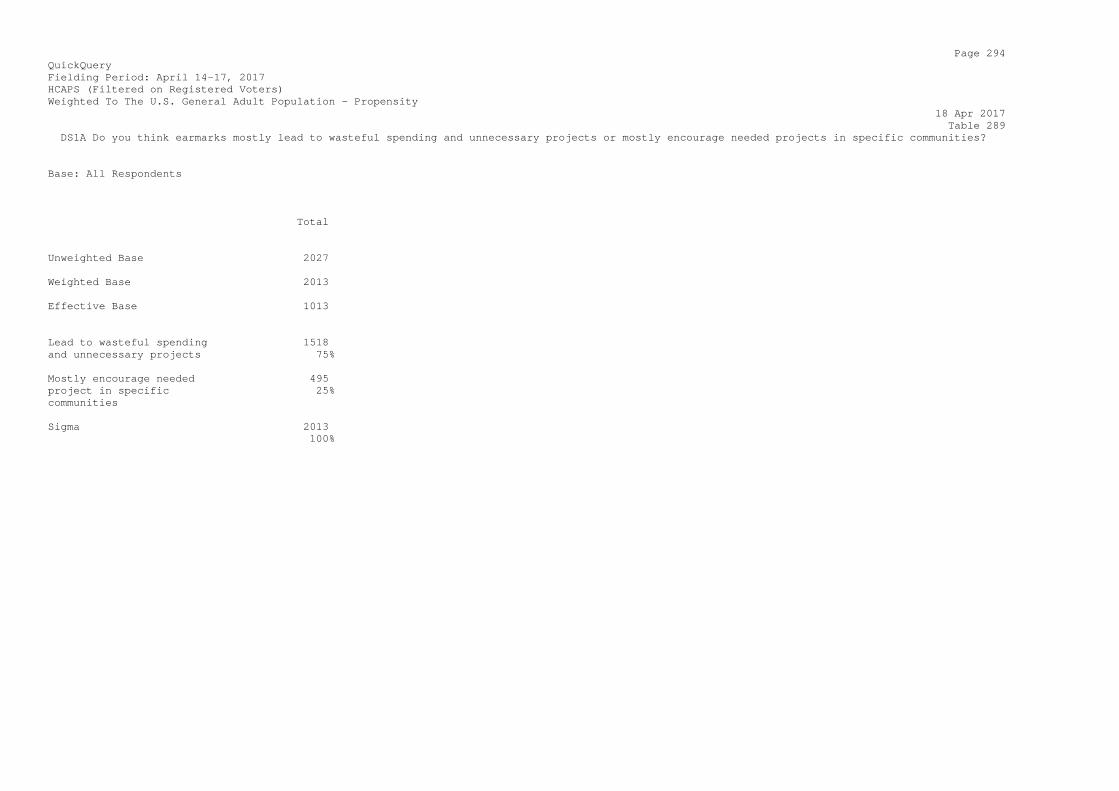
Page 294 QuickQuery Fielding Period: April 14-17, 2017 HCAPS (Filtered on Registered Voters) Weighted To The U.S. General Adult Population - Propensity 18 Apr 2017 Table 289 DS1A Do you think earmarks mostly lead to wasteful spending and unnecessary projects or mostly encourage needed projects in specific communities? Base: All Respondents Total Unweighted Base 2027 Weighted Base 2013 Effective Base 1013 Lead to wasteful spending 1518 and unnecessary projects 75% Mostly encourage needed 495 project in specific 25% communities Sigma 2013 100%
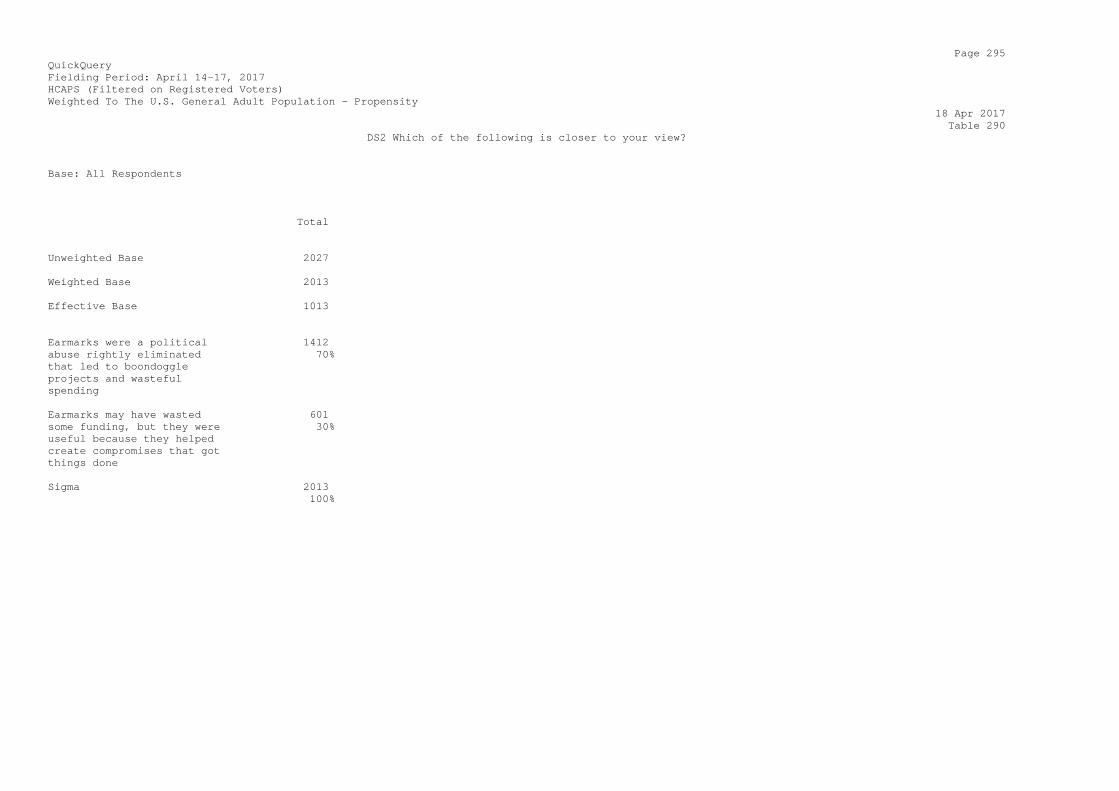
Page 295 QuickQuery Fielding Period: April 14-17, 2017 HCAPS (Filtered on Registered Voters) Weighted To The U.S. General Adult Population - Propensity 18 Apr 2017 Table 290 DS2 Which of the following is closer to your view? Base: All Respondents Total Unweighted Base 2027 Weighted Base 2013 Effective Base 1013 Earmarks were a political 1412 abuse rightly eliminated 70% that led to boondoggle projects and wasteful spending Earmarks may have wasted 601 some funding, but they were 30% useful because they helped create compromises that got things done Sigma 2013 100%
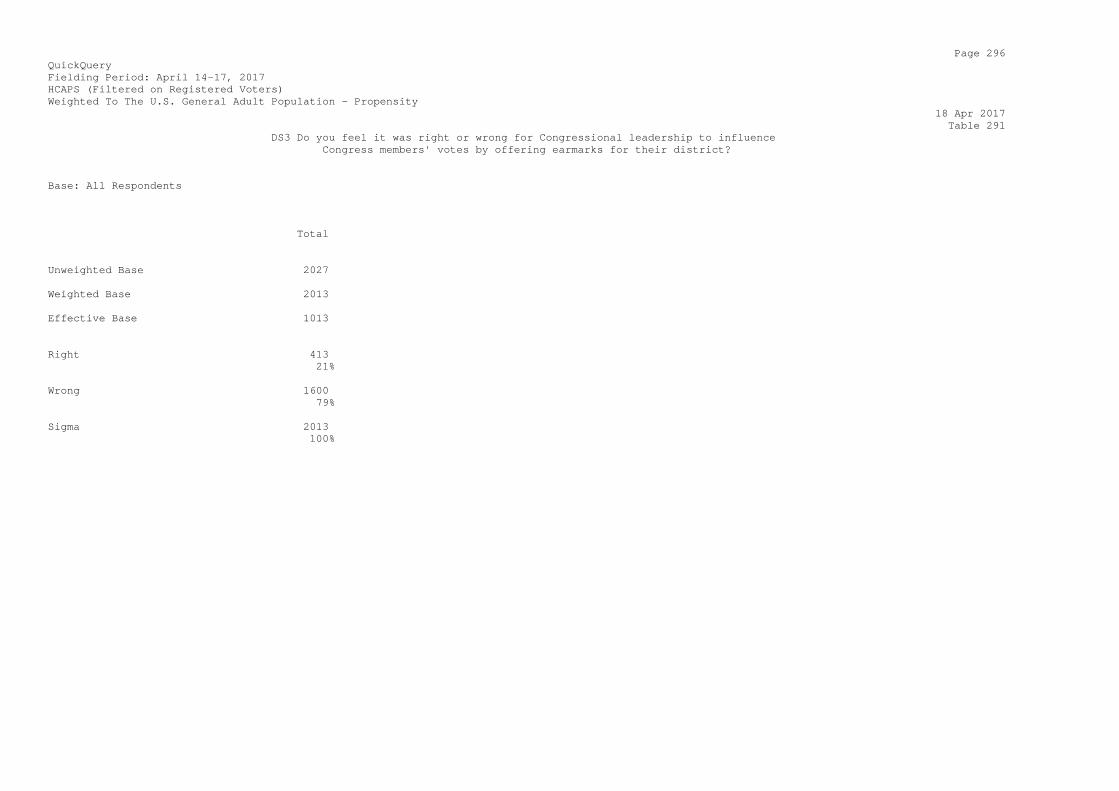
Page 296 QuickQuery Fielding Period: April 14-17, 2017 HCAPS (Filtered on Registered Voters) Weighted To The U.S. General Adult Population - Propensity 18 Apr 2017 Table 291 DS3 Do you feel it was right or wrong for Congressional leadership to influence Congress members' votes by offering earmarks for their district? Base: All Respondents Total Unweighted Base 2027 Weighted Base 2013 Effective Base 1013 Right 413 21% Wrong 1600 79% Sigma 2013 100%
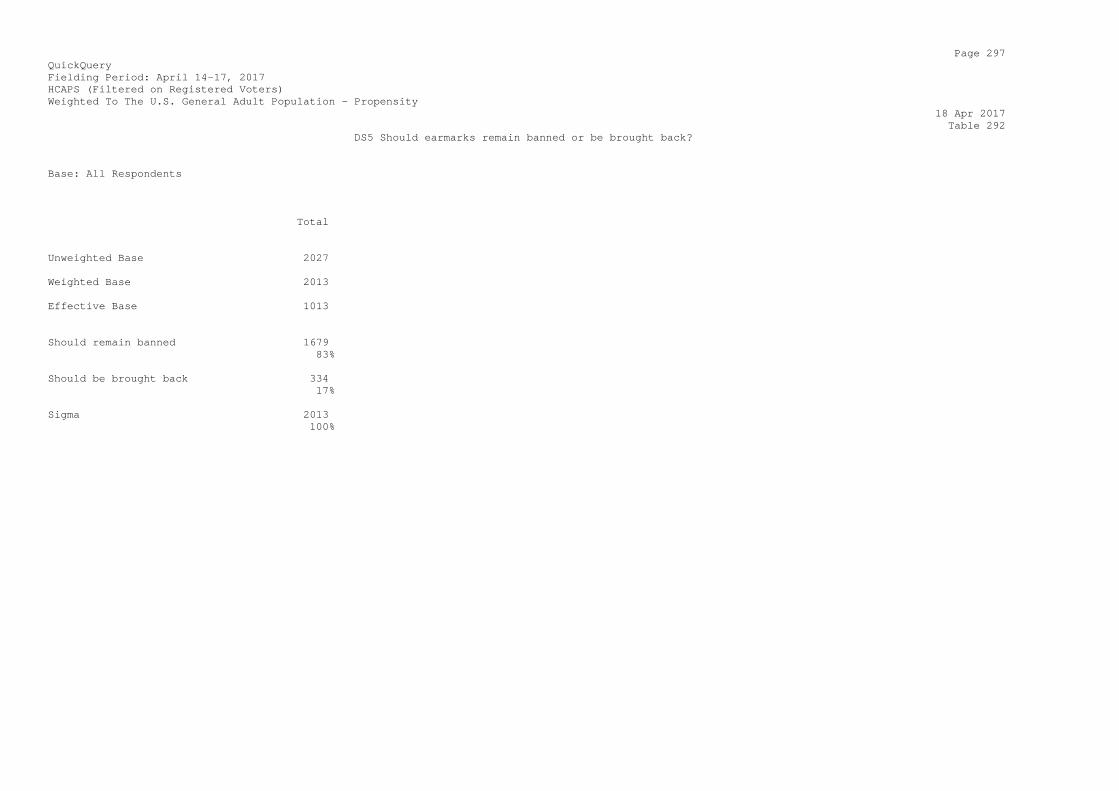
Page 297 QuickQuery Fielding Period: April 14-17, 2017 HCAPS (Filtered on Registered Voters) Weighted To The U.S. General Adult Population - Propensity 18 Apr 2017 Table 292 DS5 Should earmarks remain banned or be brought back? Base: All Respondents Total Unweighted Base 2027 Weighted Base 2013 Effective Base 1013 Should remain banned 1679 83% Should be brought back 334 17% Sigma 2013 100%

Page 298 QuickQuery Fielding Period: April 14-17, 2017 HCAPS (Filtered on Registered Voters) Weighted To The U.S. General Adult Population - Propensity 18 Apr 2017 Table 293 CS1 Do you believe that events like this occur frequently? Base: Saw Vignette A Total Unweighted Base 679 Weighted Base 652 Effective Base 343 Yes 406 62% No 246 38% Sigma 652 100%
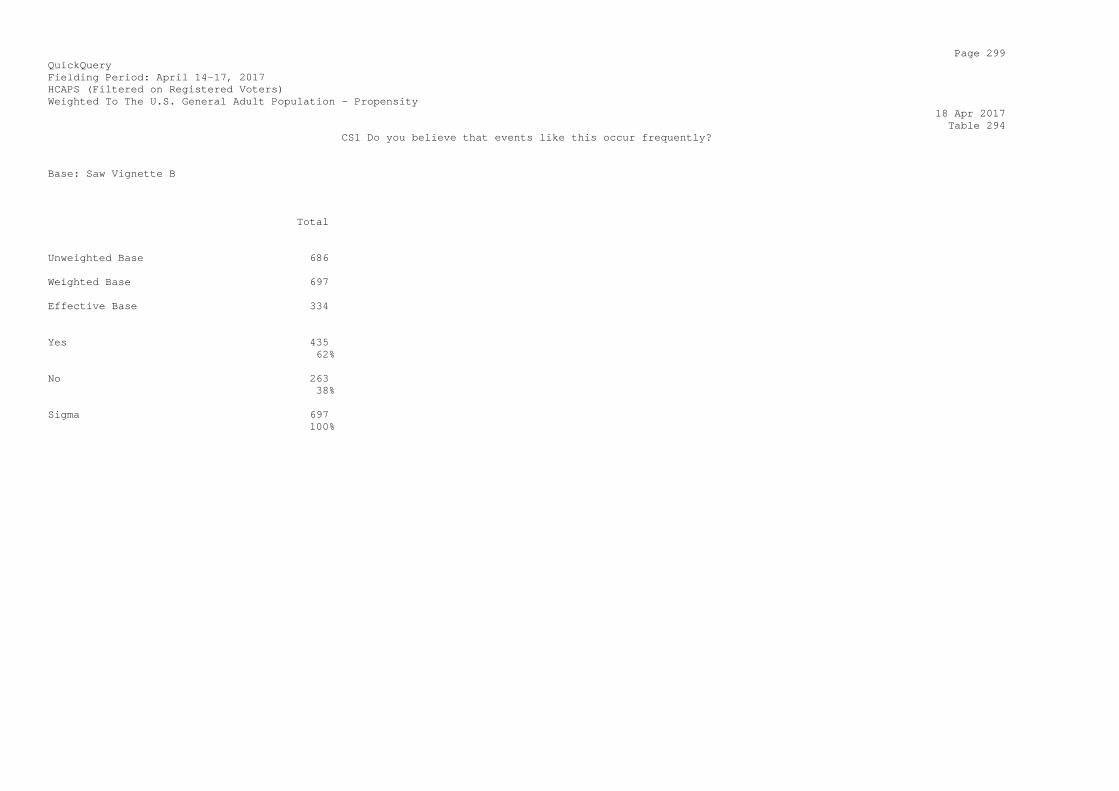
Page 299 QuickQuery Fielding Period: April 14-17, 2017 HCAPS (Filtered on Registered Voters) Weighted To The U.S. General Adult Population - Propensity 18 Apr 2017 Table 294 CS1 Do you believe that events like this occur frequently? Base: Saw Vignette B Total Unweighted Base 686 Weighted Base 697 Effective Base 334 Yes 435 62% No 263 38% Sigma 697 100%

Page 300 QuickQuery Fielding Period: April 14-17, 2017 HCAPS (Filtered on Registered Voters) Weighted To The U.S. General Adult Population - Propensity 18 Apr 2017 Table 295 CS1 Do you believe that events like this occur frequently? Base: Saw Vignette C Total Unweighted Base 662 Weighted Base 663 Effective Base 338 Yes 464 70% No 200 30% Sigma 663 100%

Page 301 QuickQuery Fielding Period: April 14-17, 2017 HCAPS (Filtered on Registered Voters) Weighted To The U.S. General Adult Population - Propensity 18 Apr 2017 Table 296 CS2 Are you concerned that another event like this will occur soon? Base: Saw Vignette A Total Unweighted Base 679 Weighted Base 652 Effective Base 343 Yes 506 78% No 146 22% Sigma 652 100%

Page 302 QuickQuery Fielding Period: April 14-17, 2017 HCAPS (Filtered on Registered Voters) Weighted To The U.S. General Adult Population - Propensity 18 Apr 2017 Table 297 CS2 Are you concerned that another event like this will occur soon? Base: Saw Vignette B Total Unweighted Base 686 Weighted Base 697 Effective Base 334 Yes 541 78% No 156 22% Sigma 697 100%

Page 303 QuickQuery Fielding Period: April 14-17, 2017 HCAPS (Filtered on Registered Voters) Weighted To The U.S. General Adult Population - Propensity 18 Apr 2017 Table 298 CS2 Are you concerned that another event like this will occur soon? Base: Saw Vignette C Total Unweighted Base 662 Weighted Base 663 Effective Base 338 Yes 551 83% No 113 17% Sigma 663 100%

Page 304 QuickQuery Fielding Period: April 14-17, 2017 HCAPS (Filtered on Registered Voters) Weighted To The U.S. General Adult Population - Propensity 18 Apr 2017 Table 299 CS3 Should the government be restricted in its pursuit of cyber thieves? Base: Saw Vignette A Total Unweighted Base 679 Weighted Base 652 Effective Base 343 Yes 119 18% No 450 69% Don't know 83 13% Sigma 652 100%
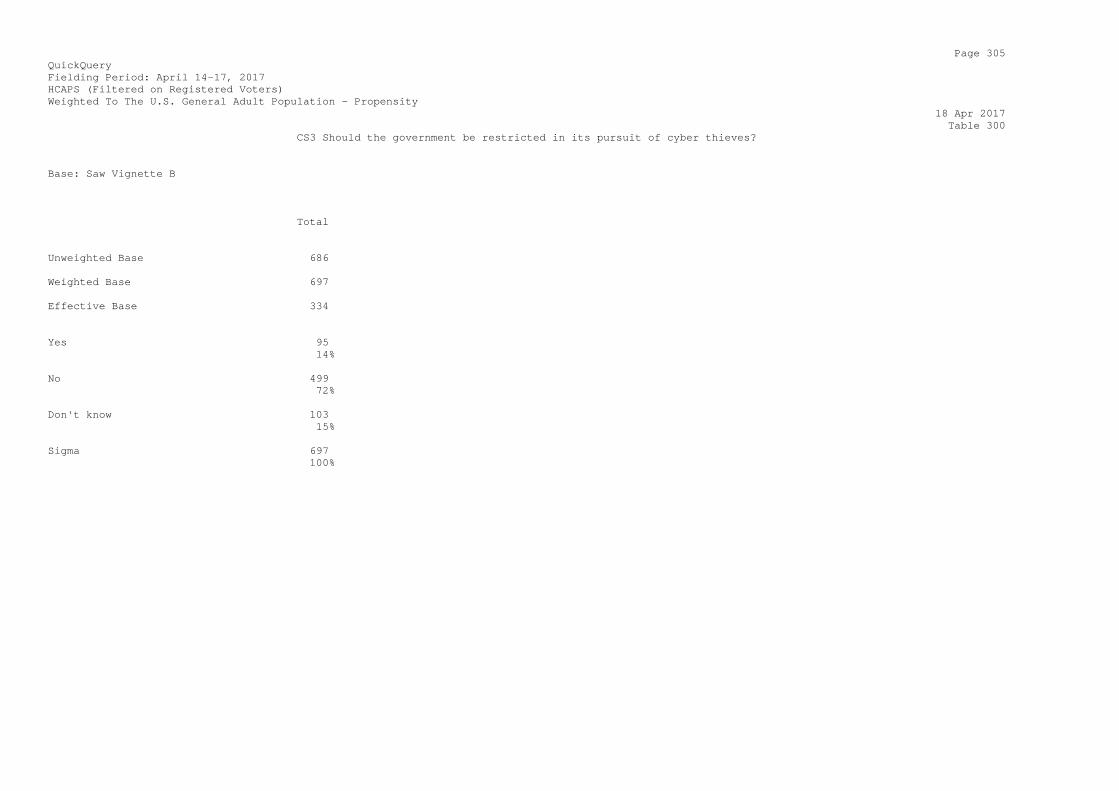
Page 305 QuickQuery Fielding Period: April 14-17, 2017 HCAPS (Filtered on Registered Voters) Weighted To The U.S. General Adult Population - Propensity 18 Apr 2017 Table 300 CS3 Should the government be restricted in its pursuit of cyber thieves? Base: Saw Vignette B Total Unweighted Base 686 Weighted Base 697 Effective Base 334 Yes 95 14% No 499 72% Don't know 103 15% Sigma 697 100%

Page 306 QuickQuery Fielding Period: April 14-17, 2017 HCAPS (Filtered on Registered Voters) Weighted To The U.S. General Adult Population - Propensity 18 Apr 2017 Table 301 CS3 Should the government be restricted in its pursuit of cyber thieves? Base: Saw Vignette C Total Unweighted Base 662 Weighted Base 663 Effective Base 338 Yes 131 20% No 440 66% Don't know 93 14% Sigma 663 100%
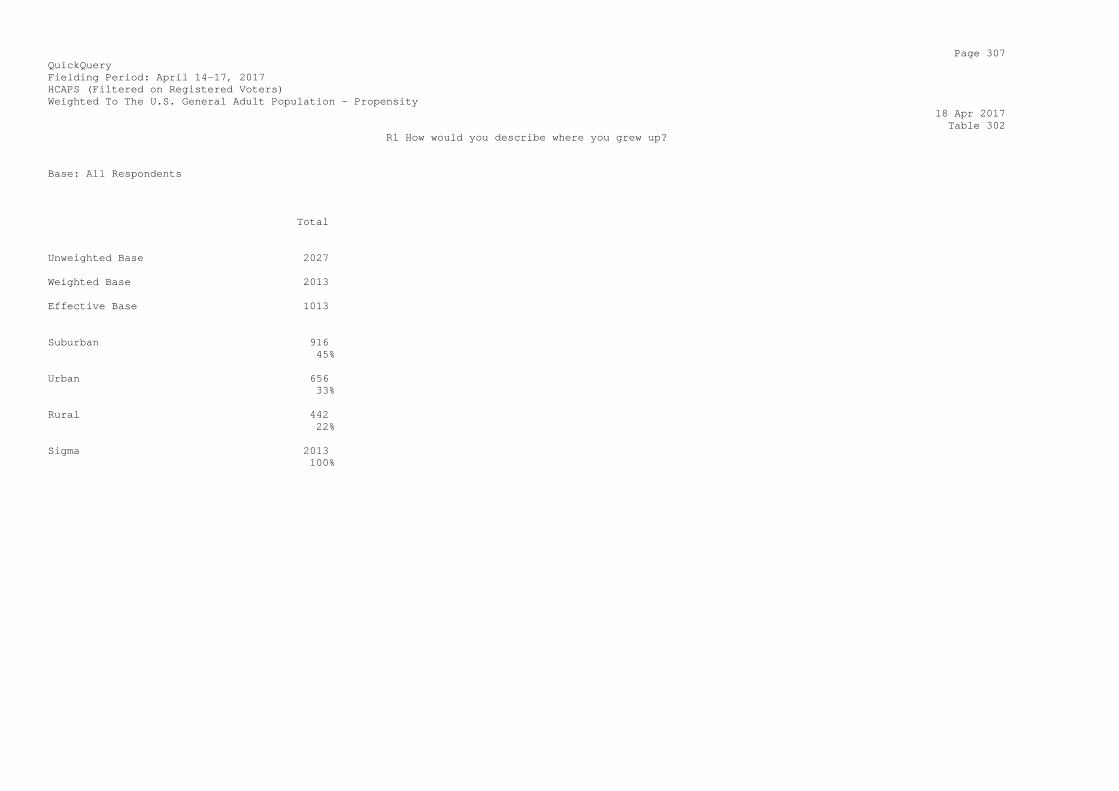
Page 307 QuickQuery Fielding Period: April 14-17, 2017 HCAPS (Filtered on Registered Voters) Weighted To The U.S. General Adult Population - Propensity 18 Apr 2017 Table 302 R1 How would you describe where you grew up? Base: All Respondents Total Unweighted Base 2027 Weighted Base 2013 Effective Base 1013 Suburban 916 45% Urban 656 33% Rural 442 22% Sigma 2013 100%
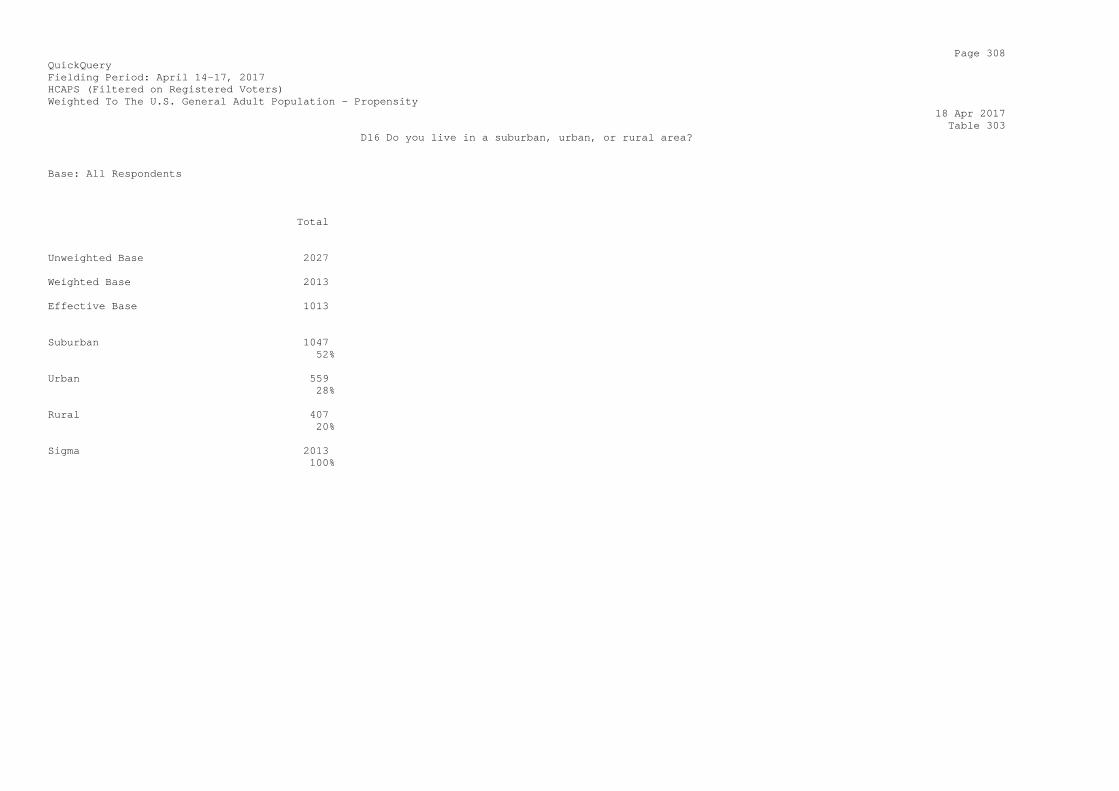
Page 308 QuickQuery Fielding Period: April 14-17, 2017 HCAPS (Filtered on Registered Voters) Weighted To The U.S. General Adult Population - Propensity 18 Apr 2017 Table 303 D16 Do you live in a suburban, urban, or rural area? Base: All Respondents Total Unweighted Base 2027 Weighted Base 2013 Effective Base 1013 Suburban 1047 52% Urban 559 28% Rural 407 20% Sigma 2013 100%

Page 309 QuickQuery Fielding Period: April 14-17, 2017 HCAPS (Filtered on Registered Voters) Weighted To The U.S. General Adult Population - Propensity 18 Apr 2017 Table 304 R4 Thinking about jobs in rural communities, which of the following statements do you agree with most? Base: All Respondents Total Unweighted Base 2027 Weighted Base 2013 Effective Base 1013 There are not enough jobs in 1578 rural areas 78% There are enough jobs in 435 rural areas 22% Sigma 2013 100%
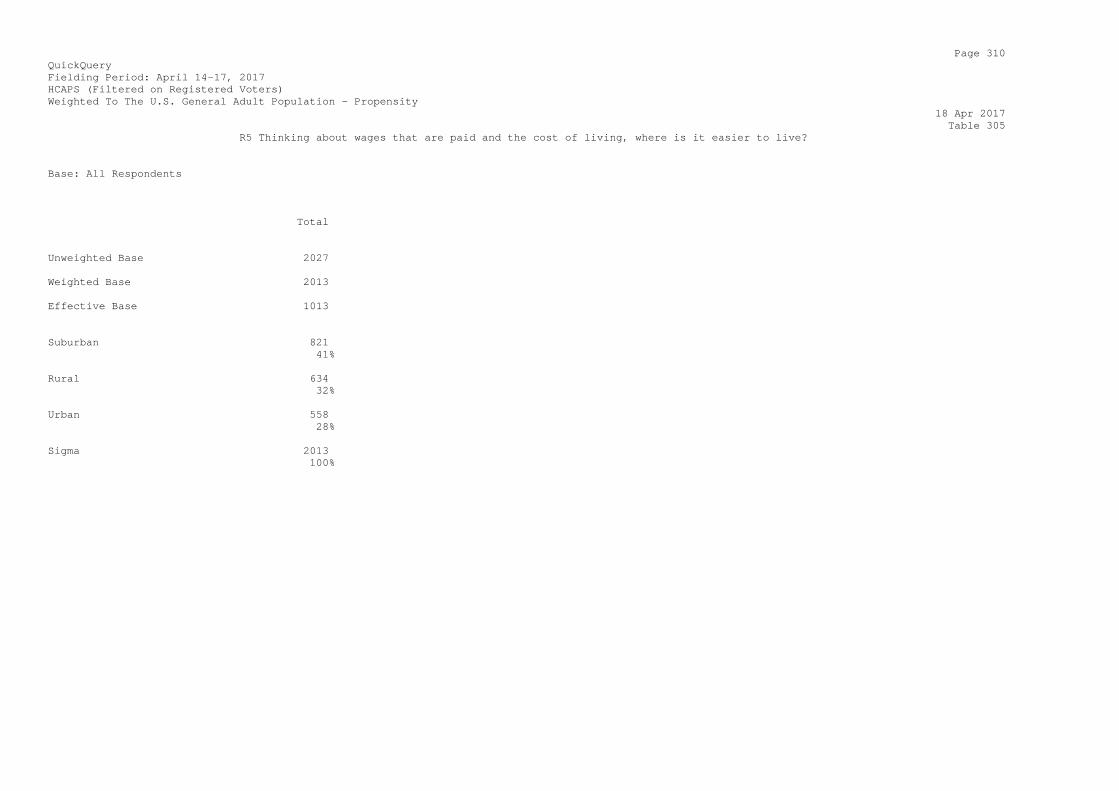
Page 310 QuickQuery Fielding Period: April 14-17, 2017 HCAPS (Filtered on Registered Voters) Weighted To The U.S. General Adult Population - Propensity 18 Apr 2017 Table 305 R5 Thinking about wages that are paid and the cost of living, where is it easier to live? Base: All Respondents Total Unweighted Base 2027 Weighted Base 2013 Effective Base 1013 Suburban 821 41% Rural 634 32% Urban 558 28% Sigma 2013 100%
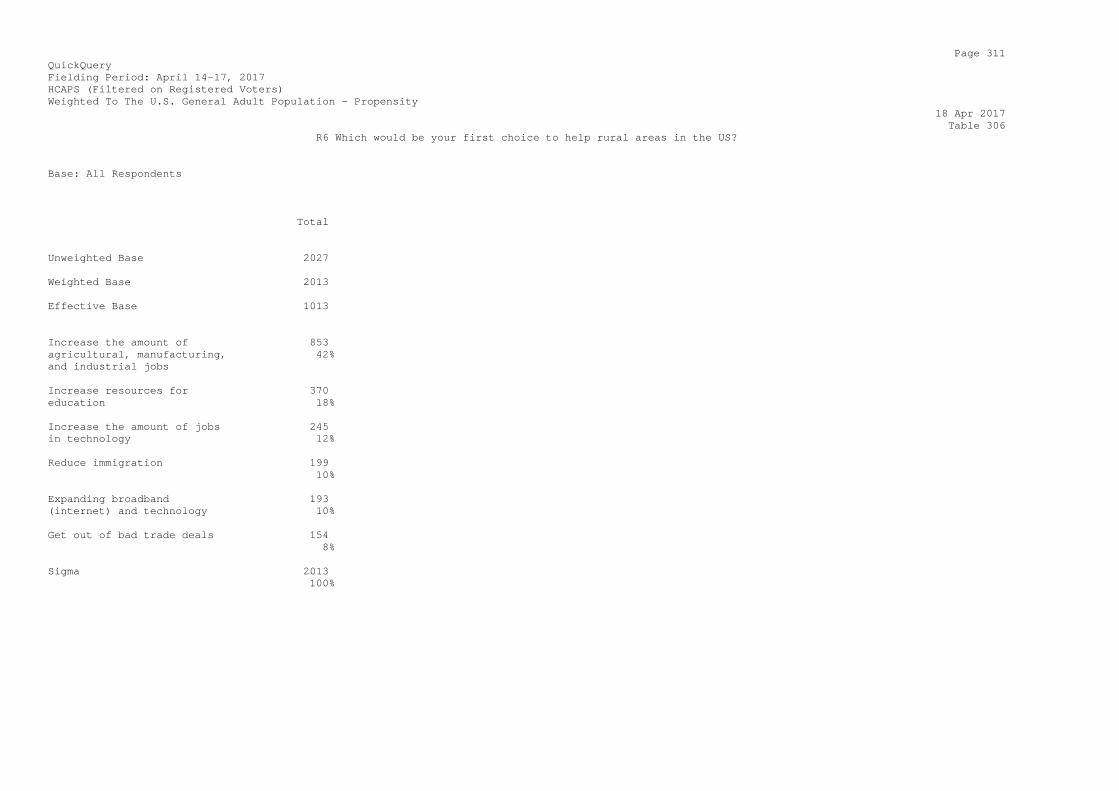
Page 311 QuickQuery Fielding Period: April 14-17, 2017 HCAPS (Filtered on Registered Voters) Weighted To The U.S. General Adult Population - Propensity 18 Apr 2017 Table 306 R6 Which would be your first choice to help rural areas in the US? Base: All Respondents Total Unweighted Base 2027 Weighted Base 2013 Effective Base 1013 Increase the amount of 853 agricultural, manufacturing, 42% and industrial jobs Increase resources for 370 education 18% Increase the amount of jobs 245 in technology 12% Reduce immigration 199 10% Expanding broadband 193 (internet) and technology 10% Get out of bad trade deals 154 8% Sigma 2013 100%
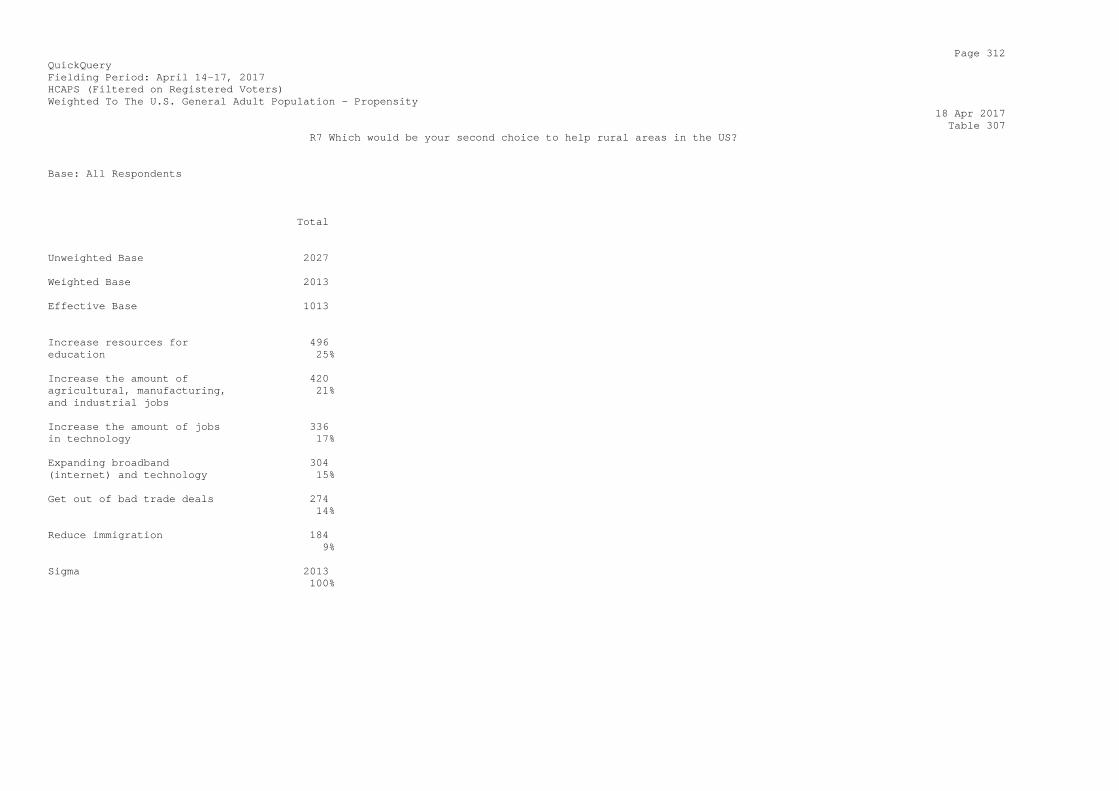
Page 312 QuickQuery Fielding Period: April 14-17, 2017 HCAPS (Filtered on Registered Voters) Weighted To The U.S. General Adult Population - Propensity 18 Apr 2017 Table 307 R7 Which would be your second choice to help rural areas in the US? Base: All Respondents Total Unweighted Base 2027 Weighted Base 2013 Effective Base 1013 Increase resources for 496 education 25% Increase the amount of 420 agricultural, manufacturing, 21% and industrial jobs Increase the amount of jobs 336 in technology 17% Expanding broadband 304 (internet) and technology 15% Get out of bad trade deals 274 14% Reduce immigration 184 9% Sigma 2013 100%
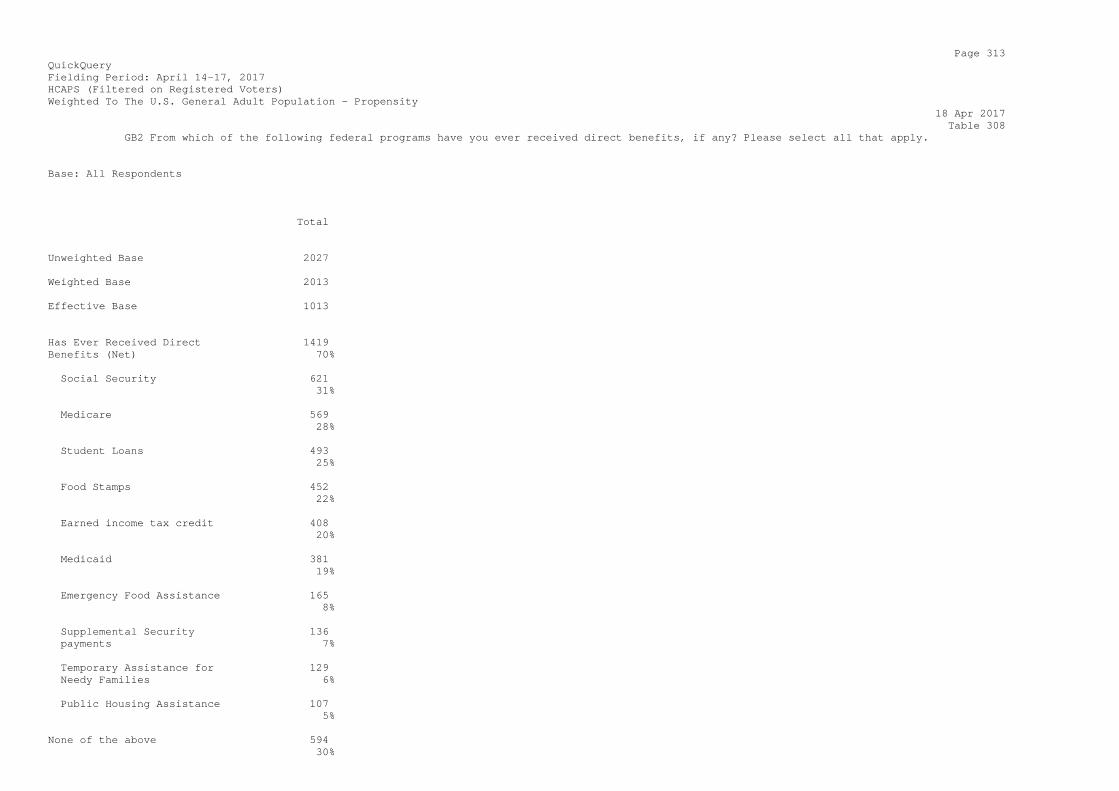
Page 313 QuickQuery Fielding Period: April 14-17, 2017 HCAPS (Filtered on Registered Voters) Weighted To The U.S. General Adult Population - Propensity 18 Apr 2017 Table 308 GB2 From which of the following federal programs have you ever received direct benefits, if any? Please select all that apply. Base: All Respondents Total Unweighted Base 2027 Weighted Base 2013 Effective Base 1013 Has Ever Received Direct 1419 Benefits (Net) 70% Social Security 621 31% Medicare 569 28% Student Loans 493 25% Food Stamps 452 22% Earned income tax credit 408 20% Medicaid 381 19% Emergency Food Assistance 165 8% Supplemental Security 136 payments 7% Temporary Assistance for 129 Needy Families 6% Public Housing Assistance 107 5% None of the above 594 30%

Sigma 4055 201%
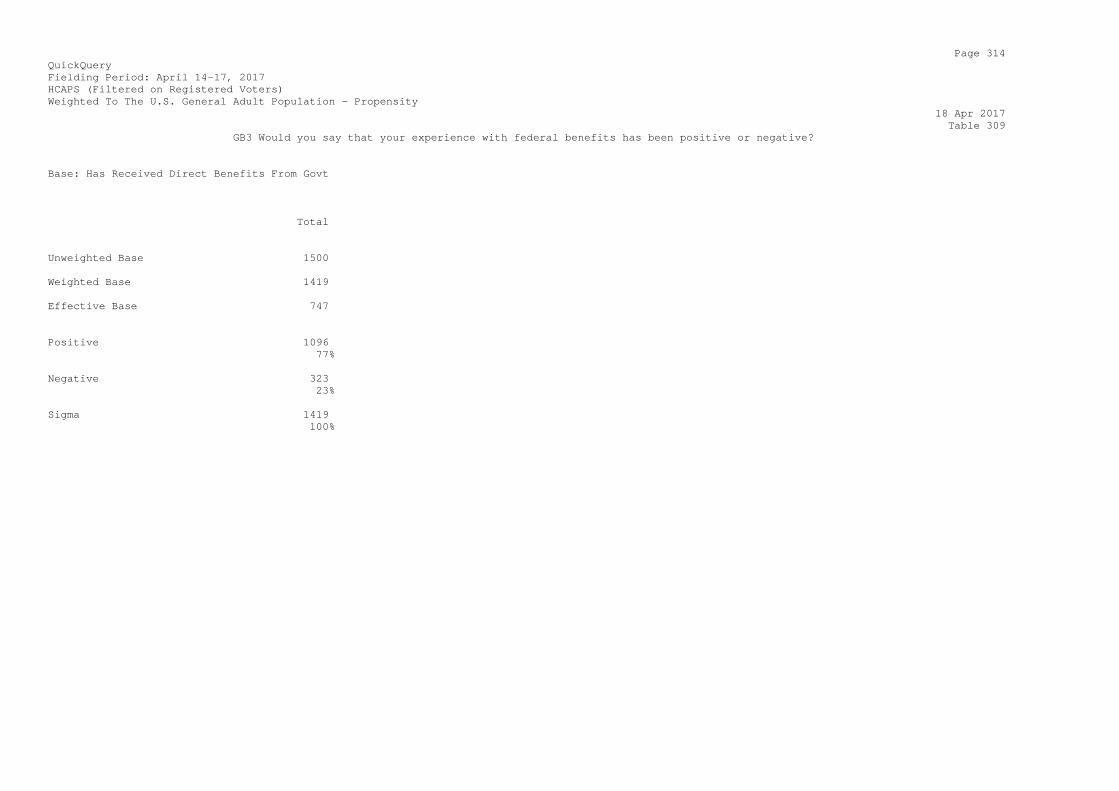
Page 314 QuickQuery Fielding Period: April 14-17, 2017 HCAPS (Filtered on Registered Voters) Weighted To The U.S. General Adult Population - Propensity 18 Apr 2017 Table 309 GB3 Would you say that your experience with federal benefits has been positive or negative? Base: Has Received Direct Benefits From Govt Total Unweighted Base 1500 Weighted Base 1419 Effective Base 747 Positive 1096 77% Negative 323 23% Sigma 1419 100%
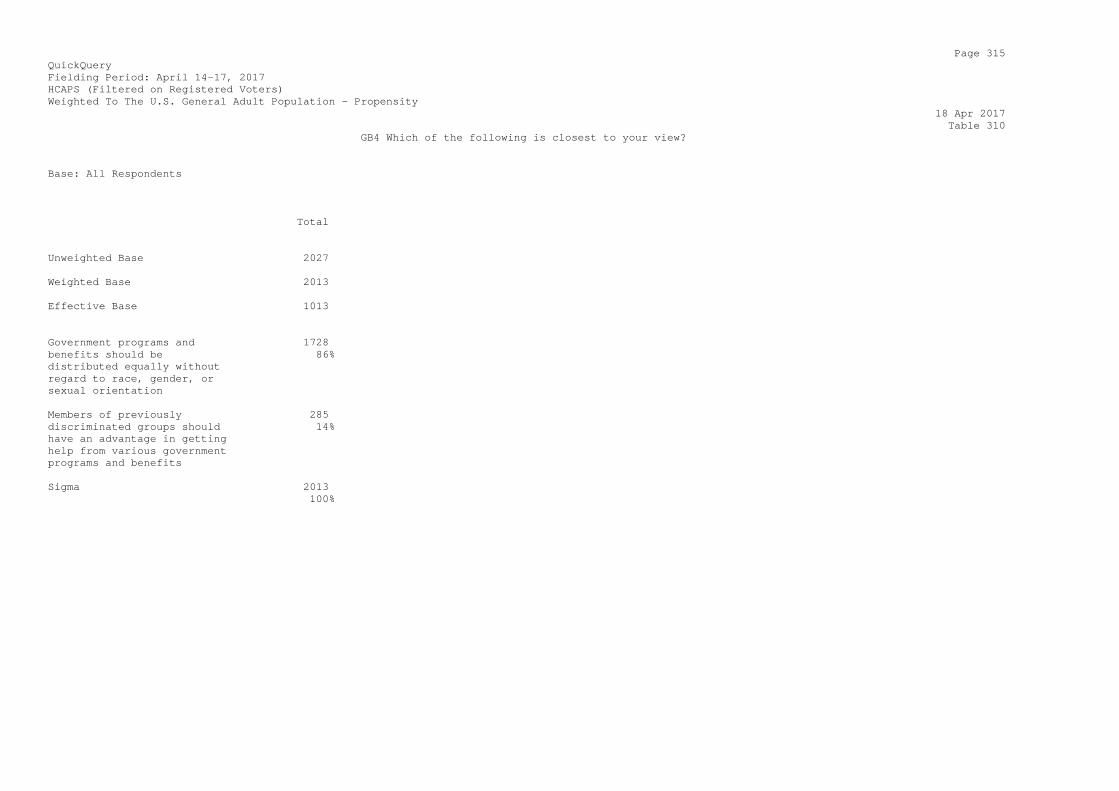
Page 315 QuickQuery Fielding Period: April 14-17, 2017 HCAPS (Filtered on Registered Voters) Weighted To The U.S. General Adult Population - Propensity 18 Apr 2017 Table 310 GB4 Which of the following is closest to your view? Base: All Respondents Total Unweighted Base 2027 Weighted Base 2013 Effective Base 1013 Government programs and 1728 benefits should be 86% distributed equally without regard to race, gender, or sexual orientation Members of previously 285 discriminated groups should 14% have an advantage in getting help from various government programs and benefits Sigma 2013 100%
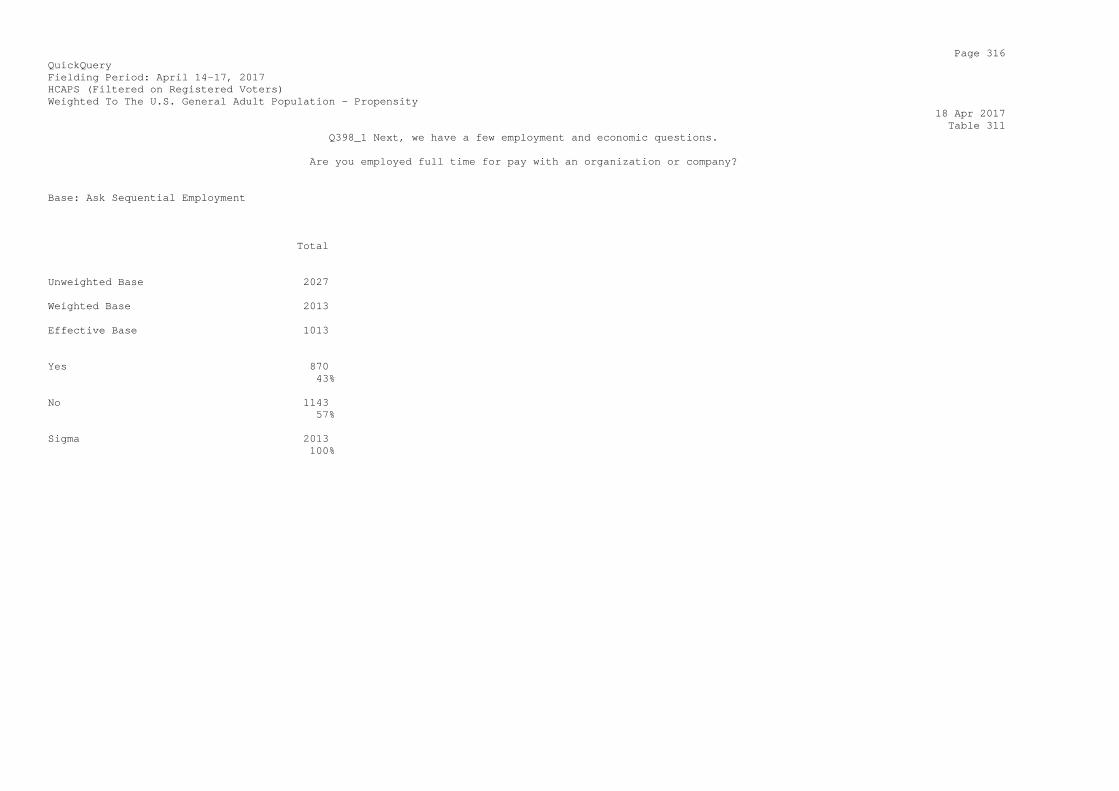
Page 316 QuickQuery Fielding Period: April 14-17, 2017 HCAPS (Filtered on Registered Voters) Weighted To The U.S. General Adult Population - Propensity 18 Apr 2017 Table 311 Q398_1 Next, we have a few employment and economic questions. Are you employed full time for pay with an organization or company? Base: Ask Sequential Employment Total Unweighted Base 2027 Weighted Base 2013 Effective Base 1013 Yes 870 43% No 1143 57% Sigma 2013 100%

Page 317 QuickQuery Fielding Period: April 14-17, 2017 HCAPS (Filtered on Registered Voters) Weighted To The U.S. General Adult Population - Propensity 18 Apr 2017 Table 312 Q398_2 Next, we have a few employment and economic questions. Are you employed part time for pay with an organization or company? Base: Ask Sequential Employment Total Unweighted Base 2027 Weighted Base 2013 Effective Base 1013 Yes 330 16% No 1683 84% Sigma 2013 100%
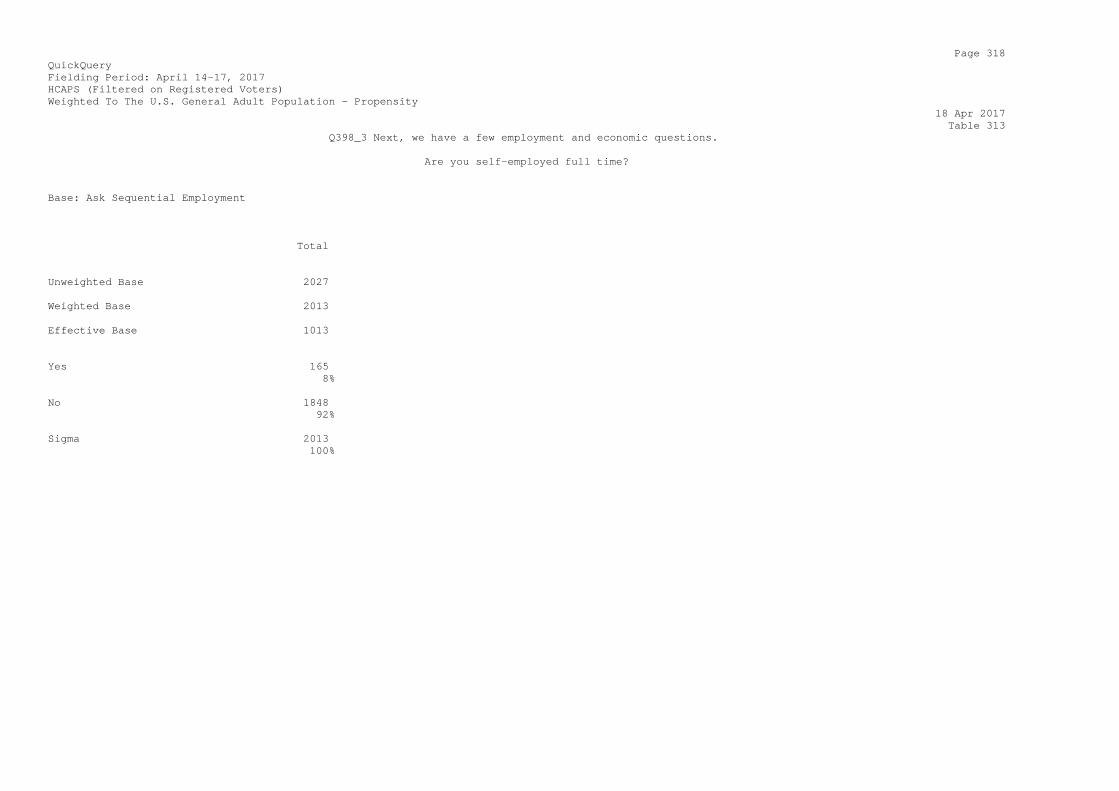
Page 318 QuickQuery Fielding Period: April 14-17, 2017 HCAPS (Filtered on Registered Voters) Weighted To The U.S. General Adult Population - Propensity 18 Apr 2017 Table 313 Q398_3 Next, we have a few employment and economic questions. Are you self-employed full time? Base: Ask Sequential Employment Total Unweighted Base 2027 Weighted Base 2013 Effective Base 1013 Yes 165 8% No 1848 92% Sigma 2013 100%

Page 319 QuickQuery Fielding Period: April 14-17, 2017 HCAPS (Filtered on Registered Voters) Weighted To The U.S. General Adult Population - Propensity 18 Apr 2017 Table 314 Q398_4 Next, we have a few employment and economic questions. Are you self-employed part time? Base: Ask Sequential Employment Total Unweighted Base 2027 Weighted Base 2013 Effective Base 1013 Yes 199 10% No 1815 90% Sigma 2013 100%
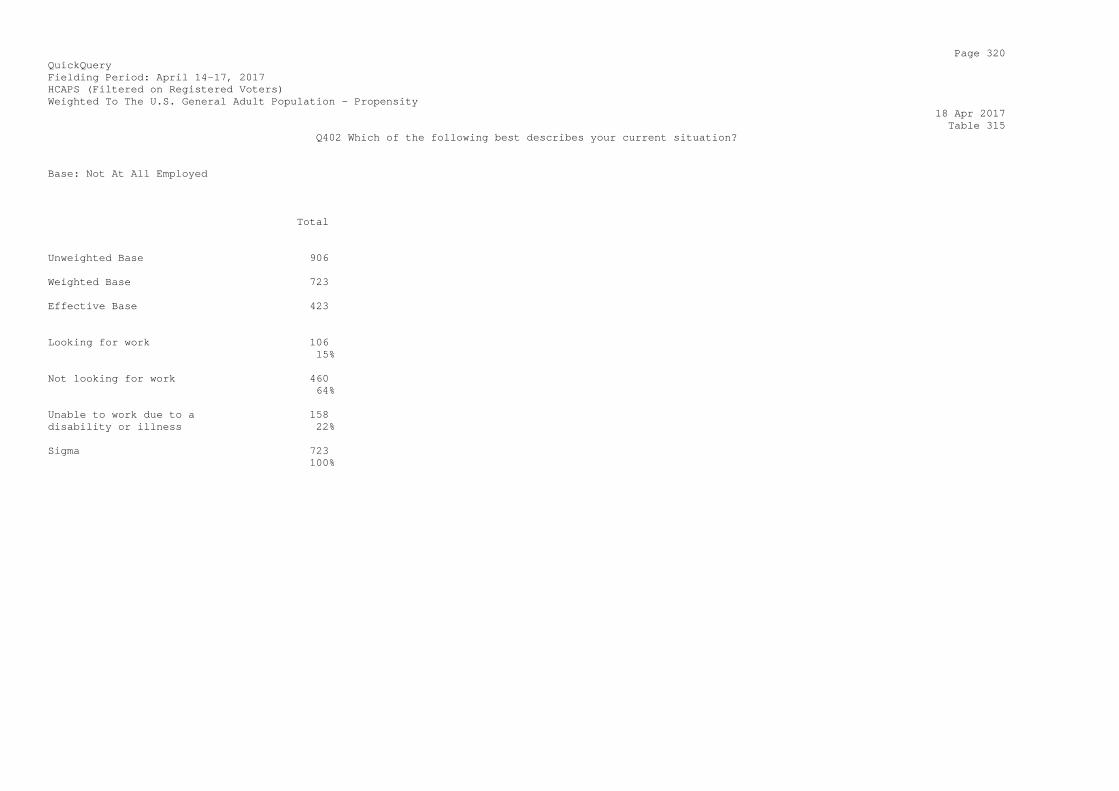
Page 320 QuickQuery Fielding Period: April 14-17, 2017 HCAPS (Filtered on Registered Voters) Weighted To The U.S. General Adult Population - Propensity 18 Apr 2017 Table 315 Q402 Which of the following best describes your current situation? Base: Not At All Employed Total Unweighted Base 906 Weighted Base 723 Effective Base 423 Looking for work 106 15% Not looking for work 460 64% Unable to work due to a 158 disability or illness 22% Sigma 723 100%
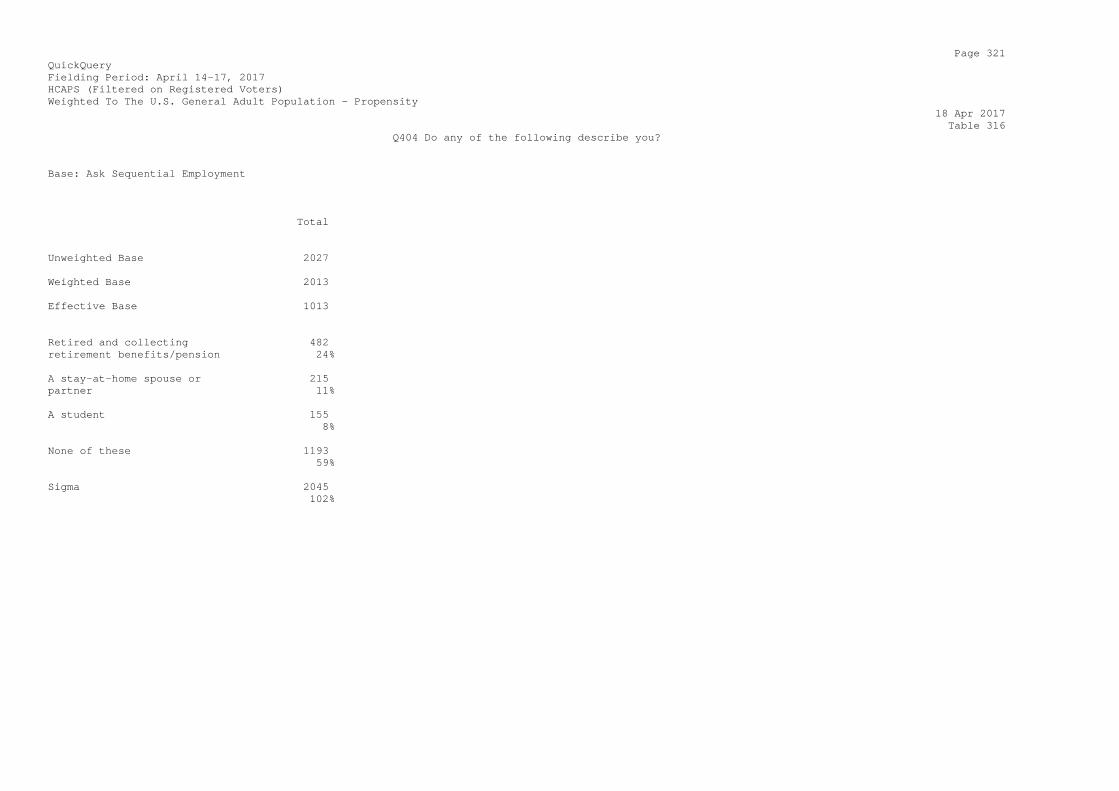
Page 321 QuickQuery Fielding Period: April 14-17, 2017 HCAPS (Filtered on Registered Voters) Weighted To The U.S. General Adult Population - Propensity 18 Apr 2017 Table 316 Q404 Do any of the following describe you? Base: Ask Sequential Employment Total Unweighted Base 2027 Weighted Base 2013 Effective Base 1013 Retired and collecting 482 retirement benefits/pension 24% A stay-at-home spouse or 215 partner 11% A student 155 8% None of these 1193 59% Sigma 2045 102%
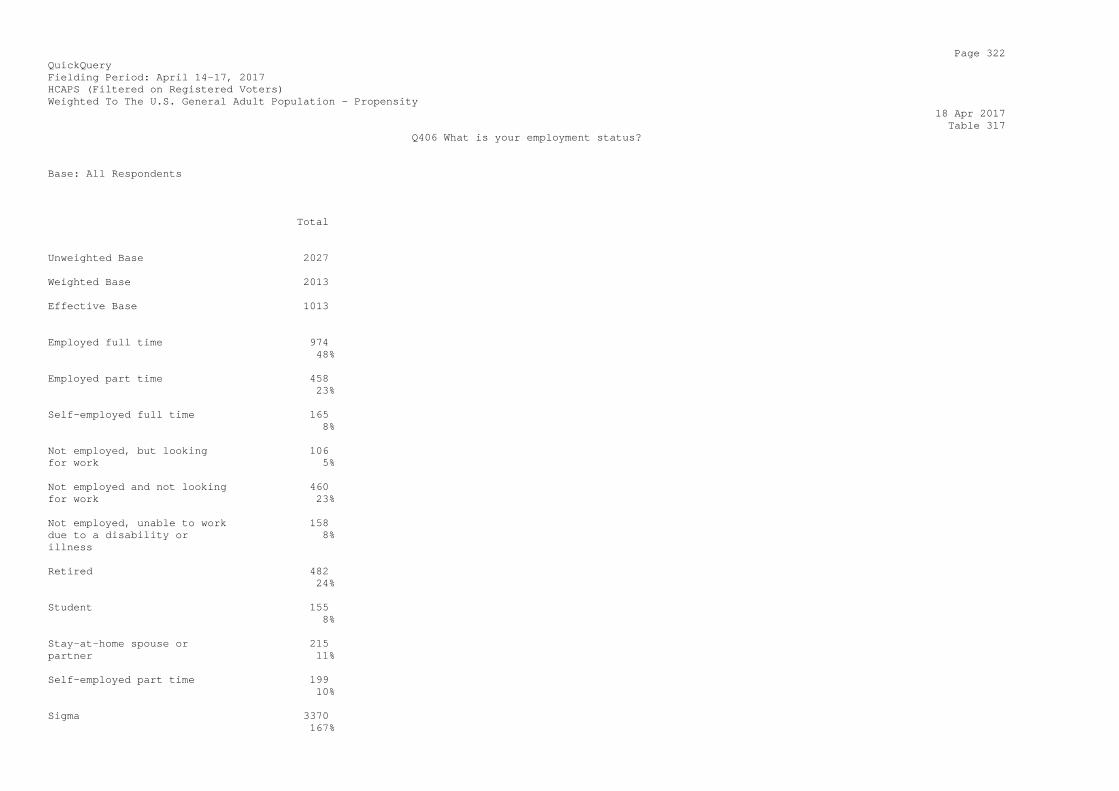
Page 322 QuickQuery Fielding Period: April 14-17, 2017 HCAPS (Filtered on Registered Voters) Weighted To The U.S. General Adult Population - Propensity 18 Apr 2017 Table 317 Q406 What is your employment status? Base: All Respondents Total Unweighted Base 2027 Weighted Base 2013 Effective Base 1013 Employed full time 974 48% Employed part time 458 23% Self-employed full time 165 8% Not employed, but looking 106 for work 5% Not employed and not looking 460 for work 23% Not employed, unable to work 158 due to a disability or 8% illness Retired 482 24% Student 155 8% Stay-at-home spouse or 215 partner 11% Self-employed part time 199 10% Sigma 3370 167%
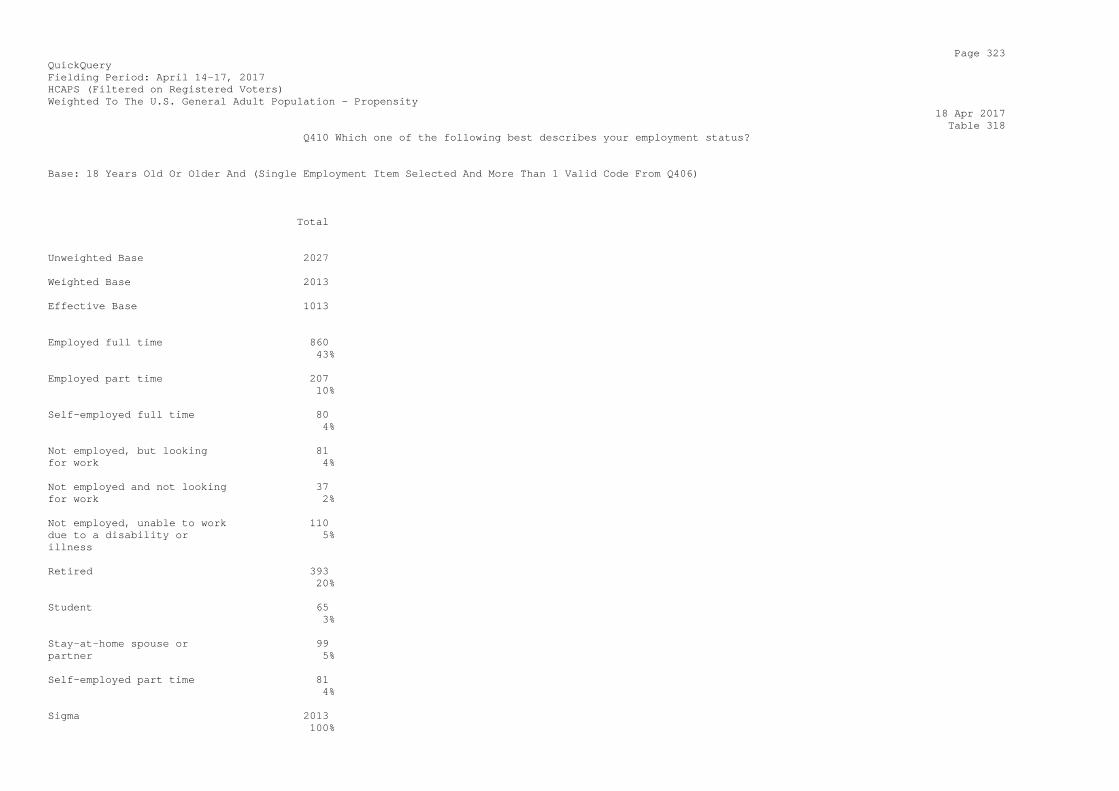
Page 323 QuickQuery Fielding Period: April 14-17, 2017 HCAPS (Filtered on Registered Voters) Weighted To The U.S. General Adult Population - Propensity 18 Apr 2017 Table 318 Q410 Which one of the following best describes your employment status? Base: 18 Years Old Or Older And (Single Employment Item Selected And More Than 1 Valid Code From Q406) Total Unweighted Base 2027 Weighted Base 2013 Effective Base 1013 Employed full time 860 43% Employed part time 207 10% Self-employed full time 80 4% Not employed, but looking 81 for work 4% Not employed and not looking 37 for work 2% Not employed, unable to work 110 due to a disability or 5% illness Retired 393 20% Student 65 3% Stay-at-home spouse or 99 partner 5% Self-employed part time 81 4% Sigma 2013 100%
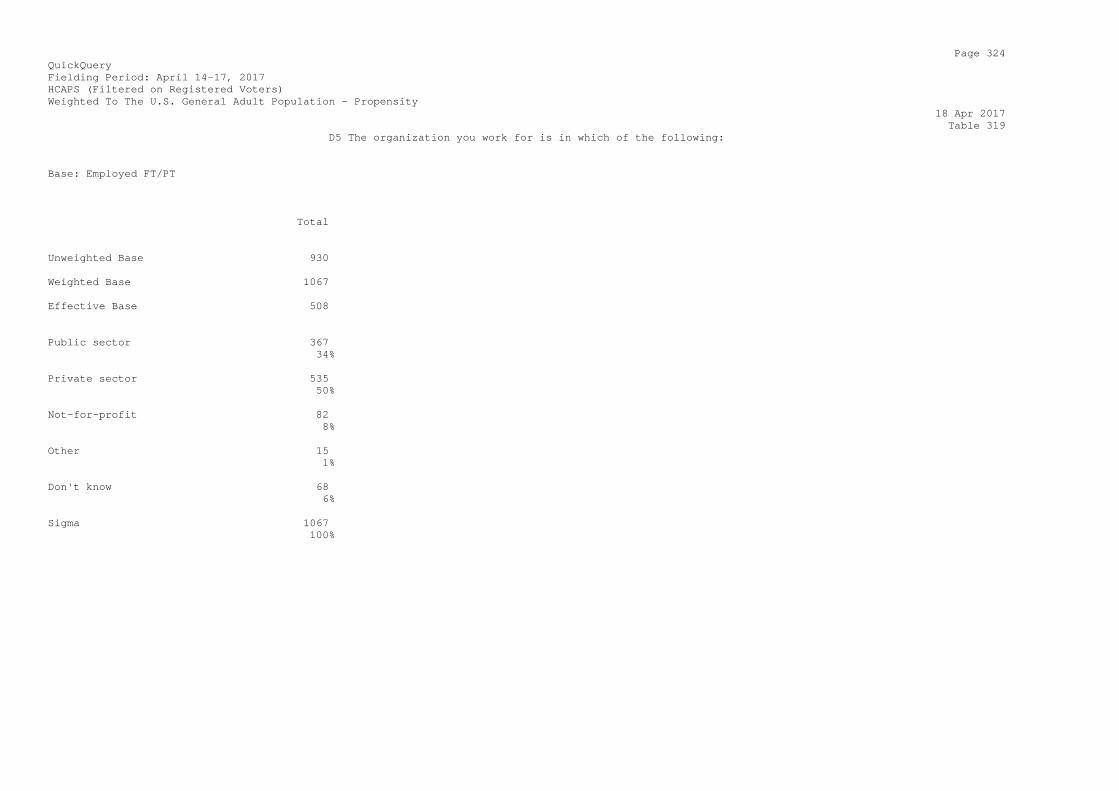
Page 324 QuickQuery Fielding Period: April 14-17, 2017 HCAPS (Filtered on Registered Voters) Weighted To The U.S. General Adult Population - Propensity 18 Apr 2017 Table 319 D5 The organization you work for is in which of the following: Base: Employed FT/PT Total Unweighted Base 930 Weighted Base 1067 Effective Base 508 Public sector 367 34% Private sector 535 50% Not-for-profit 82 8% Other 15 1% Don't know 68 6% Sigma 1067 100%
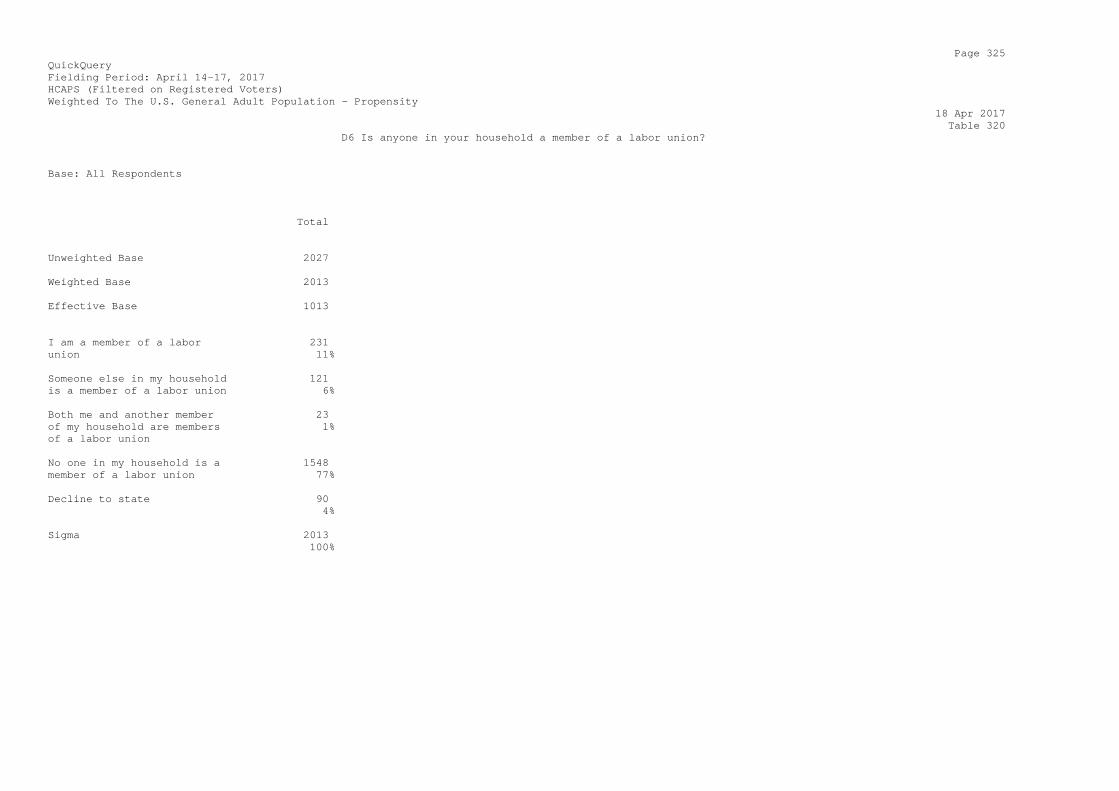
Page 325 QuickQuery Fielding Period: April 14-17, 2017 HCAPS (Filtered on Registered Voters) Weighted To The U.S. General Adult Population - Propensity 18 Apr 2017 Table 320 D6 Is anyone in your household a member of a labor union? Base: All Respondents Total Unweighted Base 2027 Weighted Base 2013 Effective Base 1013 I am a member of a labor 231 union 11% Someone else in my household 121 is a member of a labor union 6% Both me and another member 23 of my household are members 1% of a labor union No one in my household is a 1548 member of a labor union 77% Decline to state 90 4% Sigma 2013 100%
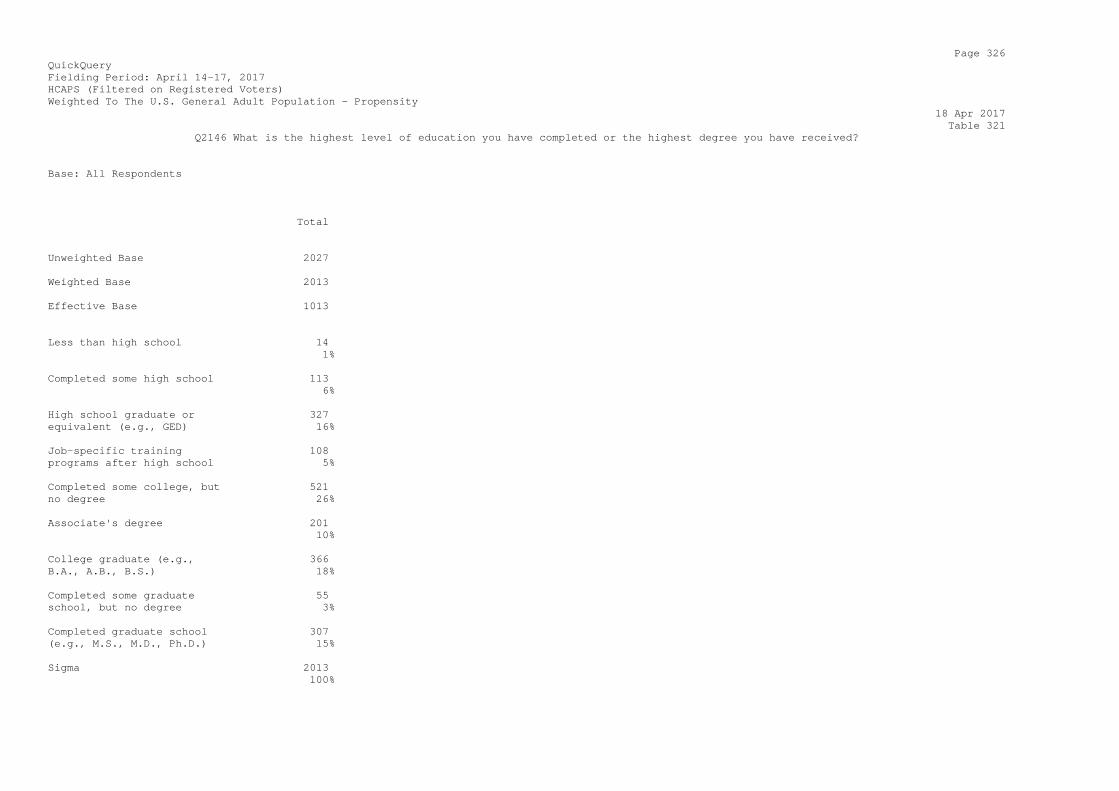
Page 326 QuickQuery Fielding Period: April 14-17, 2017 HCAPS (Filtered on Registered Voters) Weighted To The U.S. General Adult Population - Propensity 18 Apr 2017 Table 321 Q2146 What is the highest level of education you have completed or the highest degree you have received? Base: All Respondents Total Unweighted Base 2027 Weighted Base 2013 Effective Base 1013 Less than high school 14 1% Completed some high school 113 6% High school graduate or 327 equivalent (e.g., GED) 16% Job-specific training 108 programs after high school 5% Completed some college, but 521 no degree 26% Associate's degree 201 10% College graduate (e.g., 366 B.A., A.B., B.S.) 18% Completed some graduate 55 school, but no degree 3% Completed graduate school 307 (e.g., M.S., M.D., Ph.D.) 15% Sigma 2013 100%
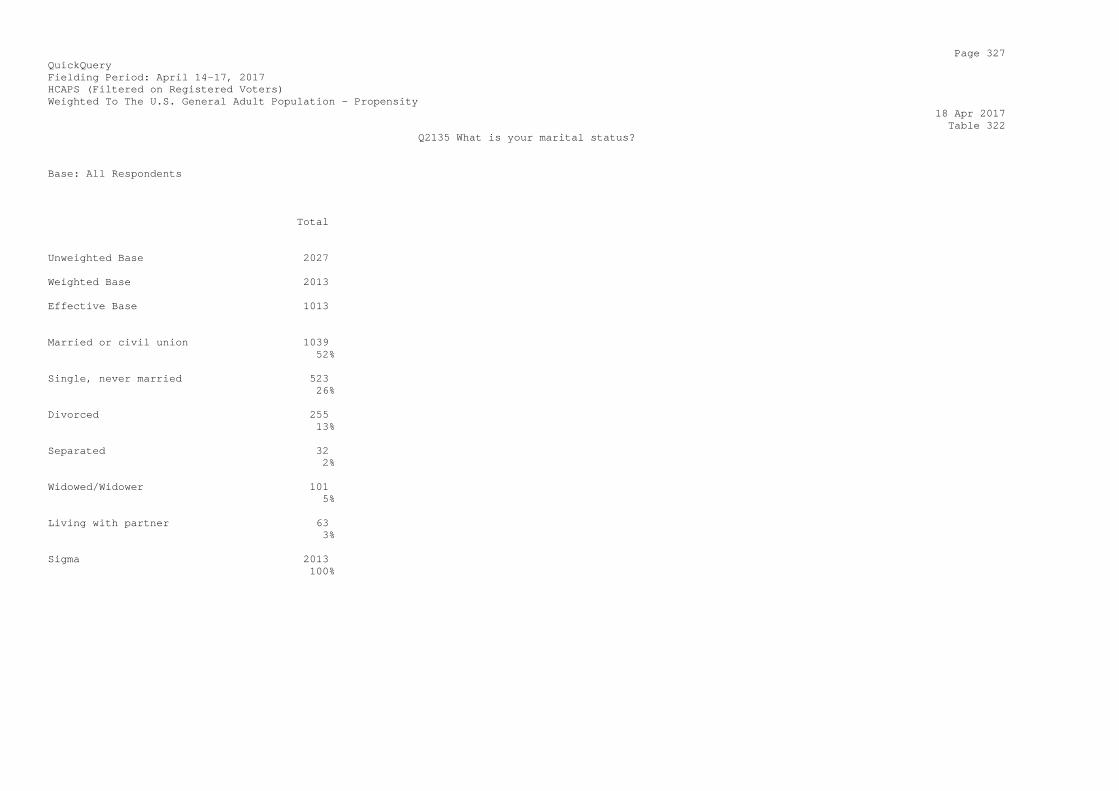
Page 327 QuickQuery Fielding Period: April 14-17, 2017 HCAPS (Filtered on Registered Voters) Weighted To The U.S. General Adult Population - Propensity 18 Apr 2017 Table 322 Q2135 What is your marital status? Base: All Respondents Total Unweighted Base 2027 Weighted Base 2013 Effective Base 1013 Married or civil union 1039 52% Single, never married 523 26% Divorced 255 13% Separated 32 2% Widowed/Widower 101 5% Living with partner 63 3% Sigma 2013 100%
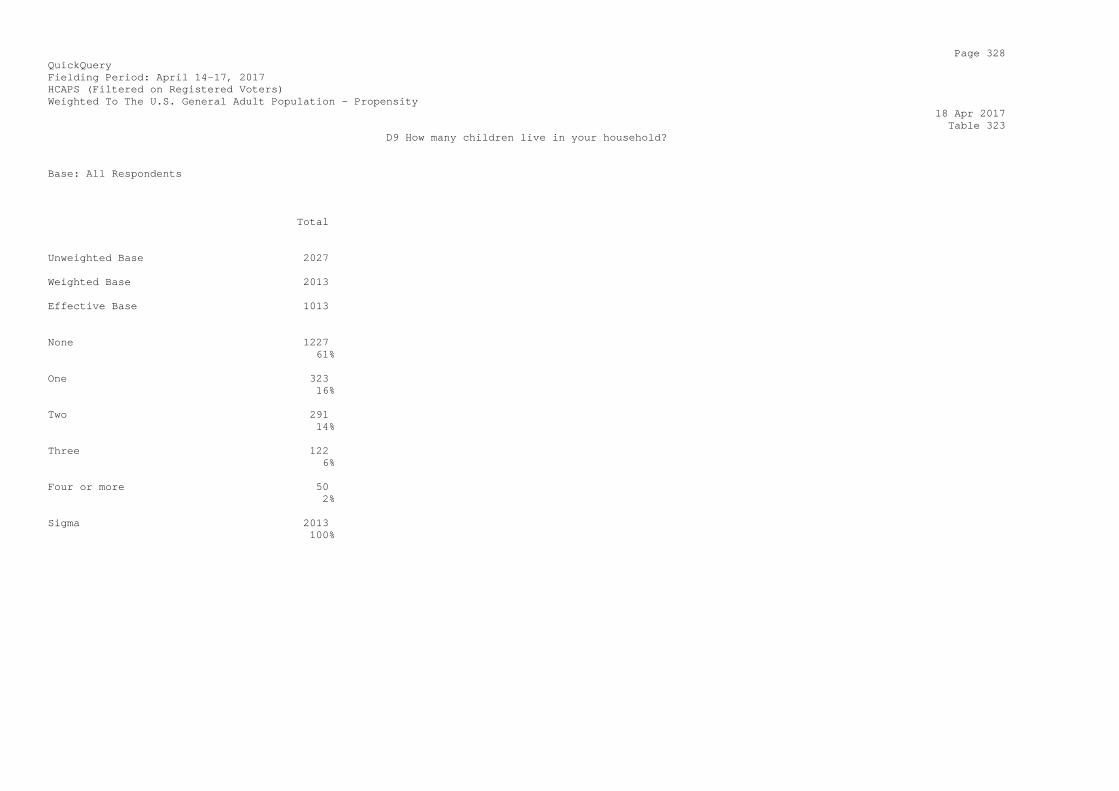
Page 328 QuickQuery Fielding Period: April 14-17, 2017 HCAPS (Filtered on Registered Voters) Weighted To The U.S. General Adult Population - Propensity 18 Apr 2017 Table 323 D9 How many children live in your household? Base: All Respondents Total Unweighted Base 2027 Weighted Base 2013 Effective Base 1013 None 1227 61% One 323 16% Two 291 14% Three 122 6% Four or more 50 2% Sigma 2013 100%

Page 329 QuickQuery Fielding Period: April 14-17, 2017 HCAPS (Filtered on Registered Voters) Weighted To The U.S. General Adult Population - Propensity 18 Apr 2017 Table 324 D10A_1 Are you registered to vote at your present address? 0 to 5 years old Base: Have Children Total Unweighted Base 656 Weighted Base 787 Effective Base 354 None 572 73% One 151 19% Two 44 6% Three 13 2% Four or more 6 1% Sigma 787 100%
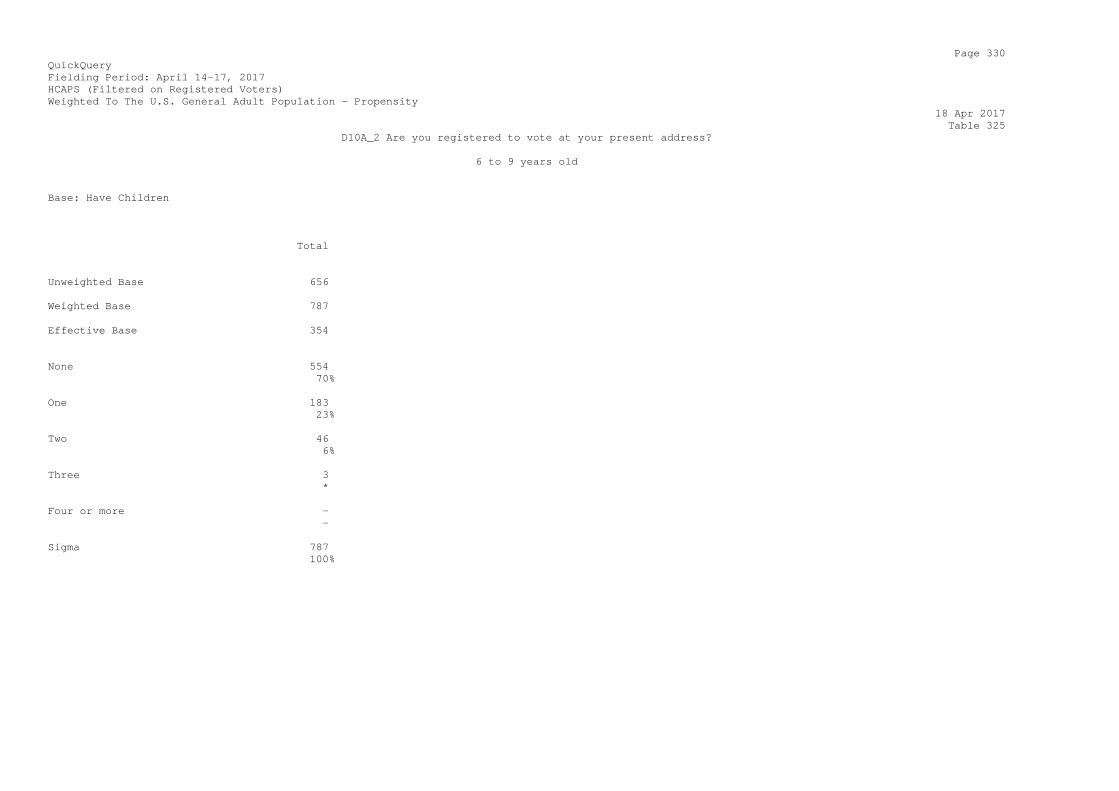
Page 330 QuickQuery Fielding Period: April 14-17, 2017 HCAPS (Filtered on Registered Voters) Weighted To The U.S. General Adult Population - Propensity 18 Apr 2017 Table 325 D10A_2 Are you registered to vote at your present address? 6 to 9 years old Base: Have Children Total Unweighted Base 656 Weighted Base 787 Effective Base 354 None 554 70% One 183 23% Two 46 6% Three 3 * Four or more - - Sigma 787 100%
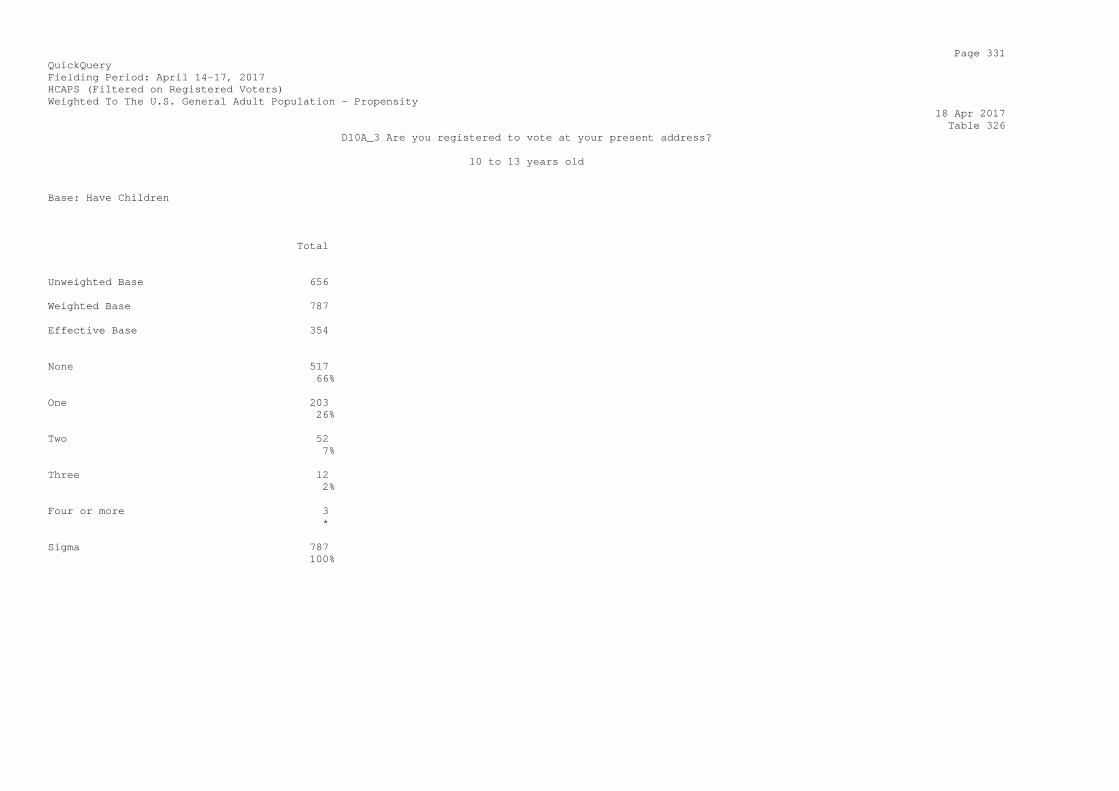
Page 331 QuickQuery Fielding Period: April 14-17, 2017 HCAPS (Filtered on Registered Voters) Weighted To The U.S. General Adult Population - Propensity 18 Apr 2017 Table 326 D10A_3 Are you registered to vote at your present address? 10 to 13 years old Base: Have Children Total Unweighted Base 656 Weighted Base 787 Effective Base 354 None 517 66% One 203 26% Two 52 7% Three 12 2% Four or more 3 * Sigma 787 100%

Page 332 QuickQuery Fielding Period: April 14-17, 2017 HCAPS (Filtered on Registered Voters) Weighted To The U.S. General Adult Population - Propensity 18 Apr 2017 Table 327 D10A_4 Are you registered to vote at your present address? 14 to 17 years old Base: Have Children Total Unweighted Base 656 Weighted Base 787 Effective Base 354 None 483 61% One 200 25% Two 74 9% Three 17 2% Four or more 12 1% Sigma 787 100%

Page 333 QuickQuery Fielding Period: April 14-17, 2017 HCAPS (Filtered on Registered Voters) Weighted To The U.S. General Adult Population - Propensity 18 Apr 2017 Table 328 S3 Some people had the chance to vote in this year's presidential election on November 8, 2016. Others did not. Did you vote in November's presidential election? Base: All Respondents Total Unweighted Base 2027 Weighted Base 2013 Effective Base 1013 Yes 1739 86% No 275 14% Sigma 2013 100%
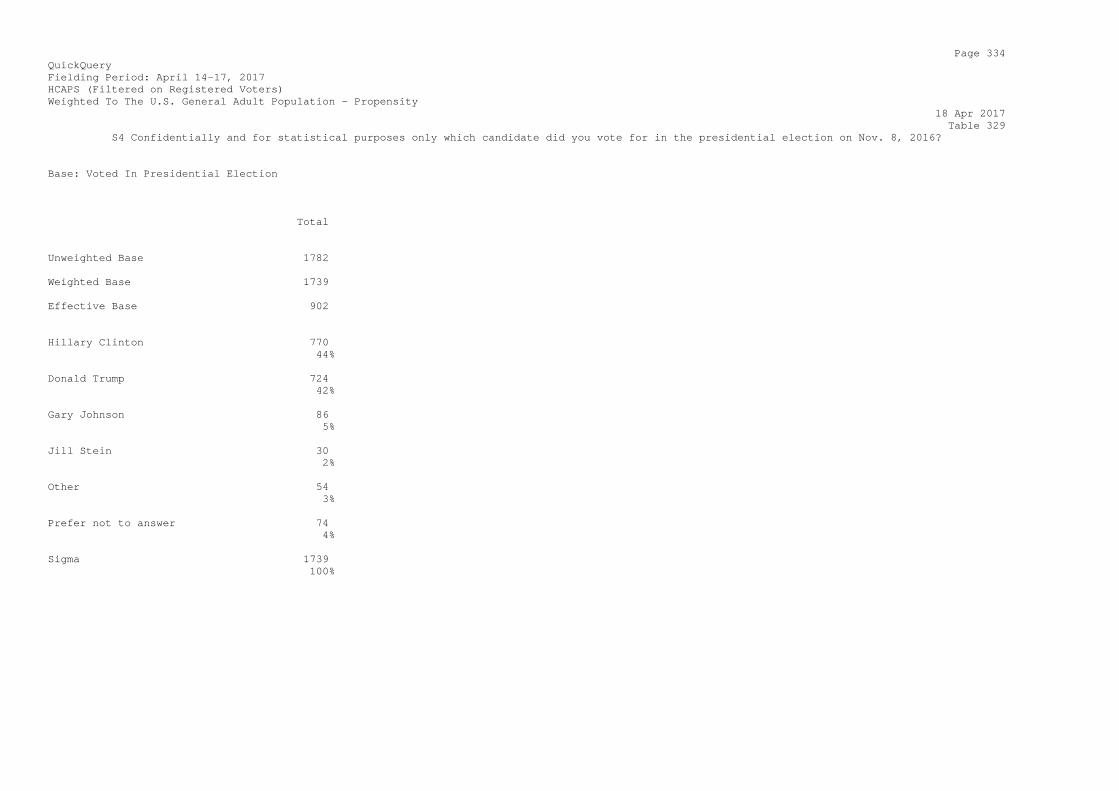
Page 334 QuickQuery Fielding Period: April 14-17, 2017 HCAPS (Filtered on Registered Voters) Weighted To The U.S. General Adult Population - Propensity 18 Apr 2017 Table 329 S4 Confidentially and for statistical purposes only which candidate did you vote for in the presidential election on Nov. 8, 2016? Base: Voted In Presidential Election Total Unweighted Base 1782 Weighted Base 1739 Effective Base 902 Hillary Clinton 770 44% Donald Trump 724 42% Gary Johnson 86 5% Jill Stein 30 2% Other 54 3% Prefer not to answer 74 4% Sigma 1739 100%
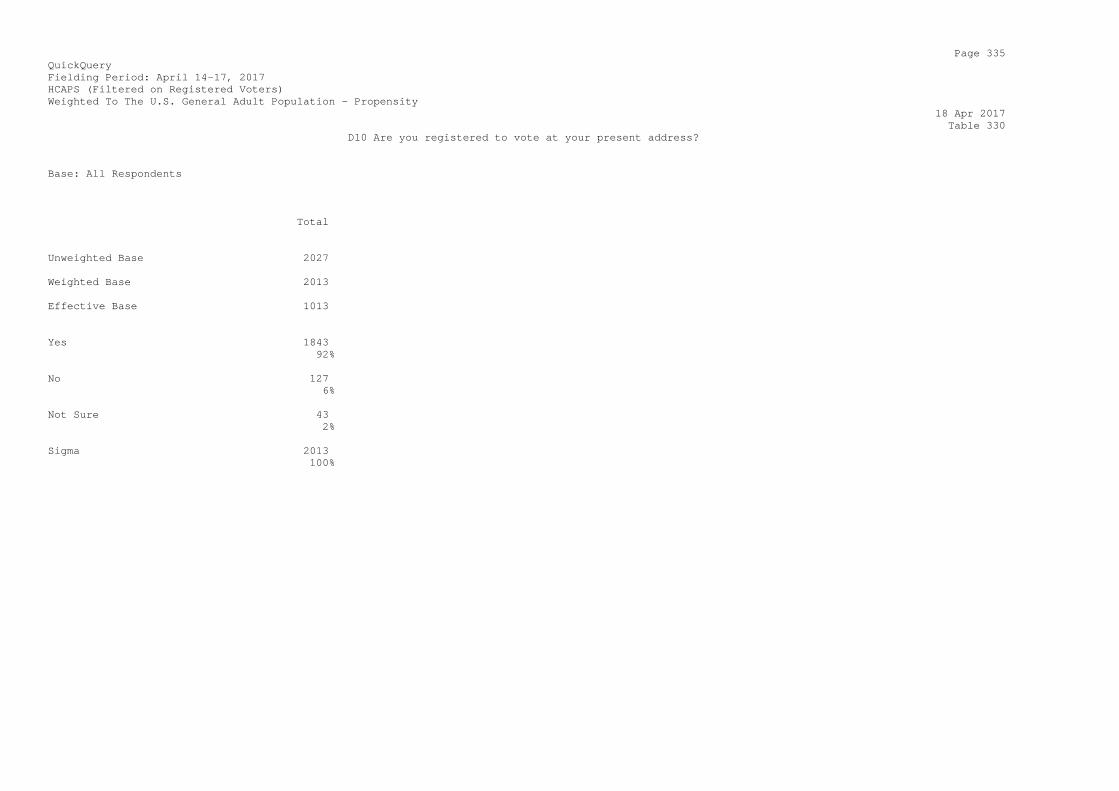
Page 335 QuickQuery Fielding Period: April 14-17, 2017 HCAPS (Filtered on Registered Voters) Weighted To The U.S. General Adult Population - Propensity 18 Apr 2017 Table 330 D10 Are you registered to vote at your present address? Base: All Respondents Total Unweighted Base 2027 Weighted Base 2013 Effective Base 1013 Yes 1843 92% No 127 6% Not Sure 43 2% Sigma 2013 100%
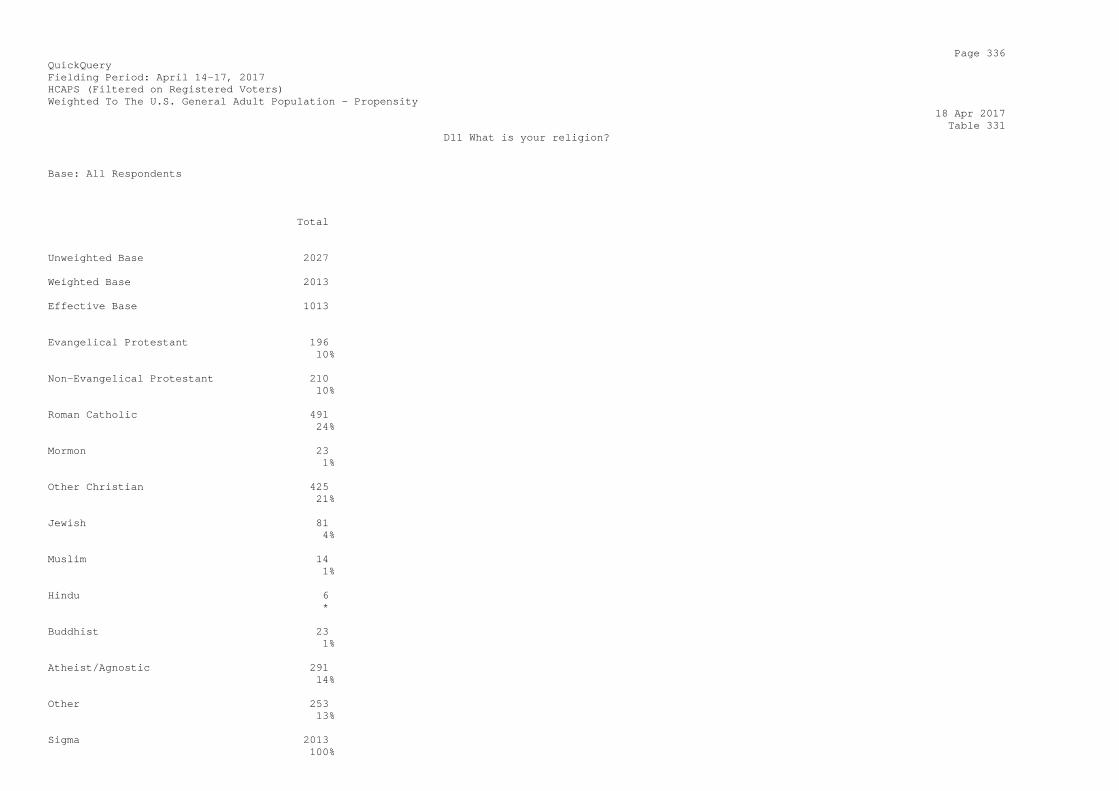
Page 336 QuickQuery Fielding Period: April 14-17, 2017 HCAPS (Filtered on Registered Voters) Weighted To The U.S. General Adult Population - Propensity 18 Apr 2017 Table 331 D11 What is your religion? Base: All Respondents Total Unweighted Base 2027 Weighted Base 2013 Effective Base 1013 Evangelical Protestant 196 10% Non-Evangelical Protestant 210 10% Roman Catholic 491 24% Mormon 23 1% Other Christian 425 21% Jewish 81 4% Muslim 14 1% Hindu 6 * Buddhist 23 1% Atheist/Agnostic 291 14% Other 253 13% Sigma 2013 100%

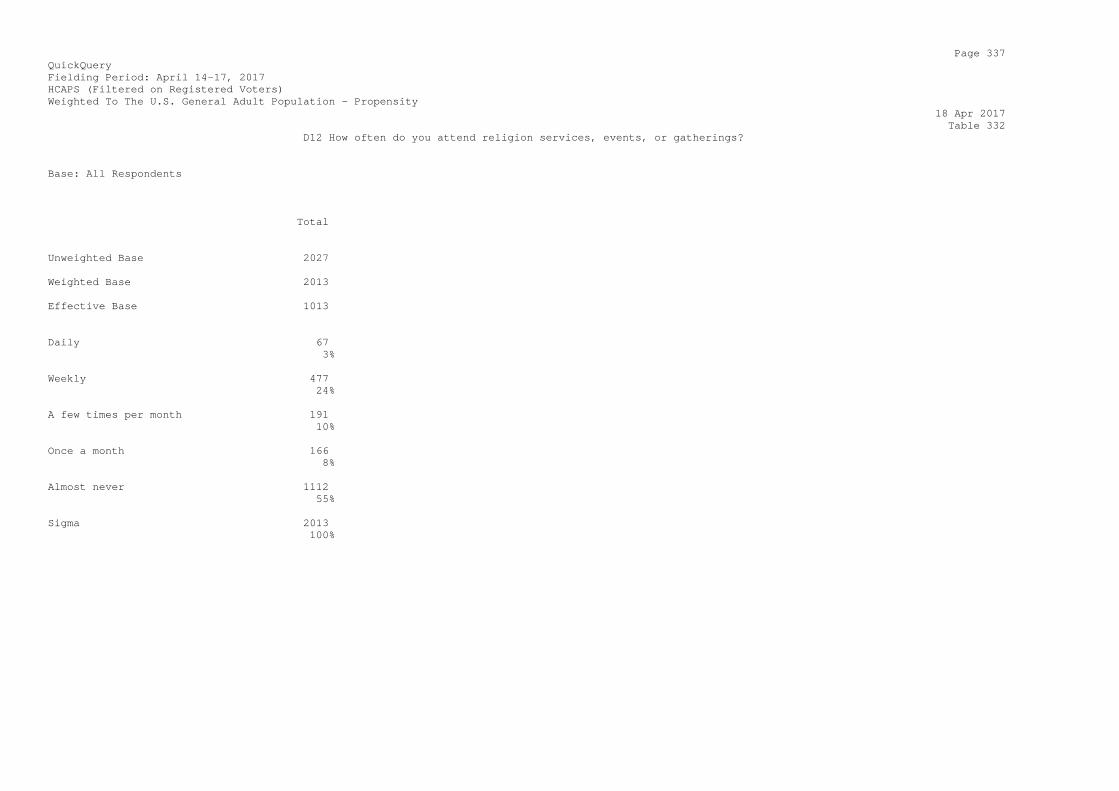
Page 337 QuickQuery Fielding Period: April 14-17, 2017 HCAPS (Filtered on Registered Voters) Weighted To The U.S. General Adult Population - Propensity 18 Apr 2017 Table 332 D12 How often do you attend religion services, events, or gatherings? Base: All Respondents Total Unweighted Base 2027 Weighted Base 2013 Effective Base 1013 Daily 67 3% Weekly 477 24% A few times per month 191 10% Once a month 166 8% Almost never 1112 55% Sigma 2013 100%
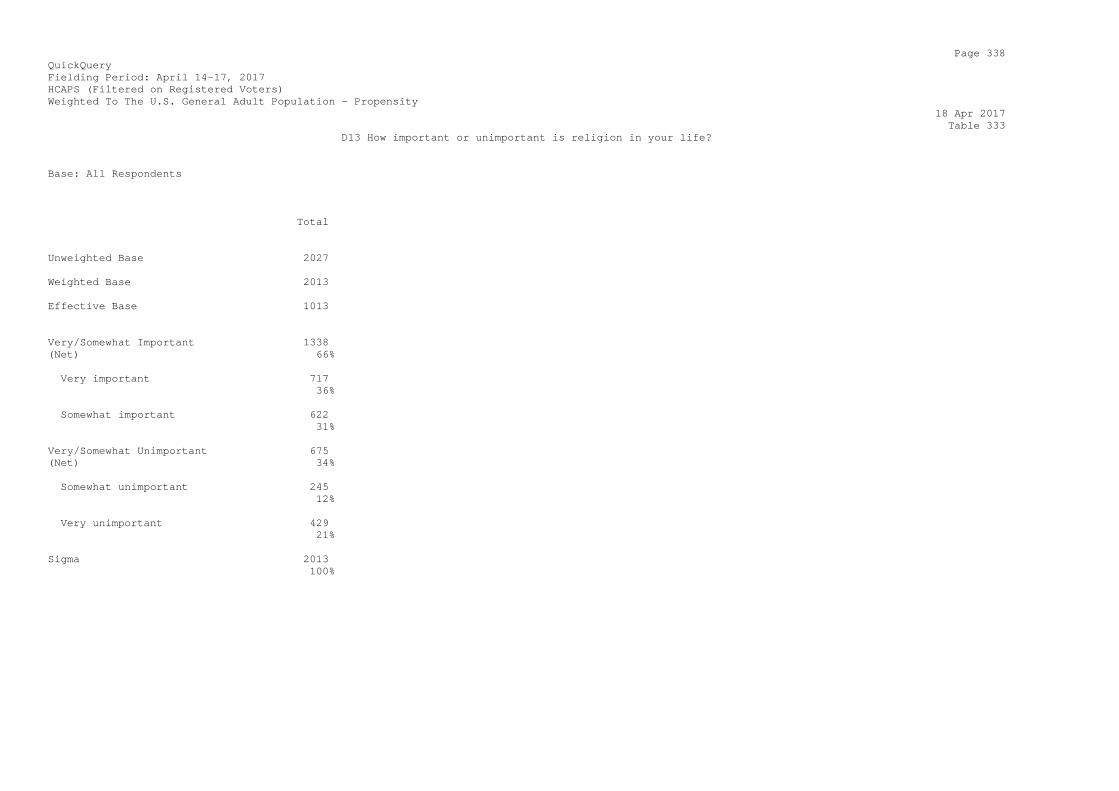
Page 338 QuickQuery Fielding Period: April 14-17, 2017 HCAPS (Filtered on Registered Voters) Weighted To The U.S. General Adult Population - Propensity 18 Apr 2017 Table 333 D13 How important or unimportant is religion in your life? Base: All Respondents Total Unweighted Base 2027 Weighted Base 2013 Effective Base 1013 Very/Somewhat Important 1338 (Net) 66% Very important 717 36% Somewhat important 622 31% Very/Somewhat Unimportant 675 (Net) 34% Somewhat unimportant 245 12% Very unimportant 429 21% Sigma 2013 100%

Page 339 QuickQuery Fielding Period: April 14-17, 2017 HCAPS (Filtered on Registered Voters) Weighted To The U.S. General Adult Population - Propensity 18 Apr 2017 Table 334 D14 Does anyone in your household own a gun? Base: All Respondents Total Unweighted Base 2027 Weighted Base 2013 Effective Base 1013 Yes 697 35% No 1316 65% Sigma 2013 100%
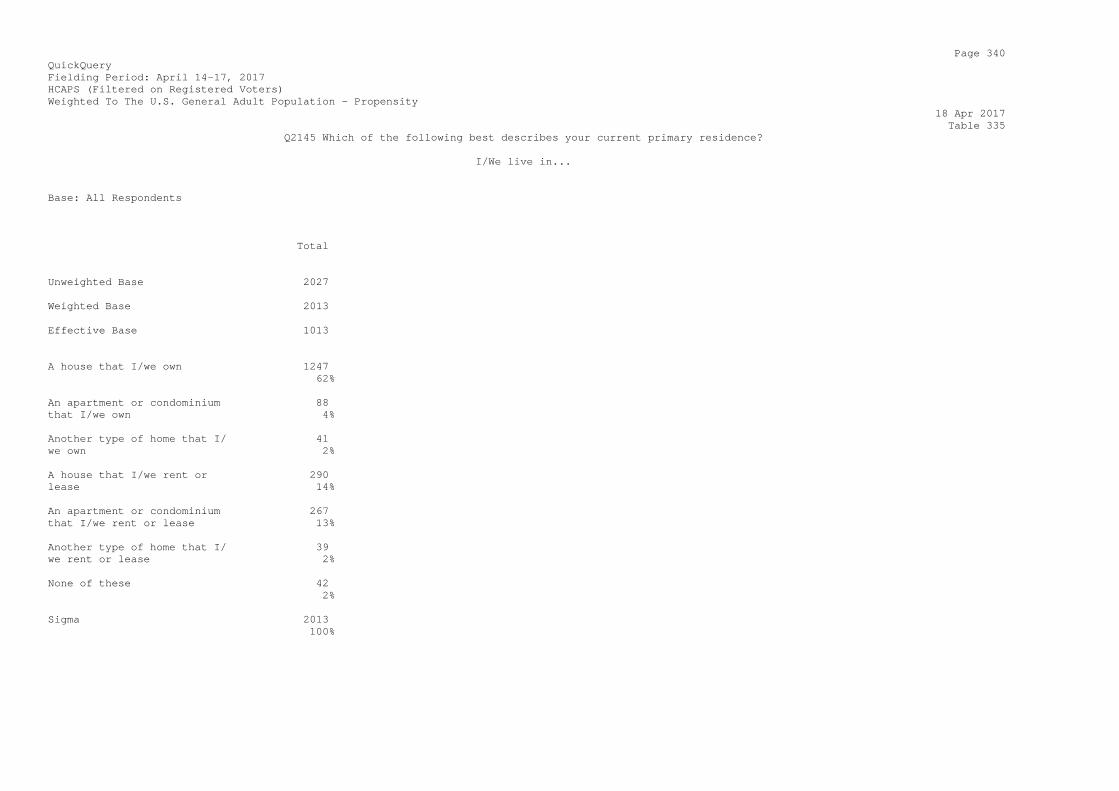
Page 340 QuickQuery Fielding Period: April 14-17, 2017 HCAPS (Filtered on Registered Voters) Weighted To The U.S. General Adult Population - Propensity 18 Apr 2017 Table 335 Q2145 Which of the following best describes your current primary residence? I/We live in... Base: All Respondents Total Unweighted Base 2027 Weighted Base 2013 Effective Base 1013 A house that I/we own 1247 62% An apartment or condominium 88 that I/we own 4% Another type of home that I/ 41 we own 2% A house that I/we rent or 290 lease 14% An apartment or condominium 267 that I/we rent or lease 13% Another type of home that I/ 39 we rent or lease 2% None of these 42 2% Sigma 2013 100%
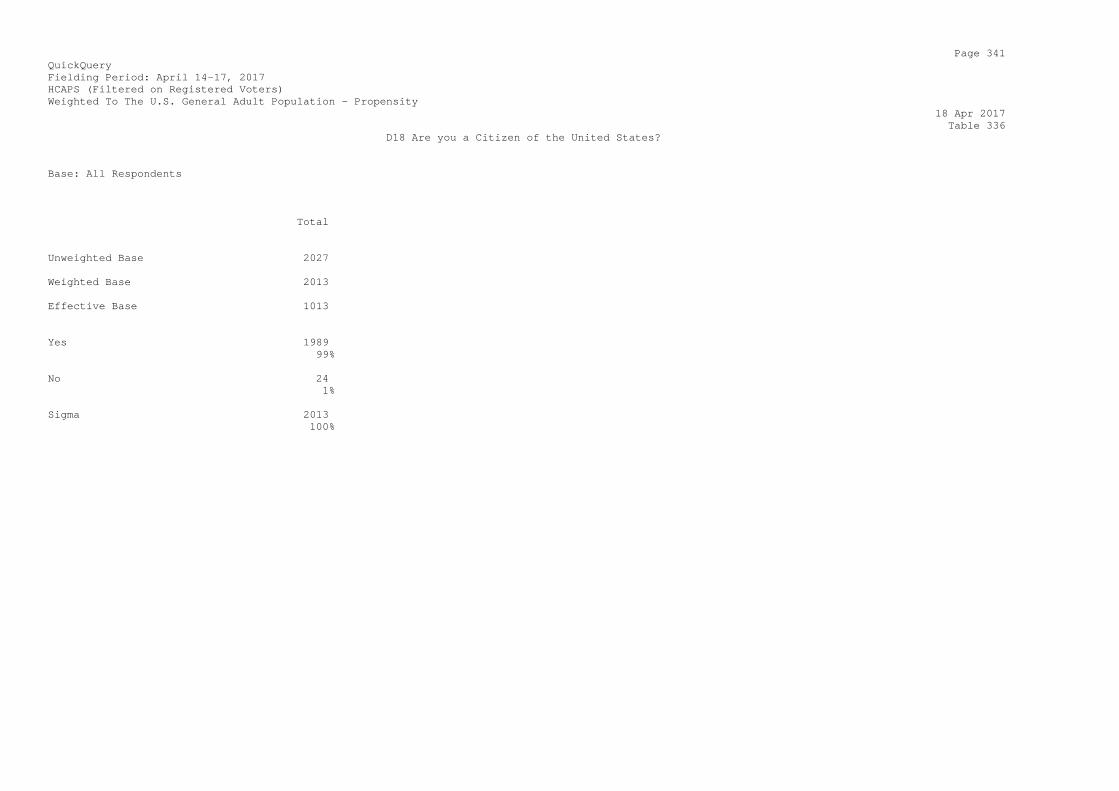
Page 341 QuickQuery Fielding Period: April 14-17, 2017 HCAPS (Filtered on Registered Voters) Weighted To The U.S. General Adult Population - Propensity 18 Apr 2017 Table 336 D18 Are you a Citizen of the United States? Base: All Respondents Total Unweighted Base 2027 Weighted Base 2013 Effective Base 1013 Yes 1989 99% No 24 1% Sigma 2013 100%
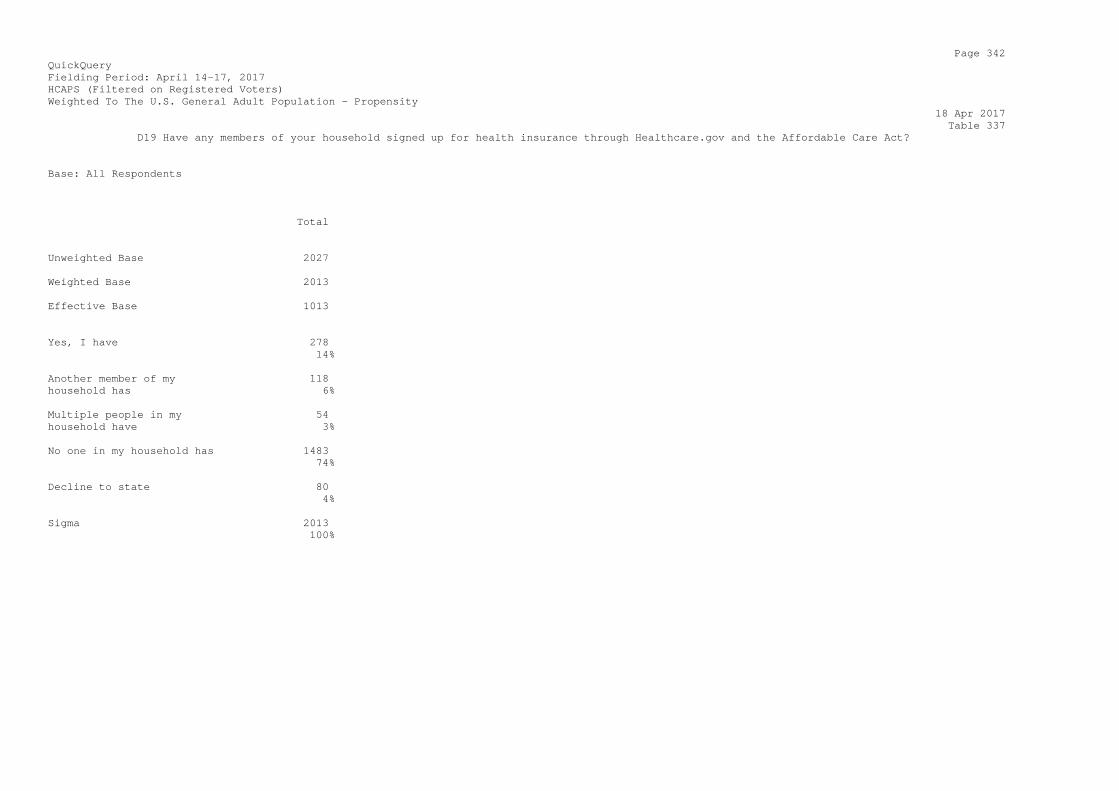
Page 342 QuickQuery Fielding Period: April 14-17, 2017 HCAPS (Filtered on Registered Voters) Weighted To The U.S. General Adult Population - Propensity 18 Apr 2017 Table 337 D19 Have any members of your household signed up for health insurance through Healthcare.gov and the Affordable Care Act? Base: All Respondents Total Unweighted Base 2027 Weighted Base 2013 Effective Base 1013 Yes, I have 278 14% Another member of my 118 household has 6% Multiple people in my 54 household have 3% No one in my household has 1483 74% Decline to state 80 4% Sigma 2013 100%
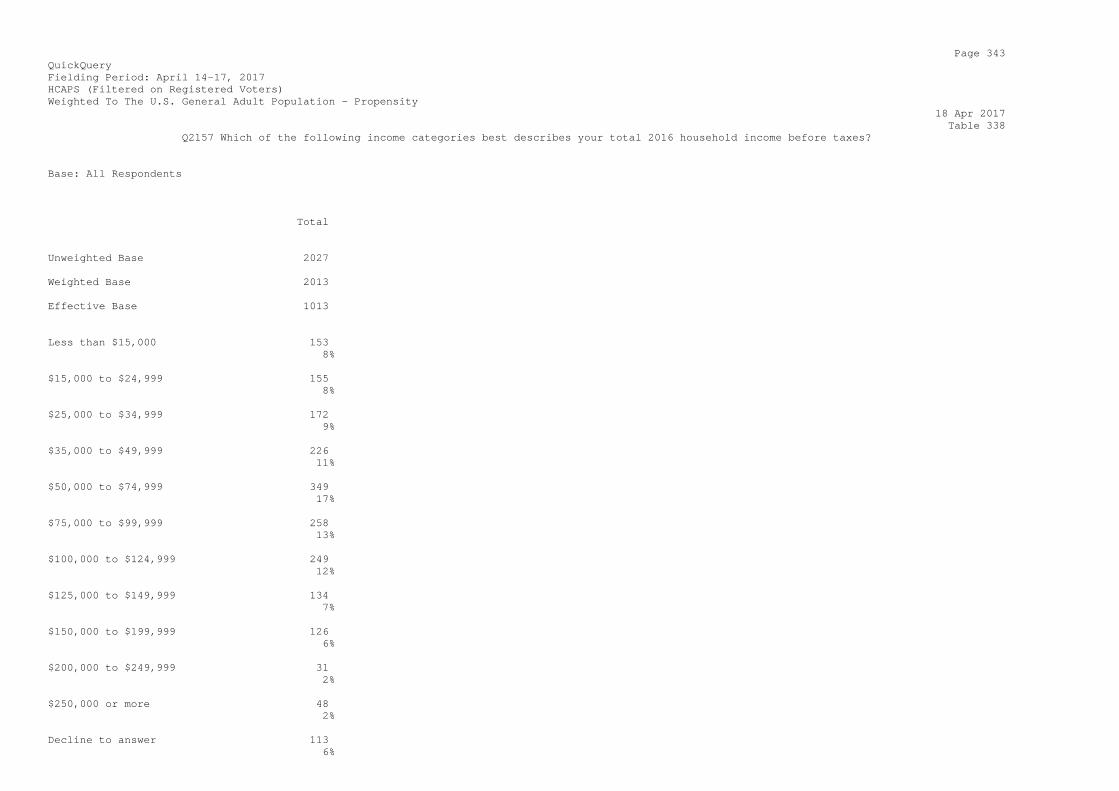
Page 343 QuickQuery Fielding Period: April 14-17, 2017 HCAPS (Filtered on Registered Voters) Weighted To The U.S. General Adult Population - Propensity 18 Apr 2017 Table 338 Q2157 Which of the following income categories best describes your total 2016 household income before taxes? Base: All Respondents Total Unweighted Base 2027 Weighted Base 2013 Effective Base 1013 Less than $15,000 153 8% $15,000 to $24,999 155 8% $25,000 to $34,999 172 9% $35,000 to $49,999 226 11% $50,000 to $74,999 349 17% $75,000 to $99,999 258 13% $100,000 to $124,999 249 12% $125,000 to $149,999 134 7% $150,000 to $199,999 126 6% $200,000 to $249,999 31 2% $250,000 or more 48 2% Decline to answer 113 6%

Sigma 2013 100%