Cross-sectional Studies in Guangdong Province, Blood ...
17
Page 1/17 The Association of Temperature Variability With Blood Pressure in Southern China: a Series of Cross-sectional Studies in Guangdong Province, China Muyun Li Southern Medical University School of Public Health Ruilin Meng Guangdong Province CDC: Guangdong Center for Disease Control and Prevention Jiali Luo Guangdong Province CDC: Guangdong Center for Disease Control and Prevention Xiaojun Xu Guangdong Province CDC: Guangdong Center for Disease Control and Prevention Jianxiong Hu Guangdong Province CDC: Guangdong Center for Disease Control and Prevention Guanhao He Guangdong Province CDC: Guangdong Center for Disease Control and Prevention Xing Li Guangdong Province CDC: Guangdong Center for Disease Control and Prevention Weilin Zeng Guangdong Province CDC: Guangdong Center for Disease Control and Prevention Tao Liu Guangdong Province CDC: Guangdong Center for Disease Control and Prevention Jianpeng Xiao Guangdong Province CDC: Guangdong Center for Disease Control and Prevention Wenjun Ma ( [email protected] ) Guangdong Provincial Institute of Public Health https://orcid.org/0000-0002-9266-4802 Research Keywords: temperature variability, generalized additive model, blood pressure Posted Date: September 7th, 2021 DOI: https://doi.org/10.21203/rs.3.rs-847370/v1
Transcript of Cross-sectional Studies in Guangdong Province, Blood ...
Page 1/17
The Association of Temperature Variability WithBlood Pressure in Southern China: a Series ofCross-sectional Studies in Guangdong Province,ChinaMuyun Li
Southern Medical University School of Public HealthRuilin Meng
Guangdong Province CDC: Guangdong Center for Disease Control and PreventionJiali Luo
Guangdong Province CDC: Guangdong Center for Disease Control and PreventionXiaojun Xu
Guangdong Province CDC: Guangdong Center for Disease Control and PreventionJianxiong Hu
Guangdong Province CDC: Guangdong Center for Disease Control and PreventionGuanhao He
Guangdong Province CDC: Guangdong Center for Disease Control and PreventionXing Li
Guangdong Province CDC: Guangdong Center for Disease Control and PreventionWeilin Zeng
Guangdong Province CDC: Guangdong Center for Disease Control and PreventionTao Liu
Guangdong Province CDC: Guangdong Center for Disease Control and PreventionJianpeng Xiao
Guangdong Province CDC: Guangdong Center for Disease Control and PreventionWenjun Ma ( [email protected] )
Guangdong Provincial Institute of Public Health https://orcid.org/0000-0002-9266-4802
Research
Keywords: temperature variability, generalized additive model, blood pressure
Posted Date: September 7th, 2021
DOI: https://doi.org/10.21203/rs.3.rs-847370/v1

Page 2/17
License: This work is licensed under a Creative Commons Attribution 4.0 International License. Read Full License
Page 3/17
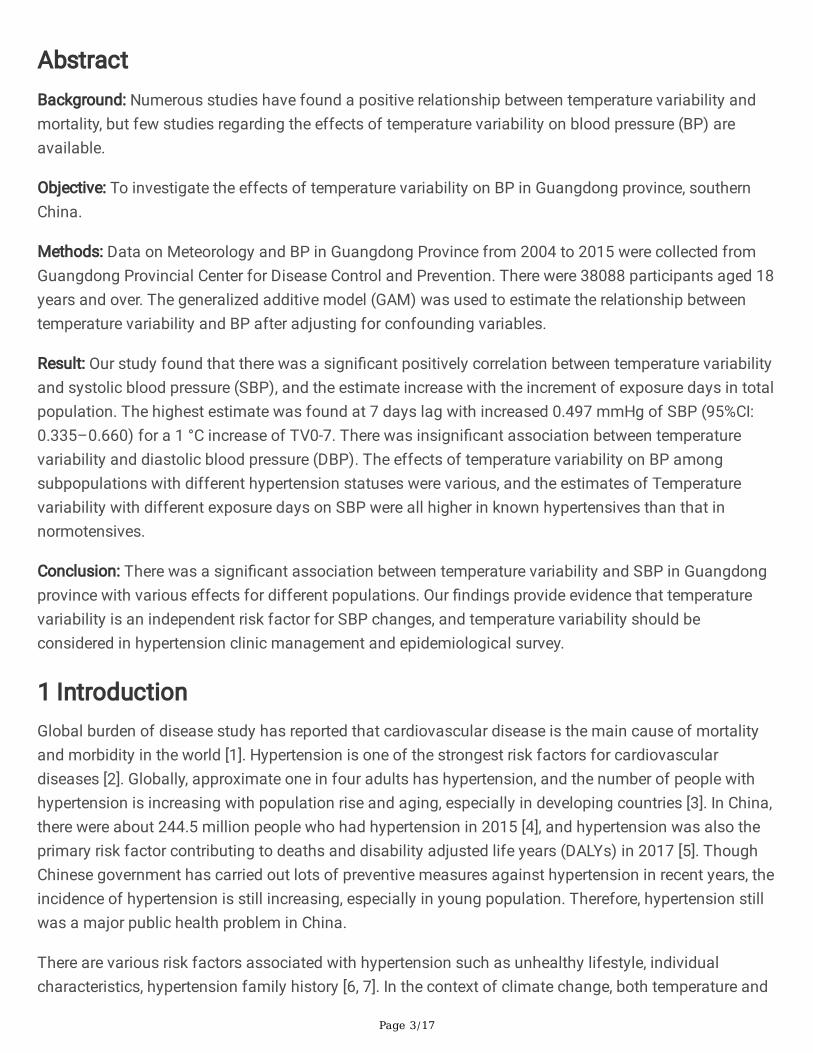
AbstractBackground: Numerous studies have found a positive relationship between temperature variability andmortality, but few studies regarding the effects of temperature variability on blood pressure (BP) areavailable.
Objective: To investigate the effects of temperature variability on BP in Guangdong province, southernChina.
Methods: Data on Meteorology and BP in Guangdong Province from 2004 to 2015 were collected fromGuangdong Provincial Center for Disease Control and Prevention. There were 38088 participants aged 18years and over. The generalized additive model (GAM) was used to estimate the relationship betweentemperature variability and BP after adjusting for confounding variables.
Result: Our study found that there was a signi�cant positively correlation between temperature variabilityand systolic blood pressure (SBP), and the estimate increase with the increment of exposure days in totalpopulation. The highest estimate was found at 7 days lag with increased 0.497 mmHg of SBP (95%CI:0.335–0.660) for a 1 °C increase of TV0-7. There was insigni�cant association between temperaturevariability and diastolic blood pressure (DBP). The effects of temperature variability on BP amongsubpopulations with different hypertension statuses were various, and the estimates of Temperaturevariability with different exposure days on SBP were all higher in known hypertensives than that innormotensives.
Conclusion: There was a signi�cant association between temperature variability and SBP in Guangdongprovince with various effects for different populations. Our �ndings provide evidence that temperaturevariability is an independent risk factor for SBP changes, and temperature variability should beconsidered in hypertension clinic management and epidemiological survey.
1 IntroductionGlobal burden of disease study has reported that cardiovascular disease is the main cause of mortalityand morbidity in the world [1]. Hypertension is one of the strongest risk factors for cardiovasculardiseases [2]. Globally, approximate one in four adults has hypertension, and the number of people withhypertension is increasing with population rise and aging, especially in developing countries [3]. In China,there were about 244.5 million people who had hypertension in 2015 [4], and hypertension was also theprimary risk factor contributing to deaths and disability adjusted life years (DALYs) in 2017 [5]. ThoughChinese government has carried out lots of preventive measures against hypertension in recent years, theincidence of hypertension is still increasing, especially in young population. Therefore, hypertension stillwas a major public health problem in China.
There are various risk factors associated with hypertension such as unhealthy lifestyle, individualcharacteristics, hypertension family history [6, 7]. In the context of climate change, both temperature and
Page 4/17
temperature variability used as to project indicator is increasing in the end of 21st century [8], and therelationship between air temperature and blood pressure (BP) has received much attention [9, 10].Generally, ambient temperature is negatively associated with BP. Temperature variability includes diurnaltemperature range (DTR), temperature change between neighboring days (TCN), and temperaturevariability within different exposure days (TV0-n). However, the evidence on the associations betweentemperature variability and BP are limited and inconsistent. For instance, Zheng et.al found that DTR waspositively associated with SBP, and negatively associated with DBP in northwest China [11]. However, Limat.al found that BP had null associations with DTR in Seoul, Korea [12]. Additionally, the two studies justfocused on DTR that only represents temperature change within one day. Therefore, it is unknownwhether temperature variability within different exposure days has various association with BP. Thirdly,the research sites in the two studies were in high latitude and temperate areas [11, 12], and it is necessaryto conduct more studies in different climate zones to better understand the spatial heterogeneity of theeffects of temperature variability on BP.
In order to �ll the knowledge gaps mentioned above, we collected data from a series of cross-sectionalsurveys conducted during 2004–2015 in Guangdong Province of China to explore the associations oftemperature variability within different exposure days with BP in a subtropical region. Our �ndings willprovide insights on the impacts of temperature variability on BP and evidence on the clinicalmanagement of hypertension for health professionals in the community health center.
2 Materials And Methods
2.1 Study design and participantsGuangdong province, located in southern China, has a developed economy and a large population. Thepopulation in Guangdong province is about 126 million according to the seventh population census ofChina in 2020 [13]. The area has a subtropical monsoon climate with plenty of sunshine andprecipitation. We collected data from surveys on the risk factors of noncommunicable diseases fromGuangdong province in 2004, 2007, 2010, 2013 and 2015. These surveys conducted by GuangdongProvincial Center for Disease Control and Prevention, and in order to understand the prevalence of majorchronic disease and their risk factors in Guangdong province, China.
Details of those surveys were described elsewhere [14–16]. Similar study designs and methods wereused to all surveys implemented in 2004, 2007, 2010, 2013 and 2015. Strati�ed multistage clustersampling with probability proportional to size was used to obtain research objects. First, 21 survey siteincluding cities or counties in Guangdong province were randomly selected. Second, four districts ortownships from each survey site were chosen; Third, three streets or villages constituted at least 50households from each district or township were chosen; Fourth, one household from each street or villagewas randomly sampled; Finally, one participant aged ≥ 18 years was selected using the Kish grid methodfrom each selected household. When the selected respondent did not agree to participate or there was no
Page 5/17
people aged ≥ 18 years in the selected household, the household would be replaced by another randomlyselected household nearby.
All participants received a face-to-face questionnaire interview by investigators with professionallytrained experience and on-site health examination.
Questionnaires were consisted of demographics, behavioral factors and disease history. Generaldemographics include gender (male and female), age (< 60 and ≧ 60), marital status (never married,married, and others), education level. Behavior factors include smoking, drinking and physical activity.The history of related diseases includes hypertension, diabetes etc.
Health examination main included blood pressure measurement, height and weight measurement, bloodsample test. Blood pressure measured in our surveys by physicians through standardized mercurysphygmomanometers or Omron sphygmomanometers. Before measurement, participants were asked torest at least 5 minutes, then BP was taken on the right arm 2 or 3 times 1 minute apart in a seatedposition. The average of readings was used for analysis. According to 2018 European society ArterialHypertension Guidelines [17, 18], we divided participants into three different blood pressure states.Participants who have been diagnosed with hypertension by physicians before the surveys were de�nedas known hypertensive patients. Newly detected hypertensive patients in the surveys were de�ned as SBPis greater than 140 mmHg and/or DBP was large than 90mmHg but not diagnosed as hypertensionbefore the surveys. Normotensives were de�ned as participants whose SBP was less than 140 mmHgand DBP was less than 90mmHg without hypertension history.
Each participant was provided a detailed introduction and explanation of this study and signed theinformed consent form. Ethics was approved by the Ethics Committee of Guangdong Provincial Centerfor Disease Control and Prevention (Ethical review code:2019025).
2.2 Meteorological data and air pollution dataDaily meteorological data during study periods were obtained from Guangdong meteorological center,including daily maximum temperature, daily minimum temperature, daily mean temperature, relativehumidity, wind speed and precipitation. We connected daily meteorological data to hypertension data byclimate station. If there is no climate station at survey sites, the nearest weather observation station willbe selected. The air pollution data during 2013–2015 were collected from Guangdong EnvironmentalMonitoring Center, including daily PM10, SO2, and O3. We linked air pollution data to hypertension datathrough each individual’s districts/counties. Similarly, if there is no air pollution station at survey site, thenearest observation station will be selected.
2.3 Statistical analysisIn this study, we employed DTR and TV0-n (n = 1–7) to assess the BP effects of temperature variabilitywithin 1 to 8 days. DTR was de�ned as the difference between the daily maximum temperature andminimum temperature within a day. TV0-n was calculated by the standard deviation (SD) of daily
Page 6/17
minimum temperature and daily maximum temperature within exposure days. For example, temperaturevariability within 2 days’ exposure (TV0–1) was calculated as follows: TV0-1 = SD (maximumtemperaturelag0, minimum temperaturelag0, maximum temperaturelag1, minimum temperaturelag1).Therefore, the de�nition of temperature variability could explain both intra-day and inter-day temperaturevariability, as well as the delayed effects of temperature variation [19].
BP was described as mean ± sd, and other basic characteristics of the study sample were presented ascounts or constituent ratios.
A nonlinear relationship between temperature and blood pressure was showed in previous study [20].Therefore, the generalized additive model (GAM) was used in this study to explore the nonlinearrelationship between temperature variability and BP. Since the distribution of BP in the population wasapproximately normal, Gaussian function was selected as the connection function in the model. Cubicspline function and three degrees of freedom (df) was chosen to �t model, and covariates included dailymean temperature, precipitation, relative humidity, wind speed, BMI, age, sex, physical activity, smoking,alcohol use, and resting time. The regression model was described as the following:
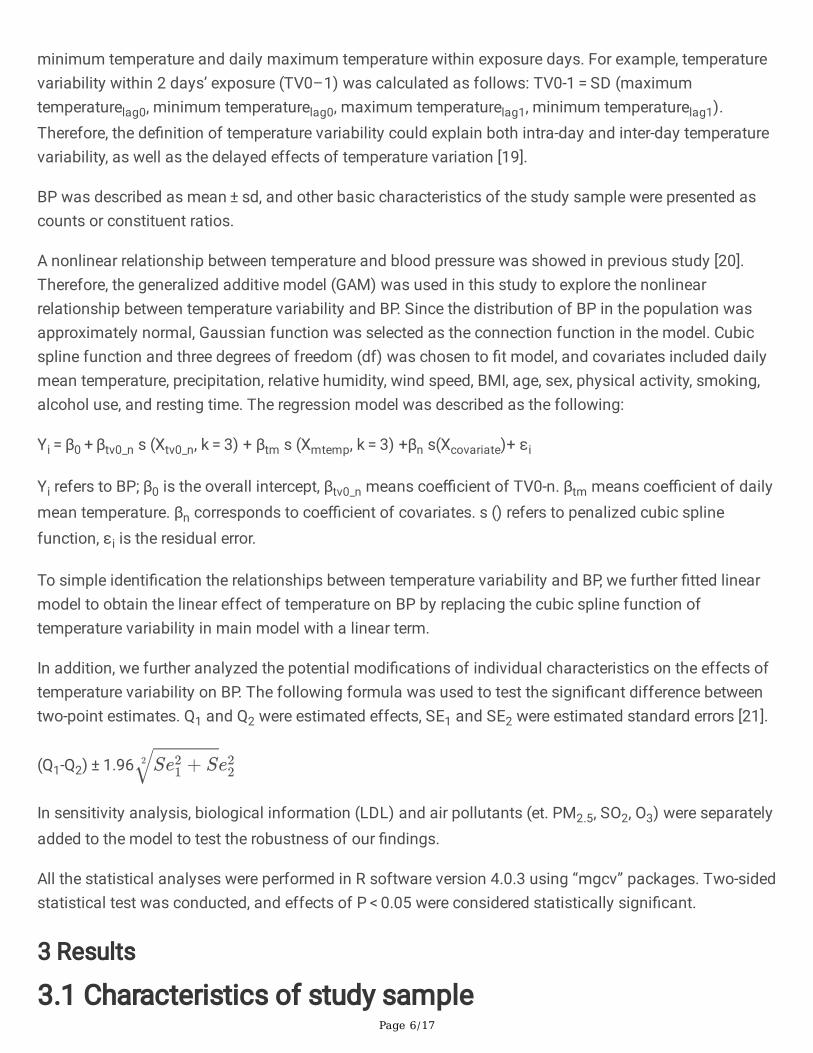
Yi = β0 + βtv0_n s (Xtv0_n, k = 3) + βtm s (Xmtemp, k = 3) +βn s(Xcovariate)+ εi
Yi refers to BP; β0 is the overall intercept, βtv0_n means coe�cient of TV0-n. βtm means coe�cient of dailymean temperature. βn corresponds to coe�cient of covariates. s () refers to penalized cubic splinefunction, εi is the residual error.
To simple identi�cation the relationships between temperature variability and BP, we further �tted linearmodel to obtain the linear effect of temperature on BP by replacing the cubic spline function oftemperature variability in main model with a linear term.
In addition, we further analyzed the potential modi�cations of individual characteristics on the effects oftemperature variability on BP. The following formula was used to test the signi�cant difference betweentwo-point estimates. Q1 and Q2 were estimated effects, SE1 and SE2 were estimated standard errors [21].
(Q1-Q2) ± 1.96
In sensitivity analysis, biological information (LDL) and air pollutants (et. PM2.5, SO2, O3) were separatelyadded to the model to test the robustness of our �ndings.
All the statistical analyses were performed in R software version 4.0.3 using “mgcv” packages. Two-sidedstatistical test was conducted, and effects of P < 0.05 were considered statistically signi�cant.
3 Results
3.1 Characteristics of study sample
2√Se21+ Se2
2
Page 7/17
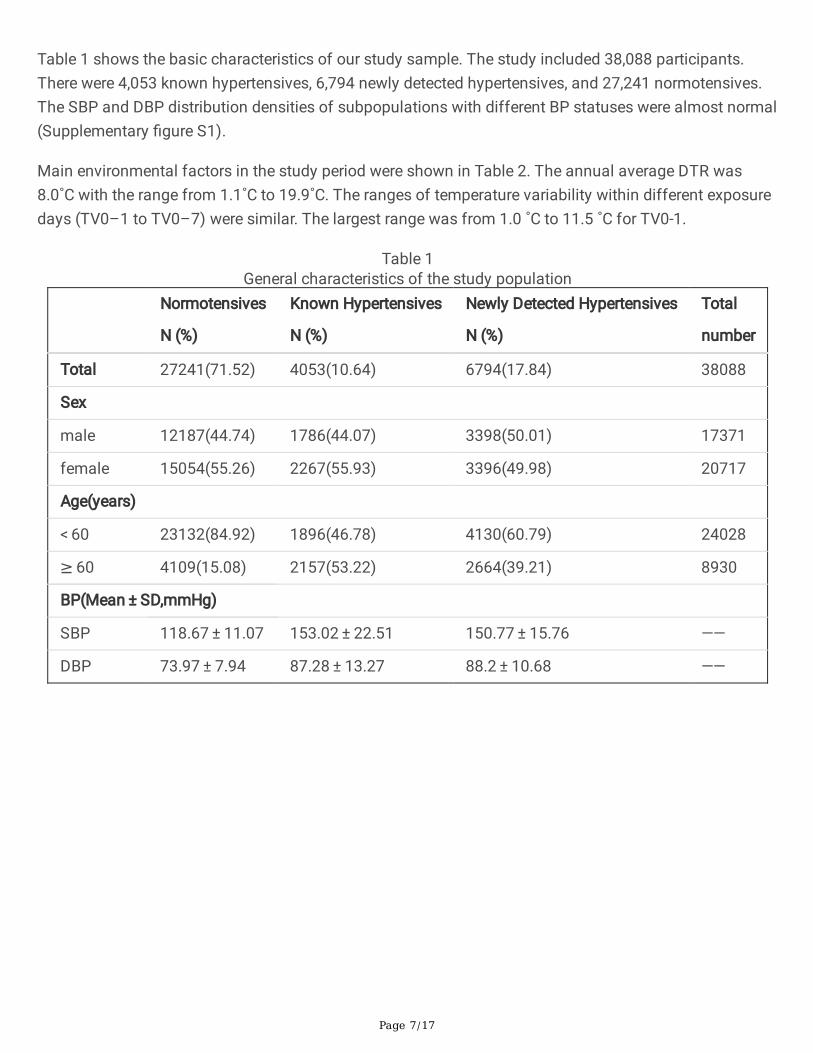
Table 1 shows the basic characteristics of our study sample. The study included 38,088 participants.There were 4,053 known hypertensives, 6,794 newly detected hypertensives, and 27,241 normotensives.The SBP and DBP distribution densities of subpopulations with different BP statuses were almost normal(Supplementary �gure S1).
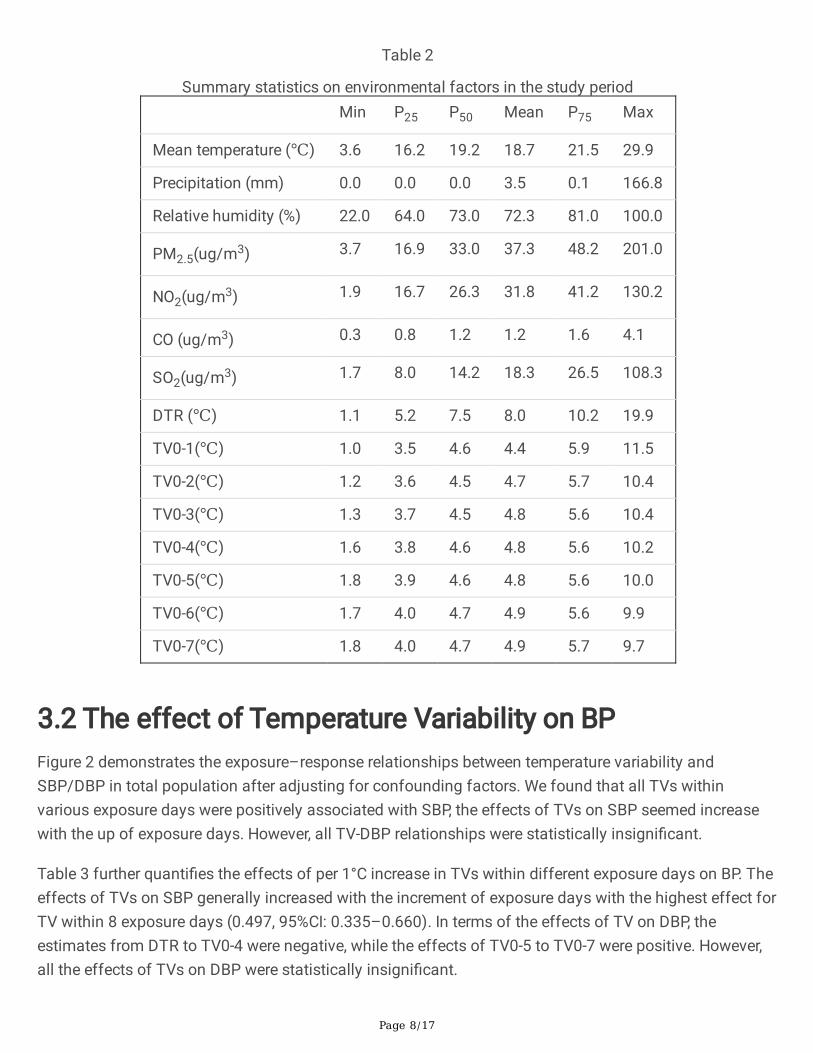
Main environmental factors in the study period were shown in Table 2. The annual average DTR was8.0˚C with the range from 1.1˚C to 19.9˚C. The ranges of temperature variability within different exposuredays (TV0–1 to TV0–7) were similar. The largest range was from 1.0 ˚C to 11.5 ˚C for TV0-1.
Table 1General characteristics of the study population
Normotensives
N (%)
Known Hypertensives
N (%)
Newly Detected Hypertensives
N (%)
Total
number
Total 27241(71.52) 4053(10.64) 6794(17.84) 38088
Sex
male 12187(44.74) 1786(44.07) 3398(50.01) 17371
female 15054(55.26) 2267(55.93) 3396(49.98) 20717
Age(years)
< 60 23132(84.92) 1896(46.78) 4130(60.79) 24028
≥ 60 4109(15.08) 2157(53.22) 2664(39.21) 8930
BP(Mean ± SD,mmHg)
SBP 118.67 ± 11.07 153.02 ± 22.51 150.77 ± 15.76 ——
DBP 73.97 ± 7.94 87.28 ± 13.27 88.2 ± 10.68 ——
Page 8/17
Table 2
Summary statistics on environmental factors in the study period Min P25 P50 Mean P75 Max
Mean temperature (℃) 3.6 16.2 19.2 18.7 21.5 29.9
Precipitation (mm) 0.0 0.0 0.0 3.5 0.1 166.8
Relative humidity (%) 22.0 64.0 73.0 72.3 81.0 100.0
PM2.5(ug/m3) 3.7 16.9 33.0 37.3 48.2 201.0
NO2(ug/m3) 1.9 16.7 26.3 31.8 41.2 130.2
CO (ug/m3) 0.3 0.8 1.2 1.2 1.6 4.1
SO2(ug/m3) 1.7 8.0 14.2 18.3 26.5 108.3
DTR (℃) 1.1 5.2 7.5 8.0 10.2 19.9
TV0-1(℃) 1.0 3.5 4.6 4.4 5.9 11.5
TV0-2(℃) 1.2 3.6 4.5 4.7 5.7 10.4
TV0-3(℃) 1.3 3.7 4.5 4.8 5.6 10.4
TV0-4(℃) 1.6 3.8 4.6 4.8 5.6 10.2
TV0-5(℃) 1.8 3.9 4.6 4.8 5.6 10.0
TV0-6(℃) 1.7 4.0 4.7 4.9 5.6 9.9
TV0-7(℃) 1.8 4.0 4.7 4.9 5.7 9.7
3.2 The effect of Temperature Variability on BPFigure 2 demonstrates the exposure–response relationships between temperature variability andSBP/DBP in total population after adjusting for confounding factors. We found that all TVs withinvarious exposure days were positively associated with SBP, the effects of TVs on SBP seemed increasewith the up of exposure days. However, all TV-DBP relationships were statistically insigni�cant.
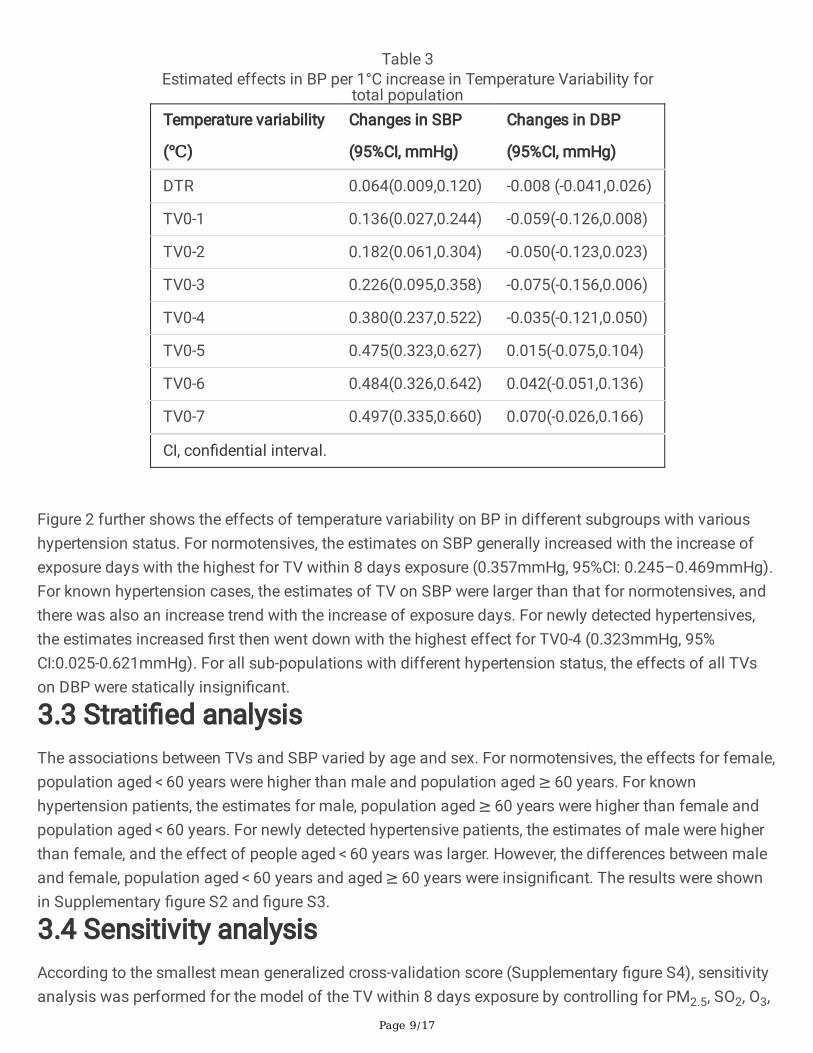
Table 3 further quanti�es the effects of per 1°C increase in TVs within different exposure days on BP. Theeffects of TVs on SBP generally increased with the increment of exposure days with the highest effect forTV within 8 exposure days (0.497, 95%CI: 0.335–0.660). In terms of the effects of TV on DBP, theestimates from DTR to TV0-4 were negative, while the effects of TV0-5 to TV0-7 were positive. However,all the effects of TVs on DBP were statistically insigni�cant.
Page 9/17
Table 3Estimated effects in BP per 1°C increase in Temperature Variability for
total populationTemperature variability
(℃)
Changes in SBP
(95%CI, mmHg)
Changes in DBP
(95%CI, mmHg)
DTR 0.064(0.009,0.120) -0.008 (-0.041,0.026)
TV0-1 0.136(0.027,0.244) -0.059(-0.126,0.008)
TV0-2 0.182(0.061,0.304) -0.050(-0.123,0.023)
TV0-3 0.226(0.095,0.358) -0.075(-0.156,0.006)
TV0-4 0.380(0.237,0.522) -0.035(-0.121,0.050)
TV0-5 0.475(0.323,0.627) 0.015(-0.075,0.104)
TV0-6 0.484(0.326,0.642) 0.042(-0.051,0.136)
TV0-7 0.497(0.335,0.660) 0.070(-0.026,0.166)
CI, con�dential interval.
Figure 2 further shows the effects of temperature variability on BP in different subgroups with varioushypertension status. For normotensives, the estimates on SBP generally increased with the increase ofexposure days with the highest for TV within 8 days exposure (0.357mmHg, 95%CI: 0.245–0.469mmHg).For known hypertension cases, the estimates of TV on SBP were larger than that for normotensives, andthere was also an increase trend with the increase of exposure days. For newly detected hypertensives,the estimates increased �rst then went down with the highest effect for TV0-4 (0.323mmHg, 95%CI:0.025-0.621mmHg). For all sub-populations with different hypertension status, the effects of all TVson DBP were statically insigni�cant.
3.3 Strati�ed analysisThe associations between TVs and SBP varied by age and sex. For normotensives, the effects for female,population aged < 60 years were higher than male and population aged ≥ 60 years. For knownhypertension patients, the estimates for male, population aged ≥ 60 years were higher than female andpopulation aged < 60 years. For newly detected hypertensive patients, the estimates of male were higherthan female, and the effect of people aged < 60 years was larger. However, the differences between maleand female, population aged < 60 years and aged ≥ 60 years were insigni�cant. The results were shownin Supplementary �gure S2 and �gure S3.
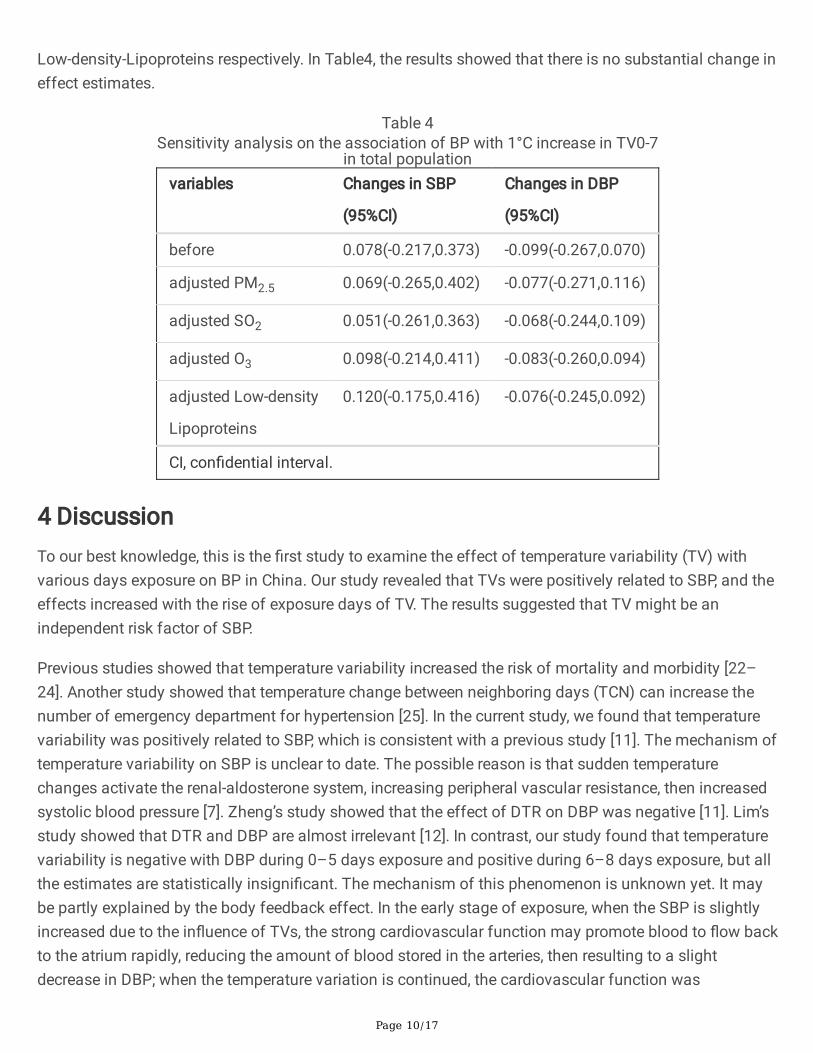
3.4 Sensitivity analysisAccording to the smallest mean generalized cross-validation score (Supplementary �gure S4), sensitivityanalysis was performed for the model of the TV within 8 days exposure by controlling for PM2.5, SO2, O3,
Page 10/17
Low-density-Lipoproteins respectively. In Table4, the results showed that there is no substantial change ineffect estimates.
Table 4Sensitivity analysis on the association of BP with 1°C increase in TV0-7
in total populationvariables Changes in SBP
(95%CI)
Changes in DBP
(95%CI)
before 0.078(-0.217,0.373) -0.099(-0.267,0.070)
adjusted PM2.5 0.069(-0.265,0.402) -0.077(-0.271,0.116)
adjusted SO2 0.051(-0.261,0.363) -0.068(-0.244,0.109)
adjusted O3 0.098(-0.214,0.411) -0.083(-0.260,0.094)
adjusted Low-density
Lipoproteins
0.120(-0.175,0.416) -0.076(-0.245,0.092)
CI, con�dential interval.
4 DiscussionTo our best knowledge, this is the �rst study to examine the effect of temperature variability (TV) withvarious days exposure on BP in China. Our study revealed that TVs were positively related to SBP, and theeffects increased with the rise of exposure days of TV. The results suggested that TV might be anindependent risk factor of SBP.
Previous studies showed that temperature variability increased the risk of mortality and morbidity [22–24]. Another study showed that temperature change between neighboring days (TCN) can increase thenumber of emergency department for hypertension [25]. In the current study, we found that temperaturevariability was positively related to SBP, which is consistent with a previous study [11]. The mechanism oftemperature variability on SBP is unclear to date. The possible reason is that sudden temperaturechanges activate the renal-aldosterone system, increasing peripheral vascular resistance, then increasedsystolic blood pressure [7]. Zheng’s study showed that the effect of DTR on DBP was negative [11]. Lim’sstudy showed that DTR and DBP are almost irrelevant [12]. In contrast, our study found that temperaturevariability is negative with DBP during 0–5 days exposure and positive during 6–8 days exposure, but allthe estimates are statistically insigni�cant. The mechanism of this phenomenon is unknown yet. It maybe partly explained by the body feedback effect. In the early stage of exposure, when the SBP is slightlyincreased due to the in�uence of TVs, the strong cardiovascular function may promote blood to �ow backto the atrium rapidly, reducing the amount of blood stored in the arteries, then resulting to a slightdecrease in DBP; when the temperature variation is continued, the cardiovascular function was
Page 11/17
decreased, and the peripheral resistance increase, which makes the effects are positively [7]. Although theeffects of TVs on DBP were insigni�cant in our study, it is suggested that temperature variability maybe apotential risk of DBP. Therefore, more studies about the associations of TV with DBP are needed in thefuture.
We also found that the effects of temperature variability on SBP increased with the increment ofexposure days of TV. This is similar to the previous studies that temperature variability increased themortality risk with the highest estimate at TV0-7 [26, 27]. The �nding suggested that temperaturevariability may have a cumulative effect on BP. Current early warning system mainly focuses on extremetemperature events [28], and the public underestimate the risk associated with TV. Therefore, in theprevention and clinical management of hypertension in the future, temperature variability should not beneglected.
We further found that the effects of temperature variability on BP among subpopulations with differenthypertension statuses were various. The estimates of TVs on SBP were higher in known hypertensivesthan that in normotensives. The result is similar to Hu et al.’s study [29]. It suggested that people withhypertension were more sensitive to TVs. The mechanism may be that aortic diameter reduce andvascular wall-to-lumen ratio increase in hypertensives, which lead to be more sensitive to temperaturevariation for known hypertensives than for normotensives [30]. In strati�ed analysis, our study did not�nd substantial difference between male and female, or different age populations.
Our �ndings suggested that TV is an important risk for SBP. In terms of etiology, adaptation toenvironmental temperature changes can partly control the onset of hypertension, then reduce theoccurrence of cardiovascular diseases. Therefore, in the prevention, control and treatment ofhypertension, in addition to using antihypertensive drugs and cultivating healthy eating habits, it is alsoimportant to pay attention to TV. For instance, when the temperature rises or falls sharply, the usage of airconditioners or heaters is necessary.
Our study has some strengths. First, this is a large-scale population study. second, it is �rst study toexamine the relationship between TV within different exposure days with BP among different populationsin China. However, there are several limitations for this study. Firstly, the current study was conductedonly in a subtropical region in China, which may be unable to extrapolate our results into another climatezone. Secondly, we used meteorological data from weather station to calculate TV, which inability to fullyre�ect personal exposure levels. Finally, there is difference in the tools for measuring blood pressure.
5 ConclusionIn conclusion, we found a signi�cantly positive association between temperature variability with differentexposure days with SBP, and the known hypertensives were more sensitive than normotensives.Therefore, the public should pay attention to TV in order to better control BP in the clinical managementof hypertensives.
Page 12/17
AbbreviationsBP: blood pressure; SBP: systolic blood pressure; DBP: diastolic blood pressure; CVD: cardiovasculardisease; TV: temperature variability; GAM: generalized additive model; TV0-n: temperature variabilitywithin different exposure days; DTR: diurnal temperature range; TCN: temperature change betweenneighboring days.
DeclarationsAuthors’ contribution
ML performed the statistical analysis and took the lead in drafting the manuscript and interpreting theresults. JL and JH designed the study and performed the statistical analysis. GH, RM, XX, WZ, XLcollected and cleaned the data. JX, TL projected administration. WM projected administration, set up thecollaborative network, designed the study and revised the manuscript.
Ethics approval and consent to participate
Ethics was approved by the Ethics Committee of Guangdong Provincial Center for Disease Control andPrevention (Ethical review code:2019025).
Declaration of competing interest
The authors declare no competing interests.
Consent for publication
Not applicable.
Acknowledgements
We thank all participants for their participation and all the staff of the survey team for their efforts thatmade this study possible. All authors read and approved the �nal manuscript.
Sources of Funding
This work was supported by National Key Research and Development Program of China(2018YFA0606200), the National Natural Science Foundation of China (42075173), Natural ScienceFoundation of Guangdong, China (2019A1515011880, 2016A030313216).
Availability of data and materials
Meteorological data can be accessed from the Guangdong Meteorological Service (http://gd.cma.cn/).
Page 13/17
The hypertension data and R code of this study are available from the corresponding author([email protected]), upon reasonable request.
References1. Diseases GBD, Injuries C: Global burden of 369 diseases and injuries in 204 countries and territories,
1990-2019: a systematic analysis for the Global Burden of Disease Study 2019. Lancet (London,England) 2020, 396(10258):1204-1222.
2. Kjeldsen SE: Hypertension and cardiovascular risk: General aspects. Pharmacological research 2018,129:95-99.
3. Forouzanfar MH, Liu P, Roth GA, Ng M, Biryukov S, Marczak L, Alexander L, Estep K, Hassen Abate K,Akinyemiju TF et al: Global Burden of Hypertension and Systolic Blood Pressure of at Least 110 to115 mm Hg, 1990-2015. Jama 2017, 317(2):165-182.
4. Wang Z, Chen Z, Zhang L, Wang X, Hao G, Zhang Z, Shao L, Tian Y, Dong Y, Zheng C et al: Status ofHypertension in China: Results From the China Hypertension Survey, 2012-2015. Circulation 2018,137(22):2344-2356.
5. Zhou M, Wang H, Zeng X, Yin P, Zhu J, Chen W, Li X, Wang L, Wang L, Liu Y et al: Mortality, morbidity,and risk factors in China and its provinces, 1990-2017: a systematic analysis for the Global Burdenof Disease Study 2017. Lancet (London, England) 2019, 394(10204):1145-1158.
�. Mills KT, Stefanescu A, He J: The global epidemiology of hypertension. Nature reviews Nephrology2020, 16(4):223-237.
7. Oparil S, Acelajado MC, Bakris GL, Berlowitz DR, Cifkova R, Dominiczak AF, Grassi G, Jordan J,Poulter NR, Rodgers A et al: Hypertension. Nature reviews Disease primers 2018, 4:18014.
�. Alexander L, Allen S, Bindoff N, Breon F-M, Church J, Cubasch U, Emori S, Forster P, Friedlingstein P,Gillett N et al: Climate change 2013: The physical science basis, in contribution of Working Group I(WGI) to the Fifth Assessment Report (AR5) of the Intergovernmental Panel on Climate Change(IPCC) 2013.
9. Chen Q, Wang J, Tian J, Tang X, Yu C, Marshall RJ, Chen D, Cao W, Zhan S, Lv J et al: Associationbetween ambient temperature and blood pressure and blood pressure regulators: 1831 hypertensivepatients followed up for three years. PloS one 2013, 8(12):e84522.
10. Park S, Kario K, Chia YC, Turana Y, Chen CH, Buranakitjaroen P, Nailes J, Hoshide S, Siddique S, SisonJ et al: The in�uence of the ambient temperature on blood pressure and how it will affect theepidemiology of hypertension in Asia. Journal of clinical hypertension (Greenwich, Conn) 2020,22(3):438-444.
11. Zheng S, Zhu W, Wang M, Shi Q, Luo Y, Miao Q, Nie Y, Kang F, Mi X, Bai Y: The effect of diurnaltemperature range on blood pressure among 46,609 people in Northwestern China. The Science ofthe total environment 2020, 730:138987.
Page 14/17
12. Lim YH, Kim H, Kim JH, Bae S, Hong YC: Effect of diurnal temperature range on cardiovascularmarkers in the elderly in Seoul, Korea. Int J Biometeorol 2013, 57(4):597-603.
13. Guangdong Provincial Bureau of Statistics, O�ce of the Leading Group for the Seventh NationalCensus of Guangdong Province: Communiqué of the Seventh National Census of GuangdongProvince.Nanfang Daily 2021,44-0001
14. Lao XQ, Zhang YH, Wong MC, Xu YJ, Xu HF, Nie SP, Ma WJ, Thomas GN, Yu IT: The prevalence ofmetabolic syndrome and cardiovascular risk factors in adults in southern China. BMC public health2012, 12:64.
15. Lao XQ, Ma WJ, Sobko T, Zhang YH, Xu YJ, Xu XJ, Yu DM, Nie SP, Cai QM, Wei XL et al: Dramaticescalation in metabolic syndrome and cardiovascular risk in a Chinese population experiencing rapideconomic development. BMC public health 2014, 14:983.
1�. Lao XQ, Xu YJ, Wong MC, Zhang YH, Ma WJ, Xu XJ, Cai QM, Xu HF, Wei XL, Tang JL et al:Hypertension prevalence, awareness, treatment, control and associated factors in a developingsouthern Chinese population: analysis of serial cross-sectional health survey data 2002-2010.American journal of hypertension 2013, 26(11):1335-1345.
17. Bakris G, Ali W, Parati G: ACC/AHA Versus ESC/ESH on Hypertension Guidelines: JACC GuidelineComparison. Journal of the American College of Cardiology 2019, 73(23):3018-3026.
1�. Williams B, Mancia G, Spiering W, Agabiti Rosei E, Azizi M, Burnier M, et al. 2018 ESC/ESH Guidelinesfor the management of arterial hypertension. Eur Heart J 2018, 39:3021–3104
19. Guo Y, Gasparrini A, Armstrong BG, Tawatsupa B, Tobias A, Lavigne E, Coelho MS, Pan X, Kim H,Hashizume M et al: Temperature Variability and Mortality: A Multi-Country Study. Environmentalhealth perspectives 2016, 124(10):1554-1559.
20. Madaniyazi L, Zhou Y, Li S, Williams G, Jaakkola JJ, Liang X, Liu Y, Wu S, Guo Y: OutdoorTemperature, Heart Rate and Blood Pressure in Chinese Adults: Effect Modi�cation by IndividualCharacteristics. Scienti�c reports 2016, 6:21003.
21. Zeka A, Zanobetti A, Schwartz J: Individual-level modi�ers of the effects of particulate matter ondaily mortality. American journal of epidemiology 2006, 163(9):849-859.
22. Hu K, Guo Y, Yang X, Zhong J, Fei F, Chen F, Zhao Q, Zhang Y, Chen G, Chen Q et al: Temperaturevariability and mortality in rural and urban areas in Zhejiang province, China: An application of aspatiotemporal index. The Science of the total environment 2019, 647:1044-1051.
23. Chen S, Siqi C, Jianxiong H, Weiwei G, Maigeng Z, Min Y, Chunliang Z, Yize X, Biao H, Yanjun X et al:Developing a novel indicator to estimate years of life lost attributable to temperature variabilitybetween neighboring days. Environmental Research Letters 2020, 15(10).
24. Fitzmaurice C, Abate D, Abbasi N, Abbastabar H, Abd-Allah F, Abdel-Rahman O, Abdelalim A, Abdoli A,Abdollahpour I, Abdulle ASM et al: Global, Regional, and National Cancer Incidence, Mortality, Yearsof Life Lost, Years Lived With Disability, and Disability-Adjusted Life-Years for 29 Cancer Groups,1990 to 2017: A Systematic Analysis for the Global Burden of Disease Study. JAMA oncology 2019,5(12):1749-1768.
Page 15/17
25. Xingfu Wei SZ, Jun Wang, Yonghong Nie, Minzhen Wang, Xiuying Mi, Xiangyan Meng, Haiyan Li,Yana Bai: Effects of temperature change on outpatient and emergency room visits for hypertensionin Jinchang of Gansu Province: A time-series analysis. Journal of Environmental and OccupationalMedicine 2019, 5:452-458.
2�. Kang Y, Tang H, Jiang L, Wang S, Wang X, Chen Z, Zhang L, Zheng C, Wang Z, Huang G et al: Airtemperature variability and high-sensitivity C reactive protein in a general population of China. TheScience of the total environment 2020, 749:141588.
27. Zhang Y, Xiang Q, Yu C, Bao J, Ho HC, Sun S, Ding Z, Hu K, Zhang L: Mortality risk and burdenassociated with temperature variability in China, United Kingdom and United States: Comparativeanalysis of daily and hourly exposure metrics. Environmental research 2019, 179(Pt A):108771.
2�. McGregor GR, Bessemoulin, P., Ebi, K.L., Menne, B., : Heatwaves and Health: Guidance on Warning-system Development. World Meteorological Organization 2015.
29. Hu J, He G, Luo J, Xu Y, Xu X, Song X, Chen S, Ji G, Chen Z, Jiang Q et al: Temperature-adjustedhypertension prevalence and control rate: a series of cross-sectional studies in Guangdong Province,China. Journal of hypertension 2021, 39(5):911-918.
30. Schiffrin EL: The vascular phenotypes in hypertension: Relation with the natural history ofhypertension. Journal of the American Society of Hypertension : JASH 2007, 1(1):56-67.
Figures
Page 16/17
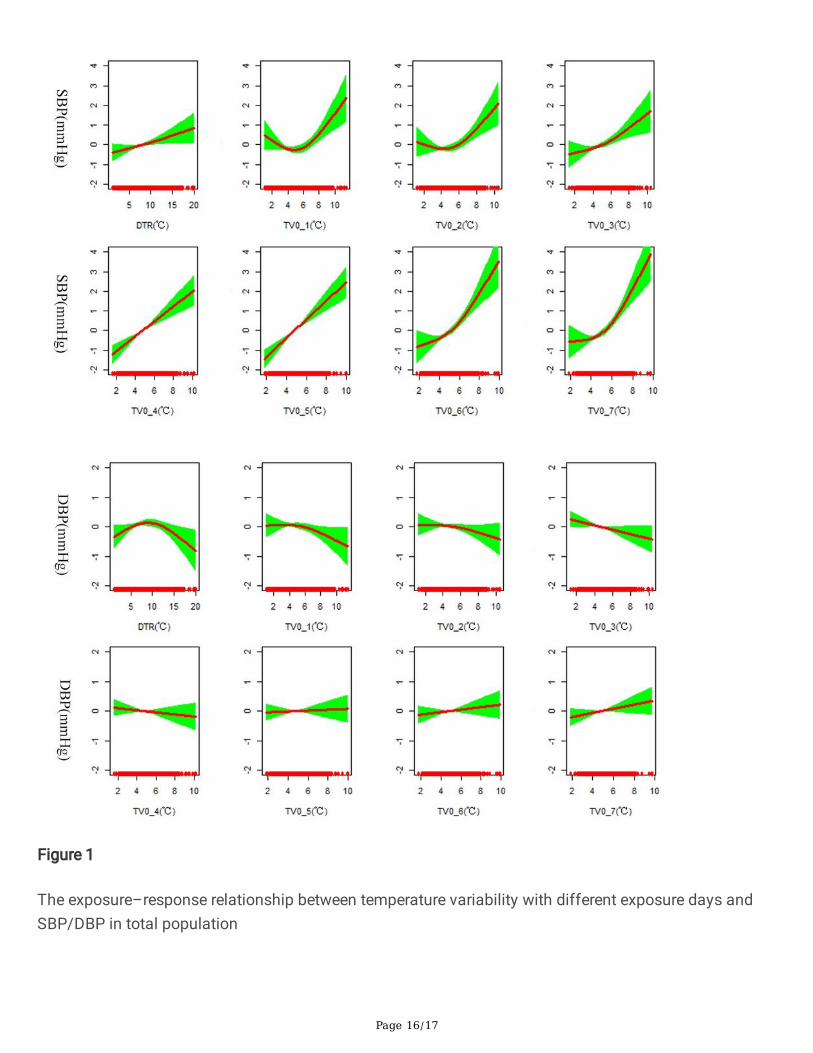
Figure 1
The exposure–response relationship between temperature variability with different exposure days andSBP/DBP in total population
Page 17/17
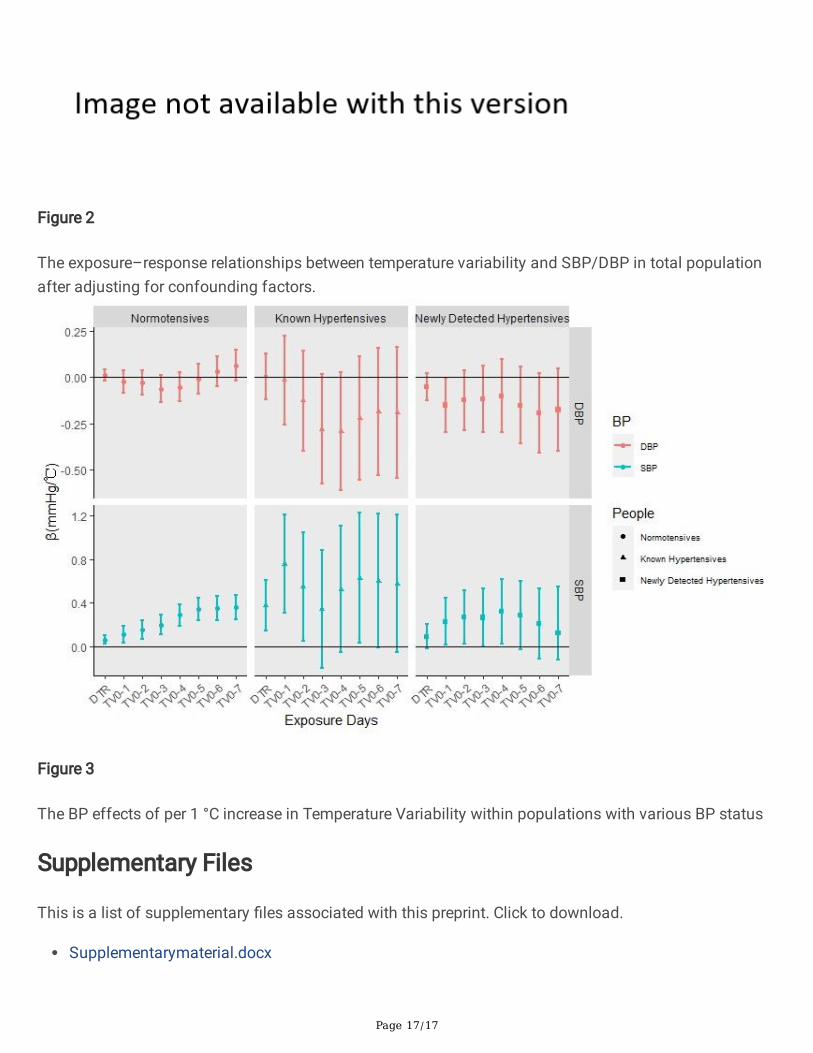
Figure 2
The exposure–response relationships between temperature variability and SBP/DBP in total populationafter adjusting for confounding factors.
Figure 3
The BP effects of per 1 °C increase in Temperature Variability within populations with various BP status
Supplementary Files
This is a list of supplementary �les associated with this preprint. Click to download.
Supplementarymaterial.docx