Crook County Climate and Health Adaptation Plan Final 8-28 ...
40
“A Healthy and Safe CLIMATE AN Crook Co P 1 e Future for the People of Crook ND HEALTH ADAPTATION P ounty Health Department Prineville, Oregon August 2013 k County” PLAN t
Transcript of Crook County Climate and Health Adaptation Plan Final 8-28 ...

“A Healthy and Safe Future for
CLIMATE AND HEALTH A
Crook County Health Department
Prineville, Oregon
1
“A Healthy and Safe Future for the People of Crook County”
CLIMATE AND HEALTH ADAPTATION PLAN
Crook County Health Department
Prineville, Oregon
August 2013
People of Crook County”
PLAN
Crook County Health Department
This project was funded by the Centers for
States and Cities Initiative which was assigned to assist 16 states and 2 cities develop ways to
anticipate health effects by applying climate science, predicting health im
flexible programs. The grant was administered by the Oregon Health Authority and the project
ran from August 2011 through August 2013.
CROOK COUNTY ASSESSM
Assessment, Literature Review, Analysis, Report Writing
• Karen Yeargain, LPN, Preparedness Coordinator
• Max Hamblin, REHS, Environmental Health
• Muriel DeLaVergne
Crook County Health Department
375 NW Beaver St., Ste.100
Prineville, Oregon 97754-1802
Phone: 541-447-5165
Fax 541-447-3093
The Crook County Health Department
our residents (Appendix 1) The CCHD staff are licensed or certified in th
quality care. All services are provided without regard to religion, race, color, national origin, creed, disabil
gender, or ability to pay. We are dedicate
(http://www.co.crook.or.us/Departments/Health
2
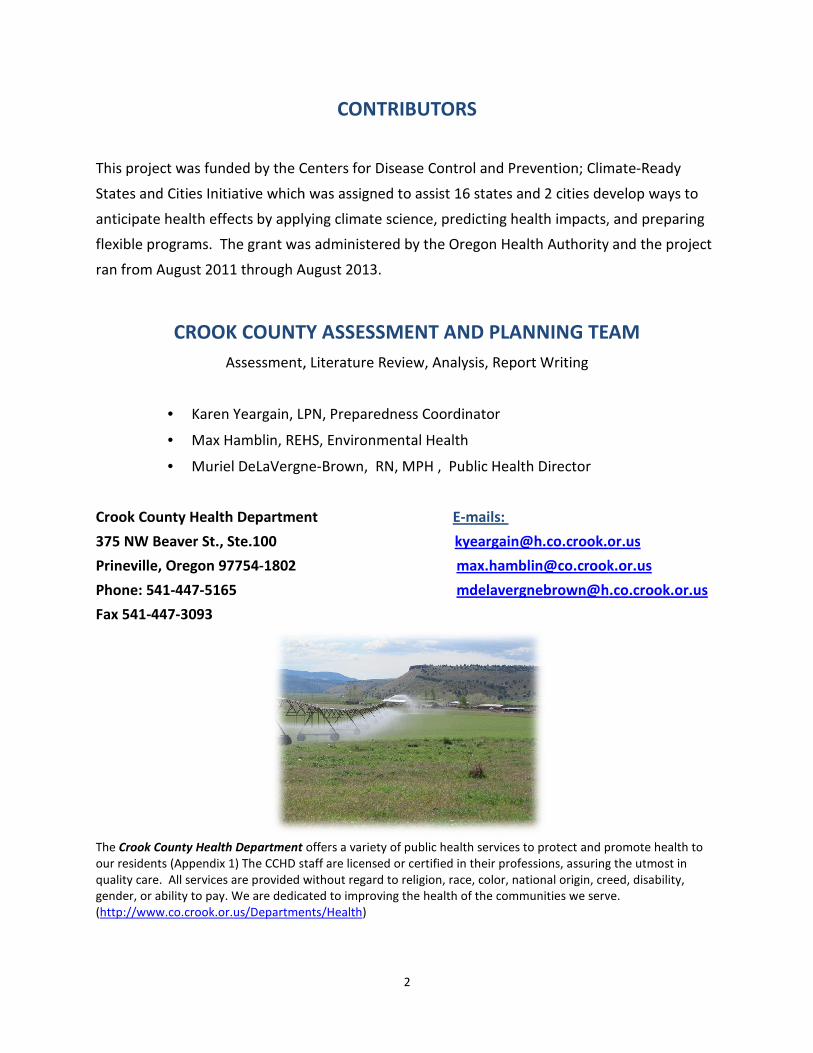
CONTRIBUTORS
project was funded by the Centers for Disease Control and Prevention; Climate
States and Cities Initiative which was assigned to assist 16 states and 2 cities develop ways to
anticipate health effects by applying climate science, predicting health impacts, and preparing
flexible programs. The grant was administered by the Oregon Health Authority and the project
ran from August 2011 through August 2013.
CROOK COUNTY ASSESSMENT AND PLANNING TEA
Assessment, Literature Review, Analysis, Report Writing
Karen Yeargain, LPN, Preparedness Coordinator
Max Hamblin, REHS, Environmental Health
Muriel DeLaVergne-Brown, RN, MPH , Public Health Director
Crook County Health Department E-mails:
Crook County Health Department offers a variety of public health services to protect and promote health to
staff are licensed or certified in their professions, assuring the ut
All services are provided without regard to religion, race, color, national origin, creed, disabil
We are dedicated to improving the health of the communities we serv
http://www.co.crook.or.us/Departments/Health)
Climate-Ready
States and Cities Initiative which was assigned to assist 16 states and 2 cities develop ways to
pacts, and preparing
flexible programs. The grant was administered by the Oregon Health Authority and the project
ENT AND PLANNING TEAM
offers a variety of public health services to protect and promote health to
eir professions, assuring the utmost in
All services are provided without regard to religion, race, color, national origin, creed, disability,
communities we serve.

3
ACKNOWLEDGEMENT TO
COMMUNITY PARTNERS
Crook County Health Department Staff
Jim Hensley, Crook County Sheriff
Dave Dethman, Emergency Manager
Dave Freitag, SAR, ARES, RACES
Steve Dougill, Crook County IT Manager
Eric Bush, Prineville PD
Scott Willard, Lutheran Community Services
Kevin Benton, Oregon Department of Forestry
Phil Stenbeck, Assistant Planning Director Crook County
John Jackson, Singletree Enterprises, LLC
Ken Fahlgren, Crook County Commissioner
Penny Keller, Crook County Road Department
Joie Wright RN, BSN, St. Charles Health System
Matt Smith, Chief, Crook County Fire and Rescue
Dennis Merrill, American Red Cross
Mike Kasberger, Manager, Ochoco Irrigation District
Tim DeBoodt, OSU Extension
Muriel DeLaVergne-Brown, RN, MPH 8-27-13
SIGNATURE DATE
“Climate Change is such a
huge issue that it requires
strong, concerted, consistent
and enduring action by
government.”
Peter Garrett
“The science is compelling.
And the longer we wait, the
harder the problem will be to
solve.”
Senator John Kerry
“The earth is warming at an
alarming rate, we are
running out of fossil fuels,
and it is long past time for us
to take action to correct
these problems.”
Bill Clinton
“The significant problems we
face cannot be solved at the
same level of thinking we
were at when we created
them.”
Albert Einstein

4
TABLE OF CONTENTS
Executive Summary 5
Process Summary and Methodology 8
Crook County Description 10
Background for Climate Health Action Plan 11
Climate Change – What is it? 14
What is Climate Adaptation? 15
How Can Communities Take Action on Climate Adaptation 15
BRACE STEPS - Framework for Approaching the Health Impacts of Climate Change
Brace Step 1: Assessing Local Climate Impacts, Health Outcomes, and
Vulnerable Populations (Oregon, regional, local) 16
Brace Step 2: Health Risk Assessment and Qualifying the Data 20
Brace Step 3: Key Interventions to Local Health Impacts of Climate Change 22
Brace Step 4: Actions Steps for Implementing CCHD Climate and Health:
How Can Crook County Take Action on Climate Change 25
Conclusion 26
References 28
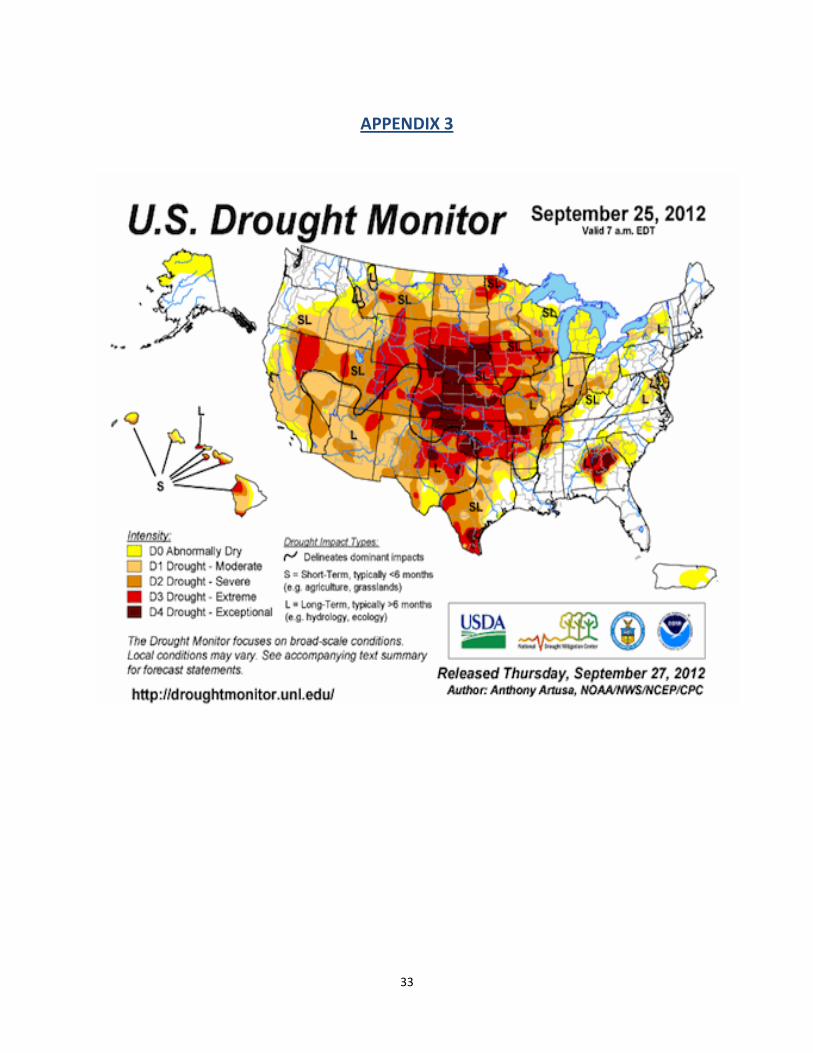
List of Appendices:
# 1 Organizational Chart 31
# 2 Global Surface Mean Temperature Anomalies 32
# 3 US Drought Monitor 33
# 4 Projected Impact of Climate Change on Agricultural Yields 34
# 5 Potential Health Effects of Climate Change 35
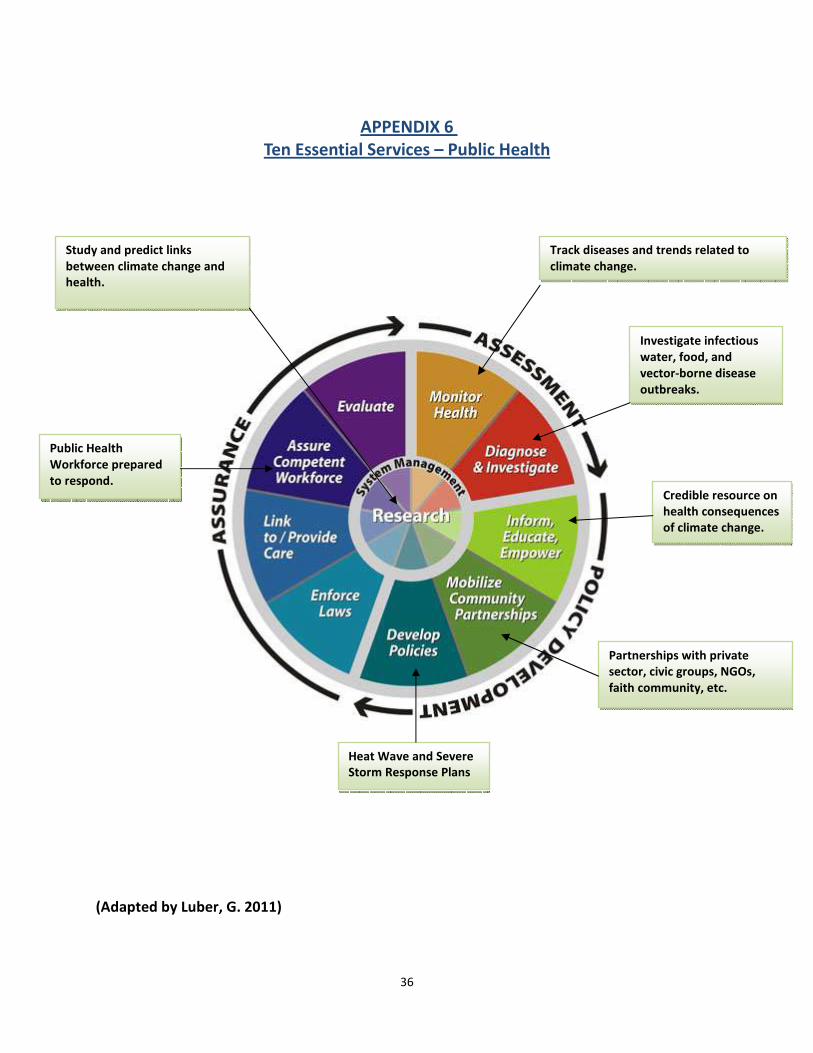
# 6 Ten Essential Services – Links to Climate Change 36
# 7 Health Recommendations for Wildfire Smoke Events 37
# 8 Health Risk Assessment Model – Climate Change Consequences 38
# 9 Hazard Risk Assessment Model – OEM Threat Analysis 39
# 10 Hazard Risk Assessment Model – Public Health Consequences 40

5
EXECUTIVE SUMMARY
The Crook County Health Department Climate and Health Action Plan was funded by the
Centers for Disease Control and Prevention; Climate-Ready States and Cities Initiative which
was assigned to assist 16 states and 2 cities develop ways to anticipate health effects by
applying climate science, predicting health impacts, and preparing flexible programs. The grant
was administered by the Oregon Health Authority and the project ran from August 2011
through August 2013.
Historically, Crook County worked with partners prior to the grant opportunity discussing
climate change mitigation, adaptation, and the implications of climate change on Crook County
as part of the Emergency Management Hazard Vulnerability Plan. In addition, the GeosInstitute
led a group of Central Oregon stakeholders through a process in 2010 exploring how the
communities and natural resources of Crook, Deschutes, and Jefferson Counties may be
affected by projected changes in climate conditions. Recommended actions identified by local
leaders and experts in that process included the following:
• Increase water storage, decrease flood risk, increase groundwater recharge, and
improve surface water quality for restoring wetlands, complex stream channels, and
floodplains.
• Conserve water through improved irrigation water delivery and reduce water-intensive
landscaping.
• Decrease water demand.
• Reduce forest fuels through thinning and controlled burns.
• Protect intact habitats with relatively small populations of invasive species.
• Limit urban wild land and floodplain development and initiate conservation minded
land use planning.
Changing climate conditions stimulate conversation and action; and two primary approaches to
climate change are adaptation which increases the resilience of communities and resources to
near-term climate change impacts, and mitigation which reduces the long-term severity of
climate change by lowering the concentration of greenhouse gases in the atmosphere.
This grant opportunity was meant to enhance the ability of public health to engage in this
important work. The Crook County Climate Health Action Plan developed by Public Health will:
• Develop strategies for public health staff to be a source of leadership, expertise, and
guidance concerning sustainable development in Crook County;
• Raise awareness in Crook County as to the important responsibilities of, and actions
regarding sustainable development and climate change; and
• Help shape local policy promoting sustainable development, with strategies to mitigate
climate change for Crook County.

6
Climate change and health are inextricably linked; changes in the types and incidence of
disease, as well as events such as floods and heat-waves can negatively impact health. Crook
County has a long history of risk analysis and emergency planning related to the incidence and
impacts of disease and climate change is no exception.
Key Local Climate Variables Identified:
• Drought
• Air Quality
• Vector-borne and Communicable Diseases
Health Results in Crook County:
• Decreased water quality and quantity which could contribute to Crook County’s
decrease in crop production, lower lake/stream levels, less animal production (birthing,
milk, meat), and an increase in human related diseases
• Decrease in air quality leading to an increase in aggravation of cardiovascular and
respiratory diseases, asthma, and decreased lung function growth in children
• Shorter lengths of sub-freezing conditions, coupled with longer, wetter spring and fall,
can increase the numbers of mosquitoes and rodents which are vectors of West Nile
Virus, Hanta Virus, and Plague
Recommended Actions:
1. Collaboration and Coordination:
Incorporate the work of the plan into the Emergency Management Groups work-plan
and add partners as needed. The work-group consists of the following members and
meets monthly.
• Emergency Management
• St. Charles Health System
• Crook County Health Department
• City of Prineville
• Crook County Commissioner
• Ochoco Water District
• BLM
• Oregon Department of Forestry
• Environmental Health
• State, County, and City Law Enforcement Agencies
• Crook County Road Department as requested
• DEQ as requested
2. Drought, Water Issues:
• Develop strategies to recognize health effects of drought on the population of
Crook County.

7
• Continue to build relationships with regional partners.
• Assure information targeting at-risk populations for identified health effects
related to drought are culturally appropriate and accessible.
• Continue to gather local information through community assessment and
incorporate into the regional health improvement plan.
• Coordinate efforts through the Emergency Management work-group.
3. Air Quality Issues:
• Monitor Crook County’s air quality results; compare them to past results in order
to monitor trends.
• Strengthen partnerships with the area DEQ to provide information to and
protect the public during acute smoke events using the DEQ Visibility Scale, air
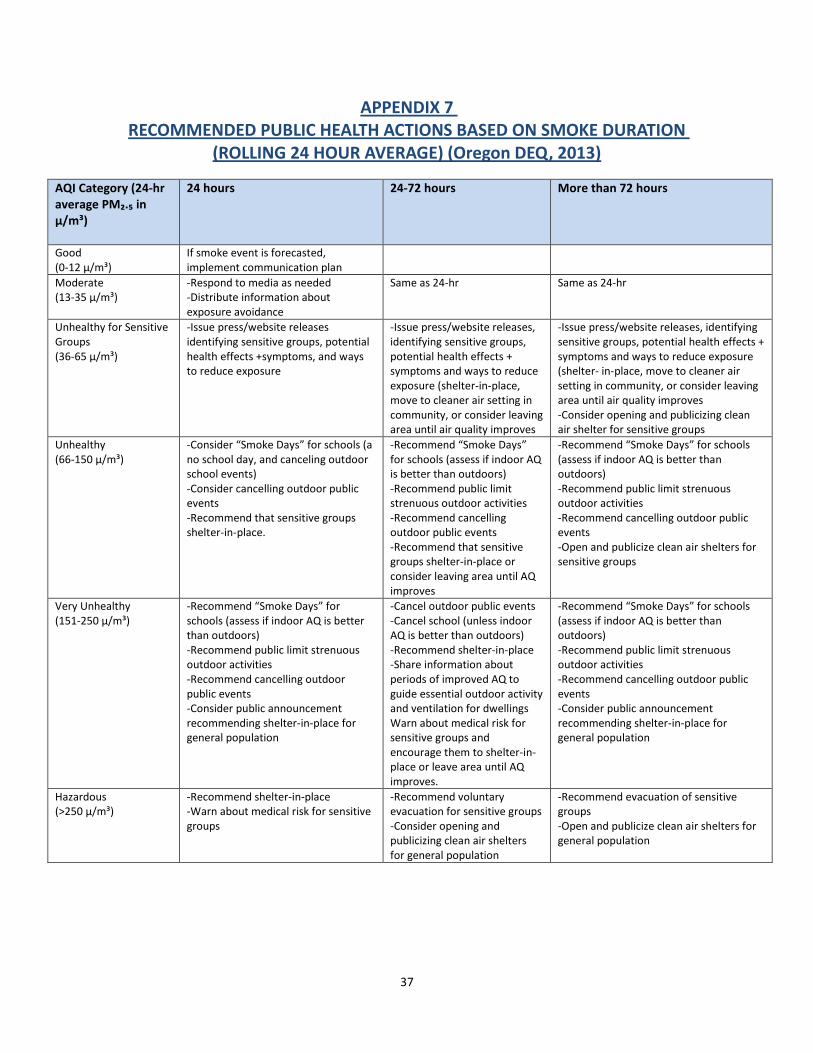
quality index monitoring, and protocol (Appendix 7).
• Monitor asthma trends related to smoke events through the Coordinated Care
Organization claims system.
• Implement a Healthy Homes Initiative to assist in the education of families in
Crook County.
4. Communicable Disease Issues:
• Monitor health trends in Crook County in regard to diseases that are vector-
borne.
• Receive reports and investigate reports of disease cases or clusters per
Communicable Disease protocols, with local climate change risks incorporated
into the assessment of contributing factors.
• Foster and maintain lines of communication with local laboratories, hospitals,
medical clinics, and schools in regard to notifying CCHD about unusual disease
and/or trends, in addition to reportable diseases.
5. Include information on the Crook County Health Department website on the Climate
and Health Plan, and include the air quality information on the regional Healthy
Communities Website.
• Promote community education on effects of climate change on the community.
• Post the climate health action plan on the website, with recommended actions.
• Develop and strengthen relationships with community groups to educate
community members.

8
PROCESS SUMMARY AND METHODOLOGY
The Crook County Health Department staff began work in August of 2011, as part of a CDC
project, to enhance the capability of state and local health agencies to prepare for issues
associated with the projected climate change in our region and county. CCHD worked with the
Oregon Health Authority (OHA) and four other local health departments on the CDC’s Climate-
Ready States and Cities Initiative (www.cdc.gov).
Crook County Health Department’s lead role in the process was grounded in the mission of
protecting the health of our residents. The 10 Essential Public Health Services guide the work
of the department.
1. Monitor health status to identify and solve community health problems.
2. Diagnose and investigate health problems and health hazards in the community.
3. Inform, educate, and empower people about health issues.
4. Mobilize community partnerships and action to identify and solve health problems.
5. Develop policies and plans that support individual and community health efforts.
6. Enforce laws and regulations that protect health and ensure safety.
7. Link people to needed personal health services and assure the provision of health care
when otherwise unavailable.
8. Assure competent public and personal health care workforce.
9. Evaluate effectiveness, accessibility, and quality of personal and population-based
health services.
10. Research for new insights and innovative solutions to health problems.
The Crook County Health Department utilized the CDC’s framework for climate change
planning, the BRACE framework. The model consists of five sequential steps in addressing
climate health issues.
BRACE METHODOLOGY:
1. Forecast local climate impacts and assess health vulnerabilities – Determine with
stakeholders, existing conditions and the potential future impacts of a changing climate
on all members of the community with particular focus on understanding the needs of
vulnerable populations.
• What will the local climate future potentially look like?
• Which factors may result in increased illness, injury, or death?
• Which populations may be vulnerable?
2. Health risk assessment – quantifying disease burden involves prioritizing and focusing
on the scope of issues identified in step 1 and determining what is feasible to assess
and in what way.
• Identify potential data sources about health impacts from Step 1.
• Quantify the additional burden of illness, injury or death (if possible)
• Qualitatively describe the potential health impacts.
3. Identify key and potential interventions to respond to health impacts of climate
change – evaluate the magnitude/burden of health impacts, stakeholder input, and the
9
resources available to recommend interventions
4. Develop and begin implementation of climate and health action (adaptation) plan
utilizing stakeholder feedback to ensure the most effective and practical interventions
and communication plan.
• Develop a written adaptation plan for proposed changes to address health
impacts of climate change.
• Disseminate to stakeholders and the public.
• Evaluate planning process and product.
• Evaluate and expand stakeholders
5. Evaluation (at each step)
The Crook County process was divided into two parts:
• Karen Yeargain implemented the 1st
year process and was joined by D. Max Hamblin,
REHS in year two. CCHD staff’s first step was to understand the BRACE model, and incorporate knowledge of the
region into the process. Initial information was gained through a GEOSInstitute Report which
had been completed the previous year. The report documented climate change issues in the
Central Oregon region. Community partners and stakeholders attended the meeting and
provided local input.
The staff attended monthly meetings of the Crook County Emergency Preparedness Committee
and incorporated community partner input into the process. Members of the Emergency
Preparedness Committee include the following partners: In addition, staff researched the
history of Crook County’s climate through website searches, the Crook County Historical
Museum Archives, local city and county archives, and county health records.
Additional input on air quality included working with community business partners (stove shop)
and the former Environmental Health Specialist who monitors the air station for DEQ in the
county. The staff learned how to read the information for future monitoring. The DEQ
information related to smoke monitoring and response provided valuable data for the plan.
The Communicable Disease data was gathered through a focus group with health department
staff and the gathering of data from the local hospital on asthma/COPD. The staff also
attended monthly meetings with emergency room staff and was able to ask their input for this
process. Data gathering on the hospital side is challenging and future work with the
Coordinated Care Organization will improve this process for the implementation of the Regional
Health Improvement Plan. The School Based Health Center staff was able to provide some
information on the number of students with asthma who had visited the center.
During this timeframe, the CCHD VISTA volunteer, Tobacco Coordinator, and Public Health
Director were working with the City of Prineville on the 20 year transportation plan
incorporating strategies to decrease greenhouses gases, increase bike and walking paths, and
incorporate a new strategy for the East Cascades Transit fixed route bus system in the

10
community.
The staff with community input completed the Worksheets of Public Health Climate Change
Consequences and rated the scores. The staff attended required meetings in Portland,
coordinated efforts with other county partners working on the project and with the data
gathered chose the three top public health risks. Since the staff had assisted the county on
their HVA, it was reassuring to find similar issues with the climate change assessment.
This report is the result of all the input, training, and support provided to begin the process for
a Climate Health Action Plan. This plan is the first step for Crook County; staff will continue to
implement climate change adaptation as a health policy approach, provide training for staff,
and continue work with community stakeholders.
CROOK COUNTY DESCRIPTION
Crook County, Oregon, was established on October 24th, 1882. The early settlers ventured from
the west after word arrived that conditions were abundantly available for growing crops. There
has been steady growth over time to a current population of 20,978. During the years 1990-
2000, there was an increase of 35.94% and the population is projected to double in the next
two decades. Crook County, located in the geographic center of Oregon, encompasses 2,982
square miles. Although considered rural, the county and region have experienced growth over
the past ten years (Oregon Blue Book, 2013).
From 2000 to 2010, Crook County has grown, yet with the loss of jobs, and other issues, the
2010 census population recorded 20,978 (US Census, 2010) individuals living in the county. The
county’s main population center is Prineville, home to approximately 10,000 individuals, while
the remaining individuals live throughout the county in small communities such as Paulina,
Post, Alfalfa, and Powell Butte. Although Prineville is the county’s only incorporated city, the
growth in the county has outpaced the growth within the city. This growth has affected the
Powell Butte area to the west, and the Juniper Canyon area on the south side of town. While
both areas have experienced growth, Powell Butte continues to be an area with higher than
average household incomes and land values. The Juniper Canyon area on the other hand, is a
mixed development with mid ranged housing in one canyon, and lower income, some
substandard housing in the next canyon. These pocket areas have contributed to Juniper
Canyon’s continued identification as one of Crook County’s areas of poverty, as in the rural
Paulina area.
The county is bordered by Deschutes County to the west and south, Jefferson and Wheeler
counties to the north, and Grant and Harney counties to the East. Crook County’s economy
once depended on wood mills, but since their closures, the county job growth is in the service
and trade sectors. Equally, Crook County has a large agricultural (hay, grain, and mint) and beef
production sector. Economically, Crook County’s growth has leveled out this past year and
forest products, agriculture, livestock, construction, and recreation/tourism services (two
reservoirs) represent Crook County’s overall economy. Recently, the county was fortunate to

gain two data centers, including
farms. The unemployment rate
and there are transportation barriers due to the lack of a fixed route bu
to Redmond and Bend.
FIGURE 2: Crook County Populatio
2010 Population <5 years
20,978 1,364
Total % 6.5%
FIGURE 4: Population by Race/Ethnicity: (US Census
The county is predominately white with the following demographics (2010
• 89.4% White
• 0.2% Black or African American
• 7.0% Hispanic or Latino origin
• 1.4% American Indian and Alaska Native
• 0.5% Asian
• 0% Native Hawaiian and Other
• 1.5% Other
BACKGROUND FOR CLIMATE HEALTH ACTION PLA
Crook County is considered cool and dry. Precipitation varies from 14 inches to less than 10
inches per year. The standard explanation for
shadow of the Cascades Mountains. Typically warm, moist, marine air from the Pacific rises
over the Cascades and cools while ascending. It then loses it moisture holding capacity and
thus rains or snows, predominately (although not exclusively) on the west slopes. Due to the
cold, semi-arid climate, and predominately shallow, rocky soils; Central Oregon has a limited
inventory of indigenous plants. On the Cascade slopes and in the Ochoco Mountains in C
County ponderosa pine forests prevail, ranging down to about 3,500 feet. Below 3,500 feet,
the juniper forest takes over through much of Crook County. Where the juniper cannot grow,
sage, bitterbrush, and grasses predominate (Pohl, et.al.
11
two data centers, including Facebook and future business may include
farms. The unemployment rate in Crook County continues to be one of the highest in the state
portation barriers due to the lack of a fixed route bus system from Prineville
rook County Population by Age: (US Census – 2010)
6 - 18 years 19-64 years >65 years
4,783 11,999 2,832
22.8% 57.2% 13.5%
Population by Race/Ethnicity: (US Census – 2010)
The county is predominately white with the following demographics (2010 – US Census):
0.2% Black or African American
7.0% Hispanic or Latino origin
1.4% American Indian and Alaska Native
0% Native Hawaiian and Other Pacific Islanders
TE HEALTH ACTION PLAN
Crook County is considered cool and dry. Precipitation varies from 14 inches to less than 10
inches per year. The standard explanation for the climate is that Central Oregon lies in the rain
shadow of the Cascades Mountains. Typically warm, moist, marine air from the Pacific rises
over the Cascades and cools while ascending. It then loses it moisture holding capacity and
, predominately (although not exclusively) on the west slopes. Due to the
arid climate, and predominately shallow, rocky soils; Central Oregon has a limited
inventory of indigenous plants. On the Cascade slopes and in the Ochoco Mountains in C
County ponderosa pine forests prevail, ranging down to about 3,500 feet. Below 3,500 feet,
the juniper forest takes over through much of Crook County. Where the juniper cannot grow,
rasses predominate (Pohl, et.al. 2002). The annual rain fall measures
White
Latinos
American Indian
Asian
Black
Other
include wind and solar
in Crook County continues to be one of the highest in the state
s system from Prineville
>65 years
13.5%
US Census):
Crook County is considered cool and dry. Precipitation varies from 14 inches to less than 10
the climate is that Central Oregon lies in the rain
shadow of the Cascades Mountains. Typically warm, moist, marine air from the Pacific rises
over the Cascades and cools while ascending. It then loses it moisture holding capacity and
, predominately (although not exclusively) on the west slopes. Due to the
arid climate, and predominately shallow, rocky soils; Central Oregon has a limited
inventory of indigenous plants. On the Cascade slopes and in the Ochoco Mountains in Crook
County ponderosa pine forests prevail, ranging down to about 3,500 feet. Below 3,500 feet,
the juniper forest takes over through much of Crook County. Where the juniper cannot grow,
annual rain fall measures
White
Latinos
American Indian
Asian
Black
Other

12
about 10.5 inches compared to the Pacific Northwest’s 37 to 50 inches per year. The summer
precipitation is very low. Summertime annual temperatures range from 86—100 degrees with
an all-time Oregon high of 114 degrees during one summer.
Climate change is predicted for Central Oregon, including drought. This is a natural and
consistent characteristic of these ecosystems; and consequently climate changes may result in
more frequent and/or extensive periods of drought in the region. Plant and animal species’
geographic ranges and distribution are directly determined by climate conditions such as
temperature and rainfall along with ecosystem factors (topography, slope, aspect, elevation,
soils, geology, surface water and wet environments). All of these factors shape habitat and
species distribution as well as competition, predation and other species interactions in the
region (Barr & Leonard, 2010). The plan focuses on Crook County, yet Central Oregon is a
geographic region which relies on the involvement and work of Deschutes County and Jefferson
County. (See maps on following page)

13
CROOK COUNTY MAPS

CLIMATE CHANGE – WHAT IS IT?
The climate is changing, and it will affect the way we live and where
future. Overwhelming scientific evidence of anthropogenic climate change exists (Solomon et
al., 2007). The United Nations Intergovernmental Panel on Climate Ch
that “warming of the climate system is unequivocal, as is now evident from observations of
increases in global average air and ocean temperatures, widespread melting of snow and ice,
and rising of global average sea level.”
Climate change has serious and far
generations. For example, climate change is already changing the distribution of some
infectious disease vectors and threatens to “increase the number of people suffering from
death, disease and injury from heat
will disproportionately burden the very young and the elderly, the physically and mentally
disabled, the poor and economically disadvantaged and other ma
et al., 2008).
United States temperatures have increased by 1.5°F since 1895 with more than 80% of this
increase since 1980 (NCADAC, 2013).
The consensus amongst the world’s cl
gas emissions, emission levels in the atmosphere could reach 550
before 2050. This could warm the planet to 3
(NOAA, 2011).
Warming is expected to be the strongest in the Arctic and would be associated with the
continuing retreat of glaciers, permafrost, and sea ice. Other
weather events and species extinctions due to shifting temperature changes.
to humans include threat to food security from decreasing crop yields and loss of habitat
(Battisti, 2009).
The current projection is to limit global temperature rises to around 2
levels, and stabilize atmospheric CO
further global warming and avoid the worse impacts of a changing climate. This assumes
achieving cuts in global carbon emissions to 8
14
WHAT IS IT?
The climate is changing, and it will affect the way we live and where we live, now and in the
Overwhelming scientific evidence of anthropogenic climate change exists (Solomon et
The United Nations Intergovernmental Panel on Climate Change (IPCC) concludes
that “warming of the climate system is unequivocal, as is now evident from observations of
increases in global average air and ocean temperatures, widespread melting of snow and ice,
and rising of global average sea level.”
change has serious and far-reaching health implications for present and future
generations. For example, climate change is already changing the distribution of some
infectious disease vectors and threatens to “increase the number of people suffering from
death, disease and injury from heat-waves, floods, storms, fires and droughts.” Climate change
will disproportionately burden the very young and the elderly, the physically and mentally
disabled, the poor and economically disadvantaged and other marginalized communities (Ebi,
United States temperatures have increased by 1.5°F since 1895 with more than 80% of this
increase since 1980 (NCADAC, 2013). The planet has already warmed by almost 1
The consensus amongst the world’s climate scientists is that without action to cut gre
levels in the atmosphere could reach 550-600 parts per million (ppm)
before 2050. This could warm the planet to 3-4°C above pre-Industrial global temperatures
Warming is expected to be the strongest in the Arctic and would be associated with the
continuing retreat of glaciers, permafrost, and sea ice. Other effects may be more extreme
weather events and species extinctions due to shifting temperature changes. Effects significant
to humans include threat to food security from decreasing crop yields and loss of habitat
projection is to limit global temperature rises to around 2°C above pre
ic CO² levels to 450ppm before 2050. This should prevent
further global warming and avoid the worse impacts of a changing climate. This assumes
achieving cuts in global carbon emissions to 85%-95% of current levels by 2040 (UNFCCC, 2011).
we live, now and in the
Overwhelming scientific evidence of anthropogenic climate change exists (Solomon et
ange (IPCC) concludes
that “warming of the climate system is unequivocal, as is now evident from observations of
increases in global average air and ocean temperatures, widespread melting of snow and ice,
reaching health implications for present and future
generations. For example, climate change is already changing the distribution of some
infectious disease vectors and threatens to “increase the number of people suffering from
waves, floods, storms, fires and droughts.” Climate change
will disproportionately burden the very young and the elderly, the physically and mentally
zed communities (Ebi,
United States temperatures have increased by 1.5°F since 1895 with more than 80% of this
The planet has already warmed by almost 1°C since 1900.
imate scientists is that without action to cut greenhouse
600 parts per million (ppm)
Industrial global temperatures
Warming is expected to be the strongest in the Arctic and would be associated with the
effects may be more extreme
Effects significant
to humans include threat to food security from decreasing crop yields and loss of habitat
above pre-industrial
levels to 450ppm before 2050. This should prevent
further global warming and avoid the worse impacts of a changing climate. This assumes
95% of current levels by 2040 (UNFCCC, 2011).

15
WHAT IS CLIMATE ADAPTATION?
There are two primary approaches to climate change – adaptation and mitigation.
• Adaptation increases the resilience of communities and resources to near-term climate
change impacts.
• Mitigation reduces the long-term severity of climate change by lowering the
concentration of greenhouse gases in the atmosphere.
• Adaptation measures can be effective in the near term but will ultimately fail without
effective mitigation.
Climate Adaptation is about adjusting the way we live, build our homes, expand our cities and
towns in Crook County, in order to cope with increasingly unpredictable and changing local
climate conditions. Humans have always adapted to local climate conditions. However, until
now, our global climate has been stable for most of the last 10,000 years. This knowledge is
some of the foundation of climate adaptation solutions emerging today. However; because we
are now facing an increasingly uncertain and volatile climate, we will also have to find new
solutions.
HOW CAN COMMUNITIES TAKE ACTION ON CLIMATE ADAPTATION?
One of the largest challenges to climate adaptation strategy development is the diversity in the
potential impacts, which include effects on public health, economic vitality, ecosystem health,
water supply, and natural hazards. Fortunately, many existing local and regional plans already
address some of these impacts, meaning that communities are likely to have good ideas of the
types of strategies likely to be most effective. The ultimate goal should be for climate
adaptation to be included as one consideration in all local and regional policy-making
processes.
1. Administrative policy, procedures, and initiatives: Strategies that do not require governing
board action can be implemented by a coordinated approach within an agency.
2. General Plan: The community general plan, especially the safety element, is an appropriate
document for goals, objectives, and policies related to climate change adaptation.
3. Local Hazard Mitigation Plan: Adaptation strategies related to wildfire, flooding, drought,
heat and cold emergencies.
4. Climate Action Plan and Land Use Planning.
16
BRACE STEP 1: ASSESSING LOCAL CLIMATE IMPACTS, HEALTH OUTCOMES
AND VULNERABLE POPULATIONS
REGIONAL IMPACTS
CLIMATE CHANGES IN OREGON
The Pacific Northwest is one area that will see drastic climate changes over the next 100 years.
Oregon, with its division of the Cascade Mountain range, will see greater variances in
temperature, precipitation, and increase forest risks. Oregon can see increases in temperatures,
thus leading to changes that would trickle down to the surrounding counties. Over the last half
a century, low to mid-elevation snowpack has been declining in the Cascades (Mote et al. 2005;
Chang et al. 2010) By 2050, snowpack in the Cascades is projected to decline by about half
(Leung et al. 2004; Chang et al. 2010) The loss of snowpack negatively affects Central Oregon in
terms of water supply, crop productivity, forest fire danger, human health conditions, and the
natural ecosystem changes to native species.
CLIMATE PROJECTIONS – LOCAL IMPACT
The November 2011 document, Integrated Strategies for a Vibrant and Sustainable Central
Oregon developed by the USDA Forest Service, along with GEOS Institute and Headwaters
Economics presented the following information to community members from Central Oregon in
Crook County prior to the climate change grant opportunity. This report provides an excellent
resource for Crook County along with Deschutes, and Jefferson County.
Future Climate of Crook, Deschutes, and Jefferson Counties (Barr, GeosInstitute Institute,
2011)
Three global climate models (CSIRO, MIROC, and HADCM) and a vegetation model (MC1) were
used to project future temperature, precipitation, vegetation, runoff, and wildfire in Central
Oregon. All three climate models projected an increase in annual average temperatures
compared to 1961 to 1990 temperatures (2.1 to 4.0° F increase by mid-century and 5.4 to 8.7° F
[2.5 to 4.6° C] by late century). All seasons showed warming, though summer projections show
the greatest degree of warming.
Projections for annual average precipitation ranged from an overall reduction of 7% to an
increase of 22% by late century. All three models agreed that future winters are likely to be
somewhat wetter than past winters (an increase of 4% to 24%). All other seasons had variable
projections for precipitation trends. Increasing temperatures, despite projected increases in
winter precipitation, suggest that snow pack levels will continue to decline in the region.
Vegetation model results indicated a shift in growing conditions. Ponderosa pine dominated
mixed conifer forests are expected to expand at the expense of Douglas fir dominated mixed
17
conifer and subalpine forests. The extent of wildfire is projected to increase by 11 to 16% by
late century.
Crook County’s climate projections fall into three categories:
• Drought
• Air Quality
• Vector and Communicable Diseases
These three areas would impact different vulnerable populations in diverse ways. Crook
County’s vulnerable population mainly includes the elderly, the uninsured, and people with
chronic health conditions, rural residents, and low-income residents. The vulnerability would
mainly be enhanced by their age, income, and lack of health care. In the three categories
below, each population is affected differently.
DROUGHT IN CROOK COUNTY
The effect of drought due to increase climate changes is going to be dramatic in 30 years. From
1900, the average minimum temperature has stayed steady with an average of 70.6 degrees
But due to the earth’s increase of CO² and other gases in the recent years (caused by burning
fossil fuels, forest clearing, and man-made productions), a blanket has formed around the
earth, thus increasing the earth’s rate of temperature. In Crook County, with its high desert
terrain and low average rainfall, this would increase daily temperature more drastically over the
next 10, 20, and 30 years (See graph-pg. 18).
Crook County’s drought trends are strongly affected by the Cascade Mountain Range. While
annual average precipitation in Prineville is about 10.5 inches, Ochoco Ranger Station in the
western foothills of the Ochoco Mountains receives about 17 inches per year (DEQ, 2012). The
relatively low precipitation, particularly at lower elevations adjacent to areas of community
development, strong solar radiation and gusty wind patterns combine to generate a fairly dry
environment.

18
With more frequent drought conditions occurring, this would contribute to Crook County’s
decrease in crop production, lower lake/river/stream levels, less animal production (birthing,
milk, meat), and an increase in human related diseases, due to a scarcity of water.
The effect of drought on Crook County’s vulnerable population would hit everyone, yet the
rural residents/farmers could see a major impact. Not enough water to plant crops and not
being able to provide water for livestock would create shortages. Residents who are uninsured
would be more susceptible to disease and won’t/can’t seek proper medical attention. And in
the future years, Crook County’s existing aquifers would dry up and the city/county would use
up more resources to supply water.
AIR QUALITY IN CROOK COUNTY
Crook County’s air quality is a serious threat to the population, especially during the winter
months. From October through February 2009-2011, the Particulate Matter of 2.5 µg/m3 was
in the moderate level for 162 days (58%) (EPA Air Quality). This was due to the increase of
wood burning stove use, local wildfires, and a small percentage from industry. These effects are
likely to increase in mid-century due to early onset of rain in the fall and longer durations of
rain in the spring months. Besides wood burning stoves use (both burning legal and illegal

19
products (plastics, chemically treated wood), other contributing factors are an increase of
wildfires from more prolonged drought conditions, increased population resulting in increased
traffic pollution, and, as the county’s industry production (saw mills, Les Schwab, chemical
company’s) increases, so does its environmental output.
Air quality affects all vulnerable populations in one way or another, with the elderly and those
with compromised immune systems being impacted the most. With an increase in air pollution,
Crook County will likely see an increase in the need for emergent medical attention, limited
hour’s outdoors, premature mortality, aggravation of cardiovascular and respiratory disease,
development of chronic lung disease, exacerbation of asthma, and decreased lung function
growth in children, and more people relying on government assistance.
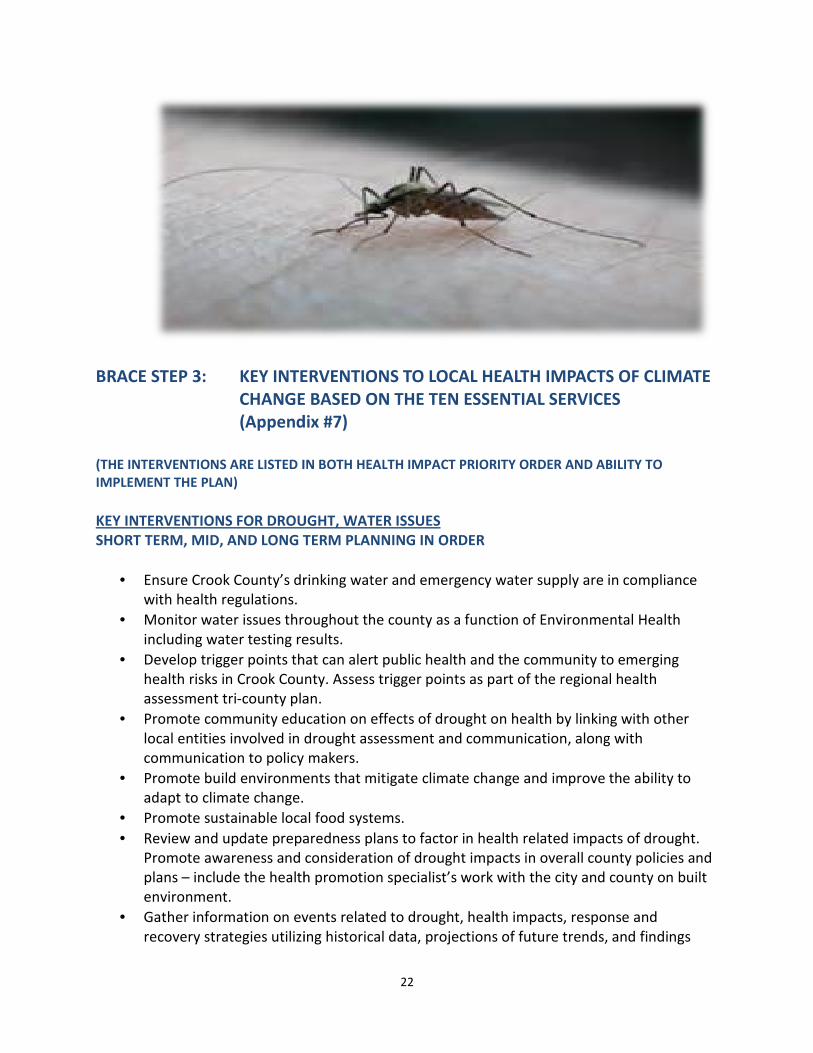
VECTOR-BORNE AND COMMUNICABLE DISEASE IN CROOK COUNTY
Climate change in Crook County by mid-century is predicted to result in warmer minimum
temperatures and more precipitation falling as rain. This trend will result in changes of the
environmental conditions that either inhibit or support the proliferation of specific disease-
causing organisms and vectors, both already established and new to our area.
Shorter length of sub-freezing conditions, coupled with longer, wetter spring and fall, can
increase the numbers of mosquitoes and of rodents which are vectors for West Nile Virus, and
for Hanta Virus and plague respectively. The fleas of rat species, either sage rats or domestic
rats, can and do carry plague in Crook County. In 2011, an outdoor domestic cat became ill, was
diagnosed with plague, was treated and recovered; there were two human exposures but both
were given preventive treatment and did not become sick. In 2012, two people were infected
with plague when they were bitten trying to help one’s domestic cat that was ill after hunting
field rodents (Crook County CD Investigations 2011-2012).
Warmer winter temperatures, with fewer days that dip below freezing, can also change the
plant ecology of Crook County. The fungus, Cryptococcus Gattii, which is found in Douglas Fir
stands in the Northwest and now Southwest Canada, are increasing in areas where tree species
that rely on colder winter temperatures, such as the Ponderosa Pine are being replaced by the
“Doug Fir” that thrives in habitat with fewer sub-freezing days. Human infection with this
fungus can result in hard to treat illness, often resulting in severe disease and death. While our
County has not yet seen evidence of Cryptococcus Gattii, “Species such as Ponderosa pine are
expected to decrease in abundance over the next century, while Douglas fir is likely to increase
across the county” (The Resource Innovation Group, 2011).
Increases in the more common food-borne, water-borne and vector-borne diseases such as,
salmonella, E. coli, campylobacter, and giardiasis are also likely to be seen as the climate
environment changes and alters both the abundance of these organisms and the degree to
which county residents have contact with them.
20
BRACE STEP 2: HEALTH RISK ASSESSMENT AND QUANTIFYING THE DATA
The research for Crook County’s Climate Change Adaption Program came mainly from internet
research, The GeosInstitute Report, Crook County Historical Society, and reviewing medical and
disease outbreaks from Crook County Health Department.
We researched various data on Crook County temperatures from Almanacs, historical city
information, and national weather data. Most of the information on temperatures was
repetitive, yet each source predicted a little different outcome, depending on whose service
was accessed (NOAA, NWA, Crook County Information).
The air quality historical data information was comprised of measurements recorded by the
local DEQ air weather station. This air quality station was erected in 2005 and has given results
on Crook County in various forms of particulate matter, ozone levels, and carbon monoxide.
There was also valuable information from the EPA AirNOW site. With this air quality data, we
interpreted the air quality impacts from various causes; wild fires, chemical/factory burnings,
and the city’s wood burning stoves, and open burns. In Oregon’s 2010 Burden of Asthma in
Oregon Report approximately 10.2 of adults and 9.5% of children have asthma. Oregon has a
higher burden of asthma than the overall United States. In 2009 Oregon was among the top
five states with the highest percentage of adults with asthma. Oregonians without a college
education, with lower income, or are on the Medicaid or the Children’s Health Insurance
Program have higher rates of asthma, and Crook County has one of the higher asthma
hospitalizations per 100 (18 years and older) rates in the state for individual on the Oregon
Health Plan, 2004-2006. (OHA, Public Health, 2010)
Wildfire smoke and field burning smoke also directly affect Crook County during specific times
of the year. In response to wildfire air quality in Oregon and Pole Creek Fire Event in the Sister,
area, a recent protocol was developed; Oregon Wildfire Response Protocol for Severe Smoke
Episodes (DEQ, 2013). This document specifically outlines recommended public health actions
based on smoke duration (Appendix #7).
The Vector Borne and Communicable Disease information came from various sources, including
ORPHEUS (State of Oregon Communicable Database), information from past outbreaks in Crook
County, epidemiology results, and after action reports.
The data was then entered into the BRACE model: Building Resilience against Climate Effects.
This model was developed by Climate and Health Program at the Centers for Disease Control
and Prevention (CDC). It is a framework for agencies to use in developing climate change
adaption plans for their county. (See Appendices 8,9,10)

21
CROOK COUNTY’S HEALTH CONCERNS
• Decreased water quality and quantity which could contribute to Crook County’s
decrease in crop production, lower lake/stream levels, less animal production (birthing,
milk, meat), and an increase in human related diseases.
• Decreased air quality leading to an increase in aggravation of cardiovascular and
respiratory diseases, asthma, and decreased lung function growth in children.
• Shorter lengths of sub-freezing conditions, coupled with longer, wetter Spring and Fall,
can increase the numbers of mosquitoes and rodents which are vectors of West Nile
Virus, Hanta Virus, and Plague
CROOK COUNTY’S TOP ADAPTATIONS BASED ON HEALTH CONCERNS
DROUGHT
1. Develop strategies to recognize health effects of drought on the population of Crook
County.
2. Assure information that targets at-risk populations for identified health effects related
to drought is culturally appropriate and accessible.
3. Review and update preparedness plans to factor in health related impacts of drought.
4. Gather information on events related to drought, health impacts, response and recovery
strategies utilizing historical data, projections of future trends, and findings from other
regions that share similar characteristics to Crook County.
AIR QUALITY
1. Monitor Crook County’s air quality results, comparing them to past results and
predicted future patterns to detect trends in health related illnesses.
2. Implement a community-wide program to provide safe destinations during bad air
quality days.
3. Develop strategies as part of the Central Oregon Health Council to address asthma rates
in Crook County through the coordinated care organization.
COMMUNICABLE DISEASE
1. Monitor health trends in Crook County in regard to diseases that are Vector-Borne, with
an eye to the impacts of climate change as influencing factors.
2. Investigate reports of unusual patterns of communicable & vector-borne disease
and receive and investigate reports of disease cases or clusters as per Communicable
Disease protocols, with local climate change risks incorporated into assessment of
contributing factors.
3. Foster and maintain lines of communication with local laboratories, hospitals, medical
clinics, and schools in regard to notifying CCHD about unusual diseases and/or trends, in
addition to reportable diseases.
BRACE STEP 3: KEY INTERVENTIONS TO
CHANGE
(Appendix
(THE INTERVENTIONS ARE LISTED IN
IMPLEMENT THE PLAN)
KEY INTERVENTIONS FOR DROUGHT, WATER I
SHORT TERM, MID, AND LONG TERM
• Ensure Crook County’s drinking water and emergency
with health regulations.
• Monitor water issues throughout the county as a function of Environmental Health
including water testing results.
• Develop trigger points that can alert public health and the community to emerging
health risks in Crook County.
assessment tri-county plan.
• Promote community education on effects of drought on health by linking with other
local entities involved in drought assessment and communication
communication to policy makers.
• Promote build environments that mitigate climate change and improve the ability to
adapt to climate change.
• Promote sustainable local food systems.
• Review and update preparedness plans to factor in health
Promote awareness and consideration of drought impacts in overall county policies and
plans – include the health promotion specialist’s work with the city
environment.
• Gather information on events related to
recovery strategies utilizing historical data, projections of future trends, and findings
22
KEY INTERVENTIONS TO LOCAL HEALTH IMPACTS
CHANGE BASED ON THE TEN ESSENTIAL SERVICES
ppendix #7)
RE LISTED IN BOTH HEALTH IMPACT PRIORITY ORDER AND AB
FOR DROUGHT, WATER ISSUES
, MID, AND LONG TERM PLANNING IN ORDER
nsure Crook County’s drinking water and emergency water supply are in compliance
Monitor water issues throughout the county as a function of Environmental Health
including water testing results.
Develop trigger points that can alert public health and the community to emerging
lth risks in Crook County. Assess trigger points as part of the regional health
county plan.
Promote community education on effects of drought on health by linking with other
local entities involved in drought assessment and communication, along with
communication to policy makers.
Promote build environments that mitigate climate change and improve the ability to
Promote sustainable local food systems.
Review and update preparedness plans to factor in health related impacts of drought.
Promote awareness and consideration of drought impacts in overall county policies and
include the health promotion specialist’s work with the city and county on built
Gather information on events related to drought, health impacts, response and
recovery strategies utilizing historical data, projections of future trends, and findings
LOCAL HEALTH IMPACTS OF CLIMATE
ENTIAL SERVICES
RIORITY ORDER AND ABILITY TO
water supply are in compliance
Monitor water issues throughout the county as a function of Environmental Health
Develop trigger points that can alert public health and the community to emerging
Assess trigger points as part of the regional health
Promote community education on effects of drought on health by linking with other
long with
Promote build environments that mitigate climate change and improve the ability to
related impacts of drought.
Promote awareness and consideration of drought impacts in overall county policies and
and county on built
drought, health impacts, response and
recovery strategies utilizing historical data, projections of future trends, and findings
23
from other regions that share similar characteristics to Crook County.
• Assure information that targets at-risk populations for identified health effects related
to drought is culturally appropriate and accessible (Resources available for all county
residents including vulnerable populations – Spanish Resources)
• Develop systems to recognize climate change environmental factors that act as triggers
for identified health problems.
• Continue ongoing relationships with the media to provide accurate details.
• Incorporate climate health impacts into staff training so the materials are considered
with health policy in all programming.
• Utilize available community health assessments to identify existing services and gaps in
access of at-risk persons to needed health services.
• Assure training for area medical providers in recognition and management of emerging
health risks that may be related to climate change.
KEY INTERVENTIONS FOR AIR QUALITY
SHORT TERM, MID, AND LONG TERM PLANNING IN ORDER
• Crosswalk Identified vulnerable populations with community health resources and
update the findings through the tri-county community health assessment.
• Use community data of chronic illness trends (asthma, COPD, compromised immune
systems) to compare with trends from past air quality findings; apply historic trends to
future climate forecasts associated with climate change.
• Outreach to Crook County residents about air quality reports through print media and
internet, targeting those with asthma and respiratory-related illnesses.
• Identify health hazards in Crook County and implement a strategy to implement a
system to monitor and control those hazards (wood burning, heavy machinery output,
business environmental accidents).
• Monitor local and federal air quality laws and regulations and monitor open fire burns.
• Identify air quality health hazards in Crook County and work with partners to implement
strategies to monitor and control those hazards (wood burning, heavy machinery
output, business environmental accidents).
• Develop a plan to demonstrate safe air quality programs (healthy homes, wood burning)
for the community and implement incentives for participation.
• Work with local businesses to ensure outdoor employees are protected from harmful air
quality.
• Implement a community-wide program to provide safe destinations during bad air
quality days.
• Identify resources pertaining to air quality and inform the community of these
resources via print media, media, and internet.
• Develop an outreach program with community workers and business’s to improve
partnerships associated with air quality and their effects of long term climate issues.
• Work with local and nearby health facilities to identify trends in admissions for chronic
illnesses impacted by air quality changes.
24
• Utilize the professional federal air quality organizations (EPA, DEQ) and include them
with Crook County’s air quality response plan(s).
• Have an ongoing educational air-quality related health curriculum to better inform the
population and the volunteer workforce.
• Evaluate the program’s effectiveness through after action reports, surveys, and
comparisons of before and after care of the community’s health care organizations.
KEY INTERVENTIONS FOR COMMUNICABLE DISEASE AND VECTOR-BORNE DISEASES
SHORT TERM, MID, AND LONG TERM PLANNING IN ORDER
• Monitor health trends in Crook County in regard to diseases that are Vector-borne, with
an eye to the impacts of climate change as influencing factors.
• Establish and maintain mechanisms for surveillance of climate-related illness and
vulnerabilities.
• Investigate reports of unusual patterns of communicable & vector-borne disease.
• Develop information/educational tools for the public about seasonal disease risks,
including mitigation and prevention measures that can be taken on an individual or
community basis.
• Provide educational pieces (written, presentations, webinar announcements) for the
medical community about communicable disease trends, diagnosis and reporting,
including climate change factors that may impact future trends.
• Disseminate information to the public about communicable and vector-borne diseases
through venues such as Rimrock Health Alliance, “What’s Brewing” and others, as
identified.
• Foster and maintain lines of communication with local laboratories, hospitals, medical
clinics, and schools in regard to notifying CCHD about unusual diseases and/or trends, in
addition to reportable diseases.
• Develop planning and/or policy strategies that incorporate climate change
considerations into all planning activities.
• Ensure familiarity with public health laws related to communicable & infectious diseases
within health department staff through timely trainings and updates.
• Provide information regarding laws/regulations about reportable diseases to medical
community.
• Monitor needs of vulnerable populations through health department community
assessment activities.
• Administer Training Needs Assessment (TNA) to public health workforce, including
volunteers, to determine current knowledge base of health & climate risks related to
communicable and Vector-Borne diseases.
• Research information from a variety of reliable sources on climate trends that impact
Communicable Disease and/or Vector-Borne Disease risks in Crook County.

BRACE STEP 4: ACTION STEPS FOR IMP
HEALTH ACTION PLAN
LOCAL COMMUNITY ACTION PLAN
COLLABORATION
A prepared and locally networked community plays a big role in minimizing the impacts from a
changing climate. Current areas for action could be heat stress management, local food
production, cold events, and responding wisely to emergencies such as flooding and wildfire.
Objective: The key objective is to work with the local communities to dev
community based climate resilience action plan.
Solutions: Work for community awareness and education, early identification systems,
encouraging the development of neighborhood emergency response
know what to do in an emergency.
ACTIONS
1. Update county’s response plans, either as addendums or in t
emergent emergency events an
collaboration with key stakeholders.
2. Develop strategies for increasing community awareness and action during emergency
events—this includes scenario mappin
emergency scenarios.
3. Develop information and early notification/prevention strategy for key pests, diseases
and health risks that are likely to be seasonal suc
4. Gain sufficient stakeholder engagement to develop relevant solutions.
5. Continue participation on the vulnerable population tri
CHALLENGES AHEAD
• As science keeps moving in the same direction, all signs sugg
25
ACTION STEPS FOR IMPLEMENTING CCHD CLIMA
HEALTH ACTION PLAN
ON PLAN – CONTINUED COMMUNITY COMMUNICATION AND
A prepared and locally networked community plays a big role in minimizing the impacts from a
changing climate. Current areas for action could be heat stress management, local food
ents, and responding wisely to emergencies such as flooding and wildfire.
Objective: The key objective is to work with the local communities to develop a local
community based climate resilience action plan.
community awareness and education, early identification systems,
the development of neighborhood emergency response plan so communities
now what to do in an emergency.
Update county’s response plans, either as addendums or in their next review cycle, to
emergency events and pests/diseases related to climate change
collaboration with key stakeholders.
Develop strategies for increasing community awareness and action during emergency
this includes scenario mapping and assessment of vulnerable communities to
Develop information and early notification/prevention strategy for key pests, diseases
and health risks that are likely to be seasonal such as mosquitoes and rodents.
older engagement to develop relevant solutions.
Continue participation on the vulnerable population tri-county group.
As science keeps moving in the same direction, all signs suggest that climate change is
LEMENTING CCHD CLIMATE AND
COMMUNICATION AND
A prepared and locally networked community plays a big role in minimizing the impacts from a
changing climate. Current areas for action could be heat stress management, local food
ents, and responding wisely to emergencies such as flooding and wildfire.
elop a local
community awareness and education, early identification systems, and
so communities
heir next review cycle, to
related to climate change in
Develop strategies for increasing community awareness and action during emergency
g and assessment of vulnerable communities to
Develop information and early notification/prevention strategy for key pests, diseases
rodents.
that climate change is
26
accelerating—we are planning for an uncertain future.
• Integrated Action—Plan with partners and key stakeholders.
• State and National policies may not be updated on a timely basis.
• Resourcing Adaption Actions—Innovation solutions.
• Adapt to change.
CONCLUSION
Crook County’s approach to climate change will involve community involvement in determining
Crook County climate risk variables and how they may affect the health of the public, now and
in the near and distant future. One main concern was the lack of any organized community
effort around climate change issues. A goal for Crook County is to bring diverse groups together
to share their ideas on climate change effects and the adaptation efforts currently underway
and planned for the future.
Crook County can take action is through quarterly meetings with these diverse groups (i.e.
Agricultural, Public and Environmental Health, Medical Provider Groups, Vulnerable Population
Representatives). In these meetings, the discussion of health related topics due to the impact
from climate change would be the primary focus. In addition, since the Central Oregon area is
interconnected, working as a tri-county effort would garner more participation. One of the
biggest actions a community needs to combat Climate Change is to get involved. Whether it be
attending meetings, asking questions, or volunteering their time, involvement is the key to
Climate Change.
It will take decades to manifest, document, analyze and respond to climate change impacts in
the Central Oregon area, yet it is imperative to develop strategies that benefits across many
sectors. Communication between state and federal agencies, public health, planning and the
farmer, ranchers, and citizens of Crook Count is vital to make a difference for the future.
Crook County has developed ideas to combat the effects of health on our county by using the
BRACE model to develop a Health Risk Assessment, an OEM Threat Analysis, and a Hazardous
Risk Assessment (see below). By focusing on three conditions with the highest public risk; Air
Quality, Drought, and Communicable Disease, we developed steps to better improve the overall
health of our present community, as well as our future population. The final guiding principles
for a Climate Health Action Plan include:
• Increase public awareness and understanding of climate change impacts on human
health and the need to adapt to these changes.
• Ensure health promotion and protection for vulnerable populations and communities.
• Promote healthy and resilient populations, communities, and environments.
• Encourage adaptation strategies that maximize health benefits, minimize unintended
consequences, and mitigate climate change.
• Ensure the need for additional research and resources to implement the Climate Health
Action Plan.
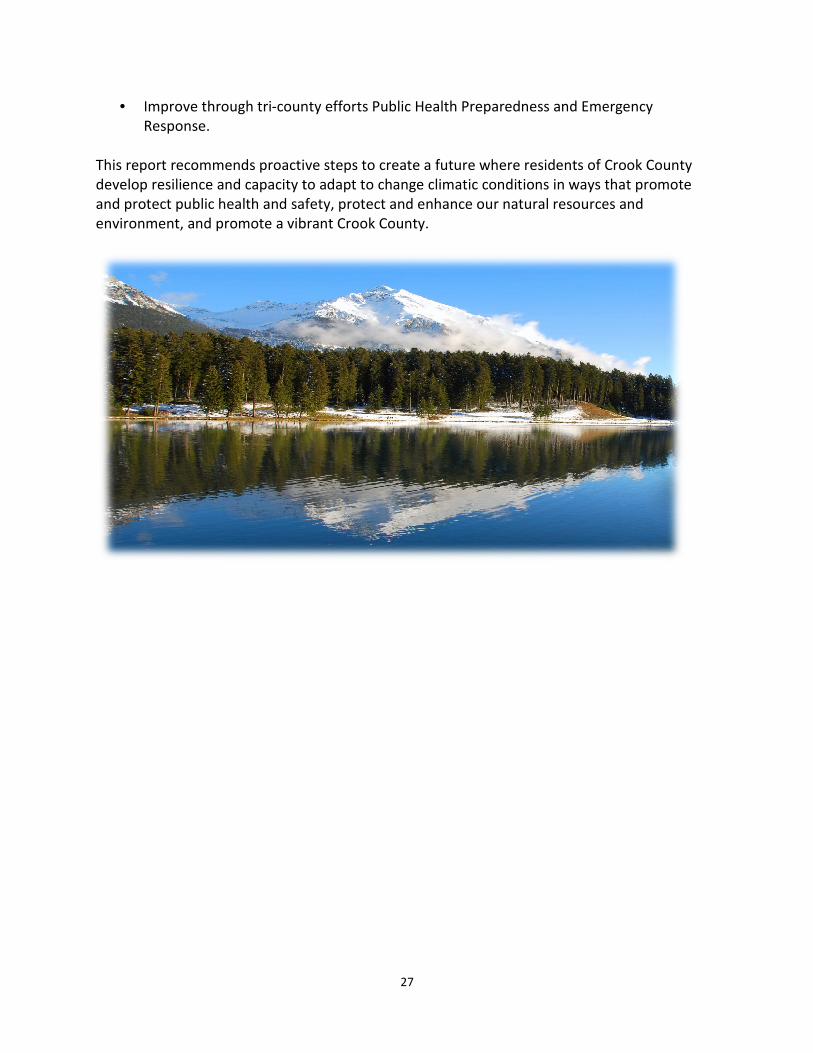
• Improve through tri-county efforts P
Response.
This report recommends proactive steps to create a future where residents of Crook County
develop resilience and capacity to adapt to change climatic conditions in ways tha
and protect public health and safety, protect and enhance our natural resources and
environment, and promote a vibrant Crook County.
27
county efforts Public Health Preparedness and Emergency
recommends proactive steps to create a future where residents of Crook County
develop resilience and capacity to adapt to change climatic conditions in ways tha
and protect public health and safety, protect and enhance our natural resources and
environment, and promote a vibrant Crook County.
Health Preparedness and Emergency
recommends proactive steps to create a future where residents of Crook County
develop resilience and capacity to adapt to change climatic conditions in ways that promote
and protect public health and safety, protect and enhance our natural resources and
28
REFERENCES
American Public Health Association (2011). Climate Change: Mastering the Public Health Role.
Retrieved August 19, 2013. Available from http://www.apha.org/advocacy/report.
Analysis of the Effects of Global Change on Human Health and Welfare and Human Systems.
Ed. J.L. Gamble. Washington, D.C.: Environmental Protection Agency. 2-22 to 2-26.
Barr, B.R., Journet, Leonard, J. (2010). Projected future conditions and sector background
information for the Deschutes River Basin of Central Oregon. Geos Institute, Ashland,
OR.
Barr, B.R. (2011). Integrated Strategies for a Vibrant and Sustainable Central Oregon. Geos
Institute, ClimateWise;
www.geosinstitute.org/images/stories/pdfs/Publications/ClimateWise/DeshctesClimate
Wise Final.pdf
Battisti, D., Naylor (2009). "Historical warnings of future food insecurity with unprecedented
seasonal heat". Science 323 (5911): 240–4. doi:10.1126/science.1164363.
PMID 19131626. Retrieved August 21, 2013.
Chang, H., J. Jones, Gannett, M., Tullos, D., Moradkhani, H., Vaché, K., Parandvash, H., Shandas,
V., Nolin, A., Fountain, A., Johnson, S., Jung, I-W., House-Peters, L., Steel, M., and
Copeland, B. (2010). “Climate Change and Freshwater Resources in Oregon.” In Oregon
Climate Change Research Institute: Oregon Climate Assessment Report, edited by K.D.
Dello and P.W. Mote.
Confalonieri, U., Menne, B., Akhtar, R., Ebi, K.L., Kovats, R.S., Revich, B., Woodward, A. (2007).
Human Health. Climate Change 2007: Impacts, Adaptation and Vulnerability.
Contribution of Working Group II to the Fourth Assessment Report of the
Intergovernmental Panel on climate Change. Cambridge University Press.
Ebi, K.L., Balbus, J., Kinney, P.L., Lipp, E., Mills, D., O’Neill, M.S., Wilson, M. (2008). Effects of
Global Change on Human Health. Synthesis and Assessment Product 4-6.
Environmental Defense Fund. Are We Ready? Preparing for the Public Health Challenges of
Climate Change. 2008.
Garland, R. (2009). The Burden of Asthma in Oregon: 2010. Office of Disease Prevention and
Epidemiology. Public Health Division, OHA.
http://www.cdc.gov/climateandhealth/climate_ready.htm
http://www.census.gov/2010census/

29
http://www.deq.state.or.us/aq/burning/wildfires/visibility.htm
http://ncadac.globalchange.gov
http://bluebook.state.or.us/
IPCC 2007: Contribution of Working Group 1 to the Fourth Assessment Report of the
Intergovernmental Panel on Climate Change. Solomon, S., Qin, D., Manning, M., Chen,
Z., Marquis, M., Averyt,K.B., Tignor, M., Miller H.L., Cambridge University Press,
Cambridge, UK and New York, NY, USA.
Leung, L.R., Y. Qian, X. Bian, W. Washing, J. Han, J.O. Roads (2004), Mid-century ensemble
regional climate change scenarios for the west United States., Climatic Change, 62, 75-
113.
Luber, G. (2011). A Human Health Perspective on Climate Change – Implications for Response
and Adaptation in the Public Health Sector, National Center for Environmental Health,
CDC.
Meehl et al., Chap. 10: Global Climate Projections, Sec. 10.ES: Mean Temperature, in IPCC AR4
WG1 2007.
Mote, P.W, Hamlet, A.F., Clark,M.P., Lettenmaier, D.P.(2005). “Declining Mountain Snowpack in
Western North America.” BAMS, January 2005, doi: 10.1175/BAMS-86-1-39.
NOAA National Climatic Data Center, State of the Climate: Global Analysis for Annual 2011.
NOAA. 19 January 2012. Retrieved 31 January 2012.
Pohl, K.A., Hadley, K.S., Arabus, K.B., 2002. A 545-year Climate History for Central Oregon.
Physical Geography 23(3): 302-320.
Smith, T.M., Reynolds, R.W., A global merged land-air-sea surface temperature reconstruction
based on historical observations (1880-1997). J. Climate. 2005;18(12):2021-2026.
Solomon, S., Qin D., Manning M., Chen, Z., Marquis, M., Averyt, K.B., Tignor, M., Miller, H.L.,
Eds. Intergovernmental Panel on Climate Change. (2007). Climate Change 2007: The
Physical Science Basis. Contribution of Working Group I to the Fourth Assessment
Report of the Intergovernmental Panel on Climate Change. Cambridge University Press:
Cambridge, UK.
The Resource Innovation Group. “Public Health and Climate Change – A Guide for Increasing
the Capacity of Local Public Health Departments (2011)

30
United Nations Framework Convention on Climate Change (UNFCCC) (2011). Conference of the
Parties – Sixteenth Session: Decision 1/CP.16: The Cancun Agreements: Outcome of the
work of the Ad Hoc Working Group on Long-term Cooperative Action under the
Convention.

CROOK COUNTY ORGANIZ
Administration
Dianne Koops,
Office Manager
Wendy McCoy, Billing/Lead Clerk II
MCH Services
Barbara Higgins,
RN MCH
Supervisor
Babies First,
CaCoon, HS,
MCM, NFP
Paula Yvonne, BSN
Glenda Powell, FSW
Renee Sheehy, FSW, WIC
Jennifer Chaney, BSS WIC Supervisor, PHAB/MM/Quality Coordinator
Emma Reynolds, WIC
Ruby Ruiz, WIC Clerk
Health Officer
Laura Gratton, D.O.
Dr. Maggie King, MD Dep.
31
APPENDIX 1
CROOK COUNTY ORGANIZATIONAL CHART
COUNTY COURT
Judge Mike McCabe
Commissioner Ken Fahlgren - Health
Commissioner Seth Crawford
WIC Services
Jennifer Chaney, BSS WIC Supervisor, PHAB/MM/Quality Coordinator
Emma Reynolds, WIC Certifier, OMC,
MFMC
Ruby Ruiz, WIC Clerk Interpreter
RDs
RanDee Anshutz
Clinical Services
Becky Lundgren, RN
Family Planning/HIV/STD
Coordinator
Mindy Stomner, RN Immunization Coor.
Claudia Wiseman, NP
On-Call Nursing Staff
Suzie Fisher, LPN
Health Promotion
Healthy Communities
Kris Williams, Tobacco
Prevention Coordinator
Carly Rachocki,
MPHHealth
Promotion
Josephina Riggs Cuidate
Wendy Perrin, RN, BSN
School Based Health Center
HEALTH DEPARTMENT
DIRECTOR
Muriel DeLaVergne-
Brown, RN, MPH
Health Officer
Laura Gratton, D.O.
Dr. Maggie King, MD Dep.
Health Promotion
Healthy Communities
Kris Williams, Tobacco
Prevention Coordinator
Carly Rachocki,
MPHHealth
Promotion
Josephina Riggs Cuidate
Wendy Perrin, RN, BSN
School Based Health Center
Communicable Disease
Public Health Preparedness
Environmental
Health
Climate Change
Karen Yeargain, LPN
Max Hamblin, REHS
Julie Lancaster, Tech

32
APPENDIX 2
33
APPENDIX 3

34
APPENDIX 4

35
APPENDIX 5
POTENTIAL HEALTH EFFECTS OF CLIMATE CHANGE
CLIMATE CHANGE
-Temperature Rise
-Sea Level Rise
-Hydrologic Extremes
Heat Heat Stress, Cardiovascular
Failure
Severe Weather Injuries, Fatalities
Air Pollution Asthma, Cardiovascular
Disease
Allergies Respiratory Allergies, Poison
Ivy
Vector-Borne Diseases Malaria, Dengue,
Encephalitis, Hantavirus, Rift
Valley Fever
Water-Borne Diseases Cholera, Crytosporidiosis,
Campylobacter,
Leptospirosis
Water and Food Supply Malnutrition, Diarrhea,
Harmful Algal Bloom
Mental Health Anxiety, Despair,
Depression, Post-Traumatic
Stress
Environmental Refugees Forced Migration, Civil
Conflict
Adapted from J. Patz
36
APPENDIX 6
Ten Essential Services – Public Health
(Adapted by Luber, G. 2011)
Track diseases and trends related to
climate change.
Investigate infectious
water, food, and
vector-borne disease
outbreaks.
Credible resource on
health consequences
of climate change.
Partnerships with private
sector, civic groups, NGOs,
faith community, etc.
Study and predict links
between climate change and
health.
Public Health
Workforce prepared
to respond.
Heat Wave and Severe
Storm Response Plans
37
APPENDIX 7
RECOMMENDED PUBLIC HEALTH ACTIONS BASED ON SMOKE DURATION
(ROLLING 24 HOUR AVERAGE) (Oregon DEQ, 2013)
AQI Category (24-hr
average PM₂.₅ in
µ/m³)
24 hours 24-72 hours More than 72 hours
Good
(0-12 µ/m³)
If smoke event is forecasted,
implement communication plan
Moderate
(13-35 µ/m³)
-Respond to media as needed
-Distribute information about
exposure avoidance
Same as 24-hr Same as 24-hr
Unhealthy for Sensitive
Groups
(36-65 µ/m³)
-Issue press/website releases
identifying sensitive groups, potential
health effects +symptoms, and ways
to reduce exposure
-Issue press/website releases,
identifying sensitive groups,
potential health effects +
symptoms and ways to reduce
exposure (shelter-in-place,
move to cleaner air setting in
community, or consider leaving
area until air quality improves
-Issue press/website releases, identifying
sensitive groups, potential health effects +
symptoms and ways to reduce exposure
(shelter- in-place, move to cleaner air
setting in community, or consider leaving
area until air quality improves
-Consider opening and publicizing clean
air shelter for sensitive groups
Unhealthy
(66-150 µ/m³)
-Consider “Smoke Days” for schools (a
no school day, and canceling outdoor
school events)
-Consider cancelling outdoor public
events
-Recommend that sensitive groups
shelter-in-place.
-Recommend “Smoke Days”
for schools (assess if indoor AQ
is better than outdoors)
-Recommend public limit
strenuous outdoor activities
-Recommend cancelling
outdoor public events
-Recommend that sensitive
groups shelter-in-place or
consider leaving area until AQ
improves
-Recommend “Smoke Days” for schools
(assess if indoor AQ is better than
outdoors)
-Recommend public limit strenuous
outdoor activities
-Recommend cancelling outdoor public
events
-Open and publicize clean air shelters for
sensitive groups
Very Unhealthy
(151-250 µ/m³)
-Recommend “Smoke Days” for
schools (assess if indoor AQ is better
than outdoors)
-Recommend public limit strenuous
outdoor activities
-Recommend cancelling outdoor
public events
-Consider public announcement
recommending shelter-in-place for
general population
-Cancel outdoor public events
-Cancel school (unless indoor
AQ is better than outdoors)
-Recommend shelter-in-place
-Share information about
periods of improved AQ to
guide essential outdoor activity
and ventilation for dwellings
Warn about medical risk for
sensitive groups and
encourage them to shelter-in-
place or leave area until AQ
improves.
-Recommend “Smoke Days” for schools
(assess if indoor AQ is better than
outdoors)
-Recommend public limit strenuous
outdoor activities
-Recommend cancelling outdoor public
events
-Consider public announcement
recommending shelter-in-place for
general population
Hazardous
(>250 µ/m³)
-Recommend shelter-in-place
-Warn about medical risk for sensitive
groups
-Recommend voluntary
evacuation for sensitive groups
-Consider opening and
publicizing clean air shelters
for general population
-Recommend evacuation of sensitive
groups
-Open and publicize clean air shelters for
general population
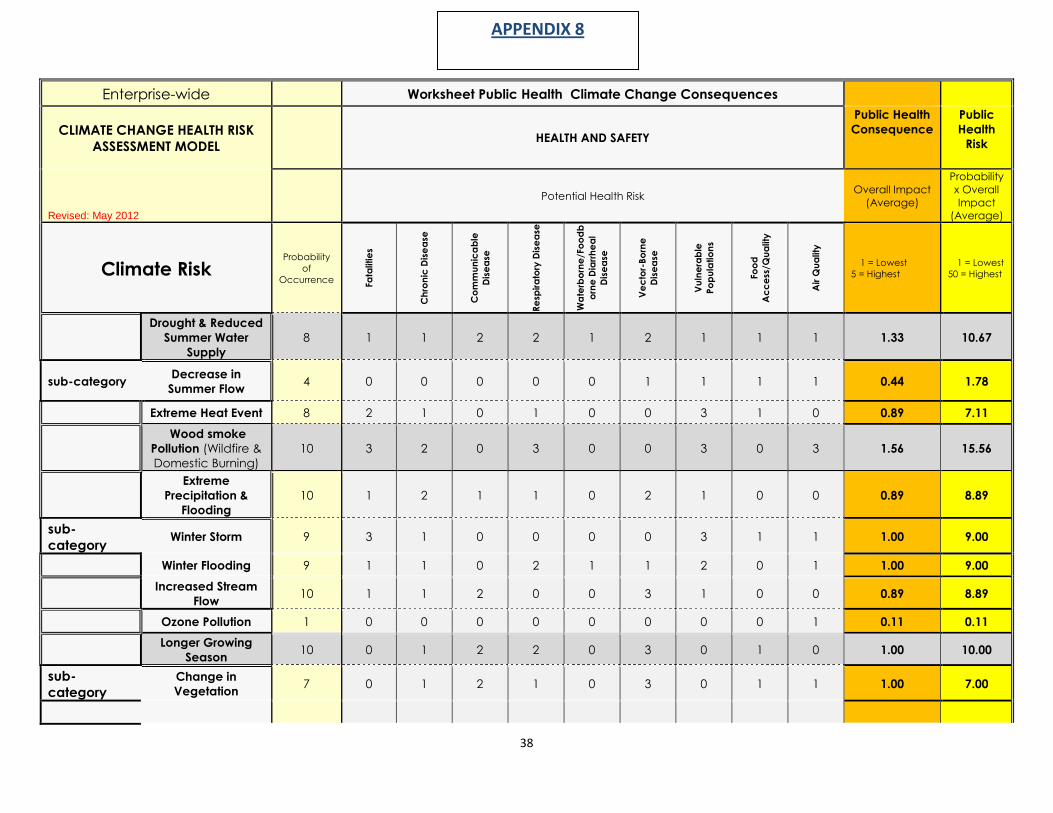
38
Enterprise-wide Worksheet Public Health Climate Change Consequences
CLIMATE CHANGE HEALTH RISK
ASSESSMENT MODEL HEALTH AND SAFETY
Public Health
Consequence
Public
Health
Risk
Revised: May 2012
Potential Health Risk Overall Impact
(Average)
Probability
x Overall
Impact
(Average)
Climate Risk Probability
of
Occurrence
Fatalities
Chronic Disease
Communicable
Disease
Resp
iratory Disease
Waterborne/Foodb
orne Diarrheal
Disease
Vector-Borne
Disease
Vulnerable
Populations
Food
Access/Q
uality
Air Q
uality
1 = Lowest
5 = Highest
1 = Lowest
50 = Highest
Drought & Reduced
Summer Water
Supply
8 1 1 2 2 1 2 1 1 1 1.33 10.67
sub-category Decrease in
Summer Flow 4 0 0 0 0 0 1 1 1 1 0.44 1.78
Extreme Heat Event 8 2 1 0 1 0 0 3 1 0 0.89 7.11
Wood smoke
Pollution (Wildfire &
Domestic Burning)
10 3 2 0 3 0 0 3 0 3 1.56 15.56
Extreme
Precipitation &
Flooding
10 1 2 1 1 0 2 1 0 0 0.89 8.89
sub-
category Winter Storm 9 3 1 0 0 0 0 3 1 1 1.00 9.00
Winter Flooding 9 1 1 0 2 1 1 2 0 1 1.00 9.00
Increased Stream
Flow 10 1 1 2 0 0 3 1 0 0 0.89 8.89
Ozone Pollution 1 0 0 0 0 0 0 0 0 1 0.11 0.11
Longer Growing
Season 10 0 1 2 2 0 3 0 1 0 1.00 10.00
sub-
category
Change in
Vegetation 7 0 1 2 1 0 3 0 1 1 1.00 7.00
APPENDIX 8
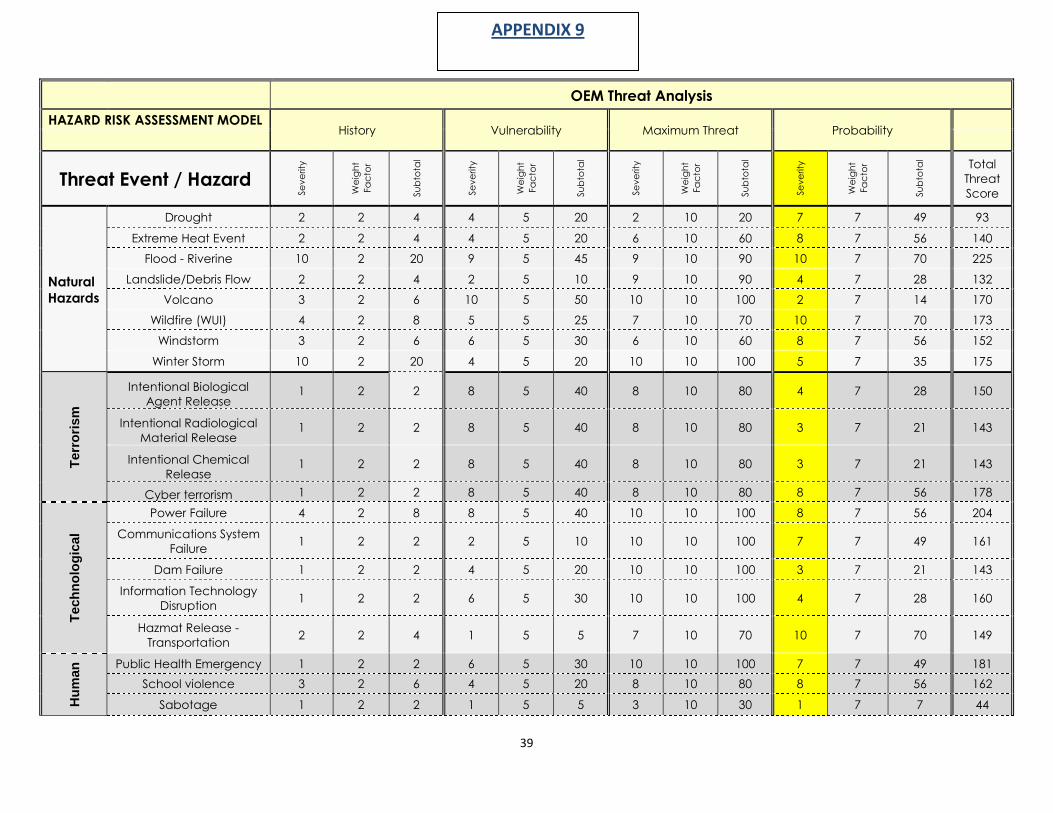
39
OEM Threat Analysis
HAZARD RISK ASSESSMENT MODEL History Vulnerability Maximum Threat Probability
Threat Event / Hazard
Severity
Weight
Facto
r
Subto
tal
Severity
Weight
Facto
r
Subto
tal
Severity
Weight
Facto
r
Subto
tal
Severity
Weight
Facto
r
Subto
tal
Total
Threat
Score
Natural
Hazards
Drought 2 2 4 4 5 20 2 10 20 7 7 49 93
Extreme Heat Event 2 2 4 4 5 20 6 10 60 8 7 56 140
Flood - Riverine 10 2 20 9 5 45 9 10 90 10 7 70 225
Landslide/Debris Flow 2 2 4 2 5 10 9 10 90 4 7 28 132
Volcano 3 2 6 10 5 50 10 10 100 2 7 14 170
Wildfire (WUI) 4 2 8 5 5 25 7 10 70 10 7 70 173
Windstorm 3 2 6 6 5 30 6 10 60 8 7 56 152
Winter Storm 10 2 20 4 5 20 10 10 100 5 7 35 175
Ter
rori
sm
Intentional Biological
Agent Release 1 2 2 8 5 40 8 10 80 4 7 28 150
Intentional Radiological
Material Release 1 2 2 8 5 40 8 10 80 3 7 21 143
Intentional Chemical
Release 1 2 2 8 5 40 8 10 80 3 7 21 143
Cyber terrorism 1 2 2 8 5 40 8 10 80 8 7 56 178
Tec
hn
olo
gic
al
Power Failure 4 2 8 8 5 40 10 10 100 8 7 56 204
Communications System
Failure 1 2 2 2 5 10 10 10 100 7 7 49 161
Dam Failure 1 2 2 4 5 20 10 10 100 3 7 21 143
Information Technology
Disruption 1 2 2 6 5 30 10 10 100 4 7 28 160
Hazmat Release -
Transportation 2 2 4 1 5 5 7 10 70 10 7 70 149
Hu
man
Public Health Emergency 1 2 2 6 5 30 10 10 100 7 7 49 181
School violence 3 2 6 4 5 20 8 10 80 8 7 56 162
Sabotage 1 2 2 1 5 5 3 10 30 1 7 7 44
APPENDIX 9

40
Worksheet B: Public Health Consequences
HAZARD RISK ASSESSMENT MODEL
HEALTH AND SAFETY RESPONSE
CAPACITY
PUBLIC HEALTH
INFRASTRUCTURE
Public Health
Consequence
Public Health
Risk
Potential injuries and deaths Ability to respond Service
Interruption
Overall Impact
(Average)
Probability x
Consequences
Hazards Probability
of
Occurrence Fata
lities
Outp
atient
Injuries
Resp
irato
ry
Illness
Chronic
Disease
Communica
ble D
isease
Menta
l
Health
Vulnera
ble
Populations
Food
Security
Wate
r
Security
Hosp
ital Beds
Primary C
are
Pro
viders
Pharm
acies
Ambulance
Sta
ffing
Inte
ragency
Partners
1 = Lowest
5 = Highest
1 = Lowest
50 = Highest
Natural Haza
rds
Earthquake - Cascadia (3-5min) 2 2 5 4 4 2 5 5 4 4 5 5 5 5 3 1 3.93 7.87
Extreme Heat Event 8 1 2 3 4 1 2 2 2 2 2 2 2 2 2 1 2.00 16.00
Wildfire (WUI) 10 2 2 4 2 1 3 4 3 2 3 2 2 4 3 1 2.53 25.33
Windstorm 8 2 2 2 2 1 2 2 2 2 2 2 1 5 3 1 2.07 16.53
Cyber Terrorism 8 1 1 1 1 1 1 1 1 1 1 1 3 1 2 1 1.20 9.60
Technological
Power Failure 8 2 2 1 3 1 1 3 3 3 2 2 3 3 3 1 2.20 17.60
Communications System Failure 7 1 1 1 1 1 1 2 1 1 1 1 3 1 2 1 1.27 8.87
Airplane Crash 10 2 2 1 1 1 2 1 1 1 4 1 2 4 2 1 1.73 17.33
Hazmat Release - Transportation 10 1 2 2 2 1 2 3 2 1 4 3 3 4 2 1 2.20 22.00
Hazmat Release - Fixed Facility 10 1 2 2 2 1 2 3 2 1 4 3 3 4 2 1 2.20 22.00
Hu
man
Public Health Emergency 7 2 2 4 4 2 4 4 2 2 4 5 3 2 3 1 2.93 20.53
School violence 8 2 2 1 1 1 3 2 1 1 3 2 1 4 3 1 1.87 14.93
APPENDIX 10