Crocodile 2
102
Improved Nutrition and Management of Farmed Crocodiles - from Hatching to Harvest A report for the Rural Industries Research and Development Corporation by BM Davis September 2001 RIRDC Publication No. 01/123 RIRDC Project No. DAQ-247A
-
Upload
eddy-mwachenje -
Category
Education
-
view
312 -
download
1
Transcript of Crocodile 2

Improved Nutrition and Management of Farmed Crocodiles - from Hatching to Harvest A report for the Rural Industries Research and Development Corporation by BM Davis September 2001 RIRDC Publication No. 01/123 RIRDC Project No. DAQ-247A

ii
© 2001 Rural Industries Research and Development Corporation. All rights reserved. ISBN 0 642 58345 5 ISSN 1440-6845 Improved Nutrition and Management of Farmed Crocodiles: Hatching to Harvest Publication No. 01/123 Project No. DAQ-247A The views expressed and the conclusions reached in this publication are those of the author and not necessarily those of persons consulted. RIRDC shall not be responsible in any way whatsoever to any person who relies in whole or in part on the contents of this report. This publication is copyright. However, RIRDC encourages wide dissemination of its research, providing the Corporation is clearly acknowledged. For any other enquiries concerning reproduction, contact the Publications Manager on phone 02 6272 3186. Researcher Contact Details BM Davis Department of Primary Industries Abbott Street OONOONBA QLD 4810 PO Box 1085 TOWNSVILLE QLD 4810 Phone: 07 4722 2649 Fax: 07 4778 2970 Email: [email protected] RIRDC Contact Details Rural Industries Research and Development Corporation Level 1, AMA House 42 Macquarie Street BARTON ACT 2600 PO Box 4776 KINGSTON ACT 2604 Phone: 02 6272 4539 Fax: 02 6272 5877 Email: [email protected]. Website: http://www.rirdc.gov.au Published September 2001 Printed on environmentally friendly paper by Canprint

iii
Foreword The aim of the crocodile Research and Development program is to assist the sustainable commercial production of crocodiles in Australia. To this end, the program addresses industry priorities such as pelleted feed, husbandry practices and industry economics. Commercial crocodile farming in Australia has largely been a by-product of captive crocodile colonies kept for tourist exhibitions. Tourists want to observe animals taking prey which for captured animals is usually culled hens, kangaroo portions or wild pig portions. While the industry continues to provide the opportunity for tourists to observe crocodiles at close range they are also taking the opportunity to educate the public about the animals and their environment which assists with the conservation message. Initially, producers tried farming crocodiles under conditions close to the animals natural environment. This did not work effectively for a variety of reasons including the difficulty associated with handling animals and fighting amongst the crocodiles leading to skin damage which posed a major problem. As a result of such experiences there has been a tendency over the past decade for the industry to adopt more intensive farming methods. This report covers a wide range of topics associated with commercial crocodile production including nutrition, husbandry, housing, effluent management, diseases, genetics, animal capture, economic and extension methods. Project funds were provided by two Research and Development Organisations: the Rural Industries: Research and Development Corporation (RIRDC) and the Queensland Department of Primary Industries (QDPI) which are respectively funded by the Federal Government and the State Government of Queensland. This report, a new addition to RIRDC’s diverse range of over 700 research publications, forms part of our New Animal Products R&D program, which aims to accelerate the development of viable new animal industries. Most of our publications are available for viewing, downloading or purchasing online through our website: • downloads at www.rirdc.gov.au/reports/Index.htm • purchases at www.rirdc.gov.au/eshop Peter Core Managing Director Rural Industries Research and Development Corporation

iv
Acknowledgements Organisational support is imperative for the successful delivery of crocodile research and development outcomes. Central to this support is the QDPI which is responsible for having financed the very fine, environmentally-controlled crocodile research facility at Townsville. The RIRDC is thanked for its operational financing of the project. Australia’s commercial crocodile industry is thanked for its contribution of animals for research purposes. The Queensland Crocodile Advisory Committee is thanked for its interest, advice and encouragement for the research/development program. Several individuals have made a special contribution to the crocodile R&D program and include: Dr Peter McInnes from RIRDC
Rob Jack, Lyndell Morrissy, Honor Stephenson, Rod Bloomfield, Fraser Trueman, Bill Johnston, Dr Steve Johnson and Dr Annette Thomas from QDPI
Dr Mark Read, Environmental Protection Agency.
Presenting research outcomes to producers at distant locations such as the Northern Territory is difficult. The R&D group have been assisted in this task by the Northern Territory’s Department of Primary Industry and Fisheries (NTDPI&F) and a special thanks is extended to Jill Millan and Mauricio Perez-Ruiz for their assistance. The following people are thanked for their contribution to the research report: Mr Bob Mayer, Mr Steve Peucker, Dr Annette Thomas,Mr Geoff Runge, Dr Cam McPhee, Mr Bill Johnston of QDPI, Mr Robert Henaway, Project Services, Townsville and Dr Robert van Barneveld, Barneveld Nutrition.
v
Contents Foreword iii Acknowledgements iv Contents v Executive Summary vi 1. Introduction 1 1.1 Crocodile Farming in Australia – 1998 to 2001 1 1.2 The 1998-2001 Crocodile Research Program 1 2. Objectives 3 3. Methodology 4 3.1 General research procedures for research experiments 4 3.2 Research on environmental factors and management practices for rearing hatchling
crocodiles 4 3.3 Research on environmental factors and management practices for rearing grower
crocodiles 5 3.4 Analysis and publication of research results 5 4. Detailed Results 6 4.1 Nutrition 6
4.1.1 Developing Manufactured Pelleted Feed for Hatchling and Grower Crocodiles 6 4.2 Husbandry 25
4.2.1 Stocking Densities for ‘Grower’ Crocodiles 25 4.2.2 Varying Water Levels for Hatchling Crocodiles 30 4.2.3 Feeding Frequency for Hatchling Crocodiles – The Effects on Growth Rates and Economic Implications 32 4.2.4 Hide-Boards and Warmer Temperatures for Hatchling Crocodiles 40 4.2.5 Water Temperatures for 15 Month Old Crocodiles 44
4.3 Housing 48 4.3.1 Environmental Housing for Crocodiles 48
4.4 Environmental Management 52 4.4.1 Treatment of Wastewater and Disposal/Reuse of Effluent 52
4.5 Diseases 65 4.5.1 Some Fungal Contaminants of the Estuarine Crocodile (Crocodylus porosus) 65
4.6 Genetics 80 4.6.1 Improving the Commercial Performance of Grower Crocodiles by Genetic Selection 80
4.7 Capture 83 4.7.1 Refinement to Electrical Stunning Equipment to Capture Crocodiles 83
4.8 Economics 85 4.8.1 CROCTEL – A Computer Program to Monitor Commercial Breeder Performance 85 4.8.2 CrocProfit – Decision Investment Tool for Farmers and Investors 85
4.9 Extension 86 4.9.1 General 86
5. Discussion of Results 87 6. Implications 89 7. Recommendations 90 8. Appendix 1 92
Thinking of Crocodile Farming – Farming Issues to Consider 92 Thinking of Crocodile Farming – Some Licence Issues to Consider 95

vi
Executive Summary The RIRDC and the QDPI have a contractual agreement designed to assist the development of the Australian and Queensland crocodile industries. Both organisations share the goal of a viable and sustainable crocodile industry which will achieve its objectives through improved technology. This report covers a range of crocodile R & D topics including nutrition, husbandry, housing, effluent management, diseases, genetics, animal capture, economics and extension practices. The report is intended to provide the reader with a comprehensive insight into commercial crocodile production under Australian conditions. Some topics are presented in more detail than others which reflects the state of the R & D progress for that particular topic. For example, the article on environmental housing deals with general principles rather than crocodile specific requirements. Conversely, the research report covering the water temperature requirement of hatchling crocodiles is advanced. Pelleted feeding is a high industry priority and one that is being pursued by the research team. Manufactured feed for crocodiles has proven to be a complex, difficult issue. The key complexity is one of manufactured diet acceptance by crocodiles which have proven to be fussy feeders despite their fearsome reputation. Researchers are addressing the acceptability challenges by conducting a series of free choice feeding exercises which allow the crocodile to demonstrate its preference for a particular ingredient. Once preferred ingredients can be identified they will be blended into balanced diets and offered to crocodiles. Growth rates will be measured and compared to animals on chicken head diets. So far researchers have established that it is possible to manufacture on-farm, cold pressed, pelleted feed that crocodiles will eat. In addition, manufactured feed offers a 2.4:1 ratio over offal diets on a dry matter basis. This advantage translates into ingredient, transport and storage savings for producers. Crocodile farming is described as an emerging industry and as such has less experience with commercial intensive livestock principles than the more established industries such as pigs and poultry. Despite this comparative lack of intensive livestock skills, the crocodile industry is making good progress in closing the gap. Crocodile farming is moving from extensive outdoor practices which are much influenced by climatic conditions to intensive housing with some environmentally-controlled housing being used for hatchlings on commercial farms. Several producers are going a step further and creating individual pens for grower animals to reduce fighting and subsequent skin damage, thus placing a more valuable product in the market. Such practices lead to a better return on investment. Husbandry research has addressed several areas including stocking densities, water levels, hideboards and water temperatures for hatchling and/or grower crocodiles. Water temperature has been shown to influence growth rates. Stocking densities influence dominance and subsequently skin quality. Husbandry research is on-going. Genetics is a relatively new field in commercial crocodile production. It is important to Queensland producers in particular because they are primarily dependent upon hatchlings from captive breeders. This is unlike the Northern Territory where producers largely depend on ranching programs (that is, collecting eggs and/or hatchlings from designated locations in the wild which are closely monitored) for their hatchlings. Western Australia will also benefit from the scheme because most of their hatchlings are farm-bred. Some West Australian farms have individual grow-out pens and this will allow for careful monitoring of an individual animal’s progress and link this back to parent stock. Crocodiles are powerful, aggressive animals. Catching them by hand is no simple task. Researchers have collaborated with two electrical companies to develop electro-stunning wands. Wands deliver a controlled shock to the animal (110 volts for four seconds) which renders the crocodile powerless for approximately five minutes. During this time the animal can be secured and measured or transported

vii
to new quarters. Producers report several advantages for this method of capture including safety issues, more animals can be handled in a day’s work and animals recover more rapidly from capture trauma. Considerable international interest has been shown in this equipment. Commercial crocodile production, being a new industry, has little production data available. The crocodile research team has developed CROCTEL, a computer program which has largely monitored the performance of breeder crocodiles. It is proposed to use CROCTEL in support of the genetics program. CrocProfit is a spreadsheet, forecasting tool. It has been distributed to producers on a national basis and will allow them to calculate changes in farming operations. For example it will allow them to estimate the impact of changes in skin price or to determine the effects of shifts in expenditure/income due to moving to manufactured feed. Crocodile producers nationally are cooperating with the research team. Seminars, demonstrations, publications and workshops have been employed to keep producers informed of research outcomes. Producers make their priorities known and provide feedback on research programs through the Crocodile Advisory Committee.
1
1. Introduction 1.1 Crocodile Farming in Australia – 1998 to 2001 Established crocodile farmers in Australia are implementing changes in husbandry practices in an attempt to improve on-farm performance. For example, temperature controlled environments are being established to house hatchlings in order to provide animals with a better chance of survival and a better chance to grow. Some producers have moved to housing grower animals individually. This step has been implemented in an attempt to reduce skin damage due to fighting resulting in the downgrading of valuable skins. Producers who have tried this technique report a much-improved proportion of first quality skins reaching the market. The advantages being offered by individual housing is being aided by electrical stunning equipment (the outcome of an RIRDC project initiative) to capture and inspect animals prior to harvest. Before the advent of stunning equipment, animals were shot and harvested irrespective of the quality of their skin. Now animals can be captured and inspected prior to harvest and if their skin is damaged they can be released to recover. Individual housing or penning of animals has created or is creating a good deal of interest among Australia’s crocodile producers. 1.2 The 1998-2001 Crocodile Research Program The title of this report is “Improved Nutrition and Management of Farmed Crocodiles: Hatching to Harvest”. The report addresses those issues but in fact goes further and addresses a range of subject matter considered important to industry development, some of which falls outside the limits of the RIRDC program. Nonetheless our wider research program is presented to provide the reader with a more comprehensive view of the subjects researched and to provide those clients contemplating crocodile farming with information to ensure they have every chance of success with their venture. To this end the following areas have been researched and are subject of this report.
Nutrition 1. Developing Manufactured Pelleted Feed for Hatchling and
Grower Crocodiles
2. Preliminary Results from On-farm Breeder Vitamin Supplement Trials
Husbandry 1. Stocking Densities for ‘Grower’ Crocodiles
2. Varying Water Levels for Hatchling Crocodiles
3. Feeding Frequency for Hatchling Crocodiles – The Effects on Growth Rates and Economic Implications
4. Hide-Boards and Warmer Temperatures for Hatchling Crocodiles
5. Water Temperatures for 15 Month Old Crocodiles
Housing Environmental Housing for Crocodiles
Environmental Management Treatment of Wastewater and Disposal/Reuse of Effluent
2
Diseases 1. Some Fungal Contaminants of the Estuarine Crocodile
(Crocodylus porosus) 2. Opportunistic Treatments of Fungal Diseases in Hatchling
Crocodiles
Genetics Improving the Commercial Performance of Grower Crocodiles by Genetic Selection
Capture Refinement to Electrical Stunning Equipment to Capture Crocodiles
Economics 1. CROCTEL – A Computer Program to Monitor Commercial Breeder Performance
2. CrocProfit – Decision Investment Tool for Farmers and Investors
Extension General Appendix 1 - DPI Notes – “Thinking of Crocodile Farming – Farming Issues to Consider” and “Thinking of Crocodile Farming – Some Licence Issues to Consider.
3
2. Objectives 1. To develop improved, economic, nutritionally balanced food pellets for both hatchling and
grower sized crocodiles, thereby directly reducing farm costs associated with transport, storage, food preparation, manual addition of vitamin and mineral supplements to diets currently involving fresh meat and reducing the risk of animal disease.
2. To continue research into environmental rearing factors (temperature, light, water depth,
hideboards, sound, stress) and management practices (animal rearing density, grading on size, feeding frequencies and number of feed stations). Such technology will deliver improved growth rates (with a resulting shorter turn-off time on farms), reduced disease and mortality rates and increased proportions of first grade skins produced.
3. To measure and then demonstrate the real on-farm benefits of implementing research results
of Objectives1 and 2 by working with cooperating farms to set up and run basic ‘demonstration’ type research on the farms.
4. To encourage more farmers (in all states and the Northern Territory) to use QDPI’s standard,
computer database recording scheme (CROCTEL) and a spreadsheet which acts as a decision making tool for farmers and investors (CrocProfit). To undertake an annual centralised processing and statistical analysis of all farms’ recorded information (maintaining farm anonymity) and then to discuss each farm’s results personally with that farm’s management. To prepare and distribute an annual report on farm statistics to farmers, researchers and government agencies. To present and discuss overall trends at annual industry seminars and to use the results as a basis for R&D planning at Industry Advisory Group meetings.
5. To ensure that the results from Objectives 1, 2, 3 and 4 are accurately and quickly extended to
crocodile farms across Australia by
• conducting annual industry seminars at Cairns and Darwin and sponsoring key farmers and researchers from outside these areas to participate
• publishing research results in ‘Crocodile Research Bulletins’ and in Research Updates
• producing jointly with the NTDPI&F a biennial crocodile industry newsletter called Crocodile Capers.
6. To help to establish more unified, cooperative crocodile farming industry organisations in Queensland and the Northern Territory and to encourage these groups to have more interaction with each other.
7. To sponsor half-yearly meetings with the Crocodile Industry Advisory Group to
• review current crocodile R&D undertaken by QDPI
• plan effective future R&D
so that the individual activities planned under the previous six general activity areas most effectively and efficiently address industry needs.

4
3. Methodology 3.1 General research procedures for research experiments Annual cohorts of animals were provided by industry for this work with
• approximately 300 newly hatched animals from a number of large nests, each identified individually by web tags and numbers matched with clutch
• approximately 180 of these subsequently moved into the grower shed at one-year of age. Experiments with discrete-type treatments (eg pelleted diet vs mince) were designed with replicated pen/tank units so that valid statistical analyses could be carried out on ensuing data. Experiments involving a single factor with different levels (eg water temperature) may have unreplicated pen treatments if the main objective is to estimate an overall response pattern. In either situation, close attention was paid to statistical design and setting up of experiments, so that groups of animals initialled assigned to pens were as uniform as possible. Fellow researchers have often published non-conclusive research results, with the explanation the crocodiles exhibit more variation in response to applied treatments than most other animals, both between and within clutches. From experience built up since 1993 the following are regarded as key issues when designing an experiment on hatchling crocodiles to one year of age:
• allow for a ‘settling-down’ period of two weeks between successive experiments (when all animals are subjected to the same conditions)
• grade the animals into two size classes • allocate animals to tank/size groups using the same mix of clutches (as much as possible, given
the actual numbers in each clutch) using an initial randomisation within these constraints • fine-tune the allocation (swapping within clutches) so that, for each size-class, tanks contain
animals with the same average (fasted) liveweight and also the same range in liveweight • use a separate ‘give and take’ tank in which to rear runts and any animals which become sick or
diseased. In terms of carrying out the experiment, the following guidelines are used (for hatchling animals):
• fast the animals for at least 48 hours prior to measuring • measure animals only at the start and at the end of an experiment (usually treatment differences
are statistically significant by 8-10 weeks) • weigh food offered and remnants of food uneaten at each feed (this gives an indication of
growth rate in each tank during the experiment) • feed animals daily from Monday to Friday then fast them over the weekend to assist in complete
digestion of food in their system • record belly scale patterns at an early age (either by photographs or by photocopies) • record liveweight, total length, snout-vent length and cranial skull length at each measuring.
3.2 Research on environmental factors and management practices for rearing hatchling crocodiles We have already done a lot of the necessary ‘bench-mark’ research on temperature, light and hide-boards and some work on grading and rearing density. Other avenues of research which have potential (based on recommendations from the USA study tour, fellow researchers, farmers, wildlife park workers) include:

5
• strategies for encouraging animals to spread out more evenly in their environment which avoids areas of high density and a seeming waste of other empty space - this could involve adjusting water levels, re-positioning hideboards, dimming lights.
• use of coloured water in tanks • water quality (some farms have ample supplies of brackish water but fresh water is expensive) • incubate eggs to produce mostly female animals and farm these if they do not fight as much and
cause skin damage • reduce aggressive behaviour at feeding by modifying feeding methods (more feed stations) or
by type of diet or by housing animals in individual cages. •
3.3 Research on environmental factors and management practices for rearing grower crocodiles Since no research had ever been done on farmed Crocodylus porosus (C. porosus) of this size, the first step was to find out which animal rearing densities were appropriate in the research pens. Then it was important to carry out research over the whole spectrum of environment, management and nutrition issues. Since temperature is known to be the most important environmental factor (at least for hatchlings) this was also a priority area. The period of growth from one-year to harvest is when most damage is done to skins by fighting so this was one important response parameter, as well as growth rates, skin thickness, meat quality and disease incidence. Other research issues which were prioritised by the Advisory Group included light, hide-boards, coloured water, amount of water, water quality and frequency of feeding. 3.4 Analysis and publication of research results Bob Mayer, who is a biometrician, has carried out analyses. The Industry Advisory Group and crocodile biologist Mark Read has assisted in interpreting the statistical findings and individual members of the QDPI team have cooperated in writing up the results for the different styles of report (Research Bulletin, Research Update, Crocodile Capers, papers for scientific journals, papers/posters for conferences).

6
4. Detailed Results 4.1 Nutrition
4.1.1 Developing Manufactured Pelleted Feed for Hatchling and Grower Crocodiles The development of manufactured pelleted feed in what could be described as “new animal industries” such as companion pets (cats and dogs) and crocodiles have proven to be complex. This point is emphasised by Earle (2001) who states “the nutritionist developing cat and dog foods assumed that both animals requirements were similar because they were perceived to be carnivores”. In fact the requirements of cats and dogs have been proven to be very different. A similar line of thinking has been employed with crocodiles, that is, crocodiles too are carnivores and subsequently manufactured diets containing meat products such as minced chicken heads or minced kangaroo meat would both attract and encourage crocodiles to consume the manufactured diet. Our research experience has shown this is not the case for farmed estuarine crocodiles (C. porosus) in Australia. In fact, despite a general reluctance to eat manufactured pelleted feed, crocodiles have shown a preference for diets containing no fresh meat as opposed to those containing some minced meat product. By comparison, animals rejected both the combination and manufactured diets showing a marked preference for chicken heads which acted as the control diet in experiments. They thus grew faster on chicken heads. Understanding the nutritional requirements of an animal has, according to Earle, three interrelated steps. These are: • understanding what constitutes the basic nutritional requirements of the animals (in Earle’s
research program, cats and dogs) • understanding the relationship between nutrition and the overall functioning of the biological
system • understanding the new technologies for animal food production and in the case of crocodiles
applying these new technologies on the farm. Objectives Australian crocodile producers have consistently nominated the development of pelleted feed as a high industry priority. Industry requires a manufactured diet that meets the following objectives:
1. crocodiles will accept and grow well on 2. is cost effective 3. does not require refrigeration 4. is stable in water 5. can be mixed on-farm.
Objectives 2, 4 and 5 have been accomplished. Objective 3 has been partly accomplished. However, Objective 1 has a considerable way to go before being commercially viable. Overseas Experience with Manufactured Feed for Crocodiles A popular belief in Australia is that the Nile crocodile, Crocodylus niloticus, (C. niloticus) is an easier proposition to convert to manufactured diets than is the case with the estuarine crocodiles (C. porosus). Jansen-van Vuuren (1995) states that the Zimbabwean experience with Nile crocodile hatchlings is that they are extremely selective with regard to the texture, odour and taste of artificial diets. This characteristic, which is possibly instinctive in origin, has hindered the development of suitable artificial-type diets for hatchlings. Be it taste or texture or odour acceptability, that is, taking
7
sufficient quantities of manufactured feed to promote both body maintenance and growth has been a most difficult task indeed and in Australia has not been satisfactorily resolved. The major problem currently confronting Australian researchers working on the development of pelleted feed is one of acceptability. Other overseas researchers are quoted by Mayer (1998). Morpurgo (1992), Coulson et al. (1995), Rodriquez et al. (1996) reported varying responses to growth rates using dry formulated feed. Coulson for example reported that none of the dry preparations they trialed could match the growth rate of animals fed fresh meat, fish or chicken or other fresh products used as supplements to dry feed. Conversely, Zimbabwe reports found no significant difference in growth when three day old Nile crocodiles were fed pellet/ground meat diets in ratios of 30:70, 50:50, 70:30 over a seven month period. We can conclude that international experience has shown that crocodiles are animals which do not readily accept manufactured feed. Mayer (1998) quoting Manolis et al. (1989) suggests that hatchlings may be genetically programmed to avoid strong smells and that clutch specific preferences may exist for different diets. This could account for the non-recognition of pellets and mash as food. It seems that no one researcher has been able to readily identify the link between what Earle describes as an understanding of the relationship between nutrition and the overall functioning of the crocodile’s biological system. Further, there are no literature reports on the cost/benefit or other advantages/disadvantages of pelleted feed over more traditional offal by-products diets. Reduced costs in refrigerated storage, ingredients and transport give pelleted feed an advantage over wet diets. The term ‘wet diets’ according to Staton and Vernon (1991) relates to raw meats which are typically 65-80% wet matter. Dry matter calculations are used to make comparisons between feed products more realistic by getting rid of the water for comparative purposes. Consequently, for every 1 kilogram of manufactured feed administered to animals, 2.4 kilograms of poultry by-product or kangaroo meat has to be fed to get the same level of nutrients to animals. As a result it could well be that a poorer growth performance for manufactured feeds could be tolerated on economic grounds. Biological results are not an end in themselves ie. bigger may not be necessarily better. Current Australian Situation Overcoming the issue of acceptance is the major task to be addressed. A series of 12 cages have been constructed with one animal allotted to each cage. Each animal has access to both water and a dry area and animals are in sight of one another. This approach is meant to eliminate physical contact between animals so that dominance should not discourage some animals from feeding. Importantly, as a research tool, it allows 12 different diet combinations to be fed simultaneously. From past experience researchers have established that estuarine crocodiles do not like blood meal. Neither do they appear keen about mixed ingredient combinations such as a fish, meat meal, soybean combination. One observational study (Peucker, 1999) involved colouring pig meat with different colours (light green, dark green, light red, dark red, light blue, dark blue, yellow, orange, purple, brown and pink). Results showed crocodiles exhibited no preference for a specific coloured meat diet neither did they reject any specific colour. Researchers concluded that colour played no part in food intake. The use of cages will enable researchers to rapidly gauge animals’ reactions to different diets. Both van Barneveld (2001) and Webb (2001) advocate this short, rapid approach to screen ingredients so eventually diets can be formulated which have a reasonable chance of being accepted by animals. In Zimbabwe a similar screening process was employed. When using pelleted feed several issues need to be considered. The issues include:
• is there an increasing need for manufactured diets • can pelleted feed be manufactured on farms • are ingredients available to manufacture pellets • can pellets be manufactured economically • will crocodiles accept pelleted feed • will crocodiles grow well on manufactured feed?

8
Future Need for Manufactured Diets In Queensland most of the crocodile farms are in the northern region of the state. Producers largely depend on culled hens to feed their breeder crocodiles. Over the past three years 60 percent of the egg farms in north Queensland have closed and more are likely to follow reducing the number of culled hens available to feed crocodiles. While there are no immediate plans to change things, in the foreseeable future the use of offal by-products to feed animals destined for human consumption could be prohibited. This would mean the feeding of culled hens and chicken heads would no longer be allowed. The basis for such a decision has its foundation in overseas experiences with infections which can be transferred to humans such as ‘Mad Cow Disease’. This would make the development and availability of manufactured feed even more important. Making Feed On-farm Equipment for on-farm manufacture of pelleted feed has been designed and trialed and it works effectively and efficiently. Halls Engineering, Sydney developed the mincer-mixer type equipment (see Figure 1). Pellets are extruded through various sized nozzles, depending on the size of the animals to be fed. Researchers have been able to develop a cold pressed pellet which makes the milling operation simple and inexpensive.
Figure 1. Mincer-Mixer Crocodile Pellet Making Equipment Experience has shown that these pellets hold together well in and out of water. They remain intact for several hours before they begin to break down. Crocodiles have been observed to eat pellets which have sunk under the water. Researchers believe that if pellets floated there would be further advantages. It seems air could be added for buoyancy without technical difficulty. Another suggestion about buoyancy comes from Degussa (1992) in a technical report on fish pellets. Degussa suggests a combination of Sipernat 17 and Sipernat 22S, one of the company’s hydrophilic precipitated silicas, could be added to the pellet. When such feed is placed in water, air bubbles form on the pellets due to hydrophobicity. These air bubbles decrease the overall specific weight of the pellets and keep them floating and/or slow down settling. This product has not been researched in

9
conjunction with crocodile pellets in Australia. Nonetheless it provides an insight which could prove beneficial to the industry and warrants investigation. In essence the manufacture of on-farm pelleted feed is achievable now. Feed Ingredients and Availability Feed ingredients are available. Feather meal and poultry offal meal are processed meals made from feathers and offal which have been rendered to reduce water content and the concentration of microorganisms. Other ingredients such as oils and vitamins are also readily available. Processed meals have the added advantage of being easily stored and they do not require refrigeration or freezing as does fresh poultry offal. Feed ingredients for manufactured diets do not pose a problem. Cost of Manufactured Feed On a dry matter basis manufactured feed offers an advantage of 2.4:1 ratio over chicken heads and other poultry by-products and kangaroo meat. The ingredient cost of pelleted feed is about $1.10/kg but this could vary according to the distance ingredients have to be transported and buying power. Nonetheless the ratio of 2.4:1 represents considerable savings in transport and ingredient costs. Staton (1991) states that water is an important requirement for crocodiles. However water is available to the animal in abundance by drinking and from the standpoint of feeding the crocodile it is important to maximise the dry matter food content of feed so that each bite taken represents a larger and more balanced intake of protein, energy and other nutrients. This view supports the position the authors have taken on cost savings. Crocodiles – Accepting Pelleted Feed as the Sole Source of Nutrition Researchers at Townsville have demonstrated that crocodiles will eat and grow on pelleted feed as their sole source of nutrition. They also found that – • while growth rates for one group of hatchlings were satisfactory on pelleted feed, growth rates for
grower aged animals (>1 year) were variable • grower responses in particular for weight have been unsatisfactory when compared to control
animals fed chicken heads. Trial Design Hatchling and grower animals are individually identified by the application of a small tag bearing a number to the web of each rear foot. Initially researchers used one tag per animal but found this to be inadequate. Sometimes two animals (or more) lost their tag during an experiment so there was no way of knowing which animal belonged to which tag. The two tag system overcame this problem. The numbers also identified the animals by clutch. Animals are weighed and measured as the animals enter the research facility as new hatchlings. They are then weighed and measured at the start and finish of each trial. From the outset new hatchlings crocodiles vary in size. Both weight and length can be seen to vary and this variation is maintained all their lives even within the same clutch. It is important to note this early natural variability so that animals fed manufactured diets are not thought to be variable merely as the result of manufactured feed.
10
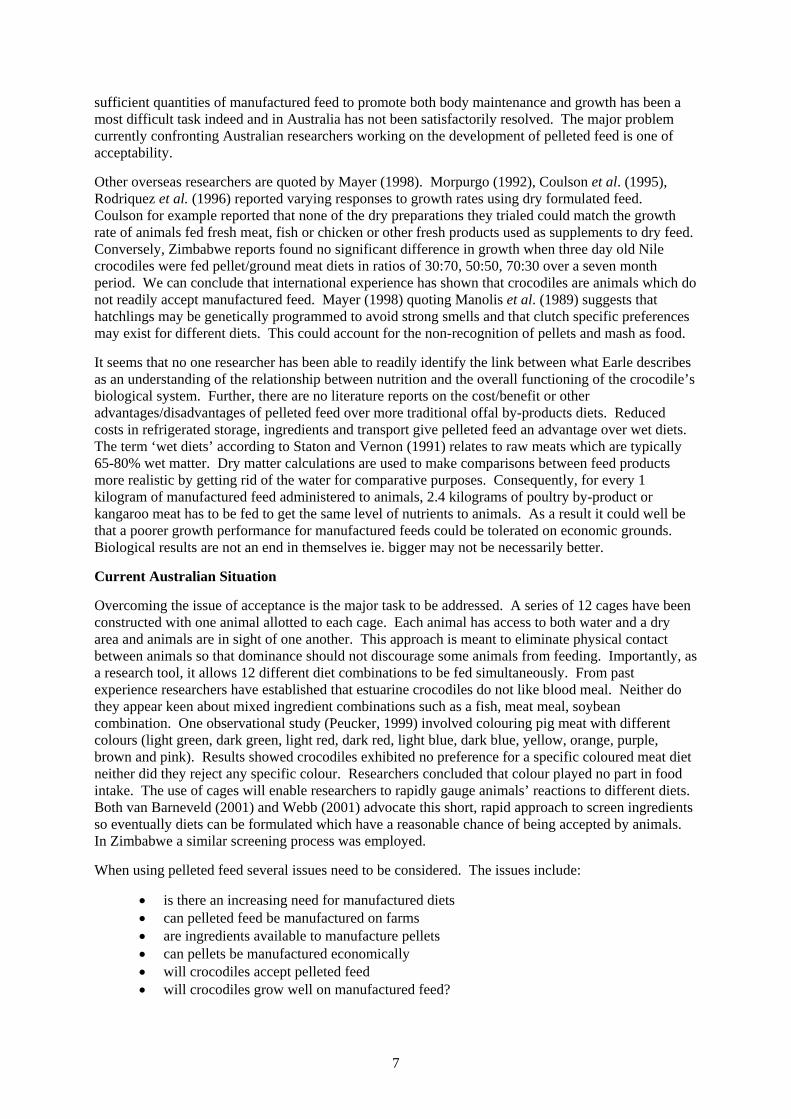
Results Peucker and Mayer (1997) state that food conversion efficiency for young crocodiles is among the highest of all animals (up to 110% on a dry matter basis for meat - ie. for every 1 kg of dry matter that an animal consumes, it can increase by 1.1 kg in bodyweight). Since a healthy one-year old crocodile weighs on average about 1.5 kg, animals need a relatively small amount of food over this period and even a high-cost pellet could be justified if it gave the same growth rates as for meat diets. During the grower stage animals eat much more food and we would expect food conversion efficiency to drop but we do not have any accurate information for this age. The most economic pellet for growers may thus be one which gives less than maximum potential growth but is cheaper to produce. In January 2000 an experiment was conducted using four different pelleted feeds plus chicken heads as a control diet in a trial lasting eight weeks with crocodiles being fed three days each week. The pellet diets were:
• chicken flavoured • kangaroo and beef flavoured • fish flavoured and • beef flavoured.
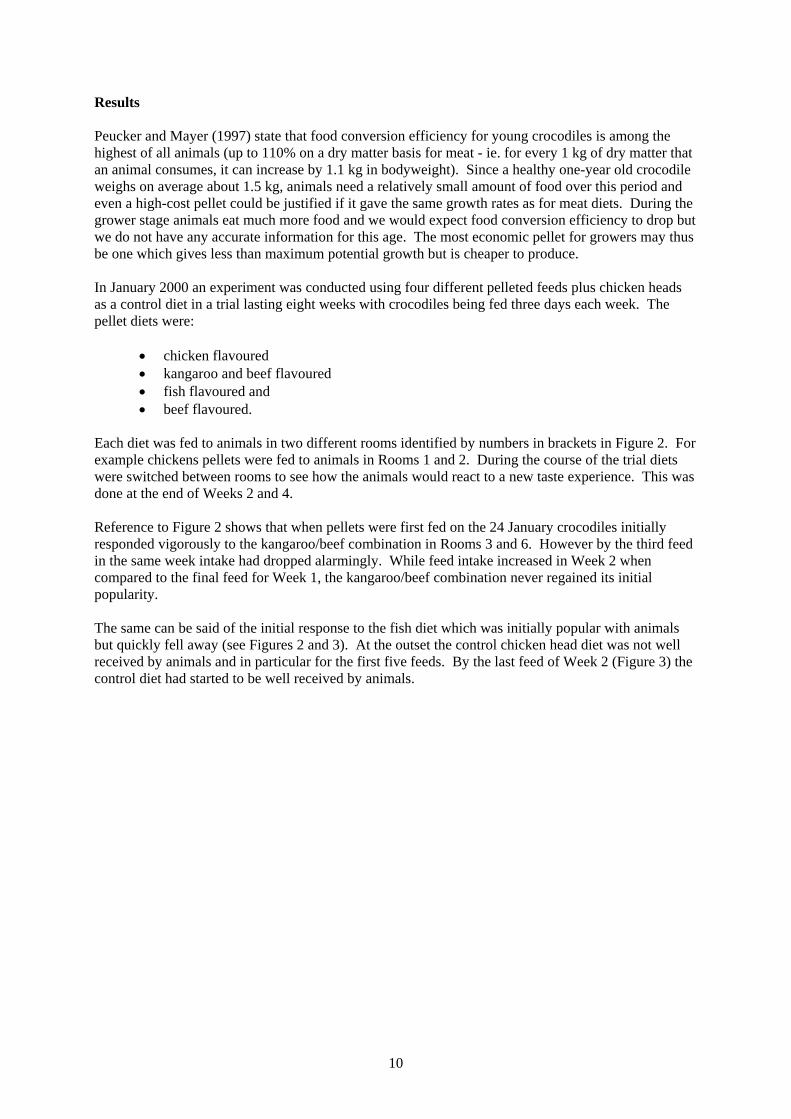
Each diet was fed to animals in two different rooms identified by numbers in brackets in Figure 2. For example chickens pellets were fed to animals in Rooms 1 and 2. During the course of the trial diets were switched between rooms to see how the animals would react to a new taste experience. This was done at the end of Weeks 2 and 4. Reference to Figure 2 shows that when pellets were first fed on the 24 January crocodiles initially responded vigorously to the kangaroo/beef combination in Rooms 3 and 6. However by the third feed in the same week intake had dropped alarmingly. While feed intake increased in Week 2 when compared to the final feed for Week 1, the kangaroo/beef combination never regained its initial popularity. The same can be said of the initial response to the fish diet which was initially popular with animals but quickly fell away (see Figures 2 and 3). At the outset the control chicken head diet was not well received by animals and in particular for the first five feeds. By the last feed of Week 2 (Figure 3) the control diet had started to be well received by animals.
11
Figure 2. Pellet Intake – Week 1
Figure 3. Pellet Intake – Week 2 In Week 3 (Figure 4) the chicken pelleted diets started to emerge as the most popular feed exceeding all other pellet combinations for feed intake and matching the control diet.

12
Figure 4. Pellet Intake – Week 3
Figure 5. Pellet Intake – Week 4 Clearly, by Week 5 (Figure 6), the control diet proved most popular with animals. This trend was maintained up to and including Week 8 (Figure 9) when the trial concluded.

13
Figure 6. Pellet Intake – Week 5
Figure 7. Pellet Intake – Week 6 Chicken flavoured diet remained the most popular of the manufactured diets with crocodiles from the fifth week (see Figure 6 to 9). The control chicken head diet easily out-performed the manufactured pelleted feed in terms of crocodile growth. However, when figures are converted to a dry matter basis (a ratio of 2.4:1) the performance of pelleted feed becomes more acceptable.

14
Figure 8. Pellet Intake – Week 7
Figure 9. Pellet Intake – Week 8 Peucker and Mayer reported outcomes from a set of experiments conducted at the Townsville crocodile research complex in 1997. Diets for this particular research program consisted of a kangaroo mince, a kangaroo mince manufactured pellet combination and a kangaroo mince/manufactured mash combination. Both combination diets were manufactured on a 50:50 weight ratio basis. At the same time water/air temperatures of 32ºC and 34ºC were trialed. The results for the different treatments as they related to final average body weight and length are presented in Figures 10 and 11.

15
Figure 10. Liveweight Response to Three Diets and Two Water Temperatures
Figure 11. Total Length Response to Three Diets and Two Water Temperatures
In essence the animals on the full mince diet fell behind the mince/pellet and the mince/mash combination for body weight and marginally for length. Body weight was very even at the start trial in April (13/4) but by July (15/7) the pellet/mince and mince/mash combinations at 32oC produced animals which were lighter by 20 and 40g respectively. At 34ºC the differences were not as large. Body length saw a slight advantage for the mince/manufactured combination at 32ºC but no difference at 34ºC. The authors argued that the differences were a consequence of the different temperatures. However, given the same trends for both temperature treatments the results could just as easily be reflecting different energy levels in the respective diets. The important thing to note is that animals grew as well, if not better, on the mince/manufactured diet combination.

16
In this trial the particle sizes of mince and pellet diets were similar. With the ratio of meat to pellets of 50:50 the animals ate the combination diet. However earlier studies indicated that once the percentage of meat was lower than 50% the animals tended to pick the meat from the diet and leave the dry ingredients behind. Peucker and Mayer found that when a manufactured diet was offered as the sole source of food animals were reluctant to eat. While combination diets are encouraging in the sense that they demonstrate animals will eat manufactured feed they have the drawback that pellet/mince combination still need to be refrigerated resulting in higher costs. Also, if a ban is applied to offal by-products the combination diet does not offer a solution to the improved diet dilemma. In 1999 two further nutritional trials were conducted one for hatchling and one for grower crocodiles. The aim of this work was to wean crocodiles quickly onto pelleted diets as a sole source of feed. Figure 12 shows that animals fed two pelleted diets and control diet of chicken heads were even in body weight at the outset of the trial. Animals grew on the two manufactured diets but again chicken heads outperformed pellet diets. The response pattern of the small/medium (S/M) animals to pellets was similar to that of the medium/large (M/L) groups. Animals on Pellet 2 outperformed those on Pellet 1. For the S/M group the difference between the control and Pellet 1 was approximately 90g and between the control and Pellet 2 40g. The differences for the M/L group were similar: 100g and 40g. Animals on Pellet 2 performed better than those on Pellet 2 for both size classes.
Figure 12. Hatchling Responses to Pellets In 2001a nutritional trial involving grower crocodiles was conducted. Two pelleted feeds were tested and chicken heads were again used as the control. Results are presented in Figure 13 which looks at the performance of all the animals in the trial on an individual basis. Control animals represented by a dot point (∀) symbol, Pellet A by a zero (o) and Pellet B by a plus (+) symbol. The straight line in Figure 13 represents no change in initial body weight over the life of the trial which lasted ten weeks. In other words animals located along this line neither gained nor lost weight. Animals above this line gained weight while animals below the line lost weight.

17
Figure 13. Pellet Trial: All Size Classes It can be readily seen that the majority of animals above the line were fed on chicken heads and below the line on the manufactured diets. Weight is one measurement but body length and head length also reflect growth performance. Responses for all three parameters are presented in Table 1. The results confirm the pattern shown in Figure 13. Bodyweights, head lengths and overall lengths of animals fed pelleted diets were lower than for the control fed animals. However, the weight difference, expressed as a percentage, was far greater than for head length or total length measurements. Table 1. Grower Pellet Trial – January-April 2001
Control Pellet A Pellet B Initial av. Total length (mm) 993 996 990 Final av. Total length (mm) 1089 1016 1017 % change in Total length 9.7 2.0 2.7 Initial av. Head length (mm) 142 141 141 Final av. Head length (mm) 156 147 147 % change in Head length 9.9 4.3 4.3 Initial av. Liveweight (g) 3106 3105 3112 Final av. Liveweight (g) 4055 2920 2930 % change in Liveweight 30.6 -6.0 -5.8 Discussion The object of converting farmed estuarine crocodiles from traditional meat based diets to manufactured pelleted feeds is complex and requires several interrelated steps. Crocodiles have displayed an inherent resistance to feed changes and frequently prefer to suppress food intake rather than readily accept manufactured diets. It appears that other crocodilians (Nile crocodiles and alligators) also display resistance (Jansen-van Vuuren, 1995). Further, resistance is not confined to crocodilians, other species such as domestic cats and dogs demonstrated their own complexity (Earle, 2001). However the nutritional problems of the companion pet industry have been largely addressed and resolved. It is anticipated that the difficulties confronting crocodile researchers will also be resolved.

18
The complexity of pelleted feed manufacture is not confined solely to producing a diet which crocodiles will consume. Other important issues have to be addressed, for example, where do producers buy manufactured feed from and do they manufacture feed on-site. The issue of on-farm manufactured feed has been addressed by the research team and details covering equipment and pellet manufacturing procedures are available. Further motivations exist to push the issue of manufactured feed to a successful conclusion including the issue of economics which favours manufactured feed because of its dry matter advantage over wet meat products. Feed ingredients are also available from commercial feed milling sources and can be procured at prices competitive with offal by-products. Processed diets offer two more advantages namely less volume of ingredients are required leading to a reduction in ingredient and transport costs and no refrigeration costs are required. In essence the economics of manufactured feed are encouraging. Research strategy aimed at improving feed acceptability may require several steps. These may include: • training hatchlings to recognise pellets as food • conducting free choice feeding exercises for crocodiles to identify their preference(s) for
manufactured ingredients • formulating and trialing balanced diets which have their foundation in preferred ingredients • changing the diets of control animals between experiments • using a condition index involving weight, total length and head length • eventually producing a diet check program which producers can use for themselves. Acceptance of pelleted feed is the key issue. Crocodiles are reluctant to eat current manufactured diets in quantities that promote growth to the same extent obtained on offal by-product feeds. Several suggestions can be advanced and this reluctance might have its foundations in crocodiles not liking the smell, texture or taste of pellets. However, it might also be as Manolis (1989) suggests that hatchling crocodiles are genetically pre-programmed to recognise certain items, smells, tastes and movements in their environment as representing food. Pelleted feed may simply not fit the framework and the crocodile may never learn to associate pellets with food. It might be possible to change this behaviour. One member of the research team observed baby Nile crocodiles in Zimbabwe being trained to take pellets. This process consisted of rolling pellets in front of the hatchling which responded by scurrying around after the rolling pellets to capture them. Grower yearling animals were observed to readily accept pelleted feed as their sole source of diet without the pellets having to be put in motion. Not only did the animals on this farm accept the feed they grew on it exceedingly well. In Townsville the success that has been achieved with manufactured feed has been associated with animals which have been trained to take pellets. That training consisted of a measured substitution program. Small quantities of pellets were initially mixed in with the diet and increased in quantity over time. Other young animals can be conditioned or imprinted on items in their environment. Imprinting needs to take place very early in the young animal’s life. With chickens, the critical period seems to be the first 48 hours of the bird’s life. Young conditioned animals such as chickens and foals have been shown to demonstrate a marked change in behaviour after imprinting. Free choice feeding will be trialed in an attempt to improve acceptance. Animals will be fed different ingredients and preferences and intakes noted. If preference patterns can be established, preferred ingredients will then form the basis of balanced diets. In previous trials balanced diets were prepared and fed over a 10-week period. Most of these trial diets produced unsatisfactory growth rates when compared to those of animals on control diets. With the use of cages diets can be assessed very quickly.
19
After weighing and measuring animals were distributed to S/M or M/L groups and each treatment was applied to both groups. Comparisons were then made between controls (chicken heads) and treatments (Pellet 1 etc). Each experiment lasts approximately 10 weeks. A condition index incorporating weight, total length and head length would be a superior method of determining growth response. Using weight response alone could be misleading as it may represent fat deposits for control fed animals. Table 1 shows substantial differences for each of these parameters reinforcing the need for a multi measurement index. Not infrequently producers report buyers described skins as being too short and too wide. Buyers would prefer longer, narrower skins which imply producers need to farm leaner, longer animals. The animal’s width might be readily influenced by nutrition but changing the animal’s length may not be as readily achieveable. Researchers have concerns that body weights reported from this trial, in part, reflect a good deal of fat for control animals which then tends to exagerate the comparative results for controls and treatments. Conversely, it could be said that animals on pelleted feed were carrying little or no body fat and their meat to fat ratio is disproportionate in the reverse direction. However, no definitive measurements have been taken to support either view. One way of improving the measure procedures would be to use a weight/length index. Riese (1997) states that growth allometry is insignificant in juvenile C. porosus up to 1.2 metres in length so using an index in the context of trials may be questionable. To support the notion that a condition index might have a place in the context of this trial, researchers have drawn on Webb’s (1990) recommendation for one year old crocodiles which incorporates weight/length measurements. The relative condition index can be estimated from a relationship between weight and length. The research team and associates have experience in writing least cost diet check programs. Once ingredient preferences are established programs can be written so that producers can formulate diets for themselves. On-farm mixing equipment and diet computer programs will provide producers with much flexibility in their manufactured feed programs. References Earle, K (2001) Recent Advances in Pet Nutrition (1). Friskies Products Technology Centre, St
Joseph, USA.
Jansen-van Vuuren, RA (1995) A Review and Update of the Nutrition of Nile Crocodile (Crocodylus niloticus) from Birth to One Year of Age and the Development of Artificial-type diets for Juveniles in Zimbabwe – 1989 to 1994.
Mayer R (1998) Crocodile Farming: Research, Development and On-Farm Monitoring, 1995 to 1998, RIRDC Report No. 98, Canberra, ACT pp 31 and 36.
Peucker, SKJ (1999) The Influence of Feed Colouring Upon Feed Intake. Unpublished Data. Queensland Department of Primary Industries, Brisbane.
Riese, G (1997) Factors Affecting Food Intake and Growth in Captive Saltwater Crocodiles. Sc. Master Thesis.
Staton, MA and Vernon, B (1991) Formulated Crocodile Feeds, Intensive Tropical Animal Production Seminar Proceedings. Department of Primary Industries, Townsville, Qld.
van Barneveld, R (2001) Manufactured Feeds for Crocodiles – Review of 2001 Growth Experiments and Future Directions. Barneveld Nutrition Pty Ltd, South Maclean Qld. Unpublished report.
Webb, GJW (2001) Personal communication. Wildlife Management Pty Ltd, Sanderson NT.
Degussa Pacific Ltd. (1992) Sipernat for the Improvement of Fish Feed Pellets, Technical Report, 13/F., Manulife Tower, Electric Road, Hong Kong.
20
4.1.2 Preliminary Results from On-farm Breeder Vitamin Supplement Trials Introduction This cooperative venture with the Queensland crocodile farming industry and the University of Queensland (UQ) was part of a UQ research project entitled ‘Crocodile Biology and the Development of an Economically and Ecologically Sustainable Industry’. The project was formed in part as a response to a direct request from one of Queensland’s largest crocodile farmers to investigate a ‘35% decline in hatching rate’ among their captive breeder colonies for the 1995/96 breeding season. Four possible hypotheses were proposed to explain the infertility problem (either due to a single cause or to multiple causes):
• mating within communal pens dominated by alpha males (peripheral males rarely breeding)
• clutches fathered by a single male • problems of decreased egg fertility and hatching success related to declining reproductive
condition of alpha males and particular females • declining reproductive success of females related to nutrient deficiencies • problems in hatching success associated with damage to embryos during transport and the
presence of pathogens within incubators. UQ scientific expertise lay in DNA technology and the project involved UQ developing specific micro-satellite fingerprinting for C. porosus and Crocodylus johnstoni (C. johnstoni). UQ also pursued the issue of damage to eggs and embryos. The QDPI was invited to be a joint-partner in research, to design and supervise on-farm research to see whether the infertility problem could be linked to nutritional deficiencies in breeder animals. This report covers the progress of the on-farm research to date. Most of the funding for the UQ activities came from a research grant from the Australian Research Council / Department of Employment, Education, Training and Youth Affairs under its ‘Strategic Partnership with Industry – Research & Training Support’ program and the Australian Crocodile Industry Group also pledged financial support. A RIRDC review of all emerging animal industries in Australia (Canberra 1997) recommended that nutrition be a high priority area for the crocodile industry and that QDPI should coordinate activities in this area. The breeder nutrition fell in this area and was carried out under QDPI’s current RIRDC research program. Similar observations on low fertility rates among captive breeder alligators in American have since been reported (Lance et al., 1998). Alligator farming in Louisiana is based mainly on collecting eggs from the wild and incubating them on farms. Industry statistics from 1997 on the ‘captive breeders’ on Louisiana farms showed that a total of only 10,508 hatchlings were obtained from 3,407 adult breeders, or 5.6 per adult female. Only 33% of mature females on farms nested that season and of the eggs laid, only 53% hatched. In the absence of any ‘standardised’ farm recording it was acknowledged that these figures may not be very reliable and may even underestimate the problem. For example some farms may have ignored infertile eggs in their counting. This low reproductive rate from captive breeding stock is not economic for the Louisiana industry and such rates would certainly not be economic in the Australian situation. Hence farmers in Louisiana rely mostly on wild eggs and claim that the hatching rates for these eggs is around 90%. Experienced crocodilian biologists have also noted a steady and sometimes quite sudden decline in fertility rates among mated pairs of captive alligators and other crocodile species on farms (Elsey et al., 1994). Research Program The benchmark work in the area of crocodile dietary requirements was published by Staton et al. (1991) and included tabulated figures for protein/energy/vitamin/mineral requirements for ‘fast growing crocodiles up to 25kg bodyweight’. There has been no work published for adult breeder

21
animals. Some pilot work on individual areas for alligators was reported at the Singapore meeting of the Crocodile Specialist Group (Lance et al., 1998). Blood samples taken from adult male and female alligators show higher levels of iron and zinc in mated females at the time when yolk is being laid down in their eggs. At the same time, calcium is being drawn from the females’ bones to be put down as shell and it can take months for bone calcium levels to return to normal. A lot of captive breeder alligators seem to be obese (compered with animals in the wild) and have very high levels of plasma lipids (resembling humans about to have heart attacks). Other US studies on diets for breeders (Lance et al., 1998) showed that a mono-diet of frozen fish resulted in 40% fertile eggs, compared with a diet of nutria (a large rodent) which gave a 75% rate. Chemical analyses of these diets showed vitamin E levels of 9% in the fish and 12% in the nutria. Other studies showed no effects of selenium or Omega-3 fatty acids. Studies on the relative porosity of egg shell from captive bred eggs versus wild eggs showed that the latter had a lot more pores per unit area and that infertile farm-bred eggs had very few pores. The industry in Queensland feeds mostly spent hens and cut-up chunks of wild pig to their breeder animals. ‘Ranching’ of eggs is not permitted in Queensland, so farmers have to rely on captive breeding (or buying in from the Northern Territory where ranching is allowed) for their stock. QDPI took samples of these food sources and had them analysed. The results showed that spent hens and wild pig meat both had very low levels of vitamins and minerals. Breeding ‘colonies’ in large lagoon areas probably supplement their ‘farm-fed’ diets with fish, frogs etc but breeders kept in small enclosures with small concrete ponds would not have any other food source. While a lot of large ‘display’ animals on Queensland farms may be over-fed (tourism demands that animal feeding displays are held regularly), most of the breeding animals not on display are fed only several times a week and not at all during cold periods. A special meeting of animal nutritionists was convened in Townsville in January 1998 to formulate a recommended vitamin/mineral diet supplement to trial on breeder animals on cooperating farms. The result was to use the formulation of Staton fed at a rate of 35g per feed. The logistics of how to ‘package’ this supplement so that it could be fed to animals proved difficult and in the end, the method used was hand-filling and sealing individual sachets of the dry ingredients. These sachets were designed to be inserted into the body cavity of hens and inserted into deep incisions made in pieces of pork. This form of supplement was used from April 1998 until mid-late 1999 but was relatively expensive to manufacture. A cheaper method has now been derived. It involves farmers mixing amounts of dry product into a ‘slurry’ and injecting set amounts into meat pieces using a form of ‘drenching’ gun. This is the method that is currently in use in the farm research. The actual cost of the vitamin/mineral supplement was $6590 per tonne. A ‘typical’ feeding routine on Queensland farms would be to feed each breeding animal twice a week, except for 12 weeks in mid-winter where the animals would be fed almost nothing. Adding the supplement at the recommended rate of 35g to each feed, at this feeding regimen, would require 2.8kg of supplement per animal (at a cost of $18.45). For a breeding ‘pair’ these figures would double.

22
On-Farm Trials Five farms in Queensland are cooperating in this research project. Some have breeding colonies, others have individual breeding pairs and some have both. Using each individual farm’s fertility records from the 1997/98 season as captured on CROCTEL (Mayer et al., 1997), ‘pairings’ were made of colonies/pairs so that each pair had similar fertility in 1997/98. Then one of each pair was randomly selected to receive the supplement while the other was to receive just the non-supplemented food and act as ‘control’. While it is important for the breeding female to have a nutritious diet (especially during mating and when eggs are being formed), it may be that it is equally important that the male is healthy (for libido and sperm quality) for optimal reproduction. Thus, both male and female animals in each ‘supplement’ group were fed the supplement. The pens/lagoons designated as ‘treatment’ groups were identified with permanent markers placed on the fences. The ‘sachets’ were used for 12-18 months (depending on the farm) beginning in April 1998. Then there was a period when no more supplement was fed until the trial was re-commenced (using the same design) in mid-late 2000. Results CROCTEL farm production figures on overall fertility rates for three of the larger participating farms are shown in Figure 1. Fertility was assessed by ‘banding’ in the eggs. Of the other two farms in the study, one was very small with only 6 breeding pairs and the other has not yet entered breeding records for the last two seasons onto CROCTEL. For the other three, records prior to 19993/94 are not reliable and only available from two farms.
Figure 1. Fertility Trends for Three Queensland Farms The sudden drop in banding rate for farm A between 1994/95 and 1995/96 did not occur on the other two farms and was accentuated by the abnormally high figure recorded in 1994/95 which was 26% up on the 1994/95 figure. It is interesting to note that since farms have been adding supplements to the ‘treatment’ groups (beginning in April 1998), the 1998/99 and 1999/2000 overall farm fertility rates have steadily increased on each farm. Statistical summaries of the supplemented and non-supplemented groups on each farm are presented in Table 1. Season 1997/98 was prior to the start of the trials and the values show the natural difference between the groups even after ‘pairing’ on reproduction.
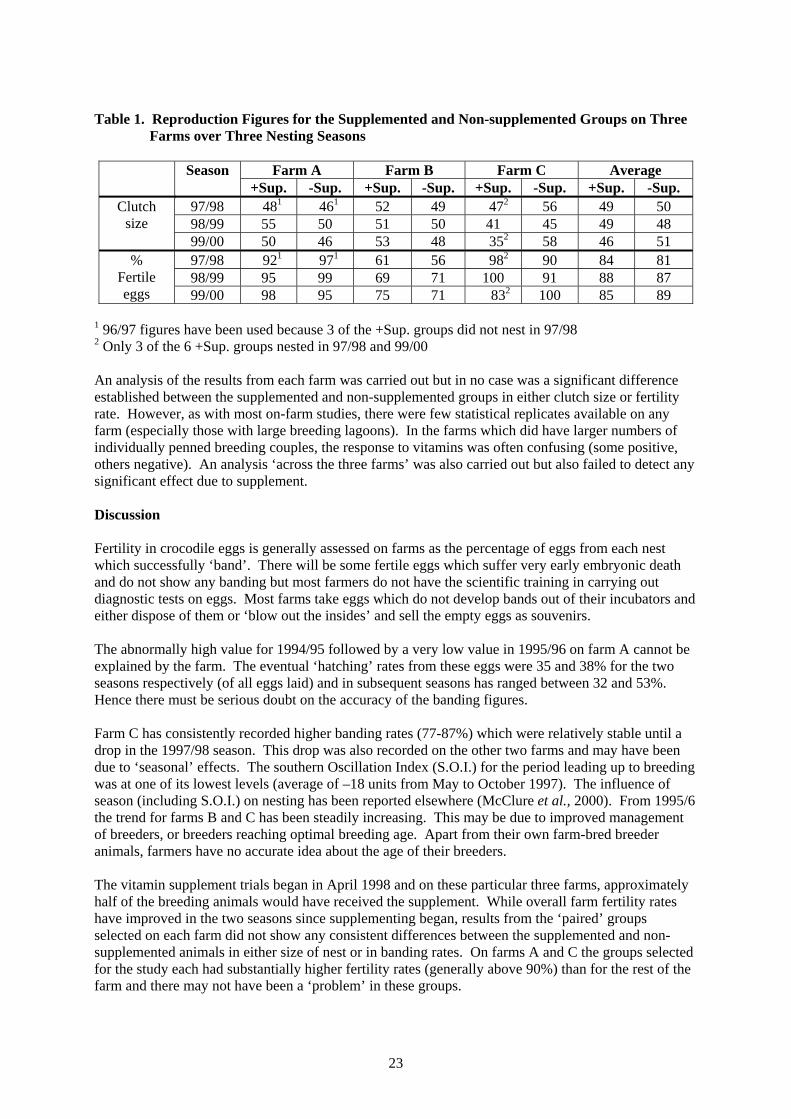
23
Table 1. Reproduction Figures for the Supplemented and Non-supplemented Groups on Three Farms over Three Nesting Seasons
Farm A Farm B Farm C Average Season +Sup. -Sup. +Sup. -Sup. +Sup. -Sup. +Sup. -Sup.
97/98 481 461 52 49 472 56 49 50 98/99 55 50 51 50 41 45 49 48
Clutch size
99/00 50 46 53 48 352 58 46 51 97/98 921 971 61 56 982 90 84 81 98/99 95 99 69 71 100 91 88 87
% Fertile eggs 99/00 98 95 75 71 832 100 85 89
1 96/97 figures have been used because 3 of the +Sup. groups did not nest in 97/98 2 Only 3 of the 6 +Sup. groups nested in 97/98 and 99/00 An analysis of the results from each farm was carried out but in no case was a significant difference established between the supplemented and non-supplemented groups in either clutch size or fertility rate. However, as with most on-farm studies, there were few statistical replicates available on any farm (especially those with large breeding lagoons). In the farms which did have larger numbers of individually penned breeding couples, the response to vitamins was often confusing (some positive, others negative). An analysis ‘across the three farms’ was also carried out but also failed to detect any significant effect due to supplement. Discussion Fertility in crocodile eggs is generally assessed on farms as the percentage of eggs from each nest which successfully ‘band’. There will be some fertile eggs which suffer very early embryonic death and do not show any banding but most farmers do not have the scientific training in carrying out diagnostic tests on eggs. Most farms take eggs which do not develop bands out of their incubators and either dispose of them or ‘blow out the insides’ and sell the empty eggs as souvenirs. The abnormally high value for 1994/95 followed by a very low value in 1995/96 on farm A cannot be explained by the farm. The eventual ‘hatching’ rates from these eggs were 35 and 38% for the two seasons respectively (of all eggs laid) and in subsequent seasons has ranged between 32 and 53%. Hence there must be serious doubt on the accuracy of the banding figures. Farm C has consistently recorded higher banding rates (77-87%) which were relatively stable until a drop in the 1997/98 season. This drop was also recorded on the other two farms and may have been due to ‘seasonal’ effects. The southern Oscillation Index (S.O.I.) for the period leading up to breeding was at one of its lowest levels (average of –18 units from May to October 1997). The influence of season (including S.O.I.) on nesting has been reported elsewhere (McClure et al., 2000). From 1995/6 the trend for farms B and C has been steadily increasing. This may be due to improved management of breeders, or breeders reaching optimal breeding age. Apart from their own farm-bred breeder animals, farmers have no accurate idea about the age of their breeders. The vitamin supplement trials began in April 1998 and on these particular three farms, approximately half of the breeding animals would have received the supplement. While overall farm fertility rates have improved in the two seasons since supplementing began, results from the ‘paired’ groups selected on each farm did not show any consistent differences between the supplemented and non-supplemented animals in either size of nest or in banding rates. On farms A and C the groups selected for the study each had substantially higher fertility rates (generally above 90%) than for the rest of the farm and there may not have been a ‘problem’ in these groups.

24
Perhaps it takes more than 1-2 years for vitamin benefits to be expressed in improved fertility rates. The trial is still continuing on the five farms and it will be interesting to look at the results for the 2000/01 and 2001/02 seasons. Some farmers have indicated that they will continue to use supplemented feed for their breeding colonies after the research has finished, as an ‘insurance’ policy even if benefits cannot be scientifically proven. Each extra hatchling is worth $35 to a farmer, so even a small increase in hatchlings (either due to larger nest sizes, or increased fertility rates, or both) would make the exercise of adding supplement to diets worthwhile. To provide supplemented feed to a breeding ‘pair’ costs $37 in basic ingredients, plus there are extra labour costs involved in adding the supplement to individual pieces of meat. Another issue, not currently under research, is the possibility that hatchlings produced from supplement fed adults may be healthier and less likely to become ‘runts’ or die early. Mortality rates for the first year can be in excess of 50% on some farms and even 20% on farms with best environments for the young animals (Hutton et al., 1993). References Elsey RM, Joanen T and McNease L (1994) Captive breeding of alligators and other crocodilians.
Proceedings of the 2nd Regional meeting of the Crocodile Specialist Group. Darwin, Australia March 1993.
Hutton JM and Webb GJW (1994) The principles of farming crocodiles. Proceedings of the 2nd Regional meeting of the Crocodile Specialist Group. Darwin, Australia March 1993.
Lance VA and Elsey RM (1998) Physiology of reproduction and captive breeding in the American alligator. Proceedings of the 14th working meeting of the Crocodile Specialist Group. Singapore July 1998.
McClure G and Mayer R (2000) Factors influencing nesting of Crocodylus porosus on a Queensland farm. In ‘Crocodile Biology and Evolution’, Surrey Beatty and Sons, eds. G Grigg, F Seebacker and C Franklin, 256-261.
Mayer R, Bloomfield R and Davis B (1997) CROCTEL. Crocodile Research Bulletin Vol. 2. Queensland Department of Primary Industries publication, 90-98.
Staton MA and Vernon BP (1991) Formulated crocodile feeds. Proceedings of the Intensive Tropical Animal Production Seminar, Townsville, 239-248.
25
4.2 Husbandry
4.2.1 Stocking Densities for ‘Grower’ Crocodiles
Introduction A literature search has found no published research in the area of optimal stocking rates for ‘grower’ sized animals for any species of crocodile or alligator. This was confirmed during study tours to the USA, Argentina, Singapore, South Africa and Zimbabwe, where it was ascertained that research workers in these countries were not engaged in any research on ‘grower’ sized crocodiles. This is probably because larger sized animals require more expansive, costly experimental facilities for properly replicated research. Research on stocking density has been carried out only on hatchling and hatchling size animals reared in small tanks. In nutrition research for American alligators (Joanen et al., 1976), a stocking density of 0.3m2 per animal was used for animals from hatching to one year of age, when animals ranged from 4 to 5 kg in weight. Then, from age 12 to 26 months, stocking density was reduced to 0.6m2 per animal and the alligators weighed an average of 19kg at the conclusion of the study. However it is generally acknowledged that alligators are much less aggressive in nature than the saltwater crocodile. Meetings between Australian crocodile farmers and researchers were held (Townsville Sept.1996 and Feb. 1997) to discuss information gathered from a study tour to the USA by R. Mayer and a representative of the Queensland farming industry. The main purpose was to design an optimal, controlled-environment research facility for grower sized crocodiles. Opinions were sought on the key issues of: • minimum number of animals that could be reared together to give a response representative of
larger, commercial scale groups
• minimum pen floor area that should be provided for grower animals when they reach 2-3 years of age (allowing for the probability that research advances in areas such as nutrition, handling and environment will increase the size of such animals to a size larger than is currently achieved).
Consensus of opinion was that minimum numbers of 18 animals in each ‘treatment’ group would be necessary and that a floor area of 1m2 per animal should be allowed for. (Both of these may prove to be ‘conservatively’ high and densities can be subsequently manipulated for individual experiments.) Consequently, the research facility was constructed to contain 12 rooms, each with floor area of 18m2. After deliberations on alternative designs for actual pens, a design was adopted and a ‘grower’ shed was subsequently constructed in Townsville adjacent to the ‘hatchling’ research complex. Technical details on the grower shed are contained in an RIRDC report (Mayer, 1998). These initial experiments on rearing densities for grower crocodiles were regarded as vital ‘bench-mark’ work for any research involving grower animals. Conducting experiments at sub-optimal densities can give misleading or unrepresentative results. Experimental Details Because of the large range in size of individual animals at the start of each experiment, animals were divided into two ‘size classes’, S/M and M/L. Animals were allocated to various densities within these two size classes on the basis of similar proportional representation from clutches (as much as possible) and also so that each group had the same average and range in liveweights. Because of the temperature at which these research animals had been incubated on the farms, most were males. However, among the 1997 hatchlings, there were sufficient females to form ‘observational’ groups of 15 S/M and 11 M/L ‘females only’ in two rooms of the complex. The clutch representation of these
26
groups was different from the others and the average starting weight for the M/L group was slightly lower. Details of each experiment are presented in the following Table. Table 1. Experiment Details
Experiment 1 2
Cohort (year hatched) 1997 1998 Duration 30/11/98 – 4/3/99 15/4 – 19/7/99 Age of animals (months) 19-22 12-15 Av. starting weight(g) of S/M animals 1660 400 Av. starting weight(g) of M/L animals 3230 (3020 females**) 1030 Densities* for S/M groups 10, 16, 20, 25, 30 18, 29, 40 Densities* for M/L groups 5, 10, 15, 20, 25 18, 30, 40 ‘Extra’ treatments 15 S/M, 11 M/L females
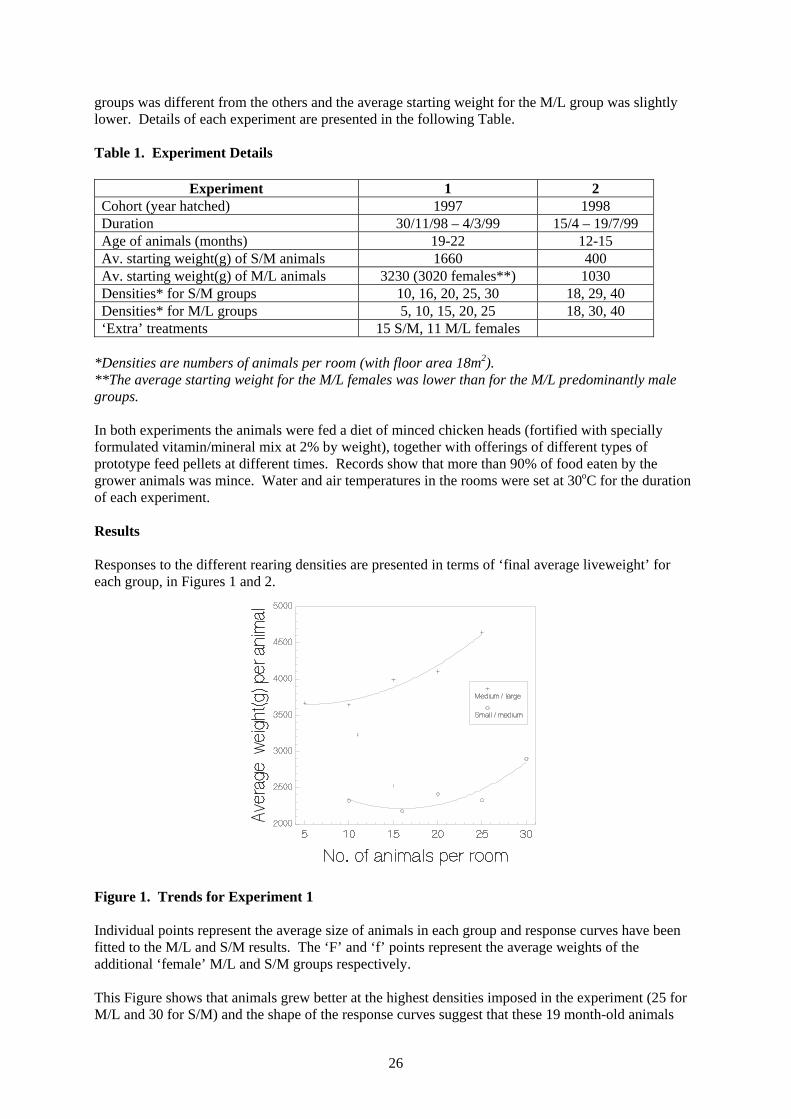
*Densities are numbers of animals per room (with floor area 18m2). **The average starting weight for the M/L females was lower than for the M/L predominantly male groups. In both experiments the animals were fed a diet of minced chicken heads (fortified with specially formulated vitamin/mineral mix at 2% by weight), together with offerings of different types of prototype feed pellets at different times. Records show that more than 90% of food eaten by the grower animals was mince. Water and air temperatures in the rooms were set at 30oC for the duration of each experiment. Results Responses to the different rearing densities are presented in terms of ‘final average liveweight’ for each group, in Figures 1 and 2.
Figure 1. Trends for Experiment 1 Individual points represent the average size of animals in each group and response curves have been fitted to the M/L and S/M results. The ‘F’ and ‘f’ points represent the average weights of the additional ‘female’ M/L and S/M groups respectively. This Figure shows that animals grew better at the highest densities imposed in the experiment (25 for M/L and 30 for S/M) and the shape of the response curves suggest that these 19 month-old animals

27
might have grown even faster if reared at densities higher than these. There was a suggestion that the M/L female group grew more slowly than M/L male groups with about the same numbers, although the female group started at an average 210g lighter in bodyweight. From the results of Experiment 1, a second experiment was conducted using higher densities. The animals comprised 1998 hatchlings which had just been moved from the ‘hatchling’ research facility as 12 month old animals. Consequently they were seven months younger and only one-third the size of the 1997 animals used in Experiment 1. In order to achieve these larger sized groups, only six groups of animals were possible (three S/M and three M/L) which utilised only half of the ‘grower’ rooms. The results of Experiment 2 are presented in Figure 2.
Figure 2. Trends for Experiment 2 This Figure shows that growth in the S/M groups did not vary much between the densities, while among the M/L groups the best density seemed to be at the middle rate (30 per room, or 0.6m2 floor space per animal). However, with just three observation points for each size class, no statistical analysis of patterns was possible. When animals were measured (for lengths, weight) at the end of each experiment, note was made of any evidence of skin damage (especially on the valuable ‘belly’ area). Negligible damage was noted in Experiment 2. The incidence of damage in experiment 1 (the older, larger animals) is presented in Figure 3.
Figure 3. Skin Damage Incidence in Experiment 1 (the ‘F’ and ‘f’ values indicate the values for the ‘female only’ groups)

28
In the S/M groups, only one group recorded significant damage (at density of 20). In the M/L groups, more damage tended to occur among the lower density groups. It should be cautioned that percentages based on small numbers can be unreliable. Discussion A detailed review of literature published on the effects of density on hatchling crocodiles (hatchling to 12 months old) is presented in Crocodile Research Bulletin Vol.2 (Mayer, 1997). In essence, most experiments failed to establish any significant growth response patterns to varying rearing densities. Experiments on eight month old hatchling C. porosus (in the ‘hatchling’ research facility) showed that for M/L animals there was a slight improvement in growth as densities increased to 30-35 animals per tank (floor area 3.9m2). Among S/M animals, highest growth was achieved at the lowest densities. Of course it should be noted that at this young age most animals tend to ‘crowd together’ under hide-boards, so the ‘effective’ density is much higher. Behaviour of ‘grower’ animals in rooms without hide areas is different and ‘dominance’ seems to relate to individual sections of a room, for example in the separate land and water environments. In some groups, more noticeably those with smaller numbers, video surveillance has shown a single dominant animal can tend to ‘claim’ the water, chasing all other animals out of the water. In other rooms, the smallest animals were often seen lying in isolation in land corner areas or beside the door (perhaps the ‘least favourable’ areas). One explanation for the response patterns of the M/L groups in Figure 1, is that at densities lower than 20 per group, individual dominant animals might be trying to stake out preferred individual ‘territory’ for their exclusive use. This behaviour results in fighting among animals which was evidenced by the patterns of increased skin damage in these smaller groups of M/L animals (Figure 3). At higher densities such as those imposed in the second experiment, video observations showed that the animals were more evenly spread out and animals seemed content to be lying in close contact (eg lying on top of each other on the land and stacked two or three deep in the water). This is corroborated by the growth responses in Figure 2 and the low incidence of skin damage in this experiment. Responses among the S/M groups were generally less pronounced. Apart from a suggestion of better growth at a density of 30 in Experiment 1, all other groups performed about the same. Perhaps an optimal density has not yet been reached. Generally there was a lower incidence of skin damage among these S/M groups than among M/L groups. In Experiment 1, the S/M animals (over all densities) increased an average of 50% in bodyweight over the three month period, compared with an increase of only 25% for the M/L groups. This is contrary to other experiments we have run on environmental and nutritional factors, where the M/L animals have performed relatively better than the S/M ones. The most likely explanation for the performance in Experiment 1 M/L animals is in the increased skin damage – these animals suffered from more aggressive interactions between animals. This pattern was reversed in Experiment 2 (involving younger animals at higher densities), where the S/M groups gained 34% compared with M/L groups which gained 47%. The concept that groups of ‘females only’ might perform better than predominantly male groups, was not substantiated. While the incidence of skin damage in these groups was low, their growth rates were not better than the male groups. Implications for Industry On commercial farms grower crocodiles are generally reared in semi-open pens much larger than the 18m2 of the research facility. Pens are often larger than 100m2 and some have multiple water areas. The animals rarely spread out evenly over land and water areas and can concentrate in favoured water

29
and land spots. The amount and type of animal-to-animal interaction may vary from monitored research-sized pens to these larger commercial pens. Research on younger C. porosus (Webb et al., 1994) indicates that the effect of ‘available space’ is important and that at similar densities animals benefit from having a larger ‘total space’ in which to live. Conversely there may be benefits with smaller pens (temperatures more easily regulated, hygiene and disease control) as suggested by researchers working with C. niloticus (Hutton et al., 1987). These researchers stated that ‘in order to reduce stress generally the Department currently favours small, outdoor, concrete pens, each about 3 x 3 m and stocked with 50 hatchlings. These are considered superior to the larger pens holding 200-300 animals at the same density’. Directly adopting research from smaller sized pens may not be optimal for a particular farming operation. The results from the two experiments would suggest that an optimal stocking density for animals between 12 and 22 months of age is around 0.6m2 floor area per animal, which would translate to 167 animals in a commercial pen of 100m2. Most farmers would currently be stocking at densities higher than this, due to the high costs associated with providing housing for the grower animals. The research has shown that ‘understocking’ may introduce more problems (due to animal behaviour) than ‘overstocking’. In fact, some farmers are seriously considering providing separate growing areas for individual grower animals to prevent animals fighting and damaging the valuable skins. This was one suggestion brought back from a study tour of alligator farms in the USA (Mayer et al., 1996). Australian farmers should consider conducting their own ‘observational’ studies, where they vary the stocking density in different pens and note the responses (food consumption, growth rates, skin damage). The most important implications of this research into stocking rates for growers is that other research (on nutrition, environment) can now be undertaken in the research facility at a density of 30 animals per room without compromising results. References Hutton JM and Van Jaarsveldt KR (1987) Crocodile farming in Zimbabwe in Wildlife Management :
Crocodiles and Alligators (GWJ Webb, SC Manolis and PJ Whitehead eds) Surrey Beatty and Sons, Sydney pp323-327
Joanen T and McNease L (1976) Culture of immature American alligators in controlled environmental chambers. Proceedings 7th Annual Workshop World Mariculture Society pp201-211
Mayer R and Freeman P (1996) Study tour of alligator facilities in Florida and Louisiana. Report presented to Rural Industries Research and Development Corporation p15
Mayer R (1997) Effects of rearing hatchling crocodiles at different densities. Crocodile Research Bulletin Vol. 2 pp30-45
Mayer R (1998) Designing a research facility for grower size crocodiles. RIRDC Publication No 98/20
Webb GJW, Manolis SC, Otley B and Heyward A (1992) Crocodile management and research in the Northern Territory : 1990-92. Proceedings of the 6th Working Meeting of the IUCN Crocodile Specialist Group. Victoria Falls, Zimbabwe, Sept. 1992.

30
4.2.2 Varying Water Levels for Hatchling Crocodiles Introduction Crocodile and alligator farming practices around the world vary considerably in the issue of ‘how much water to provide for animals’. At the one extreme, an alligator farm in Louisiana USA (which works with the University of Southern Louisiana) uses pens completely flooded to a depth of 60cm. The heated water is filtered and re-circulated many times before being discharged and food pellets are automatically dispensed onto food platforms just above the water. At the other extreme, crocodile farmers in Zimbabwe provide minimal amounts of water in shallow troughs for their C. niloticus. The most common practice currently used in the Australian crocodile industry is to have approximately equal areas of land and water areas in hatchling rearing tanks. The aim of the current research was to see how hatchling crocodiles at a range of different ages respond to different water levels. Experimental Details The rearing tanks used in these experiments have been described in detail in Crocodile Research Bulletin No.1 (Peucker et al., 1995). Basically they are rectangular with a gently sloping floor along the main axis. For hatchling animals up to the age of 12 months, hide-boards are suspended just above the water at one end of each tank. The ‘standard’ has been to have water filled to cover half the floor area. This results in a maximum water depth of 16cm. In previous studies carried out in these tanks, animals of all ages up to one year of age were observed (by video surveillance) to stay more in the heated water than on the land area or on top of the hide-boards. Also, when less that two months of age, animals tend to hide under the boards. These behaviour traits effectively create very high animal density in small areas of the tank. It was hoped that by providing a greater area of water, animals might disperse more evenly and avoid any problems associated with high ‘local’ density. Three experiments were carried out on water levels, using hatchlings at different ages. The standard research practice of firstly dividing the animals into two size classes termed S/M and M/L and then forming ‘equal’ groups of animals within these grades on the basis of clutch and weight was employed in experiment. Each experiment involved imposing three different water levels : 30%, 50% and 80 or 100% of floor area for each size class. Hence, there were six treatment combinations. These were each replicated twice (randomly assigned to tanks), except for the second experiment which was restricted to 10 available tanks. In this experiment the 50% treatments were applied to just one tank each. The usual management practices for feeding and cleaning were carried out. Animals were fed fortified chicken and kangaroo mince daily from Monday to Friday and tanks emptied out and refilled with clean, warm water several hours after each feeding. Specific details of the treatments in each experiment and the age and size of animals at the start of each experiment are listed it Table 1. Table 1. Details of the Experiments
Exp. Period Animal age (weeks)
Water levels Size classes (initial av. weights, density)
1 9-11/1997 20 - 29 30, 50, 80 S/M(189,22) M/L(406,17) 2 2-5/1998 43 - 55 30, 50, 100 S/M(527,25) ML(1059,19) 3 10-12/1998 27 - 35 30, 50, 100 S/M(161,18) ML(417,13)

31
Results Responses to the water level treatments for each size class in each experiment are shown in Figure 1. The response variable is ‘average final (fasted) liveweight’ of animals in each tank. Each tank average has been plotted as a separate point on the graph and lines have been drawn connecting tank means for each treatment.
Figure 1. Animal Liveweight Response to Water Levels for Each Size Class The response among the S/M groups in experiments 1 and 3 (the smallest animals considered in the experiments) was very flat, indicating that there was negligible effect of water level on growth. There were three other groups (S/M in Experiment 2 and M/L in Experiments 1 and 3) which started at approximately the same size of 400 to 500g (see Table 1). One of these (M/L in Experiment 1) also showed a very flat response, while the other two showed an increase from 30 to 50% water and a lesser increase from 50 to 100%. The M/L groups in Experiment 2 began twice as heavy as other groups (across the three experiments) and showed quite a different pattern in final weight, especially at the 100% water level. No definitive assessments were made on skin damage when animals were being measured but it was noted that the animals in Experiment 2 (in both S/M and M/L groups) exhibited considerable signs of bite marks and scratches, especially in the 30% and 100% water levels. Over the weekends when no cleaning was carried out, animal waste build-up (especially for the larger M/L groups in Experiment 2) caused the water in the 30% tanks to become quite polluted. The confounding effects of water volume and water quality were inseparable in these studies. Discussion Experience over eight years and many experiments has shown that animals are less aggressive and much easier to catch when they are submerged. Perhaps they feel ‘safer’ from natural dangers. There have also been reports from farmers that during periods when cloudy water has been used in pens (caused by heavy rain washing coloured soil particles into storage dams), animals seem to fight less. This response was anticipated by eminent US alligator expert T. Joanen during a study trip (Mayer et al., 1996). The suggestion was that ‘colouring water might be beneficial as an alternative to providing greater volumes of water in alligator pens, since it would reduce the amount of animal eye-to-eye contact’.

32
Since five out of the six groups showed very little response to differing water levels, it seems that hatchling crocodiles adapt well to a wide range of water:land ratios. The one group which did exhibit differences showed evidence of substantial fighting among some of the groups. This issue probably had a greater influence on final liveweight than did the different water levels. It had been thought that providing 100% water would have reduced fighting but the highest incidence of skin damage was noticed in both 30% and 100% tanks. This supports the idea that crocodile experiments on any issue need to be repeated more than once, because of the specific and dramatic ways in which each particular group of animals interact. Providing greater volumes of water in tanks automatically improves the quality of water, because it dilutes the animal waste and uneaten food scattered in the water. In both of the overseas examples presented in the introduction the water was much ‘dirtier’ than the water in the current experiments. Farmers often comment that the dominant animals in breeding areas seek out the source of the best quality water. However although animals obviously prefer good quality water they seem to be able to cope very well with poorer quality water. This has important implications for farmers and the methods they use to provide water to their hatchling animals. References Mayer R and Freeman P (1996) Study tour of alligator facilities in Florida and Louisiana. Report
presented to Rural Industries Research and Development Corporation p23 Peucker S and Johnson S (1995) Crocodile facilities at OVL. Crocodile Research Bulletin Vol.1 June
1995 pp11-13
4.2.3 Feeding Frequency for Hatchling Crocodiles – The Effects on Growth Rates and Economic Implications Summary The trial served two purposes, firstly to compare growth rates of young crocodiles under different feeding strategies and secondly to examine the costs associated with those strategies. Animals fed the highest number of times achieved the best growth rates and cost the most to feed. There was little difference between four and five day feeding in the M/L group in terms of length and cost but an increase of 14 percent in weight gain in the group fed five days. In the S/M group there was little difference between three and four day feeding in regard to bodylength, with the three day fed animals gaining more bodyweight and costing an extra 15 cents per crocodile reared. During the trial the small-medium groups out-performed their larger siblings and were cheaper to feed. Background Little information is available on the cost of rearing commercial crocodiles to harvest in Australia. Perhaps this is because crocodile farming is a relatively new industry and producers have higher priority issues to address. Nonetheless commercial crocodile production is about profit and knowing your costs will assist with profit margins. Two types of costs are associated with intensive livestock production namely variable and fixed costs. Variable costs include feed, hatchlings, medication, electricity and casual labour costs. These are costs which can be influenced on a daily basis by better husbandry. For example mortality rates can be varied to see how this influences the economic performance of your farming operation. Variable costs can also be influenced by other husbandry practices such as changes in feeding strategies. Superficially a change in feeding strategy may not seem to influence growth or economic performance but the results of work presented in this paper suggest otherwise.

33
Fixed costs cover items such as depreciation, telephones, postage, vehicle registration, insurance, and permanent labour. These items will largely remain constant despite improvement in husbandry practices. Fixed costs cannot be influenced on a daily basis in the same way variable costs can, so they tend to have less emphasis placed on them by producers. This is not to say they are of less importance; the message is they are not influenced by the daily events of farm practices. Commercial crocodile producers employ a range of feeding strategies and some examples are presented in Table 1. The table shows just how diverse these practices can be on farms. Researchers noted this diversity of feeding strategies and set out to determine if they delivered different growth rate responses and, if they did, what the economic implications for these differences were. It should be pointed out that the different strategies in Table 1 were not the subject of the trial. The trial employed a slightly different strategy to those used by commercial producers. However, the application of an economic analysis shows just how financially different strategies can be which makes selecting the appropriate strategy for a farm an important exercise. Table 1. Different Commercial Feeding Strategies Used on Farms for Crocodiles to Harvest Size
Feeding strategy
Number of days fed per week
Number of feeds per day
Duration of strategy (months)
Changes to Strategies after 3-6
months 1 5 consecutive days 1
6 Nil
2 5 consecutive days 2
4 3 times per week to harvest
3 2 days miss a day, 2 days
1 6 every second day to harvest
4 6 or 7 days 1 3 5-6 days for month four, drop one day then every second day
Evaluating the effects of different feeding regimes on animal growth This trial consisted of 186 eight month old crocodiles. Crocodiles were allocated on size and clutch on the 14/12/98 with the trial commencing on 4/1/99. The actual trial lasted 47 days with the aim of evaluating the effects of different feeding regimes on animal growth. Crocodiles were fed two, three, four or five days per week (see Table 2). Only the three and five day feeding regimes were replicated in this trial. The feed consisted of 70 percent kangaroo meat, 30 percent chicken heads and supplemented with a two percent vitamin premix. The wide range of individual bodyweights, necessitated the animals being graded into two size classes (S/M and M/L). The price paid for feed during this trial was 90 cents/kg for chicken heads, $1.10/kg for kangaroo meat and the vitamin premix costing one cent per gram. The S/M groups were made up of 18 crocodiles per tank representing a stocking density of one animal/ 0.22sq m with the M/L group having 13 crocodiles per tank, representing a density of one animal /0.3 sq m. The water and air temperatures were kept at 32°C for the duration of the trial.

34
Table 2. Details of Trial Design
Days Fed Room Tank Size Monday Tuesday Wednesday Thursday Friday
A S/M 1 B M/L
b
b
b
b
b
A M/L 2 B S/M
b
b
b
b
A M/L 3 B S/M
b
b
A S/M 4 B M/L
b
b
b
A S/M 5 B M/L
b
b
b
b
b
A M/L 6 B S/M
b
b
b
Results Food consumption Feed consumption figures have been calculated on a ‘per tank’ basis and converted to average figures per animal per day (over the whole 10-week period between consecutive measurings). The response patterns with respect to feeding frequencies are shown in Figure 1.
Figure 1. Average Amounts of Food Consumed by Animals in Each Size Class for Each
Feeding Regime The increasing responses to feeding frequency for both size classes in Figure 1 suggest that the animals on the reduced feeding frequencies were unable to completely compensate for reduced feeding. For instance, the average food eaten per feed (which includes wastage) for the S/M animals changed from 4.9g for animals fed twice each week to just 3.6g for animals fed five times each week. The M/L animals which began the trial an average 2.5 times heavier than the S/M animals, ate on average 3.7g more per day which was 26% more than eaten by their smaller siblings.

35
Food Conversion Efficiency Food Conversion Efficiency (FCE) figures, also calculated on a whole tank basis, were determined by dividing the total amount of food eaten by animals in a tank (on a wet-weight basis) by the overall increase in (fasted) liveweight by all animals in that tank over the course of the trial. The ‘food eaten’ figures were calculated by adding the amounts of food put out on feeding trays at each feeding, and subtracting any food left uneaten on the trays. No attempt was made to collect uneaten food particles from the water or scattered on the land areas in each tank. Hence the estimates of ‘food eaten’ will be over-estimated, perhaps by as much as 10%. The effects of different feeding frequencies on FCE are shown in Figure 2.
Figure 2. Food Conversion Efficiencies for the Groups of Animals in Each Tank For the S/M groups of animals there was no significant effect of different feeding frequencies on FCE, and the average FCE across all frequencies was 14.4%. For the M/L groups there was a significant increase in FCE with increasing frequency which changed dramatically from only 5% at two feeds per week to 15% at five feeds per week. Overall, the S/M animals had higher FCEs than did the M/L animals. There seems to be no readily referenced literature about growth rates or food conversion rates for intensively reared eight month old C. porosus. Most research has been done on hatchlings up to four months of age. One such experiment, on C. porosus fed fish, pork or beef diets (Garnett et al., 1986) reported food conversion rates (converted to a wet weight basis) of 17, 34 and 37% (over the four month period from hatching) for the mono-diets of fish, beef and pork respectively. Combining results obtained from two separate experiments on C. johnstoni aged between six and eleven and half months of age Webb et al. (1983) found that there was no significant difference in growth rate between animals fed daily and others fed five days per week. The figures from the current study using a diet of kangaroo meat and chicken heads as the diet are generally lower than these figures. Previously reported research from the crocodile complex involved five month old crocodiles fed a range of beef products and resulted in food conversion rates of 25-42% (Mayer, 1995A). Another experiment on seven-month old animals fed a mixture of chicken heads, beef and kangaroo meat (Mayer, 1995B) produced rates of 7-21% with the smallest graded animals producing the worst conversion. This is opposite to the findings of the current trial, where the S/M animals produced the best conversions. Another experiment (Mayer et al., 1997) on ‘rearing densities’ for ten month old
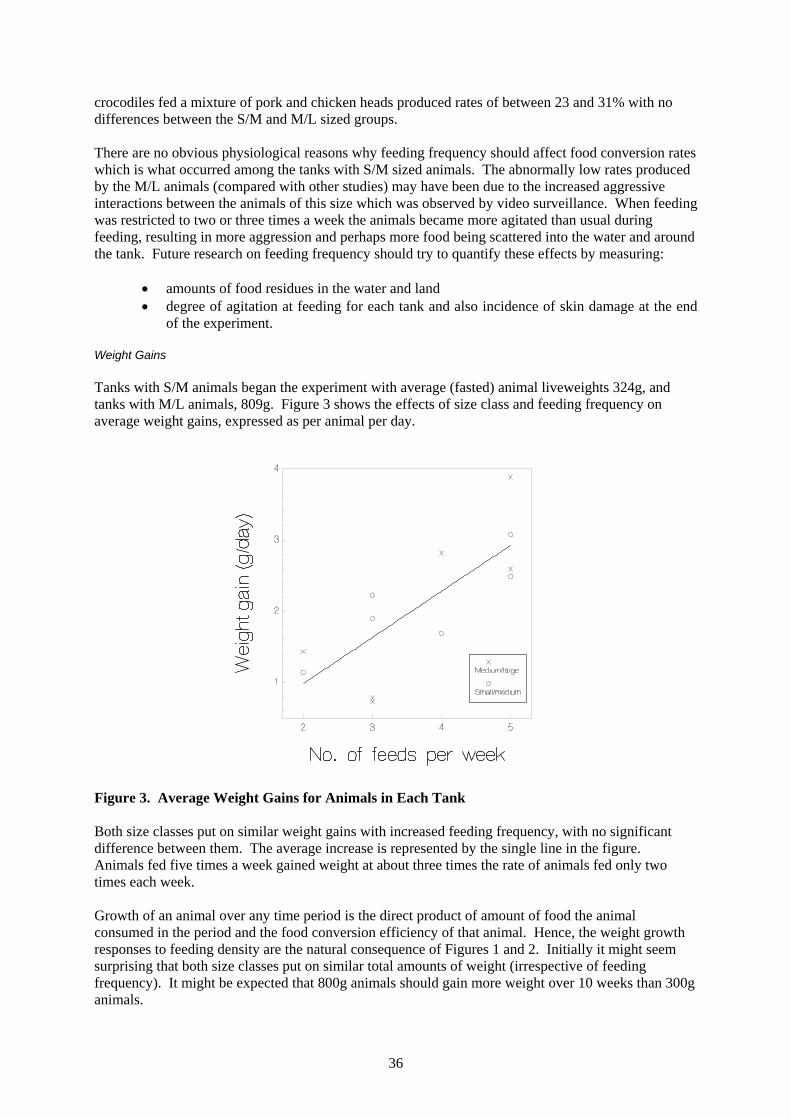
36
crocodiles fed a mixture of pork and chicken heads produced rates of between 23 and 31% with no differences between the S/M and M/L sized groups. There are no obvious physiological reasons why feeding frequency should affect food conversion rates which is what occurred among the tanks with S/M sized animals. The abnormally low rates produced by the M/L animals (compared with other studies) may have been due to the increased aggressive interactions between the animals of this size which was observed by video surveillance. When feeding was restricted to two or three times a week the animals became more agitated than usual during feeding, resulting in more aggression and perhaps more food being scattered into the water and around the tank. Future research on feeding frequency should try to quantify these effects by measuring:
• amounts of food residues in the water and land • degree of agitation at feeding for each tank and also incidence of skin damage at the end
of the experiment. Weight Gains Tanks with S/M animals began the experiment with average (fasted) animal liveweights 324g, and tanks with M/L animals, 809g. Figure 3 shows the effects of size class and feeding frequency on average weight gains, expressed as per animal per day.
Figure 3. Average Weight Gains for Animals in Each Tank Both size classes put on similar weight gains with increased feeding frequency, with no significant difference between them. The average increase is represented by the single line in the figure. Animals fed five times a week gained weight at about three times the rate of animals fed only two times each week. Growth of an animal over any time period is the direct product of amount of food the animal consumed in the period and the food conversion efficiency of that animal. Hence, the weight growth responses to feeding density are the natural consequence of Figures 1 and 2. Initially it might seem surprising that both size classes put on similar total amounts of weight (irrespective of feeding frequency). It might be expected that 800g animals should gain more weight over 10 weeks than 300g animals.
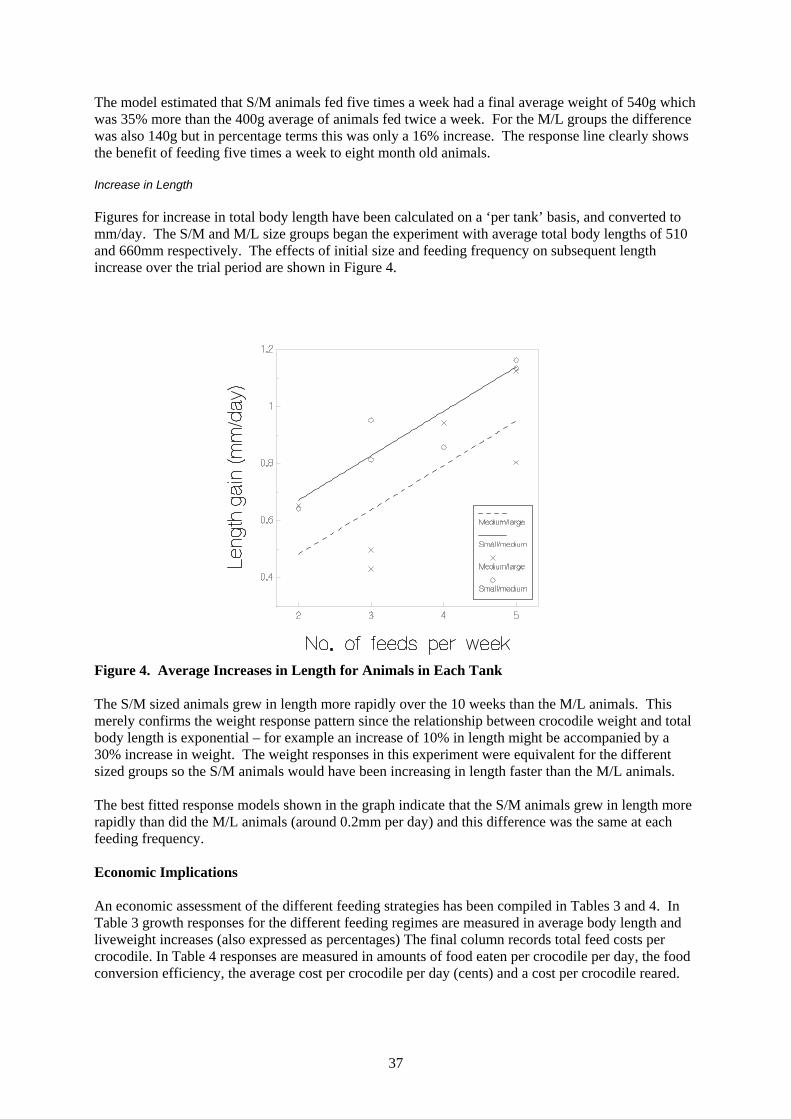
37
The model estimated that S/M animals fed five times a week had a final average weight of 540g which was 35% more than the 400g average of animals fed twice a week. For the M/L groups the difference was also 140g but in percentage terms this was only a 16% increase. The response line clearly shows the benefit of feeding five times a week to eight month old animals. Increase in Length Figures for increase in total body length have been calculated on a ‘per tank’ basis, and converted to mm/day. The S/M and M/L size groups began the experiment with average total body lengths of 510 and 660mm respectively. The effects of initial size and feeding frequency on subsequent length increase over the trial period are shown in Figure 4.
Figure 4. Average Increases in Length for Animals in Each Tank The S/M sized animals grew in length more rapidly over the 10 weeks than the M/L animals. This merely confirms the weight response pattern since the relationship between crocodile weight and total body length is exponential – for example an increase of 10% in length might be accompanied by a 30% increase in weight. The weight responses in this experiment were equivalent for the different sized groups so the S/M animals would have been increasing in length faster than the M/L animals. The best fitted response models shown in the graph indicate that the S/M animals grew in length more rapidly than did the M/L animals (around 0.2mm per day) and this difference was the same at each feeding frequency. Economic Implications An economic assessment of the different feeding strategies has been compiled in Tables 3 and 4. In Table 3 growth responses for the different feeding regimes are measured in average body length and liveweight increases (also expressed as percentages) The final column records total feed costs per crocodile. In Table 4 responses are measured in amounts of food eaten per crocodile per day, the food conversion efficiency, the average cost per crocodile per day (cents) and a cost per crocodile reared.

38
Table 3. Average Length and Bodyweight Increase and Costs Incurred for the Four Different Feeding Strategies over 10 weeks.
No. of
days fed per week
Group size
Ave. length increase per crocodile - mm
(% increase)
Ave. weight gain per
crocodile – g (% increase)
Cost per crocodile reared ($)
2 M-L 47 (7%) 103 (13%) 1.80 3 M-L 33 (5%) 55 (7%) 1.87 4 M-L 68 (10%) 203 (25%) 2.59 5 M-L 69 (10%) 233 (51%) 2.66
2 S-M 46 (9%) 82 (25%) 1.06 3 S-M 64 (12%) 148 (46%) 1.49 4 S-M 62 (12%) 122 (37%) 1.64 5 S-M 83 (16%) 200 (39%) 2.19
Table 4. Average Costs of the Four Different Feeding Strategies over 10 weeks.
No. of days
fed per week
No. of crocodiles
Group size
Feed eaten grams/
crocodile/day
Food Conversion
Efficiency (%)
Average food cost/ crocodile/ day (cents)
Cost per crocodile
reared ($)
2 13 M-L 20 8.2 2.5 1.80 3 26* M-L 21 5.8 2.6 1.87 4 13 M-L 29 12.7 3.6 2.59 5 26* M-L 30 15.0 3.7 2.66
2 18 S-M 12 11.8 1.5 1.06 3 36* S-M 17 16.1 2.1 1.49 4 18 S-M 18 13.2 2.3 1.64 5 36* S-M 24 14.5 3.0 2.19
* indicates that the three and five day treatments were replicated hence they had double the number of animals Discussion Growth rates of crocodiles are highly variable and are influenced by a number of factors which include clutch, genetics, diet, environment/management and behaviour. Farmers can have some control over some of these influences by using good husbandry practices. This trial examined the effects on the growth rates of young crocodiles using four different feeding strategies, as well as looking at the cost per animal reared during the trial for each feeding strategy. Feeding strategies employed by farms have a direct influence on cost of production. Identifying the optimal feeding strategy that minimises feeding costs, reduces labour input and produces crocodiles that grow at acceptable rates will improve farm profitability. Tables 3 and 4 shown above generally reflect what would be considered obvious; that the biggest increases in bodylength and weight gain were achieved at the highest feeding frequency. This strategy cost the most to feed. Hutton et al., (1993) suggested that care is need when interpreting the growth rates of crocodiles. The use of high fat diets on farms may in fact allow animals to gain weight without actually growing in length.
39
In this trial, animals in the S-M group out performed their larger siblings in average length increases, they had better food conversion efficiencies (except for the five day feeding) and were cheaper to feed over the different feeding strategies. The four and five day feeding strategies resulted in the largest increases in average body length in both crocodile size classes, with a large difference in the S-M group between four and five day feeding groups. This group averaged 83 mm per animal in bodylength gained over the trial. Table 3 shows there was little difference between the average bodylength gained between the four and five day feeding strategy for the M-L group (68 and 69mm) and three and four day feeding for the S-M group (64 and 62mm). The M-L group on the three day feeding strategy performed the worst of all the groups recording the lowest in both average bodylength increase and average weight gain (33mm and 55 gms). Aggressive behaviour at feeding time from one animal in this group that was observed on video and may explain the lowest increase in bodylength and weight gain result from this group. In comparison, the three day feeding in the S-M group performed better than the four day group gaining slightly more bodylength than the four day feeding but also having a higher average body weight gain at the end of the trial. There was very little difference in bodylength gain and cost per animal reared between feeding four or five days a week for the M-L group of animals. A one millimetre per crocodile difference in length which, related to an extra cost of seven cents per animal reared over the time period. There was a greater difference between the three and four day feeding strategies of the same size group, with an increase in bodylength of 35 millimetre per crocodile representing, an extra 72 cents per crocodile reared over the same period. Interestingly the reverse was found in the S-M group were the largest differences occurred between the four and five day feeding strategies and little difference between the three and four day feeding strategy but with the four day feeding costing an extra 15 cents per animal over the trial period. The difference between the four and five day feeding strategy was an increase of 21 millimetres per crocodile gained representing an extra cost of 55 cents per animal reared over the trial period. References Garnett ST and Murray RM (1986) Parameters affecting the growth of the estuarine crocodile
Crocodylus porosus in captivity. Aust. Journal of Zoology 34, 211-23.
Hutton, J.M. and Webb G.J.W. 1993 The Principles of Farming Crocodiles. Proceeding of the 2nd Regional meeting of the Crocodile Specialist Group. Darwin Northern Territory. Australia.
Mayer RJ (1995A) Feed trial on five month old crocodiles. Crocodile Research Bulletin Vol.1 Queensland Department of Primary Industries publication, 30-40.
Mayer RJ (1995B) Effects of grading on seven month old crocodiles. Crocodile Research Bulletin Vol.1 Queensland Department of Primary Industries publication, 41-52.
Mayer RJ and Peucker S (1997) Effects of rearing juvenile crocodiles at different densities. Crocodile Research Bulletin Vol.2 Queensland Department of Primary Industries publication, 30-45.
Webb GJW, Buckworth R and Manolis S.C. 1983 Crocodylus johnstoni in a Controlled-Environment Chamber: a Raising Trial. Aust. Wildl Res. 10 421-32

40
4.2.4 Hide-Boards and Warmer Temperatures for Hatchling Crocodiles Introduction In a review of crocodile farming methods (Hutton et al., 1993) it was recommended that one way of reducing stress among hatchling crocodiles was to provide artificial screens suspended low over water areas of rearing tanks. This was aimed at taking advantage of a hatchling’s natural desire to find cover, under which it feels more secure. Although it was acknowledged that this issue had not been well researched, it was claimed that the method appeared to work in commercial practice. More recent work has been done on this area of shelter for hatchling C. porosus on a commercial farm in the Northern Territory (Riese, 1995). In the first of two experiments, shelter boards were positioned over 15% and 30% of the surface of some rearing tanks while other tanks had no shelter. There was a tendency for growth rates to increase with increasing levels of shelter but the results were not statistically significant. In a follow-up experiment, three levels of shelter (nil, 30%, 60% cover) were evaluated. Again the same pattern was observed but again was not significant because of the large variation experienced between statistical replicates (up to 300%). This ‘imprecision’ in results was attributed to two potential causes – • insufficient control of pen temperatures throughout the area (ambient air temperatures fluctuated a
lot during each 24 hour period and were not uniform over the whole area)
• the different responses of individual clutches to levels of shelter.
The specially designed crocodile research facilities have been set up in Townsville to minimise the effects of such extraneous influences. Experiments on the effect of water temperature on growth of hatchling crocodiles have shown that optimal temperatures are around 32-34oC. Webb et al. (1990) showed that between hatching and one month of age, C. porosus grew faster at 32oC than at either 30 or 34oC. Lang (1981) reported that at between 0-2 weeks of age (the yolk assimilation period), hatchling C. porosus selected temperatures of between 33.4 and 33.9oC and then from 2-5 weeks, preferred 31.8 to 32.2oC. Previous research involving two month old C. porosus in the current hatchling facility at Townsville indicated that the animals grew more rapidly at 34oC than at temperatures from 26 to 32oC (Mayer, 1995). Hence, it was decided to include a second factor of ‘water temperature’ to the experiment on hide-boards. Experimental Details The research animals available for use in this experiment comprised 275 seven-week old hatchlings from year 1997. Some of these obviously had not initiated feeding and looked poorly. This is not uncommon in commercial situations. Consequently the 25 animals in poorest condition were split off and housed in a special ‘runt’ tank in a separate shed. The remaining 240 animals were graded into two groups, S/M and M/L by liveweight, with the heaviest 102 forming the M/L category and the remaining 138 the S/M. Within each category the animals were arranged into six ‘equivalent’ groups on the basis of clutch and weight (23 in each S/M group and 17 in each M/L group). The average weight per animal in each S/M group was 64g and in each M/L group was 99g. The experiment consisted of suspending 0, 1 or 2 hide-boards in the rearing tanks (covering areas 0, 40, 80% of surface area). Each board was positioned at right-angles to the slope of the floor, so that equal areas of land and water were ‘sheltered’. An additional factor of two water temperatures (32, 34oC) was imposed in a factorial combination with the hide-board treatment. Hence, the final design comprised “2 animal size classes x 3 levels of hide-board x 2 water temperatures” and each of the 12 combinations was randomly allocated to a tank in the hatchling research shed.

41
Air temperature in each room was maintained at 32oC and the ‘standard’ mince diet (70% kangaroo meat, 30% chicken heads, 2% vitamin/mineral supplement) was fed during the 12 week duration of the trial. Amount of food put out on trays and amount left on trays when removed after two hours in the tanks was compared to get an estimate of food eaten by the group. Most of the ‘wasted’ food was seen to be lying in the water and was not eaten before the tank was drained. Feed conversion into liveweight was calculated over the whole period of the trial for each tank (since liveweights were only measured at the start and at the end of the experiment). The calculations were made on a ‘wet’ basis and the moisture content of the mince diet was 83%. Statistical Analysis Because there was no statistical ‘replication’ of the 12 treatments, the third-order interaction (among all three treatments) was used as an estimate of experimental error. Results Animal Behaviour The hatchlings of this young age (seven weeks) were typically shy and scuttled under hide-boards (where provided) whenever the doors to the rooms were opened. Video surveillance showed that the animals did gradually venture out, especially at feeding times but they still spent most of the time under the hide-boards. Measured Responses The 12 individual treatment responses (in terms of average final liveweight of the animals in each tank) are presented in Figure 1.
Figure 1. Growth Response of the Two Graded Size Groups to the Hide-Board and Water
Treatment Temperatures The response trends for the M/L groups were very similar. These animals grew faster when more hide-board shelter was provided at each water temperature and the three groups with 34oC water ended up heavier than the three groups with water at 32oC. The patterns for the S/M groups were not as uniform. At 34oC water there seemed to be a benefit in providing hide-boards while at the sub-optimal 32oC there did not seem to be any real difference whether hide-boards were present or not.

42
The results of statistical analysis of each of the three treatment factors are presented in Table 1. Key response variables analysed were amount of food eaten, relative food conversion efficiency and ultimate liveweight gain. Table 1. Response of Two Size Groups of Animals (S/M = Small/Medium, M/L =
Medium/Large) to 0, 1 or 2 Hide-Boards per Tank in Combination with Two Water Temperatures (32oC, 34oC)
Food consumed
(g/animal/day) Food conversion
ratio Liveweight gain (g/animal/day)
S/M M/L S/M M/L S/M M/L Number of 0 5.5 a* 6.0 a 0.22 a 0.30 c 1.2 a 1.8 b hide- 1 7.3 ab 9.9 bc 0.22 a 0.23 ab 1.6 b 2.3 c boards 2 7.4 ab 10.9 c 0.22 a 0.25 b 1.6 b 2.8 d Water 32oC 6.4 a 8.7b 0.19 a 0.23 b 1.2 a 2.0 b temperature 34oC 7.1 ab 9.1 b 0.25 b 0.29 c 1.8 b 2.6 c
* Within each treatment group (hide-board, temperature) values followed by a similar letter do not differ significantly (p>0.05). In the analysis of ‘food consumed’, the only factors which were statistically significant (p<0.05) were ‘hide-boards’ and ‘animal size class’. The size effect was to be expected since the M/L animals started the trial an average 55% heavier than the S/M animals. Averaged across both S/M and M/L groups, the tanks with 1 or 2 hide-boards recorded significantly higher food consumption than tanks with no hide-boards. Increased water temperature had little effect on consumption rates. For ‘food conversion efficiency’ each of the main effects ‘hide-boards’, ‘water temperature’ and ‘size’ had significant influence and the interaction between ‘hide-board’ and ‘size’ was very close to significance (p=0.053). The M/L animals recorded significantly better food conversions (average 0.26) than the S/M animals (0.22) and conversion was higher at 34oC (0.27) than at 32oC (0.21). The hide-board effects seemed to change with size. Among the S/M groups the food conversion was very constant, while among the M/L groups the no hide-board tanks had better rates (0.30) than groups with hide-boards (0.23, 0.25). The resulting ‘liveweight’ response (a product of amount of food eaten and how efficiently the animals converted this into weight) was significant in all main factors and also in the interaction between the ‘hide-board’ and ‘temperature’ factors. Higher temperature produced higher growth in both size classes. Providing 1 or 2 hide-boards to S/M groups gave similar results, with both being higher than no hide-boards. For the M/L groups increasing hide-boards from 0 to 1 and from 1 to 2 each gave significant increases in growth. Discussion Temperature Increasing water temperature from 32 to 34oC did not seem to affect the appetite of animals. However it did result in the animals being more efficient in converting food eaten into weight gain. This agrees with findings by Lang (1981) with 2-5 week old C. porosus (see introduction). Other research on hatchlings to one month of age (Webb et al., 1990) found that 32oC gave better growth than temperatures up to 2oC either side. The net effect on growth in the current experiment was that within each size class, the groups provided with the warmer water were significantly heavier by the end of the 12 weeks (50% heavier for S/M and 30% for M/L).
43
Hide-boards The pattern of food consumption among both size groups was similar - providing 1 or 2 hide-boards in the tanks increased the amounts of food consumed. However the effect on food conversion efficiency changed with size. Hide-boards had no effect for the S/M animals while among the M/L animals, the best efficiency was achieved by groups without hide-boards. One explanation might be that these latter groups did not eat as much as the animals with hide-boards and, being larger animals, needed to utilise this limited food to maximum benefit. The cumulative effect on growth among the S/M groups was that providing 1 or 2 hide-boards for animals resulted in higher growth rates (33% higher) than for groups without hide-boards. For the M/L groups, the effect was even more pronounced, with a significant benefit of 27% for 1 hide-board and an additional significant increase of 22% in providing a second hide-board. Food Consumption The highest rate of food consumption was 76 g/animal/week for the M/L groups provided with 2 hide-boards and the lowest (39g) for S/M animals with no hide-boards. Taken in relation with the average size of animals in each size class over the experiment, this means that S/M animals were consuming, on average, 39% of their body-weight in food each week, while the rate was 34% for M/L animals. These figures are much higher than other published figures of 15-20% (Hutton et al., 1993) for ‘typical hatchling crocodiles at constant temperature of 30-32oC’. It should be remembered that any food ‘wasted’ was included in ‘consumption’ figures in the experiment but this would rarely have exceeded 20% of food actually eaten. Since the higher temperature did not greatly affect consumption, the only other explanation would be in the hide-boards, other environmental conditions (light, type of rearing tank, noise, water quality) or management practices (feeding frequency, particular diet, animal density, frequency of handling for research purposes). Conversion Efficiency Food conversion ratios ranged from 19 to 30%. These are in line with other published rates for hatchling C. porosus - 28% for one month animals fed daily (Webb et al., 1991) and 18-32% (on an equivalent wet food weight basis) for animals over a 4 month period from hatching (Garnett et al., 1986). Conclusion Accelerated growth rates of at least 30% can be achieved in young hatchling crocodiles by simply providing some form of hide-board or shelter areas in the rearing tanks. This is certainly cost-effective for industry. Suggestions have been made (Hutton et al., 1993) that the size an animal will reach at two years of age can ‘usually be quite accurately predicted within the first few months’. Hence, it seems important for farmers to get their hatchlings growing as quickly as possible in the first months. The other way to increase growth is to heat the water in the rearing tanks to 34oC. The cost of doing this will vary considerably from farm to farm, so each farmer will have to estimate how much it is worth to the enterprise to have animals growing around 40% faster in the warmer water and compare this benefit with the added costs of heating. References Garnett ST and Murray RM (1986) Parameters affecting the growth of the Estuarine Crocodile,
Crocodylus porosus, in captivity. Aust. J. Zoology 34, pp211-23.

44
Hutton JM and Webb GJW (1993) The principles of crocodile farming. Proceedings of the 2nd Regional Meeting of the IUCN Crocodile Specialist Group, Darwin Northern Territory, March 1993.
Lang JW (1981) Thermal preferences of hatchling New Guinea crocodiles : effects of feeding and ontogeny. J. Therm. Biology 6, pp73-78.
Mayer R (1995) Temperature trial on two month old juveniles. Crocodile research Bulletin Vol. 1 pp20-29.
Riese G (1995) Effects of shelter availability on growth rates of hatchling C. porosus. PhD Thesis, Zoology Dept., University of Queensland.
Webb GJW, Hollis GJ and Manolis SC (1991) Feeding, growth and food conversion rates of wild juvenile saltwater crocodiles (C. porosus). J. Herpetol. 25(4) : 462-473.
Webb GJW, Manolis SC and Cooper-Preston H (1990) Crocodile management and research in the Northern Territory. Proceedings of the 10th Working Meeting of the IUCN Crocodile Specialist Group, Gainesville Florida USA 1990 Vol. 2 254-273.
4.2.5 Water Temperatures for 15 Month Old Crocodiles Introduction Considerable research has been carried out on the effects of water temperature on the growth of hatchling and hatchling crocodiles of different species up to 12 months of age (Foggin et al., 1989, Zilber et al., 1990, Mayer, 1995, 1997). This work has shown that 34oC results in optimal growth for the younger animals (to three months) and 32-34oC for animals from three months to one year old. Because small crocodiles can be reared at very high densities (up to 30 per m2) it is cost effective for industry to provide carefully controlled rearing environments for these animals. However, as they grow above 1kg they are moved into larger ‘grower’ areas with environments not so carefully controlled. Farmers in the Northern Territory and in Queensland notice a dramatic drop-off in quantities of food eaten by grower animals whenever temperatures fall below 20oC. The current trial was regarded as an important, initial ‘bench-mark’ assessment of responses in grower sized crocodiles to water temperature. Preceding experiments on ‘rearing density’ for grower crocodiles had indicated that a minimum density of around 30 animals per room was necessary to reduce fighting among animals. There were only 186 grower animals (the 1998 cohort) available for the experiment, so to achieve this minimum density it was only possible to form three groups of graded S/M and three groups of graded M/L animals. Consequently, only one half of the research facility was used for the experiment. There was also a leftover group of runts kept in one of the spare rooms. Experimental Details S/M animals were aggregated into the three groups (each with 28 animals) on the basis of similar clutch representation and average starting weight which was 540g. In a similar manner, the three groups of M/L animals (also of size 28) were formed, which had an equal mix of clutches (different from the S/M) and equal average liveweight of 1590g. The S/M groups were allocated randomly to rooms in which water temperature was set and maintained at 26o, 29o, or 32oC. In a similar manner each of the M/L groups was allocated to one of the water temperature treatments. Air temperatures in each room were kept at 30oC.
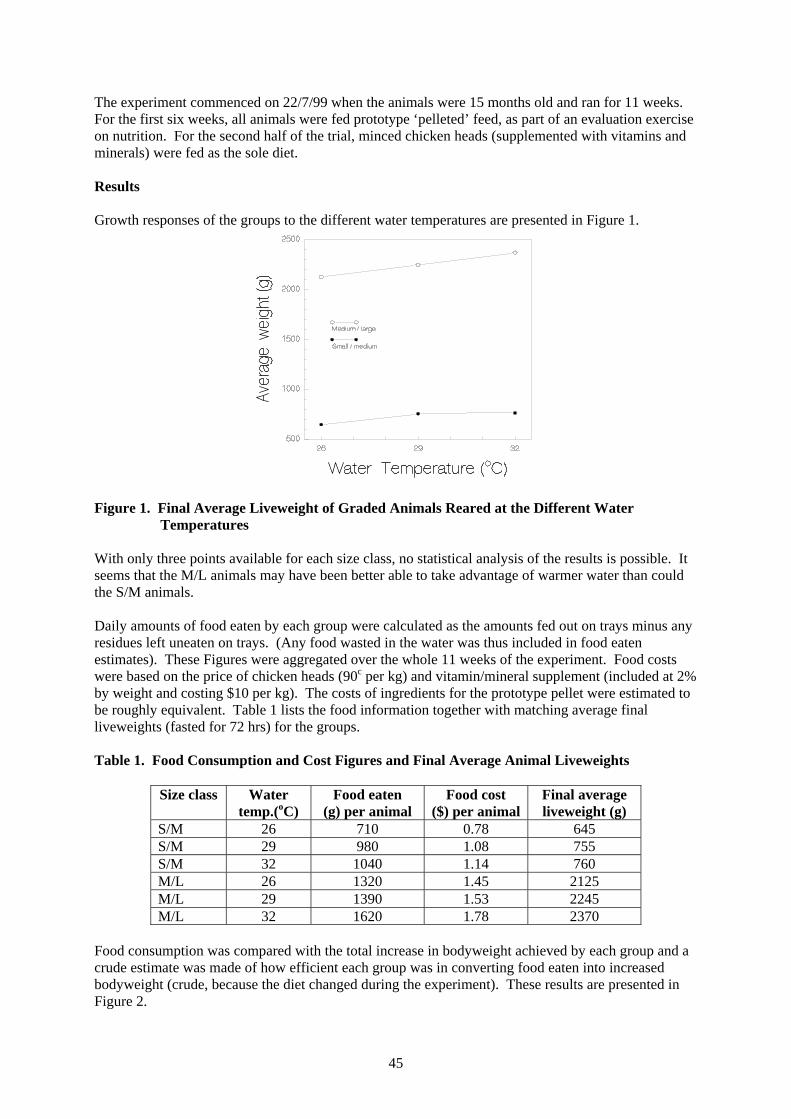
45
The experiment commenced on 22/7/99 when the animals were 15 months old and ran for 11 weeks. For the first six weeks, all animals were fed prototype ‘pelleted’ feed, as part of an evaluation exercise on nutrition. For the second half of the trial, minced chicken heads (supplemented with vitamins and minerals) were fed as the sole diet. Results Growth responses of the groups to the different water temperatures are presented in Figure 1.
Figure 1. Final Average Liveweight of Graded Animals Reared at the Different Water Temperatures
With only three points available for each size class, no statistical analysis of the results is possible. It seems that the M/L animals may have been better able to take advantage of warmer water than could the S/M animals. Daily amounts of food eaten by each group were calculated as the amounts fed out on trays minus any residues left uneaten on trays. (Any food wasted in the water was thus included in food eaten estimates). These Figures were aggregated over the whole 11 weeks of the experiment. Food costs were based on the price of chicken heads (90c per kg) and vitamin/mineral supplement (included at 2% by weight and costing $10 per kg). The costs of ingredients for the prototype pellet were estimated to be roughly equivalent. Table 1 lists the food information together with matching average final liveweights (fasted for 72 hrs) for the groups. Table 1. Food Consumption and Cost Figures and Final Average Animal Liveweights
Size class Water temp.(oC)
Food eaten (g) per animal
Food cost ($) per animal
Final average liveweight (g)
S/M 26 710 0.78 645 S/M 29 980 1.08 755 S/M 32 1040 1.14 760 M/L 26 1320 1.45 2125 M/L 29 1390 1.53 2245 M/L 32 1620 1.78 2370
Food consumption was compared with the total increase in bodyweight achieved by each group and a crude estimate was made of how efficient each group was in converting food eaten into increased bodyweight (crude, because the diet changed during the experiment). These results are presented in Figure 2.

46
Figure 2. Average Group Figures of Food Conversion Efficiency (Converting Food) Eaten into
Liveweight Gain At the cooler water temperature of 26oC, the animals in both size classes were not able to convert food eaten into liveweight as efficiently. Discussion The growth response among the M/L animals in Figure 1 followed the standard response observed in an experiment with two month old animals (Mayer, 1995) but was much less pronounced. With only three points available, it was difficult to assess whether it would be worth experimenting with higher temperatures for these larger sized animals - ideally a response curve should have a defined ‘optimal’ point. The relatively small increase in liveweight in the M/L groups with increasing temperature (6% from 26 to 29 degrees and a further 6% from 29 to 32 degrees) suggested that these older 15 month animals are more resilient to a substantial change in environment than are younger hatchling and hatchling animals. The corresponding increases for S/M animals were 17% and 1% respectively. The ‘lack of response’ between 29 and 32oC in the S/M groups reflects other research experiments in which the S/M animals are ‘inferior’ performers, less able to take advantage of improved environmental conditions. Efficiency in converting food eaten into liveweight gain is reduced at 26oC compared with higher temperatures. This is a well-known physiological process. The digestion of food inside cold-blooded animals is slowed down at lower temperatures and the animals are not able to utilise the food as efficiently. Unfortunately there seems to be no published data on food conversion rates for grower crocodiles. Farmers should consider using CROCTEL and measure representative growth rates of their farm animals to estimate food conversion efficiency. It could well emerge that a different farming strategy should be used for S/M animals. For it to be economic for a farmer to provide heated water for 15 month old animals, the value of increased size in animals must be more than offset against heating (direct energy, capital and depreciation) costs and increased food costs. The latter have been listed in Table 1 in the results section. Cost of heating will vary considerably between farms and farmers will also have different ‘value judgements’ about the real worth of increasing animal size at 15 months of age. References Foggin CM, Hutton J and Rogers J (1989) The effects of temperature on the growth and disease in
farmed Nile crocodiles. Proceedings of the 9th Working Meeting of the IUCN-SSC Crocodile Specialist Group. Lae Papua New Guinea, October 1988.

47
Zilber A, Popper DN and Yom-Tov Y (1990) The effect of direct sunlight and temperature on growth and survival of young Nile crocodiles Crocodilus niloticus. Elsevir Science Publishers B.V.
Mayer R (1995) Temperature trial on two month juveniles. Crocodile Research Bulletin Vol.1 pp20-29.
Mayer R (1997) Temperature effects on seven and ten month old crocodiles. Crocodile Research Bulletin Vol. 2 pp46-62.

48
4.3 Housing
4.3.1 Environmental Housing for Crocodiles Some elements of the Australian crocodile industry are moving into environmentally-controlled housing. The industry lack standard housing designs which possibly added to housing costs in the past. Producers are acquainted with important principles in environmental housing in a paper by Geof Runge. This information could be most useful for those people designing housing for hatchlings in particular. The crocodile industry has reached a stage in its development where it has to seriously consider the type of housing to use in the future. What modifications are needed to make to the current house design to improve growth rate, feed and energy efficiency and maintain or reduce costs? This paper outlines a concept for the future housing needs of crocodiles. The purpose of this paper is to provide a framework for development of ideas and discussion which will lead to a solid foundation for future housing. The problem for the industry is maintaining an optimum house climate and environment year-round for both hatchlings and grower stock. Temperature 32oC. (30 – 34oC) Relative humidity 60-90% Ammonia less than 20 ppm The temperature to maximise growth rate and feed conversion of growing crocodiles appears to be in the range of 30 to 34o Celsius. The humidity requirements have not yet been defined, however anecdotal evidence suggests that it should be in the range of 60-90%. Ammonia is a problem in completely enclosed housing because of the variable and low ventilation rates being achieved using natural ventilation. Ammonia is formed from the breakdown of compounds containing nitrogen excreted in the manure. Airborne concentrations above 25 ppm create a respiratory hazard for humans. People can detect ammonia above 20 ppm. With meat chickens ammonia above 10 ppm damages the lung surface, above 20 ppm there is increased susceptibility to disease and depending on age, growth rate is reduced at levels of 10 to 50 ppm. This suggests that care needs to be taken with ammonia levels because of potential effects on crocodiles. Table 1 shows some United Kingdom exposure limits for gases and dust on humans and poultry. Table 1. Exposure Limits for Gases and Dusts on Humans and Poultry
(ppm) Humans Poultry Substance
Continuous Short Continuous Ammonia 25 35 20 CO2 5,000 15,000 3,000 CO 50 300 10 Grain dust 10 30 - Humidity 50-70%
The ambient temperature in Australian production areas ranges from 3-42oC. This temperature range suggests that we need both heating and cooling facilities in housing for crocodiles if we are to maintain the temperature within the limits of 30 to 34oC.
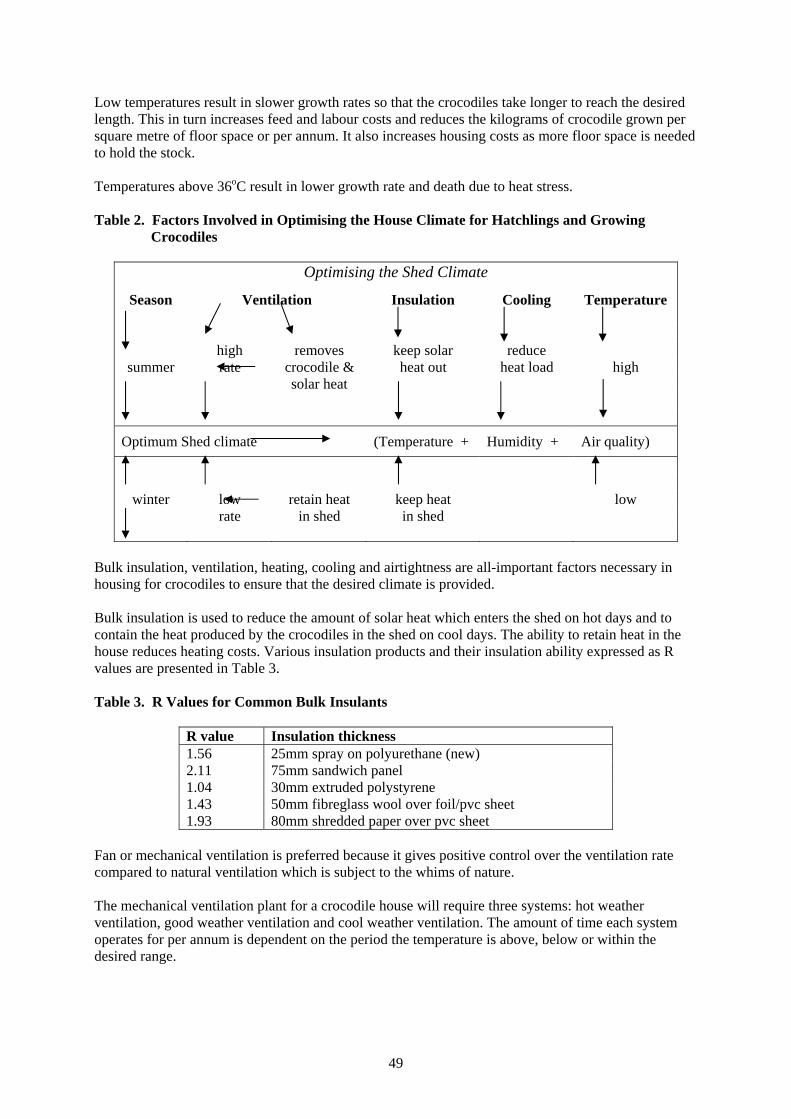
49
Low temperatures result in slower growth rates so that the crocodiles take longer to reach the desired length. This in turn increases feed and labour costs and reduces the kilograms of crocodile grown per square metre of floor space or per annum. It also increases housing costs as more floor space is needed to hold the stock. Temperatures above 36oC result in lower growth rate and death due to heat stress. Table 2. Factors Involved in Optimising the House Climate for Hatchlings and Growing
Crocodiles
Optimising the Shed Climate
Season
Ventilation Insulation Cooling Temperature
high removes keep solar reduce
summer rate crocodile & heat out heat load high solar heat
Optimum Shed climate (Temperature + Humidity + Air quality)
winter low retain heat keep heat low rate in shed in shed
Bulk insulation, ventilation, heating, cooling and airtightness are all-important factors necessary in housing for crocodiles to ensure that the desired climate is provided. Bulk insulation is used to reduce the amount of solar heat which enters the shed on hot days and to contain the heat produced by the crocodiles in the shed on cool days. The ability to retain heat in the house reduces heating costs. Various insulation products and their insulation ability expressed as R values are presented in Table 3. Table 3. R Values for Common Bulk Insulants
R value Insulation thickness 1.56 25mm spray on polyurethane (new) 2.11 75mm sandwich panel 1.04 30mm extruded polystyrene 1.43 50mm fibreglass wool over foil/pvc sheet 1.93 80mm shredded paper over pvc sheet
Fan or mechanical ventilation is preferred because it gives positive control over the ventilation rate compared to natural ventilation which is subject to the whims of nature. The mechanical ventilation plant for a crocodile house will require three systems: hot weather ventilation, good weather ventilation and cool weather ventilation. The amount of time each system operates for per annum is dependent on the period the temperature is above, below or within the desired range.

50
The hot weather ventilation system will use from half to the full ventilation rate to remove hot air and moisture from the house. It is used when the ambient temperature is greater than the temperature required in the house. The number of fans operating varies according to the house temperature. The higher the temperature the greater the number of fans that are working. If the temperature in the shed is greater than what the crocodiles need additional cooling is required. The air entering the house can be cooled using evaporative cool pads or the pond water can be cooled or the floor cooled using cooled water circulated through pipes in the floor. Information on how crocodiles warm and cool themselves is needed to determine which cooling system is the most effective and cost efficient method for cooling. The good weather ventilation system is used where the outside temperature is similar to that needed by the crocodiles. Usually one third to two-thirds of the full ventilation rate is used. The number of fans operating will vary according to ambient temperature. Cool weather or minimum ventilation is used when the outside temperature is lower than that required by the crocodile. It uses up to half the ventilation capacity. Minimum ventilation maintains air quality in the shed by removing heat, ammonia, carbon dioxide and moisture. This system has fans placed in one end wall and specially designed inlets in the sidewalls. The minimum ventilation rate required is calculated according to the weight of crocodile in the shed and is usually related to the carbon dioxide production rate. The inlet area is calculated using 1m2 of inlet per 13,725 m3 per hour of fan flow. Care must be taken with both design and installation of inlets to ensure that the cold air entering the shed mixes with the warm air before coming contact with the crocodiles. Air must enter through these inlets at a minimum speed of 3 m per second to ensure good mixing and control of the direction of flow. The hot weather ventilation system has fans in one end wall and inlets in the opposite end wall or in the sidewalls adjacent to that end wall. Some of the fans fitted in the end wall can also be used for the minimum ventilation system. A plastic curtain can be fitted over the inlet and opened according to the ventilation rate. Evaporative cool pads can also be fitted over the inlet. The shed must be airtight so that the air which the fans suck into the shed comes through the inlets placed there for that purpose. If the air enters the shed through cracks or holes in the walls or roof it will not mix properly and can result in hot spots in the shed or air which is too cool coming into contact with the livestock. Another effect is uneven temperatures throughout the house. For effective ventilation good insulation, an airtight house, good control over the ventilation rate and good mixing of incoming air is required. Air movement of more than 0.5m/s at floor level may be detrimental to the health and performance of young hatchlings. As a minimum of 30oC is required in the shed at all times during the year the shed will have to be heated for part of the year during the cool weather. The most efficient method is to circulate heated water through the floor. Either gas or electricity can be used to heat the water. Solar heating could be used to reduce electricity costs. When the water in the pond is flushed out the ponds should be refilled with water which has been warmed to the required temperature. An auxiliary heater is required for heating this water because the high demand for warm water is too great for the floor heating system. A controller able to manage the ventilation and cooling systems in response to ambient and house temperature is an essential piece of equipment. Low and high temperature alarms connected to paging systems or telephones and a backup generator in case of power failure will be necessary.
51
To improve shed climate more information is needed about the metabolism and behaviour of crocodiles, their heat, carbon dioxide and ammonia output and how do they warm and cool themselves. With this information better calculations can be made on the airflow rate required or the ventilation rate and in turn the running costs. The bottom line is that costs must not be more than the savings achieved with faster growth rates. Energy costs will be critical in determining this. There may also be a place for the use of geothermal energy sources. Because of the longer growing period compared to poultry or pigs energy costs may be critical in determining the viability of better housing. It is possible that capital costs may be higher to enable the use of sophisticated energy saving techniques. In summary the technology already used in other intensive livestock industries is available to improve the shed climate. It needs to be developed, designed and modified to suit application in a crocodile house and the costs must not be excessive. It is important that attention is paid to installation and management. The poultry industry had made a lot of mistakes in housing that it has tried over the years and we should learn from the lessons that they have learnt.
52
4.4 Environmental Management
4.4.1 Treatment of Wastewater and Disposal/Reuse of Effluent Introduction Project Services were commissioned by the Department of Primary Industries (QDPI) to prepare a report on options for the treatment of wastewater and disposal/reuse of effluent from crocodile pens similar to those at their Oonoonba site in Townsville. Scope This report outlines the theories and design principles which can be utilised by existing and future crocodile farms. However engineering site assessment and design are required for each specific case. There are a number of associated topics which are influencing factors but are outside the scope of this report. These are: Control of Feeding Some contaminants found in wastewater are directly related to the food source of the crocodile. If a particular contaminant can be removed from the food source, without detriment to the crocodile’s development, then that contaminant will not have to be removed during the treatment process. Also if the crocodile is only fed what it requires this will reduce the volume of excess food which will also have to be removed from the wastewater during the treatment process. Combining of Waste Streams The farmer may wish to combine wastewater from other sources and treat them together. This has particular application when the farm is also a tourist facility. Other sources include kitchen sinks, wash basins, showers, toilets and wash down areas. These need to be assessed on an individual basis since each waste source changes the chemical composition of the other. Advanced Treatment Advanced treatment is only used if effluent is to be reused say as pen water, discharged to an environmentally sensitive area or discharged to waters. Advanced treatment is not considered in this report since it is complex and therefore expensive and generally not commercially viable. Release to Waters This is a licensed activity which is only carried out by Local Authorities. Strict environmental regulation means advanced treatment is required with regular testing and monitoring by skilled operators. Terminology
Wastewater – the used water of a community or organisation which contains dissolved and suspended solids. It is the general term for all types of discharged wastewater including domestic, commercial and industrial. Sewerage – domestic wastewater – ie. from humans. Effluent - wastewater which has received some form of treatment. Absorption Area / Transpiration Area / Evapotranspiration Absorption Area – refer Figure 6.

53
Shock Load – higher than normal volumes eg. High number of people visiting tourist parks during holiday periods. Associated Professional Disciples
Treatment and Disposal/reuse is a complex topic that requires input from several Professional Disciplines. These include: • Civil Engineering • Microbiology • Environmentalism • Science • Hydraulic Engineering • Mechanical Engineering • Electrical Engineering Most are only involved in research and design of large-scale treatment works. Characteristics of Wastewater from Crocodile Pens Table 1 below shows the most common contaminants found and their comparison to the quantities found in wastewater from humans (domestic wastewater or sewerage). This is done since most research, available literature and treatment processes are for sewerage and therefore need to modified to suit the varying characteristics of wastewater from crocodile pens. Table 1. Common Contaminants Found in Crocodile Pen Wastewater Compared to Those
Found in the Wastewater from Humans
Contaminant Crocodiles
(mg/l)
Humans –
Min (mg/l)
Humans –
Max (mg/l)
BOD5 236 200 400
Suspended Solids 630 200 500
Ammonia as Nitrogen 226 20 30
Total Nitrogen 230 30 70
Total Phosphorus 22 8 16
BOD5 (five-day biochemical oxygen demand) - is of a similar concentration to that of humans. Therefore there should be similar reductions in BOD5 through a nominated treatment plant. Suspended solids - are higher than the maximum human concentration. This would be due to the presence of uneaten food scraps. Ammonia as Nitrogen – this is approximately ten times the concentration level found in human wastewater. This is because humans use water flushing which dilutes the wastewater and therefore reduces the concentration of ammonia. Also the water reacts with the ammonia to form other compounds of nitrogen. In contrast the volume of water in the crocodile wastewater is very low therefore the ammonia remains unreacted.

54
Total Nitrogen – since most the ammonia does not react to form other nitrogen compound it follows that the nitrogen concentration is similar to the ammonia concentration. Phosphorus – this is higher than maximum concentration for humans due to it being present in the abovementioned uneaten food scraps. Related Issues Due to the volatility of the contaminants present, the treatment of wastewater and disposal/reuse of effluent is an important topic which is now listed on Development Applications as an Environmental Relevant Activity (ERA). To obtain application approval it is necessary to satisfy the strict requirements of various Health and Environmental Legislation which are administered by the following organisations: • Australian Standards – eg AS 1547 • National Health and Medical Research Council (NHMRC) • Queensland Department of Environment • ANZECC Public Health Issues In Australia, public health problems related to domestic wastewater are not significant. This is because of two factors. Firstly, householders are required to use a septic tank as a minimum, with effluent being disposed of to land in an absorption area – refer Figure 1 and Figure 6. Secondly most communities have low populations spread over a wide area (ie. low density rural areas). However in some communities as population densities have increased, contamination of groundwaters has become an issue. This is particularly applicable where disposal areas are located near potable water sources. Air and soil pollution may also result. Furthermore vermin such as mosquitos, rats and cockroaches are attracted by wastewater and wastewater treatment processes. The reuse of effluent as irrigation is becoming common practice. However it does raise some concerns in regards to health issues. Since the effluent is above the ground there is the potential for human contact with pathogens. Spray irrigation needs strict regulation as it has the potential to release harmful pathogens into the air where humans may inhale them. Pathogens include viruses, bacteria, fungi and protozoan and metazoan parasites. In an adequately designed absorption area the majority of these pathogens are filtered out as the effluent seeps through the soil. They still however remain in the soil and may survive for very long periods of time - so the restriction of contaminants within a disposal area until they decay is how treatment is actually carried out. Some viruses are known to survive up to three years. An example of typical survival times for viruses are shown below : Table 2. Typical Survival Times for Viruses
Pathogen
Disease
Survival Time (days)
Salmonella
Typhoid Fever
7 – 168
Enteroviruses
Gastroenteritis
25 – 170

55
Faecal coliforms are the majority of bacteria found in the faeces of human and animals. Bacteria not only survive but can multiply and unlike viruses they do not require a host cell to do this. Faecal coliform counts are used as an indicator for pathogens - if these are low it is assumed that escherida coliforms (e coli) and other pathogens are also low. Environmental Issues Effects on Environment Nutrients such as Nitrogen and Phosphorus are the elements found in sewerage which are particularly harmful to the environment. Generally Australia is deficient in these nutrients. If quantities above the natural levels are introduced then the result is degradation of native vegetation and adverse conditions such as the blue-green algae blooms. In very sensitive areas such as National Parks, nutrients will need to be greatly reduced or completely removed. BOD5 is a standard of measurement for the quantity of oxygen which will be consumed by the organisms and chemicals contained in effluent. It is a major threat to the environment since the oxygen is evitably stripped from soils and watercourses. Queensland Environmental Protection Agency Requirements The Environmental Protection Agency requires that contaminants remain within the nominated disposal/reuse area. This is because even effluent which has received advanced treatment will still contain impurities at higher concentrations than found naturally in rainwater or the environment. Diversion of stormwater from disposal/reuse area and retention (storage) of contaminates is required – refer Figure 8. Stages of Treatment Primary Treatment Primary Treatment is the removal of the majority of settleable solids. In domestic situations this is most commonly achieved by use of a septic tank. Solids settle to bottom of tank, the most of which breaks down. The accumulation of remaining solids is later removed by pump out, after a period of approximately three years. The effluent from septic tanks is usually discharged to an absorption area.
Figure 1. Septic Tank As shown in Table 1 wastewater from crocodile pens contain a high volume of suspended solids. In practical terms this means that the sludge volume will need to be higher in a primary treatment system. For a septic tank this means that a larger volume tank is required. If a nominal sized septic tank is used then the frequency of pump out of sludge will need to be increased. Figure 2 below shows a settling pond which is another common form of primary treatment. The disadvantage of ponds is the area of land required. Since this is not usually a problem in rural areas

56
ponds are the preferred system of primary treatment for farming communities. If basic earthworking equipment is available the sludge capacity of a pond can be easily increased by excavating a pond of greater area or depth. However removing sludge from a pond is more difficult. This is because: • the pond needs to be drained and the effluent temporarily stored • earthworking equipment is required to remove the sludge • it is difficult to distinguish the sludge from mud which may result in over excavation • how and where to dispose of the sludge. (With a septic tank special trucks are available which pump straight from the tank and dispose of the sludge at an approved facility).
Figure 2. Settling Pond Secondary Treatment The main function of secondary treatment is the reduction of BOD5. This is achieved by bubbling or mixing oxygen (from air) through the effluent, thereby satisfying it’s oxygen demand. An additional function is the reduction of pathogens. Systems are classified either as active (ie. requires energy input) or passive (does not require energy input). Basic Types of Systems The basic types of secondary treatment systems are: • an Aeration (or extended aeration) plant – refer Figure 3. This is an active system. It is designed
and supplied by a manufacturer. The one shown in Figure 3 has a blower attachment which bubbles air/oxygen through the effluent. Others have large fans that mix and aerate the effluent
• note: Figure 3 shows a total treatment plant which incorporates primary treatment (anaerobic
chamber), secondary treatment (aerobic chamber) and tertiary treatment (clarification chamber and chlorine canister)
• aerobic sand filter – refer Figure 4. This is a passive system. As the effluent flows from top to
bottom it mixes with the air/oxygen which is present in the voids between the sand grains. Bacteria also grows on the sand grains and feed on the remaining suspended solids in the effluent then on each other thereby reducing the pathogen concentration
• facultative lagoon – refer Figure 5. This is also a passive system. It relies on wind action on the
effluent surface to provide mixing with the air/oxygen.

57
Figure 3. Aeration Plant
Figure 4. Aerobic Sand Filter
Figure 5. Settling Pond

58
Advantages and Disadvantages of Active and Passive Systems
SECONDARY TREATMENT- Main function is reduction of BOD - supplies oxygen to effluent- Additional function is reduction of Pathogens - growth of bacteria which consume suspended solids
ACTIVE How it Works Advantages Disadvantages Common
Aerated Wastewater Mechanical Mixing or Requires minimal space Direct cost - must be installed Performance based -Treatment Plant Bubbling of Oxygen by Manufacturer Testing of final effluent is
Fast Treatment required to ensure systemOngoing cost - maintenance continues to operated at the
Maintaince by skilled (usually quaterly) and required level to satisfyoperator - final effluent power supply Health and Environmentalalso tested Legislation and Policy
Maintenance service may behigh in remote locations Chemicals going into effluent
must be bacteria friendly
PASSIVE
Sand Filter Air voids between sand grains Minimal ongoing costs - Direct cost - must be installedare a source of oxygen backwashing required by Manufacturer
Bacteria growth on sand grains whichare a type of media
Facultative Lagoon Wind action on surface of lagoon Indirect cost - works can be Poor circulationcarried out by owner
Added function of water plants Desludgingtaking up nutrients Minimal ongoing costs -
maintenance works can be Leachingcarried out by owner
High rainfallCan be designed to absorbshock loads Plant management - control of
growth and harvesting
Drowning risk
Odour
Undesirable visual appearance Tertiary Treatment Tertiary treatment involves the filtering out of suspended colloidal solids and disinfection to further remove pathogens. Pathogens cannot be entirely removed and are always present in some form. Disinfection can be achieved by various methods such as chlorination, ozone dosing, exposure to ultraviolet light or pasteurisation. However chlorination is generally chosen since the other methods still require it to provide ongoing protection against reinfestation by pathogens. Advanced Treatment Advanced treatment involves the removal of nutrients which are mainly nitrogen and phosphorous. Generally nitrogen is removed by reacting it with oxygen by use of a reed bed, lagoon or extended aeration plant. Phosphorus is reacted with other chemicals to form a precipitate that settles out of solution. Generally it is now thought more economical to reuse these nutrients. The most common form of reuse is as fertiliser for vegetation when effluent is applied as irrigation. Disposal Area The traditional disposal area is commonly referred to as an absorption area which refers to absorption of the effluent into the soil. However two other functions may also occur which are absorption to the atmosphere by both evaporation and transpiration. The latter by incidental grass growth.
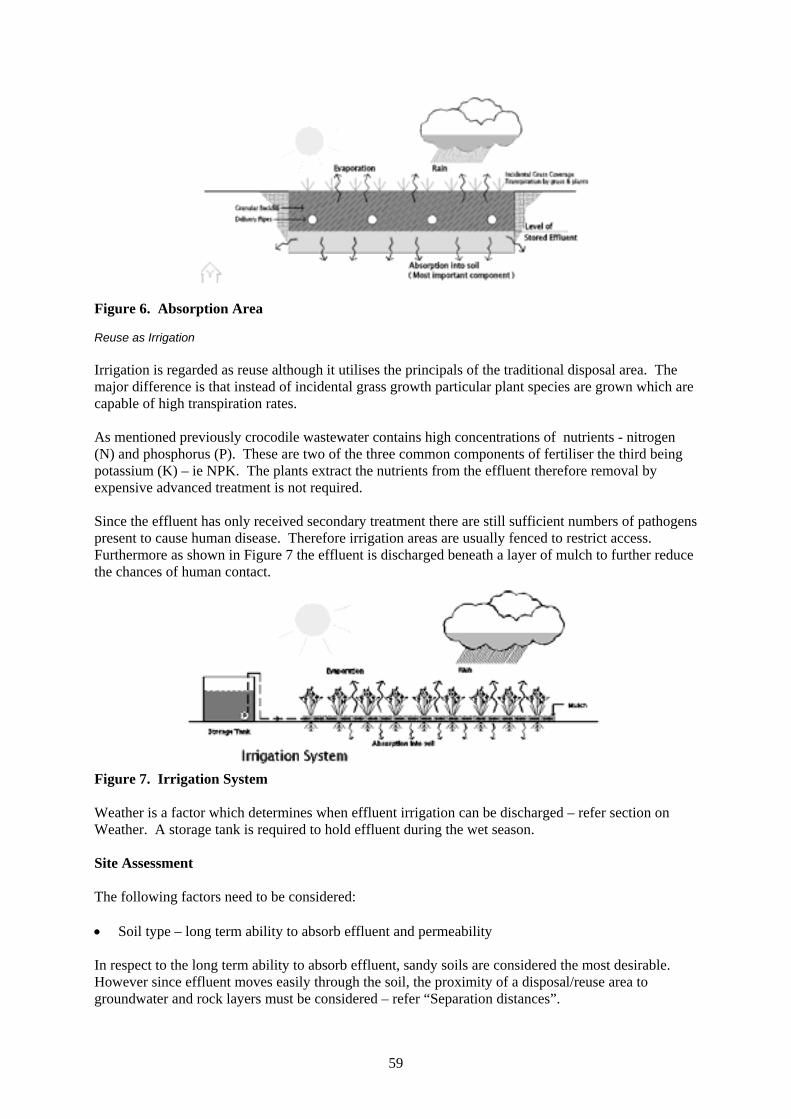
59
Figure 6. Absorption Area Reuse as Irrigation Irrigation is regarded as reuse although it utilises the principals of the traditional disposal area. The major difference is that instead of incidental grass growth particular plant species are grown which are capable of high transpiration rates. As mentioned previously crocodile wastewater contains high concentrations of nutrients - nitrogen (N) and phosphorus (P). These are two of the three common components of fertiliser the third being potassium (K) – ie NPK. The plants extract the nutrients from the effluent therefore removal by expensive advanced treatment is not required. Since the effluent has only received secondary treatment there are still sufficient numbers of pathogens present to cause human disease. Therefore irrigation areas are usually fenced to restrict access. Furthermore as shown in Figure 7 the effluent is discharged beneath a layer of mulch to further reduce the chances of human contact.
Figure 7. Irrigation System Weather is a factor which determines when effluent irrigation can be discharged – refer section on Weather. A storage tank is required to hold effluent during the wet season. Site Assessment The following factors need to be considered: • Soil type – long term ability to absorb effluent and permeability In respect to the long term ability to absorb effluent, sandy soils are considered the most desirable. However since effluent moves easily through the soil, the proximity of a disposal/reuse area to groundwater and rock layers must be considered – refer “Separation distances”.

60
Clayey soils are considered the least desirable. This generally means that the size of a disposal/reuse area is relatively larger than one located in a sandy soil. Since clayey soils do not readily absorb effluent there is a risk of overflow during rainy months. • Site slope and stormwater runoff If the site slope is too steep effluent will seep out of the disposal/reuse area. Earthworks are required to provide a level surface. Stormwater runoff flowing through a disposal/reuse area can wash out effluent and therefore disperse contaminants into the environment. Earth mounds are an economical way of providing diverting stormwater runoff around a disposal/reuse area whilst retaining rain which falls on the area and is mixed with the effluent – refer Figure 8. • Separation distances The Department of Natural Resources have published an “Interim Code of Practice for On-site Sewerage Facilities”. This code gives recommended minimum separation distances – horizontally to watercourses and vertically to groundwater and rock layers. The distances are determined by the time taken for the effluent to travel through the soil and the corresponding degree of pathogen die-off during this time – refer Table 3 and Figure 8. • Prevailing wind direction This is a consideration in regards to the spreading of odours to surrounding neighbours. Also if effluent is reused as sprayed irrigation, vapour containing pathogens may be blown away from the nominated disposal/reuse area. The factors listed above can be summarised by Table 3 and Figure 8.

61
Table 3. Surface Horizontal Separation Distances
Primary Effluent Secondary Effluent Advanced Secondarymg/L mg/L Effluent mg/L
Biochemical Oxygen Demand 120-240 =< 20 =< 10
Suspended Solids 65-180 =< 30 =< 10
Total Nitrogen 36-45 =< 30 =< 10
Total Phosphorus 6-10 =< 10 =< 5
Thermotolerant Coliform =< 200 =< 10(org/100 ml)
To bank of permanent water course 50 m 30 m 10 m(eg river, stream or lake)
To farm dams, intermittent water course, 50 m 30 m 10 mdrainage channels
To a bore or well used for domestic 50 m 30 m 10 mwater supply
Property boundaries, paths, walkways 4 m when lower than 4 m when lower than 4 m when lower thanthe disposal facility the disposal facility the disposal facility2 m wen higher than 2 m wen higher than 2 m wen higher thanthe disposal facility the disposal facility the disposal facility
Dwellings, Children's play areas Prohibited 15 m 10 m
Water edge of swimming pool Prohibited 6 m 6 m
Unsaturated depth to a permanent 1.2 m 0.6 m 0.3 mwater table ( Taken from TABLE A5)
Figure 8. Surface Run-off Weather Weather is an important consideration especially in North Queensland. Rainfall during the wet season increases the volume stored within a disposal area. Careful design is required to reduce the incident of overflow. Consequently fine weather is necessary to aid in the evaporation and transpiration and thereby reduce the volume stored within a disposal area. Also effluent cannot be used as irrigation during the wet season. This is because there is an adequate rainfall to produce sufficient watering for vegetation. If effluent is added during this time it will

62
simply run off and be dispersed into the environment. The effluent must therefore be stored. Considering the number of wet days may range from three to six months in any one year, the storage facilities may be quite extensive.
0
50
100
150
200
250
300
350
Jan Feb March April May June July Aug Sept Oct Nov Dec Jan Feb March April May
Mill
imet
res
RainfallEvaporation
Figure 9. Rainfall and Evaporation Figure 9 illustrates that irrigation can only be discharged in an eight month period between April and December – ie when evaporation exceeds rainfall. Conclusion Wastewater from crocodile pens contains some contaminants which are higher in concentration that those found in domestic wastewater (sewerage) from humans. These are: • suspended solids • suspended solids can be removed by increasing the sludge capacity of a primary treatment system.
A cost comparison is required for the option of a nominal sized septic tank with an increased number of pump outs, a larger septic tank or constructing a larger settling pond. The other factor to consider is that pumping sludge from a septic tank is an easier method of removal than that required for a settling pond
• nutrients - nitrogen and phosphorus • it is more economical to reuse nutrients as fertiliser for vegetation when effluent is applied as
irrigation rather than remove it by expensive tertiary and advanced treatments. Secondary treatment is required to remove the BOD5 by supplying oxygen to the effluent. Coincidently the majority of pathogens are also removed. As to what system to use and whether it is passive or active, can be determined by a life cycle cost analysis which needs to take into account the various advantages and disadvantages.

63
Although the majority of pathogens are removed, during treatment processes, the remaining number is sufficient to be a danger to humans. Therefore to reduce the risk measures must be taken to reduce the risk of contact with humans. These include fencing of disposal areas, irrigating at night and utilising subsurface irrigation – ie below a layer of mulch or chip bark. There are specific site requirements to ensure pathogens remain in the area until die off occurs. Or if effluent is moving through the soil die off occurs before the effluent reaches groundwater or nearby water courses. Note: The area in which effluent is reused is still considered a disposal area. Recommendation
Figure 10. Recommended System The recommendation given by this report and shown in Figure 10 is by no means exclusive. Wastewater treatment and disposal/reuse is a complex subject the final solution of which is subject to a large variety of economic and site considerations. This recommendation assumes that there is a large volume of wastewater, land is readily available and the owner may want to reduce the costs by being involved in the treatment process. Figure 10 also shows an idealistic site where the effluent flows through each treatment process under the influence of gravity thereby eliminating the need for pumps. This may not be possible for flat sites. Settling Pond As a primary treatment process a settling pond is easy to construct and the owner can carry out the majority of the work if they are in possession of basic earthworks machinery. Since crocodile wastewater contains a large volume of suspended solids the sludge capacity of the primary treatment process needs to be increased. This can easily be achieved by increasing the volume of the pond by either making it deeper or by increasing its area. Aerobic Sand Filter This secondary treatment is inexpensive to install due to the simplicity of its design – it’s basically a sandpit with slotted inlet and outlet pipes. It has negligible running and operation costs as it is a passive system that does not require power and there are no moving parts which require maintenance.

64
Storage Pond As with the settling pond the storage pond is also easy to construct and the owner can carry out the majority of the work if they are in possession of basic earthworks machinery. Since effluent cannot be used as irrigation during rainy periods it must be stored. Again this can easily be achieved by increasing the volume of the pond by either making it deeper or by increasing its area. This is much more economic than the purchase and fitting of a large storage tank. The disadvantage is that an additional pond depth must be allowed to cater for the rainfall which lands on the pond surface. Irrigation System Irrigation allows nutrients (nitrogen and phosphorus) to be reused as fertiliser for vegetation. This means the nutrients are removed without the use of expensive mechanical and chemical treatment processes. Since the wastewater from crocodiles contains high concentrations of these nutrients irrigation is an ideal solution. The irrigation is subsurface in that it is discharged beneath a large layer of mulch or chip bark. This reduces the risk of human contact since the effluent will still contain harmful pathogens. References Department of Primary Industries Institute of Engineers Australia Seminar on Domestic On-Site Wastewater Treatment and Disposal Bundaberg 8th, & 9th September 1995 Australian Standards AS 1547 – 1994 Disposal Systems for Effluent from Domestic Premises Department of Natural Resources Interim Code of Practice for On-Site Sewerage Facilities Australian Water Resources Council National Water Quality Management Strategy Draft Guidelines for Sewerage Systems Effluent Management August 1992 Water Industry Planning and Development Effluent/Sludge Reuse Seminar 5 November 1997 Department of Natural Resources Interim Guidelines for Reuse or Disposal of Reclaimed Water Department of Environment Environmental Protection Act 1994 User’s Guide to Queensland’s Environmental Protection (Water) Policy 1997
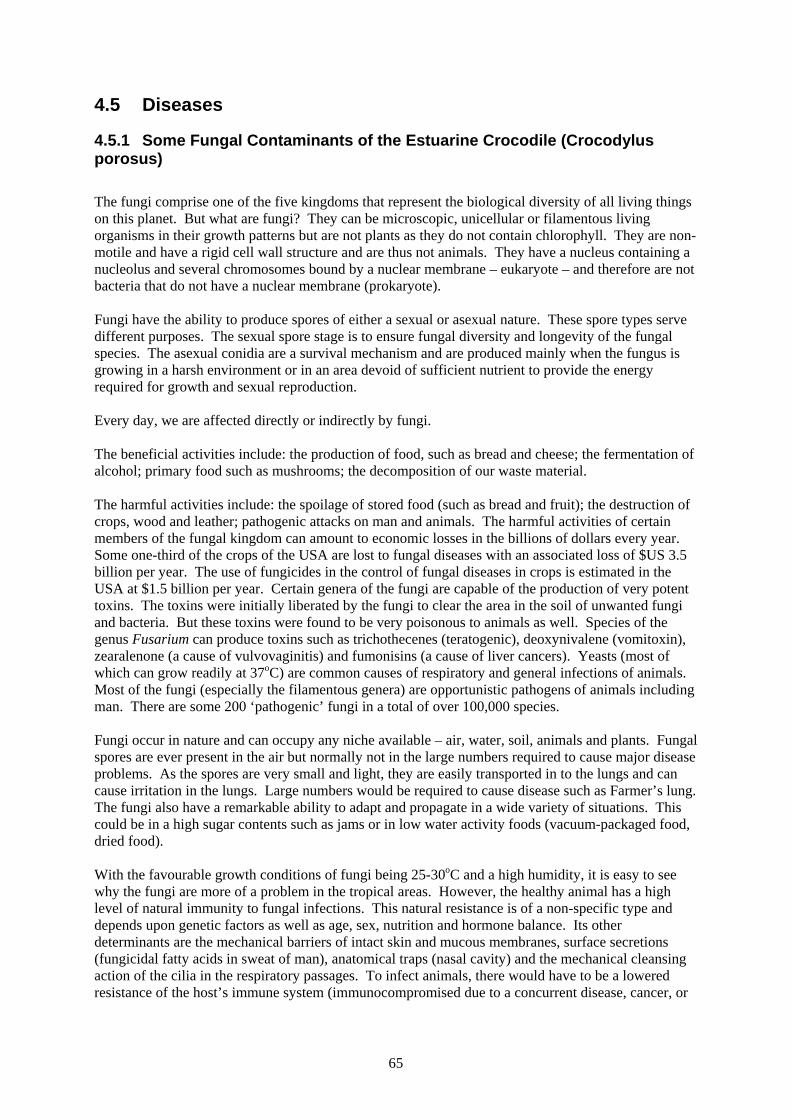
65
4.5 Diseases
4.5.1 Some Fungal Contaminants of the Estuarine Crocodile (Crocodylus porosus) The fungi comprise one of the five kingdoms that represent the biological diversity of all living things on this planet. But what are fungi? They can be microscopic, unicellular or filamentous living organisms in their growth patterns but are not plants as they do not contain chlorophyll. They are non-motile and have a rigid cell wall structure and are thus not animals. They have a nucleus containing a nucleolus and several chromosomes bound by a nuclear membrane – eukaryote – and therefore are not bacteria that do not have a nuclear membrane (prokaryote). Fungi have the ability to produce spores of either a sexual or asexual nature. These spore types serve different purposes. The sexual spore stage is to ensure fungal diversity and longevity of the fungal species. The asexual conidia are a survival mechanism and are produced mainly when the fungus is growing in a harsh environment or in an area devoid of sufficient nutrient to provide the energy required for growth and sexual reproduction. Every day, we are affected directly or indirectly by fungi. The beneficial activities include: the production of food, such as bread and cheese; the fermentation of alcohol; primary food such as mushrooms; the decomposition of our waste material. The harmful activities include: the spoilage of stored food (such as bread and fruit); the destruction of crops, wood and leather; pathogenic attacks on man and animals. The harmful activities of certain members of the fungal kingdom can amount to economic losses in the billions of dollars every year. Some one-third of the crops of the USA are lost to fungal diseases with an associated loss of $US 3.5 billion per year. The use of fungicides in the control of fungal diseases in crops is estimated in the USA at $1.5 billion per year. Certain genera of the fungi are capable of the production of very potent toxins. The toxins were initially liberated by the fungi to clear the area in the soil of unwanted fungi and bacteria. But these toxins were found to be very poisonous to animals as well. Species of the genus Fusarium can produce toxins such as trichothecenes (teratogenic), deoxynivalene (vomitoxin), zearalenone (a cause of vulvovaginitis) and fumonisins (a cause of liver cancers). Yeasts (most of which can grow readily at 37oC) are common causes of respiratory and general infections of animals. Most of the fungi (especially the filamentous genera) are opportunistic pathogens of animals including man. There are some 200 ‘pathogenic’ fungi in a total of over 100,000 species. Fungi occur in nature and can occupy any niche available – air, water, soil, animals and plants. Fungal spores are ever present in the air but normally not in the large numbers required to cause major disease problems. As the spores are very small and light, they are easily transported in to the lungs and can cause irritation in the lungs. Large numbers would be required to cause disease such as Farmer’s lung. The fungi also have a remarkable ability to adapt and propagate in a wide variety of situations. This could be in a high sugar contents such as jams or in low water activity foods (vacuum-packaged food, dried food). With the favourable growth conditions of fungi being 25-30oC and a high humidity, it is easy to see why the fungi are more of a problem in the tropical areas. However, the healthy animal has a high level of natural immunity to fungal infections. This natural resistance is of a non-specific type and depends upon genetic factors as well as age, sex, nutrition and hormone balance. Its other determinants are the mechanical barriers of intact skin and mucous membranes, surface secretions (fungicidal fatty acids in sweat of man), anatomical traps (nasal cavity) and the mechanical cleansing action of the cilia in the respiratory passages. To infect animals, there would have to be a lowered resistance of the host’s immune system (immunocompromised due to a concurrent disease, cancer, or

66
the use of drugs), stress related incidents (which in crocodiles may include over-crowding, transportation and excess handling) and/or trauma caused by wound ingress. The major fungi affecting Queensland crocodile farms are Fusarium solani, Paecilomyces lilacinus and Chrysosporium sp. These fungi can cause fatal disease in the saltwater crocodile. Other fungi ubiquitous in the soil and nesting materials as well as on the eggs are Aspergillus flavus, Aspergillus niger, Rhizopus sp. and Penicillium spp. Fusarium solani Fusarium solani is a fast growing fungus that is a common inhabitant in the soil and a noted pathogen of food crops. When grown on Sabourads Dextrose Agar (SDA), it can reach almost to the edge of a Petri dish by 3-5 days at 28oC. (Figure 1). There are often tinges of reds and oranges in the colony colour. The colony produces masses of spores under the right conditions (low nutrient, ideal growth). The microconidia will germinate and produce new hyphae and regrowth. (Figure 2). The macroconidia are shaped like a canoe (often indicative of the genus). (Figure 3). They have been isolated frequently from reptiles (especially turtles and their eggs), including crocodiles. Isolation of Fusarium solani from crocodile nesting material and egg shells is common.
Figure 1. Agar Culture of Fusarium Solani Grown on Sabourads Dextrose Agar (SDA) for 3-5 Days at 28oC.
Figure 2. Slide Culture of Fusarium solani Showing Both Micro- and Macro-Conidia.
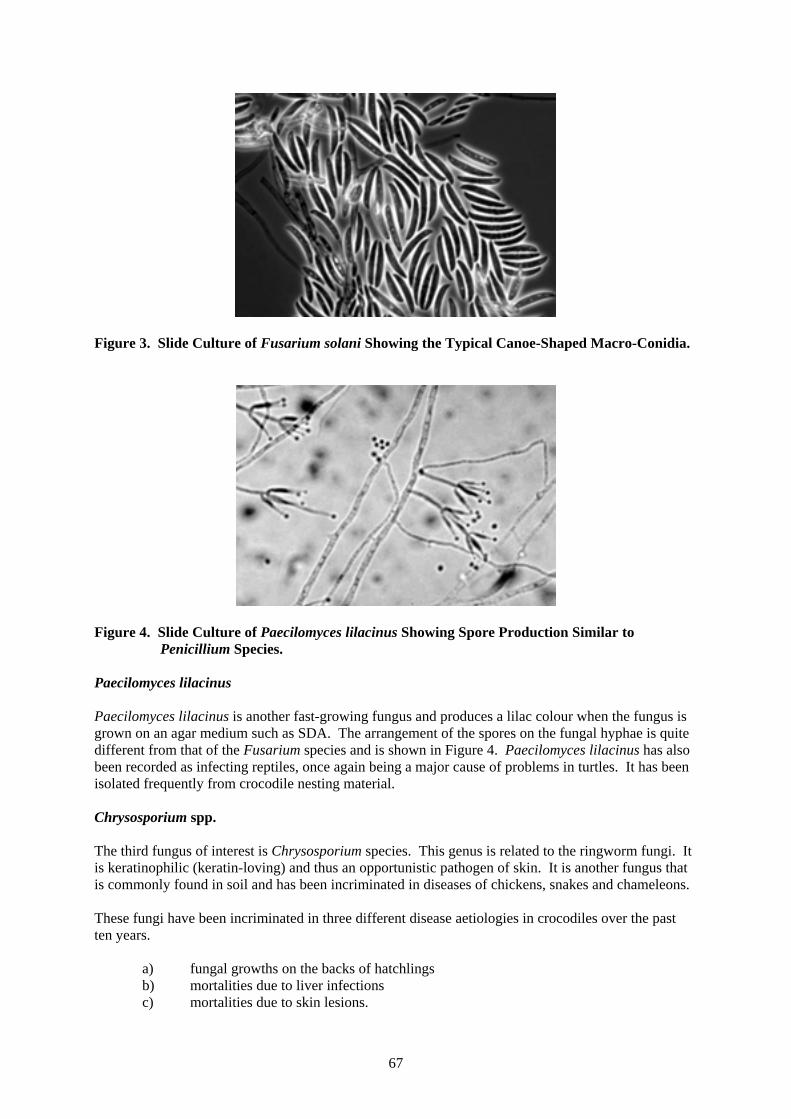
67
Figure 3. Slide Culture of Fusarium solani Showing the Typical Canoe-Shaped Macro-Conidia.
Figure 4. Slide Culture of Paecilomyces lilacinus Showing Spore Production Similar to
Penicillium Species. Paecilomyces lilacinus Paecilomyces lilacinus is another fast-growing fungus and produces a lilac colour when the fungus is grown on an agar medium such as SDA. The arrangement of the spores on the fungal hyphae is quite different from that of the Fusarium species and is shown in Figure 4. Paecilomyces lilacinus has also been recorded as infecting reptiles, once again being a major cause of problems in turtles. It has been isolated frequently from crocodile nesting material. Chrysosporium spp. The third fungus of interest is Chrysosporium species. This genus is related to the ringworm fungi. It is keratinophilic (keratin-loving) and thus an opportunistic pathogen of skin. It is another fungus that is commonly found in soil and has been incriminated in diseases of chickens, snakes and chameleons. These fungi have been incriminated in three different disease aetiologies in crocodiles over the past ten years.
a) fungal growths on the backs of hatchlings b) mortalities due to liver infections c) mortalities due to skin lesions.

68
a) The fungal growths seen on the backs of hatchling crocodiles in the tanks are usually due to
growth of Fusarium solani or Paecilomyces lilacinus on the oil from chicken or fish meat given in the diet. The oil from these feeds forms a film on the top of the water and transfers to the crocodile (especially on the back) as the hatchling comes out of the water. The temperature and humidity are ideal for growth of the fungi that is usually noted as a pinkish or lilac fluffy area on the backs of the hatchlings and is more easily discernible under the water. This condition is non-fatal and easily resolved with a disinfectant (such as formaldehyde) that can be added to the water. An effective dose is a daily addition of 0.003% formalin to the water, ensuring the crocodiles are in the water at the time. The formalin flushes out of the system fairly quickly so there are no lingering effects.
b) Mortalities due to liver infections have been caused in Queensland by both Fusarium solani
and Paecilomyces lilacinus. It is a disease of hatchling crocodiles up to one to two months of age. The fungus enters the egg shell from the nesting material after lay either through cracks in the shell (Figure 5) or via passage through the pores of the egg shell. Both of these fungi appear to have easy entry through the pores that is not seen with other common fungi such as Aspergillus and Penicillium species.
Figure 5. Cracks in Laid Crocodile Egg Shells that have been Colonised by Fusarium solani. Whether the fungus can penetrate the egg and cause liver infection in the embryo depends on 1) fungi present in the nesting material 2) washing of the eggs before incubation 3) virulence and strain of the fungus 4) presence of large air sacs within the eggs (Figure 6) 5) genetic capacity 6) ability of the egg membrane and the albumen in controlling entrance of the fungus.
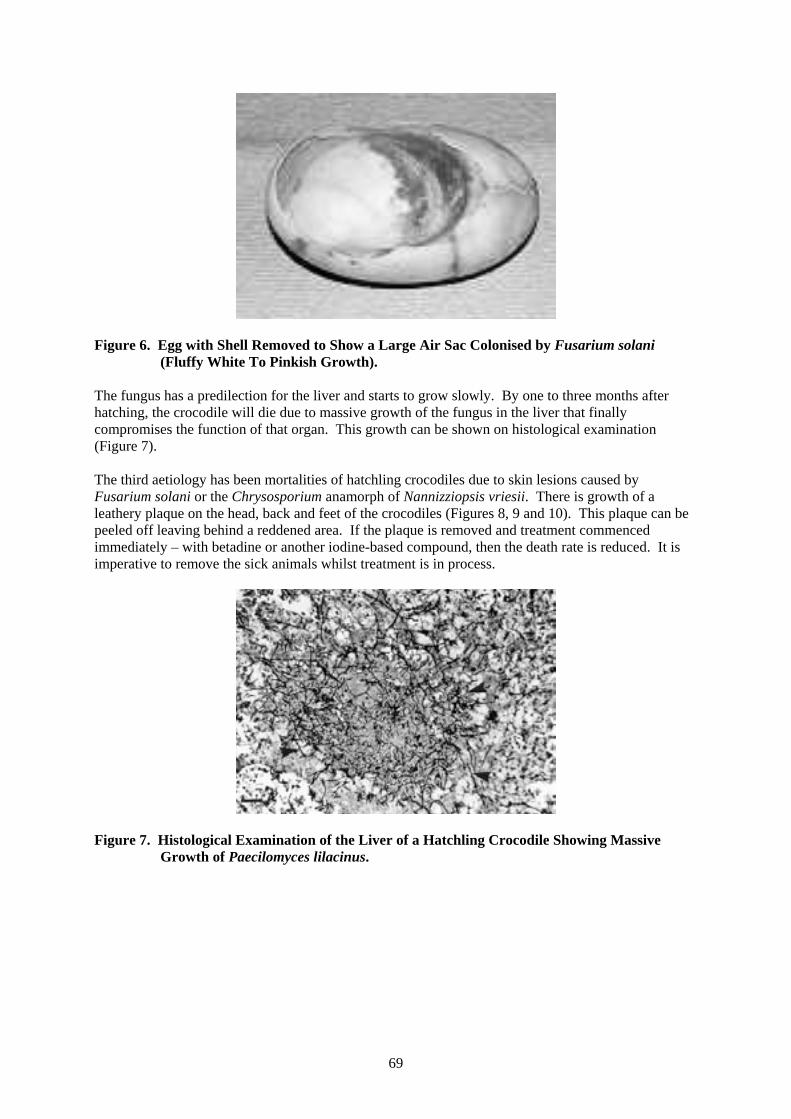
69
Figure 6. Egg with Shell Removed to Show a Large Air Sac Colonised by Fusarium solani
(Fluffy White To Pinkish Growth). The fungus has a predilection for the liver and starts to grow slowly. By one to three months after hatching, the crocodile will die due to massive growth of the fungus in the liver that finally compromises the function of that organ. This growth can be shown on histological examination (Figure 7). The third aetiology has been mortalities of hatchling crocodiles due to skin lesions caused by Fusarium solani or the Chrysosporium anamorph of Nannizziopsis vriesii. There is growth of a leathery plaque on the head, back and feet of the crocodiles (Figures 8, 9 and 10). This plaque can be peeled off leaving behind a reddened area. If the plaque is removed and treatment commenced immediately – with betadine or another iodine-based compound, then the death rate is reduced. It is imperative to remove the sick animals whilst treatment is in process.
Figure 7. Histological Examination of the Liver of a Hatchling Crocodile Showing Massive Growth of Paecilomyces lilacinus.

70
Figure 8. Initial Lesions of a Skin Condition Caused by Fusarium solani.
Figure 9. Consolidated Growth of the Fungus on the Back of the Head and the Snout of a
Hatchling Crocodile.
Figure 10. Lesions of the Tail Region. The lesions grow not only on the skin but also penetrate through the upper skin layers. This growth can be seen on histological examination of the skin tissue (Figure 11).

71
Figure 11. Histological Examination of the Upper Skin Layer of a Hatchling Crocodile. The
Fungal Hyphae are Evident Throughout the Tissue as well as the Presence of Arthroconidia Typical of Chrysosporium Species.
When the fungal hyphae penetrate the dermis, then treatment becomes very difficult. Often, bacterial septicaemia ensues. As in most cases of disease, prevention is better and cheaper than a cure. The best preventative is the addition of disinfectants in the water system. Two of the more used disinfectants are chlorine and formaldehyde derivatives. Both are effective when used separately but should never be used together because of the production of carcinogenic compounds when they are mixed. Formaldehyde is used frequently in the poultry industry for the fumigation of eggs, incubators and rooms with very good results. Chlorine disinfection Chlorination is probably the oldest and most widely used form of drinking water disinfection. The advantages are:
• relatively inexpensive • easily obtained • residual protection in the distribution system • strong oxidising agent.
The most common dry form of chlorine is calcium hypochlorite [Ca(OCl)2] which gives 70% available chlorine when dissolved in water.

72
The diagram below shows the breakdown of calcium hypochlorite when it is added to demand medium. Ca(OCl)2
Total residual Chlorine demand (available) chlorine (lost for disinfection purposes) a) free available chlorine a) inorganic (Fe++,
1) elemental (Cl2) Mn++, NO2-) chlorides
2) hypochlorous acid (HOCl) 3) hypochlorite ion (OCl-) b) organic (not amines)
b) combined available chlorine
1) ammonia (chloramine) 2) nitrogenous compounds
(N-chlorocompounds) Ca(OCl)2 + H2O Ca++ + H2O + 2OCl- Ca(OCl)2 + 2H2O Ca(OH)2 + 2HOCl HOCl H+ + OCl-
The disadvantages of using chlorine are: a) the bactericidal activity of the calcium hypochlorite is dependent on the production of
hypochlorous acid and hypochlorite ion. The shift in the third equation is pH dependent and acid production will cause a shift in the equilibrium and there will be more production of hypochlorous acid which is a more effective bactericide than the hypochlorite ion.
This is seen as follows
At a pH of 5, 99.7% of the free chlorine is available as the more active hypochlorous acid At a pH of 7, approximately 80% is available At a pH of 8, approximately 22% is available At a pH of 8.5, 10% is available At a pH of 9, 0% is available.
This can be a problem where local councils or farmers keep the water supply at pH of 7.5 to minimise pipe corrosion or where the river water has a pH value of 7.5 to 8. b) the presence of organic compounds can reduce the amount of available chlorine for disinfection.
For example, when chlorine reacts with ammonia in water, the resulting reactions can form chloramines – monochloramine (NH2Cl), dichloramine (NHCl2) or trichloramine (NCl3) depending on the pH of the water – which are less effective than hypochlorite as a disinfectant

73
c) increase in temperature results in a more effective killing of bacteria however, above 45oC, more
chlorine needs to be added to overcome the thermal decomposition of the chlorine compound at that temperature
d) contact time is important. Chloramines have a slower killing time than the hypochlorite ion and
hypochlorous acid and with heavy concentrations of bacteria in the water, there must be a reasonable contact time maintained before the treated water is passed to the system in use
e) bacteria can form biofilms at water/solid interfaces which are much more resistant to disinfection f) settling tanks allow for removal of excess organic matter. 2-6 mg/L of free residual chlorine is
sufficient where settling tanks are in use. Up to 10 mg/L of free residual chlorine may be needed where water is not filtered or allowed to settle. However, the presence of large concentrations of chlorine leads to the production of chlorophenols and their associated unpleasant flavours.
Monitoring of chlorine levels in the concentrated drums is essential as the chlorine levels will drop off by a factor of 10% per month until the product becomes water. Apparatus such as a Lovibond Comparator can measure the free residual chlorine but cannot differentiate between hypochlorous acid and hypochlorite. Formaldehyde disinfection Formaldehyde is a colourless gas with a strong, distinctive odour and is normally present at low levels in both indoor and outdoor air. It is liberated into the air from burning wood, kerosene and natural gas, as well as from automobiles and cigarettes. The urban concentration (higher than in rural areas) is approximately <0.03 ppm. It is a volatile organic compound, which means that the aqueous form becomes gas at normal room temperature and is liberated faster at higher temperatures. In solution (at approximately 37% formaldehyde), it is known as formalin and is used mainly as a preservative or disinfectant in the medical field. It destroys bacteria, fungi, yeasts and some viruses and its commercial importance as a fungicide is its use as a disinfectant. Formaldehyde is a strong reducing agent, especially in the presence of alkalis. Its action probably relies on combination with free amino groups of the proteins in the cell protoplasm, whereby it injures the nuclei and coagulates the proteins. Its chemical formula is CH2O H H OH C O + O C H H H H OH Formaldehyde water formalin (0.1%) (99.9%) At 0.8 – 1.0 ppm, there is a noticeable odour and from that concentration up it can be of a poisonous nature and irritating properties including tiredness, dizziness, sore nose, eyes and throat, nausea, headache and allergies. Prolonged exposure to higher doses (above the threshold level) can result in an impaired respiratory system, impaired liver and kidney function, cancer and reproductive problems. Its main usage is the disinfection of rooms, walls, floors, etc. It is best used in water at 1 ppm but in crocodile farms, it has been used at 10 ppm as a per diem addition. In one case of fungal infection, the amount was raised to 40 ppm (twice daily). This worked very well but obviously the hazard to the workers is great and needs to be considered.

74
Fungal contaminants are a real problem in tropical areas and even more so in the crocodile industry. The temperature and humidity requirements for the growth of hatchling crocodiles are also the ideal temperature and humidity for fungal growth. Routine vigilance is required to ensure that fungal diseases do not become a fatal problem of crocodiles. 4.5.2 Opportunistic Treatments of Fungal Diseases in Hatchling Crocodiles Introduction Fungal diseases in hatchling crocodiles can be a major cause of mortalities on farms. Fungi are opportunistic pathogens and fungal disease can generally be associated with a variety of pre disposing conditions. These may be cool conditions, over-crowding of pens and reduced hygiene levels (Buenviaje, 1994; Hibberd 1994). Fungal outbreaks can be difficult to treat and consideration needs to be given to the costs of the medication, the ease of application, the time and labour require to treat infected animals and the availability of a separate “hospital” tank or pen to house affected animals. In June 2000, six infected hatchlings from a Queensland farm were sent to Oonoonba Veterinary Laboratory, Townsville. One animal died in transit. Samples of plaque (necrotic tissue) from the jaw, head and foot of the two worst infected hatchlings were taken. The remaining animals were in reasonable body condition and were in a “mild” state of infection (see Figures 1 and 3). Nothing abnormal was seen during the post mortem examination of the dead hatchling, while the histological examination also revealed no significant lesions in the internal organs. Fusarium sp was isolated from the skin samples. Control methods have been tried with mixed success in the past which include treating the water, treating the affected hatchlings and changing the environment that the hatchlings are raised in. Treatments included the use of soda ash to increase the pH of the water and malchite green, (McInerney, pers. comm.), potassium permanganate (Foggin 1987) salt and formalin (Thomas 1995), bathing hatchlings in betadine antiseptic solution and periods of drying out the crocodiles environment (McInerney pers comm). The five remaining hatchlings therefore presented an opportunity to examine different medication that maybe useful in controlling fungal diseases in crocodiles. This investigation is opportunistic in nature, there was no opportunity for replication of treatments due to the few hatchlings involved and the availability of pen space. Medication The medications used in this investigation were:
• Lotagen Gel® • Lotagen Concentrate®.
Both the Lotagen Gel® and Lotagen Concentrate® are astringent/antiseptic treatments and are manufactured by Schering-Plough Animal Health and are used in the treatment of wounds, ulcers and abscesses in dogs and mulesing, castration in sheep. Both have the same active ingredient, metacresolsulfonic acid and formaldehyde (IVS2000). It was suggested (R.Murray, pers. comm.) that these medications maybe be useful in controlling fungal disease in crocodiles. The treatments act on necrotic tissue and aid in the healing process. Both treatments have bactericidal and fungicidal properties. Both medications can be purchased by the general public and as such are listed as S6 medication in the Poisons Schedule. Lotagen Concentrate® has a withholding period of 28 days for meat, while there is no withholding period for the gel (IVS 2000). Both products were purchased from a local veterinary supply company.

75
Treatment
• one hatchling was not treated (control) • two hatchlings were treated with the Lotagen Gel® • two hatchlings were treated with the Lotagen Concentrate®.
Hatchlings were housed in a large plastic realm tank which was divided into three compartments. The water was heated by using a 50 watt aquarium heater per compartment. A small electric fan forced heater was used to heat the air. For the first week the air heated to 32-33°C while the water was held at 28-29°C. This was to allow the hatchlings to keep warm and dry and to act as a deterrent from going into the water. Keeping the hatchlings dry for periods of time reduces the spread of the fungi (McInerney pers comm). It should be noted that care needs to be taken to ensure animals do not suffer from dehydration. The water temperature was then increased to 31-32°C for the rest of the investigation. The hatchlings were caught and place into two small plastic dixies for treatment. Rubber bands were used to keep their mouths closed, so treatment could be carried out more effectively. Hatchlings were treated twice daily for the first three days followed by daily application for four days followed by a two day break followed by three further treatments over four days. The Lotagen Concentrate® was applied to two hatchlings at the recommend rate of 20% dilution. The mixture of concentrate and water was then applied over the entire animals, with the excess being drawn up by a 20 ml syringe from the bottom of the dixie and re applied three times over the animals. The animals were then left for 30 minutes before returning to the tank. A small amount of Lotagen Gel® was applied to the back of two animals and then rubbed over the entire animal (both on top and the underside of each animal). Animals were then left in their dixie for 30 minutes before being returned to the tank. Discussion Four of the hatchlings recovered, including the control. One animal from the Concentrate treatment became infected again on the underside near the right hind leg. This may have been partly due to ineffective coverage of the treatment to this part of the hatchling. This hatchling was treated with betadine antiseptic solution® daily for three days. The fungi persisted and the same hatchling was then treated with SM33 (antiseptic gel used in the treatment of inflamed gums and mouth tissue) which was purchased from the local chemist for $8-40 and used once to put a seal over the affected area. The initial period of allowing the animals to dry out was effective in preventing the fungi hyphae spreading in the control animal. The control animal was eating small amounts of food while the treated animals did not eat anything during the treatment period presumably due to the stress of handling and treatment. A week after the treatments had ceased the hatchlings began eating small amounts of feed. No new outbreaks could be seen on any of the hatchlings. In terms of application the “pour on” concentrate was less labour intensive than applying the gel. This would be especially time consuming if large numbers of hatchlings are involved which is often the case. The opportunity to treat the hatchling while they were in reasonable body condition and “mild” state of infection was conducive to their recovery.

76
Conclusion Crocodile diseases are difficult to treat. Temperature control is critical in the preventing, controlling and treating disease. The old adage of prevention is better than cure is certainly true when treating crocodiles. The use of formaldehyde as a general husbandry practice during the cooler months is useful. We have found a combination of 0.01 per cent of formaldehyde (twice daily) and betadine antiseptic solution to be effective in controlling Fusarium sp and Chrysosporium sp. The above combination of treatments would be cheaper and just as if not more effective than the Lotagen concentrate, given that one hatchling remained affected and we had to use Betadine and S33 gel. The gel treatment would be difficult and time consuming if large numbers of hatchlings were involved. The control treatment of long periods of drying out the environment was also effective on this one particular hatchling and cost nothing. Table 1 sets out the details of this investigation. Table 1. Fusarium solani – Crocodiles with Lesions
Lotagen Concentrate (Liquid)
Lotagen Gel (Ointment)
Dosage • 30mls/crocodile • 20% concentrate twice daily for
3 days • once daily for the next 7 days
• approximately 1gm/crocodile • twice daily for 3 days • once daily for the next 7 days
Application • remove plaque (dead skin). • use swab to remove the fungal
hyphae which grow in the dead tissue
• squirt solution and then re do 3 times
• allow to dry for 30 minutes .
• remove plaque with swab • apply ointment to animals and
rub in • allow to dry for 30 minutes
Cost • $31 per 100ml bottle
or • $283 for I L
• $8 per 20gm tube
Advantages • easier to apply than the gel
• controlled the infection on the
two animals that were treated
Disadvantages • 1 animal became reinfected. • Very expensive
• reasonably expensive. • Labour intensive

77
Table 2. Previous Treatments Used on Other Fungal Diseases
Betadine Antiseptic Solution (Liquid)
Formaldehyde (Liquid)
Dosage • apply ad lib for good
coverage/crocodile • once daily for 2 weeks
• 20 mls/ 160L tank 0.01% • once daily
Application • remove plaque with swab. • swab and pour onto animals
• apply to clean water
Cost • $35 for 2L
• $80 for 20L
Advantages • effective in controlling Fusarium &
Chrysosporium.sp. (Research Bulletin No 1 p67).
• used in general husbandry
as a preventative treatment. • effective against Fusarium,
Paecilomyces and Chrysosporium spp.
• cheap • easy to apply with 20ml
syringe.
Disadvantages • can be labour intensive if swabbing
or bathing individual animals. • spraying easier but be careful of
animals’ eyes
• care needed when using,
wear gloves and avoid contact with skin
Figures 1 and 3 show hatchlings before treatment. Figures 2 and 4 show hatchlings after treatment with Lotagen Gel and Lotagen Concentrate respectively.
Figure 1. Hatchling Before Treatment

78
Figure 2. Hatchlings after Lotagen Gel Treatment
Figure 3. Hatchling Before Treatment
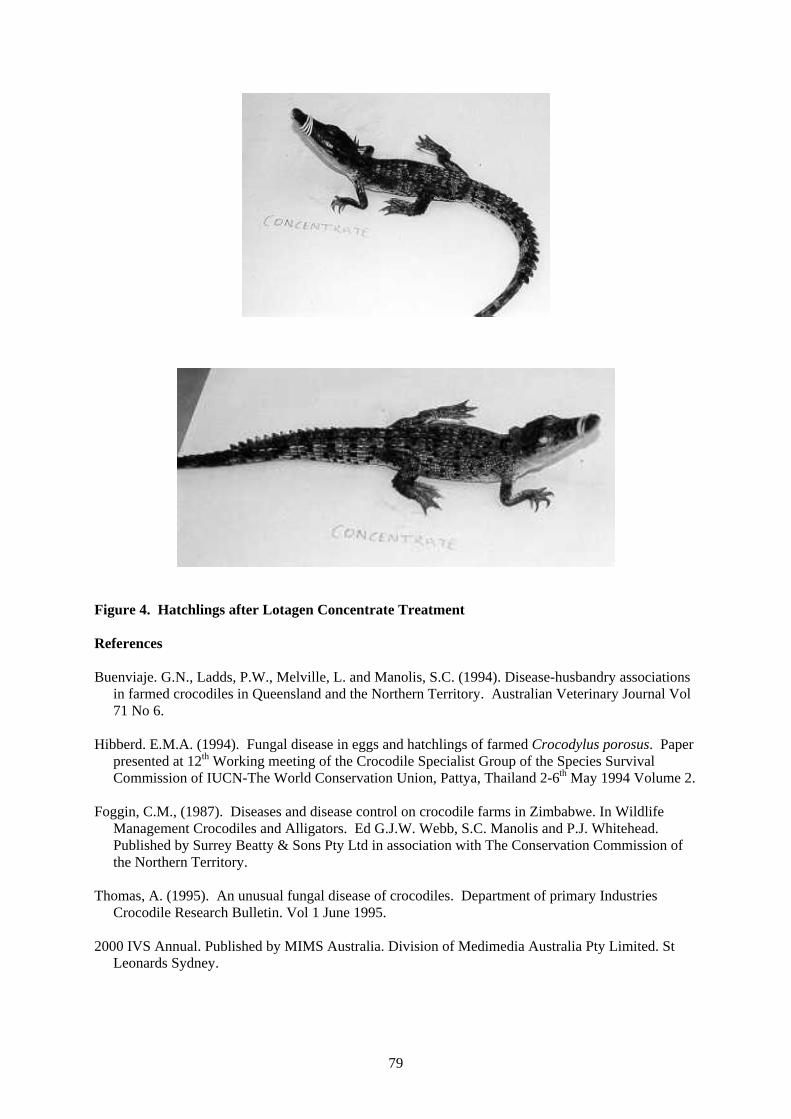
79
Figure 4. Hatchlings after Lotagen Concentrate Treatment References Buenviaje. G.N., Ladds, P.W., Melville, L. and Manolis, S.C. (1994). Disease-husbandry associations
in farmed crocodiles in Queensland and the Northern Territory. Australian Veterinary Journal Vol 71 No 6.
Hibberd. E.M.A. (1994). Fungal disease in eggs and hatchlings of farmed Crocodylus porosus. Paper
presented at 12th Working meeting of the Crocodile Specialist Group of the Species Survival Commission of IUCN-The World Conservation Union, Pattya, Thailand 2-6th May 1994 Volume 2.
Foggin, C.M., (1987). Diseases and disease control on crocodile farms in Zimbabwe. In Wildlife
Management Crocodiles and Alligators. Ed G.J.W. Webb, S.C. Manolis and P.J. Whitehead. Published by Surrey Beatty & Sons Pty Ltd in association with The Conservation Commission of the Northern Territory.
Thomas, A. (1995). An unusual fungal disease of crocodiles. Department of primary Industries
Crocodile Research Bulletin. Vol 1 June 1995. 2000 IVS Annual. Published by MIMS Australia. Division of Medimedia Australia Pty Limited. St
Leonards Sydney.
80
4.6 Genetics
4.6.1 Improving the Commercial Performance of Grower Crocodiles by Genetic Selection Newly hatched crocodiles vary considerably in size within clutches and from clutch to clutch. This variation has implications for commercial production in that the variation in size remains over the entire growing period of the animals. As a result of this variation animals reach processing size at different ages and slower maturing animals have to be held longer. Ideally, an all in all out system should apply, that is, hatchlings produced in the same season should be harvested at the same time. The practice of staggered harvesting presents problems with production efficiency because housing has to be found for slow maturers and it takes more labour to get these animals to market. Some producers are interested in reducing the variation in cohorts and in an attempt to reduce this variation want to apply genetic selection. To this end a geneticist will work with some producers who have captive breeder colonies and it is proposed to use the BLUP program to make genetic progress. A paper covering the BLUP proposal has been produced by Dr Cam McPhee and is presented in this report. Most farm livestock have been substantially improved over the past 50 years by selection programs based on the scientific principles of quantitative genetics. I have demonstrated this myself in populations of a number of species during my 40 yr career as a livestock geneticist with QDPI. These populations have been on commercial and research farms . Currently our pig research herd at Biloela Research Station is $100 per sow per year more profitable than it was at the start of a selection program 5 yr ago. Harvest weight in Redclaw crayfish is currently being increased by 10% per year by a selection program at Walkamin Research Station. On a larger scale, the British have used selection to improve the profitability of their pigs by 2% per year compounding for the past 35 yr. Overall this has amounted to a doubling in the value of the pig to the community, mainly through a shorter time to slaughter, less food used and a reduction in carcass fat. The Selection Process Selection is the process of choosing new breeding animals for replacing the ones culled before each breeding season, This can be seen as a two stage process.
1. Evaluating the quality of the genes each animal has for the trait or characteristic (eg. growth rate) to be improved.
2. Replacing breeding stock found to have low quality genes with those with high quality
genes Evaluating an Animal's Genes How do we evaluate the quality of the genes a given animal has for a particular trait eg. growth rate? In the past, progeny testing was a method that was used to determine the quality of an animal's genes by measuring the growth rate of its offspring. Nowadays we can determine the quality of an animal's genes whether or not it has had progeny. First we have to measure the growth rate of the animal itself as accurately as possible.
81
Then we have to identify the non-genetic factors which could affect this growth rate eg. sex, environmental factors such as type of food, age at measurement. The animal's growth rate would still be influenced by a host of non-genetic factors difficult or impossible to define eg. behaviour, parasite burden, immunity status. So the growth rate we measure on an animal can only be an indication of the genes it carries for the trait. Some additional clues to the quality of the genes an animal carries can be gained by studying the growth of its relatives. This is because related animals share the same genes by virtue of their ancestors being the same. For example, full sibs have both parents the same and have 50% of their genes in common whereas half sibs have one parent the same and 25% of their genes in common. This means that the performance of a full sib tells us more about an animal's genes than the performance of a half sib. If we have accurate measures of the performance of an animal and its relatives and we are able to identify and define the most important non-genetic factors which affect this performance, then we can gain an estimate of the value of the genes it carries for that performance trait eg growth rate. If we use this animal for breeding it passes its genes to all of its offspring and this in turn affects their growth rate which in turn affects their profitability. Calculating Breeding Values There is now a sophisticated computer program which can estimate this genetic value for all animals in the population which have had performance measurements taken on them, whether they be young or old. The program, called BLUP, takes into account, not only an animal's performance but also that of its relatives and its degree of relationship to these relatives and the environmental influences on these performances. All this information is then collated by the program into a Breeding Value (BV) for each animal. BVs can be + or -. Animals with + BVs have better than average genes for a particular performance trait and those with - BVs have worse than average genes. Since an animal gets 50% of its genes from its sire and 50% of its genes from its dam, the expected performance of an animal is the average of its sire's and its dam's BVs. Thus, if a sire's BV for weight at turnoff is +15kg and the dam's +5kg, then their offspring are expected to weigh (15+5)/2 = +10kg more than average at turnoff. The selection process ensures that, at mating, all the male and female breeders in the population have the highest BVs for the trait that is being improved To achieve this, before each season's matings are carried out, BVs for all animals eligible for breeding should be estimated using the BLUP computer program. Only those which have the highest BVs for performance should be kept for breeding, provided they are physically sound. The remainder should be culled if they have been breeders in previous seasons or sold for slaughter if they are young growing stock. The more breeders culled and replaced in this way each breeding season, the faster will the growth rate of animals in the population improve.

82
Performance Recording For the program to be successful, accurate records need to be kept. The minimum records for each animal hatched are as follows: Breeding location Growout location Animal ident. number. Sire number Dam number Sex Hatching date and weight Finishing date and weight Predicting Improvement Given this information and assuming that it is accurate, we can predict the year by year improvement possible from a selection program. Each year's performance is determined by the average BV of the male and female breeding stock whose progeny are finished in that year. This average BV increases as older breeders with low BVs are culled and replaced by younger animals selected for their high BVs. For example, if 10% of the breeders are culled each year and these are replaced with young stock whose BVs for finishing weight average 10kg higher than the previous year's, then the annual rate of genetic improvement per animal turned off for sale is 10% of 10kg = 1kg. The selection program described has been aimed at improving growth rate but the same procedure could be used to improve any trait of economic importance which can be measured eg. number of scale rows. Success however, will be directly related to the accuracy of record keeping.

83
4.7 Capture
4.7.1 Refinement to Electrical Stunning Equipment to Capture Crocodiles Since our original article on stunning equipment (RIRDC Publication No.00/105) several improvements have been made to the stunning wands. The improvements have their foundations in feedback from producers and our own experiences. Stunning equipment is seen to offer several advantages and this is why we have attempted to improve the equipment further still. The advantages include: • a catch and release principle for animals ready for harvest - animals with damaged skins are
released to recover in the hope of a better return to investment after recovery • according to producers’ reports more animals can be handled in a day with the same labour force • animals recover more readily after stunning than when captured by hand - they resume feeding
more readily and also return to the water sooner • it is safer, quicker and easier for handlers to capture crocodiles which pose a threat (>1.0 metre)
with stunning equipment. The original wands were made from PVC pipe or fibreglass. The limitation with this equipment was that animals sometimes damaged the wands, biting down hard and cracking the PVC or fibreglass. As a result of this damage the possibility of water making contact with electrical cables arose and we saw this as an unacceptable risk. To overcome the risk the research team moved to stainless steel tubing. In fact the first of the stainless steel wands was reported in the initial RIRDC publication on stunning equipment. Stainless steel wands can be used on mains power provided a transformer is used or a belt power pack. The first stainless steel prototype was too heavy. The subsequent wands were made of lighter material making the operator’s job much easier – see Figures 1 and 2 for comparison.
Figure 1. Front View of Stainless Steel Figure 2. Side View of Stainless Steel
Wands – Prototypes 1 and 2 Wands – Prototypes 1 and 2 Besides reducing the wand’s weight by reducing material thickness the angle on the wand’s neck was changed (see Figure 2 for comparison). The change in angle allowed for distance between the operator and the animals to be increased and at the same time improved the application of the stunner to the animal’s neck.
1st Prototype
2nd Prototype
1st Prototype
2nd Prototype
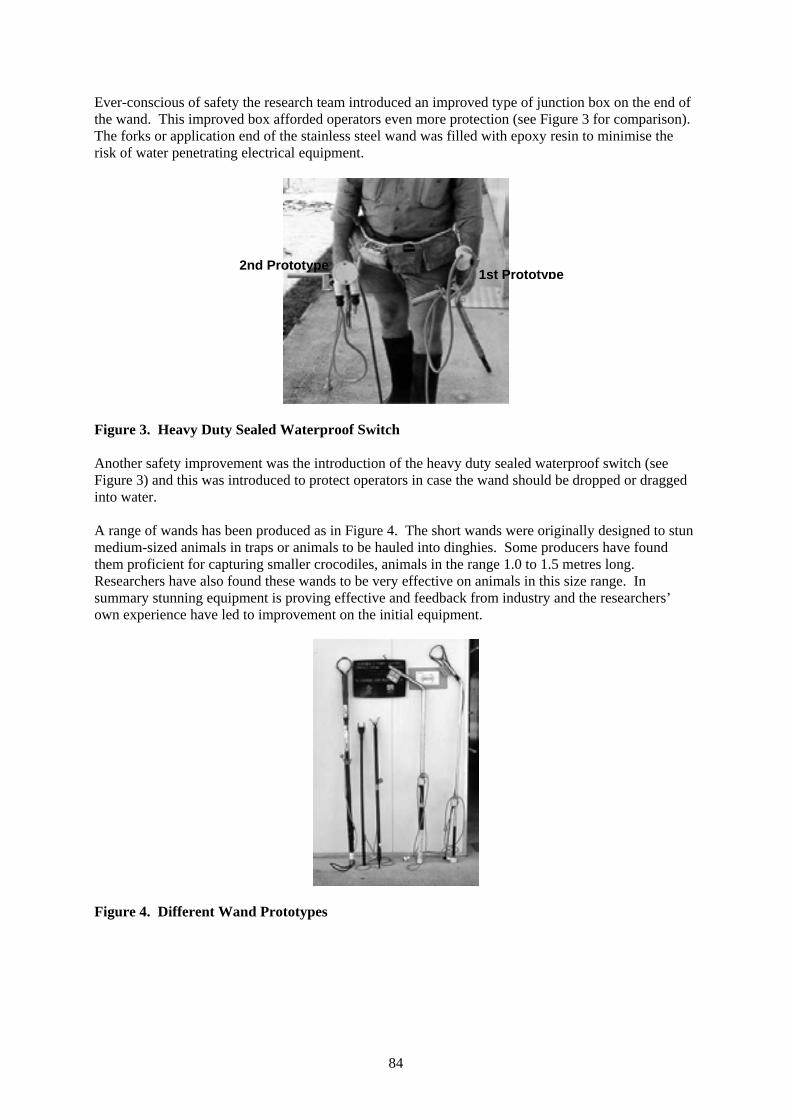
84
Ever-conscious of safety the research team introduced an improved type of junction box on the end of the wand. This improved box afforded operators even more protection (see Figure 3 for comparison). The forks or application end of the stainless steel wand was filled with epoxy resin to minimise the risk of water penetrating electrical equipment.
Figure 3. Heavy Duty Sealed Waterproof Switch Another safety improvement was the introduction of the heavy duty sealed waterproof switch (see Figure 3) and this was introduced to protect operators in case the wand should be dropped or dragged into water. A range of wands has been produced as in Figure 4. The short wands were originally designed to stun medium-sized animals in traps or animals to be hauled into dinghies. Some producers have found them proficient for capturing smaller crocodiles, animals in the range 1.0 to 1.5 metres long. Researchers have also found these wands to be very effective on animals in this size range. In summary stunning equipment is proving effective and feedback from industry and the researchers’ own experience have led to improvement on the initial equipment.
Figure 4. Different Wand Prototypes
1st Prototype 2nd Prototype

85
4.8 Economics Two computer programs are available tot he crocodile industry namely:
• CROCTEL • CrocProfit.
4.8.1 CROCTEL – A Computer Program to Monitor Commercial Breeder Performance Mayer (1998) states that the impetus for developing standard computerised on-farm data recording schemes has its foundation in a number of different areas. In Australia, crocodile farms are required by legislation (since crocodiles of both native species are ‘protected’ animals) to compile and submit regular statistical information on the numbers of eggs and animals of different ages/categories that they have on their farms. At earlier information seminars farmers suggested that it would be useful if a computer program could be accessed (specifically developed of modified from existing programs) which would enable them to automatically ‘spit out’ information required by authorities in a form suitable to them. Such an organised system with its requirement for regular, accurate input of basic farm data would lead to more accurate figures than currently being assessed for audit purposes. CROCTEL has been available to the industry for several years as a program to compile statistical records required by government agencies. The Convention on International Trade on Endangered Species (CITES) is a typical example of where this program was supposed to be useful for industry. Despite the availability of CROCTEL it has not been readily adopted by industry to satisfy CITES requirements. It is difficult to pinpoint why the program has apparently floundered. Perhaps producers consider CROCTEL too complex, or learning new skills takes time and comparatively speaking record keeping is a low industry priority. In the Northern Territory it may have its foundations in the fact that government officers conduct audits of animal numbers. It might simply be that it will take longer to change recording practices than anticipated. Queensland producers have used CROCTEL to monitor on-farm research performances. For instance, CROCTEL was used to record and analyse the performance of captive breeders for vitamin and non-vitamin supplemented diets. In this instance CROCTEL provided a useful service. However to actually get production figures into a format where CROCTEL could be readily used took several farm visits by QDPI officers. It seems learning the necessary skills to use CROCTEL may pose a barrier to adoption rather than a reluctance by producers to make information available. It could well be that researchers had unrealistic expectations about the time it would take producers to adopt CROCTEL
4.8.2. CrocProfit – Decision Investment Tool for Farmers and Investors CrocProfit is a forecasting, decision investment tool designed to assist producers and potential investors. The program could be used to determine if in fact investors should be involved in crocodile farming. For example, the investor can use the program to establish the best, most likely and the possible poorest outcome by varying inputs such as feed and hatchling costs. The investor might want to hold costs constant but vary mortality rates and feed consumption to see how these impact on the bottom line. Another combination might be for the investor to increase production costs and decrease the price for skins to see how they impact on profitability. The program is flexible to the extent that it gives the investor the opportunity to change any input to determine its impact on the farming operation. CrocProfit has been distributed to established producers and is available to potential investors. In September 2001 a workshop will be conducted to take producers through CrocProfit. At the same time feedback will be sought from industry about the program and suggestions for improvement noted.
86
4.9 Extension
4.9.1 General There have been quite a number of avenues set up for regular input by industry (in Queensland, Northern Territory and Western Australia). Several extension methods are used to reach target audiences and include – • Crocodile Capers • Crocodile Research Bulletin • computer software • workshops • site visits – farms and offices. • DPI Technical Notes Crocodile Capers is a technical publication written along populist lines and easy to read. It is restricted to four pages so by necessity articles are short and frequently direct the reader to other publications. Crocodile Capers is produced twice yearly and has proven popular with readers. Crocodile Research Bulletin is a formal, detailed document aimed at reporting both research and development results. Two Bulletins have been produced to date and a third is due to be published in 2001. The earlier documents have been bound publications but the third document will be a loose leaf, ring binder document designed to accommodate technical updates on different topics. Computer software is very specific in its function and directed at established producers or prospective producers and the latter in particular. For example in 2001 the spreadsheet CrocProfit has been produced which allows clients to enter their own figures and determine if they want to be involved in crocodile farming. This software can be linked to the DPI Notes to obtain a useful insight for clients with little or no crocodile farming knowledge. Workshops are directed at established producers. In the immediate past one day workshops covered five to six subject areas which producers found demanding and difficult to come to terms with the central message. As a result of this experience a request has been made to conduct workshops more frequently, deal with one topic only and work on that topic in an interactive way rather than using the lecture technique. To this end a three-hour workshop will be conducted in September 2001 covering CrocProfit where producers will be given the opportunity to work through the program with the lecturer determining just how useful CrocProfit is to them as a commercial tool. Further producers will be asked if adjustments to the program are necessary to make it more suited to their needs and user-friendly. Site visits can be either farm visits or office visits to local authorities for example who are showing interest in crocodile farming as part of regional development strategies. Site visits play a supportive role in the extension strategy rather than a primary role. DPI Technical Notes are designed to address specific issues. For example two technical notes on crocodiles have been produced in 2001 with the titles: “Thinking of Crocodile Farming – Farming Issues to Consider” and “Thinking of Crocodile Farming – Some Licence Issues to Consider”. Both of these articles are directed at producers expanding farming operations and in particular are designed to assist new industry entrants (see Appendix 1).
87
5. Discussion of Results Nutrition Pelleted feeding is a high industry priority and one that is being pursued by the research team. Manufactured feed for crocodiles has proven to be a complex, difficult issue. The key complexity is one of manufactured diet acceptance by crocodiles which have proven to be fussy feeders despite their fearsome reputation. To be specific the main difficulty is enticing animals to consume sufficient quantities of feed to promote optional growth rates. Researchers are addressing the acceptability challenges by conducting a series of free choice feeding exercises which allow the crocodile to demonstrate its preference for a particular ingredient. Once preferred ingredients can be identified they will be blended into balanced diets and offered to crocodiles. Growth rates will be measured and compared to animals on chicken head diets. So far researchers have established that it is possible to manufacture on-farm, cold pressed pelleted feed. The quality of pellets is excellent in that they do not readily break down in water. Adding ingredients to pellets so they float would not cause feed milling problems on farm. In addition, manufactured feed offers a 2.4:1 ratio over offal diets on a dry matter basis. This advantage translates into ingredient, transport and storage savings for producers. Husbandry Husbandry research has addressed several areas including stocking densities, water levels, hideboards and water temperatures for both hatchling and grower crocodiles. Water temperature has been shown to influence growth rates. Stocking densities influence dominance and subsequently skin quality. Husbandry research is on-going. However one of the key innovative husbandry practices being investigated/developed by industry lies outside the scope of the R&D program and has to do with individual pens and cages for grower crocodiles. Housing Crocodile farming is described as an emerging industry and as such has less experience with commercial intensive livestock principles than more established industries such as pigs and poultry. Despite this comparative lack of intensive livestock skills, the crocodile industry is making good progress in closing the gap. Crocodile farming is moving from extensive outdoor practices which are much influenced by climatic conditions to intensive housing with some environmentally-controlled housing being used for hatchlings on commercial farms. Several producers are going a step further and creating individual pens for grower animals to reduce fighting and skin damage, thus placing a more valuable product in the market. These practices also allow for the production of more skins per labour unit. Effluent Management Effluent issues generally have received considerable attention from the Australian and state governments. These concerns have two sources; one is domestic while the other is international. Domestically, Australians are becoming more conscious of their environment and how it is managed and as a result are putting pressure on governments to manage better eg. water salinity and the Murray River. Internationally the issues of global warming and greenhouse emissions have brought pressure to bear on governments. These pressures are applied to you as commercial livestock producers through having to meet ever-increasing requirements directed at protecting the environment. The effluent overview is presented with these pressures or requirements in mind. Further the overview is directed at acquainting producers with a range of options which might be employed when it comes to addressing effluent discharges from their farms. Each producer will need to see the alternative

88
strategies in the context of their specific responsibilities which will be largely determined by their local authority and their particular state’s Environmental Protection Agency. The information in the effluent management section is provided as general advice which would need to be modified to meet specific situations. Diseases Crocodiles tend to suffer from few collective or colony diseases as growers and adults. As hatchlings, crocodiles are susceptible to fungal diseases and this report concentrates on fungi isolated at Townsville and their control. The study of fungal diseases is on-going in an attempt to gain a better understanding of how these organisms affect animals. It has been established that Fusarium solani,, Paecilomyces lilacinus and Chrysosporium sp. are the primary causes of deaths in Queensland’s commercial crocodile populations. If producers are experiencing problems with fungal diseases they are invited to contact QDPI at Townsville for assistance. The experienced research team there will provide assistance in identifying fungi and providing suggestions on their control. Genetics Genetics is a relatively new field in commercial crocodile production. It is important to Queensland producers in particular because they are primarily dependent upon hatchlings from captive breeders. This is unlike the Northern Territory where producers largely depend on ranching programs (that is, collecting eggs and/or hatchlings from designated locations in the wild which are closely monitored) for their hatchlings. Western Australia will also benefit from the scheme because most of their hatchlings are farm-bred. Some West Australian farms have individual grow-out pens and this will allow for careful monitoring of individual animals’ progress and link this back to parent stock. Capture Crocodiles are powerful aggressive animals. Catching them by hand is no simple task. Researchers have collaborated with two electrical companies to develop electro-stunning wands. Wands deliver a controlled shock to the animal (110 volts for four seconds) which renders the crocodile powerless for approximately five minutes. During this time the animal can be secured and measured or transported to new quarters. Producers report several advantages for this method of capture including safety issues, more animals can be handled in a day’s work and animals recover more rapidly from capture trauma. Considerable international interest has been shown in this equipment. Economics Commercial crocodile production, being a new industry, has little production data available. The crocodile research team has developed CROCTEL, a computer program which has largely monitored the performance of breeder crocodiles. It is proposed to use CROCTEL in support of the genetics program. CrocProfit is a spreadsheet, forecasting tool. It has been distributed to producers on a national basis and will allow them to calculate changes in farming operations. For example it will allow them to estimate the impact of changes in skin price or to determine the effects of shifts in expenditure/income due to moving to manufactured feed. The research team needs to put more effort into implementing these programs now rather than developing more models. Extension Crocodile producers nationally are cooperating with the research team. Seminars, demonstrations, publications and workshops have been employed to keep producers informed of research outcomes. Producers make their priorities known and provide feedback on research programs through the Crocodile Advisory Committee and the overall program is working satisfactorily. However the crocodile R&D program would benefit from more on-farm visits from the research team.

89
6. Implications Several implications have emerged as the result of research outcomes presented in this report including: 1. The report addresses several topics which are important in the farming of commercial
crocodiles and centralises these topics in one document. Experience to date has been that such topics would be spread across a wide variety of publications assuming that the topics were in fact addressed.
2. The R&D program has advanced beyond establishing benchmark standards which was the
primary goal of past programs and is now producing commercial outcomes based on sound scientific principles.
3. Communication, networking and mutual respect have improved in the crocodile industry
leading to improved co-operation which will positively influence co-operation and the rate of technical and economic adoption.
4. Some useful progress has been made in nutritional research which will allow producers to
successfully manufacture cold pressed pellets on farm once the issue of feed intake is successfully addressed.
5. The development and commercial manufacture of stunning equipment has created a safer
working environment for people catching crocodiles and at the same time has allowed more animals to be captured in a day’s work. Further, animals have recovered from capture rapidly, the recovery being more speedy than for traditional methods according to industry feedback.
6. The advent of cages and individual rearing pens has reduced skin damage leading to more top
quality skins reaching the market. It can be expected that industry will take a keener interest in this method of farming.
7. The application of genetics should help address the varied growth performance of crocodiles.
If crocodiles were more uniform in growth responses it would mean animals could arrive at and leave farms at the same time. Consequently the need to hold animals over would be avoided or minimised which can only help financial returns. It can be expected that producers with captive breeders will press for assistance in the area of genetics.
8. CrocProfit development will allow both established and prospective producers to forecast returns on investment. Coupled with DPI Notes on crocodile farming prospective producers should minimise the risk of unwise investment as was witnessed in the ostrich industry. Producers could be assisted to identify areas of inefficiencies in their farming operations by comparing their individual cost of production analysis with that of the industry average.
9. More time needs to be spent by the research team in visiting producers to discuss results in
order to increase producer understanding of outcomes. If researchers can impartially discuss research results it will assist with the rate of adoption.

90
7. Recommendations Several recommendations emerge from this report and include the following issues: 1. Genetic Programs for Captive Breeders Crocodiles vary considerably in size from the time they are hatched. This variation is maintained throughout the life of the animal in our experience as smaller animals tend never to catch up. On some occasions we have had hatchlings delivered to the research station which were healthy and of acceptable size only to see these animals go backwards over time. We have found that whole clutches of animals do not perform well under captive rearing conditions despite a promising start. We are of the opinion that this is not a diet or environmental issue as animals from other clutches experiencing the same conditions grow well. Because we have excellent animal identification the performance of individual animals and animals from the same clutch can be studied thoroughly. Producers in Queensland and Western Australia would benefit from assistance in the genetics area as they keep captive breeders. Further, these producers can trace their hatchlings to parents and can identify hatchlings either individually or by clutch to monitor performance. This on-farm work could also be supported by monitoring the performance of siblings at the Townsville research complex. Assuming genetic programs could reduce size variation in the commercial crocodile population, it would assist producers in attaining the goal of all in all out for specific groups of animals. Improved all in all out performance would improve returns on housing investment and labour. It is recommended that Dr Cameron McPhee, QDPI, provide support with on-farm crocodile genetics for captive breeders in an attempt to reduce the variation in hatching size. 2. Single topic industry meetings. Past QDPI generated crocodile seminars and workshops extended to two days and covered several topics. This approach aimed to minimise costs and use clients’ time to best effect. Queensland clients report that this approach leads to information overload. Clients have suggested that their interests and those of research organisations would be better serviced by having single topic seminars which were held more frequently and extended to a morning or afternoon session. Proximity to clients plays a part in service delivery. As this request came from Queensland producers it will be possible to comply. In the Northern Territory and Western Australia cases the research team will continue to present results for more than one topic simply because of the costs involved in meeting with clients. However, the method of presentation is being reviewed so that the interests of all parties are better serviced. In Queensland, it is recommended that single topic, shorter seminars be held more frequently as requested by clients. Because of costs, it will not be possible to conduct more frequent, single topic seminars in NT and WA but the method presentation will be reviewed. 3. Improving the use of on-farm recording schemes. Three on-farm recording schemes are available to producers namely:
• CROCTEL • CrocProfit • Grower Production Analysis.
CROCTEL was initially designed to record information to satisfy CITES requirements. Despite this proposed use CROCTEL has not found favour with producers. It has been used to some extent to record the performance of captive breeder crocodiles in Queensland but that is only after government officers have visited farms to collect data. It seems that the issue is not one of reluctance to provide

91
information on the part of producers, rather it seems to be an issue of being unable to find time to record data or a problem with an unfamiliar recording format or both. Record keeping and the subsequent analysis of farming records could be very useful in identifying high on-farm costs. CROCTEL will provide both a whole-of-farm analysis and specific area farm analysis such as grower performance. It is yet to be determined if the whole-of-farm CROCTEL approach is perceived to be too complex. If indeed this is an issue a simpler, specific area analysis can be employed while the benefits of recording schemes are demonstrated to clients. It is recommended that a half day workshop is held at Cairns in September 2001 to acquaint producers with CrocProfit in particular and to revisit CROCTEL in an attempt to determine if there are barriers preventing wider use of CROCTEL. Further, it is recommended that government officers visit farmers to assist with data recording. 4. Further developments of pelleted feed for grower crocodile. Several steps have been successfully accomplished in relation to producing pelleted feed for grower crocodiles and include: • the development of feed milling equipment for the on-farm manufacture of cold pressed pellets • the development of technology which consistently produces a high quality pellet which will
remain stable in water • the development of a pellet which could be stored without refrigeration. At this juncture, however, crocodiles do not consume sufficient quantities of pelleted feed to promote body weights in particular and to a lesser degree overall body length and head length measurements comparable to those achieved when crocodiles are fed diets of chicken heads and/or kangaroo meat. Several recommendations are made in order to advance improved pellet consumption and some are made in relation to measuring growth response. These are: • that an invited number of institutions having people with experience in feeding crocodile meet to
review nutritional research outcomes and make recommendation which will hopefully lead to an increased quantity of pelleted feed being consumed by grower crocodiles
• that a number of one year old crocodiles be held in cages and fed different ingredient diets to see if an ingredient/diet preference can be established
• that a measurement index incorporating weight and length be used in future to determine growth performance – rather than determine performance by any one parameter alone
• that researchers have an ongoing interest in developments relating to the feeding of offal by-products to animals destined for human consumption.
5. On-farm development of individual cages for grower crocodiles. On-farm development of individual rearing pens and rearing cages is taking place. It is reported that individual accommodation is resulting in an increased number of improved quality skins reaching market, which provide better returns to grower. It is recommended that research officers take an active interest in this husbandry change and where possible determine the value of the change by using CrocProfit to determine before and after performances. 6. Effluent management. Government is placing more emphasis on environmental management generally and including the methods used by intensive livestock industries to meet their obligations. The crocodile industry should not think itself as being apart from these requirements. To this end it is recommended that researchers keep abreast of developments and requirements in this area.

92
8. Appendix 1
DPI Notes Thinking of Crocodile Farming – Farming Issues to Consider Bernie Davis and Steve Peucker, Intensive Livestock, Townsville. People thinking of crocodile farming have put a series of questions to us over time. This is a general response to those questions and it is not meant to be detailed or exhaustive. Hopefully, our responses will help the reader identify further information sources and minimise problems if they decide to farm crocodiles. BUSINESS PLANNING Is farming crocodiles a business? All farming enterprises are a business. You will be a price taker, you won’t determine price. The only way you can increase income in the absence of a price rise is by producing a higher proportion of high grade skins and reducing costs. How much money is needed to farm crocodiles? That depends on a number of factors. For example, are crocodiles to be your sole income and what sort of farming system do you want to establish? The list is substantial and it is very individual. The only way to really address this issue is to establish a business plan. Establishing a business plan Establish a business plan with the assistance of professional advice. Advice costs money, so be prepared to pay. At the end of the day the advice might say “give crocodile farming a miss.” Your expectations are an important consideration. Will government help establish your farming costs and cost of production? Yes and no. The Department of Primary Industries has developed a spreadsheet program called CrocProfit. You and your financial consultant will need to do the calculations for your farming enterprise using CrocProfit or similar programs. QDPI could also establish a grower cost of production program where they would establish your cost for rearing a group of crocodiles to slaughter, provide you with an industry average and range for a number of things like mortality rates and feed costs. You would compare your farm’s performance to an industry average. The procedure is confidential and anonymous. CROCODILES Do I really want to farm crocodiles? It’s your decision. Crocodiles can be fast, aggressive and therefore dangerous but fascinating to work with. They are not and never will be household pets. Where do I purchase my animals? You can keep breeders and collect and hatch their eggs. Initially, you can buy your breeders from other farmers. Conversely, you could buy hatchlings from another hatchery.

93
Can I catch wild crocodiles or take eggs from wild crocodiles and farm them? In Queensland no you can’t. In the Northern Territory you can but you must have a government permit. Taking eggs and baby crocodiles is not a job for the inexperienced. What is needed to farm crocodiles? A site that has water and electricity, is close to feed suppliers, processing plants and links to markets. The site will need to be secured and meet the requirements of your local authority. You will also need capital and patience. What about remote farm sites? Remote farm land costs can be less expensive. However, transport costs associated with servicing these sites (eg feed and products to market) are frequently overlooked by prospective farmers. Careful consideration needs to be given to transport costs because they can be expensive. Is there standard descriptive commercial crocodile language in use? Yes, but descriptions are still in the development stage. • Hatchlings are baby crocodiles and the term may apply up to one year of age • Clutches are groups of hatchlings from the same nest • Growers are animals of about one year old to harvest • Breeders are large adult animals. Breeders are further described as male and female. Males are
sometimes called bulls. • Hatchling describes sub-adult breeders or advanced growers • The term “colony” is sometimes used to describe a group of growers or breeders. The term
“clutch” does not apply because there is generally more than one clutch in pens. HUSBANDRY How long does take to grow crocodiles to market size? It will take about three years from the time you place your first hatchling until they are ready for market. Do all crocodiles reach a standard market size at the same time? No. Fast growing animals could reach market size in approximately two years. Slow growing animals may take three years or more. This situation may change in the future with the application of genetic selection. The current growth rate response has implications for both stock rotation and management. How do I house animals? Housing depends on location. Crocodiles need to have their body temperature maintained at about 32-34ºC, especially the small ones. Seek informed advice on this issue from QDPI, established farmers, established consultants and animal housing specialists. What do I feed crocodiles? Currently crocodiles maintained in captivity are fed chicken heads and/or kangaroo meat. Sometimes beef and horse offal is used. QDPI is developing pelleted feed made from manufactured ingredients such as poultry feather meal, poultry meat meal, fish meal and soya bean meal as examples. Pelleted feed will be available for commercial trial in 2001. Where do I purchase feed? Pet feed suppliers sell chicken heads and kangaroo meat. Look in the yellow pages for contacts or ask established farmers for contacts.
94
Once diet formulations are available you will be able to have feed manufactured by professional milling services or make it on farm yourself. Where do I buy manufactured ingredients to make diets? Ingredients for on-farm mixing can be purchased from merchants catering for the pig, poultry and aquaculture industries. MARKETING AND PROCESSING What am I selling? About 80 percent of your income will be derived from skins and the remaining 20 percent from meat. Where do I sell my animals? The main markets for skins are in Asia (Japan and Singapore) and Europe – France, for example. Meat is sold in Asia (Japan, China), Europe and at home here in Australia. Contact Environment Australia (02 62472246) for export requirements. You should try and sell your production through an Australian agent. The market is not interested in small consignments of skins and meat. Are there market opportunities? Australia sells about 11,000 skins/year from saltwater crocodiles (C. porosus). By international standards Australia is a small supplier (about 1% of the world market) and there are market opportunities for Australian skins provided they are of high quality. This is because C. porosus produces the finest quality skin of all crocodilian species and is eagerly sought after by tanners. Can I process my own animals? Yes, you can provided you have a registered processing plant. You will need some industry-specific skills to remove the skin. First grade skins are valuable, second grade skins are worth about 75 percent of first grade skins and third grade about fifty percent. Remember your costs of production will be the same for all three categories. Some “turn key” processing plants are being manufactured in north Queensland, so if you decide to do your own processing you might want to consider these. Is contract processing available? Yes, you can have your animal’s contract processed. You need to approach a contractor with a registered processing plant and come to a business arrangement/agreement. FURTHER INFORMATION Where can I get more information about crocodile farming? • Department of Primary Industries, Townsville • Rural Industries Research & Development Corporation, Canberra • Queensland Parks and Wildlife Service, Environmental Protection Agency for information on wild
animals • Private consultants. Consultants with crocodile experience are established in north Queensland
and the Northern Territory • Environment Australia (02 62472246) for information on export requirements.

95
DPI Notes Thinking of Crocodile Farming – Some Licence Issues to Consider Bernie Davis and Steve Peucker, Intensive Livestock, Townsville. Queensland, as well as other states of Australia have a number of licence requirements you are obliged to meet, to farm commercial crocodiles. In addition, Federal licences are required to export crocodile products from Australia. The government agencies, their licence requirements and the function of those requirements are described for you in Table 1. The list of functions is a guide only, they are not meant to be exhaustive or detailed. It is important that you contact State and Federal agencies in the very early stage of project planning. Officers from these agencies are available to discuss your particular situation and offer suggestions or how you can best comply with requirements.
AGENCY LICENCE FUNCTION Queensland Parks and Wildlife Service (QPWS) Ph: 07 3227 7111 Website: www.env.qld.gov.au
Wildlife Farming Licence
Ensures: • crocodiles are farm bred • farm and housing requirements are
met • animal welfare requirements are met Applicant must have demonstrated experience in handling crocodiles or employ staff with that experience.
Queensland Parks and Wildlife Service (QPWS) Ph: 07 3227 7111 Website: www.env.qld.gov.au
Wildlife Movement Licence
To notify QPWS of the movement of stock from one farm to another
Environmental Protection Agency (EPA) Ph: 07 3227 7111 Website: www.env.qld.gov.au
Effluent Discharge Licence
Audits of water and effluent discharges from crocodile farms
Environment Australia Ph: 02 6274 2246 Website: www.environment.gov.au Email:[email protected]
CITES Permit Required to export skins from Australia. CITES permits and tags demonstrate that skins are from farm bred animals
Australian Quarantine Inspection Service (AQIS) Ph: 07 3246 8755 Also has regional offices Website: www.aqis.gov.au
Food Processing Accreditation Licence
Required for the export of crocodile meat.
Safe Food Ph: 07 3405 4800 Website:Not available
Food Processing Accreditation Licence
Required for the production of crocodile meat in Queensland.
Department of Industrial Relations Ph: 1300 369 915 Website: www.dir.qld.gov.au
Workplace registration
Workplace, health and safety issues