Croatia - United Nations Office on Drugs and Crime · PDF filePeriod: 2005‐2006 POLICE...
26
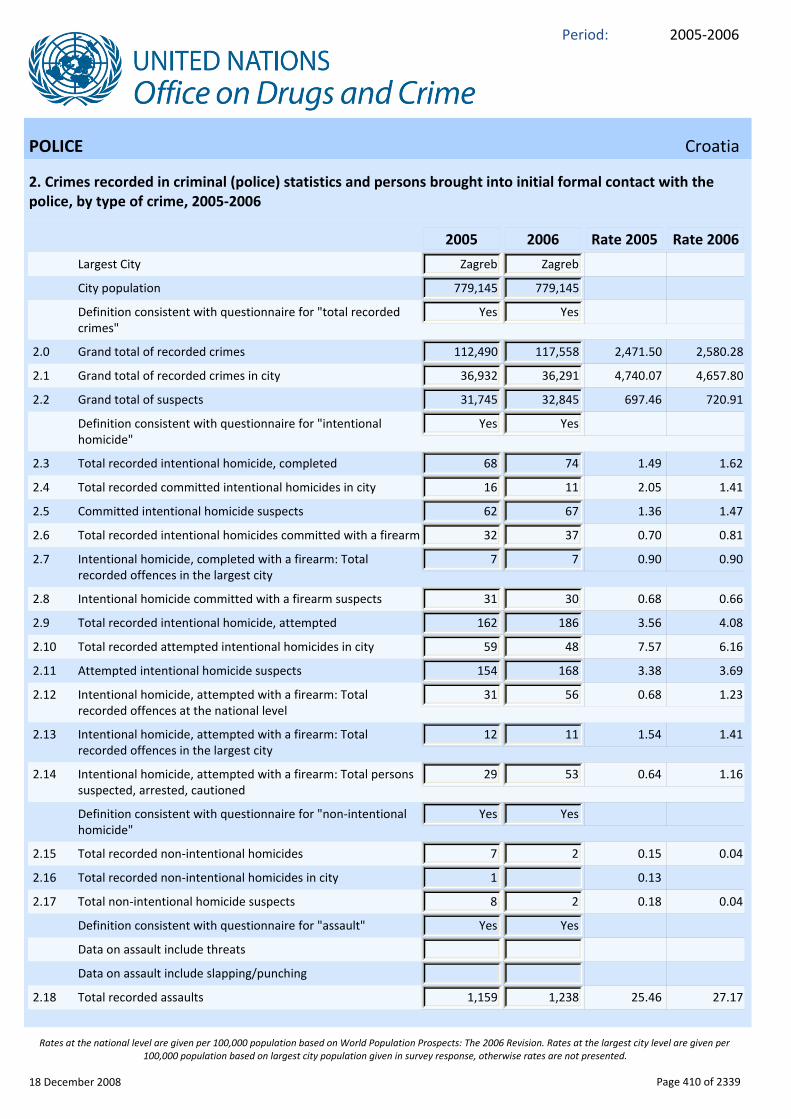
2005‐2006 Period: Croatia POLICE Croatia 1. Police personnel, by sex, and financial resources, 2005‐2006 Indicator Value Comments: 2005 2006 Rate 2005 Rate 2006 Police are part of the national security force Country has more than one police force Police or law enforcement personnel fulfill prosecutorial functions 1.1 Total police personnel 18,787 18,824 412.77 413.17 1.2 Female police personnel 1,552 1,609 34.10 35.32 1.3 Male police personnel 17,235 17,215 378.67 377.85 There is a specialised police body assigned to the policing of organized crime Yes Yes 1.4 Total police personnel assigned to the policing of organized crime 208 208 4.57 4.57 Total police budget/financial resources in millions of local currency 3,070 3,325 67.45 72.98 Currency used HRK HRK Table 1: Use of an alternative reference date to "31 December" Table 1: Alternative date Ministarstvo unutarnjih poslova Table 1: Source(s) of the data provided Comments for Table 1 18 December 2008 Page 409 of 2339 Rates at the national level are given per 100,000 population based on World Population Prospects: The 2006 Revision. Rates at the largest city level are given per 100,000 population based on largest city population given in survey response, otherwise rates are not presented.
Transcript of Croatia - United Nations Office on Drugs and Crime · PDF filePeriod: 2005‐2006 POLICE...
2005‐2006Period:
Croatia
POLICE Croatia
1. Police personnel, by sex, and financial resources, 2005‐2006
Indicator Value
Comments:
2005 2006 Rate 2005 Rate 2006
Police are part of the national security force
Country has more than one police force
Police or law enforcement personnel fulfill prosecutorial functions
1.1 Total police personnel 18,787 18,824 412.77 413.17
1.2 Female police personnel 1,552 1,609 34.10 35.32
1.3 Male police personnel 17,235 17,215 378.67 377.85
There is a specialised police body assigned to the policing of organized crime
Yes Yes
1.4 Total police personnel assigned to the policing of organized crime
208 208 4.57 4.57
Total police budget/financial resources in millions of local currency
3,070 3,325 67.45 72.98
Currency used HRK HRK
Table 1: Use of an alternative reference date to "31 December"
Table 1: Alternative date
Ministarstvo unutarnjih poslovaTable 1: Source(s) of the data provided
Comments for Table 1
18 December 2008 Page 409 of 2339
Rates at the national level are given per 100,000 population based on World Population Prospects: The 2006 Revision. Rates at the largest city level are given per 100,000 population based on largest city population given in survey response, otherwise rates are not presented.
2005‐2006Period:
POLICE Croatia
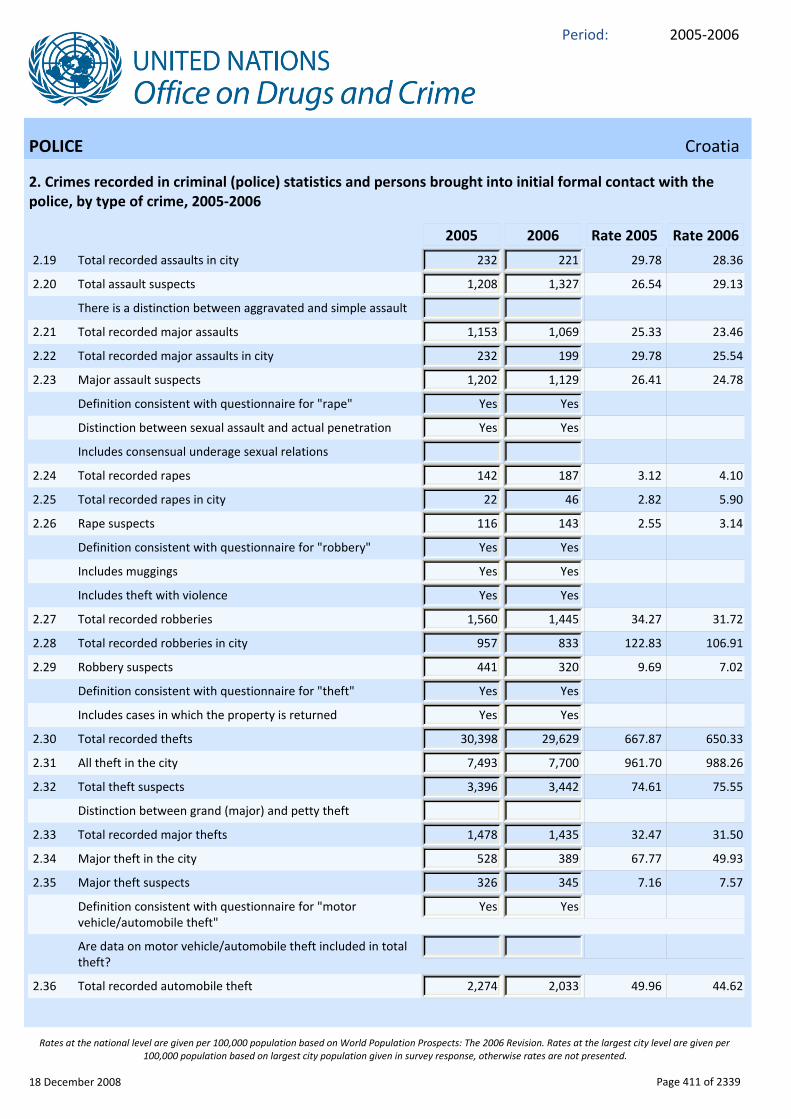
2. Crimes recorded in criminal (police) statistics and persons brought into initial formal contact with the police, by type of crime, 2005‐2006
2005 2006 Rate 2005 Rate 2006
Largest City Zagreb Zagreb
City population 779,145 779,145
Definition consistent with questionnaire for "total recorded crimes"
Yes Yes
2.0 Grand total of recorded crimes 112,490 117,558 2,471.50 2,580.28
2.1 Grand total of recorded crimes in city 36,932 36,291 4,740.07 4,657.80
2.2 Grand total of suspects 31,745 32,845 697.46 720.91
Definition consistent with questionnaire for "intentional homicide"
Yes Yes
2.3 Total recorded intentional homicide, completed 68 74 1.49 1.62
2.4 Total recorded committed intentional homicides in city 16 11 2.05 1.41
2.5 Committed intentional homicide suspects 62 67 1.36 1.47
2.6 Total recorded intentional homicides committed with a firearm 32 37 0.70 0.81
2.7 Intentional homicide, completed with a firearm: Total recorded offences in the largest city
7 7 0.90 0.90
2.8 Intentional homicide committed with a firearm suspects 31 30 0.68 0.66
2.9 Total recorded intentional homicide, attempted 162 186 3.56 4.08
2.10 Total recorded attempted intentional homicides in city 59 48 7.57 6.16
2.11 Attempted intentional homicide suspects 154 168 3.38 3.69
2.12 Intentional homicide, attempted with a firearm: Total recorded offences at the national level
31 56 0.68 1.23
2.13 Intentional homicide, attempted with a firearm: Total recorded offences in the largest city
12 11 1.54 1.41
2.14 Intentional homicide, attempted with a firearm: Total persons suspected, arrested, cautioned
29 53 0.64 1.16
Definition consistent with questionnaire for "non‐intentional homicide"
Yes Yes
2.15 Total recorded non‐intentional homicides 7 2 0.15 0.04
2.16 Total recorded non‐intentional homicides in city 1 0.13
2.17 Total non‐intentional homicide suspects 8 2 0.18 0.04
Definition consistent with questionnaire for "assault" Yes Yes
Data on assault include threats
Data on assault include slapping/punching
2.18 Total recorded assaults 1,159 1,238 25.46 27.17
18 December 2008 Page 410 of 2339
Rates at the national level are given per 100,000 population based on World Population Prospects: The 2006 Revision. Rates at the largest city level are given per 100,000 population based on largest city population given in survey response, otherwise rates are not presented.
2005‐2006Period:
POLICE Croatia
2. Crimes recorded in criminal (police) statistics and persons brought into initial formal contact with the police, by type of crime, 2005‐2006
2005 2006 Rate 2005 Rate 2006
2.19 Total recorded assaults in city 232 221 29.78 28.36
2.20 Total assault suspects 1,208 1,327 26.54 29.13
There is a distinction between aggravated and simple assault
2.21 Total recorded major assaults 1,153 1,069 25.33 23.46
2.22 Total recorded major assaults in city 232 199 29.78 25.54
2.23 Major assault suspects 1,202 1,129 26.41 24.78
Definition consistent with questionnaire for "rape" Yes Yes
Distinction between sexual assault and actual penetration Yes Yes
Includes consensual underage sexual relations
2.24 Total recorded rapes 142 187 3.12 4.10
2.25 Total recorded rapes in city 22 46 2.82 5.90
2.26 Rape suspects 116 143 2.55 3.14
Definition consistent with questionnaire for "robbery" Yes Yes
Includes muggings Yes Yes
Includes theft with violence Yes Yes
2.27 Total recorded robberies 1,560 1,445 34.27 31.72
2.28 Total recorded robberies in city 957 833 122.83 106.91
2.29 Robbery suspects 441 320 9.69 7.02
Definition consistent with questionnaire for "theft" Yes Yes
Includes cases in which the property is returned Yes Yes
2.30 Total recorded thefts 30,398 29,629 667.87 650.33
2.31 All theft in the city 7,493 7,700 961.70 988.26
2.32 Total theft suspects 3,396 3,442 74.61 75.55
Distinction between grand (major) and petty theft
2.33 Total recorded major thefts 1,478 1,435 32.47 31.50
2.34 Major theft in the city 528 389 67.77 49.93
2.35 Major theft suspects 326 345 7.16 7.57
Definition consistent with questionnaire for "motor vehicle/automobile theft"
Yes Yes
Are data on motor vehicle/automobile theft included in total theft?
2.36 Total recorded automobile theft 2,274 2,033 49.96 44.62
18 December 2008 Page 411 of 2339
Rates at the national level are given per 100,000 population based on World Population Prospects: The 2006 Revision. Rates at the largest city level are given per 100,000 population based on largest city population given in survey response, otherwise rates are not presented.
2005‐2006Period:
POLICE Croatia
2. Crimes recorded in criminal (police) statistics and persons brought into initial formal contact with the police, by type of crime, 2005‐2006
2005 2006 Rate 2005 Rate 2006
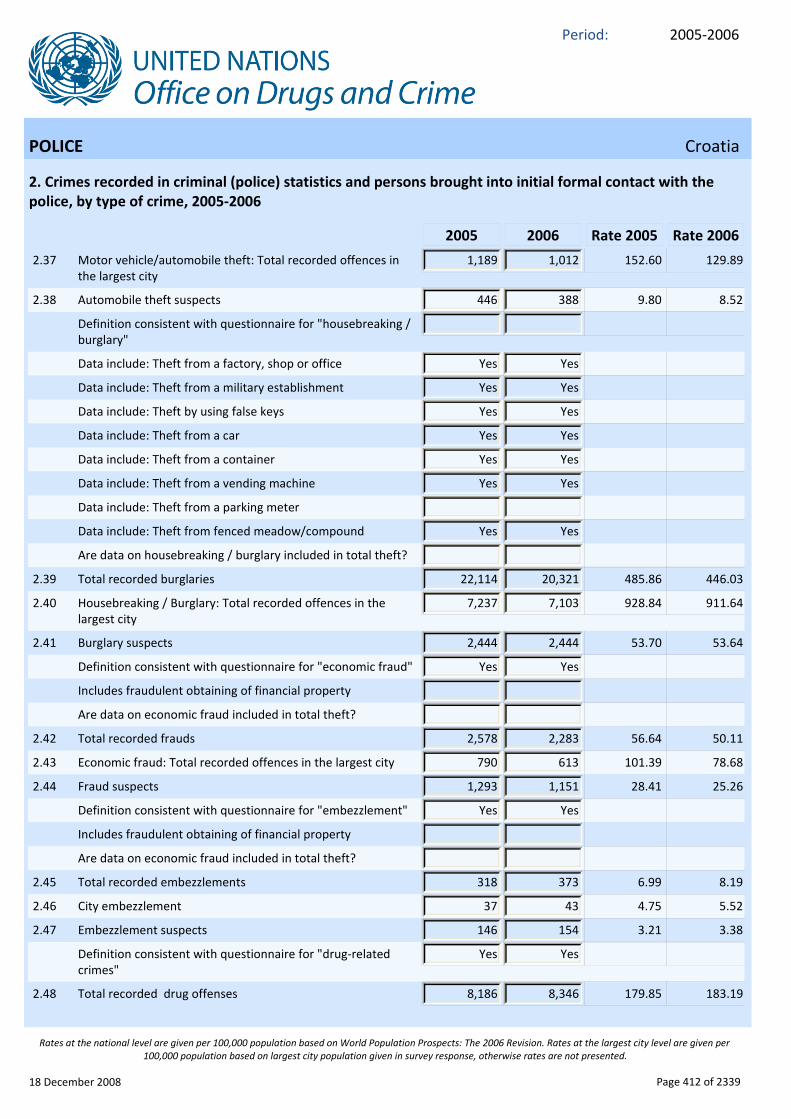
2.37 Motor vehicle/automobile theft: Total recorded offences in the largest city
1,189 1,012 152.60 129.89
2.38 Automobile theft suspects 446 388 9.80 8.52
Definition consistent with questionnaire for "housebreaking / burglary"
Data include: Theft from a factory, shop or office Yes Yes
Data include: Theft from a military establishment Yes Yes
Data include: Theft by using false keys Yes Yes
Data include: Theft from a car Yes Yes
Data include: Theft from a container Yes Yes
Data include: Theft from a vending machine Yes Yes
Data include: Theft from a parking meter
Data include: Theft from fenced meadow/compound Yes Yes
Are data on housebreaking / burglary included in total theft?
2.39 Total recorded burglaries 22,114 20,321 485.86 446.03
2.40 Housebreaking / Burglary: Total recorded offences in the largest city
7,237 7,103 928.84 911.64
2.41 Burglary suspects 2,444 2,444 53.70 53.64
Definition consistent with questionnaire for "economic fraud" Yes Yes
Includes fraudulent obtaining of financial property
Are data on economic fraud included in total theft?
2.42 Total recorded frauds 2,578 2,283 56.64 50.11
2.43 Economic fraud: Total recorded offences in the largest city 790 613 101.39 78.68
2.44 Fraud suspects 1,293 1,151 28.41 25.26
Definition consistent with questionnaire for "embezzlement" Yes Yes
Includes fraudulent obtaining of financial property
Are data on economic fraud included in total theft?
2.45 Total recorded embezzlements 318 373 6.99 8.19
2.46 City embezzlement 37 43 4.75 5.52
2.47 Embezzlement suspects 146 154 3.21 3.38
Definition consistent with questionnaire for "drug‐related crimes"
Yes Yes
2.48 Total recorded drug offenses 8,186 8,346 179.85 183.19
18 December 2008 Page 412 of 2339
Rates at the national level are given per 100,000 population based on World Population Prospects: The 2006 Revision. Rates at the largest city level are given per 100,000 population based on largest city population given in survey response, otherwise rates are not presented.
2005‐2006Period:
POLICE Croatia
2. Crimes recorded in criminal (police) statistics and persons brought into initial formal contact with the police, by type of crime, 2005‐2006
2005 2006 Rate 2005 Rate 2006
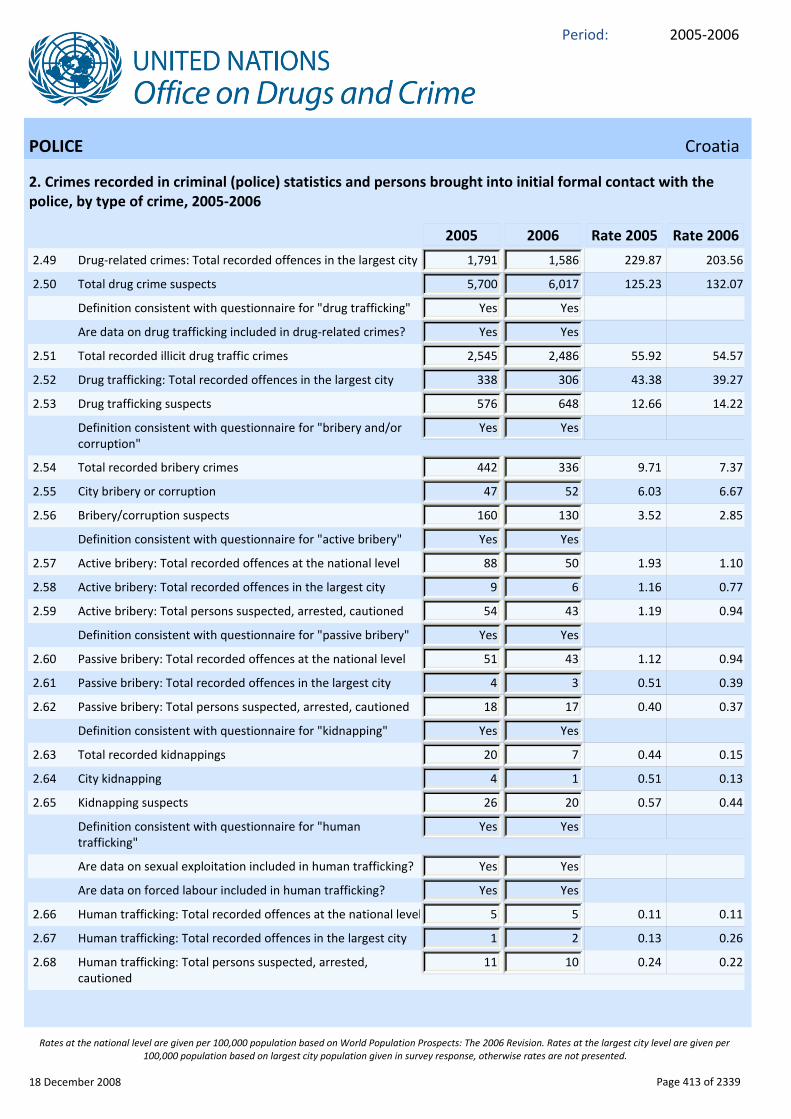
2.49 Drug‐related crimes: Total recorded offences in the largest city 1,791 1,586 229.87 203.56
2.50 Total drug crime suspects 5,700 6,017 125.23 132.07
Definition consistent with questionnaire for "drug trafficking" Yes Yes
Are data on drug trafficking included in drug‐related crimes? Yes Yes
2.51 Total recorded illicit drug traffic crimes 2,545 2,486 55.92 54.57
2.52 Drug trafficking: Total recorded offences in the largest city 338 306 43.38 39.27
2.53 Drug trafficking suspects 576 648 12.66 14.22
Definition consistent with questionnaire for "bribery and/or corruption"
Yes Yes
2.54 Total recorded bribery crimes 442 336 9.71 7.37
2.55 City bribery or corruption 47 52 6.03 6.67
2.56 Bribery/corruption suspects 160 130 3.52 2.85
Definition consistent with questionnaire for "active bribery" Yes Yes
2.57 Active bribery: Total recorded offences at the national level 88 50 1.93 1.10
2.58 Active bribery: Total recorded offences in the largest city 9 6 1.16 0.77
2.59 Active bribery: Total persons suspected, arrested, cautioned 54 43 1.19 0.94
Definition consistent with questionnaire for "passive bribery" Yes Yes
2.60 Passive bribery: Total recorded offences at the national level 51 43 1.12 0.94
2.61 Passive bribery: Total recorded offences in the largest city 4 3 0.51 0.39
2.62 Passive bribery: Total persons suspected, arrested, cautioned 18 17 0.40 0.37
Definition consistent with questionnaire for "kidnapping" Yes Yes
2.63 Total recorded kidnappings 20 7 0.44 0.15
2.64 City kidnapping 4 1 0.51 0.13
2.65 Kidnapping suspects 26 20 0.57 0.44
Definition consistent with questionnaire for "human trafficking"
Yes Yes
Are data on sexual exploitation included in human trafficking? Yes Yes
Are data on forced labour included in human trafficking? Yes Yes
2.66 Human trafficking: Total recorded offences at the national level 5 5 0.11 0.11
2.67 Human trafficking: Total recorded offences in the largest city 1 2 0.13 0.26
2.68 Human trafficking: Total persons suspected, arrested, cautioned
11 10 0.24 0.22
18 December 2008 Page 413 of 2339
Rates at the national level are given per 100,000 population based on World Population Prospects: The 2006 Revision. Rates at the largest city level are given per 100,000 population based on largest city population given in survey response, otherwise rates are not presented.

2005‐2006Period:
POLICE Croatia
2. Crimes recorded in criminal (police) statistics and persons brought into initial formal contact with the police, by type of crime, 2005‐2006
Indicator Value
Comments:
2005 2006 Rate 2005 Rate 2006
Definition consistent with questionnaire for "smuggling of migrants"
Yes Yes
2.69 Smuggling of migrants: Total recorded offences at the national level
260 320 5.71 7.02
2.70 Smuggling of migrants: Total recorded offences in the largest city
34 11 4.36 1.41
2.71 Smuggling of migrants: Total persons suspected, arrested, cautioned
270 358 5.93 7.86
Definition consistent with questionnaire for "counterfeit currency offences"
Yes Yes
Are data on counterfeit currency offences included in economic fraud?
2.72 Counterfeit currency offences: Total recorded offences at the national level
470 483 10.33 10.60
2.73 Counterfeit currency offences: Total recorded offences in the largest city
67 24 8.60 3.08
2.74 Counterfeit currency offences: Total persons suspected, arrested, cautioned
159 138 3.49 3.03
Definition consistent with questionnaire for "participation in organized criminal groups"
Yes Yes
2.75 Participation in organized criminal groups: Total recorded offences at the national level
29 26 0.64 0.57
2.76 Participation in organized criminal groups: Total recorded offences in the largest city
5 2 0.64 0.26
2.77 Participation in organized criminal groups: Total persons suspected, arrested, cautioned
3 17 0.07 0.37
Central Bureau of Statistics (Census of population 2001) Statistical Yearbook of the city of Zagreb 2006
Source: city population
If one person did more penal acts, we show him only once, for more heavily act. In row 2.2 there are persons reported only for penal acts for which legal proceedings is starting by official duty.
Comments for "Total recorded crimes"
Comments for "Intentional homicide"
Comments for "Non‐intentional homicide"
Comments for "Assault"
Data refers to rapes and rapes in attempt.Comments for "Rape"
18 December 2008 Page 414 of 2339
Rates at the national level are given per 100,000 population based on World Population Prospects: The 2006 Revision. Rates at the largest city level are given per 100,000 population based on largest city population given in survey response, otherwise rates are not presented.

2005‐2006Period:
POLICE Croatia
2. Crimes recorded in criminal (police) statistics and persons brought into initial formal contact with the police, by type of crime, 2005‐2006
Comments for "Robbery"
Row 2.32. not include reported persons for small thefts. Comments for "Theft"
In motor vehicle thefts we include thefts done and thefts in attemptComments for "Motor vehicle/automobile theft"
Comments for "Housebreaking / Burglary"
Comments for "Economic fraud"
Comments for "Embezzlement"
Comments for "Drug‐related crimes"
Comments for "Drug trafficking"
Comments for "Bribery and/or corruption"
Comments for "Kidnapping"
Comments for "Human trafficking"
Comments for "Smuggling of migrants"
Comments for "Counterfeit currency offences"
Comments for "Participation in organized criminal groups"
Ministry of Interior – Records of penal acts and reported personsTable 2: Source(s) of the data provided
18 December 2008 Page 415 of 2339
Rates at the national level are given per 100,000 population based on World Population Prospects: The 2006 Revision. Rates at the largest city level are given per 100,000 population based on largest city population given in survey response, otherwise rates are not presented.
2005‐2006Period:
POLICE Croatia
3. Persons brought into formal contact with the criminal justice system, regardless of the type of crime, by category and sex, age group and citizenship, where formal contact might include being suspected, arrested, cautioned, 2005‐2006
Indicator Value
Comments:
2005 2006 Rate 2005 Rate 2006
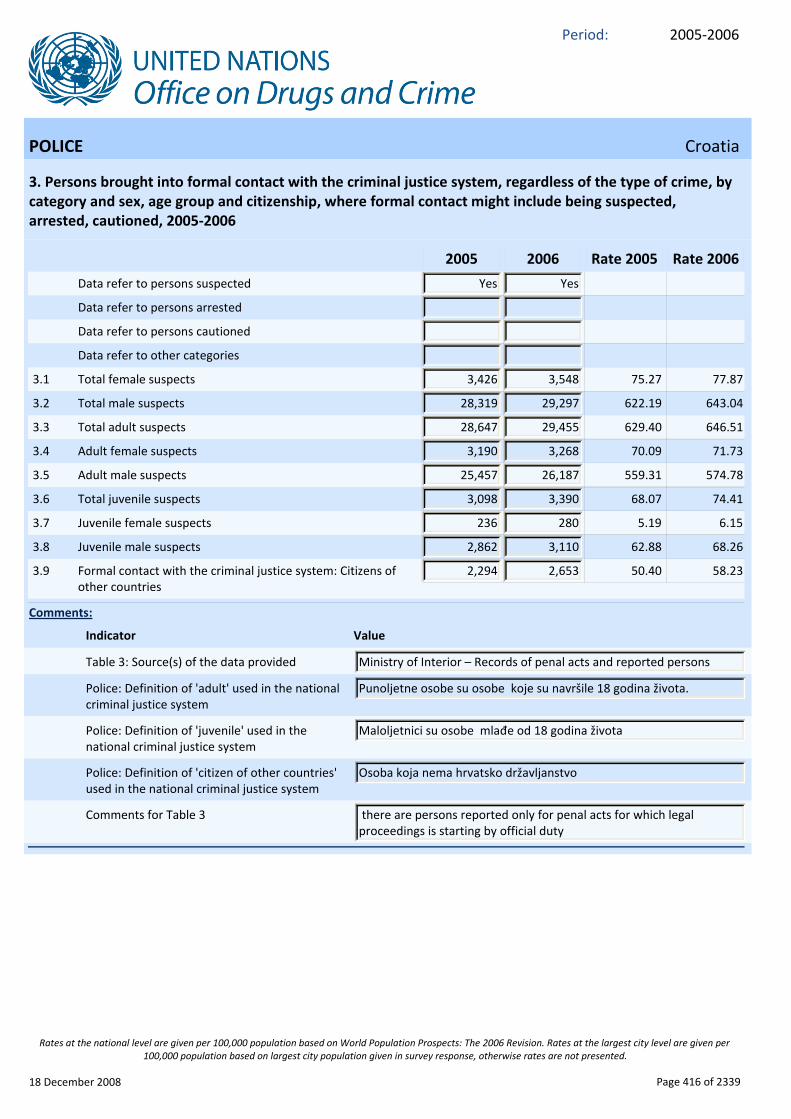
Data refer to persons suspected Yes Yes
Data refer to persons arrested
Data refer to persons cautioned
Data refer to other categories
3.1 Total female suspects 3,426 3,548 75.27 77.87
3.2 Total male suspects 28,319 29,297 622.19 643.04
3.3 Total adult suspects 28,647 29,455 629.40 646.51
3.4 Adult female suspects 3,190 3,268 70.09 71.73
3.5 Adult male suspects 25,457 26,187 559.31 574.78
3.6 Total juvenile suspects 3,098 3,390 68.07 74.41
3.7 Juvenile female suspects 236 280 5.19 6.15
3.8 Juvenile male suspects 2,862 3,110 62.88 68.26
3.9 Formal contact with the criminal justice system: Citizens of other countries
2,294 2,653 50.40 58.23
Ministry of Interior – Records of penal acts and reported personsTable 3: Source(s) of the data provided
Punoljetne osobe su osobe koje su navršile 18 godina života. Police: Definition of 'adult' used in the national criminal justice system
Maloljetnici su osobe mlađe od 18 godina životaPolice: Definition of 'juvenile' used in the national criminal justice system
Osoba koja nema hrvatsko državljanstvoPolice: Definition of 'citizen of other countries' used in the national criminal justice system
there are persons reported only for penal acts for which legal proceedings is starting by official duty
Comments for Table 3
18 December 2008 Page 416 of 2339
Rates at the national level are given per 100,000 population based on World Population Prospects: The 2006 Revision. Rates at the largest city level are given per 100,000 population based on largest city population given in survey response, otherwise rates are not presented.
2005‐2006Period:
POLICE Croatia
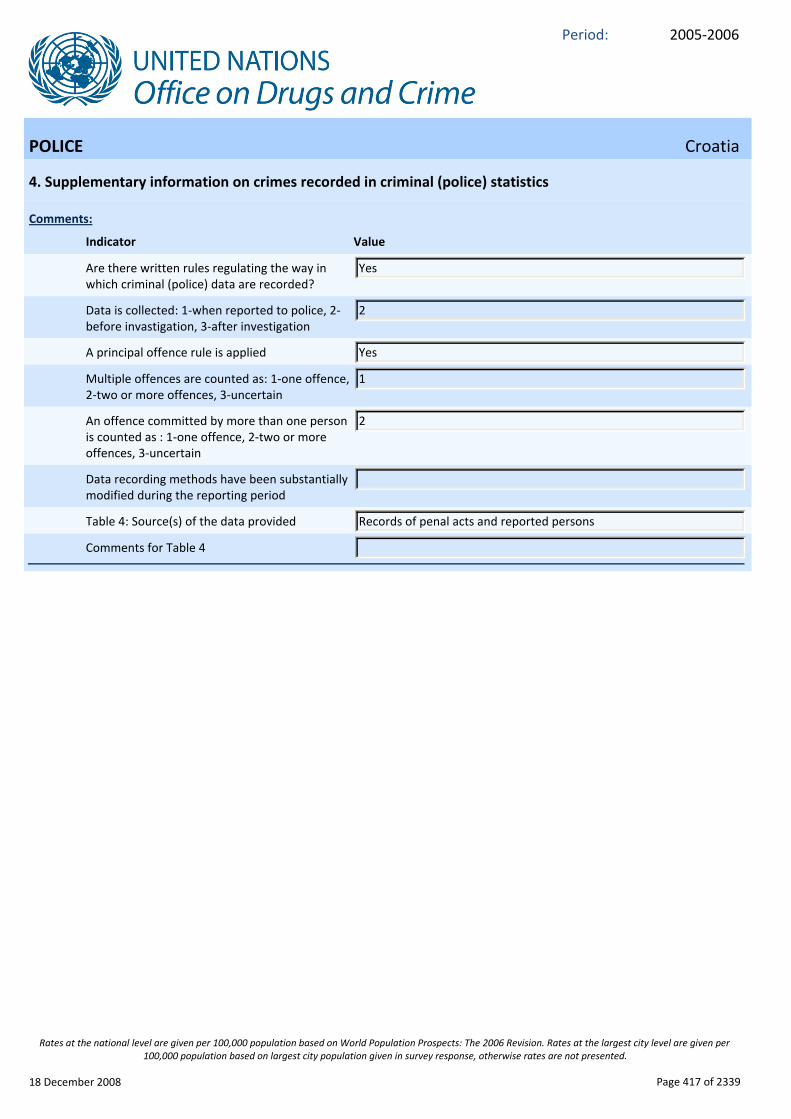
4. Supplementary information on crimes recorded in criminal (police) statistics
Indicator Value
Comments:
YesAre there written rules regulating the way in which criminal (police) data are recorded?
2Data is collected: 1‐when reported to police, 2‐before invastigation, 3‐after investigation
YesA principal offence rule is applied
1Multiple offences are counted as: 1‐one offence, 2‐two or more offences, 3‐uncertain
2An offence committed by more than one person is counted as : 1‐one offence, 2‐two or more offences, 3‐uncertain
Data recording methods have been substantially modified during the reporting period
Records of penal acts and reported personsTable 4: Source(s) of the data provided
Comments for Table 4
18 December 2008 Page 417 of 2339
Rates at the national level are given per 100,000 population based on World Population Prospects: The 2006 Revision. Rates at the largest city level are given per 100,000 population based on largest city population given in survey response, otherwise rates are not presented.

2005‐2006Period:
PROSECUTION Croatia
5. Prosecution personnel, by category, and financial resources, 2005‐2006
Indicator Value
Comments:
2005 2006 Rate 2005 Rate 2006
5.0 Total prosecution personnel 568 576 12.48 12.64
5.1 Female prosecution personnel 339 353 7.45 7.75
5.2 Male prosecution personnel 229 223 5.03 4.89
There is a specialized prosecution body dealing with organized crime
Yes Yes
5.3 Total prosecution officials assigned to the prosecution of organized crime
12 16 0.26 0.35
Total prosecution budget/financial resources in millions of local currency
Currency used
Agency Public Prosecutor´s Office of the Republic of Croatia (County and Municipal)
Prosecutor agency
Table 5: Use of an alternative reference date to "31 December"
Table 5: Alternative date
Public Prosecutor´s Office of the Republic of CroatiaTable 5: Source(s) of the data provided
Comments for Table 5
6. Persons prosecuted, by selected types of crime, 2005‐2006
Indicator Value
Comments:
2005 2006 Rate 2005 Rate 2006
6.1 Total prosecuted for committed intentional homicide 197 262 4.33 5.75
6.2 Human Trafficking: Persons prosecuted 6 14 0.13 0.31
6.3 Smuggling of Migrants: Persons prosecuted 321 371 7.05 8.14
6.4 Participation in Organized Criminal Groups: Persons prosecuted 132 94 2.90 2.06
Central Bureau of Statistics of the Republic of CroatiaTable 6: Source(s) of the data provided
Comments for Table 6
18 December 2008 Page 418 of 2339
Rates at the national level are given per 100,000 population based on World Population Prospects: The 2006 Revision. Rates at the largest city level are given per 100,000 population based on largest city population given in survey response, otherwise rates are not presented.
2005‐2006Period:
PROSECUTION Croatia
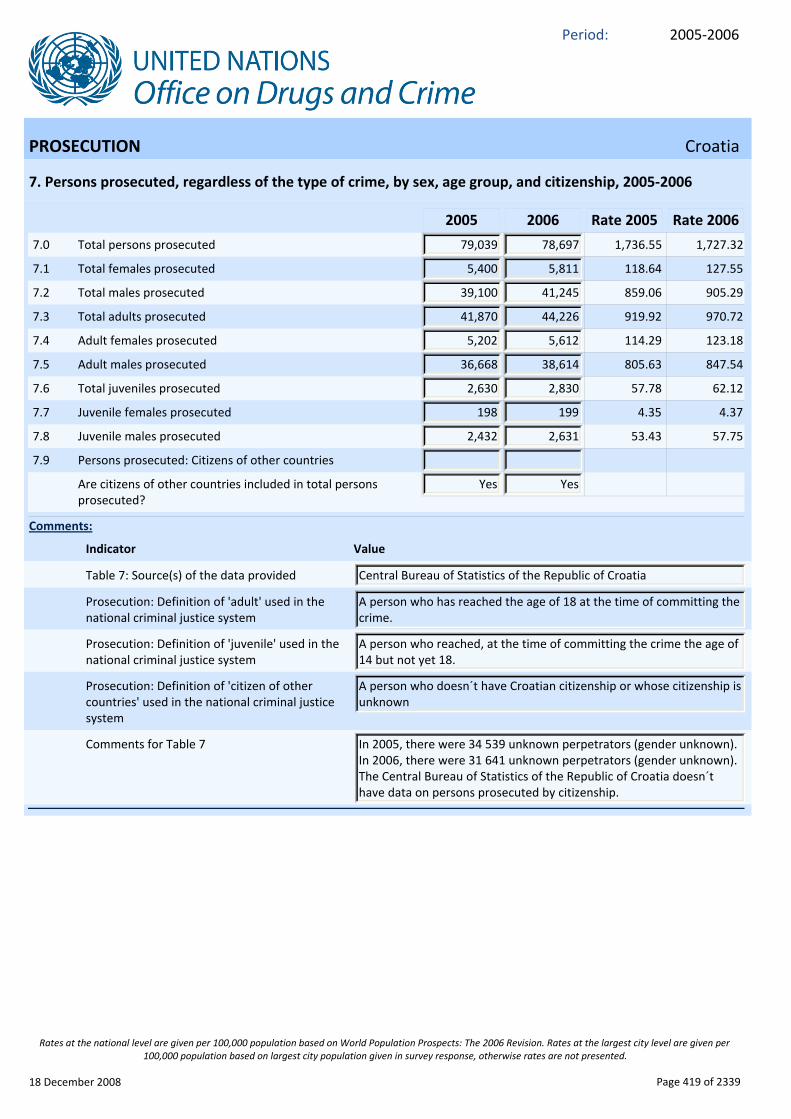
7. Persons prosecuted, regardless of the type of crime, by sex, age group, and citizenship, 2005‐2006
Indicator Value
Comments:
2005 2006 Rate 2005 Rate 2006
7.0 Total persons prosecuted 79,039 78,697 1,736.55 1,727.32
7.1 Total females prosecuted 5,400 5,811 118.64 127.55
7.2 Total males prosecuted 39,100 41,245 859.06 905.29
7.3 Total adults prosecuted 41,870 44,226 919.92 970.72
7.4 Adult females prosecuted 5,202 5,612 114.29 123.18
7.5 Adult males prosecuted 36,668 38,614 805.63 847.54
7.6 Total juveniles prosecuted 2,630 2,830 57.78 62.12
7.7 Juvenile females prosecuted 198 199 4.35 4.37
7.8 Juvenile males prosecuted 2,432 2,631 53.43 57.75
7.9 Persons prosecuted: Citizens of other countries
Are citizens of other countries included in total persons prosecuted?
Yes Yes
Central Bureau of Statistics of the Republic of Croatia Table 7: Source(s) of the data provided
A person who has reached the age of 18 at the time of committing the crime.
Prosecution: Definition of 'adult' used in the national criminal justice system
A person who reached, at the time of committing the crime the age of 14 but not yet 18.
Prosecution: Definition of 'juvenile' used in the national criminal justice system
A person who doesn´t have Croatian citizenship or whose citizenship is unknown
Prosecution: Definition of 'citizen of other countries' used in the national criminal justice system
In 2005, there were 34 539 unknown perpetrators (gender unknown). In 2006, there were 31 641 unknown perpetrators (gender unknown). The Central Bureau of Statistics of the Republic of Croatia doesn´t have data on persons prosecuted by citizenship.
Comments for Table 7
18 December 2008 Page 419 of 2339
Rates at the national level are given per 100,000 population based on World Population Prospects: The 2006 Revision. Rates at the largest city level are given per 100,000 population based on largest city population given in survey response, otherwise rates are not presented.

2005‐2006Period:
COURTS Croatia
8. Judges, by status and sex, and financial resources, including in appeal courts, 2005‐2006
Indicator Value
Comments:
2005 2006 Rate 2005 Rate 2006
8.0 Total number of professional judges/magistrates 1,912 1,938 42.01 42.54
8.1 Number of female professional judges/magistrates 1,214 1,257 26.67 27.59
8.2 Number of male professional judges/magistrates 698 681 15.34 14.95
8.3 Number of part time professional judges/magistrates
8.4 Professional part time judges: Females
8.5 Professional part time judges: Males
Part‐time personnel is NOT included in total professional judges or magistrates
8.6 Number of lay judges/magistrates 5,637 5,268 123.85 115.63
8.7 Number of female lay judges/magistrates 2,030 1,987 44.60 43.61
8.8 Number of male lay judges/magistrates 3,607 3,281 79.25 72.01
8.9 Number of part time lay judges/magistrates
8.10 Lay part time judges: Females
8.11 Lay part time judges: Males
Data on part‐time personnel is NOT included in total lay judges or magistrates
There is a specialised court dealing with organized crime
8.12 Total professional judges or magistrates assigned to the judging of organized crime
Total court budget/financial resources in millions of local currency
Currency used
Table 8: Use of an alternative reference date to "31 December"
Table 8: Alternative date
Ministry of JusticeTable 8: Source(s) of the data provided
Comments for Table 8
18 December 2008 Page 420 of 2339
Rates at the national level are given per 100,000 population based on World Population Prospects: The 2006 Revision. Rates at the largest city level are given per 100,000 population based on largest city population given in survey response, otherwise rates are not presented.
2005‐2006Period:
COURTS Croatia
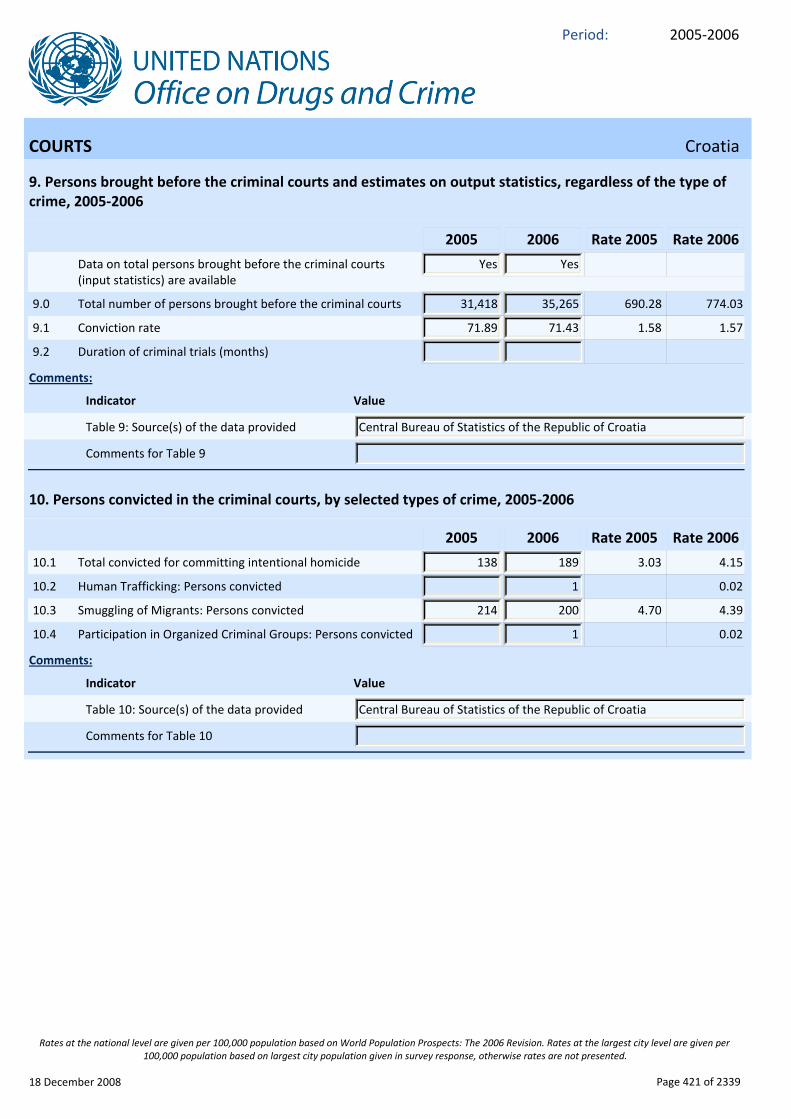
9. Persons brought before the criminal courts and estimates on output statistics, regardless of the type of crime, 2005‐2006
Indicator Value
Comments:
2005 2006 Rate 2005 Rate 2006
Data on total persons brought before the criminal courts (input statistics) are available
Yes Yes
9.0 Total number of persons brought before the criminal courts 31,418 35,265 690.28 774.03
9.1 Conviction rate 71.89 71.43 1.58 1.57
9.2 Duration of criminal trials (months)
Central Bureau of Statistics of the Republic of CroatiaTable 9: Source(s) of the data provided
Comments for Table 9
10. Persons convicted in the criminal courts, by selected types of crime, 2005‐2006
Indicator Value
Comments:
2005 2006 Rate 2005 Rate 2006
10.1 Total convicted for committing intentional homicide 138 189 3.03 4.15
10.2 Human Trafficking: Persons convicted 1 0.02
10.3 Smuggling of Migrants: Persons convicted 214 200 4.70 4.39
10.4 Participation in Organized Criminal Groups: Persons convicted 1 0.02
Central Bureau of Statistics of the Republic of CroatiaTable 10: Source(s) of the data provided
Comments for Table 10
18 December 2008 Page 421 of 2339
Rates at the national level are given per 100,000 population based on World Population Prospects: The 2006 Revision. Rates at the largest city level are given per 100,000 population based on largest city population given in survey response, otherwise rates are not presented.

2005‐2006Period:
COURTS Croatia
11. Persons convicted in the criminal courts, by sex, age group and citizenship, 2005‐2006
Indicator Value
Comments:
2005 2006 Rate 2005 Rate 2006
11.0 Grand total of persons convicted 22,586 25,190 496.23 552.89
11.1 Total females convicted 2,318 2,463 50.93 54.06
11.2 Total males convicted 20,268 22,727 445.30 498.83
11.3 Total adults convicted 21,731 24,216 477.45 531.52
11.4 Adult females convicted 2,272 2,415 49.92 53.01
11.5 Adult males convicted 19,459 21,801 427.53 478.51
11.6 Total juveniles convicted 855 974 18.79 21.38
11.7 Juvenile females convicted 46 48 1.01 1.05
11.8 Juvenile males convicted 809 926 17.77 20.32
11.9 Persons convicted: Citizens of other countries 1,597 1,598 35.09 35.07
Citizens of other countries are included in total persons convicted
Yes Yes
Central Bureau of Statistics of the Republic of CroatiaTable 11: Source(s) of the data provided
A person who has reached the age of 18 at the time of committing the crime
Courts: Definition of 'adult' used in the national criminal justice system
A person who reached, at the time of committing the crime the age of 14 but not yet 18.
Courts: Definition of 'juvenile' used in the national criminal justice system
A person who doesn´t have Croatian citizenship or whose citizenship is unknown
Courts: Definition of 'citizen of other countries' used in the national criminal justice system
Comments for Table 11
18 December 2008 Page 422 of 2339
Rates at the national level are given per 100,000 population based on World Population Prospects: The 2006 Revision. Rates at the largest city level are given per 100,000 population based on largest city population given in survey response, otherwise rates are not presented.
2005‐2006Period:
PRISONS Croatia
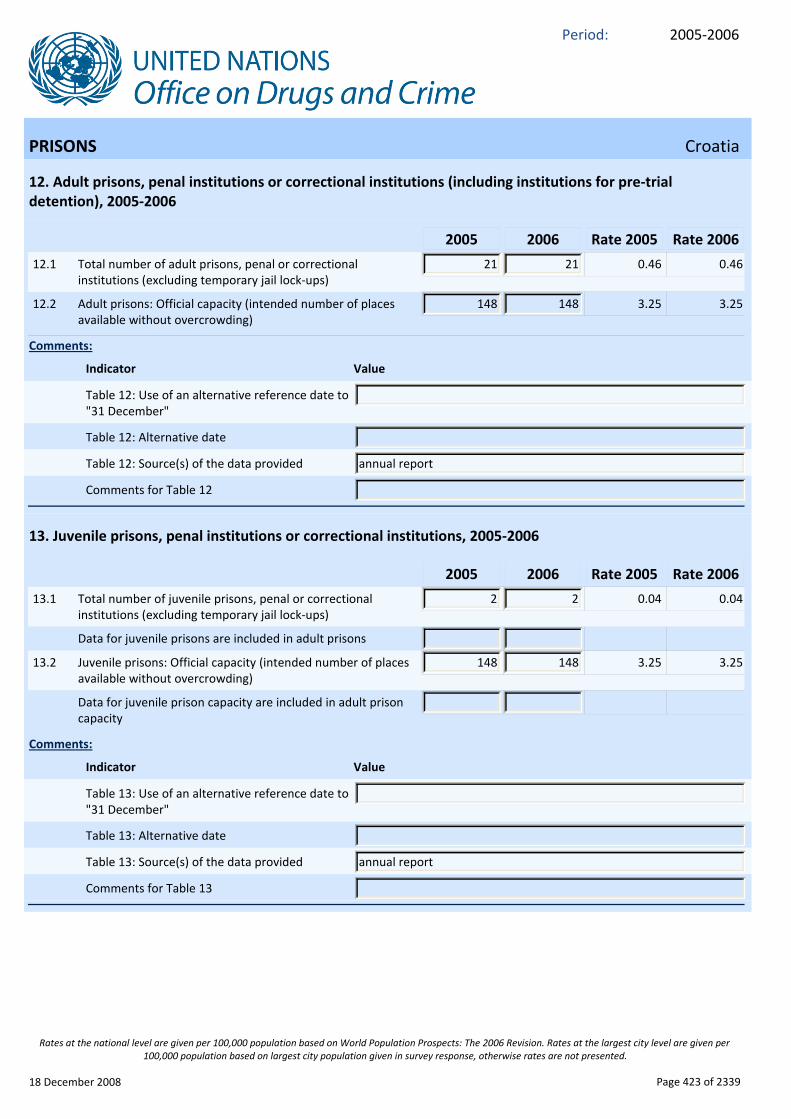
12. Adult prisons, penal institutions or correctional institutions (including institutions for pre‐trial detention), 2005‐2006
Indicator Value
Comments:
2005 2006 Rate 2005 Rate 2006
12.1 Total number of adult prisons, penal or correctional institutions (excluding temporary jail lock‐ups)
21 21 0.46 0.46
12.2 Adult prisons: Official capacity (intended number of places available without overcrowding)
148 148 3.25 3.25
Table 12: Use of an alternative reference date to "31 December"
Table 12: Alternative date
annual reportTable 12: Source(s) of the data provided
Comments for Table 12
13. Juvenile prisons, penal institutions or correctional institutions, 2005‐2006
Indicator Value
Comments:
2005 2006 Rate 2005 Rate 2006
13.1 Total number of juvenile prisons, penal or correctional institutions (excluding temporary jail lock‐ups)
2 2 0.04 0.04
Data for juvenile prisons are included in adult prisons
13.2 Juvenile prisons: Official capacity (intended number of places available without overcrowding)
148 148 3.25 3.25
Data for juvenile prison capacity are included in adult prison capacity
Table 13: Use of an alternative reference date to "31 December"
Table 13: Alternative date
annual reportTable 13: Source(s) of the data provided
Comments for Table 13
18 December 2008 Page 423 of 2339
Rates at the national level are given per 100,000 population based on World Population Prospects: The 2006 Revision. Rates at the largest city level are given per 100,000 population based on largest city population given in survey response, otherwise rates are not presented.

2005‐2006Period:
PRISONS Croatia
14. Staff of adult or juvenile prisons, penal institutions or correctional institutions (including institutions for pre‐trial detention), by sex, and financial resources, 2005‐2006
Indicator Value
Comments:
2005 2006 Rate 2005 Rate 2006
14.0 Total number of staff in adult prisons 2,262 2,257 49.70 49.54
14.1 Total number of female staff in adult prisons 592 591 13.01 12.97
14.2 Total number of male staff in adult prisons 1,670 1,666 36.69 36.57
14.3 Total number of staff in juvenile prisons 122 122 2.68 2.68
Total staff of juvenile prisons is included in total staff for adult prisons
14.4 Total number of female staff in juvenile prisons 53 53 1.16 1.16
Total female staff of juvenile prisons is included in total female staff for adult prisons
14.5 Total number of male staff in juvenile prisons 69 69 1.52 1.51
Total male staff of juvenile prisons is included in total male staff for adult prisons
Total prison budget/financial resources (adult and juvenile institutions) in millions of local currency
369,293.91 395,249.84 8,113.69 8,675.33
Table 14: Use of an alternative reference date to "31 December"
Table 14: Alternative date
annual reportTable 14: Source(s) of the data provided
Comments for Table 14
18 December 2008 Page 424 of 2339
Rates at the national level are given per 100,000 population based on World Population Prospects: The 2006 Revision. Rates at the largest city level are given per 100,000 population based on largest city population given in survey response, otherwise rates are not presented.
2005‐2006Period:
PRISONS Croatia
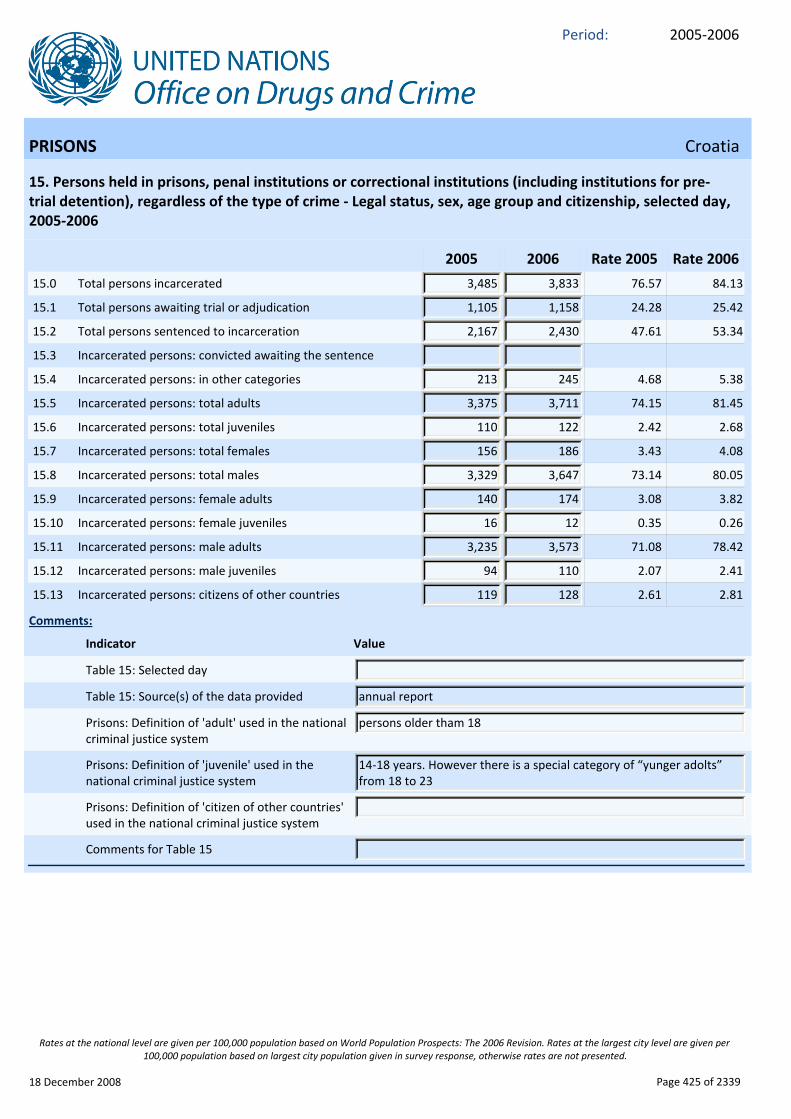
15. Persons held in prisons, penal institutions or correctional institutions (including institutions for pre‐trial detention), regardless of the type of crime ‐ Legal status, sex, age group and citizenship, selected day, 2005‐2006
Indicator Value
Comments:
2005 2006 Rate 2005 Rate 2006
15.0 Total persons incarcerated 3,485 3,833 76.57 84.13
15.1 Total persons awaiting trial or adjudication 1,105 1,158 24.28 25.42
15.2 Total persons sentenced to incarceration 2,167 2,430 47.61 53.34
15.3 Incarcerated persons: convicted awaiting the sentence
15.4 Incarcerated persons: in other categories 213 245 4.68 5.38
15.5 Incarcerated persons: total adults 3,375 3,711 74.15 81.45
15.6 Incarcerated persons: total juveniles 110 122 2.42 2.68
15.7 Incarcerated persons: total females 156 186 3.43 4.08
15.8 Incarcerated persons: total males 3,329 3,647 73.14 80.05
15.9 Incarcerated persons: female adults 140 174 3.08 3.82
15.10 Incarcerated persons: female juveniles 16 12 0.35 0.26
15.11 Incarcerated persons: male adults 3,235 3,573 71.08 78.42
15.12 Incarcerated persons: male juveniles 94 110 2.07 2.41
15.13 Incarcerated persons: citizens of other countries 119 128 2.61 2.81
Table 15: Selected day
annual reportTable 15: Source(s) of the data provided
persons older tham 18Prisons: Definition of 'adult' used in the national criminal justice system
14‐18 years. However there is a special category of “yunger adolts” from 18 to 23
Prisons: Definition of 'juvenile' used in the national criminal justice system
Prisons: Definition of 'citizen of other countries' used in the national criminal justice system
Comments for Table 15
18 December 2008 Page 425 of 2339
Rates at the national level are given per 100,000 population based on World Population Prospects: The 2006 Revision. Rates at the largest city level are given per 100,000 population based on largest city population given in survey response, otherwise rates are not presented.

2005‐2006Period:
PRISONS Croatia
16. Persons on probation or under another form of supervision in the community, selected day, 2005‐2006
Indicator Value
Comments:
2005 2006 Rate 2005 Rate 2006
Definition consistent with questionnaire for "persons on probation"
16.0 Total persons placed on probation on given day 158 253 3.47 5.55
16.1 Adults placed on probation on given day 158 253 3.47 5.55
16.2 Juveniles placed on probation on given day
Table 16: Selected day
Annual ReportTable 16: Source(s) of the data provided
Comments for Table 16
17. Persons on conditional release/parole, by age group, selected day, 2005‐2006
Indicator Value
Comments:
2005 2006 Rate 2005 Rate 2006
Definition consistent with questionnaire for "persons on conditional release/parole"
17.0 Total persons placed on release/parole on given day 1,445 1,585 31.75 34.79
17.1 Adult persons on conditional release/parole 1,429 1,585 31.40 34.79
17.2 Juvenile persons on conditional release/parole 16 0 0.35 0.00
Table 17: Selected day
Annual ReportTable 17: Source(s) of the data provided
Comments for Table 17
18 December 2008 Page 426 of 2339
Rates at the national level are given per 100,000 population based on World Population Prospects: The 2006 Revision. Rates at the largest city level are given per 100,000 population based on largest city population given in survey response, otherwise rates are not presented.
2005‐2006Period:
PRISONS Croatia
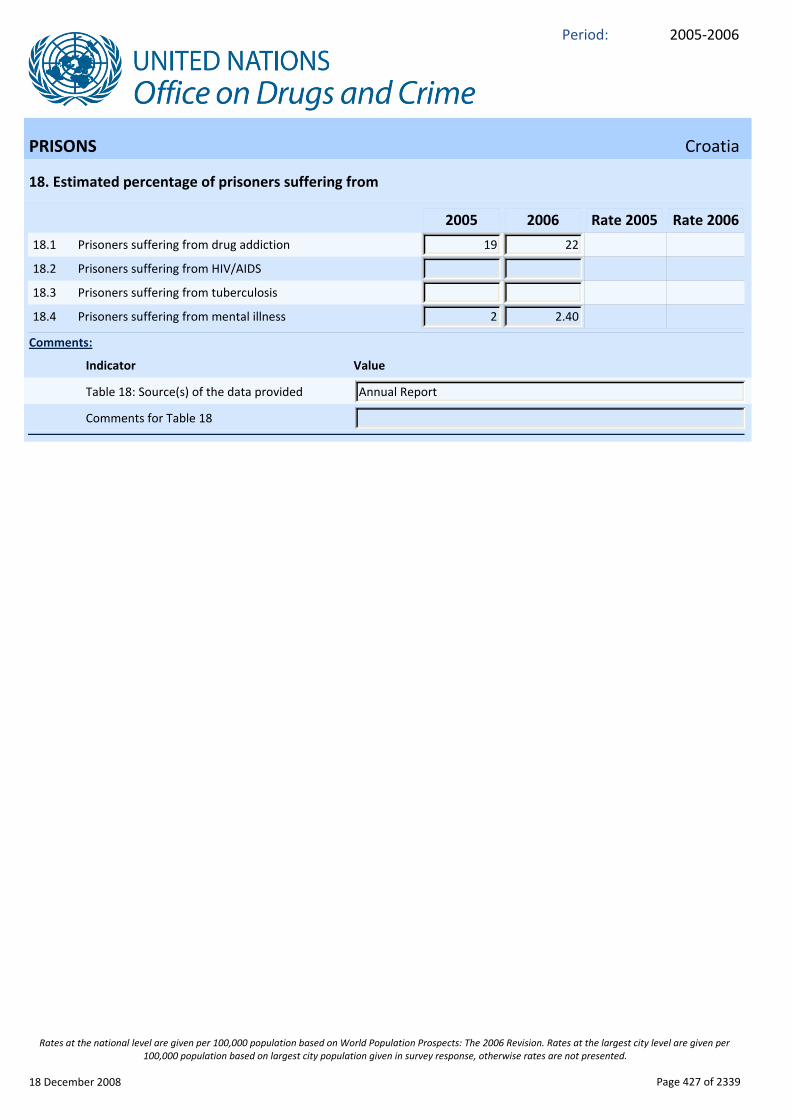
18. Estimated percentage of prisoners suffering from
Indicator Value
Comments:
2005 2006 Rate 2005 Rate 2006
18.1 Prisoners suffering from drug addiction 19 22
18.2 Prisoners suffering from HIV/AIDS
18.3 Prisoners suffering from tuberculosis
18.4 Prisoners suffering from mental illness 2 2.40
Annual ReportTable 18: Source(s) of the data provided
Comments for Table 18
18 December 2008 Page 427 of 2339
Rates at the national level are given per 100,000 population based on World Population Prospects: The 2006 Revision. Rates at the largest city level are given per 100,000 population based on largest city population given in survey response, otherwise rates are not presented.

2005‐2006Period:
Annex Croatia
19. Statistics on police recorded crime: homicide and other crimes leading to the death of another person, by category ‐ Metadata
Indicator Value
Comments:
1. recorded separately?
2. recorded as a group under ...
3. cons. intentional homicide
4. cons. non‐intentional homicide
5. cons. a crime, but not homicide
6. not considered a
crime
7. Wording in national language
Indicator
19.1 Attempted homicide19.2 Murder19.3 Manslaughter19.4 Infanticide19.5 Homicide related to
intimate/proximity19.6 Homicide related to family19.7 Homicide related to felony
murder/robbery/assault leading to death
19.8 Homicide related to fight19.9 Homicide related to sex19.10 Homicide related to drug19.11 Homicide related to alcohol19.12 Homicide related to arson19.13 Homicide related to
gang/organized crime19.14 Homicide related to
juvenile gang killings19.15 Homicide related to act of
terrorism19.16 Homicide related to
professional negligence19.17 Abortion19.18 Euthanasia19.19 Help with suicide19.20 Causing death by
dangerous driving19.21 Causing death by careless
driving19.22 Other
Table 19: Source(s) of the data provided
Comments for Table 19
18 December 2008 Page 428 of 2339
Rates at the national level are given per 100,000 population based on World Population Prospects: The 2006 Revision. Rates at the largest city level are given per 100,000 population based on largest city population given in survey response, otherwise rates are not presented.

2005‐2006Period:
Annex Croatia
20. Statistics on police recorded crime: homicide and other crimes leading to the death of another person, by category ‐ Years 2005 and 2006
2005 2006 Rate 2005 Rate 2006
20.1 Attempted homicide: Total recorded offences
Attempted homicide: Cases solved (%)
20.2 Murder: Total recorded offences
Murder: Cases solved (%)
20.3 Manslaughter: Total recorded offences
Manslaughter: Cases solved (%)
20.4 Infanticide: Total recorded offences
Infanticide: Cases solved (%)
20.5 Homicide related to intimate/proximity: Total recorded offences
Homicide related to intimate/proximity: Cases solved (%)
20.6 Homicide related to family: Total recorded offences
Homicide related to family: Cases solved (%)
20.7 Homicide related to felony murder/robbery/assault leading to death: Total recorded offences
Homicide related to felony murder/robbery/assault leading to death: Cases solved (%)
20.8 Homicide related to fight: Total recorded offences
Homicide related to fight: Cases solved (%)
20.9 Homicide related to sex: Total recorded offences
Homicide related to sex: Cases solved (%)
20.10 Homicide related to drug: Total recorded offences
Homicide related to drug: Cases solved (%)
20.11 Homicide related to alcohol: Total recorded offences
Homicide related to alcohol: Cases solved (%)
20.12 Homicide related to arson: Total recorded offences
Homicide related to arson: Cases solved (%)
20.13 Homicide related to gang/organized crime: Total recorded offences
Homicide related to gang/organized crime: Cases solved (%)
20.14 Homicide related to juvenile gang killings: Total recorded offences
Homicide related to juvenile gang killings: Cases solved (%)
18 December 2008 Page 429 of 2339
Rates at the national level are given per 100,000 population based on World Population Prospects: The 2006 Revision. Rates at the largest city level are given per 100,000 population based on largest city population given in survey response, otherwise rates are not presented.

2005‐2006Period:
Annex Croatia
20. Statistics on police recorded crime: homicide and other crimes leading to the death of another person, by category ‐ Years 2005 and 2006
Indicator Value
Comments:
2005 2006 Rate 2005 Rate 2006
20.15 Homicide related to act of terrorism: Total recorded offences
Homicide related to act of terrorism: Cases solved (%)
20.16 Homicide related to professional negligence: Total recorded offences
Homicide related to professional negligence: Cases solved (%)
20.17 Abortion: Total recorded offences
Abortion: Cases solved (%)
20.18 Euthanasia: Total recorded offences
Euthanasia: Cases solved (%)
20.19 Help with suicide: Total recorded offences
Help with suicide: Cases solved (%)
20.20 Causing death by dangerous driving: Total recorded offences
Causing death by dangerous driving: Cases solved (%)
20.21 Causing death by careless driving: Total recorded offences
Causing death by careless driving: Cases solved (%)
20.22 Other: Total recorded offences
Other: Cases solved (%)
Figures are checked with other sources
Details for checking with other sources
Figures are revised retrospectively
Details for retrospective revision
Used counting unit
Explicit counting unit
Table 20: Source(s) of the data provided
Table 20: Comments
18 December 2008 Page 430 of 2339
Rates at the national level are given per 100,000 population based on World Population Prospects: The 2006 Revision. Rates at the largest city level are given per 100,000 population based on largest city population given in survey response, otherwise rates are not presented.
2005‐2006Period:
Annex Croatia
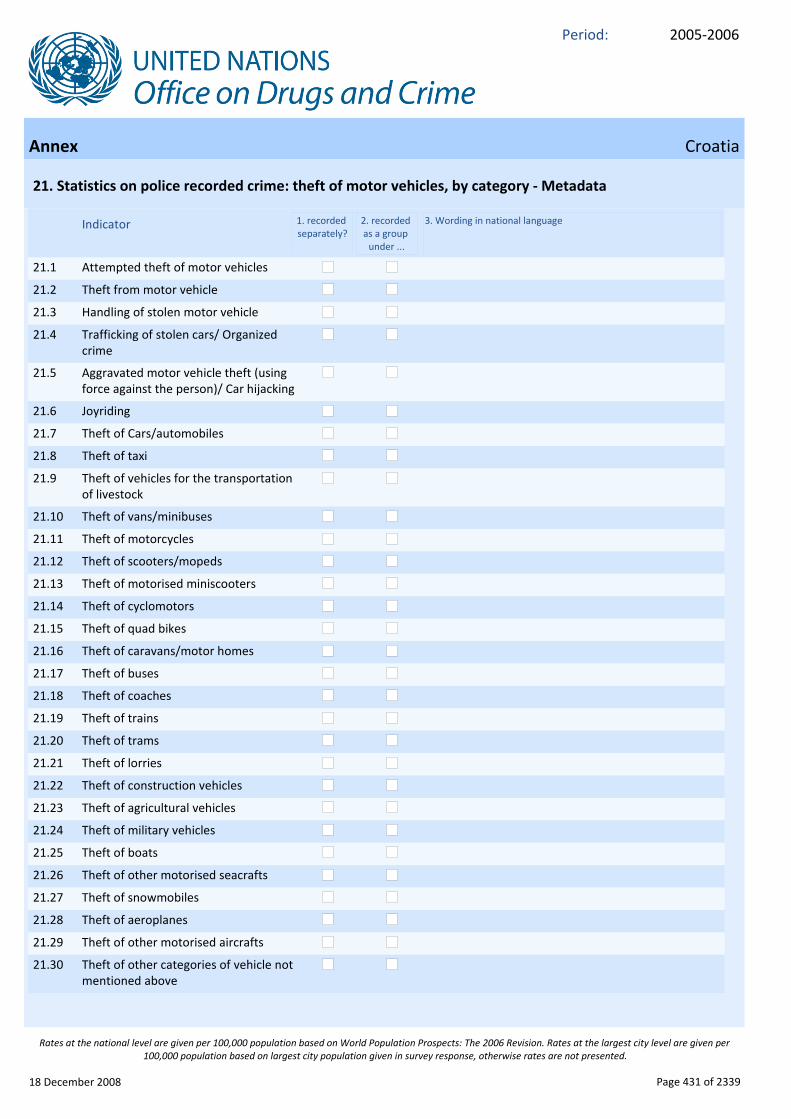
21. Statistics on police recorded crime: theft of motor vehicles, by category ‐ Metadata
1. recorded separately?
2. recorded as a group under ...
3. Wording in national languageIndicator
21.1 Attempted theft of motor vehicles
21.2 Theft from motor vehicle
21.3 Handling of stolen motor vehicle
21.4 Trafficking of stolen cars/ Organized crime
21.5 Aggravated motor vehicle theft (using force against the person)/ Car hijacking
21.6 Joyriding
21.7 Theft of Cars/automobiles
21.8 Theft of taxi
21.9 Theft of vehicles for the transportation of livestock
21.10 Theft of vans/minibuses
21.11 Theft of motorcycles
21.12 Theft of scooters/mopeds
21.13 Theft of motorised miniscooters
21.14 Theft of cyclomotors
21.15 Theft of quad bikes
21.16 Theft of caravans/motor homes
21.17 Theft of buses
21.18 Theft of coaches
21.19 Theft of trains
21.20 Theft of trams
21.21 Theft of lorries
21.22 Theft of construction vehicles
21.23 Theft of agricultural vehicles
21.24 Theft of military vehicles
21.25 Theft of boats
21.26 Theft of other motorised seacrafts
21.27 Theft of snowmobiles
21.28 Theft of aeroplanes
21.29 Theft of other motorised aircrafts
21.30 Theft of other categories of vehicle not mentioned above
18 December 2008 Page 431 of 2339
Rates at the national level are given per 100,000 population based on World Population Prospects: The 2006 Revision. Rates at the largest city level are given per 100,000 population based on largest city population given in survey response, otherwise rates are not presented.
2005‐2006Period:
Annex Croatia
21. Statistics on police recorded crime: theft of motor vehicles, by category ‐ Metadata
Indicator Value
Comments:
Table 21: Source(s) of the data provided
Table 21: Comments
18 December 2008 Page 432 of 2339
Rates at the national level are given per 100,000 population based on World Population Prospects: The 2006 Revision. Rates at the largest city level are given per 100,000 population based on largest city population given in survey response, otherwise rates are not presented.

2005‐2006Period:
Annex Croatia
22. Statistics on police recorded crime: theft of motor vehicles, by category ‐ Years 2005 and 2006
2005 2006 Rate 2005 Rate 2006
22.1 Attempted theft of motor vehicles: Total number of recorded offences
22.2 Theft from motor vehicle: Total number of recorded offences
22.3 Handling of stolen motor vehicle: Total number of recorded offences
22.4 Trafficking of stolen cars/ Organized crime: Total number of recorded offences
22.5 Aggravated motor vehicle theft (using force against the person)/ Car hijacking: Total number of recorded offences
22.6 Joyriding: Total number of recorded offences
22.7 Theft of Cars/automobiles: Total number of recorded offences
22.8 Theft of taxi: Total number of recorded offences
22.9 Theft of vehicles for the transporetation of livestock: Total number of recorded offences
22.10 Theft of vans/minibuses: Total number of recorded offences
22.11 Theft of motorcycles: Total number of recorded offences
22.12 Theft of scooters/mopeds: Total number of recorded offences
22.13 Theft of motorised miniscooters: Total number of recorded offences
22.14 Theft of cyclomotors: Total number of recorded offences
22.15 Theft of quad bikes: Total number of recorded offences
22.16 Theft of caravans/motor homes: Total number of recorded offences
22.17 Theft of buses: Total number of recorded offences
22.18 Theft of coaches: Total number of recorded offences
22.19 Theft of trains: Total number of recorded offences
22.20 Theft of trams: Total number of recorded offences
22.21 Theft of lorries: Total number of recorded offences
22.22 Theft of construction vehicles: Total number of recorded offences
22.23 Theft of agricultural vehicles: Total number of recorded offences
22.24 Theft of military vehicles: Total number of recorded offences
22.25 Theft of boats: Total number of recorded offences
22.26 Theft of other motorised seacrafts: Total number of recorded offences
18 December 2008 Page 433 of 2339
Rates at the national level are given per 100,000 population based on World Population Prospects: The 2006 Revision. Rates at the largest city level are given per 100,000 population based on largest city population given in survey response, otherwise rates are not presented.
2005‐2006Period:
Annex Croatia
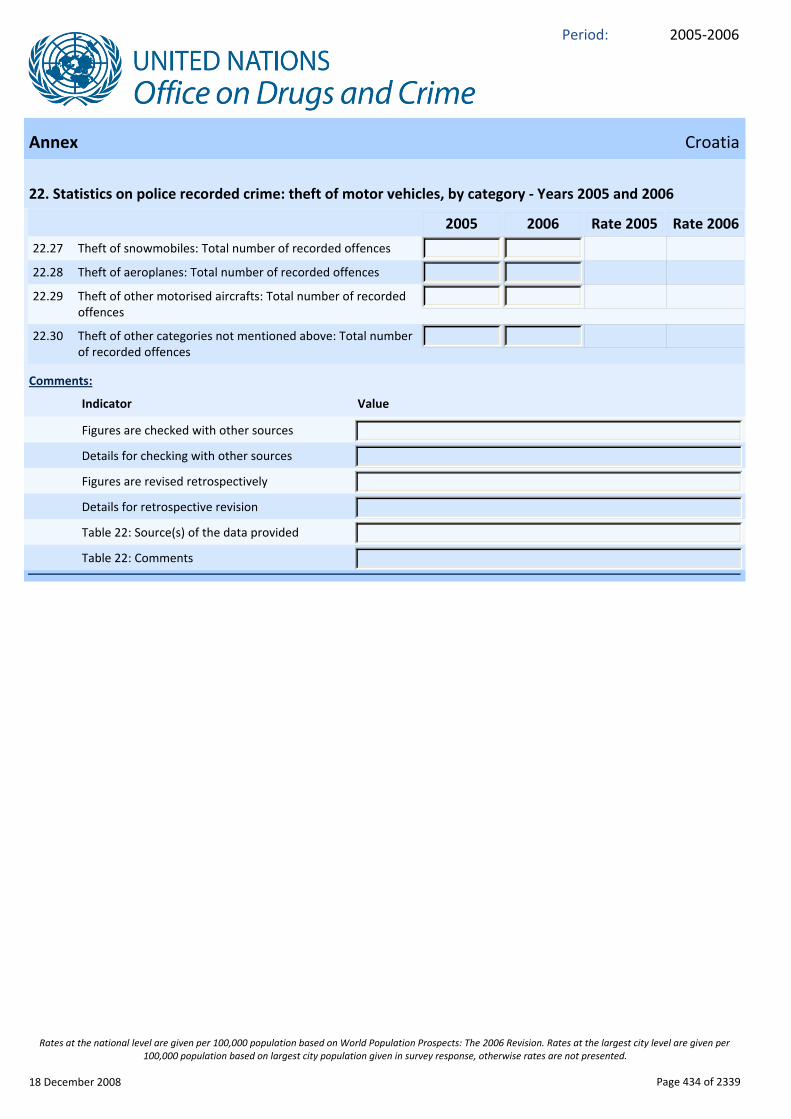
22. Statistics on police recorded crime: theft of motor vehicles, by category ‐ Years 2005 and 2006
Indicator Value
Comments:
2005 2006 Rate 2005 Rate 2006
22.27 Theft of snowmobiles: Total number of recorded offences
22.28 Theft of aeroplanes: Total number of recorded offences
22.29 Theft of other motorised aircrafts: Total number of recorded offences
22.30 Theft of other categories not mentioned above: Total number of recorded offences
Figures are checked with other sources
Details for checking with other sources
Figures are revised retrospectively
Details for retrospective revision
Table 22: Source(s) of the data provided
Table 22: Comments
18 December 2008 Page 434 of 2339
Rates at the national level are given per 100,000 population based on World Population Prospects: The 2006 Revision. Rates at the largest city level are given per 100,000 population based on largest city population given in survey response, otherwise rates are not presented.