CRM-Q4FY18-Exhibit 99s1.q4cdn.com/454432842/files/doc_financials/2018/Q4/CRM-Q418... ·...
17
Exhibit 99.1 John Cummings Salesforce Investor Relations 415-778-4188 [email protected] Gina Sheibley Salesforce Public Relations 917-297-8988 [email protected] Salesforce Announces Record Fourth Quarter and Full Year Fiscal 2018 Results Raises FY19 Revenue Guidance by $150 Million to $12.60 Billion to $12.65 Billion • Fourth Quarter Revenue of $2.85 Billion, up 24% Year-Over-Year, 21% in Constant Currency • Full Year Revenue of $10.48 Billion, up 25% Year-Over-Year, 24% in Constant Currency • Deferred Revenue of $7.09 Billion, up 28% Year-Over-Year, 25% in Constant Currency • Unbilled Deferred Revenue of Approximately $13.3 Billion, up 48% Year-Over-Year • Fourth Quarter Operating Cash Flow of $1.05 Billion, up 49% Year-Over-Year • Full Year Operating Cash Flow of $2.74 Billion, up 27% Year-Over-Year SAN FRANCISCO, Calif. – Feb. 28, 2018 – Salesforce (NYSE: CRM), the global leader in CRM, today announced results for its fiscal fourth quarter and full fiscal year ended January 31, 2018. “We had an outstanding quarter of growth that propelled Salesforce over the $10 billion revenue milestone for the year,” said Marc Benioff, chairman and CEO, Salesforce. “No other enterprise software company has achieved this scale faster than Salesforce. Our relentless focus on customer success continues to strengthen our position as the global leader in CRM.” Salesforce delivered the following results for its fiscal fourth quarter and full fiscal year 2018: Revenue: Total fourth quarter revenue was $2.85 billion, an increase of 24% year-over-year, and 21% in constant currency. Subscription and support revenues were $2.66 billion, an increase of 26% year-over- year. Professional services and other revenues were $196 million, an increase of 7% year-over-year. Full fiscal year 2018 revenue was $10.48 billion, an increase of 25% year-over-year, and 24% in constant currency. Subscription and support revenues were $9.71 billion, an increase of 25% year-over-year. Professional services and other revenues were $769 million, an increase of 21% year-over-year. Earnings per Share: Fourth quarter GAAP diluted earnings per share was $0.09, and non-GAAP diluted earnings per share was $0.35. Earnings per share benefitted by $0.02 related to net realized gains from strategic investments in the fourth quarter. For the full fiscal year 2018, GAAP diluted earnings per share was $0.17, and non-GAAP diluted earnings per share was $1.35. Cash: Cash generated from operations for the fourth quarter was $1.05 billion, an increase of 49% year- over-year. Cash generated from operations for the full fiscal year 2018 was $2.74 billion, an increase of 27% year-over-year. Total cash, cash equivalents and marketable securities finished the fourth quarter at $4.52 billion. Deferred Revenue: Deferred revenue on the balance sheet as of January 31, 2018 was $7.09 billion, an increase of 28% year-over-year, and 25% in constant currency. Unbilled deferred revenue, representing business that is contracted but unbilled and off balance sheet, ended the fourth quarter at approximately $13.3 billion, up 48% year-over-year.
Transcript of CRM-Q4FY18-Exhibit 99s1.q4cdn.com/454432842/files/doc_financials/2018/Q4/CRM-Q418... ·...

Exhibit 99.1
John CummingsSalesforce
Investor Relations415-778-4188
Gina SheibleySalesforce
Public Relations917-297-8988
Salesforce Announces Record Fourth Quarter and Full Year Fiscal 2018 ResultsRaises FY19 Revenue Guidance by $150 Million to $12.60 Billion to $12.65 Billion
• Fourth Quarter Revenue of $2.85 Billion, up 24% Year-Over-Year, 21% in Constant Currency• Full Year Revenue of $10.48 Billion, up 25% Year-Over-Year, 24% in Constant Currency• Deferred Revenue of $7.09 Billion, up 28% Year-Over-Year, 25% in Constant Currency• Unbilled Deferred Revenue of Approximately $13.3 Billion, up 48% Year-Over-Year• Fourth Quarter Operating Cash Flow of $1.05 Billion, up 49% Year-Over-Year• Full Year Operating Cash Flow of $2.74 Billion, up 27% Year-Over-Year
SAN FRANCISCO, Calif. – Feb. 28, 2018 – Salesforce (NYSE: CRM), the global leader in CRM, today announced results for its fiscal fourth quarter and full fiscal year ended January 31, 2018.
“We had an outstanding quarter of growth that propelled Salesforce over the $10 billion revenue milestone for the year,” said Marc Benioff, chairman and CEO, Salesforce. “No other enterprise software company has achieved this scale faster than Salesforce. Our relentless focus on customer success continues to strengthen our position as the global leader in CRM.”
Salesforce delivered the following results for its fiscal fourth quarter and full fiscal year 2018:
Revenue: Total fourth quarter revenue was $2.85 billion, an increase of 24% year-over-year, and 21% in constant currency. Subscription and support revenues were $2.66 billion, an increase of 26% year-over-year. Professional services and other revenues were $196 million, an increase of 7% year-over-year.
Full fiscal year 2018 revenue was $10.48 billion, an increase of 25% year-over-year, and 24% in constant currency. Subscription and support revenues were $9.71 billion, an increase of 25% year-over-year. Professional services and other revenues were $769 million, an increase of 21% year-over-year.
Earnings per Share: Fourth quarter GAAP diluted earnings per share was $0.09, and non-GAAP diluted earnings per share was $0.35. Earnings per share benefitted by $0.02 related to net realized gains from strategic investments in the fourth quarter. For the full fiscal year 2018, GAAP diluted earnings per share was $0.17, and non-GAAP diluted earnings per share was $1.35.
Cash: Cash generated from operations for the fourth quarter was $1.05 billion, an increase of 49% year-over-year. Cash generated from operations for the full fiscal year 2018 was $2.74 billion, an increase of 27% year-over-year. Total cash, cash equivalents and marketable securities finished the fourth quarter at $4.52 billion.
Deferred Revenue: Deferred revenue on the balance sheet as of January 31, 2018 was $7.09 billion, an increase of 28% year-over-year, and 25% in constant currency. Unbilled deferred revenue, representing business that is contracted but unbilled and off balance sheet, ended the fourth quarter at approximately $13.3 billion, up 48% year-over-year.

As of February 28, 2018, the company is initiating revenue, earnings per share, and deferred revenue guidance for its first quarter of fiscal year 2019. In addition, the company is raising its full fiscal year 2019 revenue guidance previously provided on November 21, 2017. The company is also initiating earnings per share guidance and operating cash flow guidance for its full fiscal year 2019. The guidance below does not reflect the impact of new accounting standards ASC 606, ASC 340-40 and ASU 2016-011 and is based on estimated GAAP tax rates that reflect the company’s currently available information, including its anticipated impact of the new Tax Act and interpretations thereof, as well as other factors and assumptions.
Q1 FY19 Guidance: Revenue is projected to be $2.925 billion to $2.935 billion, an increase of 23% year-over-year.
GAAP diluted earnings per share is projected to be $0.09 to $0.10, while non-GAAP diluted earnings per share is projected to be $0.43 to $0.44.
On balance sheet deferred revenue growth is projected to be 23% to 24% year-over-year.
Full Year FY19 Guidance: Revenue is projected to be $12.6 billion to $12.65 billion, an increase of 20% to 21% year-over-year.
GAAP diluted earnings per share is projected to be $0.61 to $0.63, while non-GAAP diluted earnings per share is projected to be $2.02 to $2.04.
Operating cash flow growth is projected to be 20% to 21% year-over-year.
The following is a per share reconciliation of GAAP diluted earnings per share to non-GAAP diluted earnings per share guidance for the next quarter and the full year:
Fiscal 2019
Q1 FY2019
GAAP diluted EPS range* $0.09 - $0.10 $0.61 - $0.63PlusAmortization of purchased intangibles $ 0.09 $ 0.35Stock-based expense $ 0.34 $ 1.47Amortization of debt discount, net $ 0.01 $ 0.01LessIncome tax effects and adjustments** $ (0.10) $ (0.42)Non-GAAP diluted EPS*** $0.43 - $0.44 $2.02 - $2.04
Shares used in computing basic net income per share (millions) 730 742Shares used in computing diluted net income per share (millions) 757 763
* The Company's GAAP tax provision is expected to be 20.0% for the three months ended April 30th, 2018 and 18.5% for the twelve months ended January 31st, 2019. The Company's GAAP diluted EPS excludes the effect of ASU 2016-01.
** The Company's Non-GAAP tax provision uses a long-term projected tax rate of 21.5%, which reflects currently available information and could be subject to change.
*** Non-GAAP diluted EPS excludes the effect of ASU 2016-01.
__________________________1Accounting Standards Codification (“ASC”) 606 “Revenue from Contracts with Customers,” ASC 340-40 “Other Assets and Deferred Costs - Contracts with Customers” and Accounting Standards Update 2016-01 “Financial Instruments” (ASU 2016-01), which will be effective as of the beginning of Fiscal 2019.

For additional information regarding non-GAAP financial measures see the reconciliation of results and related explanations below.
Quarterly Conference Call
Salesforce will host a conference call at 2:00 p.m. (PT) / 5:00 p.m. (ET) today to discuss its financial results with the investment community. A live web broadcast of the event will be available on the Salesforce Investor Relations website at www.salesforce.com/investor. A live dial-in is available domestically at 866-901-SFDC or 866-901-7332 and internationally at 706-902-1764, passcode 9190744. A replay will be available at (800) 585-8367 or (855) 859-2056 until midnight (ET) Mar. 30, 2018.
About Salesforce
Salesforce, the global leader in CRM, empowers companies to connect with their customers in a whole new way. Salesforce has headquarters in San Francisco, with offices in Europe and Asia, and trades on the New York Stock Exchange under the ticker symbol "CRM." For more information about Salesforce, visit: www.salesforce.com.
###
"Safe harbor" statement under the Private Securities Litigation Reform Act of 1995: This press release contains forward-looking statements about our financial results, which may include expected GAAP and non-GAAP financial and other operating and non-operating results, including revenue, net income, diluted earnings per share, operating cash flow growth, operating margin improvement, deferred revenue growth, expected revenue growth, expected tax rates, stock-based compensation expenses, amortization of purchased intangibles, amortization of debt discount and shares outstanding. The achievement or success of the matters covered by such forward-looking statements involves risks, uncertainties and assumptions. If any such risks or uncertainties materialize or if any of the assumptions prove incorrect, the company’s results could differ materially from the results expressed or implied by the forward-looking statements we make.
The risks and uncertainties referred to above include -- but are not limited to -- risks associated with the effect of general economic and market conditions; the impact of foreign currency exchange rate and interest rate fluctuations on our results; our business strategy and our plan to build our business, including our strategy to be the leading provider of enterprise cloud computing applications and platforms; the pace of change and innovation in enterprise cloud computing services; the competitive nature of the market in which we participate; our international expansion strategy; our service performance and security, including the resources and costs required to prevent, detect and remediate potential security breaches; the expenses associated with new data centers and third-party infrastructure providers; additional data center capacity; real estate and office facilities space; our operating results and cash flows; new services and product features; our strategy of acquiring or making investments in complementary businesses, joint ventures, services, technologies and intellectual property rights; the performance and fair value of our investments in complementary businesses through our strategic investment portfolio; our ability to realize the benefits from strategic partnerships and investments; our ability to successfully integrate acquired businesses and technologies; our ability to continue to grow and maintain deferred revenue and unbilled deferred revenue; our ability to protect our intellectual property rights; our ability to develop our brands; our reliance on third-party hardware, software and platform providers; our dependency on the development and maintenance of the infrastructure of the Internet; the effect of evolving domestic and foreign government regulations, including those related to the provision of services on the Internet, those related to accessing the Internet, and those addressing data privacy and import and export controls; the valuation of our deferred tax assets; the potential availability of additional tax assets in the future; the impact of new accounting pronouncements and tax laws, including the U.S. Tax Cuts and Jobs Act, and interpretations thereof; uncertainties affecting our ability to estimate our non-GAAP tax rate; the impact of expensing stock options and other equity awards; the sufficiency of our capital resources; factors related to our outstanding convertible notes, revolving credit facility, term loan and loan associated with 50 Fremont; compliance with our debt covenants and capital lease obligations; current and potential litigation involving us; and the impact of climate change.

Further information on these and other factors that could affect the company’s financial results is included in the reports on Forms 10-K, 10-Q and 8-K and in other filings we make with the Securities and Exchange Commission from time to time. These documents are available on the SEC Filings section of the Investor Information section of the company’s website at www.salesforce.com/investor.
Salesforce.com, inc. assumes no obligation and does not intend to update these forward-looking statements, except as required by law.
© 2018 salesforce.com, inc. All rights reserved. Salesforce and other marks are trademarks of salesforce.com, inc. Other brands featured herein may be trademarks of their respective owners.
###

salesforce.com, inc.Consolidated Statements of Operations(in thousands, except per share data)(Unaudited)
Three Months Ended January 31, Fiscal Year Ended January 31, 2018 2017 2018 2017
Revenues:Subscription and support $ 2,655,000 $ 2,110,651 $ 9,710,538 $ 7,756,205Professional services and other 196,003 183,337 769,474 635,779
Total revenues 2,851,003 2,293,988 10,480,012 8,391,984Cost of revenues (1)(2):
Subscription and support 548,475 463,271 2,033,457 1,617,315Professional services and other 189,317 162,686 740,065 616,724
Total cost of revenues 737,792 625,957 2,773,522 2,234,039Gross profit 2,113,211 1,668,031 7,706,490 6,157,945Operating expenses (1)(2):
Research and development 396,547 344,192 1,553,073 1,208,127Marketing and sales 1,364,305 1,089,243 4,829,291 3,918,027General and administrative 274,490 257,941 1,088,358 967,563
Total operating expenses 2,035,342 1,691,376 7,470,722 6,093,717Income (loss) from operations 77,869 (23,345) 235,768 64,228Investment income 11,779 3,627 35,848 27,374Interest expense (21,561) (24,323) (86,943) (88,988)Other income (1) 20,130 20,572 17,435 9,072Gains from acquisitions of strategic investments 0 0 0 13,697Income (loss) before benefit from (provision for) income taxes 88,217 (23,469) 202,108 25,383Benefit from (provision for) income taxes (20,662) (27,971) (74,630) 154,249Net income (loss) $ 67,555 $ (51,440) $ 127,478 $ 179,632Basic net income (loss) per share $ 0.09 $ (0.07) $ 0.18 $ 0.26Diluted net income (loss) per share $ 0.09 $ (0.07) $ 0.17 $ 0.26Shares used in computing basic net income (loss) per share 724,127 700,994 714,919 687,797Shares used in computing diluted net income (loss) per share 749,464 700,994 734,598 700,217
(1) Amounts include amortization of purchased intangibles from business combinations, as follows:
Three Months Ended January 31, Fiscal Year Ended January 31, 2018 2017 2018 2017
Cost of revenues $ 38,866 $ 43,214 $ 165,545 $ 127,676Marketing and sales 30,066 31,000 121,340 97,601Other non-operating expense 315 564 1,433 2,491
(2) Amounts include stock-based expense, as follows:
Three Months Ended January 31, Fiscal Year Ended January 31, 2018 2017 2018 2017
Cost of revenues $ 32,748 $ 30,545 $ 129,954 $ 107,457Research and development 62,653 63,323 259,838 187,487Marketing and sales 112,015 113,422 468,553 388,937General and administrative 30,266 37,097 138,668 136,486

salesforce.com, inc.Consolidated Statements of Operations(As a percentage of total revenues)(Unaudited)
Three Months Ended January 31, Fiscal Year Ended January 31, 2018 2017 2018 2017
Revenues:Subscription and support 93% 92 % 93% 92%Professional services and other 7 8 7 8
Total revenues 100 100 100 100Cost of revenues (1)(2):
Subscription and support 19 20 19 19Professional services and other 7 7 7 8
Total cost of revenues 26 27 26 27Gross profit 74 73 74 73Operating expenses (1)(2):
Research and development 14 15 15 14Marketing and sales 48 48 46 47General and administrative 9 11 10 11
Total operating expenses 71 74 71 72Income (loss) from operations 3 (1) 3 1Investment income 0 0 0 0Interest expense (1) (1) (1) (1)Other income (1) 1 1 0 0Gains from acquisitions of strategic investments 0 0 0 0Income (loss) before benefit from (provision for) income taxes 3 (1) 2 0Benefit from (provision for) income taxes (1) (1) (1) 2Net income (loss) 2% (2)% 1% 2%
(1) Amortization of purchased intangibles from business combinations as a percentage of total revenues, as follows:
Three Months Ended January 31, Fiscal Year Ended January 31, 2018 2017 2018 2017
Cost of revenues 1% 2% 2% 2%Marketing and sales 1 1 1 1Other non-operating expense 0 0 0 0
(2) Stock-based expense as a percentage of total revenues, as follows:
Three Months Ended January 31, Fiscal Year Ended January 31, 2018 2017 2018 2017
Cost of revenues 1% 1% 1% 1%Research and development 2 3 2 2Marketing and sales 4 5 4 5General and administrative 1 2 1 2

salesforce.com, inc.Consolidated Balance Sheets(in thousands)(Unaudited)
January 31,2018
January 31,2017
AssetsCurrent assets:
Cash and cash equivalents $ 2,543,484 $ 1,606,549Marketable securities 1,978,221 602,338Accounts receivable, net 3,917,401 3,196,643Deferred commissions 460,887 311,770Prepaid expenses and other current assets 390,378 279,527
Total current assets 9,290,371 5,996,827Property and equipment, net 1,946,527 1,787,534Deferred commissions, noncurrent 413,375 227,849Capitalized software, net 146,065 141,671Strategic investments 677,283 566,953Goodwill 7,314,096 7,263,846Intangible assets acquired through business combinations, net 826,445 1,113,374Other assets, net 395,640 486,869Total assets $ 21,009,802 $ 17,584,923Liabilities, temporary equity and stockholders’ equityCurrent liabilities:
Accounts payable, accrued expenses and other liabilities $ 2,010,096 $ 1,752,664Deferred revenue 7,094,705 5,542,802Current portion of debt 1,024,717 0
Total current liabilities 10,129,518 7,295,466Noncurrent debt 694,781 2,008,391Other noncurrent liabilities 793,140 780,939Total liabilities 11,617,439 10,084,796Temporary equity:
Convertible 0.25% senior notes due April 2018 3,867 0Stockholders’ equity:
Common stock 730 708Additional paid-in capital 9,752,340 8,040,170Accumulated other comprehensive loss (27,142) (75,841)Accumulated deficit (337,432) (464,910)
Total stockholders’ equity 9,388,496 7,500,127Total liabilities, temporary equity and stockholders’ equity $ 21,009,802 $ 17,584,923

salesforce.com, inc.Consolidated Statements of Cash Flows(in thousands)(Unaudited)
Three Months Ended January 31, Fiscal Year Ended January 31,
2018 2017 2018 2017
Operating activities:Net income (loss) $ 67,555 $ (51,440) $ 127,478 $ 179,632Adjustments to reconcile net income (loss) to net cash providedby operating activities:
Depreciation and amortization 187,689 180,766 752,600 632,245Amortization of debt discount and issuance costs 8,002 9,207 31,267 30,541Gains from acquisitions of strategic investments 0 0 0 (13,697)Amortization of deferred commissions 132,975 101,014 464,662 371,541Expenses related to employee stock plans 237,682 244,387 997,013 820,367Changes in assets and liabilities, net of businesscombinations:
Accounts receivable, net (2,397,485) (1,905,275) (720,019) (628,477)Deferred commissions (426,591) (235,065) (799,305) (462,030)Prepaid expenses and other current assets and otherassets 190,924 (3,127) 24,140 (28,850)Accounts payable, accrued expenses and otherliabilities 347,945 325,011 308,225 49,953Deferred revenue 2,702,624 2,040,668 1,551,904 1,210,973Net cash provided by operating activities 1,051,320 706,146 2,737,965 2,162,198
Investing activities:Business combinations, net of cash acquired (5,610) (360,629) (25,391) (3,192,739)Purchases of strategic investments (103,350) (44,495) (216,438) (110,329)Sales of strategic investments 74,834 53,836 130,732 80,342Purchases of marketable securities (569,397) (83,550) (2,003,115) (1,070,412)Sales of marketable securities 121,366 78,252 558,614 2,005,301Maturities of marketable securities 36,034 2,713 79,123 67,454Capital expenditures (137,759) (143,974) (534,027) (463,958)
Net cash used in investing activities (583,882) (497,847) (2,010,502) (2,684,341)Financing activities:Proceeds from term loan, net 0 0 0 495,550Proceeds from employee stock plans 165,514 85,616 650,300 401,481Principal payments on capital lease obligations (23,006) (24,397) (105,896) (98,157)Proceeds from revolving credit facility 0 748,824 0 748,824Payments on revolving credit facility 0 (550,000) (200,000) (550,000)Payments on convertible senior notes (123,179) 0 (123,179) 0
Net cash provided by financing activities 19,329 260,043 221,225 997,698Effect of exchange rate changes (15,120) (7,529) (11,753) (27,369)Net increase in cash and cash equivalents 471,647 460,813 936,935 448,186Cash and cash equivalents, beginning of period 2,071,837 1,145,736 1,606,549 1,158,363Cash and cash equivalents, end of period $ 2,543,484 $ 1,606,549 $ 2,543,484 $ 1,606,549

salesforce.com, inc.Additional Metrics(Unaudited)
Jan 31,2018
Oct 31, 2017
Jul 31, 2017
Apr 30,2017
Jan 31, 2017
Oct 31, 2016
Full Time Equivalent Headcount 29,401 28,527 27,155 26,213 25,178 23,939Financial data (in thousands):
Cash, cash equivalents andmarketable securities $ 4,521,705 $ 3,628,665 $ 3,501,245 $ 3,219,550 $ 2,208,887 $ 1,751,130Strategic investments $ 677,283 $ 670,406 $ 657,687 $ 639,191 $ 566,953 $ 555,968Deferred revenue $ 7,094,705 $ 4,392,082 $ 4,818,634 $ 5,042,652 $ 5,542,802 $ 3,495,133Unbilled deferred revenue, a non-GAAP measure (1) $13,300,000 $11,500,000 $10,400,000 $ 9,600,000 $ 9,000,000 $ 8,600,000Principal due on our outstandingdebt obligations (2) $ 1,726,821 $ 1,850,000 $ 1,850,000 $ 1,850,000 $ 2,050,000 $ 1,850,000
(1) Unbilled deferred revenue represents future billings under our non-cancelable subscription agreements that have not been invoiced and, accordingly, are not recorded in deferred revenue. The amount of unbilled deferred revenue may change from quarter to quarter for several reasons, including the specific timing, duration and size of customer subscription agreements and the timing of customer renewals.
(2) Our outstanding debt obligations include our 0.25% Convertible Senior Notes, the loan assumed on 50 Fremont, and the Term Loan. The principal due on our 0.25% Convertible Senior Notes of approximately $1.0 billion as of January 31, 2018 is payable in April 2018.
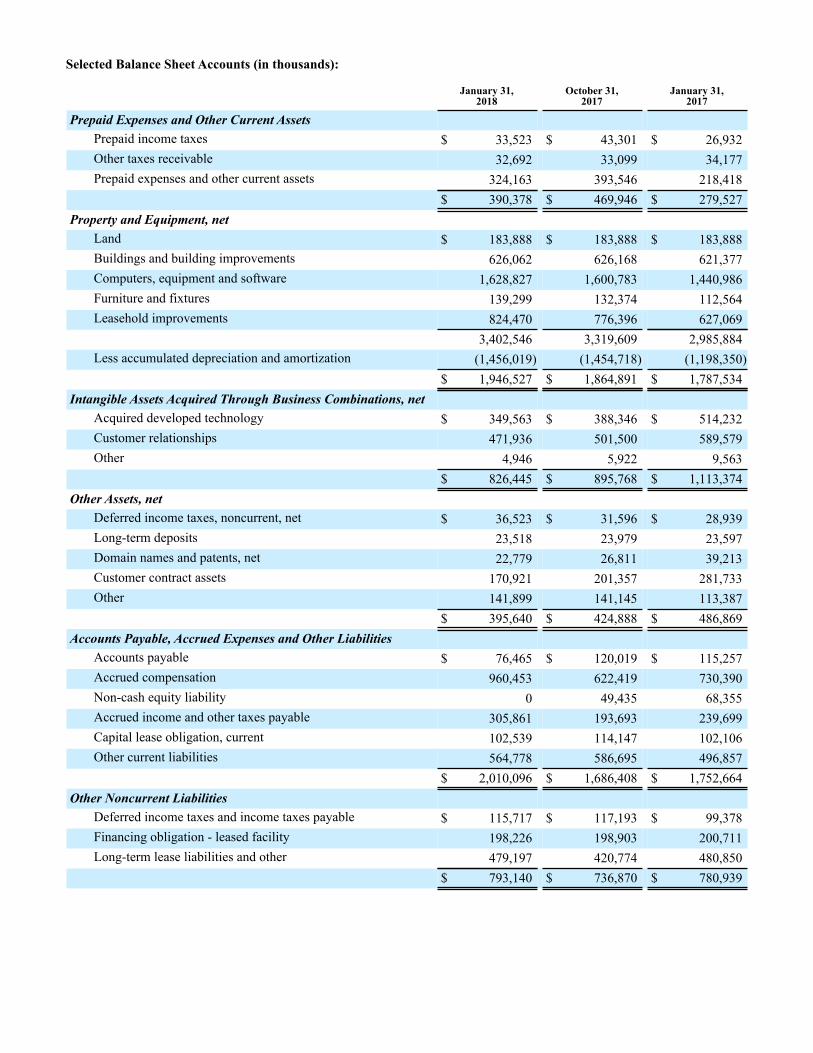
Selected Balance Sheet Accounts (in thousands):
January 31,
2018October 31,
2017January 31,
2017
Prepaid Expenses and Other Current Assets Prepaid income taxes $ 33,523 $ 43,301 $ 26,932Other taxes receivable 32,692 33,099 34,177Prepaid expenses and other current assets 324,163 393,546 218,418
$ 390,378 $ 469,946 $ 279,527Property and Equipment, net
Land $ 183,888 $ 183,888 $ 183,888Buildings and building improvements 626,062 626,168 621,377Computers, equipment and software 1,628,827 1,600,783 1,440,986Furniture and fixtures 139,299 132,374 112,564Leasehold improvements 824,470 776,396 627,069
3,402,546 3,319,609 2,985,884Less accumulated depreciation and amortization (1,456,019) (1,454,718) (1,198,350)
$ 1,946,527 $ 1,864,891 $ 1,787,534Intangible Assets Acquired Through Business Combinations, net
Acquired developed technology $ 349,563 $ 388,346 $ 514,232Customer relationships 471,936 501,500 589,579Other 4,946 5,922 9,563
$ 826,445 $ 895,768 $ 1,113,374Other Assets, net
Deferred income taxes, noncurrent, net $ 36,523 $ 31,596 $ 28,939Long-term deposits 23,518 23,979 23,597Domain names and patents, net 22,779 26,811 39,213Customer contract assets 170,921 201,357 281,733Other 141,899 141,145 113,387
$ 395,640 $ 424,888 $ 486,869Accounts Payable, Accrued Expenses and Other Liabilities
Accounts payable $ 76,465 $ 120,019 $ 115,257Accrued compensation 960,453 622,419 730,390Non-cash equity liability 0 49,435 68,355Accrued income and other taxes payable 305,861 193,693 239,699Capital lease obligation, current 102,539 114,147 102,106Other current liabilities 564,778 586,695 496,857
$ 2,010,096 $ 1,686,408 $ 1,752,664Other Noncurrent Liabilities
Deferred income taxes and income taxes payable $ 115,717 $ 117,193 $ 99,378Financing obligation - leased facility 198,226 198,903 200,711Long-term lease liabilities and other 479,197 420,774 480,850
$ 793,140 $ 736,870 $ 780,939

Supplemental Revenue Analysis
Subscription and support revenue by cloud service offering(in millions): Three Months Ended January 31, Fiscal Year Ended January 31,
2018 2017 2018 2017
Sales Cloud $ 931.8 $ 804.9 $ 3,554.3 $ 3,060.6Service Cloud 789.3 615.3 2,877.1 2,320.7Salesforce Platform and Other 536.3 391.7 1,929.2 1,441.6Marketing and Commerce Cloud 397.6 298.8 1,349.9 933.3
$ 2,655.0 $ 2,110.7 $ 9,710.5 $ 7,756.2
Total revenues by geography (in thousands): Three Months Ended January 31, Fiscal Year Ended January 31, 2018 2017 2018 2017
Americas $ 2,042,184 $ 1,718,197 $ 7,579,116 $ 6,224,971Europe 535,806 360,876 1,903,524 1,373,547Asia Pacific 273,013 214,915 997,372 793,466
$ 2,851,003 $ 2,293,988 $10,480,012 $ 8,391,984
Total revenues by geography as a percentage of totalrevenues: Three Months Ended January 31, Fiscal Year Ended January 31,
2018 2017 2018 2017
Americas 72% 75% 72% 74%Europe 19 16 18 16Asia Pacific 9 9 10 10
100% 100% 100% 100%
Revenue constant currency growth rates (ascompared to the comparable prior periods)
Three Months EndedJanuary 31, 2018
compared to Three Months Ended January 31, 2017
Three Months EndedOctober 31, 2017
compared to Three Months Ended October 31, 2016
Three Months EndedJanuary 31, 2017
compared to Three Months Ended January 31, 2016
Americas 19% 21% 29%Europe 31% 33% 26%Asia Pacific 26% 27% 30%Total growth 21% 23% 28%
We present constant currency information to provide a framework for assessing how our underlying business performed excluding the effect of foreign currency rate fluctuations. To present this information, current and comparative prior period results for entities reporting in currencies other than United States dollars are converted into United States dollars at the weighted average exchange rate for the quarter being compared to for growth rate calculations presented, rather than the actual exchange rates in effect during that period.
Deferred revenue constant currency growthrates (as compared to the comparable priorperiods)
January 31, 2018compared to
January 31, 2017
October 31, 2017compared to
October 31, 2016
January 31, 2017compared to
January 31, 2016
Total growth 25% 24% 29%
We present constant currency information for deferred revenue to provide a framework for assessing how our underlying business performed excluding the effects of foreign currency rate fluctuations. To present the information above, we convert the deferred revenue balances in local currencies in previous comparable periods using the United States dollar currency exchange rate as on the most recent balance sheet date.

Supplemental GAAP and Non-GAAP Diluted Share Count Information(share data in thousands)
Three Months Ended January 31, Fiscal Year Ended January 31, 2018 2017 2018 2017
Weighted-average shares outstanding for basic earnings pershare 724,127 700,994 714,919 687,797Effect of dilutive securities:
Convertible senior notes 5,798 1,642 4,672 1,906Employee stock awards 16,945 8,567 14,163 10,514Warrants 2,594 0 844 0
Adjusted weighted-average shares outstanding and assumedconversions for GAAP and Non-GAAP diluted earnings pershare 749,464 711,203 734,598 700,217
Supplemental Cash Flow InformationFree cash flow analysis, a non-GAAP measure(in thousands)
Three Months Ended January 31, Fiscal Year Ended January 31, 2018 2017 2018 2017
Operating cash flowGAAP net cash provided by operating activities $ 1,051,320 $ 706,146 $ 2,737,965 $ 2,162,198Less:Capital expenditures (137,759) (143,974) (534,027) (463,958)Free cash flow $ 913,561 $ 562,172 $ 2,203,938 $ 1,698,240
Comprehensive Income (Loss)(in thousands)(Unaudited)
Three Months Ended January 31, Fiscal Year Ended January 31, 2018 2017 2018 2017
Net income (loss) $ 67,555 $ (51,440) $ 127,478 $ 179,632Other comprehensive income (loss), before tax and net ofreclassification adjustments:
Foreign currency translation and other gains (losses) 23,882 (14,547) 52,072 (43,070)Unrealized gains (losses) on marketable securities andstrategic investments (55,702) (6,461) (4,497) 14,500
Other comprehensive income (loss), before tax (31,820) (21,008) 47,575 (28,570)Tax effect 1,124 8,110 1,124 2,646Other comprehensive income (loss), net of tax (30,696) (12,898) 48,699 (25,924)Comprehensive income (loss) $ 36,859 $ (64,338) $ 176,177 $ 153,708

salesforce.com, inc.GAAP Results Reconciled to non-GAAP ResultsThe following table reflects selected GAAP results reconciled to non-GAAP results. (in thousands, except per share data)(Unaudited) Three Months Ended January 31, Fiscal Year Ended January 31, 2018 2017 2018 2017
Non-GAAP gross profitGAAP gross profit $ 2,113,211 $ 1,668,031 $ 7,706,490 $ 6,157,945Plus:Amortization of purchased intangibles (a) 38,866 43,214 165,545 127,676Stock-based expense (b) 32,748 30,545 129,954 107,457Non-GAAP gross profit $ 2,184,825 $ 1,741,790 $ 8,001,989 $ 6,393,078Non-GAAP operating expensesGAAP operating expenses $ 2,035,342 $ 1,691,376 $ 7,470,722 $ 6,093,717Less:Amortization of purchased intangibles (a) (30,066) (31,000) (121,340) (97,601)Stock-based expense (b) (204,934) (213,842) (867,059) (712,910)Non-GAAP operating expenses $ 1,800,342 $ 1,446,534 $ 6,482,323 $ 5,283,206Non-GAAP income from operationsGAAP income (loss) from operations $ 77,869 $ (23,345) $ 235,768 $ 64,228Plus:Amortization of purchased intangibles (a) 68,932 74,214 286,885 225,277Stock-based expense (b) 237,682 244,387 997,013 820,367Non-GAAP income from operations $ 384,483 $ 295,256 $ 1,519,666 $ 1,109,872Non-GAAP non-operating income (loss) (c)GAAP non-operating income (loss) $ 10,348 $ (124) $ (33,660) $ (38,845)Plus:Amortization of debt discount, net 6,674 6,344 25,943 25,137Amortization of acquired lease intangible 315 564 1,433 2,491Less:Gains from acquisitions of strategic investments 0 0 0 (13,697)Non-GAAP non-operating income (loss) $ 17,337 $ 6,784 $ (6,284) $ (24,914)Non-GAAP net income GAAP net income (loss) $ 67,555 $ (51,440) $ 127,478 $ 179,632Plus:Amortization of purchased intangibles (a) 68,932 74,214 286,885 225,277Amortization of acquired lease intangible 315 564 1,433 2,491Stock-based expense (b) 237,682 244,387 997,013 820,367Amortization of debt discount, net 6,674 6,344 25,943 25,137Less:Gains from acquisitions of strategic investments 0 0 0 (13,697)Income tax effects and adjustments (117,894) (77,743) (447,415) (533,984)Non-GAAP net income $ 263,264 $ 196,326 $ 991,337 $ 705,223

Three Months Ended January 31, Fiscal Year Ended January 31,2018 2017 2018 2017
Non-GAAP diluted earnings per shareGAAP diluted net income (loss) per share $ 0.09 $ (0.07) $ 0.17 $ 0.26Plus:Amortization of purchased intangibles 0.09 0.10 0.39 0.32Amortization of acquired lease intangible 0.00 0.00 0.00 0.00Stock-based expense 0.32 0.34 1.36 1.17Amortization of debt discount, net 0.01 0.01 0.04 0.04Less:Gains from acquisitions of strategic investments 0.00 0.00 0.00 (0.02)Income tax effects and adjustments (0.16) (0.10) (0.61) (0.76)Non-GAAP diluted earnings per share $ 0.35 $ 0.28 $ 1.35 $ 1.01Shares used in computing Non-GAAP diluted netincome per share 749,464 711,203 734,598 700,217
a) Amortization of purchased intangibles were as follows:
Three Months Ended January 31, Fiscal Year Ended January 31, 2018 2017 2018 2017
Cost of revenues $ 38,866 $ 43,214 $ 165,545 $ 127,676Marketing and sales 30,066 31,000 121,340 97,601
$ 68,932 $ 74,214 $ 286,885 $ 225,277
b) Stock-based expense was as follows:
Three Months Ended January 31, Fiscal Year Ended January 31, 2018 2017 2018 2017
Cost of revenues $ 32,748 $ 30,545 $ 129,954 $ 107,457Research and development 62,653 63,323 259,838 187,487Marketing and sales 112,015 113,422 468,553 388,937General and administrative 30,266 37,097 138,668 136,486
$ 237,682 $ 244,387 $ 997,013 $ 820,367
c) GAAP non-operating income (loss) consists of investment income, interest expense, other income (expense) and gains from acquisitions of strategic investments.

salesforce.com, inc.Computation of Basic and Diluted GAAP and non-GAAP Net Income (Loss) Per Share (in thousands, except per share data)(Unaudited) Three Months Ended January 31, Fiscal Year Ended January 31, 2018 2017 2018 2017
GAAP Basic Net Income (Loss) Per ShareNet income (loss) $ 67,555 $ (51,440) $ 127,478 $ 179,632Basic net income (loss) per share $ 0.09 $ (0.07) $ 0.18 $ 0.26Shares used in computing basic net income (loss) per share 724,127 700,994 714,919 687,797
Three Months Ended January 31, Fiscal Year Ended January 31, 2018 2017 2018 2017
Non-GAAP Basic Net Income Per ShareNon-GAAP net income $ 263,264 $ 196,326 $ 991,337 $ 705,223Basic Non-GAAP net income per share $ 0.36 $ 0.28 $ 1.39 $ 1.03Shares used in computing basic Non-GAAP net income pershare 724,127 700,994 714,919 687,797
Three Months Ended January 31, Fiscal Year Ended January 31, 2018 2017 2018 2017
GAAP Diluted Net Income (Loss) Per ShareNet income (loss) $ 67,555 $ (51,440) $ 127,478 $ 179,632Diluted net income (loss) per share $ 0.09 $ (0.07) $ 0.17 $ 0.26Shares used in computing diluted net income (loss) per share 749,464 700,994 734,598 700,217
Three Months Ended January 31, Fiscal Year Ended January 31, 2018 2017 2018 2017
Non-GAAP Diluted Net Income Per ShareNon-GAAP net income $ 263,264 $ 196,326 $ 991,337 $ 705,223Diluted Non-GAAP net income per share $ 0.35 $ 0.28 $ 1.35 $ 1.01Shares used in computing diluted Non-GAAP net income pershare 749,464 711,203 734,598 700,217

Non-GAAP Financial Measures: This press release includes information about non-GAAP diluted earnings per share, non-GAAP tax rates, non-GAAP free cash flow, and constant currency revenue and constant currency deferred revenue growth rates (collectively the “non-GAAP financial measures”). These non-GAAP financial measures are measurements of financial performance that are not prepared in accordance with U.S. generally accepted accounting principles and computational methods may differ from those used by other companies. Non-GAAP financial measures are not meant to be considered in isolation or as a substitute for comparable GAAP measures and should be read only in conjunction with the company’s consolidated financial statements prepared in accordance with GAAP. Management uses both GAAP and non-GAAP measures when planning, monitoring, and evaluating the company’s performance.
The primary purpose of using non-GAAP measures is to provide supplemental information that may prove useful to investors and to enable investors to evaluate the company’s results in the same way management does. Management believes that supplementing GAAP disclosure with non-GAAP disclosure provides investors with a more complete view of the company’s operational performance and allows for meaningful period-to-period comparisons and analysis of trends in the company’s business. Further, to the extent that other companies use similar methods in calculating non-GAAP measures, the provision of supplemental non-GAAP information can allow for a comparison of the company’s relative performance against other companies that also report non-GAAP operating results.
Non-GAAP diluted earnings per share excludes, to the extent applicable, the impact of the following items: stock-based compensation, amortization of acquisition-related intangibles, amortization of acquired leases, the net amortization of debt discount on the company’s convertible senior notes, gains/losses on conversions of the company’s convertible senior notes, gains/losses on sales of land and building improvements, gains/losses on company-initiated acquisitions of entities in which the company held an equity investment, and termination of office leases, as well as income tax adjustments. These items are excluded because the decisions that give rise to them are not made to increase revenue in a particular period, but instead for the company’s long-term benefit over multiple periods.
Specifically, management is excluding the following items from its non-GAAP earnings per share, as applicable, for the periods presented in the Q4 FY18 financial statements and for its non-GAAP estimates for Q1 and FY19:
• Stock-Based Expenses: The company’s compensation strategy includes the use of stock-based compensation to attract and retain employees and executives. It is principally aimed at aligning their interests with those of our stockholders and at long-term employee retention, rather than to motivate or reward operational performance for any particular period. Thus, stock-based compensation expense varies for reasons that are generally unrelated to operational decisions and performance in any particular period.
• Amortization of Purchased Intangibles and Acquired Leases: The company views amortization of acquisition- and building-related intangible assets, such as the amortization of the cost associated with an acquired company’s research and development efforts, trade names, customer lists and customer relationships, and acquired lease intangibles, as items arising from pre-acquisition activities determined at the time of an acquisition. While these intangible assets are continually evaluated for impairment, amortization of the cost of purchased intangibles is a static expense, one that is not typically affected by operations during any particular period.
• Amortization of Debt Discount: Under GAAP, certain convertible debt instruments that may be settled in cash (or other assets) on conversion are required to be separately accounted for as liability (debt) and equity (conversion option) components of the instrument in a manner that reflects the issuer’s non-convertible debt borrowing rate. Accordingly, for GAAP purposes we are required to recognize imputed interest expense on the company’s $1.15 billion of convertible senior notes due in April 2018 that were issued in a private placement in March 2013. The imputed interest rate was approximately 2.5% for the convertible notes due 2018, while the actual coupon interest rate of the notes is 0.25%. The difference between the imputed interest expense and the coupon interest expense, net of the interest amount capitalized, is excluded from management’s assessment of the company’s operating performance because management believes that this non-cash expense is not indicative of ongoing operating performance.

• Gains on Acquisitions of Strategic Investments: The company views gains on sales of its strategic investments resulting from acquisitions initiated by the company in which an equity interest was previously held as discrete events and not indicative of operational performance during any particular period.
• Income Tax Effects and Adjustments: The company utilizes a fixed long-term projected non-GAAP tax rate in order to provide better consistency across the interim reporting periods by eliminating the effects of items such as changes in the tax valuation allowance and tax effects of acquisitions-related costs, since each of these can vary in size and frequency. When projecting this long-term rate, the company evaluated a three-year financial projection that excludes the direct impact of the following non-cash items: stock-based expenses, amortization of purchased intangibles and acquired leases, amortization of debt discount, and gains on acquisitions of strategic investments. The projected rate also assumes no new acquisitions in the three-year period, and considers other factors including the company’s expected tax structure, its tax positions in various jurisdictions and key legislation in major jurisdictions where the company operates. For fiscal 2018, after evaluating the impact of the 2017 U.S. Tax Cuts and Jobs Act (“Tax Act”) for the period from enactment of the Tax Act on December 22, 2017 to fiscal year end, the company concluded that its previously disclosed non-GAAP tax rate of 34.5 percent remained appropriate. For fiscal 2019, the company has determined that its projected non-GAAP tax rate will be 21.5 percent, which reflects currently available information, including the anticipated impact of the Tax Act and interpretations thereof, as well as other factors and assumptions. The non-GAAP tax rate could be subject to change for a variety of reasons, including the company’s ongoing analysis of the Tax Act over the measurement period, the rapidly evolving global tax environment, significant changes in the company’s geographic earnings mix including due to acquisition activity, or other changes to the company’s strategy or business operations. The company will re-evaluate its long-term rate as appropriate.
The company defines the non-GAAP measure free cash flow as GAAP net cash provided by operating activities, less capital expenditures. For this purpose, capital expenditures does not include our strategic investments, nor does it include any costs or activities related to our purchase of 50 Fremont land and building, and building - leased facilities.


![[Exhibit A] [Exhibit B]. [Exhibit D] [Exhibit F]](https://static.fdocuments.net/doc/165x107/6294402616e6d749834caeff/exhibit-a-exhibit-b-exhibit-d-exhibit-f.jpg)