Criticality of the Geological Copper Family - MMTA · Criticality of the Geological Copper Family...
8
Criticality of the Geological Copper Family Nedal T. Nassar, Rachel Barr, Matthew Browning, Zhouwei Diao, Elizabeth Friedlander, E. M. Harper,* Claire Henly, Goksin Kavlak, Sameer Kwatra, Christine Jun, Simon Warren, Man-Yu Yang, and T. E. Graedel Center for Industrial Ecology, School of Forestry and Environmental Studies, Yale University, 195 Prospect Street, New Haven, Connecticut 06511, United States 10.1021/es203534z * S Supporting Information ABSTRACT: Because modern technology depends on reliable supplies of a wide variety of materials, and because of increasing concern about those supplies, a comprehensive methodology has been created to quantify the degree of criticality of the metals of the periodic table. In this paper, we apply this methodology to the elements of the geological copper family: Cu, As, Se, Ag, Te, and Au. These elements are technologically important, but show a substantial variation in different factors relating to their supply risk, vulnerability to supply restriction, and environmental implications. Assessments are made on corporate, national, and global levels for year 2008. Evaluations of each of the multiple indicators are presented and the results plotted in “criticality space”, together with Monte Carlo simulation-derived “uncertainty cloud” estimates for each of the aggregated evaluations. For supply risk over both the medium term and long term, As is the highest risk of the six metals, with Se and Ag nearly as high. Gold has the most severe environmental implications ranking. Vulnerability to supply restriction (VSR) at the corporate level for an invented solar cell manufacturing firm shows Se, Te, and Cu as approximately equal, Cu has the highest VSR at the national level, and Cu and Au have the highest VSRs at the global level. Criticality vector magnitudes are greatest at the global level for As (and then Au and Ag) and at the national level for As and Au; at the corporate level, Se is highest with Te and Cu lower. An extension of this work, now in progress, will provide criticality estimates for several different development scenarios for the period 2010−2050. ■ INTRODUCTION Industrial manufacturing sectors and their host countries depend upon reliable supplies of resources. Some of those resources are more important than others; they may be the principal constituents of major products, their physical and chemical properties may be unsubstitutable, or they may be more environmentally benign than alternative materials. If these resources are not available, or are only available at unsuitably high prices, the business plan of a corporation, the strategic plan of a country, or the flexibility of technology in the future may be severely impacted. Most metals are found in nature in combinations, rather than singly. A given mineral deposit normally has one or two elements that provide the economic basis for development (host metals), together with smaller concentrations of other elements (companion metals) whose recovery might or might not make economic sense. Because of variations in companion metal concentrations and financial considerations, companion metal production sometimes occurs, sometimes not. Data on host metals are generally available, but information on companion metal production, trade, and use is much less widely reported. As a consequence, recent assessments regarding the long-term availability of metals 1−6 have generated quite widely differing results, both because of the sparse information available and because of the different goals of the assessments themselves. The concept of a structured assessment of the criticality of nonrenewable resources was developed by the National Research Council (NRC), 1 where the criticality of an element is defined as the risk that supplies of the element might not be routinely available together with an assessment of the impact of such a restriction on the evaluating organization. The general concept of criticality, if not the NRC framework, has been embraced by a number of organizations, but differences in methodology and perspective have produced wide differences in results. 7 To address this unsatisfactory situation, and to build upon the NRC’s conceptual foundation, our research group has created a detailed methodology to generate utilitarian assess- ments of the criticality of metals and to display the results on a three-dimensional criticality plot. 8 We demonstrate this methodology in specific applications in this paper. Because of the nature of metal deposits, we have chosen to analyze the criticality of metals in groups of geological families. Received: October 5, 2011 Revised: December 10, 2011 Accepted: December 14, 2011 Article pubs.acs.org/est © XXXX American Chemical Society A dx.doi.org/10.1021/es203535w | Environ. Sci. Technol. XXXX, XXX, XXX−XXX
Transcript of Criticality of the Geological Copper Family - MMTA · Criticality of the Geological Copper Family...

Criticality of the Geological Copper FamilyNedal T. Nassar, Rachel Barr, Matthew Browning, Zhouwei Diao, Elizabeth Friedlander, E. M. Harper,*Claire Henly, Goksin Kavlak, Sameer Kwatra, Christine Jun, Simon Warren, Man-Yu Yang,and T. E. Graedel
Center for Industrial Ecology, School of Forestry and Environmental Studies, Yale University, 195 Prospect Street, New Haven,Connecticut 06511, United States
10.1021/es203534z
*S Supporting Information
ABSTRACT: Because modern technology depends on reliable supplies of a widevariety of materials, and because of increasing concern about those supplies, acomprehensive methodology has been created to quantify the degree of criticalityof the metals of the periodic table. In this paper, we apply this methodology to theelements of the geological copper family: Cu, As, Se, Ag, Te, and Au. Theseelements are technologically important, but show a substantial variation indifferent factors relating to their supply risk, vulnerability to supply restriction,and environmental implications. Assessments are made on corporate, national,and global levels for year 2008. Evaluations of each of the multiple indicators arepresented and the results plotted in “criticality space”, together with Monte Carlosimulation-derived “uncertainty cloud” estimates for each of the aggregatedevaluations. For supply risk over both the medium term and long term, As is thehighest risk of the six metals, with Se and Ag nearly as high. Gold has the mostsevere environmental implications ranking. Vulnerability to supply restriction (VSR) at the corporate level for an invented solarcell manufacturing firm shows Se, Te, and Cu as approximately equal, Cu has the highest VSR at the national level, and Cu andAu have the highest VSRs at the global level. Criticality vector magnitudes are greatest at the global level for As (and then Au andAg) and at the national level for As and Au; at the corporate level, Se is highest with Te and Cu lower. An extension of this work,now in progress, will provide criticality estimates for several different development scenarios for the period 2010−2050.
■ INTRODUCTIONIndustrial manufacturing sectors and their host countriesdepend upon reliable supplies of resources. Some of thoseresources are more important than others; they may be theprincipal constituents of major products, their physical andchemical properties may be unsubstitutable, or they may bemore environmentally benign than alternative materials. If theseresources are not available, or are only available at unsuitablyhigh prices, the business plan of a corporation, the strategicplan of a country, or the flexibility of technology in the futuremay be severely impacted.Most metals are found in nature in combinations, rather than
singly. A given mineral deposit normally has one or twoelements that provide the economic basis for development(host metals), together with smaller concentrations of otherelements (companion metals) whose recovery might or mightnot make economic sense. Because of variations in companionmetal concentrations and financial considerations, companionmetal production sometimes occurs, sometimes not. Data onhost metals are generally available, but information oncompanion metal production, trade, and use is much lesswidely reported. As a consequence, recent assessmentsregarding the long-term availability of metals1−6 have generatedquite widely differing results, both because of the sparse
information available and because of the different goals of theassessments themselves.The concept of a structured assessment of the criticality of
nonrenewable resources was developed by the NationalResearch Council (NRC),1 where the criticality of an elementis defined as the risk that supplies of the element might not beroutinely available together with an assessment of the impact ofsuch a restriction on the evaluating organization. The generalconcept of criticality, if not the NRC framework, has beenembraced by a number of organizations, but differences inmethodology and perspective have produced wide differencesin results.7 To address this unsatisfactory situation, and to buildupon the NRC’s conceptual foundation, our research group hascreated a detailed methodology to generate utilitarian assess-ments of the criticality of metals and to display the results on athree-dimensional criticality plot.8 We demonstrate thismethodology in specific applications in this paper.Because of the nature of metal deposits, we have chosen to
analyze the criticality of metals in groups of geological families.
Received: October 5, 2011Revised: December 10, 2011Accepted: December 14, 2011
Article
pubs.acs.org/est
© XXXX American Chemical Society A dx.doi.org/10.1021/es203535w | Environ. Sci. Technol. XXXX, XXX, XXX−XXX

In the present work, we assess the criticality of the copperfamily, which we define as consisting of six elements: thecopper host and five companions, arsenic, selenium, silver,tellurium, and gold. We recognize that gold and silver aresometimes mined for themselves and sometimes occur ascompanions of metals other than copper and that traceamounts of additional metals are occasionally found in copperores. Our family definition is thus a grouping of conveniencerather than a precise reflection of geological exclusiveness.The elements in the copper family are, of course, central to
much of modern technology. Copper’s widest use is totransport electricity, while gold and silver, in addition to theirobvious uses as investment and jewelry metals, also playimportant roles in modern electronics. Selenium and telluriumare major constituents in thin-film solar cells, among other uses.Arsenic is an essential ingredient in high-speed computer chips,in the form of gallium arsenide. Restrictions to the availabilityof any of these elements would constrain a number oftechnological sectors, and an assessment of their criticality istherefore of significant interest.
■ MATERIALS AND METHODSThe methodology for evaluating criticality is the subject of acompanion paper,8 in which we describe aspects of themethodology that pertain to what we term “criticality space”:supply risk (SR), environmental implications (EI), andvulnerability to supply restriction (VSR) and to corporate,national, and global organizational levels. (An index ofacronyms is contained in the Supporting Information of ref8.) The application of this methodology to the specific exampleof the geological copper family is discussed below. The listedorder of the elements in tables is that of their atomic numbers.All data and results refer to year 2008. A unique aspect of thisapproach is what we believe to be the first Monte Carlouncertainty estimate for three-dimensional aggregated variables.For each component evaluation, each indicator was varied overits assigned uncertainty range for a sequence of 10 000iterations, each iteration being plotted to form an “uncertaintycloud” in criticality space. This process is described in detail inthe Supporting Information.The criticality analysis at the corporate level is specific to an
individual firm, its product line, its corporate strategy, itsfinancial details, and its ability to innovate. Rather than applythe methodology to an existing firm, a process that wouldinevitably involve the use of proprietary data, we have chosen to“invent” an exemplar firm to illustrate the application of ourmethodology as follows.Solar Future, Inc. This moderate-sized firm’s principal
business is the manufacture and installation of CIGS (copperindium gallium selenide) and CdTe (cadmium telluride) thin-film solar cells and is located in a developed country.Competitors have established technologies for alternativesolar cell composition (amorphous and single-crystal silicon),so the business rests upon developing and deploying CIGS andCdTe technology. The values we designate for the VSRindicators of Solar Future, Inc. (other than those forsubstitution, which are not firm-dependent) are presented inthe results with more details provided in the SupportingInformation.Actual firms may use the results from this artificial case study
as a demonstration of the value of the methodology to theirown particular circumstances.
For criticality at the national level, we demonstrate the utilityof our approach by evaluating the United States. The UnitedStates has good copper family resources, a strong manufactur-ing heritage, and a relatively affluent population accustomed totechnology’s benefits.The global level is addressed using the information and
approaches described in ref 8.The three components are themselves aggregates of several
metrics each, as described in detail in ref 8 and its SupportingInformation. As pointed out in that discussion, metrics ofseveral different types are thereby aggregated, a process thatinvolves a certain degree of arbitrariness. Different users maymake different choices in carrying out the evaluation;nonetheless, by openly providing comprehensive informationregarding our methodology, we enable users to apply themethodology precisely as they find it suitable to their ownunique needs.Because of the many individual indicators that must be
evaluated as part of the methodology, and the difficulty inspecifying the values for many of them with precision, weexplicitly estimate for each indicator a quantitative uncertainty.We include these uncertainty values in presenting the results. Inparticular, our final criticality evaluations carry with them anuncertainty in each of the three criticality dimensions that iscalculated as detailed in ref 8 and illustrated in the resultingdiagrams.
Supply Risk for the Geological Copper FamilyElements. SR consists of three components, geological,technological, and economic (GTE), social and regulatory(S&R), and geopolitical (GP). Each component, in turn, iscomprised of indicators: depletion time (DT) and companionmetal fraction (CF) for GTE, policy potential index (PPI) andhuman development index (HDI) for S&R, and worldwidegovernance indicatorspolitical stability and absence ofviolence/terrorism (WGI-PV) and global supply concentration(GSC) for GP. The evaluation approach for each indicator isunique, but the result for each is transformed to a 0−100 (lowto high SR) common scale. The ratings for the components andfor the overall SR are generated by equally weighting theindicators, but unequal weighting is an option for the individualanalyst (as discussed in more detail in the SupportingInformation in ref 8).The details of this analysis for the copper family elements are
largely described in the Supporting Information, but a fewexplanatory comments are appropriate here. The first relates toDT. Whereas some analysts have previously used only thegeological stocks for this calculation (e.g., Morley andEatherley6), we assess also the in-use (above-ground) stocks,their in-use lifetimes, and their typical recycling rates. (Thisapproach is expected to be particularly important for elementssuch as lead with short in-use lifetimes and high recyclingrates.) A second remark is that we regard corporations andcountries as more concerned with shorter term time horizonsand global analysts with longer ones, so we utilize reserves forthe geological stocks for the first case and reserve base for thesecond (in both cases with in-use recycling flows).It is also important to note that the PPI, HDI, and WGI-PV
scores are weighted by production. As described in ref 8, theproduction values used in weighting each country’s contribu-tion to the overall indicator score can relate to the metal’smining, smelting, or refining production for each of theseindicators except PPI (because PPI is based explicitly on anevaluation of a jurisdiction’s mining operation and potential).
Environmental Science & Technology Article
dx.doi.org/10.1021/es203535w | Environ. Sci. Technol. XXXX, XXX, XXX−XXXB

Figure 1. continued
Environmental Science & Technology Article
dx.doi.org/10.1021/es203535w | Environ. Sci. Technol. XXXX, XXX, XXX−XXXC

Figure 1. Resulting criticality assessment values for indicators, components, and axes of the geological copper family of elements. The abbreviationsare as follows: DTM = depletion time, medium-term perspective; CF = companion metal fraction; PPI = policy potential index; HDI = humandevelopment index; WGI-PV = worldwide governance indicatorspolitical stability and absence of violence/terrorism; GSC = global supplyconcentration, SRM = supply risk, medium-term perspective; DTL = depletion time, long-term perspective; SRL = supply risk, long-term perspective;EI = environmental implications; RI = percentage of revenue impacted; PT = ability to pass through cost increases; CS = importance to corporatestrategy; SP = substitute performance; SA = substitute availability; ER = environmental impact ratio; PR = price ratio; AI = ability to innovate; VSRC= vulnerability to supply restriction, corporate; NE = national economic importance; PPUN = percentage of population utilizing, national; IRR = netimport reliance ratio; IR = net import reliance; GII = global innovation index; VSRN = vulnerability to supply restriction, national; PPUG =percentage of population utilizing, global; VSRG = vulnerability to supply restriction, global. For each indicator, component, and axis score, fourvalues are provided per element. Under the column labeled “D”, the default values are provided; these values are obtained when all of the statedassumptions are utilized. Under the column labeled “U”, three values from the uncertainty analysis are provided per indicator for each element: the5th percentile, the median, and the 95th percentile in that order from top to bottom. Note that values reported for all indicators are based on theappropriately weighted and scaled “transformed” scores (see ref 8 for details). More information regarding the assumptions and uncertainty analysisis provided in the Supporting Information. Note that DTM (along with CF) was used to calculate GTE. Values are reported to the nearest wholenumber and colored according to the color ramp shown at the top of the figure.
Environmental Science & Technology Article
dx.doi.org/10.1021/es203535w | Environ. Sci. Technol. XXXX, XXX, XXX−XXXD
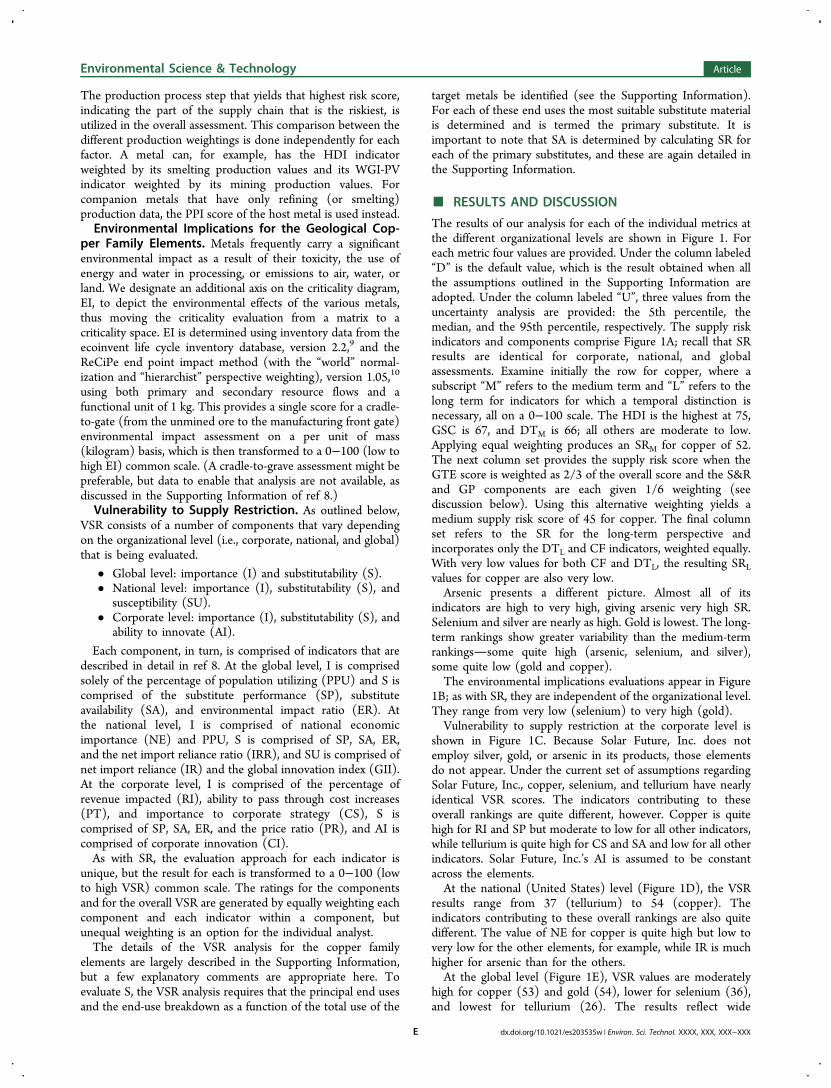
The production process step that yields that highest risk score,indicating the part of the supply chain that is the riskiest, isutilized in the overall assessment. This comparison between thedifferent production weightings is done independently for eachfactor. A metal can, for example, has the HDI indicatorweighted by its smelting production values and its WGI-PVindicator weighted by its mining production values. Forcompanion metals that have only refining (or smelting)production data, the PPI score of the host metal is used instead.Environmental Implications for the Geological Cop-
per Family Elements. Metals frequently carry a significantenvironmental impact as a result of their toxicity, the use ofenergy and water in processing, or emissions to air, water, orland. We designate an additional axis on the criticality diagram,EI, to depict the environmental effects of the various metals,thus moving the criticality evaluation from a matrix to acriticality space. EI is determined using inventory data from theecoinvent life cycle inventory database, version 2.2,9 and theReCiPe end point impact method (with the “world” normal-ization and “hierarchist” perspective weighting), version 1.05,10
using both primary and secondary resource flows and afunctional unit of 1 kg. This provides a single score for a cradle-to-gate (from the unmined ore to the manufacturing front gate)environmental impact assessment on a per unit of mass(kilogram) basis, which is then transformed to a 0−100 (low tohigh EI) common scale. (A cradle-to-grave assessment might bepreferable, but data to enable that analysis are not available, asdiscussed in the Supporting Information of ref 8.)Vulnerability to Supply Restriction. As outlined below,
VSR consists of a number of components that vary dependingon the organizational level (i.e., corporate, national, and global)that is being evaluated.
• Global level: importance (I) and substitutability (S).• National level: importance (I), substitutability (S), and
susceptibility (SU).• Corporate level: importance (I), substitutability (S), and
ability to innovate (AI).
Each component, in turn, is comprised of indicators that aredescribed in detail in ref 8. At the global level, I is comprisedsolely of the percentage of population utilizing (PPU) and S iscomprised of the substitute performance (SP), substituteavailability (SA), and environmental impact ratio (ER). Atthe national level, I is comprised of national economicimportance (NE) and PPU, S is comprised of SP, SA, ER,and the net import reliance ratio (IRR), and SU is comprised ofnet import reliance (IR) and the global innovation index (GII).At the corporate level, I is comprised of the percentage ofrevenue impacted (RI), ability to pass through cost increases(PT), and importance to corporate strategy (CS), S iscomprised of SP, SA, ER, and the price ratio (PR), and AI iscomprised of corporate innovation (CI).As with SR, the evaluation approach for each indicator is
unique, but the result for each is transformed to a 0−100 (lowto high VSR) common scale. The ratings for the componentsand for the overall VSR are generated by equally weighting eachcomponent and each indicator within a component, butunequal weighting is an option for the individual analyst.The details of the VSR analysis for the copper family
elements are largely described in the Supporting Information,but a few explanatory comments are appropriate here. Toevaluate S, the VSR analysis requires that the principal end usesand the end-use breakdown as a function of the total use of the
target metals be identified (see the Supporting Information).For each of these end uses the most suitable substitute materialis determined and is termed the primary substitute. It isimportant to note that SA is determined by calculating SR foreach of the primary substitutes, and these are again detailed inthe Supporting Information.
■ RESULTS AND DISCUSSION
The results of our analysis for each of the individual metrics atthe different organizational levels are shown in Figure 1. Foreach metric four values are provided. Under the column labeled“D” is the default value, which is the result obtained when allthe assumptions outlined in the Supporting Information areadopted. Under the column labeled “U”, three values from theuncertainty analysis are provided: the 5th percentile, themedian, and the 95th percentile, respectively. The supply riskindicators and components comprise Figure 1A; recall that SRresults are identical for corporate, national, and globalassessments. Examine initially the row for copper, where asubscript “M” refers to the medium term and “L” refers to thelong term for indicators for which a temporal distinction isnecessary, all on a 0−100 scale. The HDI is the highest at 75,GSC is 67, and DTM is 66; all others are moderate to low.Applying equal weighting produces an SRM for copper of 52.The next column set provides the supply risk score when theGTE score is weighted as 2/3 of the overall score and the S&Rand GP components are each given 1/6 weighting (seediscussion below). Using this alternative weighting yields amedium supply risk score of 45 for copper. The final columnset refers to the SR for the long-term perspective andincorporates only the DTL and CF indicators, weighted equally.With very low values for both CF and DTL, the resulting SRLvalues for copper are also very low.Arsenic presents a different picture. Almost all of its
indicators are high to very high, giving arsenic very high SR.Selenium and silver are nearly as high. Gold is lowest. The long-term rankings show greater variability than the medium-termrankingssome quite high (arsenic, selenium, and silver),some quite low (gold and copper).The environmental implications evaluations appear in Figure
1B; as with SR, they are independent of the organizational level.They range from very low (selenium) to very high (gold).Vulnerability to supply restriction at the corporate level is
shown in Figure 1C. Because Solar Future, Inc. does notemploy silver, gold, or arsenic in its products, those elementsdo not appear. Under the current set of assumptions regardingSolar Future, Inc., copper, selenium, and tellurium have nearlyidentical VSR scores. The indicators contributing to theseoverall rankings are quite different, however. Copper is quitehigh for RI and SP but moderate to low for all other indicators,while tellurium is quite high for CS and SA and low for all otherindicators. Solar Future, Inc.’s AI is assumed to be constantacross the elements.At the national (United States) level (Figure 1D), the VSR
results range from 37 (tellurium) to 54 (copper). Theindicators contributing to these overall rankings are also quitedifferent. The value of NE for copper is quite high but low tovery low for the other elements, for example, while IR is muchhigher for arsenic than for the others.At the global level (Figure 1E), VSR values are moderately
high for copper (53) and gold (54), lower for selenium (36),and lowest for tellurium (26). The results reflect wide
Environmental Science & Technology Article
dx.doi.org/10.1021/es203535w | Environ. Sci. Technol. XXXX, XXX, XXX−XXXE

variability in the evaluations for the four indictors that comprisethe global VSR evaluation.Figure 1 demonstrates an important aspect of criticality
evaluationthat individual metrics can indicate a high level ofcriticality (as in the CF rating for Te) even as the overallcomponent evaluation (as in the SR ratings for Te) ismoderate. This circumstance emphasizes the importance ofconsidering the full range of factors in assessing criticality ratherthan one or a small number of indicators.The results of Figure 1 are plotted in criticality space in
Figure 2. At the corporate level (Figure 2A), no significantseparation occurs for the three elements. The Monte Carlosimulation-derived uncertainty cloud indicates a greater degreeof uncertainty for VSR than for SR. Elemental distinctions aremuch greater at the national level (Figure 2B), with gold clearlyin a different part of criticality space than arsenic or selenium.Here the arsenic uncertainty cloud is relatively symmetric,those for copper and gold showed greater uncertainty in EI, andtellurium and selenium continue their higher VSR uncertainty.On the global level (Figure 2C), distinctions are again clear,with selenium and tellurium positioned in close proximity dueto similar scores for all three axes and gold and copperseparated from the other elements due to their low supply risk.In most cases, the uncertainty clouds are larger than atcorporate or national levels and show considerable diversity.A measure of overall criticality, as described by Graedel et
al.,8 may be derived by calculating the “criticality vectormagnitude” ∥C∥ as follows:
|| || = + +C
SR EI VSR3
2 2 2
(1)
Unequal weighting of the criticality vector magnitudecomponents, rather than of some of their aggregated metrics,is an option for individual users, but we regard doing so asexcessively arbitrary and do not advocate it.The results are given in Table 1. By this measure, on a global
basis, the criticality of arsenic is highest, followed by gold andsilver. Nationally, gold and arsenic are the highest and telluriumis the lowest. At the corporate level, the criticality of the threeelements is fairly even, with selenium somewhat higher thantellurium and copper.To demonstrate the differences produced by alternative
weighting, which users may choose to do, we have recalculatedcriticality for Solar Future, Inc. Because the metals on whichSolar Future’s products are based largely come from countrieswithout significant political or social issues, the GTEcomponent for SR was weighted at 2/3, and S&R and GPwere weighted at 1/6 each. For VSR, Solar Future decided toinclude in its assessment only those metrics about which it wasparticularly concernedthe importance of specific metals tocorporate strategy (CS) and the supply risk of possiblesubstitutes (SA), so CS and SA were the only metricsconsidered and were weighted equally. No alternate weightingscheme was employed for EI. The result is that copper’s SRdecreases from 52 to 45 and its VSR decreases from 60 to 29.Selenium’s SR increases from 69 to 80, but its VSR decreasesfrom 62 to 43. Tellurium’s SR remains about the same,decreasing slightly from 58 to 54, but its VSR increases from 61to 84. These changes cause significant movement for theseelements in criticality space, as shown in Figure 3. Theuncertainty cloud differences are large and clearly visible. Theeffect of the alternative weighting on the criticality vector
Figure 2. Locations of the geological copper family of elements incriticality space: (a) corporate level, for Solar Future, Inc., a putativecorporation whose principal products are CIGS and CdTe solar cells(2008 epoch), (b) national level, for the United States (2008 epoch),and (c) global level (2008 epoch). The highest level of criticality is at100, 100, 100 (back right top).
Environmental Science & Technology Article
dx.doi.org/10.1021/es203535w | Environ. Sci. Technol. XXXX, XXX, XXX−XXXF

magnitudes (Table 1), is modest with copper decreasing from47 to 32, selenium decreasing slightly from 54 to 52, andtellurium increasing from 49 to 58.In very recent years, a number of organizations have made
determinations of the “criticality” of some members of thegeological copper family. We summarize the results in Table 2;they reflect the assessment diversity noted in a recent review.7
The IW study4 singles out selenium as “high risk” and copper,silver, and gold as “medium risk”. The Oakdene Hollins study6
identifies gold and silver as among the seven elementsdesignated as “insecure”. Our evaluation distinguishes criticalityat different organizational levels. We regard tellurium as havingamong the lowest criticality at the global level, and for thespecific corporation we have addressed with alternativeweighting, tellurium is the highest of the three elements thecorporation uses. At the global level, arsenic is surely of moreconcern than silver or gold, by our methodology, while copperand tellurium appear to be of less concern. Given the expectedcontinued decline of arsenic use, however, we expect a similardecline in its criticality.A particular feature of these results is the calculation and
display of Monte Carlo simulation-derived uncertainty cloudsfor the three-dimensional aggregate evaluations. The relativemagnitudes and shapes of the clouds add considerable
Table 1. Criticality Vector Magnitudes for the Geological Copper Family
Figure 3. Locations of the relevant geological copper family elementsin criticality space for Solar Future, Inc. if the GTE component isweighted at 2/3 of the overall supply risk score, with the remainingcomponents weighted at 1/6 each. For vulnerability to supplyrestriction, CS and SA indicators are the only indicators consideredand are weighted equally. The environmental implications axis scoresare unchanged.
Table 2. Criticality Designations in Seven Selected Studiesa
element EC study2 IDA study3 IW study4 NEDO study5 NRC study1 Oakdene Hollins study6 South Korea approach11
Cu not critical no shortfalls medium risk not critical not insecureAs not insecureSe high risk not critical not insecure not criticalAg not critical no shortfalls medium risk insecureTe not critical no shortfalls not critical not criticalAu medium risk insecure
aAdapted from ref 7. Copyright 2011 American Chemical Society.
Environmental Science & Technology Article
dx.doi.org/10.1021/es203535w | Environ. Sci. Technol. XXXX, XXX, XXX−XXXG

perspective to the results, providing an easy to comprehendpicture of the degree of confidence that should be placed in thecriticality results.The parameters used in these criticality evaluations are, of
course, not static. Because they will evolve over time, there isutility both for a static assessment, as done here for year 2008,and for a dynamic assessment that looks into the future. Anextension of the present work, now in progress, will providecriticality estimates for several different development scenariosfor the period 2010−2050.Overall, we regard this work as justifying our methodology of
criticality assessment. It incorporates essentially all factorsthought to influence metal criticality, including geological,technological, social, regulatory, and geopolitical metrics. Whilecomplex, it is wholly transparent, and the indicators can beweighted as deemed appropriate by the users. It explicitlyderives results at different organizational levels and calculatesand displays the estimated uncertainty for each of the threeaggregated axis values.A final word is appropriate: there is no such thing as “critical”
or “not critical”, and we have avoided making such a distinction.There are, however, metals that are more critical than othersunder some conditions, for some users, and for some timescales. This immediately suggests that policy options should beexplored when high-criticality situations are encountered. Forexample, a corporation could choose to invest directly in a minerather than to purchase metal from the global market, or todevelop product designs that avoid metals with high supply riskor high environmental implications. Countries could take stepsto ensure raw material supplies for their important industrysectors, as is happening at present in countries around theworld (generally without the detailed evaluation information ofwhich this paper is an example). As always, knowledge is power,and the additional knowledge provided by criticality assess-ments is likely to enable better decisions to be made in theinterest of corporations, countries, and the planet. This sort ofthinking and action will be increasingly important as ever-increasing rates of material use force all of us to think moredeeply about issues of resource sustainability.
■ ASSOCIATED CONTENT
*S Supporting InformationDetailed accounting of the data used in analyzing criticality,detailed results for each indicator and component, and detailedresults for the uncertainty analysis. This material is availablefree of charge via the Internet at http://pubs.acs.org.
■ AUTHOR INFORMATION
Corresponding Author*Phone: (203) 228-2902; fax: (203) 432-5556; e-mail:[email protected].
■ ACKNOWLEDGMENTS
We thank A-1 Specialized Services & Supplies, General Electric,Renault, and Shell Global Solutions for support and input andthe National Science Foundation for support. We also thank B.K. Reck for comments on this paper, M. Eckelman for helpfulguidance and input, and three anonymous reviewers for theirconstructive comments.
■ REFERENCES(1) National Research Council. Minerals, Critical Minerals, and theU.S. Economy; National Academies Press: Washington, DC, 2008.(2) European Commission (EC). Critical Raw Materials for the EU.Report of the Ad-Hoc Working Group on Defining Critical Raw Materials;EC: Brussels, Belgium, 2010.(3) Thomason, J. S.; Atwell, R. J.; Bajraktari, Y.; Bell, J. P.; Barnett, D.S.; Karvonides, N. S. J.; Niles, M. F.; Schwartz, E. L. From NationalDefense Stockpile (NDS) to Strategic Materials Security Programme(SMSP): Evidence and Analytic Support; Institute for Defense Analysis(IDA): Alexandria, VA, 2008; Vol. I.(4) Pfleger, P.; Lichtblau, K.; Bardt, H.; Reller, A. RohstoffsituationBayern: Keine Zukunft ohne Rohstoffe. Strategien und Handlungsoptionen;Vereinigung der Bayerischen Wirtschaft: Munich, Germany, 2009.(5) New Energy and Industrial Technology Development Organ-ization (NEDO). Trend Report of Development in Materials forSubstitution of Scarce Metals; Report No. 08007835-0 08007838-0 (inJapanese); Shinko Research Co. Ltd. (Mitsubishi UFJ Research andConsulting), NEDO: Tokyo, 2009.(6) Morley, N.; Eatherley, D. Material Security. Ensuring ResourceAvailability to the UK Economy; Oakdene Hollins, C-Tech InnovationLtd.: Chester, U.K., 2008.(7) Erdmann, L. K.; Graedel, T. E. The criticality of non-fuelminerals: A review of major approaches and analyses. Environ. Sci.Technol. 2011, 45 (18), 7620−7630.(8) Graedel, T. E.; Barr, R.; Chandler, C.; Chase, T.; Choi, J.;Christoffersen, L.; Friedlander, E.; Henly, C.; Nassar, N. T.;Schechner, D.; Warren, S.; Yang, M.; Zhu, C. Methodology of metalcriticality determination. Environ. Sci. Technol. 2012, DOI: 10.1021/es203534z.(9) Hischier, R.; Weidema, B.; Althaus, H.-J.; Bauer, C.; Doka, G.;Dones, R.; Frischknecht, R.; Hellweg, S.; Humbert, S.; Jungbluth, N.;Kollner, T.; Loerincik, Y.; Margni, M.; Nemecek, T. Implementation ofLife Cycle Impact Assessment Methods; ecoinvent Report No. 3, version2.2; Swiss Centre for Life Cycle Inventories: Dubendorf, Switzerland,2010.(10) Goedkoop, M.; Heijungs, R.; Huijbregts, M.; De Schryver, A.;Struijs, J.; van Zelm, R. ReCiPe 2008. Main Report, Part 1:Characterization, 1st ed.; Ministerie van Volkshuisvesting, RuimtelijkeOrdening en Milieubeheer (VROM): The Hague, The Netherlands,2009.(11) Bae, J. C. Strategies and perspectives for securing rare metals inKorea. Critical Elements for New Energy Technologies, An MIT EnergyInitiative Workshop Report, April 29, 2010; Massuchusetts Institute ofTechnology: Cambridge, MA, 2010.
Environmental Science & Technology Article
dx.doi.org/10.1021/es203535w | Environ. Sci. Technol. XXXX, XXX, XXX−XXXH