Critical Investments for a Healthier Kentucky · Critical Investments for a Healthier Kentucky By...
14
June 3, 2019 Critical Investments for a Healthier Kentucky By Ashley Spalding Too many Kentuckians face circumstances that make them vulnerable to poor health. Problems like unsafe drinking water, jobs that pay little yet take a big toll, sparse access to exercise opportunities, food insecurity and air pollution impact many of us. Smart policy choices, however, can remove barriers to good health, allowing Kentuckians to thrive. The General Assembly taking up the state’s two-year budget in January 2020 will be a key opportunity to recommit to state tax and budget choices that build the foundation for our communities’ well-being. Investments in clean water, safe and efficient transportation systems and good schools, for example, are building blocks of healthy and prosperous communities. While greatly improved access to health care through policies like Medicaid expansion are crucial and need protecting, access cannot alone accomplish the heavy lift of creating a state where all Kentuckians – no matter where they live, the color of their skin or how much money they make – can lead a healthy life. Research increasingly shows that in order to reach this goal, we need to address a range of underlying social, economic, and environmental factors in addition to clinical care. The Kentucky state budget, which lawmakers write every two years, is a key tool for addressing these “social determinants of health.” Good budget choices can improve the health of all Kentuckians and remove barriers to good health related to race, income and where one lives. Strategies range from providing full-day preschool for all Kentucky children to ensuring a strong infrastructure that provides clean water and public transit to get to good jobs or the doctor's office. We also need to ask Kentuckians to chip in towards these investments based on their ability to pay, and end the bad habit of diverting state resources to special interests in the form of tax breaks. Though this report focuses on the budget and state tax system as potential tools to support Kentuckians’ well-being, all policy choices shape the options individuals have and to what extent they can make health- promoting decisions for themselves and their families. Unfortunately, Kentucky’s tax and budget decisions in recent history have hurt rather than helped create conditions where people across the commonwealth can become healthier. And yet there are choices lawmakers can make in 2020 to re-prioritize Kentuckians’ health. Access to Health Care Just One Factor in Social Determinants of Health The increasingly influential concept of “social determinants of health” refers to the conditions in which people are born, grow, live, work and age — factors such as socioeconomic status, education, neighborhood location and physical environment, employment and social support networks, as well as access to health care. 1 These factors ultimately have a profound impact on the quality of our lives as well as how long we live. According to the widely recognized and validated model from the University of Wisconsin’s Population Health Good budget choices can improve the health of all Kentuckians and remove barriers to good health related to race, income and where one lives. Strategies range from providing full-day preschool for all Kentucky children to ensuring a strong infrastructure that provides clean water and public transit to get to good jobs or the doctor's office.
Transcript of Critical Investments for a Healthier Kentucky · Critical Investments for a Healthier Kentucky By...
June 3, 2019
Critical Investments for a Healthier Kentucky
By Ashley Spalding Too many Kentuckians face circumstances that make them vulnerable to poor health. Problems like unsafe drinking water, jobs that pay little yet take a big toll, sparse access to exercise opportunities, food insecurity and air pollution impact many of us. Smart policy choices, however, can remove barriers to good health, allowing Kentuckians to thrive. The General Assembly taking up the state’s two-year budget in January 2020 will be a key opportunity to recommit to state tax and budget choices that build the foundation for our communities’ well-being. Investments in clean water, safe and efficient transportation systems and good schools, for example, are building blocks of healthy and prosperous communities. While greatly improved access to health care through policies like Medicaid expansion are crucial and need protecting, access cannot alone accomplish the heavy lift of creating a state where all Kentuckians – no matter where they live, the color of their skin or how much money they make – can lead a healthy life. Research increasingly shows that in order to reach this goal, we need to address a range of underlying social, economic, and environmental factors in addition to clinical care. The Kentucky state budget, which lawmakers write every two years, is a key tool for addressing these “social determinants of health.” Good budget choices can improve the health of all Kentuckians and remove barriers to good health related to race, income and where one lives. Strategies range from providing full-day preschool for all Kentucky children to ensuring a strong infrastructure that provides clean water and public transit to get to good jobs or the doctor's office. We also need to ask Kentuckians to chip in towards these investments based on their ability to pay, and end the bad habit of diverting state resources to special interests in the form of tax breaks. Though this report focuses on the budget and state tax system as potential tools to support Kentuckians’ well-being, all policy choices shape the options individuals have and to what extent they can make health-promoting decisions for themselves and their families. Unfortunately, Kentucky’s tax and budget decisions in recent history have hurt rather than helped create conditions where people across the commonwealth can become healthier. And yet there are choices lawmakers can make in 2020 to re-prioritize Kentuckians’ health. Access to Health Care Just One Factor in Social Determinants of Health The increasingly influential concept of “social determinants of health” refers to the conditions in which people are born, grow, live, work and age — factors such as socioeconomic status, education, neighborhood location and physical environment, employment and social support networks, as well as access to health
care.1 These factors ultimately have a profound impact
on the quality of our lives as well as how long we live. According to the widely recognized and validated model from the University of Wisconsin’s Population Health
Good budget choices can improve the health of all Kentuckians and remove barriers to good health related to race, income and where one lives. Strategies range from providing full-day preschool for all Kentucky children to ensuring a
strong infrastructure that provides clean water and public transit to get to good
jobs or the doctor's office.
2
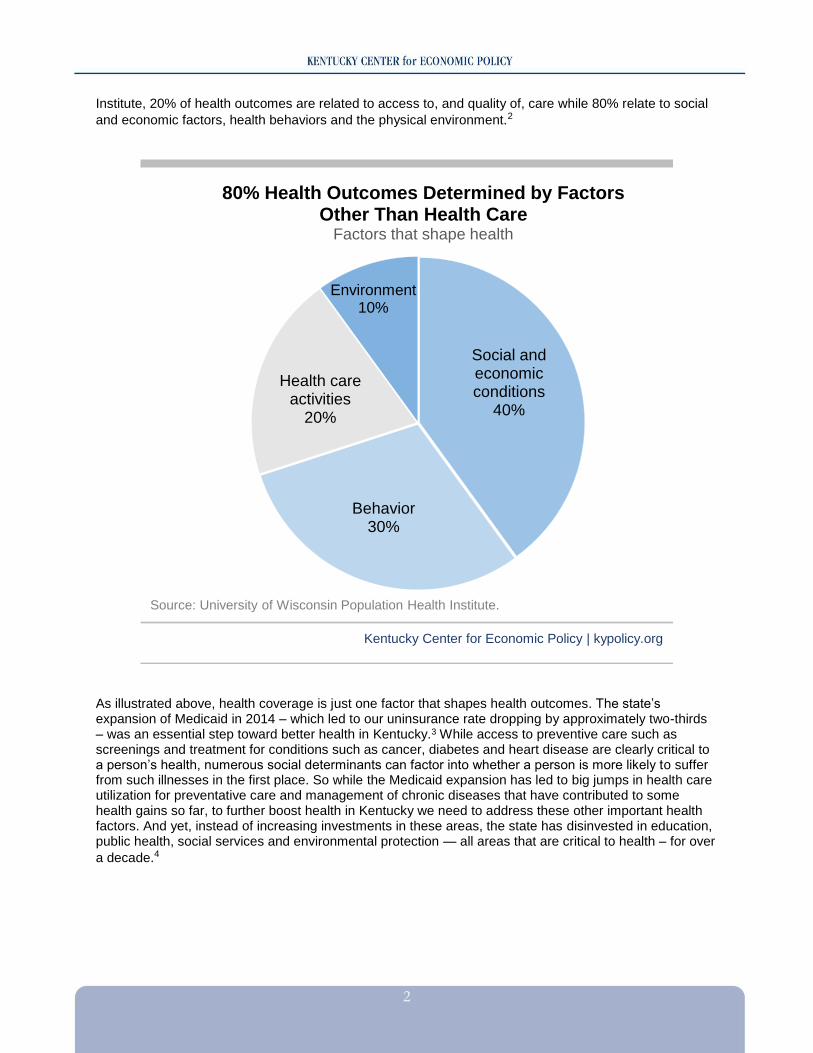
Institute, 20% of health outcomes are related to access to, and quality of, care while 80% relate to social
and economic factors, health behaviors and the physical environment.2
As illustrated above, health coverage is just one factor that shapes health outcomes. The state’s expansion of Medicaid in 2014 – which led to our uninsurance rate dropping by approximately two-thirds – was an essential step toward better health in Kentucky.3 While access to preventive care such as screenings and treatment for conditions such as cancer, diabetes and heart disease are clearly critical to a person’s health, numerous social determinants can factor into whether a person is more likely to suffer from such illnesses in the first place. So while the Medicaid expansion has led to big jumps in health care utilization for preventative care and management of chronic diseases that have contributed to some health gains so far, to further boost health in Kentucky we need to address these other important health factors. And yet, instead of increasing investments in these areas, the state has disinvested in education, public health, social services and environmental protection — all areas that are critical to health – for over
a decade.4
Social and economic conditions
40%
Behavior30%
Health care activities
20%
Environment10%
80% Health Outcomes Determined by Factors Other Than Health Care
Factors that shape health
Kentucky Center for Economic Policy | kypolicy.org
Source: University of Wisconsin Population Health Institute.
3
We Need a Healthier Commonwealth We have a long way to go to achieve good health in Kentucky. In 2018, the state ranked 45th in the
nation for overall health outcomes.5 Specific rankings
include:
Worst, out of all 50 states, for cancer deaths.
7th worst for cardiovascular death.
7th worst for diabetes.
3rd worst for frequent mental distress.
2nd worst for frequent physical distress.
4th worst for premature death.
15th worst for infant mortality.
Underlying these alarmingly poor health outcomes are factors such as our high poverty and child poverty rates, racial inequality and deep urban/rural divide. Additionally, Kentucky’s rates of smoking, air pollution and percentage of the workforce that drives alone to work are higher than the national average, while access to exercise opportunities and healthy food are lower than the national average.6 Some Kentuckians face more barriers to health than others — including people with low incomes, many
of whom live in rural parts of the state including eastern Kentucky.7 While 17.2% of Kentuckians lived
below the poverty line in 2017, the poverty rate in the 5th Congressional District of eastern Kentucky was 29.1%.8 Among other health disparities, the Appalachian portion of Kentucky has notably higher rates of mortality from heart disease, cancer, chronic obstructive pulmonary disease (COPD), stroke and diabetes than the non-Appalachian portion of the state.9 Income is a key social determinant of health as poverty can dramatically limit opportunities for quality housing, safe neighborhoods, healthy food and quality education. Individuals with low incomes are less likely to have health insurance and more likely to live in communities with a high density of tobacco retailers and fast food restaurants, a low density of health care providers, poor access to fresh foods and a built environment that is not conducive to physical activity. It is also common for low-income families to periodically go without safe housing, heat, water and electricity. And chronic stressors, including financial hardship, are linked to an increased risk of chronic disease. The negative health effects of poverty start early in a child’s life and continue throughout adulthood.10 Kentuckians of color face additional structural barriers to health Historic structural racism – including the legacies of slavery, redlining, segregation, and regressive tax policies as well as the discriminatory practices that stem from systemic racism – have prevented individuals and families of color from accumulating human and financial capital in Kentucky. These structural barriers in turn worsen wealth inequality, proximity to toxic chemicals, the quality of public education, the availability of economic opportunities and the greater likelihood of involvement in the criminal justice system for reasons such as neighborhoods of color generally being more heavily
policed.11
Black Kentuckians die more than two years earlier than white Kentuckians, and black babies are nearly twice as likely as white babies to be born with low birthweight — and twice as likely to die before their first birthday.12 The life expectancy for residents of some neighborhoods in the predominately African American west end of Louisville is 12.6 years lower than for those living in more affluent and White east end neighborhoods.13 And just over 30% of west Louisville residents live with a symptom or illness caused by outdoor air pollution compared to 16% in east Louisville.14 County-level differences in health help map barriers to health
Income is a key social determinant of health as poverty can dramatically limit opportunities for quality housing, safe
neighborhoods, healthy food and quality education. Individuals with low incomes are less likely to have health insurance
and more likely to live in communities with a high density of tobacco retailers and fast food restaurants, a low density of health
care providers, poor access to fresh foods and a built environment that is not
conducive to physical activity.
4
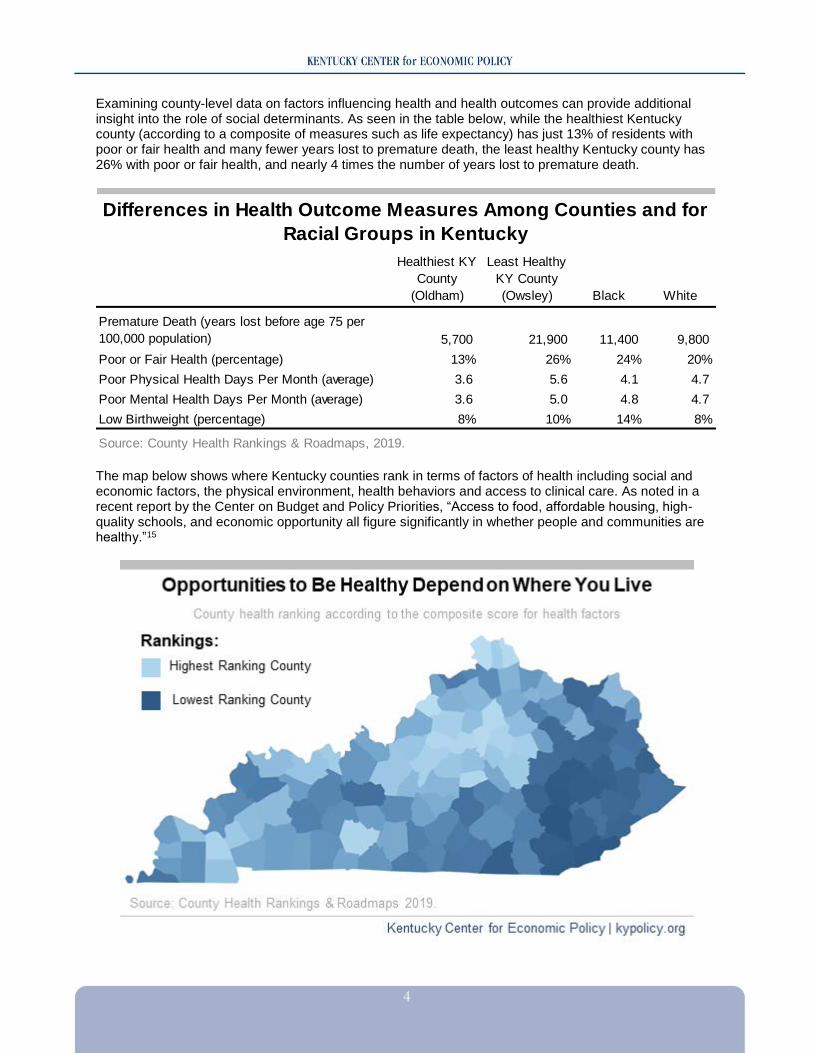
Examining county-level data on factors influencing health and health outcomes can provide additional insight into the role of social determinants. As seen in the table below, while the healthiest Kentucky county (according to a composite of measures such as life expectancy) has just 13% of residents with poor or fair health and many fewer years lost to premature death, the least healthy Kentucky county has 26% with poor or fair health, and nearly 4 times the number of years lost to premature death.
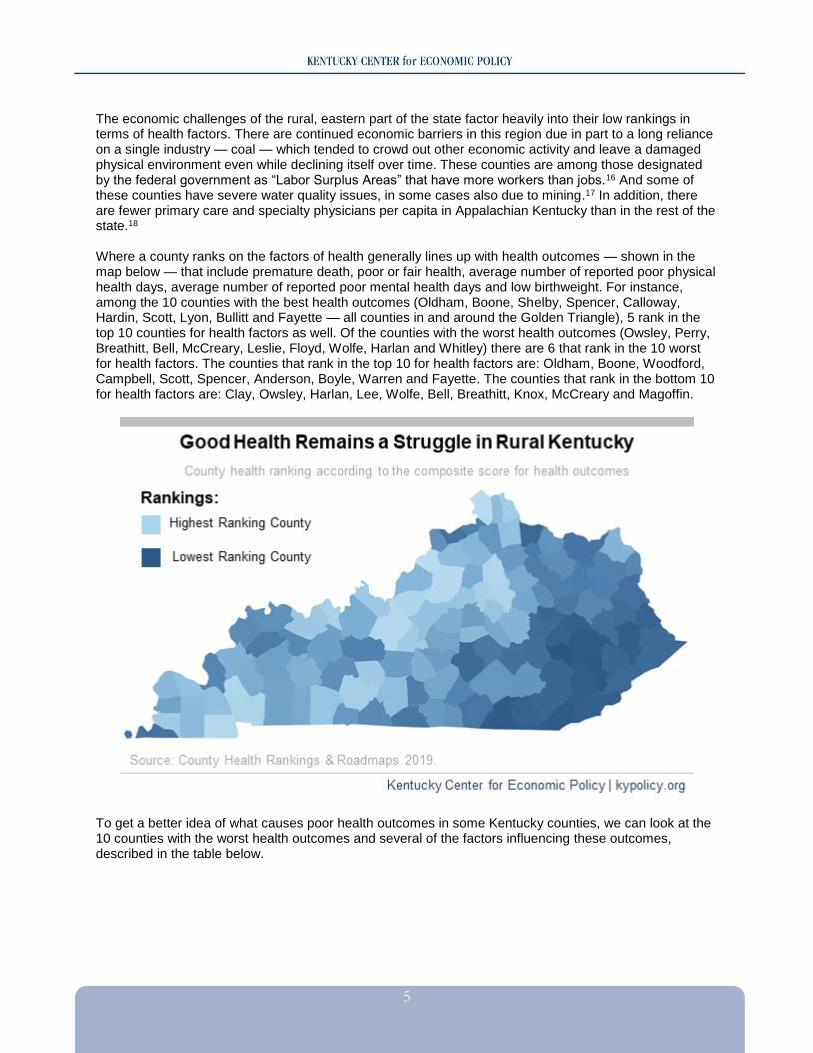
The map below shows where Kentucky counties rank in terms of factors of health including social and economic factors, the physical environment, health behaviors and access to clinical care. As noted in a recent report by the Center on Budget and Policy Priorities, “Access to food, affordable housing, high-quality schools, and economic opportunity all figure significantly in whether people and communities are healthy.”15
Healthiest KY
County
(Oldham)
Least Healthy
KY County
(Owsley) Black White
Premature Death (years lost before age 75 per
100,000 population) 5,700 21,900 11,400 9,800
Poor or Fair Health (percentage) 13% 26% 24% 20%
Poor Physical Health Days Per Month (average) 3.6 5.6 4.1 4.7
Poor Mental Health Days Per Month (average) 3.6 5.0 4.8 4.7
Low Birthweight (percentage) 8% 10% 14% 8%
Source: County Health Rankings & Roadmaps, 2019.
Differences in Health Outcome Measures Among Counties and for
Racial Groups in Kentucky
5
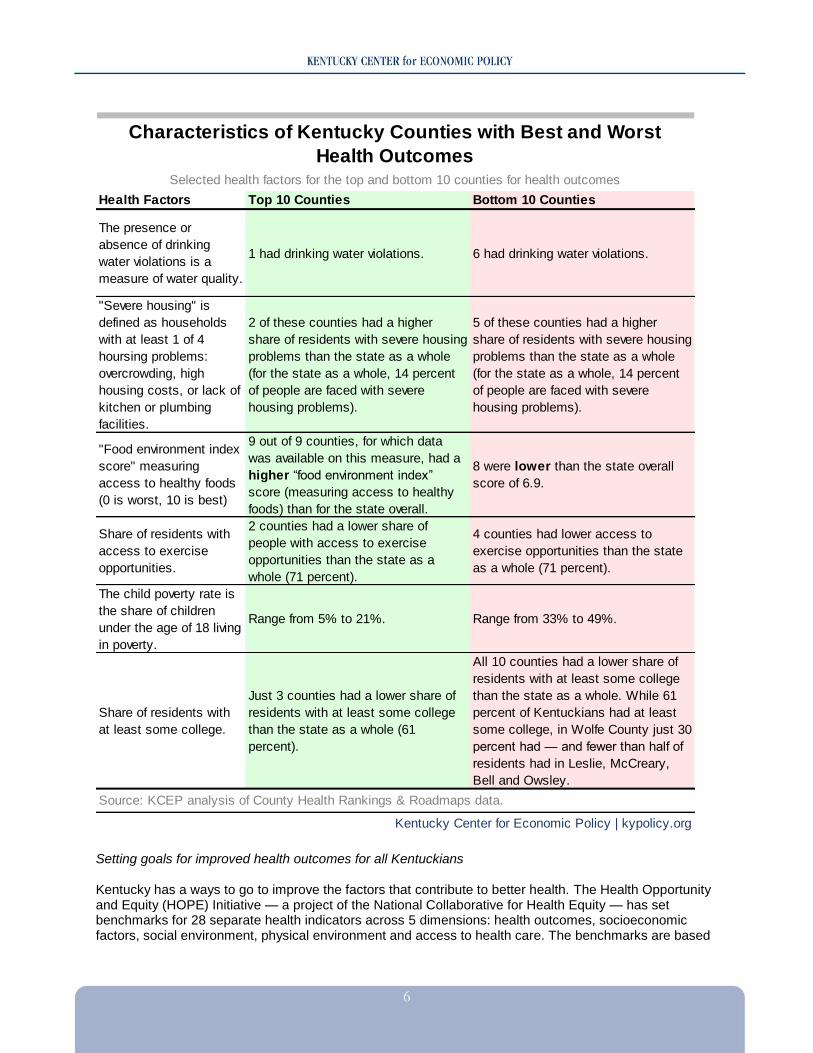
The economic challenges of the rural, eastern part of the state factor heavily into their low rankings in terms of health factors. There are continued economic barriers in this region due in part to a long reliance on a single industry — coal — which tended to crowd out other economic activity and leave a damaged physical environment even while declining itself over time. These counties are among those designated by the federal government as “Labor Surplus Areas” that have more workers than jobs.16 And some of these counties have severe water quality issues, in some cases also due to mining.17 In addition, there are fewer primary care and specialty physicians per capita in Appalachian Kentucky than in the rest of the state.18 Where a county ranks on the factors of health generally lines up with health outcomes — shown in the map below — that include premature death, poor or fair health, average number of reported poor physical health days, average number of reported poor mental health days and low birthweight. For instance, among the 10 counties with the best health outcomes (Oldham, Boone, Shelby, Spencer, Calloway, Hardin, Scott, Lyon, Bullitt and Fayette — all counties in and around the Golden Triangle), 5 rank in the top 10 counties for health factors as well. Of the counties with the worst health outcomes (Owsley, Perry, Breathitt, Bell, McCreary, Leslie, Floyd, Wolfe, Harlan and Whitley) there are 6 that rank in the 10 worst for health factors. The counties that rank in the top 10 for health factors are: Oldham, Boone, Woodford, Campbell, Scott, Spencer, Anderson, Boyle, Warren and Fayette. The counties that rank in the bottom 10 for health factors are: Clay, Owsley, Harlan, Lee, Wolfe, Bell, Breathitt, Knox, McCreary and Magoffin.
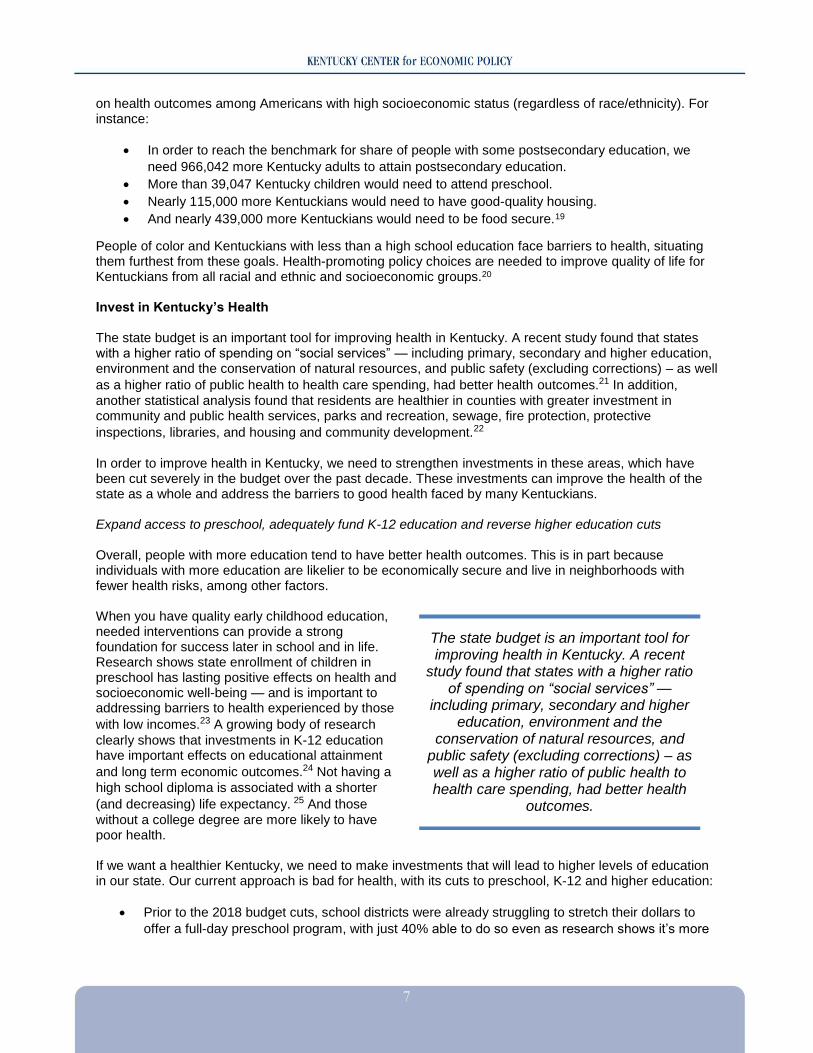
To get a better idea of what causes poor health outcomes in some Kentucky counties, we can look at the 10 counties with the worst health outcomes and several of the factors influencing these outcomes, described in the table below.
6
Setting goals for improved health outcomes for all Kentuckians Kentucky has a ways to go to improve the factors that contribute to better health. The Health Opportunity and Equity (HOPE) Initiative — a project of the National Collaborative for Health Equity — has set benchmarks for 28 separate health indicators across 5 dimensions: health outcomes, socioeconomic factors, social environment, physical environment and access to health care. The benchmarks are based
Health Factors Top 10 Counties Bottom 10 Counties
The presence or
absence of drinking
water violations is a
measure of water quality.
1 had drinking water violations. 6 had drinking water violations.
"Severe housing" is
defined as households
with at least 1 of 4
hoursing problems:
overcrowding, high
housing costs, or lack of
kitchen or plumbing
facilities.
2 of these counties had a higher
share of residents with severe housing
problems than the state as a whole
(for the state as a whole, 14 percent
of people are faced with severe
housing problems).
5 of these counties had a higher
share of residents with severe housing
problems than the state as a whole
(for the state as a whole, 14 percent
of people are faced with severe
housing problems).
"Food environment index
score" measuring
access to healthy foods
(0 is worst, 10 is best)
9 out of 9 counties, for which data
was available on this measure, had a
higher “food environment index”
score (measuring access to healthy
foods) than for the state overall.
8 were lower than the state overall
score of 6.9.
Share of residents with
access to exercise
opportunities.
2 counties had a lower share of
people with access to exercise
opportunities than the state as a
whole (71 percent).
4 counties had lower access to
exercise opportunities than the state
as a whole (71 percent).
The child poverty rate is
the share of children
under the age of 18 living
in poverty.
Range from 5% to 21%. Range from 33% to 49%.
Share of residents with
at least some college.
Just 3 counties had a lower share of
residents with at least some college
than the state as a whole (61
percent).
All 10 counties had a lower share of
residents with at least some college
than the state as a whole. While 61
percent of Kentuckians had at least
some college, in Wolfe County just 30
percent had — and fewer than half of
residents had in Leslie, McCreary,
Bell and Owsley.
Source: KCEP analysis of County Health Rankings & Roadmaps data.
Kentucky Center for Economic Policy | kypolicy.org
Selected health factors for the top and bottom 10 counties for health outcomes
Characteristics of Kentucky Counties with Best and Worst
Health Outcomes
7
on health outcomes among Americans with high socioeconomic status (regardless of race/ethnicity). For instance:
In order to reach the benchmark for share of people with some postsecondary education, we
need 966,042 more Kentucky adults to attain postsecondary education.
More than 39,047 Kentucky children would need to attend preschool.
Nearly 115,000 more Kentuckians would need to have good-quality housing.
And nearly 439,000 more Kentuckians would need to be food secure.19
People of color and Kentuckians with less than a high school education face barriers to health, situating them furthest from these goals. Health-promoting policy choices are needed to improve quality of life for Kentuckians from all racial and ethnic and socioeconomic groups.20 Invest in Kentucky’s Health The state budget is an important tool for improving health in Kentucky. A recent study found that states with a higher ratio of spending on “social services” — including primary, secondary and higher education, environment and the conservation of natural resources, and public safety (excluding corrections) – as well
as a higher ratio of public health to health care spending, had better health outcomes.21 In addition,
another statistical analysis found that residents are healthier in counties with greater investment in community and public health services, parks and recreation, sewage, fire protection, protective
inspections, libraries, and housing and community development.22
In order to improve health in Kentucky, we need to strengthen investments in these areas, which have been cut severely in the budget over the past decade. These investments can improve the health of the state as a whole and address the barriers to good health faced by many Kentuckians. Expand access to preschool, adequately fund K-12 education and reverse higher education cuts Overall, people with more education tend to have better health outcomes. This is in part because individuals with more education are likelier to be economically secure and live in neighborhoods with fewer health risks, among other factors. When you have quality early childhood education, needed interventions can provide a strong foundation for success later in school and in life. Research shows state enrollment of children in preschool has lasting positive effects on health and socioeconomic well-being — and is important to addressing barriers to health experienced by those
with low incomes.23 A growing body of research
clearly shows that investments in K-12 education have important effects on educational attainment
and long term economic outcomes.24 Not having a
high school diploma is associated with a shorter
(and decreasing) life expectancy. 25 And those
without a college degree are more likely to have poor health. If we want a healthier Kentucky, we need to make investments that will lead to higher levels of education in our state. Our current approach is bad for health, with its cuts to preschool, K-12 and higher education:
Prior to the 2018 budget cuts, school districts were already struggling to stretch their dollars to
offer a full-day preschool program, with just 40% able to do so even as research shows it’s more
The state budget is an important tool for improving health in Kentucky. A recent
study found that states with a higher ratio of spending on “social services” —
including primary, secondary and higher education, environment and the
conservation of natural resources, and public safety (excluding corrections) – as well as a higher ratio of public health to health care spending, had better health
outcomes.
8
effective for learning than partial-day programs.26 The 2018-2020 state budget made the situation
more dire after it cut preschool by 6.25%.
Core formula funding for Kentucky school districts through the Support Education Excellence in
Kentucky (SEEK) formula has declined by 16% between 2008 and 2020 when the number of
students as well as inflation are taken into account. The decline in total SEEK funding per student
is of particular concern given the formula is designed to increase the equity of funding between
low property wealth school districts and high property wealth school districts. With inadequate
state investment, however, the funding gap between districts with fewer and greater economic
resources has been growing.27
Programs designed to support K-12 students and classrooms, such as Extended School Services
(ESS), have also been cut dramatically. For ESS, state funding has been cut by 39% between
2008 and 2020 in inflation-adjusted terms.28 And while Family Resource and Youth Services
Centers (FRYSCS) — which work to minimize the impacts of hunger and poverty on student
learning — did receive some additional funding in the 2018-2020 budget, FRYSCs funding in
2020 is 15% below 2008 levels once inflation is taken into account.29
State funding for higher education has been cut 35% since 2008, which has led to tuition
increases among other concerning impacts. And state need-based financial aid also continues to
be inadequate. The high costs of college are particularly a barrier to enrollment and degree
completion for students with low incomes and students of color.30
Additional investments in education could make a big impact in the health of the Kentuckians moving forward. These expansions include universal full-day preschool, more adequate core formula funding for K-12 through SEEK and for non-SEEK education programs such as ESS, FRYSCs and state investments
in higher education that make college more affordable.31 The resulting improved economic security would
have important impacts on the health of individuals and their families. Invest in supports that increase economic security
Given the connections between income and health, investments that promote economic security are also good for health across the commonwealth:
Kentucky’s Child Care Assistance Program (CCAP) is an important support for Kentucky families
with low incomes, and should be strengthened. Federal funds were recently awarded to increase
the reimbursement rate to providers, among several other improvements to the state’s CCAP
program.32 However, the reimbursement rate is still low, particularly to enable a center to provide
a high-quality environment for children, and many providers cannot afford to accept the
assistance — and we see a lack of child care centers in some areas of the state in part as a
result.33 In addition, even the small existing copays can be unaffordable for participants with such
low incomes. In order to be more effective — and support improved health outcomes — Kentucky
should increase provider reimbursement rates, eliminate the family copay for those below the
poverty line and raise the income limit to qualify for CCAP from 160% of the federal poverty level
to 200% so that many more Kentuckians than currently qualify can benefit from this support.34
The state’s Department for Aging and Independent Living, which funds programs like home
delivered meals, helps to improve nutrition and quality of life for Kentuckians with disabilities and
seniors. In order for more Kentuckians to have access to these important services — which have
long waiting lists and were cut yet again in the 2018-2020 budget — the state needs to make
additional investments.35
9
By helping to provide families with a safe, stable, affordable place to live, housing assistance has
a tremendous positive effect on health — but Kentucky does not provide such assistance through
the state budget.36 Individuals who are chronically homeless are more likely to become ill, end up
in the hospital and die at a younger age.37 Even people with a roof over their heads may have to
spend too much of their income on rent and be faced with skipping food or medication in order to
maintain their housing. Both location and conditions of housing may expose people to pollution,
lead and mold, among other unsafe conditions — and can create barriers to accessing
transportation, fresh food and parks.38 Because federal funding only covers 25% of households
eligible for rental assistance nationally, some states fund their own assistance programs.39 A
state investment like covering the difference between rent and 30% of a household’s income for
those with low incomes (but not already receiving federal housing assistance) would be incredibly
beneficial to the health of many Kentuckians and the state as a whole.40
Fund public health Greater state investment in public health is a key part of improving health in Kentucky, where budget cuts have severely constrained services. One study found that for each 10% increase in local public health spending over a 13 year period, mortality rates fell between 1.1% and 6.9% for preventable causes including infant mortality and deaths due to cardiovascular disease, diabetes and cancer.41 Public health interventions — efforts that are not ordinarily considered “health care” — have been shown to improve health and have significant returns on investment. Interventions such as vaccinations have been found to
save $34 for every $1 spent on them.42 Other health promotion programs such as those focusing on kids
and improvements in the built environment such as building sidewalks and traffic safety have a good return as well. Kentucky’s Department for Public Health works to improve the health and safety of Kentuckians through prevention (i.e., immunizations and home visitations for new or expectant parents), health promotion such as smoking cessation, health protection such as environmental and food safety inspections, and public
health and disaster preparedness.43 However, state budget cuts have limited these efforts, and federal
funding has not increased in over a decade.44 Kentucky spends on average just $85 per person on public
health, ranking 27th in the nation for funding in this area.45 And funding challenges for public health
departments are worsening as pension payments are scheduled to increase dramatically in July.46 The combination of budget cuts and higher pension contributions has already led to a decline from 3,449 local health department employees in 2012 to just 2,474 in 2018.47 In order to manage the new funding challenges, the state is planning a concerning overhaul of the Department for Public Health that includes 700 more layoffs.48 In the midst of these funding, service provision and staffing challenges, Kentucky continues to struggle with the opioid epidemic, which has driven up overdose deaths as well as Hepatitis C and HIV infection
rates in the state.49 Needle exchanges, which are currently available in 47 Kentucky counties (though in
just half of the 54 at high risk of HIV and Hepatitis C, and many open just once a week for a few hours), can help curb the spread of these diseases in a cost-effective way, but need more funding to expand services. In addition, the state has recently been grappling with outbreaks of Hepatitis A that could be
better managed with more adequate funding.50 It is concerning but not surprising then that the state
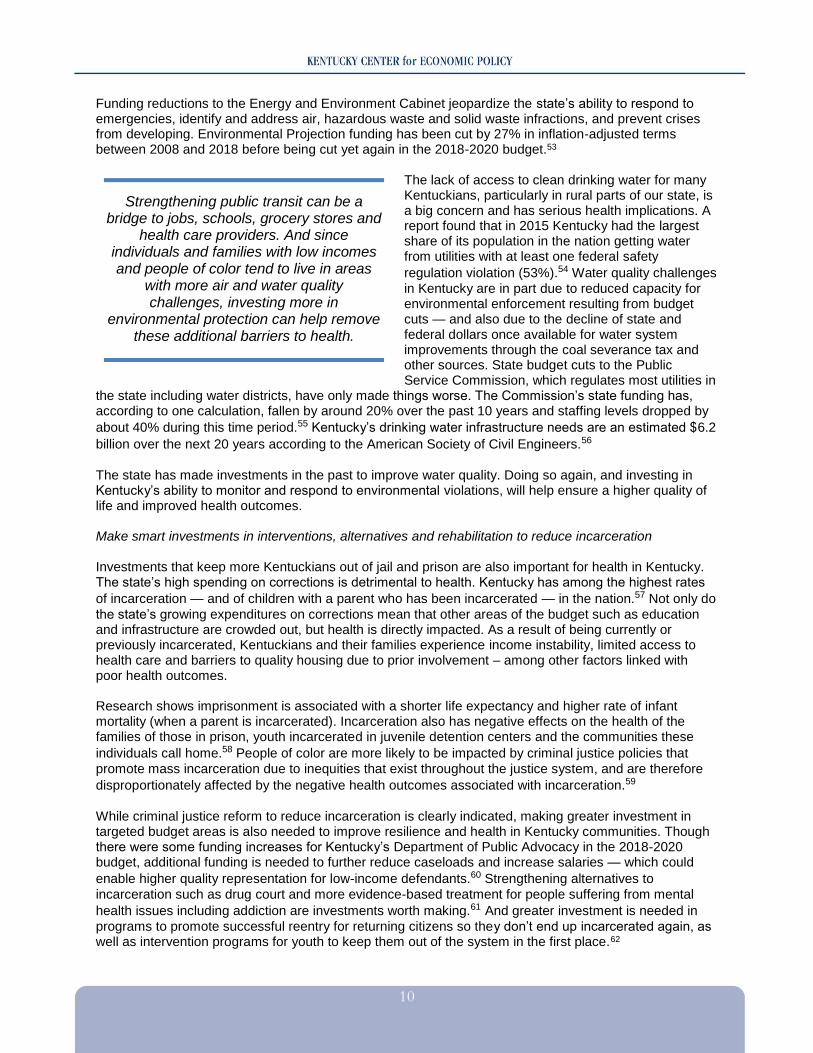
scores low on national measures of public health emergency preparedness.51 Invest in infrastructure and the environment Investments in infrastructure — including transportation, environmental protection and drinking water — are foundational to good health across the commonwealth. For instance, strengthening public transit can be a bridge to jobs, schools, grocery stores and health care providers. And since individuals and families with low incomes and people of color tend to live in areas with more air and water quality challenges,
investing more in environmental protection can help remove these additional barriers to health.52
10
Funding reductions to the Energy and Environment Cabinet jeopardize the state’s ability to respond to emergencies, identify and address air, hazardous waste and solid waste infractions, and prevent crises from developing. Environmental Projection funding has been cut by 27% in inflation-adjusted terms between 2008 and 2018 before being cut yet again in the 2018-2020 budget.53
The lack of access to clean drinking water for many Kentuckians, particularly in rural parts of our state, is a big concern and has serious health implications. A report found that in 2015 Kentucky had the largest share of its population in the nation getting water from utilities with at least one federal safety
regulation violation (53%).54 Water quality challenges
in Kentucky are in part due to reduced capacity for environmental enforcement resulting from budget cuts — and also due to the decline of state and federal dollars once available for water system improvements through the coal severance tax and other sources. State budget cuts to the Public Service Commission, which regulates most utilities in
the state including water districts, have only made things worse. The Commission’s state funding has, according to one calculation, fallen by around 20% over the past 10 years and staffing levels dropped by
about 40% during this time period.55 Kentucky’s drinking water infrastructure needs are an estimated $6.2
billion over the next 20 years according to the American Society of Civil Engineers.56
The state has made investments in the past to improve water quality. Doing so again, and investing in Kentucky’s ability to monitor and respond to environmental violations, will help ensure a higher quality of life and improved health outcomes. Make smart investments in interventions, alternatives and rehabilitation to reduce incarceration Investments that keep more Kentuckians out of jail and prison are also important for health in Kentucky. The state’s high spending on corrections is detrimental to health. Kentucky has among the highest rates
of incarceration — and of children with a parent who has been incarcerated — in the nation.57 Not only do
the state’s growing expenditures on corrections mean that other areas of the budget such as education and infrastructure are crowded out, but health is directly impacted. As a result of being currently or previously incarcerated, Kentuckians and their families experience income instability, limited access to health care and barriers to quality housing due to prior involvement – among other factors linked with poor health outcomes. Research shows imprisonment is associated with a shorter life expectancy and higher rate of infant mortality (when a parent is incarcerated). Incarceration also has negative effects on the health of the families of those in prison, youth incarcerated in juvenile detention centers and the communities these
individuals call home.58 People of color are more likely to be impacted by criminal justice policies that
promote mass incarceration due to inequities that exist throughout the justice system, and are therefore
disproportionately affected by the negative health outcomes associated with incarceration.59
While criminal justice reform to reduce incarceration is clearly indicated, making greater investment in targeted budget areas is also needed to improve resilience and health in Kentucky communities. Though there were some funding increases for Kentucky’s Department of Public Advocacy in the 2018-2020 budget, additional funding is needed to further reduce caseloads and increase salaries — which could
enable higher quality representation for low-income defendants.60 Strengthening alternatives to
incarceration such as drug court and more evidence-based treatment for people suffering from mental
health issues including addiction are investments worth making.61 And greater investment is needed in
programs to promote successful reentry for returning citizens so they don’t end up incarcerated again, as well as intervention programs for youth to keep them out of the system in the first place.62
Strengthening public transit can be a bridge to jobs, schools, grocery stores and
health care providers. And since individuals and families with low incomes and people of color tend to live in areas
with more air and water quality challenges, investing more in
environmental protection can help remove these additional barriers to health.
11
Cleaning Up State Tax Code Will Create a Healthier State In order to make investments that create opportunity for Kentuckians to be healthy, the state needs to make changes to its tax system: We need to raise additional revenue and base our tax system more on ability to pay. Our state’s tax code has long been inadequate and “upside-down,” with Kentuckians who have the lowest incomes paying the greatest share of what they earn toward state taxes. This regressive structure worsens after-tax income inequality between socioeconomic groups, people of color and white people, and communities across the commonwealth. But in 2018, the legislature made this situation worse by passing a new tax law that cut taxes for the
wealthy and special interests while shifting more responsibility onto low-to-moderate-income families.63
This also means a greater share of Kentuckians of color faced tax increases than those who are white, due to numerous barriers to economic success that result in people of color being overrepresented in
lower-income groups and under-represented in higher income groups.64 Then in 2019 the General
Assembly passed another package of special interest tax breaks, and particularly benefit banks, which will make it even more difficult to make the critical investments needed for a healthy Kentucky in future budgets.65 To raise revenue for needed investments and ask the wealthy and special interests to chip in, Kentucky should: rejoin the 32 other states with a graduated income tax based on ability to pay; trim corporate tax breaks; limit sales tax exemptions and expand the sales tax to additional services such as pool cleaning, investment counseling and interior decorating; and clean up other costly tax expenditures to allow the state to make investments in a healthier Kentucky. We should also roll back the special interest tax breaks passed in the 2019 General Assembly. In addition to raising state revenue, other changes to the state tax code can further promote health in Kentucky. Increasing the cigarette tax has been shown to deter many people from smoking. And while the state raised the cigarette tax by 50 cents a pack last year, we would get a greater impact on health from a higher increase.66 Vaping should also be subject to the cigarette tax (it currently is not). Furthermore, enacting a refundable Earned Income Tax Credit (EITC), would have significant health benefits. The federal EITC – which provides an income boost to low-income working families – increases economic security and reduces poverty and inequality. A growing body of research shows this additional income improves the health of mothers, babies and even entire neighborhoods.67 A state EITC – at 15% of the federal tax credit – would enable Kentuckians to build on the program’s successes.68 A Healthier Future for Kentucky Is Possible In order to create healthier communities and ensure every Kentuckian has an equitable opportunity to be healthy, we must invest in the social determinants of health through our budget. If we stop erecting barriers to health coverage and make needed investments across education, public health, human services, the physical environment and more – areas of the state budget that critically influence health – we will see these improvements over time, with more Kentuckians living longer, healthier lives. The Kentucky Center for Economic Policy (KCEP) is a non-profit, non-partisan initiative that conducts research, analysis and education on important policy issues facing the commonwealth. Launched in 2011, KCEP is a project of the Mountain Association for Community Economic Development (MACED). Support for this report was provided by the Robert Wood Johnson Foundation. The views expressed here do not necessarily reflect the views of the Foundation.
12
1 Samantha Artiga and Elizabeth Hinton, “Beyond Health Care: The Role of Social Determinants in Promoting Health and Health Equity,” Henry J. Kaiser Family Foundation, May 2018, https://www.kff.org/disparities-policy/issue-brief/beyond-health-care-the-role-of-social-determinants-in-promoting-health-and-health-equity/. 2 Patrick L. Remington, Bridget B. Catlin, and Keith P. Gennuso, “The County Health Rankings: Rationale and Methods,” Population Health Metrics (April 2015), https://pophealthmetrics.biomedcentral.com/articles/10.1186/s12963-015-0044-2. 3 Dustin Pugel, “New Census Data Shows Progress on Health Insurance Coverage Has Stalled,” Kentucky Center for Economic Policy, Sept. 12, 2018, https://kypolicy.org/new-census-data-shows-progress-on-health-insurance-coverage-has-stalled/. 4 Ashley Spalding, “Budget Agreement Includes Cuts, Full Pension Contributions and Some New Revenue,” Kentucky Center for Economic Policy, April 2, 2019, https://kypolicy.org/budget-agreement-includes-cuts-full-pension-contributions-new-revenue/. Dustin Pugel, “Kentucky’s Gains in Health Coverage Are Resilient Despite Sustained Attacks on Public Insurance,” Kentucky Center for Economic Policy, April 17, 2019, https://kypolicy.org/kentuckys-gains-in-health-coverage-are-resilient-despite-sustained-attacks-on-public-insurance/. 5 United Health Foundation, “American’s Health Rankings 2018 Annual Report,” https://www.americashealthrankings.org/explore/annual/measure/Overall/state/KY. 6 County Health Rankings and Roadmaps, “Kentucky: 2019 County Health Rankings Report,” March 2019, http://www.countyhealthrankings.org/sites/default/files/state/downloads/CHR2019_KY.pdf. 7 Office of Health Equity, “2017 Kentucky Minority Health Status Report,” The Department for Public Health, The Cabinet for Health and Family Services, 2018, http://www.astho.org/Accreditation-and-Performance/Documents/HE-Issue-Brief/KY-2017-Minority-Health-Status-Report/. 8 Jason Bailey, “New Census Data Shows Too Many Kentuckians Still Struggling to Afford Basic Necessities,” Kentucky Center for Economic Policy, Sept. 13, 2018, https://kypolicy.org/census-data-shows-too-many-kentuckians-still-struggling-to-afford-basic-necessities/. 9 Appalachian Regional Commission, “Health Disparities in Appalachia,” August 2017, https://www.arc.gov/research/researchreportdetails.asp?REPORT_ID=138. 10 Dhruv Khullar and Dave Chokshi, “Health, Income, & Poverty: Where We Are & What Could Help,” Health Affairs, Health Policy Brief, Oct. 4, 2018, https://www.healthaffairs.org/do/10.1377/hpb20180817.901935/full/. 11 Richard Rothstein, The Color of Law: A Forgotten History of How Our Government Segregated America (New York: Liveright, 2017). The Sentencing Project, “Report of The Sentencing Project to the United Nations Special Rapporteur on Contemporary Forms of Racism, Racial Discrimination, Xenophobia, and Related Intolerance,” March 2018, https://www.sentencingproject.org/wp-content/uploads/2018/04/UN-Report-on-Racial-Disparities.pdf. 12 Centers for Disease Control and Prevention. 13 Center for Health Equity, “2017 Health Equity Report: Uncovering the Root Causes of Our Health,” Louisville Metro, https://louisvilleky.gov/government/center-health-equity/health-equity-report. 14 LEO Weekly, “An Environmental Injustice Tour of West Louisville,” Nov. 25, 2015, https://www.leoweekly.com/2015/11/an-environmental-injustice-tour-of-west-louisville/. 15 Jennifer Sullivan, “Better State Budget, Policy Decisions Can Improve Health,” Center on Budget and Policy Priorities, Feb. 21, 2019, https://www.cbpp.org/research/state-budget-and-tax/better-state-budget-policy-decisions-can-improve-health. 16 Ashley Spalding, “Growing Number of Kentucky Counties Have More Available Workers Than Jobs,” Kentucky Center for Economic Policy, Oct. 2, 2018, https://kypolicy.org/growing-number-of-kentucky-counties-have-more-available-workers-than-jobs/. 17 Will Wright, “’Muddy, Nasty Water.’ Why These Eastern Kentuckians Are Afraid to Drink From Their Taps,” Lexington Herald-Leader, Dec. 6, 2018, https://www.kentucky.com/news/local/watchdog/article221657625.html. 18 Appalachian Regional Commission, “Health Disparities in Appalachia.” 19 The Hope Initiative, “Appendix,” July 2018, http://www.nationalcollaborative.org/wp-content/uploads/2018/07/HOPE-Appendix-Final-07.24.2018.pdf. 20 Sullivan, “Better State Budget, Policy Decisions Can Improve Health.” 21 Elizabeth H. Bradley, Maureen Canavan, Erika Rogan, Kristina Talbert-Stagle, Chima Ndumele, Lauren Taylor and Leslie Curry, “Variation in Health Outcomes: The Role of Spending on Social Services, Public Health, and Health Care, 2000-09,” Health Affairs (May 2016), https://www.healthaffairs.org/doi/10.1377/hlthaff.2015.0814. Social services included in the analysis were primary, secondary and higher education; income supports such as cash assistance, general relief for low-income or needs-tested beneficiaries of public welfare programs and Supplemental Nutritional Assistance Program funding; transportation (such as spending on sidewalks, highways and mass transit systems), environment and the conservation of natural resources, public safety (excluding corrections) and housing. The health outcomes used in the analysis were the percentage of adults in the state who were obese, had asthma, reported 14 or more days in the past 30 days as mentally unhealthy, or reported 14 or more days in the past 30 days with activity limitations. Other health outcomes were: state-level mortality rates for acute myocardial infarction, lung cancer and type 2 diabetes and post-neonatal mortality rates. The study’s authors note: “One interpretation of our findings could be that people who have poorer health require more medical care spending, which results in a lower ratio of social to health spending that is associated with poorer health outcomes. This may in part be accurate. However, it does not explain the observation that the ratio was also associated with health outcomes one and two years later. Furthermore, we also found a positive association between social services spending and better health outcomes.” 22 J. Mac McCullough and Jonathon P. Leider, “Government Spending in Health and Nonhealth Sectors Associated with Improvement in County Health Rankings,” Health Affairs (November 2016), pp. 2037-2043, https://www.healthaffairs.org/doi/abs/10.1377/hlthaff.2016.0708. This study does not provide state-level data. 23 Julia Berenson, Yan Li, Julia Lynch and José A. Pagán, “Identifying Policy Levers and Opportunities for Action Across States to Achieve Health Equity,” Health Affairs (June 2017), https://www.healthaffairs.org/doi/abs/10.1377/hlthaff.2017.0004?journalCode=hlthaff. 24 C. Kirabo Jackson, Rucker C. Johnson and Claudia Persico, “The Effects of School Spending on Educational and Economic Outcomes: Evidence from School Finance Reforms,” Quarterly Journal of Economics (February 2016), pp. 157–218, https://doi.org/10.1093/qje/qjv036.
13
25 Virginia Commonwealth University Center on Society and Health, “Why Education Matters to Health,” April 29, 2014, https://www.rwjf.org/en/library/research/2014/04/why-education-matters-to-health.html. 26 Sabrina Olds, et al., “Preschool Program Review and Full-Day Kindergarten,” Office of Education Accountability, Legislative Research Commission, September 2017, http://www.lrc.ky.gov/lrcpubs/RR450_U.pdf. 27 Anna Baumann, “The Funding Gap Between Kentucky’s Poor and Wealthy School Districts Continues to Grow,” Kentucky Center for Economic Policy, Dec. 13, 2017, https://kypolicy.org/funding-gap-kentuckys-poor-wealthy-school-districts-continues-grow/. 28 KCEP analysis of Office of the State Budget Director data. 29 KCEP analysis of Office of the State Budget Director data. 30 Michael Mitchell, Michael Leachman, Kathleen Masterson and Samantha Waxman, “Unkept Promises: State Cuts to Higher Education Threaten Access and Equity,” Center on Budget and Policy Priorities, Oct. 4, 2018, https://www.cbpp.org/research/state-budget-and-tax/unkept-promises-state-cuts-to-higher-education-threaten-access-and. 31 The state covers just half-day preschool for those with very low incomes or who have developmental disabilities. Kentucky Center for Economic Policy, “An Economic Agenda for a Thriving Commonwealth,” Aug. 22, 2018, https://kypolicy.org/economic-agenda/. 32 Will Wright, “A Two Hour Commute for Day Care: How Poor Access to Child Care Hurts Eastern Kentucky,” Lexington Herald-Leader, April 4, 2019, https://www.kentucky.com/news/state/article226333720.html. 33 Wright, “A Two Hour Commute for Day Care.” Prichard Committee for Academic Excellence, “Kentucky Early Childhood Cost of Quality Study,” November 2017, http://prichardcommittee.org/cost-of-quality/. 34 Kentucky Center for Economic Policy, “An Economic Agenda for a Thriving Commonwealth.” 35 Department for Aging and Independent Living, “Department for Aging and Independent Living Budget Overview,” presentation for the House Budget Review Subcommittee on Human Resources, Jan. 31, 2018. 36 “Better State Budget, Policy Decisions Can Improve Health.” 37 Lauren Taylor, “Housing and Health: An Overview of the Literature,” Health Affairs Health Policy Brief, June 7, 2018, https://www.healthaffairs.org/do/10.1377/hpb20180313.396577/full/. 38 “Better State Budget, Policy Decisions Can Improve Health.” 39 “Better State Budget, Policy Decisions Can Improve Health.” 40 In states and localities that do provide such assistance, about half of 19 surveyed programs cover the difference between rent and 30 percent of the tenant’s income, with the subsidy often capped at Fair Market Rent or a similar measure. These programs on average serve 1,600 households. Anna Bailey, Peggy Bailey and Doug Rice, “Innovative Approaches to Providing Rental Assistance: States and Localities Seek To Support Health and Human Services Goals,” Cityscape (2018), https://www.huduser.gov/portal/periodicals/cityscpe/vol20num2/ch4.pdf. 41 Glen P. Mays and Sharla A. Smith, “Evidence Links Increases in Public Health Spending to Declines in Preventable Deaths,” Health Affairs (August 2011), https://www.healthaffairs.org/doi/full/10.1377/hlthaff.2011.0196. 42 Aaron E. Carroll and Austin Frakt, “It Saves Lives. It Can Save Money. So Why Aren’t We Spending More on Public Health?,” The New York Times, May 28, 2018, https://www.nytimes.com/2018/05/28/upshot/it-saves-lives-it-can-save-money-so-why-arent-we-spending-more-on-public-health.html. 43 Kentucky Cabinet for Health and Family Services, “Department for Public Health FY 2018-2020 Budget Overview,” presentation for the Budget Review Subcommittee on Human Resources, Feb. 21, 2018. 44 In 33 states, state public health funding held stable or increased between 2017 and 2018. In Kentucky, state funding declined 6.3 percent, the 5th largest cut. Trust for America’s Health, “The Impact of Chronic Underfunding on America’s Public Health System: Trends, Risks, and Recommendations, 2019,” April 2019, https://www.tfah.org/report-details/2019-funding-report/. 45 United Health Foundation, “American’s Health Rankings 2018 Annual Report.” 46 Lisa Gillespie, “Ky. Health Departments Get Brief Pension Reprieve, But Public Health May Still Take a Hit,” WFPL, April 19, 2018, https://wfpl.org/public-health-will-take-a-hit-with-pension-payment-deadline-in-2019/. 47 Kentucky Retirement Systems, Comprehensive Annual Financial Reports. 48 Kentucky Statewide Board of Health meeting, Jan. 31, 2019. 49 Lisa Gillespie, “Kentucky Will Soon Lead Nation in Syringe Exchanges, But Work Isn’t Done,” WKMS, April 11, 2018, http://www.wkms.org/post/kentucky-will-soon-lead-nation-syringe-exchanges-work-isn-t-done#stream/0. 50 Mike Stunson, “As Kentucky Hepatitis Cases Rise, Lexington Offers More Clean Needles,” Lexington Herald-Leader, April 18, 2018, https://www.kentucky.com/news/local/counties/fayette-county/article209205569.html. 51 Trust for America’s Health, “Half of States Scored 5 or Lower Out of 10 Indicators in Report on Health Emergency Preparedness,” Dec. 19, 2017, https://www.tfah.org/article/half-of-states-scored-5-or-lower-out-of-10-indicators-in-report-on-health-emergency-preparedness/. 52 Olga Khazan, “A Frightening New Reason to Worry about Air Pollution,” The Atlantic, July 5, 2018, https://www.theatlantic.com/health/archive/2018/07/a-frightening-new-reason-to-worry-about-air-pollution/564428/. 53 Ashley Spalding, Anna Baumann, Pam Thomas, Dustin Pugel and Jason Bailey, “Commonwealth At Risk: A Preview of the 2018-2020 Kentucky State Budget,” Kentucky Center for Economic Policy, Jan. 4, 2018, https://kypolicy.org/commonwealth-risk-preview-2018-2020-kentucky-state-budget/. Precise calculations for cuts between 2008 and 2020 are not possible because the General Fund appropriations for these categories listed in the 2018-2020 state budget include significant increases in pension funds. 54 James Bruggers, “Kentucky Ranks Poorly in New Water Quality Study,” Courier-Journal, May 2, 2017, http://www.courier-journal.com/story/tech/science/environment/2017/05/02/kentucky-ranks-poorly-new-water-quality-study/308899001, 55 Calculation is not adjusted for inflation. Will Wright, “’Worse and Worse.’ Time to Address Eastern Kentucky’s Water Woes, Officials Say,” Lexington Herald-Leader, Dec. 14, 2018, https://www.kentucky.com/news/state/article223048640.html. 56 Kentucky Center for Economic Policy, “An Economic Agenda for a Thriving Commonwealth.” 57 Spalding, Baumann, Thomas, Pugel and Bailey, “Commonwealth At Risk.” 58 K.M. Blankenship, A.M. Del Rio Gonzalez, D.E. Keene, A.K. Groves and A.P. Rosenberg, “Mass Incarceration, Race Inequality, and Health: Expanding Concepts and Assessing Impacts on Well-Being,” Social Science & Medicine (October 2018), pp. 45-52, https://www.ncbi.nlm.nih.gov/pubmed/30205278. Connor Maxwell and Danyelle Solomon, “Mass Incarceration, Stress, and Black Infant Mortality,” Center for American Progress, June 5, 2018, https://www.americanprogress.org/issues/race/reports/2018/06/05/451647/mass-incarceration-stress-black-infant-mortality/.
14
Ashley Spalding, “How Criminal Justice Reform Would Help Kentucky Kids,” Kentucky Center for Economic Policy, Dec. 22, 2016, https://kypolicy.org/criminal-justice-reform-help-kentucky-kids/. 59 J. Acker, P. Braveman, E. Arkin, L. Leviton, J. Parsons and G. Hobor, “Mass Incarceration Threatens Health Equity in America,” Robert Wood Johnson Foundation, Jan. 15, 2019, https://www.rwjf.org/en/library/research/2019/01/mass-incarceration-threatens-health-equity-in-america.html. The Sentencing Project, “Report of The Sentencing Project to the United Nations Special Rapporteur on Contemporary Forms of Racism, Racial Discrimination, Xenophobia, and Related Intolerance.” The Special Project in collaboration with Louisville Metro Center for Health Equity, “Parental Incarceration, Children’s Health, and an Opportunity to Shift the Future,” https://louisvilleky.gov/sites/default/files/health_and_wellness/che/parental_incarceration_childrens_health.pdf. 60 Ashley Spalding, “Governor’s Proposed Additional Investment in Justice System Still Limited,” Kentucky Center for Economic Policy, Feb. 26, 2019, https://kypolicy.org/governors-proposed-additional-investment-justice-system-still-limited/. 61 Ashley Spalding, “2 Gen Approach to Kentucky’s Opioid Epidemic Needed,” Kentucky Center for Economic Policy, Feb. 22, 2018, https://kypolicy.org/2-gen-approach-kentuckys-opioid-epidemic-needed/. 62 Lois M. Davis et al., “Evaluating the Effectiveness of Correctional Education,” RAND Corporation, 2013, https://www.rand.org/content/dam/rand/pubs/research_reports/RR200/RR266/RAND_RR266.pdf. James Howell, “Gang Prevention: An Overview of Research and Programs,” Juvenile Justice Bulletin, U.S. Department of Justice, December 2010, https://www.ncjrs.gov/pdffiles1/ojjdp/231116.pdf. 63 Jason Bailey, “Kentucky Tax Shift Going Into Effect,” Kentucky Center for Economic Policy, June 21, 2019, https://kypolicy.org/kentucky-tax-shift-going-effect/. 64 Anna Baumann, “New Tax Law Shifts from the Wealthy to Kentuckians of Color and Economically Distressed Regions of State,” Kentucky Center for Economic Policy, April 20, 2018, https://kypolicy.org/new-tax-law-shifts-wealthy-kentuckians-color-economically-distressed-regions-state/. 65 Pam Thomas, “Conference Committee Agrees to Substantial New Tax Breaks in the ‘Tax Clean-Up Bill’ – Digging Our Revenue Hole Even Deeper,” Kentucky Center for Economic Policy, March 13, 2019, https://kypolicy.org/conference-committee-should-move-forward-a-clean-tax-clean-up-bill/. 66 T.R. Goldman, “Tobacco Taxes,” Health Affairs Health Policy Brief, Sept. 19, 2016, https://www.healthaffairs.org/do/10.1377/hpb20160919.471471/full/. 67 William N. Evans and Craig L. Garthwaite, “Giving Mom a Break: The Impact of Higher EITC Payments on Maternal Health,” National Bureau of Economic Research, Working Paper No. 16296, August 2010, https://www.nber.org/papers/w16296. Hillary Hoynes, Doug Miller, and David Simon, “Income, the Earned Income Tax Credit, and Infant Health,” American Economic Journal: Economic Policy (2015), pp. 172-211, https://www.aeaweb.org/articles?id=10.1257/pol.20120179. 68 Kentucky Center for Economic Policy, “An Economic Agenda for a Thriving Commonwealth.”