Critical Flicker Frequency in a Harp Seal, Pagophilus ...
59
University of Nebraska - Lincoln DigitalCommons@University of Nebraska - Lincoln Faculty Publications, UNL Libraries Libraries at University of Nebraska-Lincoln 1973 Critical Flicker Frequency in a Harp Seal, Pagophilus groenlandicus (Erxleben, 1777) Charles D. Bernholz University of Nebraska-Lincoln, [email protected] Follow this and additional works at: hp://digitalcommons.unl.edu/libraryscience Part of the Aquaculture and Fisheries Commons , Comparative and Evolutionary Physiology Commons , Marine Biology Commons , Molecular and Cellular Neuroscience Commons , Systems and Integrative Physiology Commons , and the Zoology Commons is Article is brought to you for free and open access by the Libraries at University of Nebraska-Lincoln at DigitalCommons@University of Nebraska - Lincoln. It has been accepted for inclusion in Faculty Publications, UNL Libraries by an authorized administrator of DigitalCommons@University of Nebraska - Lincoln. Bernholz, Charles D., "Critical Flicker Frequency in a Harp Seal, Pagophilus groenlandicus (Erxleben, 1777)" (1973). Faculty Publications, UNL Libraries. 311. hp://digitalcommons.unl.edu/libraryscience/311
Transcript of Critical Flicker Frequency in a Harp Seal, Pagophilus ...

University of Nebraska - LincolnDigitalCommons@University of Nebraska - Lincoln
Faculty Publications, UNL Libraries Libraries at University of Nebraska-Lincoln
1973
Critical Flicker Frequency in a Harp Seal, Pagophilusgroenlandicus (Erxleben, 1777)Charles D. BernholzUniversity of Nebraska-Lincoln, [email protected]
Follow this and additional works at: http://digitalcommons.unl.edu/libraryscience
Part of the Aquaculture and Fisheries Commons, Comparative and Evolutionary PhysiologyCommons, Marine Biology Commons, Molecular and Cellular Neuroscience Commons, Systemsand Integrative Physiology Commons, and the Zoology Commons
This Article is brought to you for free and open access by the Libraries at University of Nebraska-Lincoln at DigitalCommons@University of Nebraska- Lincoln. It has been accepted for inclusion in Faculty Publications, UNL Libraries by an authorized administrator of DigitalCommons@University ofNebraska - Lincoln.
Bernholz, Charles D., "Critical Flicker Frequency in a Harp Seal, Pagophilus groenlandicus (Erxleben, 1777)" (1973). FacultyPublications, UNL Libraries. 311.http://digitalcommons.unl.edu/libraryscience/311

CRITICAL FLICKER FREQUENCY IN A HARP
SEAL, PAGOPHILUS GROENLANDICUS (ERXLEBEN, 1777)
A Thesis
Presented to
The Faculty of Graduate Studies
of
The University of Guelph
by
CHARLES D. BERNHOLZ
In partial fulfilment of requirements
for the degree of
Master of Arts
September, 1973
© Charles D. Bernholz, 1973

ABSTRACT
CRITICAL FLICKER FREQUENCY IN A HARP SEAL, PAGOPHILUS GROENLANDICUS (ERXLEBEN, 1777)
Charles D. Bernholz, M.A. University of Guelph, 1973
Supervisor: Professor M. L. Matthews
Critical flicker frequency (CFF) in a free-swimming harp seal
(Pagophilus groenlandicus) was investigated using behavioral techniques.
The resulting CFF versus intensity contour indicates a definite rod-cone
break, confirming a duplex photoreceptor population whose presence had
not been observed in previous morphological reports.

This thesis is dedicated to
ERNST WOLF, Ph.D.
for introducing me to the
study of vision

ACJ.<NOWLIDGBMENTS
I wish to thank Prof. M. L. Matthews for serving as my Supervisor
and for his support and encouragement th.roughout this exerc,lae. Thanks
are due also to Prof. D. J. Piggins and Prof. E. D. Bailey for serving
on my Committee and for their many helpful comments.
Dean K. Ronald, College of Biological Sciences, is thanked for
making seals, equipment, and tank space available; Prof. H. M. B. Hurwitz
and the Department of Psychology are thanked for providing the
mainteneo.e. fees for theae animals.
My thanks are extended: to Prof. P. K. Leppmann for his kind
support, confidence, and friendship; to D. M. Lavigne and N. A.
0ritsland for many, many long discussions on vision, seals, and zoology;
and to Dr. L. A. Spillmann, Universitat Freiburg im Breisgau, for helpful
luggestions in the preparation of this. thesis.
Special thanks go to my wife, Anita, for her encouragement and
understanding over the past two years.
Finally, I thank C9, DS' and D3 for tolerating my experimental
procedure; without their co-operation, this dissertation would not exist.
i
TABLE OF CONmNTS
Page
I INTRODUCTION ••••••••••••••••••••••••••••••••••••••••••••• 1
II l-fE mOD ••••••••••••••••••••••••••••••••••••••••••••••••••• 19
SUBJECT •••••••••••••••••••••••••••••••• • ••.• • • •. • • • • • •• • 19 APPARATUS ••••••••••••••••••••••••••••••••••••••••••••• 22
Calibration ••••••••••••••••••••••••••••••••••••••.• 22 PROCED 1JRE ••••••••••••••••••••••••••••••••••••••••••••• 25
Preliminary Training •••••••••.••••••••••••••••••••• 25 Testing ............................................. 26
III RE8UL TS •••••••••••••••••••••••••••••••••••••••••••••••••• 28
IV DISCUSSION ••••••••••••••••••••••••••••••••••••••••••••••• 32
v BIBLlOORAPHY ••••••••••••••••••••••••••••••••••••••••••••• 45
VI APPENDIX 1 ............................................. Sl
i1

TABLE I
LIST OF TABLES
Critical flicker frequen<:y (en) determinations for a harp seal, Pagophilu8 groenlandicu8 (Erxleben, 1771) •••••• ~ •••• : ••• ~ •••••••••••••••••••..
iii
Pale
29

Fig. 1
Fig. 2
Fig. 3
Fig. 4
Fig, 5
Fig. 6
Fig. 7
Fig. 8
Fig. 9
Fig. 10
LIST OF FIGUQS
Critical flicker frequency in the cat .............. Cri tical flicker fr~R~Y 1" .,the iguana, Iguana iguana and the' gecko,' Gekko pkko •••••••••••
Lepomis ......................... ., ................. . i :-, r~ ·.~":'{"r ~ _> ,;, ,. ;0
Critical flicker frequency in the 80ft-shelled turtl.e..TI'J,S I!!lpftli •• ;e"5,o. ', ........... • ••••• • •• • •• •
Crj.~~~ufl~":~r;:;,fr.,q\le,,cyin, th,e di,lIrut Pcg, PIleI ... inunauis •••••••••••••••••••••••••••••••••.
critical flicker frequency in the owl monkey, Aotes trlvirp,.tu8 ••••••••••••••••••••••••••••••••••
An, overhead schematic representation of the indoor fiberglass tank used to house the experimental anima 1 •.••....•..•••...•.•...•••.•.••..•...•.••••..
A schematic representation of the the optical bench •
Critical flicker frequency in a harp seal, Pagophilus aroenlandicus •••••••••••••••••••••••••••
Critical flicker frequency in a harp seal, Pagophilus groenlandicus, expressed in probits, plotted as a function of luminance •••••••••••••••••
iv
Page
3
6
9
12
14
16
20
23
30
33

Walls (1942)
INTRODUCTION
Critical flicker frequency (CFF) may bethCMICht of .s an index
of the temporal resolution power of the visual system. It may be defined
as the lowest flash rate at which an observer sees a train of intermittent
light pulses as continuous, or fused. The measurement of CFF is also,
according to Walls (1942), "one of the best criteria of the comparative
objectiv,e capacities of vertebrates for movement perception," a capacity,
as with visual acutty, strongly tied to photoreceptor type and population.
Initiale work by Porter (1902) speeified two branches of the
human CFF-intensity function. Schaternikoff (1902) and Von Kries (1903)
further ,howedthat Crl-rates decreased with dark adaptation, and that
color-blind observers had CFF values 20% lower than" normals. B.ased on
this evidence, Von Kries attributed the two-part curve to different
sensitivities of rod and cone vision. Early e1ectroreti~ic work by
Piper (1911) ,.howed response differences in the electropbysiolo&J.cal
performance of rod < retinae .. and duplex retinae • Later experi_nt. in
elec.troretinography perfonaed by Granit and'Rtdclell (1134) an4 b¥ Granit
(1935) provided evidenee that, 1n,an~ls with axed retinae, photopic
CrF-rates were higher than scotopic rat... Aiso t byco..,.rill8 the
different wave component. of the electroretinogram (ERG), it wa.
po.sible to identify the separate contributions of rods and cones. The
1

2
response latency for cones was found to be shorter than that for rods.
These ~portant characteristics have been confirmed and further specified
in other experiments: Shipley and Fry (1966) used flicker perimetry
during dark adaptation to isolate and identify photoreceptor contributions;
analysis of early and late receptor potentials suggests that cones
resolve higher flicker rates than rods (Brown and Watanabe 1962 a, b;
Brown,Watanabe, and Murakami 1965; Whitten and Brown 1973 a).
The ERG-wavefouah.8,;~been "foultd: to 'ralably ,lbllo» the flicker
stimulus with are8pot18;e ;for each :l.mltvi'Clu'at·fl •• h of li'lht un-til, at
CFF, the w.ve:!ora"bc .... ' , •• ooth. In aniuls witb pure rod· retinae,
the ERG-CFPre,pomJe. rate, is low, usually below 30 flashea per sec. (£ps), such
as .the hedgeilol,Erinaceus europaeua(Horsten and W"inkleman 1962), or
the bushbaby, Gal_go crassicaudatus (Docit 1967; Ordy and Samorajski 19(8).
pure cone retinae animals exhibit higher response rates, for instance
the tree shrew, Tupaia slis (90 fps; Tigges, Brooks, and nee 1967), or
squirrel., Sciuru8 wlgaris (103 fps; Horsten and Winkleman 1962).
In mixed retinae, Dodt (1952) demonstrated light adaptation yields
higher CCF-rates than dark adapted conditions. The cat (Fig. 1),
possessing a poor but nonetheless valid mixed retina, produces a duplex
contour, defining rod and cone responses. Docit and Enroth (1954) showed
that the cone contributions to this contour can be elicited by using
high flash intensities. Gouras and Link (1966) and Goura. (1967), in
their study with the rhesus monkey ~caca mulatta), have presented
evidence to show that while the thresholds and response speed of the
receptive field of a ganglion cell of convetging rod and cone photoreceptors
increase with illumination, the much shorter response latency of the cones
(50 versus 150 msec) is sufficient to control the ganglion cell output

Fig. 1
3
Critical flicker frequency in the cat •. " The ordinate represents
the frequency in flashes per second (fps) at which the
ele~troretinogram failed to respond to each stimulus. The
abscissa represents the stimulus intensity in log milliLamberts.
(Redrawn from Dodt and Enroth 1954)

4
70
60
50
40
FPS
30
20 '
10
-1 o 1 2 3 4
Luminance, Log mL

5
whenever adequately stimulated. This situation is further enhanced by the
higher response speed of the ganglion cell itself, produced by the
increasing illumination.
When plotting CFF against a wide range of stimulus intensities,
a response contour may be produced showing a shift in function from one
type of photorecep tor to another, as in the ca t (Fig. 1), or the lack of
such a transition as in the pure rod Tokay gecko, Gekko gekko, and the
pure cone iguana, Iluaaa i·luana (Fig. 2) (Meneghini and Hama.aki 1967).
These latter curves are excellent examples of three fundamental points:
1) ~one .photoreceptors follow higher rates of flicker than rods;
2) the. ~lppes of .rod and cone curves are different; and
3) simplex retinae show no discontinuity in such functions. The eat's
response contour (Fig. 1) obtained by Dodt and Enroth (1954) combines the
properties of rod and cone performance. The discontinuity in the curve
indicates a mediational transferfram rods to cones • . I
Behavioral work by Crozier and co-workers yielded analogous
results (Fig. 3). In morphologically distinct duplex retinae, duplex
flicker contours were found (Wolf and Zerrahn-Wolf 1936; Crozier, Wolf,
andZerrahn-Wolf 1936, 1937 a, b, c, 1938; Crozier and Wolf 1939 a, c,
1940 b, 1944 b); whereas with simplex retinae (and also in the foveal
region of man), simplex contours were observed (Crozier, Wolf, Zerrahn-
Wolf 1939; Crozier and Wolf 1940 a, 1941 a, b, 1942, a,. b, 1943, 1944 a).
As stated by Crozier and Wolf (1944 c):
What one is required to say is that, in duplex performance curves we have to do with the occurrance of two populations of neural effects in the constitution of the response contours. This might well be found to occur in case~ where only "cones" or only "rods" are revealed by ordinary' histological inspection, but where either might really

Fig. 2
6
Critical flicker frequency in the iguana, Iguana iguana
(upper) and the gecko, Gekko gekko (lower). The ordinate
represents the frequency in flashes per second (fps) at which
the electroretinogram failed to respond to each stimulus. The
abscissa represents the stimulus intensity in log milliLamberts.
The iguana is thought to have a pure cone retina, whereas
the gecko possesses a pure rod retina. (Redrawn from Meneghini
and Hamasaki 1967)

7
80
70
60
J • 50
40
FPS
30
20
10
1 2 3 4 5 6
Luminance, Log mL
include more than one functional type. Reciprocally, it might easily happen that a structurally duplex retina should be aseociated with a simplex perforaance curve, but this we have not thusfar found.
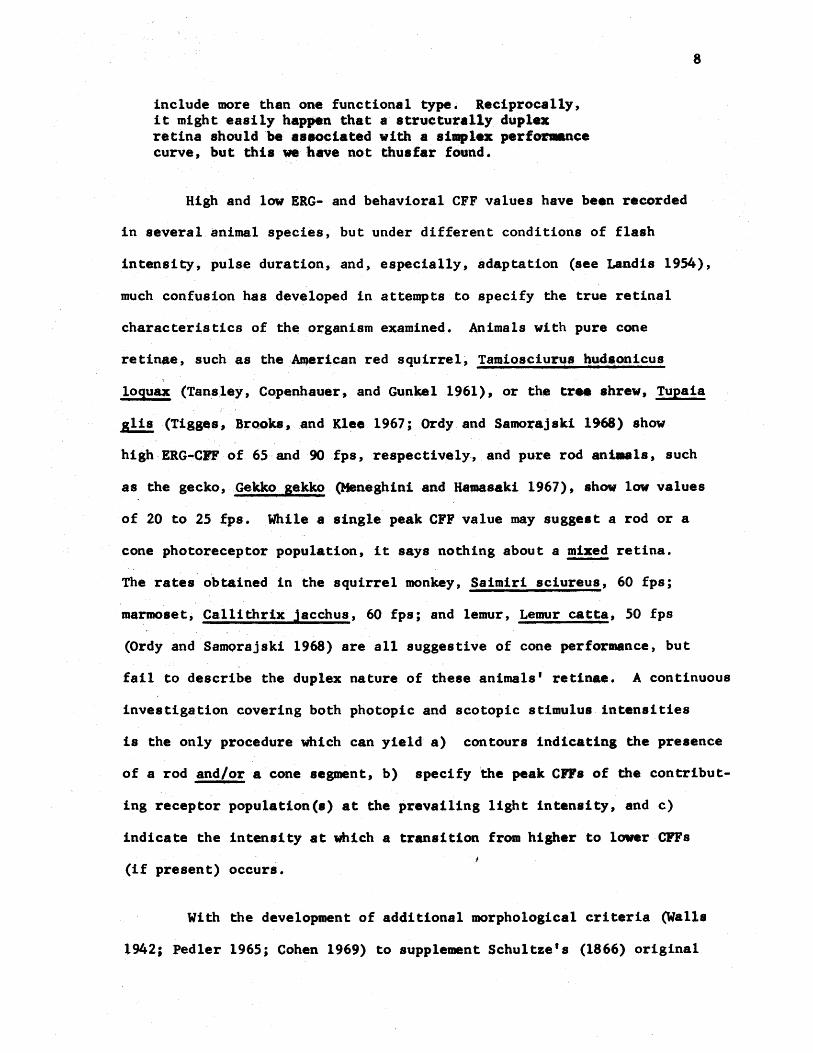
High and low ERG- and behavioral CFF values have been recorded
in several animal species, but under different conditions of flash
8
intensity, pulse duration, and, especially, adaptation (see Landis 1954),
much confusion has developed in attempts to specify the true retinal
characteristics of the organism examined. Animals with pure cone
retinae, such as the~erlcan red squirrel, Tamiosciuru8 budaonicus
loquax (Tansley, Copenhauer, and Gunkel 1961), or the tr .. shrew, Tupaia
glis(Tigges, Brooks, and Klee 1967; Ordy and Samo~ajski 1968) show
high,ERG-CPF of 65 and 90 fps, respectively, and pure rod ani.uls, such
as the gecko, Gekkogekko (Heneghini and Hamasaki 1967), show low values
of 20 to 25 fps. While a single peak CFr value may suggest a rod or a
cone photoreceptor population, it says nothing about a mixed retina.
The rates obtained in the squirrel monkey, Saimiri sciureus, 60 fps;
marmoset, Callithrix Jacchus, 60 fps; and lemur, Lemur catta, 50 fps
(Ordy and Samorajski 1968) are all suggestive of cone performance, but
fail to describe the duplex nature of these animals' retinae. A continuous
investigation covering both photopic and scotopic stimulus intensities
is the only procedure which can yield a) contours indicating the presence
of a rod and/or a cone segment, b) specify 'the peak crrs of the contribut-
ing receptor population(s) at the prevailing light intensity, and c)
indicate the intensity at which a transition from higher to lower CPFs
(if present) occurs.
With the development of additional morphological criteria (Walls
1942; Pedler 1965; Cohen 1969) to supplement Schultze's (1866) original

Fig. 3 Critical flicker frequency in the sunfish, Lepomis. The
ordinate represents the number of flashes per second (fps)
passing a given point on the circumference of a rotating
cylinder within which the animal is placed. The critical
response is a change in orientation to the alternate
transparent and opaque stripes on the cylinder wall which
cause the flashing. The abscissa represents the stimulus
intensity in logmilliLambert~. (Redrawn from Crozier, Wolf
and Zerrahn-Wolf 1936)
9

60
50
40 '
FPS
30
20
-3 ... 2 o 1 2
Luminance, Log mL

11
notion of two types of receptors, further confusion has developed.
While flicker contours and histological data for individual species are
usually in accord, occasional contradictions between anatomical and
functional distinctions have been observed. As early as 1944, Crozier
and Wolf (1944 c), in a behavioral experiment, observed a duplex contour
(Fig. 4) in the soft-shelled turtle, TrioDyx CA!Yda) amori, which according
to Gillett (1923) 118S aD ~xcluslve cone retia.. Al.e, the aelsuma
species of· geekos ~r,. theuaht to pO ••••• J pure cOMreUnae (Tan. ley
1961) but Arden and ,,, •• l.,} (1962) reported breaks 18 the ... CPF curves
of the Phe18u .. ",._,li,i(Ji'i 5). FUlrthermore,U-saki (1'67)
presented evidence sbowiag that the owl monkey, .. ate. tri:vlI'Mtua, does
not have a pur-e rod retioa .a defined by Jones (1965), but generate. a
flicker curve with a deflnlte.rod-cone break (Fig. 6). In such cases,
the histologicalcriteria· .. re inadequate to define the true retinal
compositions.
The technique of cn has therefore shown itself to be a valid
and indispensable tool in photoreceptor detection and analysis. Dodt
(1967) has d~fined CFF as the "moe t reliable" indicator of a rod or
cone malllDalian eye.-
The application of a CFF analysis to the harp seal, Palophilus
groenlandicus, follows from the small, and sometimes contradictory
evidence, accumulated to date on this seal's visual system. Nagy and
Ronald (1970) a.nalyzed the harp seal's retina histologically. While
their study did not reveal the presence of cone outer segments, cone-type
pedicles were observed. This combinati'on of characteristics is
sugges-tive of pedler's (1965) type B cell, a relatively sensitive
poly~synaptic receptor, found in the fovea of rhesus monkeys. A high

Fig. 4
12
Critical flicker frequency in the soft-shelled turtle,
Trlonyx emoryi. The ordinate represents the number of flashes
per second (fps) passing a given point on the circumference
of a rotating cylinder within which the animal is placed. The
critical response is head nystagmus to the alternate transparent
and opaque stripes on the cylinder wall which cause the flashing.
The abscissa represents the st~ulus intensity in log
milliLamberts. (Redrawn from Crozier and Wolf 1944c)

13
60
50
40
FPS
30
20
10
-2 -1 o 1 2
Luminance, Log mL

Fig. 5 Critical flicker frequency in the diurnal gecko, Phelsuma
inunguis. The ordinate represents the frequency in flashes
14
per second (fps) at which the electroretinogram failed to
respond to each st~ulus. The abscissa represents the st~ulus
intensity in log milliLamberts. (Redrawn from Arden and
Tansley 1962)

15
50
40
30
FPS
20
10
1 2 3 4 5 6
Luminance, Log mL

Fig. 6
16
Critical flicker frequency in the owl monkey, Aotes trivirgatus.
The ordinate represents the frequency in flashes per second
(fps) at which the electroretinogram failed to respond to each
s.timulus. The abscissa represents the stimulus intensity in
log m.illiLamberts. (Redrawn from Hamasaki 1967)

17
50
40
30
FPS
20
10
1 2 3 4 5 6
Luminance, Log mL
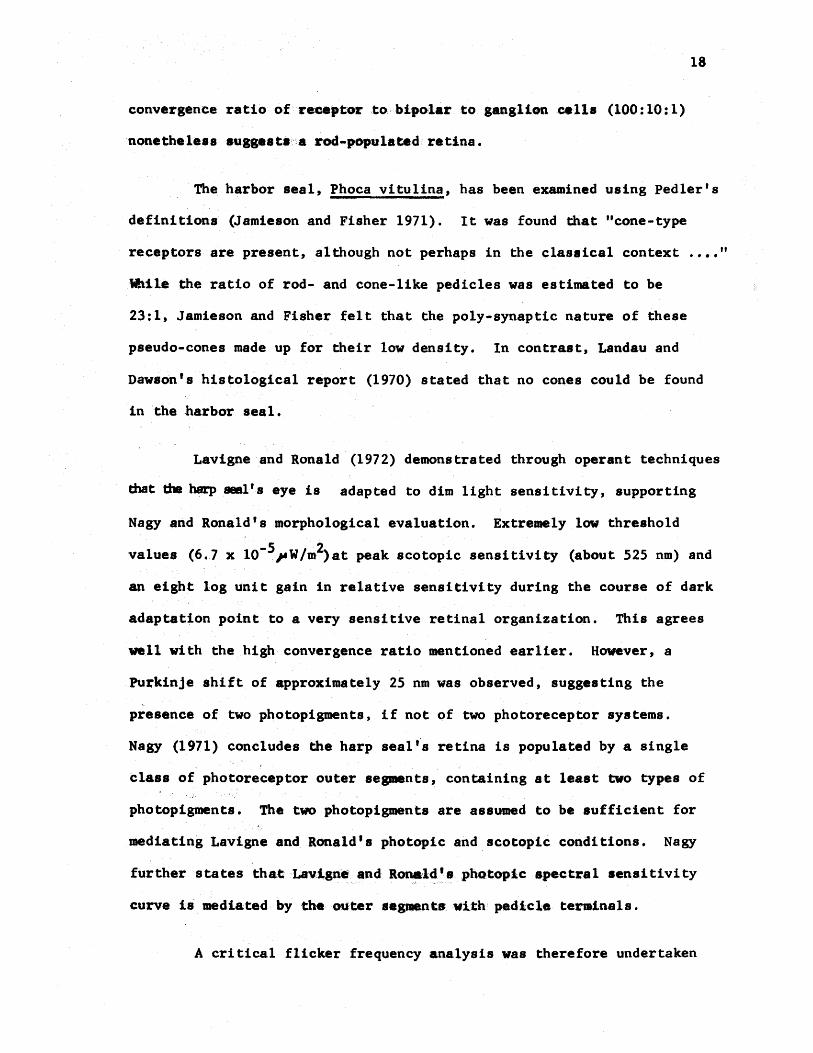
18
convergence ratio of receptor ,tobipolatto ganglion cells (100:10:1)
nonetheless .uggests,. rod-populated retina.
The harbor seal, Phoca vitulina, has been examined using pedler's
definitions (Jamieson and Fisher 1971). It was found that "cone-type
receptors are present, although not perhaps in the classical context
While the ratio of rod- and cone-like pedicles was estimated to be
23:1, Jamieson and Fisher felt that the poly-synaptic nature of these
pseudo-cones made up for their low density. In contrast, Landau and
Dawson's histological report (1970) stated that no cones could be found
in the harbor seal.
Lavigne and Ronald (1972) demonstrated through operant techniques
that the harp seal's eye is adapted to dim light sensitivity, supporting
Nagy and Ronald's morphological evaluation. Extremely low threshold
values (6.7 x 10⁻⁵ JAW/m2)at peak scotopic sensitivity (about 525 nm) and
an eight log unit gain in relative sensitivity during the course of dark
adaptation point to a very sensitive retinal organization. This agrees
well with the high convergence ratio mentioned earlier. However, a
Purkinje shift of approximately 25 nm was observed, suggesting the ",
presence of two photopigments, if not of two photoreceptor systems.
Nagy (1971) concludes the harp seal's retina is populated by a single
class of photoreceptor outer se_nts, containing at lea.st two types of
photopigments. The two photopigments are assumed to be sufficient for
mediating Lavigne and Ronald's photopic and scotopic conditions. Nagy
furtheratates that Lav.igne and Ronald'.phQtopicapectral sensitivity
curve is mediated by the outer s.gmenta with pedicle terminals.
A critical flicker frequency analysis was therefore undertaken
"

in order to. facilitate making a more definitive statement about the
functional composition and· organization 'of the harp seal's retina.
METHOD
SUBJECT
19
The subject was a four year old immature female harp seal,
Pagophilus groenlandicus (Erxleben 1777). She had served in a previous
visual experiment (Lavigne and Ronald 1972) using the same operant
techniques.
nte seal was visually isola.ted from other seals belonging to the
Department of Zoology, University of Guelph, in an indoor fiberglass tank
(Fig. 7) containing a total volume of approximately 6,000 gallons.
Continuously flowing well-water of approximately 100e provided a
water change once every four hours. Tank cleaning was carried out
periodically. A ledge, 1m wide, ran along one side of the tank, providing
an area fQr the animal to rest out of water. The area around the tank
was sectioned off from the rest of the facility by an opaque black
plastic wall. An overhead lighting array, controlled through an
autQm4tic timer giving a light-dark photoperiod of about 12:12 hr,
was positioned 2m above the water, and consisted of eight, 100 W
125 V light bulbs.
Atlantic herring, Clupea harengus, served as food. Daily
consumption was approxi_tely 4,000g, divided over two meals. ntis
was further supplemented by a daily vitamin dose (Appendix 1). Weighing

Fig. 7
20
An overhead schematic representation of the indoor fiberglass
tank used" to house the experimental animal. The 1m-wide
segment was a deck above the waterline providing an area for
the anoimal to rest out of water. Walls approximately 1m high
extended above the waterline and deck surface. The optical
bench (OB) was aligned behind an underwater window, providing
a stimulus next to the stimulus paddle (SP). Responses were
made to the left response (LRP) and right response (RRP)
paddles.

21
I ..... --- ~ ----.... ~ .... -!_I
a. Q. Ci'a: cx:[ ... a:
e an
Q. en M·
Q. CD
m CD
0 -a E
• ...

22
and bleeding (Ronald, Foster, and Johnson 1969) were carried out monthly
as part of a standard ... intenance program, giving a general indication
of the animal'. health.
APPARAnJS
The optical apparatus (Fig. 8) consisted of a General Radio
strobe wh9se condensed beam was focused on an aperature. A third lens
collimated the beam which then passed through Kodak neutral density
filters and a Uniblitz electronic shutter of 2.5 cm diameter. This beam
then passed through a clear acrylic window and approx~tely 15 em of
water before striking the right eye of the self-positioned seal. The
shutter duration was 500 msec. Appropriate baffles were used to cut down
stray light. Neutral density filters used during the testing sessions
attenuated the strobe's initial intensity of 170 lux, measured at the
position of the seal's eye, by 1.0, 2.0, 3.0, 4.0, 4.5, 5.0, 5.5, 6.0, and
7.0 log units. The entire optical apparatus was placed in a lightproof
house. Flash rate was indicated by a Dawe Instruments frequency counter
coupled to an International Rectifier photovoltaic cell whose surface
was attached to baffle 12.
Response logic, under the control of the experimenter, defined
the correct ~esponse and reinforcement pattern.
calibration: Calibration of the source was carried out using a
Gamma 700 photometer coupled to a fiber optics probe in a waterproof
housing. A R.C.A. 931A photomultiplier tube served as the sensing
element. Its housing -included a photopic correction filter facilitating

Fig. 8
23
A schematic representation of the optical bench. General
Radio strobe (8T); condens ing lenses (L l and L2); apera ture (A);
collimating lens (L3); Kodak neutral density filters (NOF);
Uniblitz electronic shutter (8); acrylic window in side of
tank (AW); water (W); baffles (BI , B2 and B3).

M
al
u. C Z
...
~ « en
CWO)
-'
N
-'
-'
24

direct illuminance lIleasur-emelltS. Calibration of the photoaaeter itself
was against :.N.R.C.!~'standard lamp. Todetennine the {.ct •• nt lux ~t
theantaaal, the fiber: optics probe was lowered into the watertoa
position equal'to that of the seal's right eye.
PROCEDURE
25
Preliminary Training: The seal was shaped using operant
techniques (Blough 1958). It was conditioned to discriminate between a
flickering stimulus of 15 fps and an apparently fused stimulus of 40 fps,
presented in randOln.order. The source was the above optical apparatus
without Jleutral density filters.
The seal began a trial by pressing a submerged stimulus paddle
with her nose, simultaneously positioning her head in a relatively
consistent viewing position. This opened the shutter and initiated the
response logic system. The seal responded to the presence of a flickering
stimulus by. pressing a response paddle on the left side of the tank, or
to the presence of a fused stimulus by responding to the right side of
the tank. Only one view of the stimulus was allowed per trial; the
animal was forced to respond in order to view the next stimulus.
During training, and later testing sessions, the order of stimulus
presentatioDswas formulated using Gellerman's (1932) schedule, yielding
an equal number of catch (fused stimulus) and test (flickering stimulus)
trials. Experimenter biasing and paddle preference by the seal were thus
minimized. The order was read from a prepared listing, and was used by
the experimenter to simultaneously match the stimulus conditions and the
respopse logic system.

26
Detection of at •• ,t ,stiIDdlus',causedthe aeal to press the left
response paddl~, r"ceiviitg;. "P'iect! 'of herr.!", •• r.ill'f« ..... t.
Respond;1ng to tbe Tight r •• pon8~ piaddlefo,J :a 't.eat' stiWllflus c-.ed a
solenoid' to close loudly, indicating to .thean1laal tha·t_'·il&4Oa'~.ct
response had been made and that no food reinforc,ementwoulcibe presented.
Catch trials required the seal to respond in the opposite saqueace;
right side respons,es were .reinforced, left side paddle responses were not.
The experimenter reset the response logic after each incorrect response
to prepare for the next tria 1.
Two seasi'ouo! abeut 30 min. each were run daily, during both
trainiftgan4\testingtimeperiods. The animal worked at her own speed.
pailutetowork caused me paddles to be withdrawn and the session
terminated. During t ... iallq and testing days, the daily food allocation
wa. given only ifboth's" ••• alon8 were completed. On Idays off, I the two
meals wel'egivenby'hand.
Tes.ting: Testing/8essions were preceded by dark adaptation
periods of at least oaehoure' Overnight ,dark adaptation of apPl'oxtlUtely
ten hours was also u •• d but <lid not cause any significant difference in
performance when cOIIlparectte one hour dark adaptation times. All testing
was carried out in the dark.
·Data collection was through the Up-Down Transformed Response
(UDTR) rule of Wetherill and Levitt (1965). This simple technique
facilitates quick but accurate threshold estimations, and may be used to
determine threshold values ranging from 5~ to 89% correct performance
(Wetherill and Levitt 1965). The function selected for this procedure
27
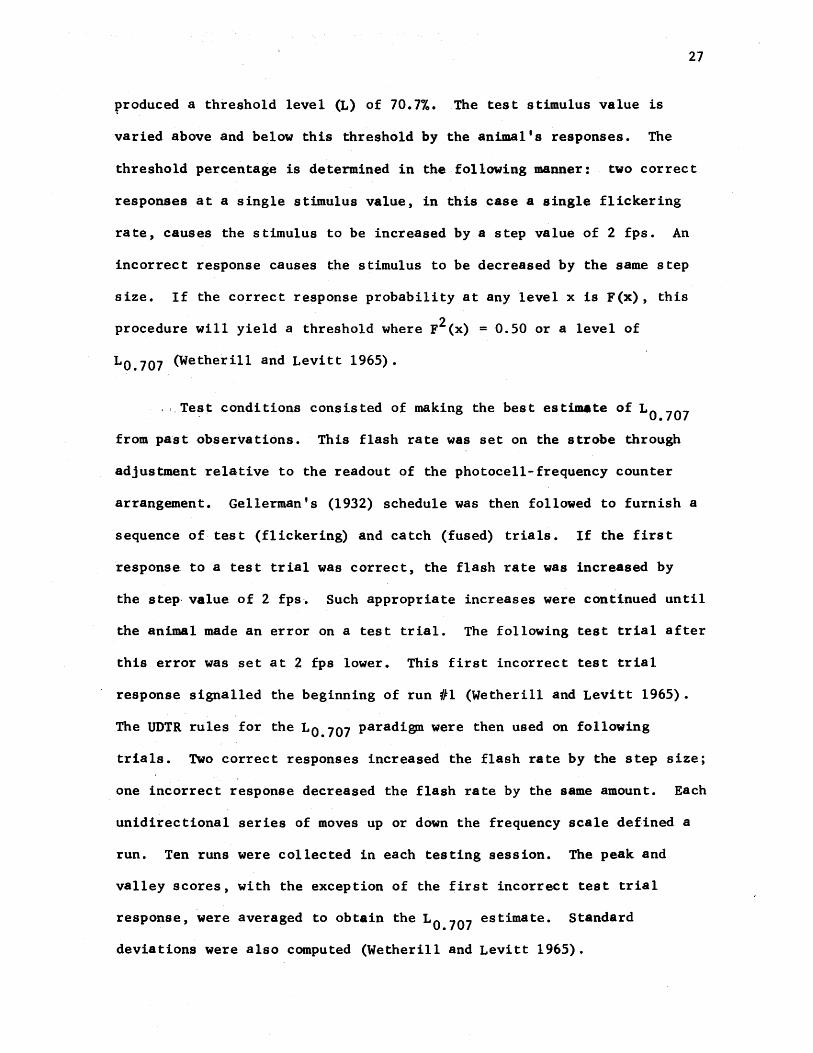
produced a threshold level (L) of 70.7%. The test stimulus value is
varied above and below this threshold by the animal's responses. The
threshold percentage is determined in the following manner: two correct
responses at a single stimulus value, in this case a single flickering
rate, causes the stimulus to be increased by a step value of 2 fps. An
incorrect response causes the stimulus to be decreased by the same step
size. If the correct response probability at any level x is F(x), this
procedure will yield a threshold where F2(x) = 0.50 or a level of
LO. 707 (Wetherill and Levitt 1965).
, , Test conditions consisted of making the best estimete of LO•707
from past observations. This flash rate was set on the strobe through
adjustment relative to the readout of the photocell-frequency counter
arrangement. Gellerman's (1932) schedule was then followed to furnish a
sequence of test (flickering) and catch (fused) trials. If the first
response. to a tes t tr ial was correc t, the flash rate was increased by
the step, value of 2 fps. Such appropriate increases were continued until
the animal made an error on a test trial. The following test trial after
this error was set at Z fps lower. This first incorrect test trial
response signalled the beginning of run #1 (Wetherill and Levitt 1965).
The UDTR rules for the LO.707 paradigm were then used on following
trials. Two correct responses increased the flash rate by the step size;
one incorrect response decreased the flash rate by the same amount. Each
unidirectional series of moves up or down the frequency scale defined a
run. Ten runs were collected in each testing session. The peak and
valley scores, with the exception of the first incorrect test trial
response, were averaged to obtain the LO•707 estimate. standard
deviations were also computed (Wetherill and Levitt 1965).

28
Catch trial performance was computed using the number of correct
catch trial responses divided by the total number of catch trials
presented. This value served two purposes: it indicated the overall
reliability of the animal's responses during the session, and served
later on as a criterion for data analysis.
RESULTS
A total of 139 testing sessions was performed during the months
of April, May, and June, 1973. These sessions were distributed over an
intensity range of 170.0 to 0.000017 lux, producing six to twelve complete
and useable sessions at each of the ten intensities.
The mean values of four sessions at each intensity, selected on
best catch trial performance, were used to compile a LO•707 mean for that
specific illuminance. Standard deviations from the compiled means and
average catch trial performance were computed (Table 1). The probable
error (PE) for each intensity's mean was calculated using the value
0.6745 standard error (Table 1) (Peatman 1947; Sokal and Rohlf 1969).
The computed means, plus and minus their respective PE to denote the 50%
confidence response band about these means (Crozier, Wolf and Zerrahn-Wolf
1937 c), have been plotted as a function of luminance (Fig. 9)
A probit function, based on a maximum response value of 32.70 fps
at 170.0 lux was calculated (Table 1) and plotted (Fig. 10). The light
intenSity was converted from incident lux to milliLamberts (Hurvich and
Jameson 1966) to facilitate comparison with other seal psychophysical
data. This plot described a two-branched function with unequal slopes.
29
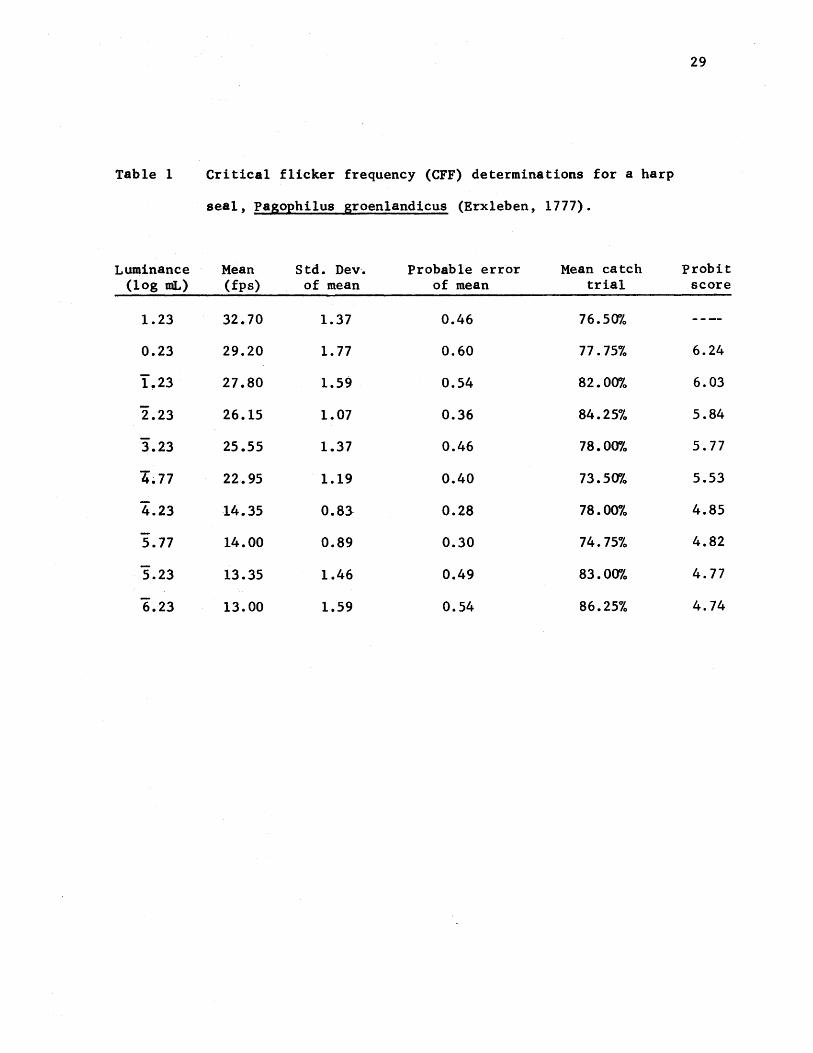
Table 1 Critical flicker frequency (CFF) determinations for a harp
seal, pasophi1us groen1andicus (Erxleben, 1777).
Luminance Mean Std. Dev·. Probable error Mean catch probit (log mL) (fps) of mean of mean trial score
1.23 32.70 1.37 0.46 76.50%
0.23 29.20 1.77 0.60 77.75% 6.24
1.23 27.80 1.59 0.54 82.00% 6.03
2.23 26.15 1.07 0.36 84.25% 5.84
3.23 25.55 1.37 0.46 78.00% 5.77
4.77 22·.95 1.19 0.40 73.50% 5.53
4.23 14.35 0.83· 0.28 78.00% 4.85
5.77 14.00 0.89 0.30 74.75% 4.82
5.23 13.35 1.46 0.49 83.00% 4.77
6.23 13.00 1.59 0.54 86.25% 4.74

Fig. 9
30
Critical flicker frequency in a harp seal, pagophilus
groen1andicus. The line has been fitted by eye. The ordinate
represents the frequency in flashes per second (fps) of the
L thresholds, plotted as a function of luminance. The 0.707
abscissa represents the stimulus intensity in log mi11iLamberts.
Vertical deviations denote the probable error of each LO. 707
threshold.

31
30
FPS
20
10
- 6 - 5 - 4 -3 - 2 -1 0 1
Luminance, log mL
32
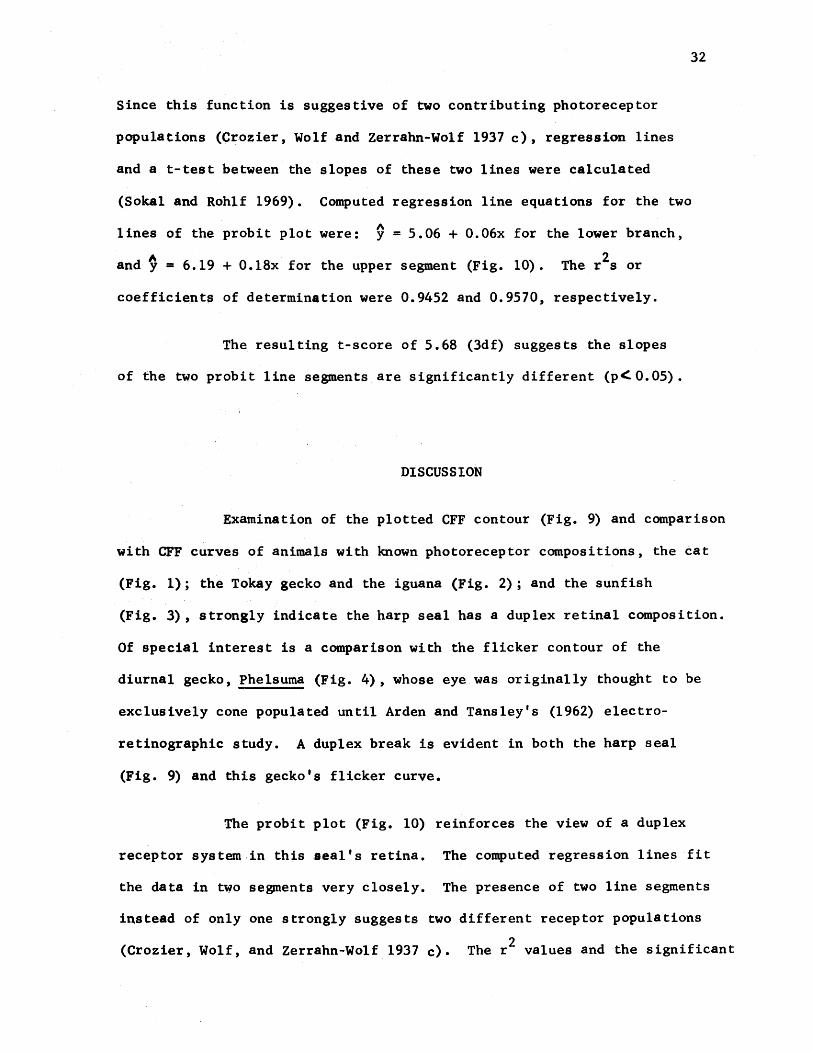
Since this function is suggestive of two contributing photoreceptor
populations (Crozier, Wolf and Zerrahn-Wolf 1937 c), regression lines
and a t-test between the slopes of these two lines were calculated
(Sokal and Rohlf 1969). Computed regression line equations for the two
lines of the probit plot were: 1\ Y = 5.06 + 0.06x for the lower branch,
and ~ = 6.19 + 0.18x for the upper segment (Fig. 10). The r 2s or
coefficients of determination were 0.9452 and 0.9570, respectively.
The resulting t-score of 5.68 (3df) suggests the slopes
of the two probit line segments are significantly different (p<. 0.05) •
DISCUSSION
Examination of the plotted CFF contour (Fig. 9) and comparison
with CFF curves of animals with known photoreceptor compositions, the cat
(Fig. 1); the Tokay gecko and the iguana (Fig. 2); and the sunfish
(Fig. 3), strongly indicate the harp seal has a duplex retinal composition.
Of special interest is a comparison with the flicker contour of the
diurnal gecko, Phelsuma (Fig. 4), whose eye was originally thought to be
exclusively cone populated until Arden and Tansley's (1962) electro-
retinographic study. A duplex break is evident in both the harp seal
(Fig. 9) and this gecko's flicker curve.
The probit plot (Fig. 10) reinforces the view of a duplex
receptor system in this seal's retina. The computed regression lines fit
the data in two se8IDents very closely. The presence of two line segments
instead of only one strongly suggests two different receptor populations
(Crozier, Wolf, and Zerrahn-Wolf 1937 c). The r2 values and the significant

Fig. 10
33
Critical flicker frequency in a harp seal, pagophi1us
groen1andicus, expressed in probits, plotted as a function
of luminance. The ordinate represents the probit values,
derived from the observed CFF thresholds. The abscissa
represents the stimulus intensity in log mi11iLamberts. The
slopes of the two line segments are significantly different
(p < 0.05) •

34
" y= 6.19 + 0.18 x
6
Probits
5 " y = 5.06 +0.06 x
--------4
-7 -6 -5 -4 - 3 - 2 -1 o 1 2
Luminance, log mL

35
result derived from the t-test between the slopes of these two line
segments verify the existence of two photoreceptor populations contributing
to the overall flicker contour.
The compiled means and standard deviations for the L 0.707
thresholds (Table 1) indicate that the operant procedure used in this
experiment is a viable technique of data collection in a free-swimming
harp seal. The small standard deviations, ranging from 0.83 to 1.77
fps, suggest the animal had learned well the necessary paradigm for this
experimental procedure. Each mean was derived from forty threshold
observations; each of the four test sessions used in compiling these means
was made up- of ten runs, each run itself estimating the threshold value.
The entire eFF curve (Fig. 9) is therefore generated from 400 threshold
observations. The catch trial performance for the forty test sessions
ranged from 70% to 97% correct.
The presence of two photoreceptor types in the harp seal
retina has also been suggested by other recent psychophysical data. A
spectral sensitivity analysis of the harp seal (Lavigne and Ronald
1972) indicated a purkinje shift in sensitivity. While purkinje shifts
have been observed in animals with only one morphologically distinct
type of photoreceptor, as well as those wi.th two types (Dodt 1967;
Granit 1943; LaMotte and Brown 1970), the flicker contour obtained in
this experiment strongly suggests the existence of two photoreceptors.
Thus, the purkinje shift observed by Lavigne and Ronald can be thought
to reliably reflect the duplex nature of this animal's retina. In
addition, monochromatic dark adaptation curves have been obtained for this
seal (Lavigne, in preparation). These curves likewise suggest a duplex
retina (Lavigne, personal communication), supporting the CPF results.

36
Further evidence for duplex retinal function is revealed by a pupillary
response experiment using the harp seal (Lavigne and Bernholz, in
preparation). This procedure generated a sigmoid function describing
the interaction between luminance and pupil area. A probit plot of
this function suggests the pupillary response is also tied to a rod-cone
break in adaptation. Differences in the break point of the pupillary
response and the CFF plots may be due to the procedure used.
Functional aspects of this seal's physiology are evident from
its interaction with the environment. The harp seal has been shown
to di.ve as deeply as 275 m (Nansen 1925), as well as remain on ice floes
for three to four weeks at a time (Mansfie.ld 1967). Ice illum~nation
of approximately 35,000 lux is not uncolTlDOn (Lavigne, personal cODlDunication),
while diving to -depths of this magnitude subjects the animal to almost
total darkness. Duntley (1963) has shown that at 520 nm, close to the
peak scotopic sensitivity of the harp seal (Lavigne and Ronald 1972),
only about 0.005% of the light incident at the water's surface penetrates
to 250 m, even assuming zero scattering. Such extremes in illumination
raise the question of whether one photoreceptor type, with or without a
highly mobile pupil, can adequately handle such a range.
Environmental influences can force an animal to adapt in
order to maximize its efficiency. One adaptation to this seal's visual
system has already been shown; the harp seal's peak scotopic sensitivity
of about 525 nm, (Lavigne and Ronald 1972) is very close to the wavelength
with the second lowest attenuation coefficient of those tested by Duntley
(1963). It would be illogical to think that an animal who has evolved
such an excellent deep diving aid as this would not retain cones for
activities on ice floes. Nonetheless, through a light microscopy study

37
and on morphological criteria, Nagy and Ronald (1970) have defined the
, '
harp seal retina as pure rod. However, a further study, using electron
microscopy, has resulted in Nagy stating that the harp seal has a single
class of photoreceptor outer segments, rod-like in appearance, housing
at least two types of photopigments. Those outer segments with pedic1e-
like terminals are thought to mediate Lavigne and Ronald's (1972)
photopic spectral sensitivity responses (Nagy 1971).
The important comparison however is between the harp ~ea1
contour and that of the owl monkey, Aotes trivirgatus, (Fig. 6).
Jones' (1965) light microscopic examination of this monkey's retina
suggested a pure rod photoreceptor population. Subsequently, Hamasaki's
(1967) ,electroretinographic study revealed a duplex flicker contour
(Fig. 6), 'thereby suggesting that Jones' histological conclusions were
erroneous.
Nagy and Ronald (1970), also using light microscopy, stated
that only rod photoreceptors could be found in the harp seal's retina,
adding:
The absence of cone-type photoreceptors in the seal should be stressed. Although pedicle-like receptor terminals, characteristic to that of cones, have been observed, no cone outer segments have been seen using morphologically accepted criteria.
Conclusions of this sort, based on accepted morphological criteria and
not on the animal and its environment, may lead to descriptive errors.
If they had followed the morphological suggestions of pedler (1965),
their "pedicle-like receptor terminals" coupled to rod outer segments
would have suggested receptors similar to those found in the fovea of
the rhesus monkey (pedler 1965). Jamieson and Fisher (1971) used Pedler's
criteria and performed a histological examination of the harbour seal,
38
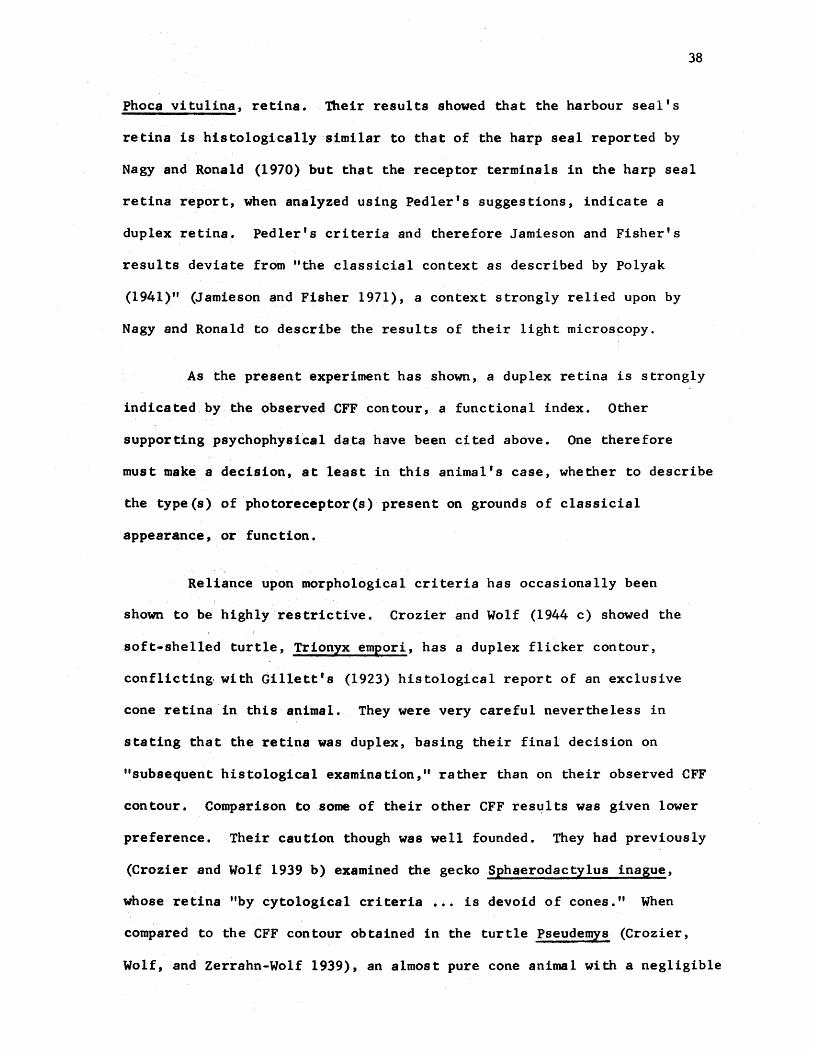
Phoca vitulina, retina. Their results showed that the harbour seal's
retina is histologically similar to that of the harp seal reported by
Nagy and Ronald (1970) but that the receptor terminals in the harp seal
retina report, when analyzed using pedler's suggestions, indicate a
duplex retina. pedler's criteria and therefore Jamieson and Fisher's
results deviate from "the classicial context as described by Polyak
(1941)" (Jamieson and Fisher 1971), a context strongly relied upon by
Nagy and Ronald to describe the results of their light microscopy.
As the present experiment has shown, a duplex retina is strongly
indicated by the observed CFF contour, a functional index. Other
supporting psychophysical data have been cited above. One therefore
must make a decision, at least in this animal's case, whether to describe
the type(s) ofphotoreceptor(s) present on grounds of classicia1
appearance, or function.
Reliance upon morphological criteria has occasionally been
shown to be highly restrictive. Crozier and Wolf (1944 c) showed the
soft-shelled turtle, Trionyx empori, has a duplex flicker contour,
conflicting, with Gillett's (1923) histological report of an exclusive
cone retina in this animal. They were very careful nevertheless in
stating that the retina was duplex, basing their final decision on
"subsequent histological examination," rather than on their observed CFF
contour. Comparison to some of their other CFF res~lts was given lower
preference. Their caution though was well founded. They had previously
(Crozier and Wolf 1939 b) examined the gecko Sphaerodactylus inague,
whose retina "by cytological criteria ••. is devoid of cones." When
compared to the CFF contour obtained in the turtle Pseudemys (Crozier,
Wolf, and Zerrahn-Wolf 1939), an almost pure cone animal with a negligible

amount of rods, Crozier and Wolf found the gecko's CFF curve to be
almost identical. From this evidence they made three statements:
1) ... these observations do not support the idea that a rod retina necessarily functions best at low illuminations, even in a nocturnal animal~
2) Nor is it indicated that a rod retina performs less ably than a cone retina at high illuminations.
3) The danger of associating histological appearance and functional capacity in matters of visual performance is sharply emphasized. (Crozier and Wolf 1939 b).
Crozier and Wolf, with apparent confidence in the reported retinal
composition, thereby rejected basic functional characteristics of rods
39
and of cones' and argued that the problem could not be solved by thinking
the· gecko possessed a "peculiar kind of retinal rod; this merely destroys
the complex accepted conception of rod with which we started" (Crozier
and Wolf 1939 b). Inspection of the CFF contours for these two animals
(Crozier and Wolf 1939 b, pp. 560 and 565) and the probability plot
(p. 563) shows reasons to question the validity of this gecko's
histologically appointed photoreceptor composition, and to firmly accept
their third statement, cited above, though now on functional rather
than morphological grounds.
One consideration missing from this gecko examination was the
transmutation theory of Walls (1942). This theory suggests that,
structurally, 'cones' of some geckoshave evolved into 'rods,' without
changing their cone operational characteristics. Pedler (1965) also
points out the possibility of one class of outer segments retaining the
terminal indicative of the complementary photoreceptor. Pedler and
Tilly (1964) have shown that in some geckos "changes in intracellular
components have evolved, to meet the demands of sensitivity and acuity
by using the facilities of one basic cell variety." Dodt and Jessen's

40
(1961) electroretinographic study of a "nocturnal gecko," Tarentola
mauritanica, in which no Purkinje shift was recorded, resulted in a duplex
flicker contour. Brown and Watanabe (1962 b) in their examination of
the owl monkey, Aotes t:rivirgatus., concluded that Dodt and Jessen's
duplex results were feasible, and that observed rod and cone potentials
from the owl monkey suggested "that functional differences may occur among
receptors which show no differences in structure or contained photopigments."
Such changes in structural versus functional characteristics can and do
occur, and make photoreceptor classification, on the basis of morphological
criteria, at times a very tenuous situation. Some geckos have been forced
to adapt from a diurnal to a nocturnal environment, only later to be
forced back into a dirunal setting (Walls 1942; Underwood 1951; Tansley
1965). Such environmental changes can result in transmutation of retinal
cells, as indicated above. The seal has had to move from the water, onto
land, and subsequently back to the water during its evolution (Harrison
and King 1965; Peterson 1968). These changes might cause anatomical
changes, mandatory to survival, to occur. A resulting photoreceptor
structure however, may no longer be easily identifiable, in the sense
of old (Schultze 1866), intermediate (Polyak 1941), or new (pedler 1965)
morphological criteria.
Kelly (1972), in discussing human spatio-temporal resolution,
suggests that in evolutionary terms the most efficient place to make
bandwidth limitations is at or near the input level. He mentions that a
species would be unlikely to develop an elaborate high frequency collecting
receptor system if, at some later stage in the visual process, this
specific information is always discarE1ed. The actual limitation is most
likely ~'governed by the response of individua 1 receptors or receptive
41
fields" (Kelly 1972). By suggesting that receptor cells, bipolar cells,
and horizontal-bipolar cell combinations each have specific adaptation
exponents, Kelly theorizes that photopic CFF mediation is accomplished
at the retina (Kelly 1971, 1972) and not at some higher site as put
forward by Sperling and Sondhi (1968).
If the photopic temporal resolution limit is set by cones as
indicated by Kelly, the frequencies above -2 log mL in the harp seal
CFF contour (Fig. 9) may also be mediated and limited by coneS. The
high luminance level precludes the possibility of rod interference.
Evi~ence from the rhesus monkey, Macaca mulatta (Gouras and Link 1966;
Gouras 1967) points out that the shorter response time by the cones
(50 versus 150, msec for the rods) controls ganglion cell output when
stimulated at suprathreshold intensities. Still shorter latency is
derived from the faster response speed of the ganglion cell itself under
increasing illumination. As a further complement to this system, it
was shown that the earliest signal to the ganglion cell leaves a transitory
refractory period; stimulation of both rods and cones simultaneously
resul~s in a higher probability of a cone controlled response (Gouras
and Link 1966; Gouras 1967). Whitten and Brown (1973 b) have suggested
that at stimulus intensities generating cone late receptor potentials
with larger than threshold amplitudes, the rod late receptor potentials
are ~o strongly suppressed by this cone stimulation that they disappear.
A cone-rod lateral inhibitory arrangement is hypothesized by these
authors to free the cones from the degrading effect of very slowly
decaying rod potentials at photopic intensities. Once freed, the cones
can then perform at peak temporal resolution rates. At threshold levels,
the same reaction time superiority is displayed by the cones (Gouras 1967).

42
Progressive light adaptation was shown to reduce the effective size of
receptive field centers, agreeing with Hubel and Wiesel's (1960)
findings in the spider monkey (Ateles) fovea that some ganglion cell
receptive field centers may in fact be only the size of single cone
photoreceptors. This shift during light adaptation to smaller receptive
field centers, most likely controlled by cones, plus the faster reaction
ti~ .of ,the ganglion cell itself leads to the increase in temporal
resolution at higher luminances.
Nagy and Ronald (1970) and Nagy (1971) found no area centralis
in the harp seal retina. No midget bipolar or midget ganglion cells,
asso.ciated wi th single cone-controlled receptive field centers should
therefore be evident (Hubel and Wiesel 1960). Also, the ganglion cell
population, relative to the photoreceptor count, was found to be very
low., The .two types of ganglion cells observed, however, had larger
dendritic fields in the periphery and far periphery than in the center
(Nagy 1971), suggesting larger receptive fields in these areas. These
ganglion cells were influenced by bipolar to amacrine to ganglion cell
connections, suggesting that a great deal of visual processing is done
at the retina. Large numbers of interneurons from horizontal cells in
the outer plexiform layer of the harp seal retina may act as the mediators
of a lateral inhibitory arrangement (Brown and Murakami 1968; Whitten
and Brown 1973 b). Care however must be taken in this interpretation;
Steinberg (1969 a, b) has shown that the cone-rod suppression is not as
complete in the cat as it appears in the Macaca investigation of Whitten
and Brown. Caution with relating this suppression to the harp seal
retina is taken from Balliet and Schusterman's (1971) suggestion that
visual acuity in some pinnipeds resemble more closely the visual acuity
of the cat than that of the otter, an evolutionary marine relative of

43
the seal. The disparity between the seal's superior and the otter's
inferior visual acuity is thought to stem basically from the poorer
resolving power of the otter's retina (Balliet and Schusterman 1971).
Complete cone-rod suppression, missing in the cat (Steinberg 1969 a, b),
and possibly in the seal retina, may not be required if sufficient high
resolving retinal elements are present to meet the minimum acuity
requirements of the animal.
While Nagy states that the bipolar cells of the harp seal retina
look like those associated with rod photoreceptors, the amacrine and the
ganglion cells present may not show such affiliation. Work with the
rhesus monkey, Macaca mulatta, indicates that different amacrine cell
types are not exclusively associated with rod or with cone photoreceptor
populations, and that there is no difference in amacrine cell types
between the fovea and parts of the retina where rod bipolar terminals are
found (Boycott and Dowling 1969). Further work on these animals has
suggested that there.are no exclusive rod-responding ganglion cells
(Gouras and Link 1966). If the observations from the rhesus monkey
retina may be applied to the harp seal retina, photoreceptor control of
the ganglion cell may be the important key to the high amount of visual
information processing at the retina thought to be exhibited by this seal.
With the presence of high CFF rates at photopic stimulus levels, the
existence of cone photoreceptors is strongly indicated.
The observed CFF contour (Fig. 9) can therefore be in agreement
with the observed second and especially the third order neurons of the
harp seal retina (Nagy and Ronald 1970; Nagy 1971) but would suggest
that the conclusion that only rod photoreceptors are present (Nagy and
Ronald 1970) is incorrect. A duplex photoreceptor population in the harp

44
seal retina, suggested by Lavigne and Ronald's (1972) spectral sensitivity
results, and by Nagy's (1971) electron microscopy proposals, is supported
by these results.

BIBLIOGRAPHY
Arden, G. B. and Tans1ey, K. 1962. The electroretinogram of a diurnal gecko. J. Gen. Physio1., 45, 1145-61.
Balliet, R. F. and Schusterman, R. J. 1971. Underwater and aerial visual acuity in the Asian "Clawless" otter (Amb1oDyx ciDeria cineria). Nature, 234, 305-6.
Blough, D. 1958. the pigeon.
A method for obtaining psychophysical thresholds from J. Exp. Anal. Behav., 1,31-43.
Boycott, B. B. and Dowling, J. E. 1969. Organization of the primate retina: light microscopy. phil. Trans. R. Soc. B.,~, 109-84.
Brown, K. T. and Murakami, M. 1968. Rapid effects of light and dark adaptation upon the receptive field organization of S-potentia1s and late receptor potentials. Vision Res., ~, 1145-71.
____ and Watanabe, K. 1962 a. Isolation and identification of a receptor potential from the pure cone fovea of the monkey retina. Nature, 193, 958-60.
· --mOiikey. 1962 b. Rod receptor potential from the retina of the night Nature, .ill, 547-50.
_____ ~ and Murakami, M. 1965. The early and late receptor potentials of monkey rods and cones. Cold Spring Harb. Symp. Quant. Bio1., 30, 457-82 •.
Cohen, A. I. 1969. Rods and cones and the problem of visual excitation. In: The Retina, B. R. Straatsma, M. O. Hall, R. A. Allen, and F. Crescite1li, Editors. Univ. of California Press. Berkeley.
Crozier, W·. J. and Wolf, E. 1939 a. The flicker contours of genetica lly related fishes. II. J. Gen. Physio1., 22, 463-86.
______ a 1939 b. The flicker 'response contour for the gecko (rod retina). J. Gen. Physio1., 22, 555-66.
• 1939 c. The flicker response contour for the frog. J. Gen. -Physio1., ll, 229-38.
• 1940 a. Temperature and critical illumination for reaction ---t~ickering light. VI. Flash duration varied. J. Gen. Physio1.,
23, 531-51.
• 1940 b. Reaction to visual flicker in the newt Triturus. ----J:-Gen. Physiol., 23, 667-76.
45

46
________ - 1941 a. The flicker response contour for phrynosoma (horned lizard; cone retina). 'J. Gen. Physiol., 24, 317-24.
· -fInCh. 1941 b. The simplex flicker threshold contour for the zebra J. Gen. Physiol., 24, 625-33.
1942 a. Theory and measurement of visual mechanisms. VIII. ---Theform of the flicker contour. J. Gen. Physio1., 25, 369-79.
_______ • 1942 b. The wavelength sensitivity for the zebra finch. J. Gen. Physio1., 25, 381-90.
. ., 1943. Theo~y and measurement of visual mechanisms. IX. -Flicker relations within the fovea. J. Gen. Physiol., 27,1119-38.
I
I
• 1944 a. Theory and measurement of visual mechanisms. X. ----Modifications of the flicker response contour, and the significance
of the avian pecten. J. Gen. Physiol., 27, 287-313.
________ • 1944 b. Flicker response contours for the sparrow, and the theory of· the avian pecten" .J. Gen. Physio1., 27, 315-24.
• 1944 c. Theory and measurement of visual mechanisms. XII. ----on-;rsual duplexity. J. Gen. Physio1., 27, 513-28.
and Zerrahn-Wo1f, G. 1936. On critical frequency and critical -illumination for response to flickered light. J. Gen. Physio1.,
lQ, 211-28.
___________ • 1937 a. Temperature and critical illumination for reaction to flickering light. II. Sunfish. J. Gen. Physiol., 20, 411-31.
• 1937 b. Critical illumination and flicker frequency in ----rerate~shes. J. Gen. physiol., 21, 17-56.
• 1937 c. Intensity and critical frequency for visual ----f1icker:--J. Gen. Physio1., 21, 203-21.
• 1938 •. Critical illumination and flicker frequency, 8S a ----f~i~f flash duration for the sunfish. J. Gen. Physiol., 21,
313-34.
1939. The flicker response function for the turtle, J. Gen. Physiol., 22, 311-40.
Dodt, E. 1952. Beitrage zur e1ectrophysio1ogie des auges. II. Mitteilung. Ueber hemmungsvorgange in der mensch1ichen retina. Von Graefes Arch. Oph thaI., 153, 152- 62.
___ • 1967. Purkinje-shift in the rod eye of the bush baby, Ga1ago crassicaudatus. Vision Res., 1,509-17.
___ and Enroth, C. 1954. Retinal flicker response in cat. Acta Physio1. Scand., 12,375-90.

__ and Jessen, K. H. i196l. The duplex nature of the retina of the nocturnal gecko as 'reflected in the electroretintogram. J. Gen. Physiol., 44,1143-58.
47
Duntley, S. Q. 1963. Light in the sea. J. Opt. Soc. Amer., 53, 214-33.
Gellerman, L. W. 1932. Chance orders of alternating stimuli in visual discr~ination experiments. J. Genet. Psychol., 42,206-08.
Gillett, W. G. 1923. shelled turtle.
The histological structure of the eye of the softAmer. Jour. Ophthal., &, 955-73.
Gouras, P. 1967. The effects of light-adaptation on rod and cone receptive field organization of monkey ganglion cells. J. Physiol., '192, 747-60 • .,....--
__ and Link, K. 1966. Rod and cone interaction in dark adaptbd monkey ganglion cells. J. Physiol., 184,499-510.
Granit, R. 1935. Two types of retinae and their electrical responses to intermi,t·tent stimuli in light and dark adaptation. J. physiol., 85,421-38.
____ • 1943. The spectral properties of the visual receptors of the cat. Acta Physiol. Scand., 1,219-29.
and Riddell, H. A. 1934. The electrical responses of light- and -dark ... adapted frogs' eyes to rhythmic and continuous stimuli. J.
Physiol., !!" 1-28.
Hamasaki, D. I. 1967. An anatomical and electrophysiological study of the retina of the owl monkey, Aotes trivirgatus. J. Comp. Neurol., 130, 163-74.
Harrison, R. J. and King, J. E. 1965. Marine Mammals. Hutchinson. London •.
Horsten, G. P. M. and Winkleman, J. E. 1962. Comparison of critical fusion frequency in diurna1an4 nocturnal retina of vertebrates. Arch. Intern. Physiol. Biochem., 70, 660-70.
Hubel,D. H. and Wiesel, T. N. 1960. Receptive fields of optic nerve fibers in the spider monkey. J. Physiol., 154,572-80.
Hurvich, L. M. and Jameson, D. 1966. Contemporary Topics in Experimental Psychology. Allyn and Bacon, Inc. Boston.
Jamieson, G. S. and Fisher, H. D. 1971. The retina of the harbor seal, Phoca vitulina. Can. J. Zool., 49, 19-23.
Jones, A. E. 1965. The retinal structure of (Aotes trivirgatus) the owl monkey. J. Compo Neurol., 125, 19-28.
Kelly, D. H. 1971. Theory of flicker and transient responses. I. Uniform fields. J. Opt. Soc. Amer. 61, 537-46.

48
____ • 1972. Adaptation effects on spatio-temporal sine-wave thresholds. Vision Res., 12, 89-101.
LaMOtte, R. H. and Brown, J. L. 1970. Dark adaptation and spectral sensitivity in the cat. Vision Res., 10, 703~16.
Landau, D. and Dawson, w. w. 1970. The histology of retinas from the pinnipedia. Vision Res., 10, 691-702.
Landis, C. 1954. Crozier and Wolf on flicker-fusion, 1933-44. J. Psychol., 37, 3-17.
Lavigne, D. M. and Ronald, K. 1972. The harp seal, pagophilus groenlandicus (Erxleben, 1777). XXIII. Spectral sensitivity. Can. J. Zool., 50, l197-l206.
Mansfield, A. w. 1967. Seals of Arctic and Eastern Canada. Fisheries Research Board of Canada. at tawa.
Meneghin:l, K .. A. and. Hamasaki, D. I. 1967. The electroretinogram of the iguana and Tokay gecko. Vision Res., 1,243-5.
Nagy, A. R •. 1971. A light and electronmicroscopic study of the structure of the retina of the harp seal, Pagophilus groenlandicus (Erxleben, 1777). Ph.D. thesis, Univ. of Guelph.
and Ronald, K. 1970. ----(Erxleben, l777)~ VI.
367-70.
The harp seal, pagophilus groenlandicus Structure of retina. Can. J. zool., 48,
Nansen, F. 1925. Hunting and Adventure in the Arctic. Duffield. New York.
Ordy, J. M. and samorajski, T. 1968. Visual acuity and ERG-CFF in relation to the morphological organization of the retina among diurnal and nocturnal pr~tes. Vision Res., ~, 1205-25.
Peatman, J. G. 1947. Descriptive and sampling Statistics. Harper. New York.
Pedler, C. 1965. Rods and cones - a fresh approach. In: Color Vision. Ciba. Foundation Symposium. A. V. S. De Reuck and J. Knight, Editors. Churchill. London.
and Tilly, R. 1962. The nature of the gecko visual cell. Vision ----Res., ~, 499-510.
Peterson, R. S. 1968. Social behavior in pinnipeds with particular reference to the northern fur seal. In: The Behavior and Physiology of Pinnipeds. R. J. Harrison, R. C. Hubbard, R. S. Peterson, C. E. Rice, and R. J. Schusterman, Editors. Appleton-CenturY-Crofts. N~w York.
Piper, H. 1911. Uber die netzhautstrome. Arch. Anat. Physiol., Lpz. 85-132.

49
polyak, S. 1941. The Retina. Univ. of Chicago Press. Chicago.
Porter, T. C. 1902. Contributions to the study of flicker. II. Proc. Roy. Soc., ~, 313-29.
Ronald, K., Foster, M. E., and Johnson, E. 1969. The harp seal, pagophilus groenlandicus (Erxleben, 1777). II. Physical blood properties. Can. J. Zool., 47, 461-68.
Schaternikoff, M. 1902. Ueber den einfluss der adaptation auf die erscheinung des flimmerns. Z. Psychol., 29, 241-54.
Schultze, M. 1866. Zur anatomie und physiologie der retina. Arch. Mikrosk. Anat. Entw. Mech., ~, 175-286.
Shipley, T. and Fry, A. 1966. Critical flicker fusion perimetry and the adaptation level of the eye. Nature, 211, 1315-17.
Sokal, R. R. and Rohlf, F. J. 1969. Biometry: The Principles and Practice of Statistics in Biological Research. W. H. Freeman. San Francisco.
Sperling, G. and Sondhi, M. M. 1968. Model for visual lUminance discrimination and flicker detection. J. Opt. Soc. Amer., 58, 1133-45.
Steinberg, R. H. 1969 a. Rod-cone interaction in S-potentials from the cat retina. Vision Res., 2, 1331-44 •
• 1969 b. The rod after-effect in S-potentials from the cat retina. ----Vision Res., 2, 1345-55.
Tansley, K. 1961. longinsulae •
The retina of a diurnal gecko, phelsuma madagascariensis Pflugers Arch. ges. Physiol., 272, 262-69.
• 1965. Vision in Vertebrates. Chapman and Hall, Ltd. London.
____ , Copenhauer, R. M. and Gunkel, R. D. 1961. Some aspects of the electroretinographic response of the American red squirrel, Tamiosciurushudsonicus loquax. J. Cell. Camp. Physiol., 57, 11-19.
Tigges, J., Brooks, B. A., and Klee, M. R. 1967. ERG recording of a primate pure cone retina (Tupaia glis). Vision Res., 1,553-63.
Underwood, G. L. 1951. Reptillian retinas. Nature, 1&Z, 183-85.
Von Kries, J. 1903. Uber die wahrnehmung des flimmerns durch normale und durch total farbenblinde personen. Z. Psychol., 32, 113-17.
Walls, G. L. 1942. The Vertebrate Eye and its Adaptive Radiation. Cranbrook Institute of Science. Bloomfield, Michigan. Reprinted 1963 Hafner Publishing Co. New York.
Wetherill, G. B. and Levitt, H. 1965. Sequential ·estimation of points on a psychometric function. Brit. J. Math. and Stat. Psychol., 18, 1-10.

50
Whitten, D. N. and Brown, K. T. 1973 a. The time courses of late receptor potentials from monkey cones and rods. Vision Res., 13, 107-35 •
• 1973 b. Photopic suppression of monkey's rod receptor potential, ----apparently by a cone-initiated lateral inhibition. Vision Res., 13,
1629-58.
Wolf, E. and Zerrahn-Wo1f, G. 1936. Threshold intensity of illumination and flicker frequency for the eye of the sunfish. J. Gen. Physio1., 12, 495-503.

APPENDIX 1
Daily Vitamin Supplement
30 500 mg Sodium chloride tablets. Drug Trading Co., Toronto.
2 10 mcgm Novo-B vitamin B compound with vitamin C capsules. Novopharm Ltd., Toronto.
2 100 mg Thiamine hydrochloride tablets. Empire Laboratories, Toronto.
1 5000 International unit A, 400 International unit D halibut liver oil capsule. Novopharm Ltd., Toronto.
3 400 International unit vitamin E capsules. Empire Laboratores, Toronto.
* * * * *
1 Neo-Maturex Hematopoietic capsule each Wednesday. Ayerst Laboratories, Montreal.
51