Critical Evaluation of Investment Analysis: A Practical ...
5
Asian Journal of Management Sciences 02 (03 (Special Issue)); 2014; 65-69. MPGI International Conference 2014 (MPGIIC-2014 on 28 th &29 th March 2014) Published on: 29-03-2014 Vivek M. Tathod School of Management, Matoshri Pratishthan, Nanded.(M.S), QR Code for Mobile users Critical Evaluation of Investment Analysis: A Practical Approach of Investors *Vivek M. Tathod, ** Dr. Sunil G. Losarwar *School of Management, Matoshri Pratishthan, Nanded.(M.S) **Nandigram Institute of Management Studies, Nanded (M.S) ISSN: 2348-0351 Cite this article as: Vivek M. Tathod, Sunil G. Losarwar. Critical Evaluation of Investment Analysis: A Practical Approach of Investors. Asian Journal of Management Sciences. 02 (03 Special Issue); 2014; 65-69.
Transcript of Critical Evaluation of Investment Analysis: A Practical ...

Asian Journal of Management Sciences 02 (03 (Special Issue)); 2014; 65-69.
MPGI International Conference 2014 (MPGIIC-2014 on 28th &29th March 2014)
Published on: 29-03-2014
Vivek M. Tathod School of Management, Matoshri
Pratishthan, Nanded.(M.S),
QR Code for Mobile users
Critical Evaluation of Investment Analysis: A Practical Approach of Investors
*Vivek M. Tathod, ** Dr. Sunil G. Losarwar *School of Management, Matoshri Pratishthan, Nanded.(M.S) **Nandigram Institute of Management Studies, Nanded (M.S)
ISSN: 2348-0351
Cite this article as: Vivek M. Tathod, Sunil G. Losarwar. Critical Evaluation of Investment Analysis: A Practical Approach
of Investors. Asian Journal of Management Sciences.
02 (03 Special Issue); 2014; 65-69.

Asian Journal of Management Sciences 02 (03) 2014; 65-69.
66
1. Introduction: Investment is the sacrifice of certain present value for the uncertain future reward. It entails arriving at numerous decisions such as type, mix, amount, timing, grade etc. of investment and disinvestment. Further such decision making has not only to be a continuous but rational too. Broadly speaking, an investment decision is a trade-off between risk and return. All investment choices are made at points of time in accordance with the personal investment ends and in contemplation of an uncertain future. Since investment in securities are revocable, investment ends are transient and investment environment is fluid, the reliable bases for reasoned expectations becomes more and more vague as one conceives of the distant future. Investors in securities will, therefore, from time to time, reappraise and re-evaluate their various investment commitments in the light of new information, changed expectations and ends.
Generally speaking, higher the risk undertaken, the more ample the return; conversely, the lower the risk, the more modest the return. In the case of investing in stock, you would demand higher return from a speculative stock to compensate for the higher level of risk.
Asset Classes
Instruments Risk
Cash Savings deposits in a bank,
Liquid Mutual funds Low
Debt
GOI Relief Bonds, Public Provident Fund, National
Savings Certificate, Company Fixed Deposits, Debt-based
Mutual funds ,Debentures/Bonds
Low to Medium, depending on the type
of issuer. In case the issuer is Government, the risk of default is
negligible
Equity Equity-based Mutual Funds
Stocks/shares issued by various companies
High
Table 1: Basic Investment Categories
S.N. Name of Security Rate of Return
(per annum) Income-Tax Concession
1. Post Office Saving Bank a/c 5.50% Exempt under Sec. 10 (15) (ii)
2. Saving Deposits of Commercial Banks 4.5% - do-
3. Public Provident Fund Account (PPF) 12% Exempt under Sec. 10 (11)
4. 10-year Social Security Certificates 11.30% (compounded half yearly) Qualifying for deduction under sec. 80L
5. Post Office Time Deposit Accounts 10-12.5% - do -
6. Bank Fixed Deposits 8- 15% - do -
7. Post Office Recurring Deposits Accounts (Period 5 Years)
13.5% - do -
8. National Savings Scheme (NSS) 11% Investment and income completely exempt, since discontinued.
9. 6-year Post Office Monthly Income Scheme 13% (Payable Monthly) Qualifying for deduction under Sec. 80L
10. Indira Vikas Patra (period 5/1/2 years) 14.% (compounded) No
11. Kisan Vikas Patra 12.67% (compounded) No
12. NSC VIII Issue 12% No
13. Units of UTI/schemes of Mutual Funds 12% variable No Included in 80L exemption
14. Equity shares of Companies Variable 1.Dividend deductible u/s sec. 80L along with others.
2. Provision for a tax rebate at 20% on an investment in eligible equity linked scheme of Rs. 10,000 maximum – a tax rebate of Rs.
2,000
15. Convertible Debentures Variable Taxable
16. Non Convertible Debenture Variable Taxable
17. Fixed Deposits in Companies 12 to 14% Taxable
18. Preference Shares (Redeemable or Cumulative) 14% Dividend deductible under sec. 80L
19. Cumulative Convertible Preference Shares (CCP) 10% - do -
20. Bonds of Public Sector Companies (i) 9-10.5% (ii) 13% and above
Interest is tax-free without any limit Interest is deductible under sec. 80L
Table 2: Various investment avenues available to investors
2. Investment profile of average household: The asset preference of an average Indian household can analyzed from the data on savings estimates of CSO and RBI. The data of RBI provides in particular the
pattern of assets in financial form of the household sector in India. If an average Indian saves Rs. 100, nearly Rs. 40 is set apart for investment in physical assets like consumer durables, housing, real-estate, gold, silver etc. The
Asian Journal of Management Sciences 02 (03) 2014; 65-69.
67
remaining Rs. 60 flows into various forms of financial assets. Taking saving in the financial form, the preferences of the Indian household are such that the investor keeps 11 to 14% of it in cash and currency and 36.43% in bank deposits, which are both riskless assets but with nil return or low returns (0 to 11 percent) There is also a category of contractual savings in the form of insurance, PF and pension funds, whose return is also small or moderate, but are based on the requirements of individual savers. The investment in this category is 24-25 % of total financial savings. 3. Research Methodology The present study is based on primary data, an exploratory in nature, was conducted in Nanded city of Maharashtra. Thus the scope of the study in terms of the geographical area been confined largely to the Nanded city. The selection of the respondents was governed by the principles purposive sampling. In terms of the respondents the scope of the present study has been restricted to analyze the views of 200 respondents. The primary data is collected from various respondents through a questionnaire. Only those respondents have interacted who are interested in investments. The questionnaire is a mix of both close ended and open ended questions. Chi-square test and ANOVA technique were used for the analysis of data 3.1 Statement of the Problem In an investment arena, we must compare the expected return from a given investment with the risk associated with it. Risk and return on investment are directly correlated; higher risk gets a smaller chance of high return and vice versa. That is why, this paper attempts to study the relationship between risk and return of the various investment avenues. The proper assessment and balance of the various risk-return trade-offs is part of creating a sound investment plan. 3.2 Objectives of the Study
To study the behavior pattern of investors while making investment.
To focus on the comparative relationship of various investment avenues.
To highlight the effect of demographic factors on the investment decisions.
To determine the risk-return profile of the investors.
3.3. Hypothesis of the Study: 1) There is a strong association between the Income of
the Individual and the choice of Investment Avenues.
2) Investors prefer return over risk.
3) There is no association between the ranks of the Respondent regarding the Returns from the investment
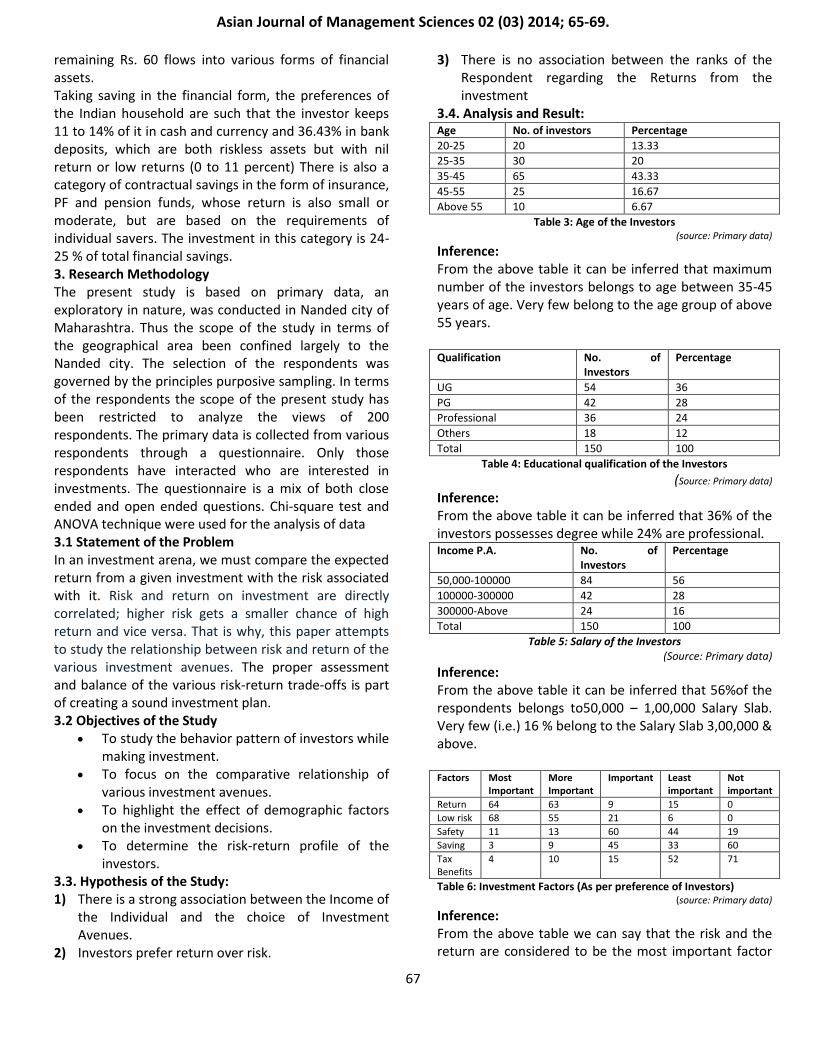
3.4. Analysis and Result: Age No. of investors Percentage
20-25 20 13.33
25-35 30 20
35-45 65 43.33
45-55 25 16.67
Above 55 10 6.67
Table 3: Age of the Investors (source: Primary data)
Inference: From the above table it can be inferred that maximum number of the investors belongs to age between 35-45 years of age. Very few belong to the age group of above 55 years. Qualification No. of
Investors Percentage
UG 54 36
PG 42 28
Professional 36 24
Others 18 12
Total 150 100
Table 4: Educational qualification of the Investors
(Source: Primary data)
Inference: From the above table it can be inferred that 36% of the investors possesses degree while 24% are professional. Income P.A. No. of
Investors Percentage
50,000-100000 84 56
100000-300000 42 28
300000-Above 24 16
Total 150 100
Table 5: Salary of the Investors (Source: Primary data)
Inference: From the above table it can be inferred that 56%of the respondents belongs to50,000 – 1,00,000 Salary Slab. Very few (i.e.) 16 % belong to the Salary Slab 3,00,000 & above. Factors Most
Important More Important
Important Least important
Not important
Return 64 63 9 15 0
Low risk 68 55 21 6 0
Safety 11 13 60 44 19
Saving 3 9 45 33 60
Tax Benefits
4 10 15 52 71
Table 6: Investment Factors (As per preference of Investors) (source: Primary data)
Inference: From the above table we can say that the risk and the return are considered to be the most important factor

Asian Journal of Management Sciences 02 (03) 2014; 65-69.
68
for an investment about 42% have said that returns are also plays a major role while taking the decision of investment. Safety, Savings and Tax benefits are also taken into consideration for making an investment decision. Investment Factors: Ranks by investors
Plans Risk Return
Stocks 1 1
Mutual Fund 2 2
Insurance 3 3
Fixed Deposits 5 4
Gilt securities 4 5
Table 7: Risk &Return in various Avenues (Source: Primary data)
Inference: From above table we can say that stocks, mutual funds and insurance possess same ranks in terms of risk and return. While fixed deposits and gilt-edge securities posses different ranks. 3.5 Statistical Analysis: Chi-Square Test: It is used to know whether the choices of the investments are made according to the income of the individual. Hypothesis: Ho: There is no association between the Income of the Investor and the choice of Investment Avenues. H1: There is association between the Income of the Investor and the choice of Investment Avenues.
Avenues Salary Slab Total
50,000-100,000
100,000-300,000
Above 300,000
Insurance 5 2 9 16
Stocks 0 6 10 16
Mutual Fund 19 3 12 34
Gilt Securities
3 6 5 14
Real estate 0 2 8 10
Gold 3 5 7 15
Fixed Deposits
30 6 9 45
Total 60 30 60 150
Table 8: Income of Investor and Choice of Investment Avenues (source: Primary data)
D.F. Chi-square
calculated Chi-square table value@5%level
(c-1)(r-1)=12 60.63 21
Inference: As calculated value of x2isgreater than the table value at 5% level of significance for 12 d.f. so we reject the null hypothesis and conclude that there is association between the Income of the Investor and the choice of Investment Avenues. One-Way ANOVA:
It is used in order to find whether the ranks given by the investors with respect to Risk for the Investments have any association or not. Avenues/Ranks 1 2 3 4 5
Stocks 61 59 30 0 0
Insurance 30 17 43 15 45
Mutual Fund 59 61 30 0 0
Gilt securities 0 13 32 75 30
Fixed Deposits 0 0 15 60 75
Table 9: Investment Avenues and rank for risk (source: Primary data)
Source of variation
SS DF MS F-Ratio F@5% for(4,20)d.f.
Between the Ranks
1435.5 4 1435.5/4 = 358.87
F=358.8/ 301.7 =1.189
F=5.80 (Table Value)
Within the Ranks
6035 20 6035/20 =301.75
Total 40095 24
Table 10: ANOVA Table
Inference: From the F-table at 5% significance level for (4, 20) degrees of freedom the critical value is 5.80. As calculated value of ‘F’ is Less than Critical value of ‘F’ so, we accept the Null Hypothesis. And conclude that there is no association between the ranks of the individuals with respect to Risk for Investment. One-Way ANOVA: It is used in order to find whether the ranks given by the investors with respect to Return in the investment have any association or not. Hypothesis: Ho: There is no association between the ranks of the Respondent regarding the Returns from the investment H1: There is association between the ranks of the Respondent regarding the Returns from the investment Avenues/Ranks 1 2 3 4 5
Stocks 58 62 30 0 0
Insurance 32 15 40 18 45
Mutual Fund 60 60 30 0 0
Gilt securities 0 13 30 72 35
Fixed Deposits 0 0 20 60 70
Table 11: Investment Avenues and rank for Return (source: Primary data) Source of variation
SS DF MS F-Ratio F@5% for(4,20)d.f.
Between the Ranks
1435.5 4 1435.5/4 = 358.87
F= 358.87/985.1 =0.36
F=5.80 (Table Value)
Within the Ranks
19702 20 19702/20 =985.1
Total 21137.5 24
Table 12: ANOVA Table

Asian Journal of Management Sciences 02 (03) 2014; 65-69.
69
Inference: From the F-table at 5% significance level for (4, 20) degrees of freedom the critical value is 5.80. As calculated value of ‘F’ is Less than Critical value of ‘F’ so, we accept the Null Hypothesis. And conclude that there is no association between the ranks of the individuals with respect to Risk for Investment. 4.Conclusions: From the above study we can conclude that: 1) The investor is looking Risk and Return as foremost factors in investment. 2) From the ANOVA table we can infer that Stock and Mutual fund ranks first both on Risk and Return 3) The bank fixed deposits and government securities are most favorable among all the investors. 4) From chi-square table there we can say that there is a association between the Income of the Investor and the choice of Investment Avenues. 5) Income level plays a great deal while selecting investment avenues. Generally high income investors prefers risky investment instrument, while low income investor prefers low risky investment avenues. References: 1. Devkumar , V.K. Indian stock market, Institute for Finance
Management and research, Madras.
2. S. Hariharan, 2003. Indian Mutual Fund Industry-The present Scenario, Southern Economist, 41(2).
3. Preeti Singh, Investment Management, Himalaya Publishing House, Eleventh Edition, 2003.
4. V. K. Bhalla, Investment Management, Security Analysis and Portfolio Management, S. Chand Publications, Seventh Edition, 2010.
Websites: www.bajajcapital.com www.sify.com www.surfindia.com www.indiamart.com