Critical Analysis of Conventional Transport Economic Evaluation
25
www.vtpi.org [email protected] Phone & Fax: 250-360-1560 Todd Litman 2013 You are welcome and encouraged to copy, distribute, share and excerpt this document and its ideas, provided the author is given attribution. Please send your corrections, comments and suggestions for improvement. Critical Analysis of Conventional Transport Economic Evaluation 30 September 2013 Todd Litman Victoria Transport Policy Institute Abstract Transportation economic evaluation refers to the process of quantifying and monetizing a transport policy or project’s benefits and costs. How it is performed can significantly influence transport planning decisions. This report critically examines conventional evaluation practices. Conventional transport economic evaluation primarily monetizes changes in vehicle travel speeds and operating costs; it overlooks other impacts and objectives (parking costs, vehicle ownership costs, mobility for non-drivers, public health, and induced travel impacts), and other accessibility factors (the quality of transport options, roadway connectivity and geographic proximity). It seldom measures the economic efficiency gains from strategies that favor higher value trips and more efficient modes, or the consumer surplus benefits of accommodating latent demand. This analysis indicates that conventional transport economic evaluation has significant omissions and biases that favor mobility over accessibility, and automobile travel over other modes. Various reforms described in this report can result in more comprehensive and multi- modal evaluation.
Transcript of Critical Analysis of Conventional Transport Economic Evaluation

www.vtpi.org
Phone & Fax: 250-360-1560
Todd Litman 2013
You are welcome and encouraged to copy, distribute, share and excerpt this document and its ideas, provided the author is
given attribution. Please send your corrections, comments and suggestions for improvement.
Critical Analysis of Conventional Transport Economic Evaluation
30 September 2013
Todd Litman Victoria Transport Policy Institute
Abstract Transportation economic evaluation refers to the process of quantifying and monetizing a transport policy or project’s benefits and costs. How it is performed can significantly influence transport planning decisions. This report critically examines conventional evaluation practices. Conventional transport economic evaluation primarily monetizes changes in vehicle travel speeds and operating costs; it overlooks other impacts and objectives (parking costs, vehicle ownership costs, mobility for non-drivers, public health, and induced travel impacts), and other accessibility factors (the quality of transport options, roadway connectivity and geographic proximity). It seldom measures the economic efficiency gains from strategies that favor higher value trips and more efficient modes, or the consumer surplus benefits of accommodating latent demand. This analysis indicates that conventional transport economic evaluation has significant omissions and biases that favor mobility over accessibility, and automobile travel over other modes. Various reforms described in this report can result in more comprehensive and multi-modal evaluation.

Critical Analysis of Conventional Transport Economic Evaluation Victoria Transport Policy Institute
2
Introduction Transportation systems are partnerships between governments and users: governments planning
decisions determine the transport options available, from which users choose the combination
that best meets their needs. This report investigates whether commonly-use transport planning
practices result in the set of options that best meet user and community needs. In particular, it
investigates whether conventional evaluation practices are biased in ways that favor mobility
(increased traffic speed) over other planning objectives, and automobile travel over other modes.
Transportation economic evaluation refers to the process used to quantify and monetize (measure
in monetary units) a transport policy or project’s impacts (benefits and costs). How such
evaluations are performed can significantly influence planning decisions: a policy or project may
seem desirable using one evaluation framework but undesirable according to another.
This is a timely issue. Conventional transport economic evaluation methods developed during a
period when vehicle travel was growing rapidly so transport planning consisted primarily of
roadway expansion. These methods were suitable for answering relatively simple questions, such
as whether a highway project can repay its construction costs through travel time and vehicle
operating cost savings. They consider a relatively narrow range of modes, objectives and
impacts, and so are unsuited for evaluating the more complex tradeoffs required for urban
transport planning and strategic policy analysis. Economic evaluation is just one part of the
transport planning process – decisions are also influenced by political factors, public input and
funding practices, and many transport modelers, planners and economists are working to develop
more comprehensive and multi-modal evaluation methods, but these improvements are
incremental; there are still significant omissions and biases in most evaluation frameworks. It is
important that people who use evaluation results understand these problems.
This report investigates these issues. It critically examines transport economic evaluation
methods, identifies their omissions and biases, and discusses how these are likely to affect
transport policy and planning decisions. It identifies specific ways to make transport evaluation
more comprehensive and multi-modal. This critique should be of interest to anybody involved in
transport economic evaluation and planning.
Economic Impacts
Infrastructure cost savings
Travel time savings
Vehicle operating savings
Energy conservation
Traffic safety
Improved public health
Pollution reduction
Habitat preservation

Critical Analysis of Conventional Transport Economic Evaluation Victoria Transport Policy Institute
3
The Conventional Evaluation Framework An evaluation framework defines the analysis scope, that is, the impacts, objectives, options,
activities, geographic area, and other factors that are considered in the evaluation process.
Impacts can be defined as problems (what you don’t want) or their opposite, goals (general
things that you ultimately want) and objectives (specific ways to achieve goals). For example, if
crashes are a problem then safety can be considered an objective, and reducing crash rates can be
considered an objective. The terms problems and objectives are more qualitative, costs and
benefits are more quantitative, as illustrated below.
Table 1 Ways to Describe An Impact
Negative Positive
Qualitative Problem Goal/Objective
Quantitative Cost Benefit
Cost, Benefit, Problem and Objective are different ways to describe an impact.
Conventional transport economic evaluation uses relatively narrow scope: it primarily considers
government costs, travel time (and therefore congestion delay), vehicle operating costs, plus
crash and emission rates (Markow 2012; SHRP 2012; TEC 2012). Table 2 summarizes the scope
of various evaluation tools. Although none is truly comprehensive, some newer tools (TREDIS,
PECAS and RUBMRIO), consider a broader range of impacts (Weisbrod and Reno 2009).
Table 2 Transport Economic Evaluation Tools (Ellis, Glover and Norboge 2012)
This table summarizes various
tools used to evaluate
transport policy and project
economic impacts. Note that
many (CDSS, HEEM-III,
LEAP, MicroBenCost,
REIMHS, REIMS and SPASM)
are outdated and should not be
used, others (SMITE, SCRITS
and Highway 1) are very
specialized, HEAT is an
example of a state-specific
REMI shell program (other
states have similar versions)
and EMME3 is an example of
a travel demand forecasting
model, not an economic model.
The box on the following page
describes the general
capabilities and limitations of
the various types of models.

Critical Analysis of Conventional Transport Economic Evaluation Victoria Transport Policy Institute
4
Choosing Economic Analysis Software – Overview of Model Tools By Glen Weisbrod, Economic Development Research Group (www.edrgroup.com/library/economic-
impact-analysis/overview-of-economic-impact-models-a-tools-for-transportation-analysis.html)
Input-output (I-O) models calculate the economic development impacts (jobs, income and GDP)
resulting from changes in regional business activity. For instance, they can be used to calculate the
impacts of a new or expanded airport, power plant or construction activity. However, they have no long-
term forecasting dimension, and no internal ability to forecast impacts of changes in transport costs or
market access. For the US, the most commonly used RIMS-II and IMPLAN. For Canada, Statistics
Canada offers provincial level models. More specialized models are also available.
Economic impact forecasting models are more comprehensive evaluation tools that calculate changes in
business attraction as well as growth. They incorporate I-O models and add capabilities to calculate the
economic growth consequences of changes in household and business costs (due to travel time and travel
cost changes). Newer ones also calculate impacts of changes in market access and trade over time. For the
US and Canada, the most commonly used are REMI and TREDIS. Both are multi-regional, spatial
economic models that can also tax revenue impacts and social benefit-cost measures. Other models with
more limited or specialized uses are also available.
Land use models forecast change in the location patterns of population, employment, housing and
business activities. The newer versions are sometimes referred to as spatial input-output models because
they base their allocation of business growth on I-O models, with greater spatial detail and less industry
detail. They account for market access but not business attraction, because they assume fixed regional
growth. Examples of land use models in current use are TRANUS, MEPLAN, MetroSim, UrbanSim,
Delta and PECAS.
User benefit/cost models are designed to help engineers and planners identify, rate and select optimal
highway projects. They assess highway improvement benefits travel speed and delay, safety, and
sometimes emissions rates. They do not consider economic development impacts, although some of their
impacts are incorporated into forecasting models. BCA.net provides project level analysis. HERS-ST
assesses statewide highway investment needs and project priorities. LCCA evaluates facility lifecycle
costs. Other widely recognized benefit-cost tools used by state DOTs are CalBC and NetBC. A variety of
other transportation planning tools are also available.
Economic development tools are models and datasets designed to assist in business attraction and site
location decisions. BizCosts, LocationSelector and FacilityLocations, Site Selector Pro and LEAP all
compare alternative locations in terms of business operating costs, market conditions, labor force, land,
transportation access, etc. They can assist businesses in making site location decisions for new facilities,
and economic developers can use them to identify relative their area’s strengths, weaknesses and best
targets for business attraction. They generally consider transportation access in limited terms, such as
distance to nearest interstate highway and airport.

Critical Analysis of Conventional Transport Economic Evaluation Victoria Transport Policy Institute
5
Critique of Conventional Evaluation This section investigates how well conventional evaluation considers various impacts and factors.
Comprehensive Evaluation To provide accurate results, economic evaluation must consider all significant impacts. Table 3
indicates the degree that various planning objectives are considered in conventional evaluation.
Table 3 Transport Planning Objectives
Objective Consideration In Conventional Evaluation
Congestion reduction, increased
mobility
Generally considered – often a dominant impact
User convenience and comfort Sometimes considered in roadway planning to justify paving, and in transit
planning to increase ridership, but not generally considered an end itself
Roadway cost savings Generally considered
Parking cost savings Often ignored in transport planning but considered in other types of planning
User cost savings &
affordability
Vehicle operating costs and transit fares usually considered, but vehicle ownership
costs are often ignored
Disadvantaged people’s
accessibility
Universal design and basic public transit services are often considered planning
objectives, but other impacts on disadvantaged people’s access is ignored
Traffic safety Generally considered, but measured per vehicle-mile,
Energy conservation Sometimes considered, but measured per vehicle-mile
Air emission reductions sometimes considered, but measured per vehicle-mile
Efficient land use Not generally considered in individual transport plans
Public fitness and health Not generally considered in individual transport plans
Only a portion of common transport planning objectives are considered in conventional evaluation. Some
impacts are measured per unit of travel which ignores the incremental costs of induced vehicle travel.
Table 4 summarizes the results. Several potentially significant impacts are often overlooked.
These overlooked impacts are sometimes called intangibles, with the implication that they are
difficult to measure and modest in magnitude, and so can be legitimately ignored. However, they
can be quantified and are often significant compared with commonly considered impacts (Litman
2009). For example, UK and New Zealand transport agencies provide guidance on methods for
monetizing parking costs, habitat preservation, changes in mobility options for disadvantaged
people, changes in public fitness, and option value (DfT 2006; NZTA 2010).
Table 4 Impacts Monetized in Conventional Transport Economic Evaluation
Usually Considered Often Overlooked
Financial costs to governments
Travel speed (reduced congestion delays)
Vehicle operating costs (fuel, tolls, tire wear)
Per-mile crash risk
Project construction environmental impacts
Downstream congestion
Parking costs
Vehicle ownership costs
Disadvantaged people’s accessibility
Delay to non-motorized travel (barrier effect)
Noise and water pollution
Strategic development impacts
Public fitness and health
Conventional transportation economic evaluation tends to monetize a limited set of impacts.

Critical Analysis of Conventional Transport Economic Evaluation Victoria Transport Policy Institute
6
Figure 1 illustrates the estimated magnitude of various impacts. Many of the often-overlooked
impacts are significant in magnitude compared with impacts that are generally considered. For
example, conventional evaluation generally ignores vehicle ownership, most parking costs, some
accident costs (crashes that result from induced vehicle travel), land use impacts, resource
externalities (fuel production economic and environmental costs not borne directly by users) and
roadway land value (the value of land devoted to road rights of way), all impacts that are
relatively easy to monetize.
Figure 1 Automobile Costs (Litman 2009)
$0.00
$0.05
$0.10
$0.15
$0.20
$0.25
$0.30
Vehicle Ownership
Crash Damages
Vehicle Operatio
n
Parking
Road Facilities
Land Use Im
pacts
Congestion
Resource Externaliti
es
Air Pollu
tion
Land Value
Greenhouse Gas
Water P
ollutio
n
Barrier E
ffect
Traffic S
ervicesNoise
Waste
Do
lla
rs P
er
Ve
hic
le-M
ile
Often Overlooked
Generally Considered
Conventional transport economic evaluation generally considers congestion, roadway, vehicle operation,
and some accident and air pollution costs. Other impacts are often overlooked.
Effects on Planning Decisions
These omissions can significantly affect planning decisions (Henderson 2011). For example,
ignoring vehicle ownership and parking costs tends to significantly undervalue planning
decisions that allow households to reduce their vehicle ownership, and ignoring objectives to
improve accessibility for non-drivers and increased public fitness and health undervalues
walking, cycling and public transit improvements.
Needed for More Comprehensive Evaluation
Comprehensive and multi-modal evaluation should quantify, and as much as possible monetize,
all significant impacts, including downstream congestion, parking costs, vehicle ownership,
delay to non-motorized travel (barrier effect), noise and water pollution, impacts on
disadvantaged people’s accessibility, option value, strategic development impacts and public
fitness and health.

Critical Analysis of Conventional Transport Economic Evaluation Victoria Transport Policy Institute
7
Multi-modal, Accessibility-Based Analysis Conventional evaluation tends to evaluate transport system performance based on mobility
(physical movement), using indicators such as roadway level-of-service, traffic speed and delay.
This assumes that the main planning goal is to maximize travel speeds, so faster transport options
are better than slower options. However, mobility is seldom an end in itself, the ultimate goal of
most travel activity is accessibility, which refers to people’s overall ability to reach desired
services and activities. Several factors affect accessibility (CTS 2010; Litman 2003):
Motor vehicle travel conditions. Vehicle traffic speeds, safety and affordability.
Quality of other modes. The quality (speed, convenience, comfort, affordability and safety) of
walking, cycling, public transit, telecommunications and delivery services.
Transport network connectivity. The density of connections between paths, roads and public
transit, and therefore the directness of travel between destinations (Figure 2).
Geographic proximity. Land use density and mix, and therefore distances between activities.
Planning decisions often involve tradeoffs between various accessibility factors. For example,
expanding roads to increase traffic speeds tends to degrade non-motorized travel conditions
(called the barrier effect), while walking, cycling and public transit improvements such as
additional crosswalks, traffic calming, bike lanes and bus lanes often reduce vehicle traffic speed
and sometimes on-street parking supply. Increasing block lengths, reducing intersections, and
one-way streets tend to increase traffic speeds but reduce connectivity which increases travel
distances. Locations along major highways tends to be convenient for automobile access but
difficult to reach by other modes, while central locations tend to be more convenient to access by
walking and transit, but have more intense traffic and parking congestion.
Figure 2 Roadway Connectivity Impacts on Accessibility and Safety
Although points A and B are approximately the same distance apart in both maps, the functional travel
distance is nearly three times farther with the poorly-connected, hierarchical road network. Because it
forces most trips onto major roads a hierarchical network tends to increase total traffic congestion and
accident risk, particularly where vehicles turn on and off major arterials (red circles).
Critical Analysis of Conventional Transport Economic Evaluation Victoria Transport Policy Institute
8
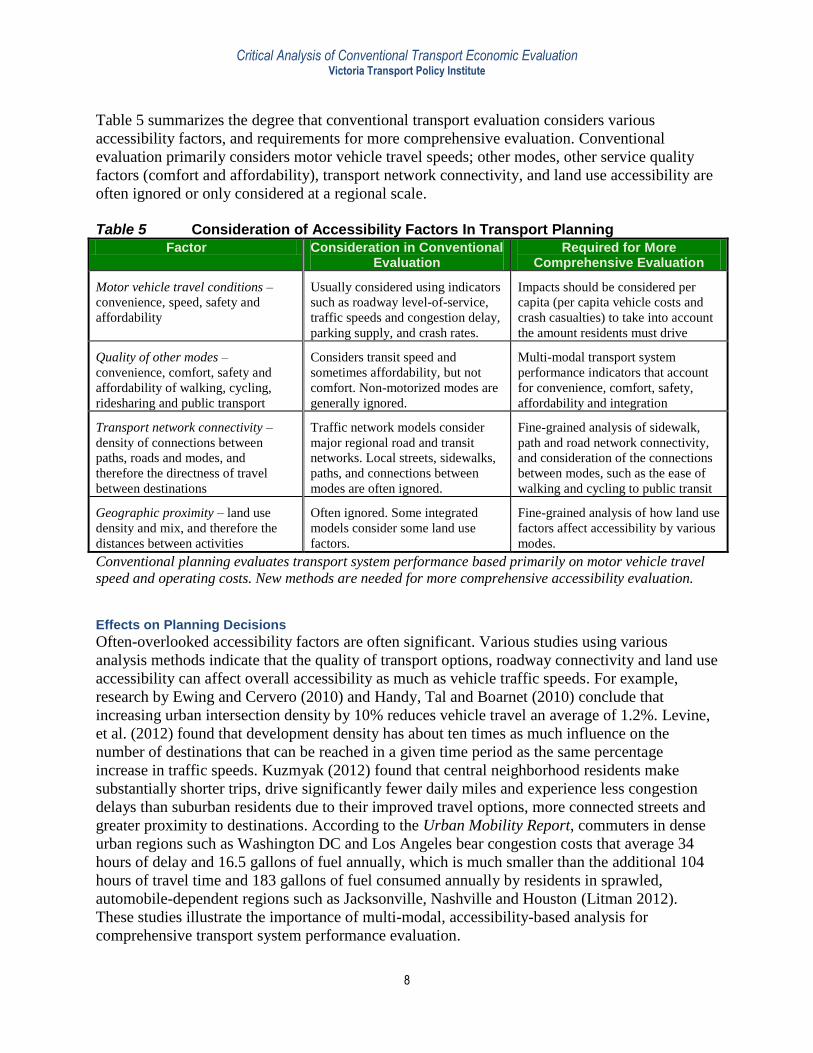
Table 5 summarizes the degree that conventional transport evaluation considers various
accessibility factors, and requirements for more comprehensive evaluation. Conventional
evaluation primarily considers motor vehicle travel speeds; other modes, other service quality
factors (comfort and affordability), transport network connectivity, and land use accessibility are
often ignored or only considered at a regional scale.
Table 5 Consideration of Accessibility Factors In Transport Planning
Factor Consideration in Conventional Evaluation
Required for More Comprehensive Evaluation
Motor vehicle travel conditions –
convenience, speed, safety and
affordability
Usually considered using indicators
such as roadway level-of-service,
traffic speeds and congestion delay,
parking supply, and crash rates.
Impacts should be considered per
capita (per capita vehicle costs and
crash casualties) to take into account
the amount residents must drive
Quality of other modes –
convenience, comfort, safety and
affordability of walking, cycling,
ridesharing and public transport
Considers transit speed and
sometimes affordability, but not
comfort. Non-motorized modes are
generally ignored.
Multi-modal transport system
performance indicators that account
for convenience, comfort, safety,
affordability and integration
Transport network connectivity –
density of connections between
paths, roads and modes, and
therefore the directness of travel
between destinations
Traffic network models consider
major regional road and transit
networks. Local streets, sidewalks,
paths, and connections between
modes are often ignored.
Fine-grained analysis of sidewalk,
path and road network connectivity,
and consideration of the connections
between modes, such as the ease of
walking and cycling to public transit
Geographic proximity – land use
density and mix, and therefore the
distances between activities
Often ignored. Some integrated
models consider some land use
factors.
Fine-grained analysis of how land use
factors affect accessibility by various
modes.
Conventional planning evaluates transport system performance based primarily on motor vehicle travel
speed and operating costs. New methods are needed for more comprehensive accessibility evaluation.
Effects on Planning Decisions
Often-overlooked accessibility factors are often significant. Various studies using various
analysis methods indicate that the quality of transport options, roadway connectivity and land use
accessibility can affect overall accessibility as much as vehicle traffic speeds. For example,
research by Ewing and Cervero (2010) and Handy, Tal and Boarnet (2010) conclude that
increasing urban intersection density by 10% reduces vehicle travel an average of 1.2%. Levine,
et al. (2012) found that development density has about ten times as much influence on the
number of destinations that can be reached in a given time period as the same percentage
increase in traffic speeds. Kuzmyak (2012) found that central neighborhood residents make
substantially shorter trips, drive significantly fewer daily miles and experience less congestion
delays than suburban residents due to their improved travel options, more connected streets and
greater proximity to destinations. According to the Urban Mobility Report, commuters in dense
urban regions such as Washington DC and Los Angeles bear congestion costs that average 34
hours of delay and 16.5 gallons of fuel annually, which is much smaller than the additional 104
hours of travel time and 183 gallons of fuel consumed annually by residents in sprawled,
automobile-dependent regions such as Jacksonville, Nashville and Houston (Litman 2012).
These studies illustrate the importance of multi-modal, accessibility-based analysis for
comprehensive transport system performance evaluation.

Critical Analysis of Conventional Transport Economic Evaluation Victoria Transport Policy Institute
9
Congestion Costing Methods Conventional transport planning places considerable weight on congestion costs: Congestion is
often assumed to be the primary transportation problem and congestion reductions are often the
primary benefit of urban transport system improvements. As a result, how congestion costs are
calculated can significantly affect urban transport planning decisions. Table 6 summarizes
economists’ recommendations for key congestion costing factors.
Table 6 Congestion Costing Factors (TC 2006; Wallis and Lupton 2013)
Evaluation Factor Economists’ Recommended Practices
Baseline speeds – the traffic speed below which
congestion costs are calculated.
Capacity maximizing traffic speeds, which is
typically about level-of-service C.
Travel time unit costs – the dollars per hour or cents per
minute used to calculate delay costs.
30-50% of average wages for personal travel time
Speed-emission curve – changes in fuel consumption and
emissions caused by traffic speed changes.
Use a U-shaped curve which recognizes that
emissions minimize at moderate (40-50 mph) speeds.
Generated traffic impacts – the increase in vehicle travel
that results if congested roadways are expanded, and
resulting incremental external costs.
Incorporate generated and induce travel in modeling,
and account for incremental external costs including
downstream congestion, crashes and pollution.
Various factors affect how congestion costs are calculated.
Conventional economic evaluation often uses congestion costing methods that do not reflect
recommended practices; they use freeflow (i.e., level-of-service A) baseline speeds, upper-bound
travel time unit costs, and constantly-declining speed emission curves (they assume that increase
in traffic speeds reduces fuel consumption and emissions), and they ignore generated traffic
impacts (Litman 2013). This exaggerates congestion costs relative to other impacts and the
benefits of highway capacity expansion compared with other transport improvement options.
Effects on Planning Decisions
Inaccurate congestion costing can significantly skew planning decisions, particularly because
urban transport planning often involves tradeoffs between traffic speed and other objectives such
as safety, affordability and improved mobility for non-drivers. For example, exaggerating
congestion costs can result in congestion reduction strategies that increase accidents and reduce
non-drivers’ accessibility, and exaggerating roadway expansion congestion reduction benefits
favors urban highway investments over public transit service improvements. Such decisions
increase automobile-dependency and reduce transport system diversity.
Needed for More Comprehensive Evaluation
Accurate congestion costing should reflect the practices recommended by economists including
optimal baseline speeds, reasonable travel time unit costs, U-shaped speed-emission curves, and
consideration of roadway expansion generated traffic impacts (Litman 2013; TC 2006; Wallis
and Lupton 2013).

Critical Analysis of Conventional Transport Economic Evaluation Victoria Transport Policy Institute
10
Generated and Induced Travel Impacts Generated traffic refers to the additional vehicle travel that occurs when a roadway is improved,
such as if a congested urban highway is expanded. Induced travel reflects the portion of
generated traffic that represents net increases in vehicle travel, ignoring route and time shifts.
Generated traffic and induced travel have three types of impacts that should be considered in
transport economic evaluation (Litman 2001; Noland and Hanson 2013):
1. It reduces congestion reduction benefits.
2. It increases external costs such as downstream congestion, parking subsidies, accidents, energy
consumption, pollution emissions and sprawl.
3. It provide additional user benefits (consumer surplus), which tends to be modest since it consists
of marginal value vehicle travel that users most willingly forego if congestion delays increase.
Conventional transportation evaluation models incorporate some, but not all, generated traffic
and induced travel effects. For example, most traffic models account for shifts in travel route,
mode and destinations, but not changes in trips frequency or changes in future land use
development (highway expansions tend to encourage more urban fringe, sprawled development,
while public transit improvements tend to encourage more central, compact development). Few
traffic models accurately predict induced vehicle travel or account for their incremental costs
such as changes in downstream congestion, parking costs, vehicle ownership costs, accidents,
and pollution emissions that result from induced vehicle travel. Also, few evaluation models
explicitly account for changes to users’ consumer surplus from changes in their vehicle travel.
Effects on Planning Decisions
Ignoring Generated Traffic effects tends to overstate roadway expansion and undervalues
improvements to alternative modes and Transportation Demand Management strategies. A
roadway expansion project that appears to provide positive economic returns when generated
traffic impacts are ignored may turn out to have smaller or negative economic returns when
generated traffic is accurately considered. Models that fail to consider generated traffic tend to
overvalue roadway capacity expansion benefits by 50% or more (Litman 2001; Williams and
Yamashita 1992).
Needed for More Comprehensive Evaluation
Traffic models should predict all impacts from capacity expansion, including shifts in route,
mode, time, destination, and land use development patterns, and identify induced travel (net
increases in total vehicle travel). Economic evaluation should account for these changes when
evaluating congestion reduction benefits (which tend to decline) and external costs (which tend
to increase) when generated and induced travel are accurately evaluated.

Critical Analysis of Conventional Transport Economic Evaluation Victoria Transport Policy Institute
11
Social Equity Analysis Social equity refers to the distribution (also called incidence) of impacts, and whether it is
considered fair. There are three general categories of transport equity (Litman 2002):
Horizontal equity (also called fairness or egalitarianism) concerns whether individuals and groups
with similar needs and abilities are treated similarly. It implies that costs should be borne by users
unless a subsidy is specifically justified (i.e., the “user pays principle”).
Vertical equity with regard to income considers the allocation of costs between different income
classes, assuming that public policies should favor people who are economically disadvantaged.
Policies that provide a proportionally greater benefit to lower-income groups are called
progressive, while those that make lower-income people relatively worse off are called regressive.
Vertical equity with regard to mobility need and ability considers whether a transport system
provides adequate service to people who are mobility disadvantaged. It justifies universal design
and special mobility services for people with disabilities or other mobility constraints.
Various tools can be used to evaluate these impacts (Forkenbrock and Weisbrod 2001). Although
equity impacts are often considered at other stages in the planning process, they are seldom
quantified and monetized in economic evaluation.
Effects on Planning Decisions
To the degree that it favors faster travel, conventional evaluation tends to favor motorists over
pedestrians, cyclists and transit users, and therefore more affluent and able transport system users
over physically and economically disadvantaged people. For example, when evaluating a
potential roadway expansion, conventional economic analysis monetizes motorists’ time and
vehicle operating cost savings but not the additional delay and risk to pedestrians and cyclists,
and therefore reduction in transport options available to non-drivers.
Needed for More Comprehensive Evaluation
Various techniques exist for evaluating transportation equity, including analysis of the
distribution of costs and benefits, and their impacts on physically, economically and socially
disadvantaged people (Forkenbrock and Weisbrod 2001; Litman 2002). For example, analysis
can quantify how a project or program affects the quality of mobility and accessibility options
available to people with disabilities and low incomes. Similarly, techniques exist for quantifying
option value, the value people are willing to pay to have an option that they do not currently use,
such as physically-able people’s willingness to pay for wheelchair ramps, and motorists’
willingness to pay for public transport services (DfT 2006; Litman 2009).

Critical Analysis of Conventional Transport Economic Evaluation Victoria Transport Policy Institute
12
Planning Integration A basic planning principle is that individual short-term decisions should support strategic, long-
term goals. This type of planning requires analysis of system-wide impacts, rather than analyzing
impacts individually. For example, public transit improvements tend to have greater impacts on
travel activity, and therefore provide more benefits and higher economic returns, if implemented
with local pedestrian and cycling improvements, supportive land use policies that encourage
more compact and mixed development around stops and stations, more efficient parking
management, and commute trip reduction programs. Conversely, a highway expansion project
may provide less benefit than predicted if it contradicts strategic development objectives by
stimulating sprawled land use patterns.
There is considerable variation in the degree that transport economic evaluation reflects system
efficiency. Most urban regions have traffic models that evaluate regional roadway system
efficiency, but there are often significant gaps in their ability to evaluate other modes, sectors or
scales. For example, few regional transport models can provide information on how changes in
pedestrian and cycling conditions affect public transit travel and traffic congestion, or how
changes in parking policies will affect future mode share and development patterns. This can
result in planning decisions at cross-purposes, for example, regional transportation agencies may
want to encourage transit-oriented development while local jurisdictions that do little to improve
walking and cycling conditions, and impose generous parking requirements on development.
Effects on Planning Decisions
Although the effects vary widely and are difficult to quantify, more integrated evaluation, more
accurate evaluation of indirect, long-term and synergistic effects can significantly affect planning
decisions (Johnston 2008).
Needed for More Comprehensive Evaluation
Various modelling improvement programs are developing guidance and practical tools for more
comprehensive and integrated transport economic evaluation, including more modes (walking,
cycling and public transit, in addition to automobile travel), more scales (local as well as
regional) and more impacts (Hough and Black 2012; ICE 2006; Johnston 2008; Rodier and
Spiller 2012).

Critical Analysis of Conventional Transport Economic Evaluation Victoria Transport Policy Institute
13
Economic Efficiency Economic efficiency refers to the overall benefits provided by goods and services. Transport
economic efficiency analysis recognizes variations in the value of travel to users and society. For
example, a vehicle transporting an injured person to a hospital generally has more value than the
same vehicle traveling on the same road with a less urgent mission. Freight and other service and
commercial vehicles tend to have relatively high value. High occupancy (rideshare and public
transit) vehicles are also more space efficient (they carry more passengers per lane) than most
cars. As a result, economic efficiency justifies policies that favor higher value trips and more
efficient modes over lower value trips and less efficient modes. This can be accomplished by
regulations that give emergency vehicles priority in traffic, and special lanes for freight and high
occupancy vehicles, and by pricing that allows higher value trips and more efficient modes to
outbid other traffic for scarce road space.
There is considerable economic literature on the economic efficiency benefits of using
regulations and pricing to favor higher value trips and more efficient modes. However,
conventional transportation economic evaluation does not generally quantify and monetize these
impacts: few transportation models report the increased economic efficiency and consumer
surplus that would result from pricing and regulations that prioritize higher-value travel.
Effects on Planning Decisions
Prioritizing travel could significantly increase economic efficiency. For example, efficient road
and parking pricing (motorists pay tolls and parking fees that reflect marginal costs or cost
recovery) typically reduces affected vehicle travel 10-50%, indicating that a significant portion
of vehicle travel, particularly urban vehicle travel, is economically inefficient: its marginal
benefits are worth less than its marginal costs, so users would forego that travel if they were
required to pay full costs (Nelson/Nygaard 2006). Some of the avoided vehicle travel would shift
to other modes, and providing high occupancy vehicle priority also increases their operating
efficiency (buses and rideshare vehicles experience less congestion delay, reducing their unit
costs), so more efficient transport system management would probably significantly improve
transport options (the quality of walking, cycling and public transport). This suggests that
applying economic efficiency principles can significantly increase transport system efficiency
and provide significant benefits.
Needed for More Comprehensive Evaluation
Transportation economic efficiency evaluation should account for variation in values of vehicle
travel, and therefore the potential economic efficiency gains from policies and projects that favor
higher value trips and more resource efficient modes. This evaluation would include analysis of
full costs (in order to define optimal pricing), demand modeling that estimates how users would
respond to efficient prices, and calculations of net changes in consumer surplus and external
costs with the implementation of more efficient regulations and pricing.

Critical Analysis of Conventional Transport Economic Evaluation Victoria Transport Policy Institute
14
Consumer Sovereignty (Responding to Consumer Demands) Consumer sovereignty refers to the degree that markets respond to consumer demands.
Consumer welfare increases if transport system users can choose the combination of modes and
services that meet their preferences and needs. In a typical community:
20-40% of residents cannot or should not drive due to age, disability or low-income.
10-30% of trips are short enough to be efficiently made by walking and cycling.
Some people prefer to walk, bike and use public transit for exercise and enjoyment.
Consumer welfare increases if transport systems serve latent demands. For example, consumer
welfare increases if sidewalk and bikepaths improvements allow residents to walk and bike to
local destinations, rather than always need to drive or be chauffeured. Similarly, user benefits are
inceased if commuters who prefer can walk, bike, rideshare or use public transit rather than
always driving. Improving these modes provides direct user benefits (consumer surplus gains) in
addition to external savings and benefits such as reduce traffic and parking congestion. User
benefits also increase if households that want to are able to live in accessible, multi-modal
(walkable and transit-oriented) neighborhoods rather than being forced to locate in automobile-
dependent neighborhoods due to inadequate supply.
In various ways, conventional transport evaluation tends to overlook and undervalue demand for
walking, cycling and high quality public transport. Travel surveys tend to undercount short trips,
children’s travel, non-commute travel, recreational travel, and the walking and cycling links of
motorized travel. Few travel surveys collect information on latent demand, such as the portion of
residents who would like to rely more on walking, cycling and public transit, and how they
would respond to specific service improvements such as faster and less crowded public transit.
Economic evaluation does not recognize the full costs that result if inadequate options force
drivers to chauffeur non-drivers.
Effects on Planning Decisions
Undervaluing demand for alternative modes, and ignoring the consumer welfare benefits of
serving this demand can significantly undervalue walking, cycling and public transport
improvements. Experience in various communities shows that improving walking, cycling and
public transit travel often results in significant increases in the use of these modes, indicating
latent demand (C40 Cities 2008; FHWA 2012).
Needed for More Comprehensive Evaluation
Economic evaluation can quantify latent demand for resource efficient modes (walking, cycling
and public transport), investigate latent demand for these modes and for more accessible, multi-
modal locations, and quantify the benefits to users and society of meeting this demand.

Critical Analysis of Conventional Transport Economic Evaluation Victoria Transport Policy Institute
15
Economic Development Analysis Economic development refers to progress toward a community’s economic goals such as
increased productivity, business activity, employment, income, property values and tax revenues
(Ellis, Glover and Norboge 2012). Economic development can provide external benefits:
residents may benefit from a transport facility or service they do not use if it increases local
employment and tax revenue. Transport improvements tend to support economic development if
they increase producer (government and business) efficiencies, for example, by reducing road
and parking facility costs (and therefore tax and development costs), reducing shipping costs or
expanding labor pools, as illustrated in Figure 3.
Figure 3 Economic and Economic Development Impacts
Economic “impacts” are changes in
the supply of scarce resources,
including time, money, land, energy,
health and ecological productivity.
Economic “development” which are
changes in economic productivity,
employment, property values and tax
revenues. Resource efficiencies to
producers (businesses and
governments) tend to support
economic development.
Under certain circumstances, such as when paved highways are first built in a region, roadway
expansion tends to provide significant economic development benefits, but theoretical and
empirical evidence indicate that as roadway systems mature marginal economic development
benefits decline (Mamuneas and Nadiri 2006), and although internationally, vehicle travel is
positively associated with productivity, since vehicle travel tends to increase with income, within
higher-income countries, high levels of motor vehicle travel tend to reduce productivity
(Kooshian and Winkelman 2011), as illustrated in Figure 4.
Figure 4 Per Capita GDP and VMT For U.S. States (Litman 2010)
R² = 0.2923
$0
$10,000
$20,000
$30,000
$40,000
$50,000
$60,000
0 5,000 10,000 15,000 20,000
Pe
r C
ap
ita
An
nu
al
GD
P (
2004)
Per Capita Annual Mileage (2005)
Per capita economic productivity
increases as vehicle travel
declines. (Each dot is a U.S.
state.)

Critical Analysis of Conventional Transport Economic Evaluation Victoria Transport Policy Institute
16
Conventional evaluation often exaggerates transport project economic development benefits by
treating economic transfers (subsidies from other sectors or jurisdictions) as net benefits,
assuming that personal cost savings increase productivity, and by ignoring incremental external
costs of increased vehicle travel (Cambridge Systematics 2012; Crompton 2006). This is an
important issue because policies and projects that stimulate automobile travel, such as roadway
expansions, parking subsidies and low fuel prices, are often justified based on claims that
increased vehicle travel supports regional economic development, employment and tax revenues.
Effects on Planning Decisions
Economic development can provide dispersed benefits and so is often considered worthy of
public support. As a result, transport projects are often justified with claims that they support
economic development. Exaggerating transport projects’ economic development benefits can
result in excess and inefficient investments, particularly if they induce additional vehicle travel
that significantly increases indirect and external costs.
Needed for More Comprehensive Evaluation
Transportation economic development analysis should reflect best practices: it should not
consider economic transfers as net benefits, it should not expect productivity gains from personal
travel cost savings, and it should recognize the incremental economic costs of increased vehicle
travel (additional road and parking costs, accident and pollution damages, economic externalities
from fuel importation, and sprawl-related costs). Integrated models such as TranSight and
TREDIS are now available that, if properly applied, provide more accurate economic
development impact analysis of transportation projects.

Critical Analysis of Conventional Transport Economic Evaluation Victoria Transport Policy Institute
17
Summary Table 7 summarizes the degree that conventional transport economic evaluation considers these
eight factors. This analysis indicates that significant changes are needed to make transport
economic evaluation truly comprehensive and multi-modal.
Table 7 Analysis Scope
Factor Conventional Transport Evaluation Required for Comprehensive Evaluation
Scope of
impacts and
objectives
considered
Often considers a limited set of impacts and
objectives, primarily related to automobile travel
such as traffic speeds, vehicle operating costs, crash
and emission rates.
Consider all significant impacts and planning
objectives.
Accessibility
analysis
Evaluates transport system performance based
primarily on vehicle traffic speeds. The quality of
other modes, network connectivity and geographic
proximity often receive little consideration.
Considers all accessibility factors including
motor vehicle traffic speeds, the quality of
alternative modes, transport network
connectivity, and geographic proximity.
Congestion
costing
Often uses costing methods that exaggerate
congestion costs and highway expansion benefits
Apply best practices when evaluating congestion
costs
Generated
traffic impacts
Most transport models consider some but not all
generated traffic impacts; land use development
impacts and the incremental costs of induced
vehicle travel are often overlooked or undervalued.
Consider the incremental benefits and costs of
induced vehicle travel.
Social equity
analysis
Equity impacts are often considered at some point
in the planning process but seldom quantified.
Define and measure equity impacts as part of
economic evaluation.
Strategic
planning
Evaluation is often uncoordinated between different
sectors and jurisdictions.
Provide more integrated analysis.
Economic
efficiency
Not generally quantified, so the efficiency benefits
of favoring higher value trips and more efficient
modes are not evaluated.
Account for the economic efficiency gains that
could result from increased economic efficiency.
Consumer
sovereignty
Seldom quantifies latent travel demands and the
benefits to users and society of accommodating
latent demand for resource efficient modes.
Better analysis of travel demands, and the
potential benefits of serving latent demand for
walking, cycling and public transport.
Economic
development
Often exaggerates the economic development
benefits of increased mobility.
Critically evaluate claims of economic
development benefits, particularly from roadway
expansions.
Compared with conventional practices, significant changes are needed to create truly comprehensive and
multi-modal transport economic evaluation.
Critical Analysis of Conventional Transport Economic Evaluation Victoria Transport Policy Institute
18
Examples This section investigates how the omissions and biases of conventional transport economic evaluation can
affect various types of transport planning decisions.
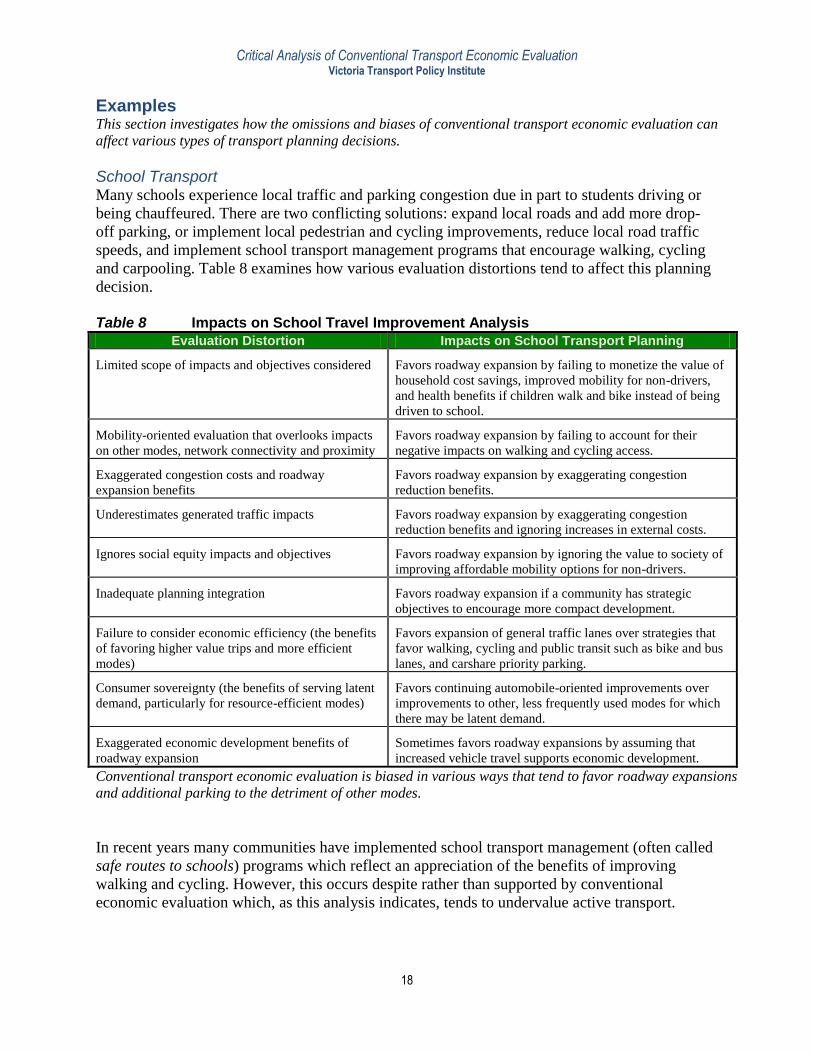
School Transport Many schools experience local traffic and parking congestion due in part to students driving or
being chauffeured. There are two conflicting solutions: expand local roads and add more drop-
off parking, or implement local pedestrian and cycling improvements, reduce local road traffic
speeds, and implement school transport management programs that encourage walking, cycling
and carpooling. Table 8 examines how various evaluation distortions tend to affect this planning
decision.
Table 8 Impacts on School Travel Improvement Analysis
Evaluation Distortion Impacts on School Transport Planning
Limited scope of impacts and objectives considered Favors roadway expansion by failing to monetize the value of
household cost savings, improved mobility for non-drivers,
and health benefits if children walk and bike instead of being
driven to school.
Mobility-oriented evaluation that overlooks impacts
on other modes, network connectivity and proximity
Favors roadway expansion by failing to account for their
negative impacts on walking and cycling access.
Exaggerated congestion costs and roadway
expansion benefits
Favors roadway expansion by exaggerating congestion
reduction benefits.
Underestimates generated traffic impacts Favors roadway expansion by exaggerating congestion
reduction benefits and ignoring increases in external costs.
Ignores social equity impacts and objectives Favors roadway expansion by ignoring the value to society of
improving affordable mobility options for non-drivers.
Inadequate planning integration Favors roadway expansion if a community has strategic
objectives to encourage more compact development.
Failure to consider economic efficiency (the benefits
of favoring higher value trips and more efficient
modes)
Favors expansion of general traffic lanes over strategies that
favor walking, cycling and public transit such as bike and bus
lanes, and carshare priority parking.
Consumer sovereignty (the benefits of serving latent
demand, particularly for resource-efficient modes)
Favors continuing automobile-oriented improvements over
improvements to other, less frequently used modes for which
there may be latent demand.
Exaggerated economic development benefits of
roadway expansion
Sometimes favors roadway expansions by assuming that
increased vehicle travel supports economic development.
Conventional transport economic evaluation is biased in various ways that tend to favor roadway expansions
and additional parking to the detriment of other modes.
In recent years many communities have implemented school transport management (often called
safe routes to schools) programs which reflect an appreciation of the benefits of improving
walking and cycling. However, this occurs despite rather than supported by conventional
economic evaluation which, as this analysis indicates, tends to undervalue active transport.

Critical Analysis of Conventional Transport Economic Evaluation Victoria Transport Policy Institute
19
Urban Congestion Reduction Urban traffic congestion is a significant problem and most urban regions are investing significant
resources to improve mobility, including roadway expansion, public transit improvements, and
various transportation demand management programs. Table 9 examines how economic
evaluation biases are likely to affect the evaluation of potential congestion reduction strategies.
Table 9 Urban Congestion Reduction Analysis
Evaluation Distortion Impacts on Congestion Mitigation Planning
Limited scope of impacts and objectives
considered
Favors roadway expansion by failing to monetize many benefits
of alternative modes and TDM, such as parking cost savings,
household savings and improved mobility for non-drivers.
Mobility-oriented evaluation that overlooks
impacts on other modes, network connectivity
and proximity
Favors roadway expansion by failing to account for the reductions
in walking and cycling access, reduced roadway connectivity, and
increased sprawl that typically results from higher design speeds.
Exaggerated congestion costs and roadway
expansion benefits
Favors roadway expansion by exaggerating congestion reduction
benefits.
Underestimates generated traffic impacts Favors roadway expansion by exaggerating their congestion
reduction benefits and ignoring increases in external costs.
Ignores social equity impacts and objectives Favors roadway expansion by ignoring the value to society of
improving affordable mobility options for non-drivers.
Inadequate planning integration Favors roadway expansion by overlooking the additional
congestion reductions and other benefits of integrated programs
involving transit improvements, TDM and smart growth policies.
Failure to consider economic efficiency (the
benefits of favoring higher value trips and more
efficient modes)
Favors expansion of general traffic lanes over strategies that favor
higher value trips and more efficient modes such as bike, HOV
and bus lanes, and efficient road pricing.
Consumer sovereignty (the benefits of serving
latent demand, particularly for resource-efficient
modes)
Favors roadway expansion over improvements to other, less
frequently used modes for which there may be latent demand,
such as cycling, vanpooling and high quality public transit.
Exaggerated economic development benefits of
roadway expansion
Favors roadway expansions by assuming that increased vehicle
travel supports economic development.
Conventional transport economic evaluation is biased in various ways that tend to favor roadway expansion
over other congestion reduction strategies such as bike, HOV and bus lanes, pricing reforms and commute trip
reduction programs.
This analysis indicates that conventional transport economic evaluation is biased in favor of
highway expansion over other potential congestion reduction strategies because it ignores their
co-benefits, such as parking cost savings, vehicle ownership cost savings and safety benefits,
exaggerates roadway expansion congestion reduction benefits, ignores the economic efficiency
benefits of efficient pricing which favors higher value trips, ignores the social equity and
consumer surplus benefits of improving mobility options for non-drivers, and the additional
potential impacts and benefits of integrated programs.

Critical Analysis of Conventional Transport Economic Evaluation Victoria Transport Policy Institute
20
Bus Rapid Transit Project Many communities are now considering implementing various types of Bus Rapid Transit (BRT)
projects which involve frequent bus services with features such as bus only-lanes and
intersection priority, integrated pre-paid fares (which minimizes boarding delays), attractive
stations and aggressive marketing. This tends to improve operating efficiencies (more passenger-
miles per bus operating hour), improve transit service quality and increase ridership, but often
has significant implementation costs and may require eliminating general traffic or parking lanes.
Table 10 examines how evaluation biases are likely to affect BRT benefit evaluation.
Table 10 Bus Rapid Transit Benefit Analysis
Evaluation Distortion Impacts on BRT Evaluation
Limited scope of impacts and objectives
considered
Undervalues BRT by failing to monetize many benefits of
alternative modes and TDM, such as parking cost savings,
household savings and improved mobility for non-drivers.
Mobility-oriented evaluation that overlooks
impacts on other modes, network connectivity
and proximity
Often undervalues BRT by failing to account for the congestion
avoided when travelers shift from driving to other modes.
Exaggerated congestion costs and roadway
expansion benefits
Favors roadway expansion over BRT by exaggerating roadway
congestion reduction benefits.
Underestimates generated traffic impacts Favors roadway expansion over BRT by exaggerating roadway
congestion reduction benefits.
Ignores social equity impacts and objectives Undervalues BRT by ignoring the value to society of improving
affordable mobility options for non-drivers.
Inadequate planning integration May undervalue BRT by failing to account the additional
ridership and benefits that could result from integrated BRT,
TDM and smart growth policies, and by overlooking the way it
supports other strategic objectives such as compact development.
Failure to consider economic efficiency (the
benefits of favoring higher value trips and more
efficient modes)
May undervalue BRT by failing to account for the economic
efficiency gains from urban traffic management that favors higher
value trips and more efficient modes.
Consumer sovereignty (the benefits of serving
latent demand, particularly for resource-efficient
modes)
May undervalue BRT by failing to account for the consumer
surplus gains provided by serving latent demand for high quality
public transport.
Exaggerated economic development benefits of
roadway expansion
May undervalue BRT if evaluation models fail to recognize the
full economic development benefits of increased economic
opportunity for non-drivers, agglomeration benefits of more
compact development, and increased regional productivity from
reduced household expenditures on vehicles and fuel.
Conventional transport economic evaluation fails to recognize many benefits of high quality public transport.
Conventional evaluation tends to undervalue BRT investments because it fails to recognize many
benefits of high quality public transport including improved user speed and comfort, parking and
vehicle ownership cost savings, social equity and consumer surplus benefits of improving
mobility for non-drivers, and benefits from more compact development.

Critical Analysis of Conventional Transport Economic Evaluation Victoria Transport Policy Institute
21
Conclusions The scope of impacts, objectives and options considered in economic evaluation can
significantly affect transport planning decisions: a policy or project may appear beneficial and
fair evaluated one way but inefficient and unfair if evaluated another. It is important that people
who use analysis result understand their weaknesses. This study identifies significant omissions
and biases in conventional economic evaluation:
It fails to quantify and monetize significant impacts including parking costs, vehicle ownership
costs, disadvantaged people’s accessibility, and public fitness.
It focuses on automobile travel and gives little consideration to impacts on accessibility factors
such as the quality other modes, transport network connectivity, or geographic proximity.
It exaggerates congestion costs and roadway expansion benefits.
It fails to incorporate social equity and strategic planning objectives.
It does not account for the economic efficiency gains of favoring higher value trips and more
efficient modes, or the consumer surplus benefits of serving latent demands.
It tends to exaggerate roadway expansion economic development benefits.
These biases and omissions tend to favor of mobility over accessibility and automobile travel
over other modes, resulting in economically excessive roadway expansion, underinvestment in
walking, cycling and public transit, and reduced support for pricing reforms and smart growth
policies. This harms consumers directly, by reducing their transport options and increasing their
costs, reduces economic efficiency and increases various external costs. Conventional evaluation
practices were originally developed during the mid-twentieth century, during the period of rapid
motor vehicle travel growth, to answer relatively simple questions such as whether a highway
project’s costs would be repaid by travel time and vehicle operating cost savings. These practices
are inadequate for evaluating more complex decisions that affect the range of transport options
available in a community, or which have significant indirect and external impacts, as is common
with urban transport planning and strategic policy and planning decisions.
To be fair, the excluded impacts and factors are often considered at other stages in a planning
process, such as during political negotiations and public engagement, and other factors often
affect planning decisions such as funding formulas. Public officials often support walking,
cycling and public transport more than is justified by conventional economic evaluation – they
realize intuitively that these modes play important roles in an efficient and equitable transport
system that are not quantified in economic evaluation. However, this occurs despite rather than
supported by the evaluation process. More comprehensive and multi-modal evaluation can result
in more integrated and consistent planning.
The omissions and biases identified in this report have been described previously, some in the
regional or transport planning literature, some in the economics literature, and some by groups
interested in specific issues such as social equity analysis or public health. However, to my
knowledge this is the first study which attempts to provide a comprehensive critique that bridges
these various perspectives. This study should be of interest to anybody involved in transport
evaluation or who uses evaluation results.

Critical Analysis of Conventional Transport Economic Evaluation Victoria Transport Policy Institute
22
References
C40 Cities (2008), Best Practices: Transport Case Studies, Climate Leadership Group, C40 Cities
(www.c40cities.org/bestpractices/transport).
Cambridge Systematics (2012), Assessing The Economic Benefit Of Transportation Infrastructure
Investment In A Mature Surface Transportation System, National Cooperative Highway Research
Program (www.trb.org); at http://onlinepubs.trb.org/onlinepubs/nchrp/docs/NCHRP20-24(80)_FR.pdf.
Daniel Carlson and Zachary Howard (2010), Impacts Of VMT Reduction Strategies On Selected Areas
and Groups, Washington State Department of Transportation (www.wsdot.wa.gov); at
www.wsdot.wa.gov/research/reports/fullreports/751.1.pdf.
John L. Crompton (2006), “Economic Impact Studies: Instruments for Political Shenanigans?” Journal of
Travel Research, Vol. 45, No. 1, pp. 67-82 (doi: 10.1177/0047287506288870).
CTS (2010), Measuring What Matters: Access to Destinations, the second research summary from the
Access to Destinations Study, Center for Transportation Studies, University of Minnesota
(www.cts.umn.edu); at www.cts.umn.edu/Publications/ResearchReports/reportdetail.html?id=1948.
DfT (2006), Transport Analysis Guidance, UK Department for Transport (www.dft.gov.uk/webtag).
David Ellis, Brianne Glover and Nicolas Norboge (2012), Refining a Methodology for Determining the
Economic Impacts of Transportation Improvements, University Transportation Center for Mobility at
Texas A&M University; at http://utcm.tamu.edu/publications/final_reports/Ellis_11-00-68.pdf.
Reid Ewing and Robert Cervero (2010), “Travel and the Built Environment: A Meta-Analysis,” Journal
of the American Planning Association, Vol. 76, No. 3, Summer, pp. 265-294; at
http://pdfserve.informaworld.com/287357__922131982.pdf.
FHWA (2012), Report to the U.S. Congress on the Outcomes of the Nonmotorized Transportation Pilot
Program, Federal Highway Administration (www.fhwa.dot.gov); at
www.fhwa.dot.gov/environment/bicycle_pedestrian/ntpp/2012_report/final_report_april_2012.pdf.
FHWA Economic Development Website (www.fhwa.dot.gov/planning/econdev/index.html) and Economic
Development Links (www.fhwa.dot.gov/infrastructure/asstmgmt/econlinks.cfm) include information on the
relationships between highway improvements and regional economic development.
David J. Forkenbrock and Glen E. Weisbrod (2001), Guidebook for Assessing the Social and Economic
Effects of Transportation Projects, NCHRP Report 456, Transportation Research Board, National Academy
Press (www.trb.org); at http://onlinepubs.trb.org/onlinepubs/nchrp/nchrp_rpt_456-a.pdf.
Susan Handy, Gil Tal and Marlon G. Boarnet (2010), Draft Policy Brief on the Impacts of Network
Connectivity Based on a Review of the Empirical Literature, for Research on Impacts of Transportation
and Land Use-Related Policies, California Air Resources Board
(http://arb.ca.gov/cc/sb375/policies/policies.htm).
J. Henderson (2011), “Level Of Service: The Politics Of Reconfiguring Urban Streets In San Francisco,”
Journal of Transport Geography, Vol. 19, Nol. 6, pp. 1138-1144 (doi:10.1016/j.jtrangeo.2011.05.010)

Critical Analysis of Conventional Transport Economic Evaluation Victoria Transport Policy Institute
23
Jill Luria Hough and Gary Black (2012), “Effective Travel Demand Modeling to Support Smart Growth
and Climate Change Policies,” ITE Journal (www.ite.org), Vol. 82, No. 5, May, pp. 30-35; at
www.ite.org/membersonly/itejournal/pdf/2012/JB12EA30.pdf.
ICE (2006), Assessment of Integrated Transportation/Land Use Models, Information Center for the
Environment, UC Davis, for California Department of Transportation; at
www.scag.ca.gov/modeling/mtf/presentations/052406/PECASscag.pdf.
iTrans (2006), Costs of Non-Recurrent Congestion in Canada, Transport Canada (www.tc.gc.ca); at
www.bv.transports.gouv.qc.ca/mono/0964770/01_Report.pdf.
Robert A. Johnston (2008), “Indicators for Sustainable Transportation Planning,” Transportation
Research Record 2067, Transportation Research Board (www.trb.org), pp. 146 – 154; at
http://pubs.its.ucdavis.edu/publication_detail.php?id=1260.
Dr. Kara Kockelman, T. Donna Chen and Brice Nichols (2013), The Economics Of Transportation
Systems: A Reference For Practitioners, Center for Transportation Research, University of Texas at
Austin (www.utexas.edu), Project 0-6628: Economic Considerations in Transportation System
Development & Operations, Texas Department of Transportation; at
www.utexas.edu/research/ctr/pdf_reports/0_6628_P1.pdf.
Chuck Kooshian and Steve Winkelman (2011), Growing Wealthier: Smart Growth, Climate Change and
Prosperity, Center for Clean Air Policy (www.ccap.org); at www.growingwealthier.info.
J. Richard Kuzmyak (2012), Land Use and Traffic Congestion, Report 618, Arizona DOT
(www.azdot.gov); at www.azdot.gov/TPD/ATRC/publications/project_reports/PDF/AZ618.pdf.
Jonathan Levine, Joe Grengs, Qingyun Shen and Qing Shen (2012), “Does Accessibility Require Density
or Speed?” Journal of the American Planning Association, Vol. 78, No. 2, pp. 157-172,
http://dx.doi.org/10.1080/01944363.2012.677119; at www.connectnorwalk.com/wp-
content/uploads/JAPA-article-mobility-vs-proximity.pdf.
Todd Litman (2001), “Generated Traffic; Implications for Transport Planning,” ITE Journal, Vol. 71, No.
4, Institute of Transportation Engineers (www.ite.org), April, pp. 38-47; at www.vtpi.org/gentraf.pdf.
Todd Litman (2002), “Evaluating Transportation Equity,” World Transport Policy & Practice
(http://ecoplan.org/wtpp/wt_index.htm), Volume 8, No. 2, Summer, pp. 50-65; revised version at
www.vtpi.org/equity.pdf.
Todd Litman (2003), “Measuring Transportation: Traffic, Mobility and Accessibility,” ITE Journal
(www.ite.org), Vol. 73, No. 10, October, pp. 28-32, at www.vtpi.org/measure.pdf. Also see, Evaluating
Accessibility for Transportation Planning, at www.vtpi.org/access.pdf.
Todd Litman (2006), “Transportation Market Distortions,” Berkeley Planning Journal; issue theme
Sustainable Transport in the United States: From Rhetoric to Reality? (www-dcrp.ced.berkeley.edu/bpj),
Volume 19, 2006, pp. 19-36; at www.vtpi.org/distortions_BPJ.pdf.
Todd Litman (2007), Socially Optimal Transport Prices and Markets, VTPI (www.vtpi.org); at
www.vtpi.org/sotpm.pdf.

Critical Analysis of Conventional Transport Economic Evaluation Victoria Transport Policy Institute
24
Todd Litman (2009), Transportation Cost and Benefit Analysis, Victoria Transport Policy Institute
(www.vtpi.org/tca).
Todd Litman (2010), Evaluating Transportation Economic Development Impacts, VTPI (www.vtpi.org);
at www.vtpi.org/econ_dev.pdf.
Todd Litman (2012), Toward More Comprehensive and Multi-modal Transport Evaluation, VTPI
(www.vtpi.org); at www.vtpi.org/comp_evaluation.pdf.
Todd Litman (2013), Smart Congestion Relief: Comprehensive Analysis Of Traffic Congestion Costs and
Congestion Reduction Benefits, VTPI (www.vtpi.org); at www.vtpi.org/cong_relief.pdf. Also see,
Congestion Costing Critique: Critical Evaluation of the 'Urban Mobility Report', VTPI (www.vtpi.org);
at www.vtpi.org/UMR_critique.pdf.
Theofanis Mamuneas and Ishaq Nadiri (2006), Production, Consumption and Rates of Return to Highway
Infrastructure Capital; at https://editorialexpress.com/cgi-
bin/conference/download.cgi?db_name=IIPF62&paper_id=11.
Michael J. Markow (2012), Engineering Economic Analysis Practices for Highway Investment, NCHRP
Synthesis 424, Transportation Research Board (www.trb.org); at
http://onlinepubs.trb.org/onlinepubs/nchrp/nchrp_syn_424.pdf.
Multimodal Benefit-Cost Analysis Tool (http://tredis.com/mbca) is a free, web-based calculation system
for comparing the costs and user benefits of individual transportation projects.
Nelson\Nygaard (2006), Traffic Reduction Strategies Study, Report and various appendices, City of
Pasadena (www.cityofpasadena.net)
Robert B. Noland and Christopher S. Hanson (2013), “How Does Induced Travel Affect Sustainable
Transport Policy,” Transportation Beyond Oil: Policy Choices for a Multimodal Future, (John Renne and
Billy Fields, eds), Island Press (www.islandpress.com), pp. 70-85.
Peter Mackie and Tom Worsley (2013) International Comparisons of Transport Appraisal Practice,
Institute for Transport Studies (www.its.leeds.ac.uk) for the UK Department for Transport; at
www.gov.uk/government/publications/international-comparisons-of-transport-appraisal-practice.
NZTA (2010), Economic Evaluation Manual, Volumes 1 and 2, New Zealand Transport Agency
(www.nzta.govt.nz); at www.nzta.govt.nz/resources/economic-evaluation-manual/volume-1/index.html
and www.nzta.govt.nz/resources/economic-evaluation-manual/volume-2/docs/eem2-july-2010.pdf.
Jonathan R. Peters, Robert E. Paaswell and Joseph Berechman (2008), Economic Competitiveness:
Performance Measures for Transportation – Review of Literature and Best Practices, University
Transportation Research Center, City College New York (www.utrc2.org); at
www.utrc2.org/research/assets/139/C-06-28finalrept-Phase1.pdf.
Caroline Rodier and Margot Spiller (2012), Model-based Transportation Performance: A Comparative
Framework and Literature Synthesis, Report 11-09, Mineta Transportation Institute
(www.transweb.sjsu.edu); at www.transweb.sjsu.edu/PDFs/research/2805-Model-based-transportation-
performance.pdf.

Critical Analysis of Conventional Transport Economic Evaluation Victoria Transport Policy Institute
25
SACTRA (1999), Transport Investment, Transport Intensity and Economic Growth, Standing Advisory
Committee on Trunk Road Assessment, Dept. of Environment, Transport and Regions
(www.roads.detr.gov.uk); at www.dft.gov.uk/pgr/economics/sactra.
Howard J. Shatz, Karin E. Kitchens, Sandra Rosenbloom and Martin Wachs (2011), Highway
Infrastructure and the Economy: Implications for Federal Policy, RAND Corporation (www.rand.org); at
www.rand.org/pubs/monographs/MG1049.html.
SHRP (2012), Interactions Between Transportation Capacity, Economic Systems, and Land Use,
Strategic Highway Research Program (www.trb.org/SHRP2); at
www.trb.org/StrategicHighwayResearchProgram2SHRP2/Blank2.aspx.
TC (2006), The Cost Of Urban Congestion In Canada, Transport Canada (www.tc.gc.ca); at www.adec-
inc.ca/pdf/02-rapport/cong-canada-ang.pdf.
Glen Weisbrod and Arno Reno (2009), Economic Impact Of Public Transportation Investment, American
Public Transportation Association (www.apta.org); at
www.apta.com/resources/reportsandpublications/Documents/economic_impact_of_public_transportation
_investment.pdf
TEC (2012), Transportation Benefits-Cost Analysis Website
(https://sites.google.com/site/benefitcostanalysis), TRB Transportation Economics Committee.
VTPI (2009), Urban Transport Performance Spreadsheet, Victoria Transport Policy Institute
(www.vtpi.org); at www.vtpi.org/Transit2009.xls.
Ian Wallis and David Lupton (2013), The Costs Of Congestion Reappraised, Report 489, New Zealand
Transport Agency (www.nzta.govt.nz); at www.nzta.govt.nz/resources/research/reports/489/docs/489.pdf.
Glen Weisbrod (2013), Choosing Economic Analysis Software, Economic Development Research Group
(www.edrgroup.com).
Huw C. W. L. Williams and Yaeko Yamashita (1992), “Travel Demand Forecasts and the Evaluation of
Highway Schemes Under Congested Conditions,” Journal of Transport Economics and Policy, Vol. 26,
No. 3, September 1992, pp. 261-282; at www.bath.ac.uk/e-journals/jtep/pdf/Volume_XXV1_No_3_261-
282.pdf.
Jason Zheng, Carol Atkinson-Palombo, Chris McCahill, Rayan O’Hara and Norman Garrick (2011),
“Quantifying the Economic Domain of Transportation Sustainability,” Transportation Research Record
2242, pp. 19-28; at http://amonline.trb.org/12koec/12koec/1.
www.vtpi.org/crit_econ_eval.pdf