Criteria Decision Making
130
1 Eric Afful-Dadzie, Msc. Hybridized Integrated Methods in Fuzzy Multi- Criteria Decision Making (With Case Studies) Doctoral thesis Course: Engineering Informatics Selected field: Engineering Informatics Supervisor: assoc. prof. Zuzana Komínková Oplatková, Ph.D Zlín, 2015
Transcript of Criteria Decision Making

1
Eric Afful-Dadzie, Msc.
Hybridized Integrated Methods in Fuzzy Multi-
Criteria Decision Making
(With Case Studies)
Doctoral thesis
Course: Engineering Informatics
Selected field: Engineering Informatics
Supervisor: assoc. prof. Zuzana Komínková Oplatková, Ph.D
Zlín, 2015

2

3
DEDICATION
This dissertation is dedicated to the two greatest women in my life; Naana
Mensima, my wife and Auntie Mary, my mum. It is also dedicated to my two
lovely boys; Jason and Ethan. May this piece of work be an inspiration for them
to achieve greater feat than their daddy.
It is further dedicated to my in-laws Pet and Oman for holding the fort in my
long absence to pursue further studies. I am extremely grateful for shouldering
such great responsibilities of providing warmth and love to my family. I will
always have you in my thoughts.
It is also dedicated to my ‘twin’ brother Ato and the entire family; Nana Otu,
Maame Esi, Maame Ekua, and Magdalene. May God richly bless you all.

4
ACKNOWLEDGEMENTS
My doctoral studies would never have been possible without the immense
support from many individuals. In particular, I acknowledge the contributions of
my supervisor, assoc. prof. Zuzana Komínková Oplatková, who was always
helpful and supportive when I most needed it. I am also grateful to her for reading
through my numerous revisions and helping to make this dissertation a reality. I
cherished the constructive criticisms and commentaries on my work.
I also acknowledge the love and support I received from prof. Ing. Roman
Prokop, CSc., especially during some of the most difficult times at the beginning
of my studies. I would like to thank him for his understanding and care.
Special gratitude goes to my brother, Dr. Anthony Afful-Dadzie who served as
my most cherished research partner in most of my publications. I am grateful to
him for his numerous reviews, commentaries, arguments and editing of my works.
Significant recognition also goes to several brilliant friends and colleagues I came
across in Zlin especially those who in diverse ways contributed to my studies and
life in Zlin. Special mention goes to Ing. Stephen Nabareseh, Ing. Michael Adu-
Kwarteng, Carlos Beltrán Prieto, Ph.D, Bc. Jana Doleželová, Ing. Tomáš
Urbánek, and Ing. Stanislav Sehnálek, for their diverse contributions to my study
in Zlin.
Also noteworthy of mention are the Dean, assoc. prof. Milan Adámek, Ph.D.,
the head of department of Informatics and Artificial Intelligence, assoc. prof. Mgr.
Roman Jašek, Ph.D. and assoc. prof. Ing. Roman Šenkeřík.
Last but not the least, I would also like to recognize and extend my appreciation
to the committee members, for taking time to read the dissertation and offering
constructive criticisms that helped improved the final work.

5
ABSTRACT
Multi-criteria decision making (MCDM) under fuzzy settings has been utilized
in many wide ranging applications in industry and academia. However, a current
trend in several of these works, is the use of more than one MCDM method in
ranking and selection problems. For example, in a supplier selection problem, the
Analytical Hierarchy Process (AHP) or the Analytic Network Process (ANP)
method may be used to set the weights of the criteria and a different MCDM
method used to rank the alternatives. Such approach is often simply referred to as
hybrid or an integrated approach in MCDM problems. In many of these hybrid
approaches however, it is realized that in spite of the use of a hybrid method, a
one-method approach could also realize the same ranking order. This has called
into question the appropriateness of use of hybrid methods in MCDM.
This work first investigates the use of hybridized or integrated MCDM methods
against one-method solutions to help determine (1) when a hybridized method
solution is useful to a decision problem and (2) which MCDM methods are
appropriate for setting criteria weights in a hybridized method and under what
conditions. Further, based on the results in the first part of this work, the
dissertation proposes a 2-tier hybrid decision making model using Conjoint
Analysis and Intuitionistic Fuzzy - Technique for Order Preference by Similarity
to Ideal Solution (IF-TOPSIS) method. The proposed hybrid method is useful in
special cases of incorporating or merging preference data (decisions) of a large
decision group such as customers or shareholders, into experts’ decisions such as
management board. The Conjoint analysis method is used to model preferences
of the large group into criteria weights and subsequently, the Intuitionistic Fuzzy
TOPSIS (IF-TOPSIS) method is used to prioritize and select competing
alternatives with the help of expert knowledge.
Three numerical examples of such 2-tier (multi-level) decision model are
provided involving (1) the selection of a new manager in a microfinance company
where shareholder preference decisions are incorporated into board management
decisions (2) an ideal company distributor selection problem where customer
preferences are merged into management decisions to arrive at a composite
decision and (3) selection of recruitment process outsourcing vendors where HR
managers’ preferences and trade-offs are incorporated into management decision.
Finally the work tests the reliability of decisions arrived at in each of the studies
by designing novel sensitivity analysis models to determine the congruent effect
on the decisions.
Keywords: Multi-Criteria Decision Making (MCDM); Hybridized; Integrated;
Criteria weights; Fuzzy sets; Intuitionistic fuzzy sets; Conjoint Analysis; TOPSIS.

6
ABSTRAKT
Vícekriteriální rozhodování (MCDM - multi-criteria decision making) s fuzzy
nastavením má velmi rozsáhlé uplatnění v průmyslu a akademické obci.
Současným trendem v těchto pracích není použití jedné, ale více metod MCDM
v problémech ohodnocování pořadí a selekce. Například, při řešení problému
výběru dodavatele může být použitý analytický hierarchický proces (AHP) nebo
metoda Analytic Network Process (ANP) k nastavení vah kritérií a jiná metoda
MCDM pro klasifikaci alternativ. Takový přístup je hodnocen jako hybridní nebo
integrovaný přístup v problémech MCDM. Nicméně, v mnoha z těchto hybridních
přístupů i přes použití metody hybridní by prostá jedna metoda mohla dosáhnout
stejného ohodnocení pořadí. Je to pak otázkou vhodnosti použití hybridních
metod MCDM.
Tato práce poprvé prozkoumává použití hybridních nebo integrovaných
MCDM metod vůči řešení jednou metodou, aby pomohla určit, (1) kdy je řešení
hybridní metodou užitečné pro rozhodovací problémy, (2) které MCDM metody
jsou vhodné pro nastavení vah kritérií v hybridních metodách a za jakých
podmínek. Dále, založeno na výsledcích v první části práce, disertační práce
navrhuje 2-stupňový hybridní rozhodovací model využívající Conjoint Analysis
(sdruženou analýzu) a Intuitionistic Fuzzy - Technique for Order Preference by
Similarity to Ideal Solution (intuicionistickou fuzzy techniku pro preferenci
pořadí podle podobnosti k ideálnímu řešení - IF-TOPSIS) metodou. Navržená
hybridní metoda je užitečná ve speciálních případech zahrnující nebo slučující
preferenční data (rozhodnutí) z velké skupiny lidí, jako jsou zákazníci nebo
akcionáři do rozhodnutí expertů, např. vedení podniku. Conjoint analysis metoda
je použita pro modelování preferencí velké skupiny do vah kritérií a následně,
Intuitionistic Fuzzy TOPSIS (IF-TOPSIS) metoda je použita k upřednostňování a
výběru protichůdných alternativ s pomocí znalostí expertů.
V práci jsou uvedeny tři numerické příklady takového 2-stupňového (multi-
úrovňového) modelu a zahrnují: (1) výběr nového manažera ve společnosti, kde
preferenční rozhodnutí akcionářů jsou zahrnuta do rozhodnutí vedení
managementu, (2) problém výběru ideálního distributora společnosti, kde jsou
zákaznické preference sloučeny do rozhodnutí managementu k dosažení
složeného rozhodnutí a (3) výběr z náborového procesu outsourcingové
společnosti, kde manažerské preference a kompromisní řešení jsou zahrnuta do
rozhodnutí managementu. Posledním bodem práce je testování spolehlivosti
rozhodnutí v každé studii pomocí modelu citlivostní analýzy, aby se určil
souhlasný efekt na rozhodnutí.
Klíčová slova: Vícekriteriální rozhodnutí (Multi-Criteria Decision Making -
MCDM); Hybridní; Integrovaný; Váhy kritérií; Fuzzy množiny; Intuicionistické
fuzzy množiny; Sdružená analýza (Conjoint Analysis); TOPSIS.

7
CONTENTS
DEDICATION ................................................................................................. 3
ACKNOWLEDGEMENTS ........................................................................... 4
ABSTRACT ..................................................................................................... 5
ABSTRAKT ..................................................................................................... 6
LIST OF FIGURES ...................................................................................... 10
LIST OF TABLES ........................................................................................ 12
LIST OF SYMBOLS AND ABBREVIATIONS ........................................ 14
1 INTRODUCTION ................................................................................. 16
2 AIMS OF THE DISSERTATION ....................................................... 20
3 STATE OF THE ART .......................................................................... 21
4 THEORETICAL FOUNDATIONS OF MCDM ............................... 25
4.1 Taxonomy of MCDM Problems and Methods ............................... 27
4.2 MCDM Problem-Based Classification ............................................ 28
4.3 Other Types of Classification ........................................................... 33
4.3.1 Compensatory Methods .............................................................. 33
4.3.2 Non-Compensatory Methods ...................................................... 34
4.4 MCDM Solutions............................................................................... 34
5 FUZZY SET THEORY ........................................................................ 37
5.1 Mathematical Foundations of Fuzzy Set Theory ........................... 38
5.1.1 Properties on Fuzzy Sets ............................................................. 40
5.1.2 Fuzzy Number ............................................................................. 41
5.2 Generalized Forms of Fuzzy Sets .................................................... 44
5.3 Theory of Intuitionistic Fuzzy Sets .................................................. 44
5.3.1 Intuitionistic Fuzzy Sets .............................................................. 45
5.3.2 Summary of Comparison ............................................................ 46

8
5.4 Fuzzy and Intuitionistic Fuzzy MCDM Methods ........................... 47
6 HYBRID MCDM METHOD SOLUTIONS ....................................... 50
6.1 Hybrid MCDM versus Single-Method Solutions ........................... 51
7 WEIGHTS USAGE IN MCDM ........................................................... 58
7.1 Choice of a Weighting Method ......................................................... 60
8 A TWO-TIER HYBRID MCDM MODEL ......................................... 64
8.1 Conjoint Analysis Technique and MCDM Methods ...................... 65
8.2 First Tier - Conjoint Analysis ........................................................... 66
8.2.1 Relative importance of attributes/criteria .................................... 67
8.2.2 Types and Uses of Conjoint Analysis ......................................... 68
8.3 Second-Tier – Intuitionistic Fuzzy TOPSIS .................................... 70
8.3.1 Steps for Intuitionistic fuzzy TOPSIS ......................................... 71
9 INTRODUCTION TO NUMERICAL EXAMPLES ......................... 75
9.1 NUMERICAL EXAMPLE 1. ........................................................... 76
9.1.1 Background to the problem ......................................................... 76
9.1.2 The Decision Problem ................................................................. 77
9.2 NUMERICAL EXAMPLE 2 ............................................................ 83
9.2.1 Background to the problem ......................................................... 83
9.2.2 The Decision Problem ................................................................. 84
9.3 NUMERICAL EXAMPLE 3 ............................................................ 90
9.3.1 Background to the problem ......................................................... 90
9.3.2 The Decision Problem ................................................................. 90
10 SENSITIVITY ANALYSIS IN MCDM .............................................. 97
10.1 Schema 1: Swapping Criteria Weight ......................................... 98
10.2 Schema 2: Swapping Decision Makers’ Weights ..................... 102
10.3 Schema 3: Swapping both criteria and decision makers’ weights
concurrently ................................................................................................. 107

9
11 CONCLUSION AND DISCUSSION ................................................ 110
LIST OF AUTHORS PUBLICATIONS ................................................... 126
Curriculum Vitae ........................................................................................ 129

10
LIST OF FIGURES
Fig. 1: Schematic diagram of a typical hybrid fuzzy MCDM Technique .......... 18
Fig. 2: Full decision making process .................................................................. 22
Fig. 3: Hierarchical outline of MCDM methods ................................................. 35
Fig. 4: Examples of membership functions that may be used in different contexts
to characterize fuzzy sets. ............................................................................ 39
Fig. 5: Membership function of triangular fuzzy number ................................... 42
Fig. 6: Two triangular fuzzy numbers ................................................................. 42
Fig. 7: Membership function of triangular fuzzy number ................................... 43
Fig. 8: Relationship among classical sets, fuzzy sets and intuitionistic fuzzy sets
..................................................................................................................... 46
Fig. 9: Crisp, fuzzy and intuitionistic fuzzy sets on a coordinate system ........... 47
Fig. 10: Methodological concept for hybrid fuzzy MCDM literature search ..... 52
Fig. 11: Full Aggregation Methods: Trend of research between hybrid MCDM
and single methods, 2000-2015 ................................................................... 53
Fig. 12: Outranking Methods: Trend of research between hybrid MCDM and
single methods, 2000-2015 .......................................................................... 54
Fig. 13: Hierarchical outline of MCDM methods ............................................... 59
Fig. 14: Schematic diagram for a two-tier hybrid MCDM decision making model
..................................................................................................................... 64
Fig. 15: Conceptual model of TOPSIS method .................................................. 70
Fig. 16: Shareholder’s characteristic preferences of an ideal new manager ....... 79
Fig. 17: Ranking of alternatives (candidates) ..................................................... 82
Fig. 18: Composite attributes of a preferred distributor ...................................... 85
Fig. 19: Final ranking of distributing company distributor ................................. 89
Fig. 20: Final ranking of recruitment process outsourcing vendor ..................... 95
Fig. 21: Plot of sensitivity analysis (schema 1, Numerical example 2) ............ 101
Fig. 22: Plot of sensitivity analysis (Schema 1, Numerical example 3) ........... 102
Fig. 23: Plot of sensitivity analysis (Schema 2, Numerical example 1) ........... 104

11
Fig. 24: Plot of sensitivity analysis (Schema 2, Numerical example 2) ........... 106
Fig. 25: Plot of sensitivity analysis (Schema 2, Numerical example 3) ........... 107
Fig. 26: Plot of sensitivity analysis (Schema 3, Numerical example 3) ........... 109

12
LIST OF TABLES
Table 1. MCDM decision problems and their appropriate methods .................. 29
Table 2. Required inputs for MCDA sorting methods (source [56]). ................ 32
Table 3. Required inputs for MCDA ranking or choice method (source [56]). . 32
Table 4. Results of ranking order between hybrid and selected single MCDM
methods. ....................................................................................................... 55
Table 5. Sample of subjective criteria importance weight ................................. 59
Table 6. Steps in conjoint analysis and various solution approaches ................. 69
Table 7. Methods of data analysis in conjoint measurement .............................. 69
Table 8. Profiles of possible candidate managers evaluated by shareholders in the
experimental design ..................................................................................... 78
Table 9. Attributes (Criteria) and Levels with their part-worths utilities relative
importance ................................................................................................... 78
Table 10. Importance weights of decision makers ............................................. 80
Table 11. Linguistic scales for candidates’ ratings ............................................. 80
Table 12. Decision makers’ ratings of competing candidates ............................ 80
Table 13. Aggregated weighted intuitionistic fuzzy decision matrix (A+,A-) .... 81
Table 14. Relative closeness coefficient and ranking ......................................... 82
Table 15. Attributes (Criteria) and Levels with their part-worths utilities relative
importance ................................................................................................... 85
Table 16. Profiles of preferred distributorship characteristics sought by customers
in the experimental design ........................................................................... 86
Table 17. Importance weights of decision makers ............................................. 87
Table 18. Linguistic scales used in the ratings ................................................... 87
Table 19. Decision makers’ ratings of alternatives ............................................ 88
Table 20. Aggregated weighted intuitionistic fuzzy decision matrix (A+,A-) .... 88
Table 21. Relative closeness coefficient and ranking ......................................... 89
Table 22. Attributes (Criteria) and Levels with their part-worths utilities relative
importance ................................................................................................... 92

13
Table 23. Profiles of preferred distributors’ characteristics sought by customers
in the experimental design .......................................................................... 92
Table 24. Importance weights of decision makers ............................................. 93
Table 25. Linguistic scales used in the ratings ................................................... 93
Table 26. Decision makers’ ratings of alternatives ............................................ 94
Table 27. Aggregated weighted intuitionistic fuzzy decision matrix (A+,A-) ... 94
Table 28. Relative closeness coefficient and ranking ........................................ 95
Table 29. Inputs for sensitivity analysis (Schema 1, Numerical example 1) ..... 99
Table 30. Results of sensitivity analysis (Schema 1, Numerical example 1) .... 99
Table 31. Inputs for sensitivity analysis (Schema 1, Numerical example 2) ... 100
Table 32. Results of sensitivity analysis (Schema 1, Numerical example 2) .. 100
Table 33. Inputs for sensitivity analysis (Schema 1, Numerical example 3) ... 101
Table 34. Results of sensitivity analysis (Schema 1, Numerical example 3) .. 102
Table 35. Inputs for sensitivity analysis (Schema 2, Numerical example 1) ... 103
Table 36. Results of sensitivity analysis (Schema 2, Numerical example 1) .. 104
Table 37. Inputs for sensitivity analysis (Schema 2, Numerical example 2) ... 105
Table 38. Results of sensitivity analysis (Schema 2, Numerical example 2) .. 105
Table 39. Inputs for sensitivity analysis (Schema 2, Numerical example 3) ... 106
Table 40. Results of sensitivity analysis (Schema 2, Numerical example 3) .. 107
Table 41. Inputs for sensitivity analysis (Schema 3, Numerical example 3) ... 108
Table 42. Results of sensitivity analysis (Schema 3, Numerical example 3) .. 109
Table 43: Publications as at 05.12.2015 ........................................................... 126

14
LIST OF SYMBOLS AND ABBREVIATIONS
IFS Intuitionistic fuzzy sets
MCDM Multi-Criteria Decision Making
F-MCDM Fuzzy Multi-Criteria Decision Making
TFN Triangular Fuzzy Number
IFN Intuitionistic fuzzy numbers
IFWA Intuitionistic Fuzzy Weighted Averaging Operator
IFHWA Intuitionistic Fuzzy Hybrid Weighted Averaging
OWA Ordered weight aggregation
AHP Analytic Hierarchy Process
ANP Analytic Network Process
DEMATEL Decision Making Trial and Evaluation Laboratory
TOPSIS Technique for Order Preference by Similarity to Ideal Solution
SIR Superiority and inferiority ranking method (SIR method)
ELECTRE ELimination and Choice Expressing REality
WPM Weighted product model
WSM Weighted sum model
DEA Data Envelopment Analysis
VIKOR Multi-criteria Optimization and Compromise Solution
PROMETHEE Preference Ranking Organization METHod for Enrichment of
Evaluations
MACBETH Measuring Attractiveness by a Categorical Based Evaluation
Technique
MAUT Multi-attribute utility theory (MAUT)
UTADIS Utilities Additives DIScriminantes
GAIA Geometrical Analysis for Interactive decision Aid
DM Decision Makers
SWARA Step-wise Weight Assessment Ratio Analysis
CBCA Choice-Based Conjoint Analysis
CA Conjoint Analysis
TCA Traditional Conjoint Analysis

15
ACA Adaptive Conjoint Analysis
MONANOVA Monotone Analysis of Variance
IF-TOPSIS Intuitionistic Fuzzy Technique for Order Preference by Similarity
to Ideal Solution
PAPRIKA Potentially All Pairwise Rankings of all Possible Alternatives
MODM Multi-Objective Decision Making
MADM Multi-Attribute Decision Making
F-MCDM Fuzzy Multi-Criteria Decision Making
IFPIS Intuitionistic Fuzzy Positive Ideal Solution
IFNIS Intuitionistic Fuzzy Negative Ideal Solution
DANP DEMATEL-based ANP
PCA Principal Component Analysis
XLSTAT Statistics and Data Analysis Software in Excel
16
1 INTRODUCTION
Decision making is largely considered a natural process for all beings with
cognitive abilities. It often arises when one decides to choose the best possible
option among a range of alternatives. When a decision problem involves only a
single criterion, the approach to decision making is often intuitive and much easier
to make. This is because the alternative (option) that receives the highest positive
ratings is adjudged the ‘best’ or the most ideal among the sets of alternatives [1].
In real-life situations however, the nature and complexities of decision problems
require robust methodological approaches that do not only consider multiple
criteria to arrive at optimal decisions, but also the dependencies and confliction
among the criteria. Multi-Criteria Decision Making (MCDM), a sub-discipline of
operations research, surged in prominence when decision makers realized that,
with a growing complexity in problems, it was unrealistic to proffer solutions
using only one criteria or objective function [55]. In view of this, the
methodological approaches adopted in Multi-Criteria Decision Making (MCDM),
depend largely on the nature and level of complexity of the underlying problem.
In practice, the MCDM approach is often either one of deterministic, stochastic,
fuzzy or combinations of any of the above methods. It has been observed and
widely accepted that (MCDM) problems tend to grow much more complex when
the underlying information is uncertain, subjective or imprecise [1]. For instance,
finding the value of the 𝑗-th alternative in a supplier selection problem when
‘quality of product’, a subjective criterion, is used to judge the alternatives [2]. In
such situations, linguistic statements are deemed appropriate to describe the
performance of the alternatives with respect to the criteria considered. When this
approach is followed, quantifying such linguistic statements using deterministic
MCDM approaches can be difficult and often inappropriate. One of the widely
dependable and effective theories used to model linguistic human decisions and
judgements is the concept of fuzzy set theory.
Finding suitable methodologies to deal with uncertain or subjective information
always presented huge challenge to researchers in the past [6], forcing many to
adopt probability theory or present uncertainty as randomness. This challenge
generated interests in research in mathematical theories aimed at adequately
dealing with situations of uncertainty [6]. Consequently, some of the most popular
theories that emerged for uncertainty modelling were fuzzy sets [3] and possibility
theory [7] by Zadeh, the rough set theory by Pawlak [8], Dempster [9], [10] and
Shafer’s [11] evidence theories. As a result of the introduction of such theories, it
became clear that uncertainty can present itself in many forms and therefore
requires caution and scrutiny in finding the relevant methodology suitable for a
particular problem [6]. For instance, in the area of fuzzy sets, many generalized
variants of the theory have been proposed aimed at dealing with different kinds
of uncertainty and thereby improving the science of uncertainty modelling. Some
of these fuzzy generalized forms are the rough sets [58], intuitionistic fuzzy sets

17
[12, 13, 14], interval-valued fuzzy sets [59], hesitant fuzzy sets [60], soft sets [61],
and type-2 fuzzy sets [62, 63] among others.
Since its introduction, fuzzy set approaches have been found a suitable tool in
modelling human knowledge especially in decision making problems that involve
multiple subjective criteria. Over the years, a range of decision support
techniques, methods and approaches have been designed to provide assistances in
human decision making processes [1]. Some of these methods are the Analytical
Hierarchy Process (AHP) [45], Analytic Network Process (ANP) [46], Technique
for Order Preference by Similarity to Ideal Solution (TOPSIS) [47],
VIseKriterijumska Optimizacija I Kompromisno Resenje, which in English is
Multi-criteria Optimization and Compromise Solution (VIKOR) [48], Simple
Additive Weighting Method (SAW) [49], ELimination Et Choice Translating
REality (ELECTRE) [50], Preference Ranking Organization METHods for
Enrichment Evaluations (PROMETHEE) [51], Decision Making Trial and
Evaluation Laboratory (DEMATEL) [52] among several others [22, 23]. Though
many of these methods and techniques were first proposed with a focus on
quantitative or deterministic multi-criteria decision making, they have all since
been extended to deal with situations of imprecision or uncertainty in data using
fuzzy sets. Consequently, fuzzy versions of AHP, TOPSIS, PROMETHEE,
VIKOR and many others have seen wide spread applications in many areas [5].
Besides the fuzzy extensions of the various MCDM methods, another recent
trend in fuzzy MCDM literature, is the use of so-called hybridized methods that
combine more than one of existing MCDM methods in ranking and selection
decision problems. In such instances of combining existing MCDM methods to
solve decision problems, words such as ‘hybrid’ and ‘integrated’ are often used
to describe the adopted methodological approach. An example could be a hybrid
composed of AHP-TOPSIS or ANP-VIKOR etc. The premise for such
combinations or hybrid methods is to adopt different MCDM methods to tackle
different stages in a typical structured multi-criteria decision making. In typical
MCDM solution, there are a number of processes and steps that are often
followed. Some of these are identifying the problem, constructing the preferences,
weighting the criteria and decision makers, evaluating the alternatives, and
determining the best alternatives [14, 15, 16]. Figure 1 shows a flowchart of some
of the processes involved in typical hybrid MCDM solutions. In such hybrid and
integrated MCDM methods, the practice is to adopt different MCDM methods to
set criteria weights, aggregate decision makers’ preferences or rank the
alternatives. Since each MCDM method has its strengths and weaknesses,
Decision Analysts must ensure the appropriateness of a hybrid method to a
particular decision problem. Another issue with the hybrid methods is that, in
most cases when a single MCDM method is utilized for the same underlying
problem, the output as far as the ranking of the alternatives tends to be the same.
This dissertation investigates the use of hybridized integrated MCDM methods
against single-method solutions to help determine (1) the appropriateness and

18
usefulness of hybridized methods to an MCDM problem and (2) which MCDM
methods are considered appropriate for setting criteria weights or ranking
alternatives in hybridized solutions and under what conditions.
Fig. 1: Schematic diagram of a typical hybrid fuzzy MCDM Technique
Setting up a decision making team
STEP 1:
Group decision
Consensus
in criteria
weight?
Determining set of alternatives
Determining set of criteria
Determine range of linguistic terms
Assigning criteria weights via
(AHP, ANP, ELECTRE, etc.)
Experts’ rating of alternatives
Aggregation of experts’ ratings
Determining final rank
STEP 2:
Choice of an
MCDM method
for weight setting
(eg. ANP)
STEP 3:
A different method
ranking
(eg. TOPSIS)
Consensus
in expert
ratings?
Yes
No
No
Yes

19
Further, based on the results in the first part of this work, the dissertation
proposes a novel 2-tier hybrid decision making model using Conjoint Analysis
and intuitionistic fuzzy TOPSIS method to demonstrate an ideal application of
such hybrid method. The usefulness of the proposed hybrid method is
demonstrated in special cases of incorporating or merging preference decisions of
a large decision group (non-experts DMs) such as customers or shareholders into
decisions by a relatively small group (experts), to form a single composite
decision. The Conjoint analysis method is used to model preferences of the large
group into criteria weights whiles the Intuitionistic Fuzzy - Technique for Order
Preference by Similarity to Ideal Solution (IF-TOPSIS) is used to rank competing
alternatives with the help of expert knowledge.
To demonstrate the applicability of the proposed hybrid methods, three
numerical examples of such 2-tier (multi-level) decision making model are
provided in case studies. The first case study focusses on the selection of a new
manager in a microfinance company where shareholder preference decisions are
incorporated into board management decisions. The second numerical example
models the incorporation of customer preferences into management decisions
involving the selection a company distributor. Finally the third study looks at the
selection of recruitment process outsourcing vendor where Human Resource (HR)
managers’ preferences and trade-offs are incorporated into management decision.
The work further tests the reliability of the ‘ranking’ decisions in each of the case
studies by designing novel sensitivity analysis to determine the congruent effect
on the decisions when certain input parameters are altered.
The dissertation is divided into 2 main parts in an 11 chapter series. The first
part composes of the introduction, aims of the dissertation, state of the art,
theoretical foundations of MCDM, fuzzy set theory, investigation into hybridized
MCDM methods and the concept of weights setting in MCDM. The second part
of the 4 remaining chapters, comprises of the proposed hybrid method, numerical
examples, sensitivity analysis as well as conclusion and discussion. In the first
part, a thorough introduction and review of hybridized fuzzy multi-criteria
decision approaches are presented. This is followed by the aims of the dissertation
and the research problem, the identified research space and an outline of how the
dissertation fills the research space. Subsequently in the second part, the proposed
hybrid method of Conjoint Analysis – Intuitionistic Fuzzy TOPSIS method
together with their underlying mathematical expressions and how the model
works, are presented. This is followed by three numerical examples in chapter 9
that demonstrate the ideal applicability of the proposed hybrid method and how it
compares with other fuzzy hybridized MCDM methods. Chapter 10, provides
novel sensitivity analysis approaches to the results of the numerical examples,
demonstrating how several input parameters can be changed to observe the overall
effect on the final ranking of the alternatives. Finally, Chapter 11 summarizes the
dissertation by presenting contributions to knowledge, identifying limitations in
the work as well as the direction for future work.

20
2 AIMS OF THE DISSERTATION
The overall aim of the research is to expand knowledge on fuzzy multi-criteria
decision making methods (MCDM). In particular, the dissertation reviews and
compares fuzzy hybrid MCDM methods against single-method fuzzy MCDM
solutions. This is to bring to light the appropriate use of the two approaches. A
hybrid MCDM method is further proposed with numerical examples to
demonstrate how it can be used in special decision problems. The following is an
outline of the aims of the dissertation:
To investigate the use of hybridized or integrated MCDM methods against
one-method solutions. To determine:
o when a hybrid method solution is useful to a selection problem.
o which MCDM method is ideal for setting criteria weights in a
hybridized method and under what conditions.
To design a new hybrid MCDM method that incorporates user (consumers,
shareholder, etc.) preferences and expert decisions in an ideal decision
making situation. The proposed method is composed of Conjoint Analysis
– Intuitionistic Fuzzy TOPSIS and are specifically used in the following:
o Conjoint Analysis for setting criteria weights
o Intuitionistic Fuzzy TOPSIS for ranking competing alternatives
To test the proposed hybrid fuzzy MCDM model with real-life numerical
examples and provide sensitivity analysis schemas to test the reliability of
decisions.

21
3 STATE OF THE ART
The early 70s and 80s, saw a gradual rise in the development of theories and
methods relating to the concept of multi-criteria decision making (MCDM).
Though the exact name had not been conceived then, several researchers provided
many important contributions which paved the way for the many MCDM methods
in existence today. According to [72], the notion of Goal programming was a
strong contributory influence to the development of MCDM concepts since most
of the earliest MCDM topics centered on optimization. Following Goal
programming, another concept that generated huge interests in the 70s to help
shape the field of MCDM was the development of vector optimization algorithms.
The focus on vector-valued objective function capable of computing multiple
objective programs with all non-dominated solutions spawn interests especially
among [74, 75, 76, 77, 78, 79] as cited in [73]. It was later realized according to
[73], that there was a challenge or limitation with the vector-valued function as a
result of the size of the growing non-dominated solutions. This challenge
generated interests in alternate interactive solutions notably by [80, 81, 82] which
were a step closer to setting up the field of MCDM. In particular, works by
Sawaragi, Nakayama and Tanino [65] provided an extensive mathematical
foundation and insight into the operations of MCDM. Their mathematical
foundations were preceded by Hwang and Masud [66] and later Hwang and Yoon
[47] who brought clarity into how many of the MCDM methods work and are
distinct from each other. Zeleny [67] also focused on methods and decision
processes with emphasis on the philosophical aspects involving multi-criteria
decision making in general. Others like Vincke [68] strengthened and provided
divergent views on how MCDM methods are approached. Steuer [69]
strengthened the area of linear MCDM problems with useful theoretical constructs
especially on how to analyze different MCDM problems. These developments
enumerated above, strengthened the resolve of more researchers in the area of
multi-criteria decision making (MCDM).
The domain of research in multiple criteria decision making has since evolved
rapidly with several MCDM methods formulated to aid decision making in very
complex decision problems [53]. The nature and level of complexity of the
problem, however determine the methodological approach adopted. The approach
could either be one of deterministic, stochastic, fuzzy or combinations of any of
the above methods. During the last half of the century, a multitude of such
methods has been developed to adequately deal with different kinds of decisions
problems. Some of the notable MCDM methods that have had wide spread use
and which were developed as a result of the theoretical foundations laid earlier in
the 60s and 70s are the following. The Analytical Hierarchy Process [45] which
is one of the most widely used MCDM methods and its variant, the Analytic
Network Process (ANP) [46] method, were both developed by Saaty. Another
widely used method both in industry and academia is the Technique for Order

22
Preference by Similarity to Ideal Solution (TOPSIS) method propounded by
Hwang and Yoon [47]. Others are Opricovic’s VIseKriterijumska Optimizacija I
Kompromisno Resenje, which in English is Multi-criteria Optimization and
Compromise Solution (VIKOR) [48], ELimination Et Choice Translating REality
(ELECTRE) by Roy [50] and subsequently by Roy and Vincke [53], Preference
Ranking Organization METHods for Enrichment Evaluations (PROMETHEE) by
Brans and Vincke, [51], Decision Making Trial and Evaluation Laboratory
(DEMATEL) [52]. Some of the very recent MCDM methods additions are the
Measuring Attractiveness through a Category Based Evaluation Technique
(MACBETH) by Costa, Bana, and Vansnick [70], Potentially all pairwise
rankings of all possible alternatives (PAPRIKA) by Hansen and Ombler [71], and
Superiority and inferiority ranking method (SIR) by Xu [72].
Typically in decision analysis, there tends to be a structured series of processes
such as: problem identification, preferences construction, alternatives evaluation
and determination of best alternatives [1, 15, 16]. However, it must be noted that
decision making is a laborious task that does not always start with problem
identification and end with a choice of an alternative.
Fig. 2: Full decision making process (Source: [82])
INTELLIGENCE
Observe reality
Gain problem/opportunity understanding
Acquire needed information
DESIGN
Develop decision criteria
Develop decision alternatives
Identify relevant uncontrollable events
Specify the relationships between criteria, alternatives, and events
Measure the relationships
CHOICE
Logically evaluate the decision alternatives
Develop recommended actions that best meet the
decision criteria
IMPLEMENTATION
Ponder the decision analyses and evaluations
Weigh the consequences of the recommendations
Gain confidence in the decision
Develop an implementation plan
Secure needed resources
Put implementation plan into action

23
Simon [82] proposed a paradigm that seemingly embodies the whole processes
of human decision making. This widely used paradigm was first composed of
three phases namely intelligence, design, and choice. A fourth phase,
implementation, was later added as illustrated in figure 2. Simon describes the
intelligence phase as when the decision maker ‘observes the reality’, gets an
appreciation of the problem domain and seeks for opportunities out of the
problem. Subsequently, the intelligence phase also gathers all relevant
information about the problem to help arrive at an ideal solution. The next stage
is termed the design phase where all relevant decision criteria, alternatives as well
as events are modelled under a mathematical formulation. In MCDM problems,
this is called the decision matrix. The paradigm also stresses that the relationships
among the decisions, alternatives and relevant events are specified and measured
[82] as cited in [83]. Finally, the implementation phase offers the decision maker
the chance to ponder over the decision made and consider the consequences the
decisions could potentially have over the circumstances. To carry out the
implementation, it is also prudent that all the necessary resources needed are
secured. When these are followed, then according to Simon’s decision making
paradigm, the implementation plan is ready to be executed. The decision paradigm
must also be seen as a continuous loop where each stage in the process is
constantly reviewed or evaluated especially as and when new information is
received. In this dissertation, the focus is on stage 2, the design phase (as shaded
in figure 2) where a new hybridized and integrated MCDM method is proposed
for a special case of merging decision streams from two different sets of decision
makers.
In the following section, the theoretical foundations of the concept of MCDM
are mathematically explained. Key terminologies used in MCDM approaches are
also outlined.

24
THEORETICAL PART

25
4 THEORETICAL FOUNDATIONS OF MCDM
Multi-Criteria Decision Making (MCDM) is generally composed of two
approaches; multi-objective decision making (MODM) and multi-attribute
decision making (MADM). However the terms MADM and MCDM are most
often used interchangeably to mean the same thing. In this dissertation, MCDM
would most often be used to mean MADM. More generally, MCDM (MADM)
thrives on the assumption that the underlying decision problem has a finite set of
alternatives [55]. In such decision problems, the set of competing alternatives are
therefore predetermined [2]. On the other hand, MODM works best in an
environment where the decision space is continuous [2], meaning an infinite
subset of a vector space defined by restrictions.
Formally, an MCDM problem
,A f (1)
is referred to as multiple attribute decision making (MADM) problem if 𝐴 is finite.
In this case problem ρ can be expressed as an MADM decision matrix .u vS R
where
1 2, ,..., ua a aA (2)
and
1 2, ,...,h h h hvs s sa (3)
for all 1,...uh
An MCDM problem ,A f is referred to as multiple objective decision
making (MODM) problem if 𝐴 can be written as:
, : ( ) 0, 1,...,n n
iA R A a R g a i m (4)
with restrictions
: , 1,..., .ng R R i m (5)
In MCDM or more appropriately, MADM problems, a number of terminologies
have become industry standards guiding both research and industry applications.
Some of these terminologies are the following.
Decision Maker (DM)
In MCDM problems, the decision maker typically initiates and ends the
decision process. The DM in this regard is responsible for structuring the decision
problem, determining the sets of alternatives, choosing an alternative and finally
reviewing the decisions made. In practice however, DMs are mostly experts with
considerable knowledge regarding both the alternatives and the criteria to be used
in judgement [1]. However, the DM is most always not a decision analyst. The
decision analyst is one who aids the decision making process by offering
appropriate formal methods (MCDM methods) to guide or assist decision makers.
Therefore the decision maker (who gives judgements) and the decision analysts

26
who chooses appropriate methods suitable for the problem at hand, are all very
important to the process.
Alternatives
In structured decision making, alternatives usually refer to the choices of action
or options available to the decision maker. These competing alternatives are pre-
screened, prioritized and finally the best is/are selected [2]. In this dissertation,
the focus is on MADM problems and therefore alternatives are considered to be
finite.
Criteria
The term criteria is used interchangeably with the terms attributes and goals, to
describe the different performance measures from which the alternatives are
assessed. In decision problems where multiple criteria are considered, the practice
is to arrange the criteria in a hierarchical structure especially when they are so
much in number. In this case, major criteria are created with associated sub-
criteria. In rare cases, some sub-criteria may also have their related sub sub-
criteria. Furthermore, it is observed that in some cases, the multiple criteria tend
to conflict with one another especially when there are tradeoffs among two or
more criteria. An example is criteria; cost and quality, when the goal is to
minimize cost and concurrently maximize quality [2]. However, regarding
conflicts in MCDM, Zeleny [64] argues that the conflicts arise not among criteria
but rather among the alternatives.
Decision Weights
In MCDM, most of the methods employ the notion of criteria weights where
the range of criteria used in judgements are prioritized in terms of their relative or
contributory importance to the final decision. In other instances, not only are the
criteria weighted, the decision makers are also sometimes assigned weights on the
assumption that not all the DMs are equal in importance [1,2, 55]. Typically in
most MCDM methods, the weights are normalized so that their aggregation adds
up to one. There are a number of ways of estimating the weights of criteria or
DMs such as through various optimization approaches or by the use of different
MCDM methods [2, 53]. Chapter 7 expounds the concept and development of
weighting methods especially in MCDM.
Decision Matrix
In structured MCDM, the decision problems are formulated for easy analysis
in a matrix format involving decision makers, the alternatives and the measuring
criteria. More formally, a decision matrix for DM 𝑘 is an (m x n) matrix where
𝐴 = {𝐴1, 𝐴2, … , 𝐴𝑚} are the set of alternatives to be considered, 𝐶 ={𝐶1, 𝐶2, … , 𝐶𝑛}, the set of criteria and, 𝑘 = {𝐷1, 𝐷2, … , 𝐷𝑑} the sets of decision
makers. Equation. (6), shows a decision matrix for decision maker, 𝑘 = 1,2,… , 𝑑

27
𝐶1 ⋯ 𝐶𝑛
𝑘 = 𝐴1⋮𝐴𝑚
[
𝑥11 ⋯ 𝑥1𝑛⋮ ⋱ ⋮𝑥𝑚1 ⋯ 𝑥𝑚𝑛
], i = 1, 2, …,m; j = 1, 2, …,n (6)
𝑊 = [𝑤1, 𝑤2, … , 𝑤𝑛] , j=1,2,…,n (7)
where 𝑥𝑖𝑗 is the rating of alternative 𝐴𝑖 with respect to criterion 𝐶𝑗 . Similarly, it
also assumes that there is a predetermined weight for the criteria indicating the
relative importance of each criterion in relation to the decision making. In this
regard, 𝑤𝑗 in Eq. (7) denotes the weight of a criterion for j = 1, 2, 3, ... , n).
4.1 Taxonomy of MCDM Problems and Methods
Decades ago, decision makers may have felt helpless when faced with multi-
criteria decision problems. Today, whiles the decision maker would not be overly
lacking in terms of solutions to complex multi-criteria problems, the sheer
numbers of different MCDM methods available, also poses a challenge to DMs
in terms of the appropriateness of a method to a problem. In view of this,
classifying MCDM methods under various groupings with similarities in features,
is seen as a step to minimizing problems with method choice abuses. Classifying
MCDM problems and its range of solutions and methods, help to tailor
appropriate methods and solutions for specific problems. Further, it is also useful
since every MCDM method has its own sets of characteristics unique to how it
approaches decision problems. It must also be stated that none of the MCDM
methods is absolutely perfect nor can offer solutions to all decision problems.
Multi-criteria decision making methods may be classified in several ways. For
example the distinction can be made according to (1) the problems suitable for the
method (2) number of DMs involved (3) the nature of the alternatives (4) the kinds
of data used by the methods and (5) the solution appropriateness to the problems
[2]. When the classification is based on the number of decision makers, the
outcome is either one of a group decision making or a single person decision
making. On the other hand, when the consideration is on the kind of data to input
into the method, then we may have deterministic, stochastic, or fuzzy MCDM
methods [2]. According to [84], MCDM methods may also be grouped under two
main classes; continuous and discrete methods, when the nature of the alternatives
involved is considered. The continuous methods belong to the class of multi-
objective decision making (MODM) problems where the focus is finding an
optimal quantity that can be varied infinitely in a decision problem with an infinite
subset of a vector space defined by restrictions. Typical MODM methods suitable
for such problem scenarios are Goal programming and linear programming.
Discrete MCDM methods on the other hand come under the MADM branch of
MCDM where there is a pre-condition that a finite number of alternatives are
considered. Because of this pre-condition, the set of alternatives are always pre-

28
determined. Further according to [85], MADM (discrete) methods are also
grouped into ranking methods and weighting methods, which are further
subdivided into qualitative, quantitative, and mixed methods [85]. For
quantitative methods, the required data has to be in either cardinal or ratio data
format [84]. Qualitative methods on the other hand require ordinal data.
Another useful form of classification is value and utility-based methods which
aid decision-makers to effectively construct preferences. In particular is the
Analytical Hierarchy Process which is by far the most popular and widely used
method under the value and utility based approaches. Other notable ones are the
Multi-attribute value theory (MAVT) and Multi-attribute utility theory (MAUT).
Though the AHP and MAVT almost employ the same decision design paradigm,
the AHPs approach in terms of setting criteria weights and rating alternatives
differ considerably from MAVT approach. Some MCDM classifications also
centre on certainty and uncertainty methods. The MAVT methods fall under the
category of quantitative but riskless category whiles the MAUT as well as the
‘French School’ methods such as ELECTRE (Elimination and (Et) Choice
Translating Reality) belong to the quantitative but risk category [84].
In real world applications, MCDM problems come with imperfect knowledge,
vagueness or subjectivity mostly as a result of human judgements. This makes
such decision problems complex to model. In view of this, information used by
MCDM methods are also sometimes classified as either crisp or fuzzy.
Information is considered crisp when it is deterministic or precise. On the other
hand, an MCDM information is considered fuzzy when it is imprecise, subjective,
incomplete or vague. Fuzzy set theory is used in dealing with this kind of
information. The fuzzy data modelling extends the usual classification of
MADM/MODM in MCDM to FMADM/FMODM (Fuzzy MADM/ Fuzzy
MODM) [4].
4.2 MCDM Problem-Based Classification
Sufficient research indicates that multi-criteria decision problems appear in a
wide range of areas and disciplines most notably in Economics, Operations
research, Information systems, Environmental management, Logistics and supply
chain management, Social Science among others [5]. However, irrespective of
where the decision problems appear, they typically fall under four categories
enumerated by Roy [53] and cited in [55]. These types of decision problems are
as follows:
I. Choice problem. In choice or selection decision problems, the objective
is to choose or select a best option among a finite set of competing
alternatives. A typical example is a car choice problem where the best
car is selected from a range of options under some criteria.
II. Sorting problem. In sorting problems, alternatives are grouped into
ordered and predefined groups that share similar characteristics or
features. For example, in employee performance evaluations, they may

29
be grouped into different classes according to how they are performing
as in: ‘over-performing’, ‘fairly-performing’ and ‘under-performing’
employees’. Such sorting could help in administering reward and
punitive measures. Sorting decision problems are also sometimes
employed in initial screening to precede a selection problem.
III. Ranking problem. Decisions problems that require ranking solutions
typically order alternatives from the best or the most ideal to the worst
through pairwise comparisons or through distance based measures. For
instance, in job positions that plan to hire more than one candidates,
performances during the interview are ranked to select deserving
candidates.
IV. Elimination problem. This acts as a branch of sorting decision problems
where the focus is to eliminate unwanted options with comparable
features or which do not meet a certain requirements from a host of
options. In such scenarios, a minimum threshold value is set to eliminate
options that do not meet the threshold.
Table 1. MCDM decision problems and their appropriate methods MCDM Methods Choice/Selection
Decision
Ranking
Decision
Sorting
Decision
Descriptive
decision
AHP
ANP
AHPSort
DEA
DEMATEL
ELECTRE I
ELECTRE III
ELECTRE-Tri
FlowSort
GAIA
Goal Programming
MACBETH
MAUT
PROMETHEE
TOPSIS
UTADIS
VIKOR

30
In Table 1, popular decision making methods that are generally deemed
appropriate for solving peculiar problems are presented. However, to solve these
decision problems, a formal analysis approach is often necessary to understand
the demands of the underlying problem. Three of such formal analysis methods
as identified by [16, 57] and cited in [1] are the descriptive, prescriptive and
normative formal analysis. The descriptive analysis approach focuses on
problems that DMs actually provide solutions to whiles prescriptive analysis
reviews and identifies methods appropriate for DMs to use to solve decisions
problems. Normative analysis on the other hand addresses the kinds of problems
that DMs should ideally solve. This dissertation combines the prescriptive and the
normative formal analysis approach in both investigative and design approaches
of hybrid MCDM methods.
Again in Table 1, it is shown that each method has its own strengths,
weaknesses and a general limitation regarding the kinds of problems they can
solve. According to [85], the great diversity of MCDA methods, though a positive
development, also presents problems especially of choice. Whiles there has not
been any framework that helps to decide which method is perfectly appropriate
for a particular problem, Guitouni [86] proposed a preliminary investigative
framework to aid in the difficult situation of choosing an appropriate multi-criteria
method for a suitable problem. In the framework, Guitouni [86] explains the
different ways of choosing an MCDA method specific to problems. In Tables 2
and 3, are the guides to the kinds of input and output information required as well
as the computational effort involved. For example the framework explains that if
the ‘utility function’ for all of the criteria are known, then the multi-attribute
utility theory (MAUT) is appropriate. It must however be recognized that
constructing such utility functions comparatively requires a greater effort. The
concept of pairwise comparison can also be used to group some of the MCDM
methods. In particular are AHP and MACBETH that support this approach of
pairwise comparison of either or both the criteria and the alternatives. However,
for AHP, pairwise comparison is based on a ratio scale whiles an interval scale
pairwise evaluation is used for MACBETH [84, 86]. The challenge of choice
between the AHP and MACBETH should therefore be decided based on how best
each scale, whether ratio or interval is suited to the underlying problem.
According to [84], yet another way to approach the classification is to look at the
key parameters involved. Regarding this approach, the PROMETHEE and the
ELECTRE methods which both belong to the French School methods, are also
seen to operate slightly differently from each other. PROMETHEE supports
indifference and preference thresholds. On the other hand, the ELECTRE method
requires indifference, preference and veto thresholds [84]. Further in terms of
focusing on key parameters to distinguish one MCDM method from the other, are
the elicitation methods which assist to define these key parameters. Another key
MCDM method widely used is the TOPSIS method which essentially functions
on a so-called positive and negative ideal solutions. TOPSIS is ideal if a decision

31
analyst wants to avoid the PROMETHEE and ELECTRE which look for key
parameters. Another method similar to TOPSIS with a similar distance-based
approach is the VIKOR method. The VIKOR method also introduces a so-called
best and worst values to separate the alternatives in terms of their performances.
Yet another useful way of classifying MCDM methods is based on the concept
of full-aggregation methods, outranking methods and Goal, aspiration or
reference level methods. In full aggregation approaches, also known as complete
ranking or the American School approach, the alternatives considered in the
decision problem have a global score where all alternatives are evaluated and
ranked from best to worst or sometimes equal ranking [56, 84]. Methods such as
TOPSIS, AHP and VIKOR are classic examples of such methods. One advantage
with full aggregation methods is that, if an alternative is rated with a bad score on
one criterion, it could be compensated for by a good score on another criterion
[84]. On the other hand, outranking methods, also known as the French school
methods, are based on pairwise comparisons. This implies that alternatives are
compared ‘head-on’ two at a time using their preference scores. The preference
or outranking degree indicates how much better one alternative is than another
[84]. In Goal, aspiration or reference level methods, a goal is defined based on
each criterion, and then alternatives closest to the ideal set goal or reference level
are selected. Furthermore, with full aggregation methods, where the global score
is the ultimate focus, it is sometimes possible to have incomparable alternatives
especially where two alternatives have different profiles. For example, one
alternative may be evaluated as ‘better’ on one criteria and the other alternative
‘better’ when evaluated on another set of criteria. According to [56], such
incomparability is as a result of the non-compensatory nature of those methods.
In view of this, [56] recommends that the type of output sought by a decision
analyst should be given the same importance as the input data required. In Tables
2 and 3 are guides to understanding the input and output required for some
selected MCDM methods. Some methods that belong to the MCDA family but
are rarely classified as such are, data envelopment analysis (DEA) and conjoint
analysis. DEA is primarily used for performance evaluation or benchmarking of
units. As a typical deterministic method, DEA requires crisp or precise data inputs
rather than subjective inputs. However with time there have been several
extensions of DEA into fuzzy environments such as in [87, 88]. Conjoint analysis
is used to elicit consumer preferences where tradeoffs are typically made. This
dissertation employs conjoint analysis, though a method outside the scope of
MCDM, to demonstrate its unique strengths and similarities to MCDM methods.

32
Table 2. Required inputs for MCDA sorting methods (source [56]).
SO
RT
ING
PR
OB
LE
M
Inputs Effort input MCDM
Method
Output
Utility function HIGH UTADIS Classification with
scoring
Pairwise comparisons on a ratio
scale
AHPSort Classification with
scoring
Indifference, preference and
veto thresholds
ELECTRE-TRI
Classification with
pairwise outranking
degrees
Indifference and preference
thresholds
LOW
FLOWSORT
Classification with
pairwise outranking
degrees and scores
Table 3. Required inputs for MCDA ranking or choice method (source [56]).
RA
NK
ING
/CH
OIC
E P
RO
BL
EM
Inputs Effort
input
MCDM
Method
Output
No subjective inputs required DEA Partial ranking with
effectiveness score
Positive and negative ideal
solutions
VERY
LOW
TOPSIS Complete ranking with
closeness score
Best and worst values
(Distance based separation
measures)
VIKOR Complete ranking with
compromise
ideal option and constraints Goal
Programming
Feasible solution with
deviation score
Indifference and preference
thresholds
PROMETHEE Partial and complete ranking
(pairwise preference degrees
and scores)
Indifference, preference and
veto thresholds ELECTRE Partial and complete ranking
(pairwise outranking degrees)
Pairwise comparisons on a
ratio scale
AHP Complete ranking with scores
Pairwise comparisons on an
interval scale MACBETH Complete ranking with scores
Pairwise comparisons on a
ratio scale and
interdependencies
ANP Complete ranking with scores
Utility function
MAUT
Complete ranking with scores
VERY
HIGH

33
4.3 Other Types of Classification
Multi-criteria decision making methods can also basically be grouped into
compensatory and non-compensatory methods [89]. This distinction is premised
on ‘whether advantages of one attribute can be traded for disadvantages of another
or not’ [89]. A decision problem is classified as compensatory if trade-offs are
permitted among the set of criteria or attributes. On the other hand, the non-
compensatory methods do not allow trade-offs among criteria. To this end,
compensatory approaches, according to Yoon and Hwang [47, 89] are cognitively
and computationally challenging but however produces optimal and rational
decisions. Non-compensatory methods are largely seen to be simple both in terms
of computational efforts and cognitive demands because each criterion stands
independent in the evaluation. This means an inferiority or superiority in a
criterion cannot be compensated for or balanced with an inferiority or superiority
from another criterion. With the rationale behind each MCDM method been
different and unique, the task of identifying an appropriate method is equally
essential to ensuring optimal solutions to decision problems. The following are
some methods which fall under the category of compensatory/non-compensatory.
4.3.1 Compensatory Methods
The Compensatory methods which allow for trade-offs among criteria can also
be divided into the following subgroups.
Scoring Methods: In scoring methods, a score also known as utility is used
to express preference of one alternative or sometimes criterion over
another. Some of the popular MCDM methods in this category are Simple
Additive Weighting method (SAW) and the Analytical Hierarchy Process
(AHP). Scoring methods typically design a preference scale on a range of
[0,1].
Compromising Methods: MCDM methods in this category use distance
based separation measures to choose a best alternative. A best alternative
is considered as the one closest to the ideal solution and concurrently
farthest from the anti-ideal solution. MCDM methods that employ this
approach are the Technique for Order Preference by Similarity to Ideal
Solution (TOPSIS) and VIseKriterijumska Optimizacija I Kompromisno
Resenje, which in English is Multi-criteria Optimization and Compromise
Solution (VIKOR). TOPSIS uses the terms positive ideal and negative ideal
solutions to respectively describe the distances closest and farthest from the
ideal solution. VIKOR on the other hand uses ‘best’ and ‘worst’ values to
describe the distance separations [4].
Concordance Methods: Concordance MCDM methods create a preference
ranking in accordance with a given concordance measure. The alternative
with relatively many highly rated criteria is chosen the best [72, 47]. The
Linear Assignment Method is a popular method in this category.

34
4.3.2 Non-Compensatory Methods
MCDM methods that are non-compensatory and therefore do not allow for
trade-offs among sets of criteria can also further be broken down into the
following:
Dominance method: In the dominated scenarios, all dominated alternatives
are removed [72].
Maxmin method: The maximin strategy is often described as conservative
in that it basically identifies the worst (minimum) criteria value of each
alternative and then selects the alternative that with the best (maximum)
criteria value. It must be noted that the maximin method is only applicable
when criteria (attributes) values are comparable [72, 86].
Maximax Method: The maximax approach is a direct contrast to the
maxmin method in that the best criteria value of each alternative are
identified and the alternative with the maximum of these criteria values is
the designated as the best alternative [72,86].
Conjunctive constraint method: In this method, a minimum threshold value
is set for each criterion in the selection process. By comparing how each
criterion fares against the threshold value, the decision maker decides
whether the standard meets his/her expectations. If they meet his
expectations, then the DM has a satisfying alternative.
Disjunctive constraint method: In this method, an alternative’s best
criterion or attribute value is the focus. The rest of the alternative’s weak
criteria are not factored in the evaluation [72].
4.4 MCDM Solutions
MCDM methods produce several kinds of solutions. These solutions are mainly
based on a number of things most especially the nature of the solution. According
to [47], since there are no absolute perfect solutions, MCDM problems may not
always have a perfect outcome or solution. Some of the names given to different
MCDM solutions are the following as explained in [72].
Ideal solution: Typically in MCDM, an ideal solution is described as one
that concurrently maximizes the benefit (profit) criteria and minimizes
the cost criteria. Criteria that give some benefits or result in profits are
maximized whiles those that bring some element of cost are as much as
possible, minimized. In practice according to [47], ideal solutions are
hard to come by and therefore decision analysts look next to non-
dominated solutions.

35
Fig. 3: Hierarchical outline of MCDM methods (source: [2])
Pairwise preference
Order of
pairwise proximity
Multi-Criteria
decision making
Information
about criteria
No information
Information
about alternatives
Ordinal
Cardinal
Marginal rate of
substitution
Standard level
Conjunctive
Disjunctive
Dominance
Minmax
Maxmin
Lexicographic
Permutation
Elimination by
aspects
TOPSIS
ELECTRE
VIKOR
PROMETHEE
Linear
assignment
SAW
MOORA
COPRAS
ARAS
LINMAP
Multidimensional
scaling with ideal point
Interactive SAW
Information type Features of
information
Major classes of
MCDM methods
Hierarchical
tradeoff

36
Non-dominated solutions: In MCDM problems, a non-dominated
solution is one that relatively outperforms the other competing
alternatives on all or most of the criteria under consideration. Dominated
solution, which is not preferred, is one that is outperformed by all other
alternatives in the evaluation.
Satisfying solutions: A solution is described as satisfying if it meets most
of the expectations of the decision analyst. Whiles a satisfying solution
may not always be a non-dominated one, it is termed as the ‘best’
solution in the moment considering all the constraints.
Preferred solutions: A preferred solution is a non-dominated solution
that best satisfies the decision maker’s expectations.
In figure 3, the various methods, approaches and solutions are outlined in a
hierarchical structure to demonstrate where each method or solution belongs and
by extension the appropriateness of a method to a solution.
Having reviewed MCDM problems, solutions, methods and their
appropriateness to decision making, the following section looks at fuzzy logic –
the tool that extends deterministic MCDM methods to deal with issues of
uncertainty, imprecision and subjectivity in human decision making. Theoretical
foundations of the fuzzy set theory are presented and further extended into its
generalized form, the intuitionistic fuzzy sets.

37
5 FUZZY SET THEORY
The world is filled with several kinds of uncertainty which is often as a result
of the absence of information, inaccuracies in measurements and a general
imperfection in the information we receive. One source of such imperfect
information is the use of our natural language to describe, communicate or share
information [90]. Since our natural languages are imbibed with concepts and
terms that do not have exact meaning or sharp boundaries, we often have
disagreements in what a term or an idea exactly means. This is referred to as
subjectivity in natural language usage. For example, human understanding of
what the terms or phrases, thin, large, much younger, quite beautiful, very secure,
very warm, hot etc. are relative in terms of the degree of definitional acceptance.
These lack of clarity or imprecision in our expression of concepts is referred to as
fuzziness or grey concepts. In the early 50s and 60s, several attempts were made
at efficiently modelling such fuzzy concepts. One theory that won wide acclaim
or acceptance was fuzzy logic by Lofti Zadeh [3]. The fuzzy set theory has
therefore become one of the de-facto standards for modelling linguistic
expressions that hold uncertainty, subjectivity and data with no sharp boundaries
in terms of their intended meaning. The concept which is based on many-valued
logic of relative graded membership, is a generalization of the classical set theory
[91, 92]. In classical sets, an element in a set either belongs or do not belong but
in fuzzy sets, an element can belong to more than one set [17]. In summary,
classical sets is described as bi-valent with sharp crisp boundaries whiles fuzzy
sets are many-valued with loose boundaries [6].
Though Zadeh’s concept of fuzzy logic was conceived as a mathematical tool
to deal with issues of uncertainty, imprecision and vagueness with formalized
methods, the attempt at many-valued logic began centuries and millennia ago with
works by Aristotle (law of the excluded middle). Plato, Łukasiewicz (three-valued
logic), Knuth (three-valued logic). However, it was Zadeh who ultimately
introduced the concept of infinite-valued logic in his seminal work titled “fuzzy
sets” and therefore fuzzy logic [90, 17, 91]. Fuzzy logic creates a so-called
member functions over a range of real numbers from [0,1]. Fuzzy logic brought
to the fore, the limitations with using conventional or classical approaches in
knowledge representation especially problems that hold uncertainty data. It was
realized that the first order logic and classical probability theory were not
appropriate methodologies for modelling uncertainty in our ‘commonsense
knowledge’ which are lexically imprecise in nature [91]. According to Zadeh, Klir
and Yuan [91], any fuzzy logic system should possess the following essential
characteristics. That in fuzzy logic:
exact reasoning has a limiting case of approximate reasoning.
everything is a matter of degree.
knowledge is interpreted as a collection of elastic or, equivalently, fuzzy
constraint on a collection of variables.

38
Inference is viewed as a process of propagation of elastic constraints.
Any logical system can be fuzzified.
In summary, Zadeh [92] posits that, for better performance and appropriateness
of use, the two most important characteristics that must be looked out for prior to
the use of fuzzy logic systems are:
Fuzzy systems are suitable for uncertain or approximate reasoning,
especially for systems with a mathematical model that is difficult to
derive.
Fuzzy logic allows decision making with estimated values under
incomplete or uncertain information.
5.1 Mathematical Foundations of Fuzzy Set Theory
The fuzzy set theory is a generalization or a comprehensive form of the crisp
set. Formally, the classical or crisp set is defined in the following:
Definition 1: Let 𝑋 and 𝐴 be a set and its subset respectively with 𝐴 ⊆ X. Then
𝜆𝐴(𝑥) = {1 𝑖𝑓 𝑥 ∈ 𝐴0 𝑖𝑓 𝑥 ∉ 𝐴
(8)
where 𝜆𝐴(𝑥)is referred to as the characteristic function [6] of set 𝐴 in 𝑋. Therefore
a classical or crisp set can be defined as:
𝐴 = {< 𝑥, 𝜆𝐴(𝑥)} > |𝑥 ∈ 𝐴 (9)
The classical crisp set in Eqn. (9) is generalized into fuzzy sets as explained
below:
A fuzzy set 𝐴′ of 𝑋 is a set of ordered
pairs{(𝑥1, 𝜇𝐴(𝑥1)), (𝑥2, 𝜇𝐴(𝑥2)),… , (𝑥𝑛, 𝜇𝐴(𝑥𝑛))}, characterized by a
membership function 𝜇𝐴′(𝑥) that maps each element 𝑥 in 𝑋 to a real number in
the interval [0,1 ]. The function value 𝜇𝐴′(𝑥)stands for the membership degree 𝑥
in 𝐴′.
Definition 2: A fuzzy set 𝐴′ in 𝑋={𝑥} is defined by:
𝐴′ = {< 𝑥, 𝜇𝐴′(𝑥)} > |𝑥 ∈ 𝑋 (10)
where 𝜇𝐴′: 𝑋 → [0,1] denotes the membership function of the fuzzy set 𝐴′and
further describes the degree of membership of 𝑥 to fuzzy set 𝐴′ It must be added that, since fuzzy set is a generalization of the classical crisp
set defined in the interval [0,1], full membership and full non-membership of 𝑥
in 𝐴′occurs when 𝜇𝐴′(𝑥) = 1 and 𝜇𝐴′(𝑥) = 0 respectively. This implies that
every crisp set is in itself a fuzzy set.
If 𝑋 = {𝑥1, 𝑥2, … , 𝑥𝑛} is a finite set and 𝐴′ is a fuzzy set in X , a notation often
used is,
𝐴′ =𝜇1𝑥1⁄ +⋯+
𝜇𝑛𝑥𝑛⁄ (11)

39
where the term 𝜇𝑖𝑥𝑖⁄ , 𝑖 = 1,… , 𝑛 denotes 𝜇𝑖 as the grade of membership of 𝑥𝑖
in 𝐴′ and the + sign also denotes the union.
Example 1:
Consider the temperature of a patient in degrees Celsius. Let 𝑋 ={36.5, 37, 37.5, 38, 38.5, 39, 39.5}. The fuzzy set 𝐴 = “High temperature” may
be defined
𝐴′ = {< 𝜇𝐴′(𝑥)/𝑥} > |𝑥 ∈ 𝑋
=0/36.5 + 0/37 + 0.1/37.5 + 0.5/38 + 0.8/38.5 + 1/39 + 1/39.5, where the
numbers 0, 0.1, 0.5, 0.8, and 1 express the degree to which the corresponding
temperature is high.
Fig. 4: Examples of membership functions that may be used in different contexts to
characterize fuzzy sets.
The 3 fuzzy sets in figure 4 are similar in the sense that the following properties
are possessed by each 𝐴𝑖(𝑖 ∈ ℕ4): (𝑖)𝐴𝑖(2) = 1 𝑎𝑛𝑑 𝐴𝑖(𝑥) < 1 𝑓𝑜𝑟 𝑎𝑙𝑙 𝑥 ≠ 2;
(𝑖𝑖)𝐴𝑖 𝑖𝑠 𝑠𝑦𝑚𝑚𝑒𝑡𝑟𝑖𝑐 𝑤𝑖𝑡ℎ 𝑟𝑒𝑠𝑝𝑒𝑐𝑡 𝑡𝑜 𝑥 = 2, 𝑡ℎ𝑎𝑡 𝑖𝑠 𝐴𝑖(2 + 𝑥)= 𝐴𝑖(2 − 𝑥)𝑓𝑜𝑟 𝑎𝑙𝑙 𝑥 ∊ ℝ;
(𝑖𝑖𝑖)𝐴𝑖(𝑥)𝑑𝑒𝑐𝑟𝑒𝑎𝑠𝑒𝑠 𝑚𝑜𝑛𝑜𝑡𝑜𝑛𝑖𝑐𝑎𝑙𝑙𝑦 𝑓𝑟𝑜𝑚 1 𝑡𝑜 0 𝑤𝑖𝑡ℎ 𝑖𝑛𝑐𝑟𝑒𝑎𝑠𝑖𝑛𝑔 𝑑𝑖𝑓𝑓𝑒𝑟𝑒𝑛𝑐𝑒 𝑜𝑓 |2 − 𝑥|
Fuzzy sets assume certain properties such as ”increasing”, ”decreasing” or
”convex”, based on the properties of a membership function that characterizes the

40
fuzzy set [92]. The fuzzy set property, ‘increasing’, is used to express such
linguistic concepts as “long”, “warm”, “old” etc., on universes of length,
temperature, age etc. Similarly, the fuzzy property of ‘decreasing’ could also be
used to describe linguistic concepts of decreasing concepts in these universes
would be “short”, “cold”, ”young”. In following section, more properties of fuzzy
sets are introduced.
5.1.1 Properties of Fuzzy Sets
Definition 3: (support) Let A′ be a fuzzy subset of X; the support of A′, denoted
supp(A′), is the crisp subset of X whose elements all have nonzero membership
grades in A′. supp(A′) = {x ∈ X | μA′(x) > 0}. (12)
Definition 4. (normal fuzzy set) A fuzzy subset A′ of a classical set X is referred
to as ‘normal’ if there exists an x ∈ X such that A′ = 1. Otherwise A′ is subnormal.
Definition 5. (α-cut) An α-level set of a fuzzy set A of X is a non-fuzzy set denoted
by [A′]α and is defined by
[A′]α={{𝑡 ∈ 𝑋| A′(𝑡) ≥ α} 𝑖𝑓 α > 0
𝑠𝑢𝑝𝑝(A′) 𝑖𝑓 α = 0 (13)
where (suppA) denotes the closure of the support of A′.
Example 2:
Assume X = {−2,−1, 0, 1, 2, 3, 4} and A′ = 0.0/ −2 + 0.3/ − 1 + 0.6/0 + 1.0/1 +
0.6/2 + 0.3/3 + 0.0/4, in this case,
[A′]α={
{−1, 0, 1, 2, 3} 𝑖𝑓 0 ≤ α ≤ 0.3
{0, 1, 2} 𝑖𝑓 0.3 ≤ α ≤ 0.6{1} 𝑖𝑓 0.6 ≤ α ≤ 1
Definition 6. (convex fuzzy set) A fuzzy set A′ of X is called convex if [A′]α is a
convex subset of X ∀α ∈ [0, 1].
Some Fuzzy Sets Algebraic Operations
Union: The union of two fuzzy sets A′ and B′ with membership functions 𝜇𝐴′ and
𝜇𝐵′ respectively is defined as the maximum of the two membership functions of
A′ and B′ . This is referred to as the maximum criterion as expressed in Eqn. (14).
𝜇𝐴′∪B′ = 𝑚𝑎𝑥(𝜇𝐴′ , 𝜇𝐵′) (14)
Intersection: The intersection of two fuzzy sets A′ and B′ with membership
functions 𝜇𝐴′ and 𝜇𝐵′ respectively is defined as the minimum of the two

41
membership functions of A′ and B′. This is referred to as the minimum criterion
as expressed in Eqn. (15).
𝜇𝐴′∩B′ = 𝑚𝑖𝑛(𝜇𝐴′ , 𝜇𝐵′) (15)
Complement: The complement of a fuzzy set A′ with membership function 𝜇𝐴′ is
described as the negation of the stated membership function as expressed in Eqn.
(16). This is known as the negation criterion.
𝜇A = 1 − 𝜇𝐴′ (16)
5.1.2 Fuzzy Number
In fuzzy MCDM, a special case of fuzzy set known simply as a fuzzy number
is introduced to capture vagueness and variations in the subjective ratings of an
expert. A fuzzy number is a generalization of a real number ℝ where each single
value is connected to a set of possible values assigned weights between 0 and 1
[18]. Fuzzy numbers use the [0,1] interval to rate a set of possible values by
capturing the subjectivity, vagueness and imprecision of a subjective rating.
Formally, a fuzzy number is defined as in definition 7.
Definition 7. (fuzzy number) A fuzzy number A′ is a fuzzy set of the real line with
a normal, (fuzzy) convex and continuous membership function of bounded
support.
The notable types of fuzzy numbers are the trapezoidal and triangular fuzzy
numbers. However, in most fuzzy multi-criteria decision making (MCDM)
approaches, the Triangular Fuzzy Number (TFN) is preferred to trapezoidal
because of its simplicity [19]. In the following, an illustration of some of the types
of fuzzy numbers are briefly discussed.
Definition 8. (quasi fuzzy number) A quasi fuzzy number A′ is a fuzzy set of the
real line with a normal, fuzzy convex and continuous membership function
satisfying the limit conditions
lim𝑡→∞
𝐴′(𝑡) = 0, lim𝑡→−∞
𝐴′(𝑡) = 0.
Let A be a fuzzy number. Then [A′]γ is a closed convex (compact) subset of ℝ
for all γ ∈ [0, 1]. The following notations are introduced
𝑎1(γ)= min[A′]γ, 𝑎2(γ)= max[A′]γ
-2
1
1 2 3 -1

42
In other words, 𝑎1(γ) denotes the left-hand side and 𝑎2(γ) denotes the right-hand
side of the γ-cut. In view of this, it can be seen that
If α ≤ β then [A′]α ⊃ [A′]β
Definition 9. (triangular fuzzy number) A fuzzy set A′ is called triangular fuzzy
number with membership function 𝑦 = 𝑓(𝑥) expressed as a triplet (a, b, c) having
the form presented in Fig. 5.
Fig. 5: Membership function of triangular fuzzy number
The equation of the straight line defined by the points (a,0) and 𝐴(𝑏, 1) is given
by 1
𝑏−𝑎=
𝑦
𝑥−𝑎 or 𝑦 =
𝑥−𝑎
𝑏−𝑎. Similarly, the straight line defined by the points 𝐴(𝑏, 1)
and (c,0) is given by 1
𝑐−𝑏=
𝑦
𝑐−𝑥 or 𝑦 =
𝑐−𝑥
𝑐−𝑏 . Therefore the membership function
𝜇𝐴′ of the triangular fuzzy number (TFN) is defined as:
𝜇𝐴′(𝑥) = {
0 𝑥 < 𝑎, 𝑥 > 𝑏𝑥−𝑎
𝑏−𝑎, 𝑎 ≤ 𝑥 ≤ 𝑏
𝑐−𝑥
𝑐−𝑏, 𝑏 ≤ 𝑥 ≤ 𝑐
(17)
In Figure 5, the value of 𝑥 at 𝑏 gives the maximal value of 𝜇𝐴′(𝑥), that is 𝜇𝐴′(𝑥) =
1. The value 𝑥 at 𝑎 represents the minimal grade of 𝜇𝐴′(𝑥), i.e 𝜇𝐴′(𝑥) = 0. The
constants 𝑎 and 𝑐 represent the lower and upper bounds of the available area data
respectively and reflect the fuzziness of the data under evaluation. In Figure 6,
two triangular fuzzy numbers are presented to demonstrate the arithmetic
operations underlying TFNs as seen in Eqs. (18) to (21) below.
Fig. 6: Two triangular fuzzy numbers
0 b c a X
1
𝜇𝐴′
A′
𝑎 𝑏 𝑐 0 𝑋
A′ B′ 1
b 0
𝜇𝐴′(x)
0 𝑎1 b a c 𝑏1 𝑐1

43
Definition 9.1: Basic Triangular Fuzzy Number Operations
Let 𝐴 = (𝑎, 𝑏, 𝑐) and 𝐵 = (𝑎1, 𝑏1, 𝑐1) be two triangular fuzzy numbers. Some
basic operations on these two fuzzy triangular numbers are as follows:
𝐴 + 𝐵 = (𝑎, 𝑏, 𝑐) + (𝑎1, 𝑏1, 𝑐1) = (𝑎 + 𝑎1, 𝑏 + 𝑏1, 𝑐 + 𝑐1) (18)
𝐴 − 𝐵 = (𝑎, 𝑏, 𝑐) − (𝑎1, 𝑏1, 𝑐1) = (𝑎 − 𝑐1, 𝑏 − 𝑏1, 𝑐 − 𝑎1) (19)
𝐴 × 𝐵 = (𝑎, 𝑏, 𝑐) × (𝑎1, 𝑏1, 𝑐1) = (𝑎𝑎1, 𝑏𝑏1, 𝑐𝑐1) (20)
𝐴 ÷ 𝐵 = (𝑎, 𝑏, 𝑐) ÷ (𝑎1, 𝑏1, 𝑐1) = (𝑎
𝑐1,𝑏
𝑏1,𝑐
𝑎1) (21)
Definition 10. (trapezoidal fuzzy number) A fuzzy set A′ is called trapezoidal
fuzzy number with membership function y = f(x) expressed as a quadruple
(a, b, c, d) having the form presented in Fig. 7. The membership function is
expressed as in Eq. (22).
Fig. 7: Membership function of triangular fuzzy number
𝜇𝐴′(𝑥) =
{
0, 𝑥 < 𝑎 𝑥−𝑎
𝑏−𝑎, 𝑎 < 𝑥 ≤ 𝑏
1, 𝑏 < 𝑥 ≤ 𝑐𝑑−𝑥
𝑑−𝑐, 𝑐 ≤ 𝑥 < 𝑑
0, 𝑥 > 𝑑
(22)
Definition 10.1: Basic Triangular Fuzzy Number Operations
In Eqns. (23) to (26), the arithmetic operations of two trapezoidal fuzzy
numbers are presented. Let 𝐴 = (𝑎, 𝑏, 𝑐, 𝑑) and 𝐵 = (𝑎1, 𝑏1, 𝑐1, 𝑑1) be two
trapezoidal fuzzy numbers. Some basic operations on these two fuzzy triangular
numbers are as follows:
𝐴 + 𝐵 = (𝑎, 𝑏, 𝑐, 𝑑) + (𝑎1, 𝑏1, 𝑐1, 𝑑1) = (𝑎 + 𝑎1, 𝑏 + 𝑏1, 𝑐 + 𝑐1, 𝑑 + 𝑑1) (23)
𝐴 − 𝐵 = (𝑎, 𝑏, 𝑐, 𝑑) − (𝑎1, 𝑏1, 𝑐1, 𝑑1) = (𝑎 − 𝑑1, 𝑏 − 𝑐1, 𝑐 − 𝑏, 𝑑 − 𝑎1) (24)
𝐴 × 𝐵 = (𝑎, 𝑏, 𝑐, 𝑑) × (𝑎1, 𝑏1, 𝑐1, 𝑑1) = (𝑎𝑎1, 𝑏𝑏1, 𝑐𝑐1, 𝑑𝑑1) (25)
𝐴 ÷ 𝐵 = (𝑎, 𝑏, 𝑐, 𝑑) ÷ (𝑎1, 𝑏1, 𝑐1, 𝑑1) = (𝑎
𝑑1,𝑏
𝑐1,𝑐
𝑏1,𝑑
𝑎1) (26)
a b c d
A′ 1

44
5.2 Generalized Forms of Fuzzy Sets
The discovery of different kinds of uncertainty, imprecision and vagueness in
peculiar circumstances, brought about several extensions and generalizations to
Zadeh’s original fuzzy construct. These fuzzy extensions and generalizations are
used in situations where the original fuzzy construct poses a limitation in terms of
ability to efficiently solve a problem. The many fuzzy variants therefore also help
in uncertainty modelling. Some of the widely accepted and used variants of the
original fuzzy sets, are rough sets by Pawlak [8], intuitionistic fuzzy sets by
Atanassov [12], interval-valued fuzzy sets by Grattan‐Guinness [59], hesitant
fuzzy sets by Torra [60], soft sets by Molodtsov [61] and type-2 fuzzy sets by [62,
63] among others. Though the fuzzy set theory has over the years, had wide
ranging research interests, especially in control systems, pattern recognition,
optimization and successfully been applied in diverse disciplines [93], its novel
use in decision making seems to be one of the most popular. In decision making
especially in the MCDM, the generalized forms of the fuzzy set theory have been
tested and applied in several instances of modelling different forms of uncertainty
in human decision making.
One fuzzy set generalization gradually becoming popular with MCDM
practitioners is Atanassov’s Intuitionistic Fuzzy Sets (IFS) [12]. Since its
introduction, IFS has gradually become one of the most utilized fuzzy set
generalizations after rough sets especially in MCDM problems [94]. Together, the
two notions of uncertainty modelling; the classical (Zadeh) and intuitionistic
(Atanassov) sets have been applied in many real-world MCDM applications
spanning diverse disciplines. With a corresponding global interest in fuzzy
MCDM methods and its generalized variants in both industry and academia, the
dissertation demonstrates a combined use of intuitionistic fuzzy TOPSIS with
conjoint analysis in a special case of merging decisions of different group decision
makers.
In the following sections, the intuitionistic fuzzy set theory is briefly
introduced. Furthermore, a comparison is made with both the classical and the
fuzzy set theory to draw out the differences and similarities amongst them. In
particular importance is how the three types of sets evolved from each other. The
rest of the dissertation is organized as follows. Chapter 6 launches an investigation
into the use of hybrid fuzzy MCDM methods against single method solutions. The
result aids in the proposal of a new hybrid method.
5.3 Theory of Intuitionistic Fuzzy Sets
This section focuses on reviewing how existing theories evolved into other
potent theories through so-called hybridizations and extensions. This is aimed at
further development of a hybrid fuzzy MCDM method. To do this, an examination
is made into how the classical set theory was generalized into fuzzy sets and
subsequently extended or generalized into the intuitionistic fuzzy set theory. This

45
implies that the classical set theory gave rise to the fuzzy set and its variant – the
intuitionistic fuzzy set, all premised on offering theories that deal with different
kinds of data. In the following sections, we compare the three sets approaches and
their interrelationships. In Eqns. (8) and (9), the foundations of both the classical
and the fuzzy sets theory were introduced. It was shown that fuzzy set is a
generalized form of the classical crisp set defined in the interval [0,1] where full
membership and full non-membership of 𝑥 in 𝐴′occurs when 𝜇𝐴′(𝑥) = 1 and
𝜇𝐴′(𝑥) = 0 respectively. This implies that every crisp set is in itself a fuzzy set.
5.3.1 Intuitionistic Fuzzy Sets
In classical fuzzy set, a fuzzy set 𝐴 in 𝑋 characterized by membership functions
is expressed as 𝐴 = {⟨𝑥, 𝜇𝐴(𝑥)⟩|𝑥 ∈ 𝑋} where 𝜇𝐴: 𝑋 → [0,1] describes the
membership function of the fuzzy set 𝐴 within the interval of [0, 1]. In
intuitionistic fuzzy sets however, a set 𝐴 in 𝑋 is defined as:
𝐴 = {⟨𝑥, 𝜇𝐴(𝑥), 𝑣𝐴(𝑥) ⟩|𝑥 ∈ 𝑋} (27)
Where 𝜇𝐴(𝑥), 𝑣𝐴(𝑥): 𝑋 → [0,1] respectively represent the membership and non-
membership functions on condition that 0 ≤ 𝜇𝐴(𝑥) + 𝑣𝐴(𝑥) ≤ 1. Additionally,
IFS introduces a third construct 𝜋𝐴(𝑥), the intuitionistic fuzzy index which
expresses whether or not 𝑥 belongs to 𝐴.
𝜋𝐴 = 1 − 𝜇𝐴(𝑥) − 𝑣𝐴(𝑥) (28)
The intuitionistic index in Eq. 28 measures the hesitancy degree of element 𝑥 in 𝐴
where it becomes obvious that 0 ≤ 𝜋𝐴(𝑥) ≤ 1 for each 𝑥 ∈ 𝑋. A small value of
𝜋𝐴(𝑥) implies that information about 𝑥 is more certain [20]. On the other hand, a
higher value of the hesitancy degree 𝜋𝐴(𝑥) means the information that 𝑥 holds is
more uncertain. An intuitionistic fuzzy set can therefore fully be defined as
𝐴 = {⟨𝑥, 𝜇𝐴(𝑥), 𝑣𝐴(𝑥), 𝜋𝐴(𝑥)⟩|𝑥 ∈ 𝑋} (29)
Where 𝜇𝐴 ∈ [0,1]; 𝑣𝐴 ∈ [0,1]; 𝜋𝐴 ∈ [0,1]
Definition 1. Basic arithmetic operations of intuitionistic fuzzy sets.
Let 𝐴 = {⟨𝑥, 𝜇𝐴(𝑥), 𝑣𝐴(𝑥)⟩|𝑥 ∈ 𝑋} and 𝐵 = {⟨𝑥, 𝜇𝐵(𝑥), 𝑣𝐵(𝑥)⟩|𝑥 ∈ 𝑋} be
two intuitionistic fuzzy numbers. Some basic operations on these intuitionistic
fuzzy numbers (IFNs) A and B applied in this research are expressed as follows:
(“iff” means “if and only if”):
𝐴 = 𝐵 𝑖𝑓𝑓 (∀ 𝑥 ∈ 𝑋)(𝜇𝐴(𝑥) = 𝜇𝐵(𝑥) & 𝑣𝐴(𝑥) = 𝑣𝐵(𝑥)) (30)
𝐴 + 𝐵 = {⟨𝑥, 𝜇𝐴(𝑥) + 𝜇𝐵(𝑥) − 𝜇𝐴(𝑥) ∙ 𝜇𝐵(𝑥), 𝑣𝐴(𝑥) ∙ 𝑣𝐵(𝑥)⟩|𝑥 ∈ 𝑋} (31)
𝐴 × 𝐵 = {⟨𝑥, 𝜇𝐴(𝑥) ∙ 𝜇𝐵(𝑥), 𝑣𝐴(𝑥) + 𝑣𝐵(𝑥) − 𝑣𝐴(𝑥) ∙ 𝑣𝐵(𝑥)⟩|𝑥 ∈ 𝑋} (32)

46
The complement A𝑐 of a fuzzy set 𝐴 in 𝑋 corresponds to negation “not”, and is
defined as:
𝜇𝐴𝑐(𝑥) = 1 − 𝜇𝐴(𝑥) for each 𝑥 ∈ 𝑋 (33)
𝐴 ∩ 𝐵 = {⟨𝑥,min( 𝜇𝐴(𝑥), 𝜇𝐵(𝑥)),max (𝑣𝐴(𝑥), 𝑣𝐵(𝑥))⟩|𝑥 ∈ 𝑋} (34)
𝐴 ∪ 𝐵 = {⟨𝑥,max( 𝜇𝐴(𝑥), 𝜇𝐵(𝑥)),min (𝑣𝐴(𝑥), 𝑣𝐵(𝑥))⟩|𝑥 ∈ 𝑋} (35)
Product of an intuitionistic fuzzy set and a real number is defined as in Eq. (36)
𝜆𝐴 = {⟨1 − (1 − 𝜇𝐴(𝑥))𝜆, (𝑣𝐴(𝑥))
𝜆⟩ 𝑥 ∈ 𝑋} (37)
Power of IFS: 𝐴𝜆 = {⟨(𝑣𝐴(𝑥))𝜆, 1 − (1 − 𝜇𝐴(𝑥))
𝜆⟩ 𝑥 ∈ 𝑋} (38)
5.3.2 Summary of Comparison
In figure 8, a pictorial relationship among classical sets, fuzzy sets and
intuitionistic fuzzy sets (IFS) is shown. This is further explained in figure 9 where
the three sets are compared on a coordinate system to demonstrate how elements
belonging to crisp sets, fuzzy sets and intuitionistic fuzzy sets interrelate [6]. In a
crisp set, the coordinate system shows only two points to explain that in such sets,
elements either belong fully or do not belong at all. It can further be shown that
at points (μ =1 and ν =0) elements in a crisp set fully belong whiles at coordinates
(μ = 0 and ν = 1), elements do not belong. In fuzzy sets, μ +ν = 1 demonstrates
that the entire area (the middle part) connecting these points have elements
belonging to a fuzzy set [6]. Finally in the case of intuitionistic fuzzy set, the strict
condition: 0 ≤ μ +ν ≤ 1, allows both the segment with its ends and the interior of
the shaded triangle at the bottom part of Figure 9c to represent the elements
belonging to an intuitionistic fuzzy set. This means each of the lines inside the
triangle depicts an image of the elements with the same value of intuitionistic
fuzzy index. It can then be concluded that in the case of intuitionistic fuzzy sets,
fuzzy sets and crisp sets are contained in it whiles fuzzy sets also respectively
contain crisp sets as shown in figure 8 below [6].
Fig. 8: Relationship among classical sets, fuzzy sets and intuitionistic fuzzy sets
Crisp set
Fuzzy set
Intuitionistic fuzzy set

47
Fig. 9: Crisp, fuzzy and intuitionistic fuzzy sets on a coordinate system
In general, intuitionistic fuzzy sets (IFS) differ from fuzzy sets in terms of the
approach in that IFS introduces three functions that express the degree of
membership, non-membership and hesitancy [95]. The IFS approach gives a
different dimension to human decision modelling by introducing three states of
fuzzy constructs to characterize the extent to which decision-makers support,
oppose and are hesitant or neutral about their decisions [35]. This approach helps
to quantify the extent of satisfaction, dissatisfaction and hesitancy in a decision
maker’s judgement. Therefore, intuitionistic fuzzy sets according to [6] offers an
additional degrees of freedom for decision makers through the introduction of
non-membership and the hesitancy degrees.
5.4 Fuzzy and Intuitionistic Fuzzy MCDM Methods
Fuzzy sets have proven a potent method in extending multiple criteria decision
making (MCDM) into decision problems where generally deterministic MCDM
methods are deemed inappropriate. Fuzzy MCDM basically use linguistic values
to assess or rate alternatives against sets of criteria. In most cases, the importance
weights of the criteria is also determined linguistically. Fuzzy multi-criteria
decision making methods (F-MCDM) become more relevant when a decision
maker is faced with a challenge of quantifying linguistic statements in an
otherwise deterministic decision making [2]. An example is attempting to
compute the 𝑗𝑡ℎ alternative in a project manager selection problem where
‘adaptability’ of a candidate is one of the criteria considered. Measuring a
subjective criteria such as ‘adaptability’ in this real-world example poses a
number of challenges including how to rate and efficiently model the linguistic
ratings into a composite decision. The extension of deterministic MCDM methods
with fuzzy set concept has been widely used in many disciplines including areas
that were never thought of as applicable. The fuzzy extension has been utilized in
almost all the methods under the domain of full aggregation and outranking
methods. Some of these MCDM methods whose extension into fuzzy sets have
received worldwide acclaim in terms of the number of applications are AHP,
𝑣 𝑣 𝑣 (a) crisp set (b) fuzzy set
𝜇 + 𝑣 = 1
(c) intuitionistic fuzzy set
𝜇 𝜇 𝜇
0 ≤ 𝜇 + 𝑣 ≤ 1= 1

48
TOPSIS, VIKOR, ELECTRE, PROMETHHE, ANP, DEMATEL, SAW among
many others.
Similar to the use of fuzzy set theory in MCDM, Attanasov’s introduction of
intuitionistic fuzzy set has also been extended to cover some of the major MCDM
techniques mentioned above. Additionally, contributions that employ either fuzzy
set theory or intuitionistic fuzzy set are also known to often combine a number of
MCDM methods into what is simply known as hybrid methods. These hybrid
methods have over a period become popular in F-MCDM and IF-MCDM
applications in diverse disciplines such as in Science, Engineering, Business,
Management, Accounting, Energy, Health, Environmental Science, Arts, and
Humanities among others. A hybrid method in fuzzy MCDM typically involves
the use of an MCDM method to set the criteria weight and a different method for
the ranking of alternatives. The next section delves into the use of hybrid methods
in fuzzy multi-criteria decision making approaches. Hybrid F-MCDM methods
are investigated against single method solutions to understand the rationale behind
the use of such integrated approaches. The investigative piece would be followed
by recommendations of appropriate use of hybrid methods. For example, the
author demonstrates which MCDM methods are appropriate to be hybridized and
under what peculiar circumstances. Finally, a novel hybrid F-MCDM method of
Conjoint Analysis and Intuitionistic Fuzzy TOPSIS are introduced to demonstrate
its applicability in case studies. The proposed hybrid method is particularly useful
in situations of merging decisions of large decision group with relatively small
decision body.

49
INVESTIGATIVE PART

50
6 HYBRID MCDM METHOD SOLUTIONS
The concept of hybrid as relating to MCDM methods has been approached
differently by different researchers. However, no matter the distinction, one basic
idea holds; dealing with a combination of two notions in a decision problem.
Typically the term hybrid is used in two ways to (1) describe the nature of the
problem and (2) the nature of the solution (methods).
In terms of the nature of the underlying problem, some definitions given to
the concept of hybrid in MCDM would include problems of incommensurable
unit of measurement, combination of qualitative and quantitative criteria as well
as combination of deterministic and probabilistic criteria in one decision problem
[72].With regards to incommensurable units, an MCDM method is considered
hybrid when different criterion assumes different unit of measurement in the same
decision problem. For instance in a car selection problem, whiles the unit of
measurement for fuel economy may be miles per gallon (mpg), the price would
be measured in dollars (currency). The concept of hybrid in MCDM is also
sometimes used to describe situations where there is a blend of both qualitative
and quantitative criteria in one decision problem. Thus, a criteria with a
deterministic value is combined with ones that are described with subjective
ratings. An example is assessing the performance of cars using price (quantitative)
and comfortability (subjective) in the same decision problem. Another idea of
hybrid is when deterministic and probabilistic criteria are found in a same decision
problem. In car selection problem, the price of the car is deterministic, however,
fuel economy is considered to assume a random value. This is because, values for
fuel economy would change based on weather, traffic and general road conditions
(e.g. ruggedness of the road).
On the other hand, when the term hybrid is used to describe the kinds of
methods used to offer solution to a decision problem in MCDM setting, it often
refers to the use of more than one different MCDM methods used at various stages
in the decision making processes. For example, the ANP method may be used to
determine the weight of the criteria whiles TOPSIS is used to rank the alternatives.
In research articles classified as hybrid, authors typically use words such as
hybrid, two-stage, combined or integrated to describe situations where more than
one MCDM method or a combination of an MCDM method and other techniques
were used to solve a problem. This approach of combining different MCDM
methods is premised on the series of stages in a typical structured decision-making
process. Typically, the processes and steps in structured decision making include
identification of the problem, construction of preferences, weighting of criteria
and decision makers and ultimately, evaluation of alternatives to determine the
best alternative [1]. In view of this, most hybrid, two-stage, combined or
integrated methods tend to propose the use of different MCDM methods for
accomplishing different tasks in the decision making process. This would often
include but not limited to, the use of different MCDM methods in such stages as,

51
setting criteria weights, aggregating decision makers’ preferences, analyzing
consensus in group decisions and ranking the alternatives. In this dissertation,
mere extension of a deterministic MCDM method is not recognized as a hybrid
solution.
In literature, some authors combine as many as four different MCDM methods
to solve a problem. For instance in [96, 97] four different MCDM methods were
used at different stages in the decision process. However, on the average two-
method hybrid solutions tend to be the most common. As the popularity of
combining different MCDM methods soar, some of the highly cited hybrid fuzzy
MCDM articles are [98] where DEMATEL, fuzzy ANP and fuzzy TOPSIS
methods were combined to evaluate green suppliers in a selection problem. In
[99] factor analysis method and DEMATEL were combined to evaluate
intertwined effects in e-learning programs whiles in [100] DEMATEL based on
ANP (DANP) was combined with VIKOR in a vendor selection problem in a
material recycling sector. It must be noted that, increasingly, some of the hybrid
methods use other methods outside the domain of MCDM and combined them
with an MCDM method. Some of these instances are seen in [99] where factor
analysis, a statistical technique, was combined with DEMATEL, an MCDM
method. In [101] the balance score card method which is a strategy management
tool was combined with AHP, an MCDM method. Other examples of such hybrid
approaches are seen in the use of quality functional deployment (QFD), SWOT
analysis [103] and Delphi method [104] among many others. This dissertation
uses this approach by demonstrating the use conjoint analysis method, which is
outside the domain of MCDM and combining with intuitionistic fuzzy TOPSIS
method in special cases of merging the decisions of large groups into small
decision making groups.
6.1 Hybrid MCDM versus Single-Method Solutions
The potential for combining several MCDM methods to accomplish a task has
been an interest to many researchers especially in the past decade. Figures 11-12
show current trends in the use of hybrid MCDM methods against single method
solutions. It is realized that in all instances, there appears to be a gradual rise in
the number of articles that use hybrid MCDM methods over single method
solutions. In this instance, single-method solutions refer to when only one MCDM
method was used to solve the entire decision problem. An example is using only
TOPSIS or AHP in a supplier selection problem.
The first part of this dissertation investigated the usefulness of hybrid methods.
In particular, decision problems in selected fuzzy hybrid MCDM articles were
investigated against those that use only single methods. This was intended to
ascertain whether the ranking order would be the same in both cases.

52
Fig. 10: Methodological concept for hybrid fuzzy MCDM literature search
To do this, the research design as shown conceptually in figure 10, sought to
primarily compare the ‘decision’ output of fuzzy MCDM hybrid methods against
MCDM of single-method solutions. A basic classification scheme was first
created to group publications into fuzzy hybrid methods and single-method
solutions. Four methods under full aggregation and 3 under outranking methods
were selected for the comparison. The key requirements for the selection of each
of the MCDM methods under full aggregation and outranking methods was by
Survey Target
Hybridized Fuzzy
MCDM methods
Search Online
Databases
Online Database
-Web of Science
-Scopus
Search Criteria 1. Keywords:
“Hybrid Fuzzy MCDM” “Integrated Fuzzy MCDM”
2. Published between 2000 – 2015
with at least 50 citations Journal
Articles
Related to
fuzzy
MCDM
methods?
Related to
Hybridized
methods?
Yes
Yes
Reviews on
selected hybrid and
single-methods
Articles selected into
fuzzy hybrid and
single-method
solutions
Remarks
No
No
No
Ex
clu
de
Yes

53
their (i) automated search availability (ii) popularity among researchers and (iii)
indexation in Scopus or Web of Science database. In figures 11 and 12, which are
grouped into full aggregation and outranking methods, there was a strong
evidence of a yearly rise in the use of hybrid MCDM methods as opposed to
single-methods. In all instances in figures 11 and 12, hybrid methods which were
virtually non-existent in the early years of the last decade, were seen to be
upstaging single fuzzy MCDM methods in later years of the decade.
Fig. 11: Full Aggregation Methods: Trend of research between hybrid MCDM and
single methods, 2000-2015
Following the revelation that fuzzy hybrid MCDM methods are becoming more
popular among researchers than the use of single MCDM methods, a further
investigation was carried out to ascertain whether hybrid methods were used
appropriately. In particular, the research sought to find out whether in decision
problems for which hybrid methods are employed, single-method solutions could
also be used to realize the same ranking order. To carry out this task, 30 research
articles that meet the requirements in figure 10, were selected for the task of
comparing hybrid MCDM methods with single-method solutions on a same
0
10
20
30
40
50
60
20
00
20
01
20
02
20
03
20
04
20
05
20
06
20
07
20
08
20
09
20
10
20
11
20
12
20
13
20
14
20
15
Hybrid Fuzzy TOPSIS Fuzzy TOPSIS
0
2
4
6
8
10
12
14
16
20
00
20
01
20
02
20
03
20
04
20
05
20
06
20
07
20
08
20
09
20
10
20
11
20
12
20
13
20
14
20
15
Hybrid Fuzzy VIKOR Fuzzy VIKOR
0
10
20
30
40
50
60
70
80
1 2 3 4 5 6 7 8 9 10 11 12 13 14 15 16
Hybrid Fuzzy AHP Fuzzy AHP
0
5
10
15
20
25
20
00
20
01
20
02
20
03
20
04
20
05
20
06
20
07
20
08
20
09
20
10
20
11
20
12
20
13
20
14
20
15
Hybrid Fuzzy ANP Fuzzy ANP

54
decision problem. Finally 10 of the articles were selected based on the fact that,
they provided numerical examples of DMs ratings to be able to apply both hybrid
and single MCDM methods on the same problem. As shown in the second and
fifth column in table 4, the original hybrid method used in the research paper are
compared with the decision solution using a single-method in the hybrid
approach.
Fig. 12: Outranking Methods: Trend of research between hybrid MCDM and single
methods, 2000-2015
The results on the new ranking order as a result of using a single MCDM
method to solve the same decision problem, are then flagged as ‘change’, ‘no
change’ or ‘irresolution’. A ‘change’ means when the single-method was used,
the same ranking was not achieved as in the original. On the other hand, a ‘no
change’ means the same ranking order is achieved whether a hybrid or just one of
the methods in the hybrid is used. An irresolution is recorded when the nature of
the decision problem requires some special treatment of the criteria weights which
may produce different ranking order with different single MCDM methods. The
results from the pilot study though not exhaustive of all hybrid fuzzy MCDM
solutions in literature, showed that out of the 10 sampled articles under the
0
2
4
6
8
10
20
00
20
01
20
02
20
03
20
04
20
05
20
06
20
07
20
08
20
09
20
10
20
11
20
12
20
13
20
14
20
15
Hybrid Fuzzy PROMETHEE
Fuzzy PROMETHEE
0
0.5
1
1.5
2
2.5
3
3.5
4
4.5
20
00
20
01
20
02
20
03
20
04
20
05
20
06
20
07
20
08
20
09
20
10
20
11
20
12
20
13
20
14
20
15
Hybrid Fuzzy ELECTRE Fuzzy ELECTRE
0
2
4
6
8
10
12
14
16
Hybrid Fuzzy DEMATEL Fuzzy DEMATEL

55
investigation, 6 of them produced the same ranking order as shown in Table 4
below.
Table 4. Results of ranking order between hybrid and selected single MCDM methods.
Author Methods used in the
Hybrid
Number of
criteria used
Number of
Alternatives
Single MCDM
method used
Ranking
order
[105] Fuzzy DEMATEL
+
Fuzzy TOPSIS
17 4 Fuzzy
TOPSIS
Change
[106] Fuzzy AHP
+
Fuzzy TOPSIS
23 5 Fuzzy
TOPSIS
No
change
[107] Fuzzy AHP
+
Fuzzy TOPSIS
28 21 Fuzzy
TOPSIS
No
change
[108] Fuzzy AHP
+
PROMETHEE
7 4 Fuzzy
PROMETHEE
No
change
[100] Fuzzy DANP
+
Fuzzy VIKOR
17 6 Fuzzy
VIKOR
Change
[109] Fuzzy ANP + Fuzzy
ELECTRE + Fuzzy
TOPSIS
10 6 Fuzzy
ELECTRE
Irresolution
[110] Fuzzy ANP+Fuzzy
DEMATEL+
Fuzzy ELECTRE
69 4 Fuzzy
DEMATEL
Irresolution
[111] Fuzzy AHP+Fuzzy
SAW 14 6 Fuzzy AHP No change
[112] Fuzzy SWARA
+
Fuzzy VIKOR
7 4 Fuzzy
VIKOR
No change
[113] Fuzzy ANP+Fuzzy
TOPSIS 31 5 Fuzzy
TOPSIS
No change
For instance in article [107], the original hybrid method used fuzzy AHP and
fuzzy TOPSIS in the hybrid. However, when only fuzzy TOPSIS was applied as
a single method, there was no change in the ranking order. The results in Table 4,
raises issues about the appropriateness of hybrid MCDM methods as raised by
other researchers [54, 55, 56]. It is observed that whiles hybrid MCDM methods
are quite useful especially for very complex decision problems, determining the
appropriate use for an ideal problem poses a challenge.
The investigation further revealed that when two or more full aggregation
methods (American school) are used in a hybrid approach and subsequently, a
single MCDM method in the hybrid is used on the same decision problem, the
same ranking order is most often achieved. For example in the sample articles
[106, 107], both AHP and TOPSIS belong to full aggregation methods. When

56
these two methods are combined in a hybrid method and then subsequently one
of the method is used on the same decision problem, the results tends to be the
same particularly when there are no designated ‘cost’ and ‘benefits’ criteria.
Where there exists a cost and benefit criteria with dependencies, a use of TOPSIS
realizes the same ranking order. Similarly when the two methods used in the
hybrid belong to the category of outranking methods (French school), then a
subsequent use of only one of the methods in the hybrid solution tends to achieve
the same results.
It was further observed that the ranking order with a single MCDM method as
compared with a hybrid method, tends to be different when the two methods come
from different categories or types of MCDM methods. For instance when one of
the methods in the hybrid comes from a full aggregation background and the other
comes from an outranking method, the results in terms of the new ranking tends
to change. Thus meaning the ranking order becomes different as seen in sampled
articles [100, 105].
Investigation into the use of hybrid MCDM methods, inspired the proposition
in this dissertation of a novel hybrid fuzzy MCDM method ideally suited for
special situations of merging separate decisions from a large group of DMs on
one-side, and a relatively small group from another. In the following sections, the
proposed hybrid fuzzy MCDM method is introduced. In the approach, conjoint
analysis is used to model preferences of a large group of decision makers (DMs)
and converted into criteria weights. The criteria weights decided by the large
group are now factored into another decision making level involving a small
group of decision makers. Intuitionistic fuzzy TOPSIS method is the other method
in the hybrid, where it is used to intuitively model expert ratings into a ranking
order in a selection problem.
In the following section, the concepts of weights setting in MCDM is briefly
explained. An understanding of the role of weights in decision making as well as
how they are set, sheds light on the proposition and use of conjoint analysis to set
criteria weights as fully explained in chapter 8.

57
THE CONCEPT OF ‘WEIGHTS’ IN MCDM

58
7 WEIGHTS USAGE IN MCDM
The notion of assigning weights, either to criteria or decision makers is central
to most multi-criteria decision making (MCDM) methods, and is used mostly
during preferences aggregation stage. The most popular form is when criteria are
weighted essentially to determine their relative importance to the overall decision
making goal. In this dissertation, one of the goals is to find an appropriate method
of assigning weights to a set of criteria as demonstrated in chapter 8. It must be
noted that whereas some MCDM methods, depending on the decision problem
assume an equal weights or importance for all the criteria, most usage of criteria
weights readily assumes that some criteria would contribute more to the
composite decision than others. With a host of aggregation algorithms in MCDM,
several different methods of determining criteria weights have been proposed over
the years. Literature is abound with many of such weighting methods where the
main purpose is to assign either a cardinal or an ordinal value to the range of
criteria to distinguish them in terms of their contributory value to the final
decision. MCDM practitioners consider weight setting as one of the most
important steps in the decision making [152]. However, with a wide array of
methods and approaches, weight assignment is sometimes abused by a misuse of
weight setting methods. In view of this, the choice of an MCDM method
especially for such task as weight setting, should always be guided by what the
decision analyst wants as an output, and what the method can help achieve. For
example, the intended meaning for using AHP (a full aggregation method) or
ELECTRE (an outranking method) are completely different. In the weighted sum
for example, the weights of criteria are intended as tradeoffs whiles in ELECTRE
methods, weights are considered as voting power of the criteria considered.
Another important observation one must consider, is when combining for
example, AHP-ANP with Choquet integral preference model. The Choquet
integral is generally used in special cases where there is an interaction among
criteria and a classical additive value function cannot be applied to aggregate the
performances of the alternatives on the considered criteria. To this end, a thorough
classification of weight setting methods helps to choose an ideal method for the
right problem.
In ranking MCDM methods, to which this dissertation focuses, weighting
methods can simply be grouped into 3 kinds; subjective weighting, objective and
hybrid weighting methods. The hybrid is used in rare but useful situations where
the problem demands the use of both subjective and objective weighting methods.
In subjective methods, criteria weights are set based on decision makers’ ratings
or preferences. For example in Table 5 below, subjective ratings of decision
makers help decide the importance of each of the criterion through the aggregate
sum of their preferences. In this instance, criteria 3 according to Table 5 is
therefore deemed relatively the most important. The ratings here are Very High
(VH), High (H), Medium (M), Low (L) and Very Low (VL).

59
Table 5. Sample of subjective criteria importance weight D1 D2 D3 D4 D5 Aggregated Weight Priority/Ranking
C1 H H H VH H 0.796,0.168 2
C2 H M H M M 0.667,0.280 3
C3 VH VH VH H VH 0.939,0.059 1
C4 VL M L M L 0.318,0.629 6
C5 L L H M M 0.456,0.486 5
C6 M H M H M 0.638,0.310 4
Some of the key subjective weighting methods widely used in literature are the
pairwise comparison (AHP, ANP) methods, trade-off methods and the Delphi
method among others. Since subjective criteria weights are set by decision
makers, the weights can be influenced to reflect an acquisition of a new
knowledge or changes to requirements of the decision goal.
Objective weights on the other hand are derived using existing or historical data
with the help of mathematical models [153]. Objective weighting methods include
multi-objective optimization methods, TOPSIS, the Shannon entropy method,
principal component analysis (PCA) among others. They are deemed relevant in
MCDM especially when reliable subjective weights are difficult to obtain or non-
existent. Computation of objective weights are sometimes beset with problems of
accuracy and reliability [153].
The third approach to weights setting in MCDM is the use of hybrid methods
that include the combination of additive and multiplication synthesis [153]. In
figure 13, is a summary of some methods and approaches that are used in
subjective, objective and hybrid weights assignment in MCDM. It must be noted
that the conjoint analysis method used to set weight in this work, is a trade-off
method which comes under subjective weighting methods.
Fig. 13: Hierarchical outline of MCDM methods (source: [153])
MCDM Weighting Methods
Objective weighting
methods
Hybrid weighting
methods
Subjective weighting
methods
Ranking weighting methods
Direct weighting methods
Allocation of points
Trade-off methods
Pairwise comparison methods
(AHP, ANP)
Least square methods
Consistent matrix analysis
Delphi method
Eigenvector method
Variation Coefficient method
Principal component analysis
Entropy method
Multiple correlation coefficient
TOPSIS
Additive synthesis
Optimal weighting based on sum
of squares
Optimal weighting based on
relational coefficient of gradation
Optimal weighting based on min.
bias

60
7.1 Choice of a Weighting Method
The decision to select an appropriate weighting method for multi-criteria
decision problems, is one of the most difficult processes in the chain of steps in
MCDM. This is because for MCDM problems where weights assignment is
required, the weights become the fulcrum to the final ranking and selection of the
competing alternatives. Thus a slight change or inaccuracies in the weights can
have a congruent effect on the final ranking results. With this in mind, and with
Hobbs’s [154] research affirming that different weighting methods result in
different set of criteria weights and consequently on the overall results, care must
be taken to choosing an appropriate weighting method suited for a particular
decision problem. In furtherance to the results in [154], [155] deployed five
weighting methods to assign ranges of weights to sets of criteria. The findings as
a result of comparisons among the various weighting methods suggested that in
subjective weighting methods, decision makers would normally assign almost the
same weights scores to criteria even with different weighting methods. However,
in terms of the suitability of the weighting method and its ease of use to the
decision problem, some minor variations were recorded [155] as cited in [153].
These slight inconsistencies in weights values derived with deferent weighting
methods have the potential of altering final results especially when alternative
performance scores are so close to each other.
In view of this, it is obvious that no single weighting method in MCDM is
adequately enough for all decision problems. However, the strength of each
weighting method must be brought to bear on the decision problem at hand. For
instance [156] found no weighting technique overly superior to the others and
therefore asserted that a preferred weighting method in translating experts’ ratings
into relative weights must always be based on the intended use of the scale
(ordinal, interval, or ratio level of measurement) to be used. Other considerations
for choice must also look at the specific decision problem at hand, ease of use of
the method especially computational time involved, respondents (decision
makers) adequate knowledge and understanding of the requirements of the
weighting method and the general output expected from the decision problem.
In [157] MCDM weighting methods are classified into two broad categories;
direct and indirect estimation. In direct estimation, questionnaires are mostly used
to elicit preferences expressed in relative importance of the attributes where
respondents’ priority statements in terms of their responses are expressed in
numerical terms. The following are some of direct weighting estimation
techniques [153].
Rating method: Rating related methods basically require respondents
(decision-maker) to determine the relative importance of each criterion in
a set of criteria (attributes) by distributing numerical values of points
among the criteria.

61
Ranking method: In ranking methods in direct estimation, respondents on
the other hand rank a set of criteria in order of their importance.
Trade-off method: In trade-off weighting methods, the decision-maker by
assigning a relative importance value to a criterion trades off one quality or
aspect for the other. This is done by directly placing weights on a set of
criteria in a pairwise combination respect to all other criteria [153].
Weighting methods that rely on trade-offs are widely used because of the
strong theoretical foundation they possess [153]. Since trade-off method
makes compromises between two criteria, a decision maker does not
necessary assign weights or determine the relative importance of a criterion
directly [154]. The decision maker is only allowed to state the extent of
compromise they are willing to make between two criteria when the two
criteria cannot be chosen at the same time. However, by making their
preferences through trade-offs, decision makers’ preferences indirectly
aggregate into relative importance of the criteria. Conjoint analysis
technique is one such trade-off method though not traditionally an MCDM
method. Among MCDM methods, AHP is noted as the most reliable trade-
off method.
Pairwise comparison: In paired comparison, the goal is to basically
address issues of unfairness by satisfying the Condorcet criterion. This is
carried out by pitching the performance of each alternative in head-to-head
with each of the rest of alternatives. Pairwise comparison is widely used
because of its strengths over other direct weighting estimation methods
which become inefficient when number of objectives grow large [158] as
cited in [153]. The problem with large number of objectives are adequately
dealt with the AHP method, which both concurrently provides pairwise
comparison and trade-off function. Pairwise comparison is found to provide
clear interpretable results which are easy to produce unlike trade-off
methods. The method works better with finite alternatives. The
methodology is found to be the most widely used for assigning weights
when the relative importance of criteria is of utmost importance. However,
pairwise comparisons show some weaknesses in its preference modelling.
The most obvious one is its inability to allow respondents to express a
separation distance in their choices of best and worst alternatives. A second
concern about pairwise comparison methods is the seeming complexity that
characterizes the comparison of objects in pairs especially when there are
large sets of criteria and respondents involved [154]. Lastly, there is the
inconsistency at the level of the decision maker concerning pairwise
comparison especially when there are large number of criteria involved
[153].
According to [157], in indirect weighting estimation methods, weights are
assigned based on respondents’ choices in the past. In essence, weights are
derived through the estimation of previous behavior or preferences of decision-

62
makers. It is observed that both direct and indirect weighting methods possess
strengths and weaknesses in terms of accuracy that make them applicable only in
unique situations. In other words, the usefulness of each method depends largely
on the input time, the attitude and conditions of the decision-makers [158], [159].
In [154] where two weighting methods were used in plant location problems, the
result produced completely different values. In the experiment, trade-offs and a
rating method were explored which produced different weighting values. This
affirms other research by [155] that, different weighting methods produce
different results, hence the need to select an appropriate weighting method for
particular problems.
In practice, the two most widely used weighting methods are those that fall
under pairwise comparison and trade-off methods. Weighting methods that allow
for trade-offs to be made by decision makers’ preferences consistent with the
underlying decision rule, tend to yield reliable and consistent weights [153].
Trade-off weighting methods though widely accepted, tends to be time consuming
and difficult to implement in practice. The next most widely used weighting
MCDM method are those that belong to the range of pairwise comparison
methods. AHP is one method that provides both functionality of trade-offs and
pairwise comparison and therefore a preferred choice in weight setting in MCDM.
In this dissertation, conjoint analysis, a method outside the scope of MCDM
but which functions almost the same as most MCDM methods is used to set
weights. It is demonstrated that although AHP is a preferred choice for trade-off
modelling in MCDM approaches, conjoint analysis has some inherent advantages
over AHP especially in terms of the number of input preferences it can model.
Additionally, conjoint analysis with its partial and total part-worth utilities also
easily reveal preferences at every level of the attributes, a strength that AHP lacks.
Furthermore, conjoint analysis is also best suited for decision problems
investigated in the numerical sections of this work. In particular is its ability to
adequately model preferences of a large group of people and transform the relative
importance of each attributes (criteria) into criteria weights. In the following
sections, the proposed hybridized decision framework is introduced. Conjoint
analysis for criteria weight setting and intuitionistic fuzzy TOPSIS method for
alternatives ranking are presented.

63
PROPOSED HYBRID/INTEGRATED METHOD
(Conjoint Analysis - Intuitionistic Fuzzy TOPSIS method)

64
8 A TWO-TIER HYBRID MCDM MODEL
The investigative section provided insights into the appropriate use of MCDM
methods especially when used in special cases in a hybrid structure. This section
proposes a novel hybrid decision making method appropriate in situations of
merging decisions from two different groups of decision makers. The basic notion
is to model decision situations where the preferences of a large group of decision
makers are expressed as criteria weights and subsequently factored into another
level of decision making involving a small group of DMs selecting a best
alternative from a competing set of alternatives. The two levels of decision
making are conveniently described as a two tier hybrid MCDM model. The two-
tier model is especially ideal in many cases where preferences and opinions of a
large group of people (for example, shareholders, customers, employees, students
etc.) are merged into a final decision making stage involving small group (experts)
(e.g. board of management, marketing executives, managing directors, school
management board etc.). Such two-tier decision making structures arise when a
higher decision making body made up of a relatively small group of experts,
solicits opinions from a lower decision making body made up of a relatively large
group of people (more than 100). For example, in a hypothetical situation where
a company's executives want to select an ideal location to site a new sales branch,
customers (large group) preferences and trade-offs may be factored into such
decision making structure. In this regard, the preferences of customers can be
modelled and incorporated into the final decision by the executives.
Fig. 14: Schematic diagram for a two-tier hybrid MCDM decision making model
Hybrid Two-
Tier Decision
Making Model
Level 1: Modelling
preferences of a large
decision making group
Level 2: Modelling
preferences of a small
decision making group
Merging the
two levels into
a composite
decision
Phase 1: Define
decision parameters
Phase 2: Setting criteria
importance weights
Setting up a large decision
making group (eg.
shareholders or customers)
Define sets of criteria
Conjoint Analysis model
Phase 4: Sensitivity
analysis
Phase 3: Ranking
alternatives
Intuitionistic Fuzzy
TOPSIS method with
IFWA aggregation
operator
Scenarios of Sensitivity
analysis

65
In this dissertation, two existing methods (one MCDM method and a popular
marketing research tool) are employed to demonstrate the modelling of such two-
tier decision problems of incorporating two decision points into a composite one.
Whiles many MCDM methods can be used to set criteria weights (as described in
chapter 7), the special case of modelling preferences and trade-offs of large group
of decision makers, can ideally be performed using conjoint analysis. Conjoint
analysis is used to elicit preferences of the large decision making group and
treated as criteria weights. Intuitionistic fuzzy TOPSIS method on the other hand,
is used to rank competing alternatives. The conjoint analysis method which is
traditionally not considered an MCDM method shares similar features with full
aggregation MCDM methods. In the following section, the conjoint analysis
method is compared to MCDM methods where its use in two-tier model is
justified.
8.1 Conjoint Analysis Technique and MCDM Methods
Conjoint Analysis (CA) and Multi-Criteria Decision Making Methods
(MCDM) in general, share similar characteristics especially in the way they
function, even though they both have different objectives. For instance, presented
with a problem, both methods typically decompose the problem into a set of
criteria or attributes with several levels. Additionally, they both typically employ
linear additive functions to determine the aggregate relative preferences of a given
set of alternatives [114]. However, these similar features in conjoint analysis and
MCDM have rarely been explored together by researchers and practitioners. One
of the several reasons identified for this lack of collaboration could be their
traditionally restricting areas of application. Whiles conjoint analysis is used to
elicit customer preferences to predict their purchasing decisions in marketing
research, MCDM is popular in decision sciences and operations research for
evaluation, ranking and selection problems. Perhaps the clearest challenge with
deploying conjoint analysis and MCDM techniques is the size of data
conventionally used in both methods. IJzerman et al., [114] explains that typically,
CA approaches require large data sets whereas MCDM methods, for example
Analytical Hierarchy Process (AHP), are capable of working with a single
decision maker. In view of the seeming challenges in utilizing CA and MCDM
methods together, this paper demonstrates an applicability of the two methods as
a 2-tier hybrid decision method to incorporate preferences of large decision
making group into a relatively small decision making group.
The paper recognizes some contributions of decision making models that have
created the research space for the concurrent use of conjoint analysis and multi-
criteria decision making methods. A non-technical article by [115] gave an
overview of utilizing conjoint analysis tools in multi-criteria decision making
methods. Scholl, et al. [116] compared solving multi-attribute design problems
with analytic hierarchy process and conjoint analysis and found both useful for
modelling respondents’ preferences. Peniwati [117], evaluated several group

66
decision making methods and found conjoint analysis as a potent technique in
terms of its depth of analysis and ‘faithfulness of judgments’. Subsequently [114]
compared the performances of AHP and conjoint analysis in the assessment of
treatment alternatives for stroke rehabilitation. IJzerman et al. [114] identified
several similarities and differences between the two methods. Literature is abound
with research contributions where various forms of user preferences were
explored in decision making problems using conjoint analysis and MCDM
methods. However, combining conjoint analysis and an MCDM method has
rarely been explored in literature. This dissertation demonstrates the appropriate
use of conjoint analysis and an MCDM method in special cases of merging two
independent decisions from two different decision levels. A demonstration of
such applicability of conjoint analysis-MCDM is shown with 3 numerical
examples in the case study section. In view of the prospects, challenges and
general progress made in modelling user preferences using various methods, this
dissertation proposes a 2-tier hybrid conjoint analysis – intuitionistic fuzzy
TOPSIS framework to incorporate large decision group preferences and trade-offs
(which culminate into criteria weights) into a relatively small decision group
(experts). The conjoint analysis is comparatively ideal for modelling large
decision making groups. Intuitionistic fuzzy TOPSIS is ideally chosen for ranking
alternatives because of its ability to decipher how much of a decision maker’s
rating is satisfactory, dissatisfactory or hesitant. This helps to put premium or not
on a decision maker’s judgements. The following sections explain the proposed
hybrid methodology, divided into first and second tiers and a thorough
background to the two methods explained.
8.2 First Tier - Conjoint Analysis
Conjoint analysis (CA), widely utilized in marketing research, originated from
mathematical psychology with introductory articles by [118,119,120] among
others. However, before these papers, [121], [122], and [123] as cited in [124] had
made significant contributions toward observing decision makers’ (DMs) policies
and decisions over time and making inferences from them. Later on, contributions
from [125] and more recent contributions by [126], [127] and [128] have helped
to improve trade-off decision analysis using conjoint analysis. Conjoint analysis
technique basically models preference data of judges who are predominantly non-
experts (service users, shareholders, consumers, potential customers, etc.) on a
range of stimuli (products or services) by their attributes, where the attributes have
different levels [126]. The technique works by decomposing the preference data
into a so-called part-worth utilities and examining the trade-offs of the decision
makers (DMs) between different levels. This approach helps to determine the
relative importance DMs attach to attributes and their levels [116]. Over the years,
the robustness, accuracy and reliability of CA has been vouched in literature
through studies by [129], [130], and [131] as cited in [132]. Conjoint analysis is
typically a simple-effects Analysis of variance (ANOVA) that produces some

67
specialized outputs. The model in Eq. (39), expresses a decision maker’s stated
preferences for a range of attributes at various levels in a full factorial design.
1 2
1 2 1 2 1 2
...
... ...
1 , 1 , , 1
... ... ,i j i j ki n
n i i j i j k n n
n n nA A A A AA A A A
x x x x x x x x x x x x x x x
i i j i j ki j i j k i
y
(39)
where μ is the grand or the general mean; 𝛽𝑥𝑖𝐴𝑖 is the effect of attribute 𝐴𝑖 at the
level 𝑥𝑖; 𝛽𝑥𝑖𝑥𝑗𝐴𝑖𝐴𝑗
is the effect of attributes 𝐴𝑖 and 𝐴𝑗 at levels 𝑥𝑖 and 𝑥𝑗 respectively;
and 𝜀𝑥1,𝑥1,…𝑥𝑛 is the error term. The attributes represent the independent variables,
the preferences are the dependent variable and the 𝛽′𝑠 are the part-worth utilities
which signify the parameter estimates from the ANOVA model [133]. In this
paper, the additive model is used to compute the part-worth utilities of each
respondent which consequently results in the total utility attached to an attribute
(criteria) by the group of respondents (large decision making group). In Eq. (40),
an individual decision maker’s utility U regarding an attribute (criteria) 𝐶𝑖 is
expressed in the additive format.
𝑈(𝐶𝑖)=∑ ∑ 𝛽𝑖𝑗𝐺𝑖𝑗𝑚𝑗
𝑗=1𝑚𝑖=1 (40)
Where 𝛽𝑖𝑗 defines the part-worth utility estimate on the j-th level of the i-th
factor (i=1, 2,…n and j=1, 2,…m), and 𝐺𝑖𝑗indicates the presence of the j-th level
of the i-th attribute or criteria (where 𝐺𝑖𝑗 = 0 if attribute j is not present or 1 if
attribute j is present).
8.2.1 Relative importance of attributes/criteria
The computation of the relative importance of each attribute is a very important
step in conjoint analysis and as far as this dissertation is concern. It is essentially
the weight of importance assigned to the attribute (criteria) evaluated in
percentages. In Eq. (41) 𝑊j is the relative importance of attribute (criteria) 𝐶𝑖 ;
Max(𝛽𝑖𝑗) represents the maximum utility of the attribute, meaning the most
preferred attribute level whiles Min(𝛽𝑖𝑗) is the minimum utility signifying the
least preferred level [134].
𝑊𝑗 =𝑀𝑎𝑥(𝛽𝑖𝑗)−𝑀𝑖𝑛(𝛽𝑖𝑗)
∑ [𝑀𝑎𝑥(𝛽𝑖𝑗)−𝑀𝑖𝑛(𝛽𝑖𝑗)]𝑡𝑗=1
× 100 (41)
At this stage, the weight 𝑊j represents the importance that decision makers
(large group) assign to each of the attributes (criteria) to be used in the subsequent
selection problem. The weight 𝑊j obtained from decision makers for each of the
criterion are factored into the second-tier using intuitionistic fuzzy TOPSIS
method.

68
8.2.2 Types and Uses of Conjoint Analysis
Typically, conjoint analysis is grouped into 4 categories namely; the traditional
conjoint analysis (TCA), adaptive conjoint analysis (ACA), choice-based conjoint
analysis (CBCA) and self-explicated conjoint analysis [160]. The first three
methods; TCA, ACA and CBCA are decompositional in the way they function,
by decomposing the preference data into a so-called part-worth utilities [121],
[160]. Self-explicated conjoint analysis on the other hand, functions from bottom-
up in a compositional structure. Unlike the first three, it composes the preference
values usually from ratings based data on attribute levels and subsequently
determines the relative importance of attributes [160].
There are stark differences among the four types of conjoint analysis even
though the decompositional types share similar features in the way they function.
These differences serve as a guide to choosing each of them in real-life
applications. The traditional conjoint analysis (TCA) which basically uses ‘stated’
preferences gathers and models respondents’ preferences for profiles of a set of
stimuli (products or services) where the entire (full) set of attributes (criteria) are
utilized for the study [125],[126]. This type of preference modelling in CA is
called full profile design. In practice however, using the complete set of full
profiles often becomes burdensome to respondents. For example in a situation
where there are even only 4 attributes each at three levels, there would be a total
of (3 x 3 x 3 x 3) = 81 possible sets of profiles which practically becomes
impossible to get accurate and reliable responses from respondents. In view of
this, a smaller set of full profiles chosen in an experimental design, are normally
used to make the work of respondents less burdensome and by extension have a
highly reliable preference data [160]. Full profile design in TCA when necessary,
actually mirrors real-world decision on alternatives in a realistic manner by
presenting all sets of combinations in an integrated multi-criteria concept.
Traditional conjoint analysis uses regression-based approaches to decompose a
decision-makers’ overall stated preferences into separate utility values that
correspond to each attribute [160]. The separate utility values are referred to as
‘attribute-specific part-worth functions’ [160]. According to [160] the preference
functions can in most cases be estimated at the individual level where the
preference function is seen as an indirect utility function.
Over the years, the challenge faced by practitioners in utilizing the traditional
de-compositional conjoint method, generated research interests in alternative
workable conjoint analysis approaches. A significant number of these new data
collection and design methods are based on the idea of modelling preferences
generated under hypothetical scenarios that mirrors the underlying real-world
problem [126]. These new approaches also proposed the use of new estimation
methods for part-worth functions such as multinomial logit methods, primarily
designed for choice-based conjoint analysis methods, the share model for share
allocation studies and logit models for probability of purchase situations [126].
Table 7 presents a host of conjoint data collection techniques and their respective

69
estimation approaches. Choice-based conjoint analysis methods are theoretically
based on discrete choice analysis where a prediction is made on choices between
two or more discrete alternatives. They are sometimes referred to simply as
“stated” choice methods because they design and model discrete hypothetical
choice possibilities of respondents [160]. CBCA is among one of the widely used
CA methods. Primarily based on behavioral theory of random utility
maximization [161] as cited in [160], the CBCA approach decomposes a decision
maker’s random utility for a stimulus into two parts: deterministic utility and a
random component [160]. Over the years, a number of alternate models have been
designed that explain the probability of choice of a stimulus (object) based on the
distributional assumptions of the random component [160], [130]. The most
popular and widely used of these new models is multinomial logistic regression
(logit model). All these methods and approaches come under the family of discrete
choice analysis methods. Table 6 presents various steps in conjoint analysis and
various diverse approaches used in providing solutions.
Table 6. Steps in conjoint analysis and various solution approaches
Table 7. Methods of data analysis in conjoint measurement
STEP METHODS
Choice of prefderence model Vector model
Part-worth model
Ideal point model
Data Collection Trade-off
Full profile
Stimuli Construction Fractional factorial design
Stimuli Presentation Visual presentation
Description
Real product
Preference scale Rank
Score
Pairwise comparison
Estimation Multiple regression (metric)
ANOVA (non-metric)
Forms of Preference modelling in CA Data Analysis
Ratings Regression Analysis
Choice Multinomial Logit
Rankings MONANOVA or LINMAP
Share Allocation Share Model
Probability of Purchase Logit Model

70
8.3 Second-Tier – Intuitionistic Fuzzy TOPSIS
The Technique for Order Preference by Similarity to Ideal Solution (TOPSIS)
method proposed by [47], has become one of the most popular techniques in
Multiple Criteria Decision Making (MCDM). Similar to all other deterministic
MCDM methods, the fuzzy and the intuitionistic fuzzy extensions of TOPSIS
have subsequently been developed. Basically, there are five computational steps
involved in the TOPSIS approach, starting with the gathering of performance
scores of alternatives with respect to the set criteria. The second step involves
normalization of the performances for uniformity. The normalized scores for the
competing alternatives are subsequently weighted and their distances to ideal and
anti-ideal points calculated [56]. Finally, the relative closeness to an ideal solution
is given by the ratio of these distances. These five steps are explained in detail
with the intuitionistic fuzzy extension form in this chapter.
The above computational steps are extended using intuitionistic fuzzy sets.
Like the original TOPSIS method, the intuitionistic fuzzy TOPSIS also relies on
the so-called shortest distance from the Intuitionistic Fuzzy Positive Ideal
Solution (IFPIS) and the farthest distance from the Intuitionistic Fuzzy Negative
Ideal Solution (IFNIS) to determine the best alternative, as shown in figure 15. In
figure 15, point A is shortest to the ideal solution and therefore becomes the best
solution. The IFNIS maximizes the cost criteria and minimizes the benefit criteria,
whiles IFPIS maximizes benefit criteria and minimizes cost criteria. The
alternatives are ranked and selected according to their relative closeness
determined using the two distance measures. Similarly, the extension of TOPSIS
into intuitionistic fuzzy sets also maintains the key features such as the FPIS and
the FNIS [20]. Intuitionistic Fuzzy TOPSIS was chosen because it is theoretically
more robust [135], provides a sound logic that mirrors the human reasoning in
selection of alternatives, and presents a scalar score value that accounts for both
the best and worst alternatives at the same time [136].
Fig. 15: Conceptual model of TOPSIS method
1 Criterion 1
1
Criterion 2 Ideal Solution
Anti- ideal Solution
A
B

71
8.3.1 Steps for Intuitionistic fuzzy TOPSIS
Step 1. Determining sets of alternatives, criteria, linguistic variables and
decision-makers.
As usual with MCDM methods, the alternatives to be ranked, the criteria to be
used in the ratings and the group of decision-makers are determined. In view of
this, let 𝐴 = {𝐴1, 𝐴2, … , 𝐴𝑚}be the set of alternatives to be considered, 𝐴 ={𝐶1, 𝐶2, … , 𝐶𝑛}, the set of criteria and, 𝑘 = {𝐷1, 𝐷2, … , 𝐷𝑑} the sets of decision
makers. Equation. (41), shows a decision matrix for decision maker, 𝑘 =1,2,… , 𝑑
𝐶1 ⋯ 𝐶𝑛
�̃� = 𝐴1⋮𝐴𝑚
[�̃�11 ⋯ �̃�1𝑛⋮ ⋱ ⋮�̃�𝑚1 ⋯ �̃�𝑚𝑛
], i = 1, 2, …,m; j = 1, 2, …,n (42)
where �̃�𝑖𝑗is the rating of alternative 𝐴𝑖 with respect to criterion 𝐶𝑗 both
expressed in intuitionistic fuzzy sets (IFS). This implies that the rating of a
decision maker 𝑘, is expressed as �̃�𝑖𝑗𝑘 = ⟨�̃�𝑖𝑗
𝑘 , �̃�𝑖𝑗𝑘 , �̃�𝑖𝑗
𝑘 ⟩. Additionally, linguistic
variables (criteria) to be used in the assessment and subsequent ranking are
determined. The linguistic variables (criteria) are then expressed in linguistic
terms and used to rate each linguistic variable. The linguistic terms are further
transformed into intuitionistic fuzzy numbers (IFNs). Linguistic terms are
qualitative words that reflect the subjective view of an expert or decision maker
about the criteria per each alternative under consideration [137]. The various
linguistic variables, terms as well as the IFNs are expressed on a scale of 0-1 and
demonstrated in the case study section.
Step 2. Determining importance weights of decision-makers
In this step, the weights of decision makers, if relevant to the study, are
determined based on their relative importance towards the final decision to be
made. This is premised on the assumption that not all decision-makers are equal
in importance and that there is a higher decision authority that rates to assign
weight to the decision makers. It must be noted that not all decision problems have
the decision makers weighted. In this study, because of the peculiarity of merging
two decision points, the decision makers (small group of experts) are considered
not to have the same importance. The ratings of the decision makers are expressed
linguistically in intuitionistic fuzzy number (IFN) format. Let �̃�𝑘 = ⟨�̃�𝑘, �̃�𝑘, �̃�𝑘⟩be
an intuitionistic fuzzy number expressing the rating of a kth decision maker. Then
the importance weight of the kth decision maker may be expressed as in Eq. (43)
below and cited in [20].

72
�̃�𝑘 =(�̃�𝑘+�̃�𝑘(
�̃�𝑘�̃�𝑘+�̃�𝑘
))
∑ (�̃�𝑘+�̃�𝑘(�̃�𝑘
�̃�𝑘+�̃�𝑘))𝑑
𝑘=1
(43)
Step 3. Determining weights of each criterion
In this step, the importance or the weight of each criterion are determined.
However, peculiar to this hybrid framework, the weights of the criteria are
determined through the preferences and trade-offs of the large decision group,
using conjoint analysis. In Eqn. (44), 𝑊𝑗 denotes the weight of the criterion 𝐶𝑗
representing the importance that decision makers (large group) assign to each of
the attributes (criteria) in the conjoint analysis modelling. The parameters in Eqn.
(44) are explained in Eqn. (41).
𝑊𝑗 =𝑀𝑎𝑥(𝛽𝑖𝑗)−𝑀𝑖𝑛(𝛽𝑖𝑗)
∑ [𝑀𝑎𝑥(𝛽𝑖𝑗)−𝑀𝑖𝑛(𝛽𝑖𝑗)]𝑡𝑗=1
× 100 (44)
Step 4. Aggregation of decisions
In step 4, the ratings of the decision makers concerning the alternatives and
criteria importance which are expressed in intuitionistic fuzzy sets are aggregated.
Let �̃�𝑘 = (�̃�𝑖𝑗𝑘 )
𝑚×𝑛 express the intuitionistic fuzzy matrix of each of the decision
makers and �̃� = [�̃�1, �̃�1, … , �̃�𝑑], the importance weight of each decision maker
where ∑ �̃�𝑘 = 1𝑑𝑘=1 , �̃�𝑘 ∈ [0,1].
The importance of aggregation in group decision making processes cannot be
overemphasized. Aggregation operators are used to sum up all individual ratings
into a composite decision for the group of decision makers. In fuzzy decision
modelling, many aggregation operators have been proposed with the majority
belonging to the families of averaging operators, ordered weight aggregation
(OWA), compensatory operators, geometric operators, Shapley averaging
operators, Sugeno integrals, Choquet operators and many other hybrid forms. In
this paper, the Intuitionistic Fuzzy Weighted Averaging (IFWA) operator is used
to aggregate decision makers’ (small group) preferences for the alternative
ratings. The (IFWA) operator by Xu [36] is preferred because it is simpler, yet
efficient [35]. In Eq. (45) is the IFWA operator where �̃�𝑖𝑗is the aggregated
decision matrix.
�̃�𝑖𝑗 = 𝐼𝐹𝑊𝐴𝑝 (�̃�𝑖𝑗(1), �̃�𝑖𝑗(2), … , �̃�𝑖𝑗
(𝑑)) = �̃�1�̃�𝑖𝑗
(1)+ �̃�2�̃�𝑖𝑗
(2)+⋯+ �̃�d�̃�𝑖𝑗
(𝑑)
=⟨1 − ∏ (1 − �̃�𝑖𝑗(𝑘))�̃�k∏ 𝑣�̃�k𝑑𝑘=1
𝑑𝑘=1 ⟩ (45)

73
Step 5. Constructing weighted aggregation of intuitionistic fuzzy sets
The next step computes the aggregated weighted intuitionistic fuzzy set by
multiplying the weight vector of the criteria set by the aggregated decision matrix
obtained in step 4. The weighted decision matrix is expressed in Eq. (46) below.
𝑊 × 𝑆 = �̃�𝑇 × ⟨�̃�𝑖𝑗𝑘 , �̃�𝑖𝑗
𝑘 ⟩ = ⟨�̃�𝑖𝑗𝑘 , �̃�𝑖𝑗
𝑘 ⟩ (46)
Step 6. Determining intuitionistic fuzzy positive A and negative A ideal
solutions
At this stage, the criteria are separated into a so-called benefit and cost criteria.
Let 𝐵 and 𝐶 respectively represent the benefit and cost criteria. Then 𝐴−which
maximizes the cost criteria while minimizing benefit criteria, and 𝐴+which
maximizes the benefit criteria and minimizes cost criteria are computed as
follows:
𝐴+ = (𝜇𝐴+𝑊(𝑥𝑗), 𝑣𝐴+𝑊(𝑥𝑗))𝐴− = (𝜇𝐴−𝑊(𝑥𝑗), 𝑣𝐴−𝑊(𝑥𝑗)) (47)
where
𝜇𝐴+𝑊(𝑥𝑗) = ((max𝑖𝜇𝐴𝑖.𝑊 (𝑥𝑗)| 𝑗 ∈ 𝐵) , (min𝑖
𝜇𝐴𝑖.𝑊 (𝑥𝑗)| 𝑗 ∈ 𝐶)) (48)
𝑣𝐴+𝑊(𝑥𝑗) = ((min𝑖𝑣𝐴𝑖.𝑊 (𝑥𝑗)| 𝑗 ∈ 𝐵) , (max𝑖
𝑣𝐴𝑖.𝑊 (𝑥𝑗)| 𝑗 ∈ 𝐶)) (49)
𝜇𝐴−𝑊(𝑥𝑗) = ((min𝑖𝜇𝐴𝑖.𝑊 (𝑥𝑗)| 𝑗 ∈ 𝐵) , (max𝑖
𝜇𝐴𝑖.𝑊 (𝑥𝑗)| 𝑗 ∈ 𝐶)) (50)
𝑣𝐴−𝑊(𝑥𝑗) = ((max𝑖𝑣𝐴𝑖.𝑊 (𝑥𝑗)| 𝑗 ∈ 𝐵) , (min𝑖
𝑣𝐴𝑖.𝑊 (𝑥𝑗)| 𝑗 ∈ 𝐶)) (51)
Step 7. Computing separating measures
The distances 𝑑𝐼𝐹𝑆+ and 𝑑𝐼𝐹𝑆
− , which express the distances of each alternative
from 𝐴+ and 𝐴−are calculated as shown in Eq. (52) and (53) respectively. These
distances are computed as intuitionistic sets.
𝑑𝐼𝐹𝑆+ (𝐴𝑖𝐴
+)=√∑ [(𝜇𝐴𝑖𝑊(𝑥𝑗) − 𝜇𝐴+(𝑥𝑗))2+ (𝑣𝐴𝑖𝑊(𝑥𝑗) − 𝑣𝐴+(𝑥𝑗))
2+ (𝜋𝐴𝑖𝑊(𝑥𝑗) − 𝜋𝐴+(𝑥𝑗))
2]𝑚
𝑗=1 (52)
𝑑𝐼𝐹𝑆− (𝐴𝑖𝐴
−)=√∑ [(𝜇𝐴𝑖𝑊(𝑥𝑗) − 𝜇𝐴−(𝑥𝑗))2+ (𝑣𝐴𝑖𝑊(𝑥𝑗) − 𝑣𝐴−(𝑥𝑗))
2+ (𝜋𝐴𝑖𝑊(𝑥𝑗) − 𝜋𝐴−(𝑥𝑗))
2]𝑚
𝑗=1 (53)
Step 8. Computing relative closeness coefficient and ranking of alternatives
The relative closeness coefficient also known as relative gaps degree CCi, is
used to determine the ranking of the ith alternative. This is computed using Eq.
(54) below:
𝐶𝐶𝑖 =𝑑𝐼𝐹𝑆− (𝐴𝑖𝐴
−)
𝑑𝐼𝐹𝑆− (𝐴𝑖𝐴
−)+𝑑𝐼𝐹𝑆+ (𝐴𝑖𝐴
+) (54)
The highest value of CCi determines the best alternative implying that the chosen
alternative is concurrently closer to A+ and farther away from A-

74
NUMERICAL EXAMPLES

75
9 INTRODUCTION TO NUMERICAL EXAMPLES
This section presents 3 numerical examples to demonstrate the applicability of
the proposed conjoint analysis – intuitionistic fuzzy TOPSIS framework for
merging two-tier decision points into a composite one. In each of the three
examples (cases), preferences of a lower decision making body (large group) is
incorporated into preferences of a higher decision making body (small group or
experts). As mentioned earlier, the conjoint analysis method models the
preferences of a large decision group into criteria weights and incorporates the
weights into another decision level by a relatively small group involved in ranking
and selection of competing sets of alternatives. The aggregate conjoint analysis
model was used to generate the part-worth utilities of each attribute (criteria).
Furthermore, the MONANOVA (Monotone Analysis of Variance) estimation was
used in producing the part-worths utilities at each level of attributes. The second
part involved the use of intuitionistic fuzzy TOPSIS in the ranking and selection
of various competing alternatives demonstrated in 3 numerical examples. Each
numerical example captures the ‘special’ scenario where such 2-tier decision
making model would be relevant in an ideal world situation. In each example, the
decision problem is formulated in a story-like form to demonstrate the need to
apply the proposed hybrid MCDM model.
The first numerical example looked at an ideal situation of building
compromises between shareholders and board management group in a micro
finance organization. Preferences of shareholders regarding the selection of a new
manager are converted into relative criteria weights using conjoint analysis and
subsequently, candidates for the position of a new manager are ranked and
selected with intuitionistic fuzzy TOPSIS.
In the second numerical example, customer preferences regarding a company’s
evaluation of its third party distributing agents (distributors) are modelled with
the proposed hybrid method in a two-tier structure. The demonstration again
shows how the hybrid framework incorporates customer concerns into
management selection decisions.
The third numerical example looks at a hypothetical situation of a company
selecting a recruitment Process Outsourcing Vendor as a partner. To this,
company management team samples preferences of other managers in the sector
regarding the characteristics they wish to see in a recruitment outsourcing vendor
along with the trade-offs they would wish to make. Similarly, these preferences
are modelled with conjoint analysis into criteria weights and subsequently,
intuitionistic fuzzy TOPSIS helps in the selection stage. The following sections
present the numerical examples.

76
9.1 NUMERICAL EXAMPLE 1.
(Incorporating Shareholder Preferences into Board Management Selection Decisions)
9.1.1 Background to the problem
Most decisions in the corporate world are traditionally taken by a team of
experts from fields and disciplines that matter to the problem [138]. These team
of experts often constitute the board of management [139] or simply company
directors. In recent times, the practice of heavily relying on board of management
for critical organizational decisions such as (1) selection of a new
manager/director, (2) sale of assets, (2) determining performance-based
compensations and (3) amount of money to distribute among shareholders among
others [140], have been challenged by legal representatives of shareholders as
they seek more for ‘powers’. In particular with recent corporate governance
failures at HIH Insurance Limited [141, 142], Enron Inc. [143, 144] and
WorldCom Inc [145,144], shareholders around the world have been empowered
to seek for increased participation in critical decisions management decisions
([140, 146]. Shareholder activism and its related empowerment agenda for an
increased decisional roles have gained momentum across the globe especially in
America, Japan, United Kingdom, South Korea, and Australia [147]. With some
high profile cases such as Carl Icahn versus Time Warner, Kirk Kerkorian versus
General Motors and Nelson Peltz versus H.J. Heinz & Co. [148], shareholders
continue to seek an increase participatory role in corporate governance by
demanding for more decisional powers.
However, with such momentum for a greater representation of shareholders in
critical decisions, the challenge has been identifying those exact situations where
such collaborative effort between the board of management (company directors)
and shareholders can be reached. This numerical example uses the proposed 2-
tier conjoint analysis-intuitionistic fuzzy TOPSIS hybrid decision making model
to present a real-world example of how such management board – shareholder
decision making collaboration can be explored. The case study demonstrates how
certain powers can be ceded to shareholders in an organizational setting. In the
numerical example of selecting a new manager in a microfinance organization,
shareholders who belong to a ‘large group’ of decision makers are given the
powers to determine the relative importance of the criteria to be used in the
manager selection process. Their preferences and trade-offs are modelled into
criteria (attributes) weights and subsequently used by board of management
(small group) in the selection. Such shared decision making model has the
potential of deepening trust and accountability between shareholders and
management board.

77
9.1.2 The Decision Problem
The problem is to select a new manager to replace an outgoing one. Given
recent history of shareholder activism for greater representation in key decisions,
management has agreed to involve shareholders by incorporating their
preferences in terms of the importance they attach to the criteria to be used in the
selection of a new manager. To carry out this, a number of problems were
identified. The first was finding an appropriate method to model the preferences
of 126 shareholders and second, how to incorporate their decisions in terms of
criteria weights into the decision making process. Conjoint analysis (CA) and
intuitionistic fuzzy TOPSIS method were chosen they mirror the human rationale
in selection. In the following section, the phases for the hybrid framework are
outlined. CA in particular was ideal for modelling large preference data
Phase 1: Selecting Attributes and Levels for modelling with Conjoint Analysis
The attributes (criteria) for selecting a new manager for the microfinance
company, was primarily based on expert advice and past literature on manager
selection problems. Based on these two pre-requisite, five key attributes or criteria
were identified as relevant for the problem. These were Knowledge of Business,
Educational Background, Relevant Experience, Management skills and Soft
Skills. All the 5 attributes were assigned with three levels as shown in Table 9. A
fractionated factorial design of 12 profiles (packages) was adopted and designed
with the help of the Conjoint Design module in the XLSTAT software (2014
version). Table 8, shows the 12 different profiles presented in this study to elicit
shareholder preferences based on rankings preference scale. The fractionated
factorial design experiment was useful considering that a full factorial design
would have yielded 243 stimuli which would have been a daunting task for the
shareholders. The aggregate conjoint analysis model was employed in generating
the part-worths of each attribute. Additionally the MONANOVA (Monotone
Analysis of Variance) estimation method was adopted for realizing the part-
worths utilities because it generates relatively better scores by combining the
linear regression model with a monotonic transformation of the response variable
[151].
The part-worth utilities, which are an individual respondent’s (shareholder)
‘value system’ or importance attached to each level of each criteria, are first
computed for each individual (shareholder) using Eq. (40). These are then
aggregated and averaged (mean) for all decision makers (shareholders) using Eq.
(41). For example, in column 7 and 8 in Table 8 are two preference ranking orders
of two shareholders (abbreviated as shdr) regarding the value they assign to each
of the 12 characteristic profiles. Shdr 1 and 2 assign a preference scale of 8 and 6
respectively to profile 1. These by the help of Eq. (40) computes an individual’s
utility which are subsequently aggregated for all individuals and averaged to
represent the relative importance of each criteria as shown in column 4 of Table
9.

78
Table 8. Profiles of possible candidate managers evaluated by shareholders in the experimental
design
Table 9. Attributes (Criteria) and Levels with their part-worths utilities relative importance
Observation Knowledge of
Business
Relevant
Experience
Management
skills
Soft Skills Educational
Background
Shdr 1
Shdr 2
Profile1 Current employee
candidate
More than
6yrs.
Meeting
Management
Adaptability Diploma with
professional
certification
8 6
Profile2 Non-employee
candidate (not
from a competitor)
1-3yrs. Leadership
and people
management
Good oral
communication
Bachelor’s
degree
4 5
Profile3 Non-employee
candidate (from a
competitor)
1-3yrs. Meeting
Management
Adaptability Bachelor’s
degree
4 6
Profile4 Non-employee
candidate (not
from a competitor)
More than
6yrs.
Leadership
and people
management
Problem
solving
Diploma with
professional
certification
2 0
Profile5 Non-employee
candidate (not
from a competitor)
More than
6yrs.
Finance
Skills
Adaptability Bachelor’s
degree
6 7
Profile6 Current employee
candidate
More than
6yrs.
Meeting
Management
Good oral
communication
Master’s
degree
9 9
Profile7 Non-employee
candidate (from a
competitor)
More than
6yrs.
Leadership
and people
management
Adaptability Master’s
degree
7 6
Profile8 Current employee
candidate
1-3yrs. Finance
Skills
Problem
solving
Master’s
degree
10 10
Profile9 Current employee
candidate
4-6yrs. Leadership
and people
management
Problem
solving
Bachelor’s
degree
6 4
Profile10 Non-employee
candidate (from a
competitor)
4-6yrs. Finance
Skills
Good oral
communication
Diploma with
professional
certification
5 4
Profile11 Non-employee
candidate (not
from a competitor)
4-6yrs. Meeting
Management
Problem
solving
Master’s
degree
3 3
Profile12 Non-employee
candidate (from a
competitor)
More than
6yrs.
Meeting
Management
Problem
solving
Bachelor’s
degree
6 8
Attribute (criteria) Levels Part-worth
utilities
(Mean)
Relative
importance
(Weight %)
C1:Knowledge of
Organization
Current employee candidate (𝐶11)
Non-employee candidate (from a competitor) (𝐶12)
Non-employee candidate (not from a competitor) (𝐶13)
2.1054
0.0150
-2.1204
37.1097
C2:Educational
Background
Diploma with professional certification (𝐶21)
Bachelor’s degree (𝐶22)
Master’s degree (𝐶23)
-0.4864
-0.5353
1.0217
19.3987
C3:Relevant
Experience
1-3yrs. (𝐶31)
4-6yrs. (𝐶32)
More than 6yrs. (𝐶33)
-0.1485
0.0150
0.1335
10.6780
C4:Management
Skills
Finance Skills (𝐶41)
Leadership and people management (𝐶42)
Meeting Management (𝐶43)
1.1745
-0.6351
-0.5394
18.6570
C5: Soft skills
Good oral communication (𝐶51)
Problem solving (𝐶52)
Adaptability (𝐶53)
0.6750
-0.5438
-0.1312
14.1567

79
The most preferred levels in each criteria are those assigned with large part-
worth utilities whereas the least preferred levels obtain small part-worth utilities.
Table 9 shows the part-worths and relative importance of the criteria for the
selection of a new manager considering preferences of the entire shareholders
(n=126). It can deduced that on the average, knowledge of organization (𝐶1) was
adjudged the most important criteria (37.11%), followed by educational
background (19.40%), management skills (18.66%), soft skills (14.15%) and
relevant experience (10.68%). Regarding the part-worth utilities, the results in
Table 9, also indicate that shareholder’s most preferred candidate for the vacant
manager position should be one with the following composite attribute levels; 𝐶11,
𝐶23, 𝐶33, 𝐶41 and 𝐶51. In effect the profile of the new manager should be one with
attributes and levels such as: a current employee candidate (𝐶11) with a Master’s
degree (𝐶23), who has relevant experience of more than 6yrs. (𝐶33), possesses
adequate financial Skills (𝐶41) and has a Good oral communication (𝐶51). In
figure 16, the sizes of the boxes indicate those levels that contribute positively to
shareholder preferences the characteristics of the new manager selection.
The preference modeling with conjoint analysis is effective since shareholders
traded-off several characteristics to arrive at this candidate profile. Typical
MCDM methods would normally not offer the chance for such clear and easily
interpretable trade-offs.
Fig. 16: Shareholder’s characteristic preferences of an ideal new manager
Phase 2: Determining importance weights of board management members
The importance of each board management member (decision maker) in terms
of the weight of their ratings are determined using Eq. 43. In Table 10, the
importance weights of each of the 7 decision makers are presented. The ratings of
decision maker 3 carries more weight than the others.
New Manager
Profile
current employee candidate
Master’s degree
More than 6yrs of
relevant experience
Strong Finance
skills
Good oral communication

80
Table 10. Importance weights of decision makers
Phase 3: Determining the linguistic Variables and Terms
The board management team evaluates the candidates based on five attributes
(criteria) using linguistic terms (Very Low, Low, Medium, High or Very high) to
rate each of the competing candidates. Table 11 below shows the linguistic terms
with their assigned IFNs.
Table 11. Linguistic scales for candidates’ ratings
Phase 4: Constructing and aggregating the fuzzy decision matrix
In this phase, the candidate ratings shown in Table 12 are aggregated using the
IFWA operator as expressed in Eq. (45) under the methodological steps of
intuitionistic fuzzy TOPSIS. The ratings represent the opinions of each of the 7
board members (DMs) regarding the suitability of each candidate for the position
of a new manager.
Table 12. Decision makers’ ratings of competing candidates
D1 D2 D3 D4 D5 D6 D7
Weight 0.16 0.15 0.25 0.10 0.09 0.12 0.13
Linguistic terms IFS fuzzy number Ratings of Alternatives
Very Low (VL) 0.05,0.95 Very Low (VL)
Low (L) 0.2,0.75 Low (L)
Medium(M) 0.55,0.4 Medium(M)
High (H) 0.75,0.2 High (H)
Very High (VH) 0.95,0.05 Very High (VH)
D1
D2
D3
D4
D5
D6
D7
C1
A1
A2
A3
A4
A5
L
M
VH
H
VL
M
M
H
H
M
L
M
VH
H
L
L
M
VH
M
L
M
M
VH
H
M
VL
M
VH
M
VL
M
M
VH
VH
L
C2
A1
A2
A3
A4
A5
M
H
VH
VH
M
M
M
H
H
M
L
H
H
H
M
L
M
VH
H
L
M
H
VH
H
L
H
M
VH
H
M
M
H
VH
H
L
C3
A1
A2
A3
A4
A5
L
L
H
VH
M
VL
H
H
M
M
VL
M
H
VH
H
M
M
M
M
H
M
M
VH
M
H
VL
M
H
M
M
H
M
VH
M
H
C4
A1
A2
A3
A4
A5
M
L
VH
VH
H
M
L
VH
H
M
VL
H
VH
VH
M
L
L
VH
H
M
M
H
VH
M
H
M
L
H
M
M
L
L
VH
M
L
C5
A1
A2
A3
A4
A5
M
M
H
VH
M
M
L
H
H
L
M
H
H
VH
L
M
M
H
H
M
M
H
H
VH
L
VH
H
VH
H
M
M
H
VH
VH
L

81
Phase 5: Constructing weighted aggregated intuitionistic fuzzy matrix
The aggregated decisions are weighted at this phase using the weights obtained
from shareholders through the use of the conjoint analysis in Table 9. The
weighted aggregated fuzzy matrix is realized using Eq. (46) where 𝑊𝑗 represents
the importance shareholders attach to the attributes and 𝑆𝑖𝑗 is the normalized
aggregated judgements from the board of management. The results of the
weighted fuzzy decision matrix are as shown in Table 13 below.
Table 13. Aggregated weighted intuitionistic fuzzy decision matrix (A+,A-)
It can be seen from the weighted aggregated intuitionistic fuzzy decision matrix
in Table 13 that, decision makers seem very satisfied with alternative A3,
followed by A4 since most of their membership functions according to Eq. 29 are
relatively higher than their non-membership and hesitancy degrees.
Phase 6: Determining distance of each alternative from IFPIS and IFNIS
The intuitionistic fuzzy positive-ideal solution (FPIS) and the intuitionistic
fuzzy negative-ideal solution (FNIS), are defined respectively as A+ and A-. At
this stage, the criteria are separated into a so-called benefit and cost criteria.
Respectively, 𝐴− maximizes the cost criteria and minimizes the benefit criteria
whiles 𝐴+ maximizes the benefit criteria and minimizes the cost criteria. The
separation is done using equations 47-51.
A+ = [(1,1,1), (1,1,1), (1,1,1), (1,1,1), (1,1,1), (1,1,1)] (55)
A- = [(0,0,0), (0,0,0), (0,0,0), (0,0,0), (0,0,0), (0,0,0)] (56)
Phase 7: Computing separating measures
The distance measures of 𝑑𝐼𝐹𝑆+ and 𝑑𝐼𝐹𝑆
− are computed from each alternative to
the fuzzy positive and negative ideal solutions using Eqns. (52) and (53)
respectively. Subsequently, this results in Table 14 below. Additionally, the
closeness coefficient that ultimately determines the ranking order of the
alternatives are calculated using Eq. (54). It can be seen that per the numerical
example, alternative 3 (A3) happens to be the best candidate for the vacant
managerial position followed by A4, A2, A5 and A1 in that order.
C1 C2 C3 C4 C5
A1 (0.131, 0.745, 0.124) (0.094, 0.564, 0.342) (0.035,0.673, 0.292) (0.071, 0.653, 0.276) (0.093, 0.409, 0.498)
A2 (0.204, 0.623, 0.173) (0.134, 0.402, 0.464) (0.059, 0.463, 0.479) (0.086, 0.576, 0.338) (0.092, 0.392, 0.515)
A3 (0.879, 0.117, 0.004) (0.72, 0.24, 0.039) (0.386, 0.555, 0.059) (0.627, 0.323, 0.051) (0.531, 0.408, 0.061)
A4 (0.722, 0.242, 0.036) (0.642, 0.301, 0.057) (0.373, 0.574, 0.054) (0.562, 0.383, 0.055) (0.58, 0.368, 0.052)
A5 (0.10, 0.804, 0.096) (0.089, 0.588, 0.323) (0.072, 0.347, 0.58) (0.101, 0.518, 0.381) (0.051, 0.649, 0.301)

82
Table 14. Relative closeness coefficient and ranking
The result of the distance measurement is shown in table 14 together with their
relative closeness coefficient (CCi) and the resulting rank of each alternative
(candidates). Table 14 shows how the 2-tier decision making structure that
incorporates shareholder views into board management decisions settled on
candidate A3 as the best alternative.
Fig. 17: Ranking of alternatives (candidates)
D+ D- CCi Ranking of Alternatives
A1 1.023 0.104 0.24 5
A2 0.441 0.309 0.46 3
A3 0.004 1.303 0.95 1
A4 0.026 1.088 0.87 2
A5 0.886 0.22 0.33 4
A 1 A 2 A 3 A 4 A 5
0.24
0.46
0.950.87
0.33

83
9.2 NUMERICAL EXAMPLE 2
(Leveraging Customer Preferences in Company Distributor Selection Decisions)
9.2.1 Background to the problem
Today, multinational companies are taking advantage of the massive and easily
generated customer preferential data to tailor products and services to the needs
of their clients. Customer preferential data modelling goes beyond the basic
demographic details of who patronizes a product or service. In view of this, the
ability to anticipate customer needs is often viewed as a strong step in building a
strong sustainable customer loyalty profile for a company [149]. Whiles customer
preference modelling has been an active research in marketing and consumer
studies, there is little in terms of models that effectively integrate customer
opinions right into management decisions. In a rapid changing business
environment where opinions and preferences of the customer take centre stage,
the ability to integrate customer decisions into management key decisions is
welcoming.
Decision models based on customer utility maximization especially those
expressed as weighted additive models have dominated research in consumer
studies [150]. One of such decision tools is conjoint analysis. As mentioned in
chapter 8, both conjoint analysis and MCDM methods share some common
characteristics especially in their use of linear or weighted additive models to
extract utilities. However, they have rarely been deployed together. In this
numerical example, a demonstration of how the two methods can be used
together, is explored in another 2-tier decision making model. In this model,
customer preferences are factored into company distributor selection problem.
Similar to the first numerical example, the idea is to convert the preferences and
trade-offs of a large group of decision makers (in this case, customers) into criteria
or attribute weights and subsequently incorporate into key management decisions.
This novel type of decision making mirrors real world situations of
accommodating decisions of a lower decision making body into a higher one. In
the decision problem described below, a company solicits customer opinions in
the form of an evaluation about the company’s distributors who regularly interact
with customers (clients). Manufacturing distributors serve as the link between
manufacturers (of product or service) on one hand and their customers.
To retain distributors who meet the company’s requirements expressed in
several criteria, customer preferences are modelled into criteria weights and
subsequently factored into another level of decision making where management
executives of the company select those to retain and those to relieve off contract.
Using conjoint analysis, the company is able to estimate the relative importance
their customers attach to the criteria for distributor selection and the extent of
trade-offs they are willing to make.

84
The numerical example again deploys the proposed 2-tier conjoint analysis-
intuitionistic fuzzy TOPSIS hybrid decision making model of how such customer-
management relationship in decision making can be effectively utilized. Such
shared decision making scenario builds trust between customers and company
management whiles again revealing customer preferences for the company to
tailor the right solutions to them.
9.2.2 The Decision Problem
Management executives in a manufacturing company periodically evaluate the
performance of their distributors so as to decide between those to retain and those
to relieve off contract. However, since the distributors deal directly with
customers, the company finds it expedient to involve customer opinions,
preferences and trade-offs in the selection, further retention and relieving of their
distributors. It anticipated that customers in making their choices in the evaluation
would make trade-offs. In all, 300 customer preferences and trade-offs are
modelled using conjoint analysis in the study. Conjoint analysis is found ideal
because of its ability to model trade-offs and handle large preferential inputs.
Intuitionistic fuzzy TOPSIS is subsequently used the purchasing and supply
executives in the ranking and selection stage. In the following section, the phases
for the hybrid framework are outlined.
Phase 1: Selecting Attributes and Levels for modelling with Conjoint Analysis
Preliminary literature study and expert opinions settled on 7 criteria (attributes)
as relevant for the study. These are: service quality, on-time delivery, cost,
reputation, and responsiveness to customer needs, State of transportation and
relationship with distributing company.
In Table 15, the relevant attributes (criteria) and their levels are shown. Again,
a fractionated factorial design of 15 profiles (packages) were opted to make it
easier and quick for responses. Table 16, shows these 15 different profiles used in
the customer preferences modelling of company distributors. The fractionated
factorial design experiment was used. The aggregate conjoint analysis model was
employed in generating the part-worths of each attribute. Further, the
MONANOVA (Monotone Analysis of Variance) estimation method was adopted
for estimating the part-worths utilities [151]. In Table 15 are the attributes and
their respective levels, the part-worth utilities for each level and the relative
importance (weights) of each attribute (criteria) attained in the numerical
example.

85
Table 15. Attributes (Criteria) and Levels with their part-worths utilities relative importance
The most visible strength of the conjoint analysis technique especially as used
in this special case of merging different levels of decisions, is its ability to
explicitly show where respondents made trade-offs as well as the attributes
(criteria) they prefer most in terms of their relative importance to the overall
selection problem. In Table 15, the numerical example shows that customers’
preferred characteristics of an ideal distributor should be one with the following
composite attributes shown in figure 18.
Fig. 18: Composite attributes of a preferred distributor
Attribute (criteria)
Levels
Part-
worth
utilities
(Mean)
Relative
importance
(Weight %)
C1: Service Quality
Excellent (𝐶11)
Acceptable (𝐶12)
Poor (𝐶13)
-0.4430
0.2933
0.1498
15.0761
C2: On-time delivery
100% on time (𝐶21)
60% on time (𝐶22)
40% or below on time (𝐶23)
0.5512
-0.1873
-0.3639
14.8845
C3: Cost
High (𝐶31)
Moderate. (𝐶32)
Low. (𝐶33)
0.6711
1.2860
-1.9572
19.3060
C4: Reputation
Highly professional (𝐶41)
Not so professional (𝐶42)
0.0543
-0.0543
5.2598
C5: Responsiveness to customer needs
Highly responsive (𝐶51)
Moderately responsive (𝐶52)
Low level of responsiveness
(𝐶53)
-0.2496
-0.2309
0.4805
15.7016
C6:State of transportation
Good (𝐶61)
Poor (𝐶62)
-0.0686
-1.0561
13.6110
C7: relationship with distributor Excellent (𝐶71)
Good (𝐶72)
Poor (𝐶73)
1.1214
1.1247
-1.1214
16.1609
𝐶12
𝐶21
𝐶32
𝐶41
𝐶53
𝐶61
𝐶73
Service
Quality
One-time
delivery
Cost
Reputation
Responsiveness
to customer
needs
State of
transportation
Relationship
with distributor

86
Table 16. Profiles of preferred distributorship characteristics sought by customers in the
experimental design
In figure 18, the preferred profile of a distributor as judged by customers is one
with an acceptable quality of service (𝐶12), 100% delivery time (𝐶21), moderate
level of cost (𝐶32), who are highly professional (𝐶41), with a low level of
responsiveness (𝐶53), good transportation and a good relationship with the
distributor. It can further be seen that customers in their choices, traded-off
responsiveness to customer needs and reputation of the distributor for a moderate
cost (fees). This means customers would want management in their evaluation
and selection of distributors to place more emphasis on the cost of delivery of
Observation Service
Quality
On-time
Delivery Cost Reputation Customer
Needs
State of
transportation
Relationship
with
distributor
Profile 1 Acceptable 100% on time Low
Highly
professional Low level of
response
Poor Good
Profile 2 Poor 100% on time High Highly
professional
Low level of
response
Poor Poor
Profile 3 Acceptable 40% or below on
time
Low Not so
professional
Moderately
responsive
Poor Excellent
Profile 4 Acceptable 40% or below on
time
Moderate Highly
professional
Low level of
response
Good Excellent
Profile 5 Poor 40% or below on
time
High Not so
professional
Highly
responsive
Poor Good
Profile 6 Excellent 100% on time Low Highly
professional
Highly
responsive
Good Poor
Profile 7 Poor 60% on time Low Not so
professional
Low level of
response
Good Poor
Profile 8 Excellent 60% on time High Not so
professional
Low level of
response
Poor Excellent
Profile 9 Excellent 40% or below on
time
Moderate Not so
professional
Low level of
response
Good Good
Profile 10 Acceptable 60% on time Moderate Not so
professional
Moderately
responsive
Poor Poor
Profile 11 Acceptable 60% on time High Highly
professional
Moderately
responsive
Good Good
Profile 12 Excellent 60% on time Moderate Highly
professional
Highly
responsive
Poor Excellent
Profile 13 Acceptable 100% on time High Not so
professional
Highly
responsive
Good Poor
Profile 14 Poor 100% on time Moderate Not so
professional
Moderately
responsive
Good Excellent
Profile 15 Excellent 40% or below on
time
High Highly
professional
Moderately
responsive
Poor Poor

87
products by distributors more than any other criteria. The weights assigned to the
other criteria can be seen in Table 15 where reputation is the least considered
criteria. In terms of partial utilities for each level of each attributes, moderate cost
is the most preferred by customers. These derived weights are further incorporated
into the evaluation, ranking and selection of the distributors and further used in
deciding which distribution company to retain or relieve.
Phase 2: Determining importance weights of decision makers
This stage assigns weights of importance to each of the decision makers
assuming that not all the decision makers are equal in importance. Using Eq. 43,
the importance weights of each of the 5 decision makers are presented in Table
17. The judgements of decision maker 1 is the most important in terms of the final
composite decision
Table 17. Importance weights of decision makers
Phase 3: Determining the linguistic Variables and Terms
The numerical example uses 5 alternatives, 7 criteria and 5 decision makers.
The third party company distributors are evaluated using linguistic terms (Very
Low, Low, Medium, High or Very high) to rate their performances. Table 18 below
shows the linguistic terms with their assigned IFNs.
Table 18. Linguistic scales used in the ratings
Phase 4: Constructing and aggregating the intuitionistic fuzzy decision matrix
The intuitionistic fuzzy weighted averaging operator (IFWA) expressed in Eq.
(45), is used to aggregate the ratings in Table 19. The ratings represent the
judgements of each of the 5 DMs regarding the performance of each candidate
company distributor in the year under review.
Phase 5: Constructing weighted aggregation of intuitionistic fuzzy matrix
The weights obtained from the customers regarding their preferences of
characteristics they cherish in a distributing company, are multiplied by the
aggregated intuitionistic fuzzy matrix as expressed in Eq. (46). The results of the
weighted intuitionistic fuzzy decision matrix are as shown in Table 20 below.
D1 D2 D3 D4 D5
Weight 0.301 0.243 0.211 0.125 0.12
Linguistic terms IFS fuzzy number Ratings of Alternatives
Very Low (VL) 0.05,0.95 Very Low (VL)
Low (L) 0.2,0.75 Low (L)
Medium(M) 0.55,0.4 Medium(M)
High (H) 0.75,0.2 High (H)
Very High (VH) 0.95,0.05 Very High (VH)

88
Table 19. Decision makers’ ratings of alternatives
Table 20. Aggregated weighted intuitionistic fuzzy decision matrix (A+,A-)
Phase 6: Determining distance of each alternative from IFPIS and IFNIS
The separation measures of distances from the intuitionistic fuzzy positive-
ideal solution (FPIS) and the intuitionistic fuzzy negative-ideal solution (FNIS)
are computed at this stage. Using Eqs. (52) and (53) defined respectively as A+
and A- , IFPIS and IFNIS are presented in Eq. 57 and 58 respectively. The
Criteria Alternatives
D1
D2
Decision-Makers
D3
D4
D5
C1
A1
A2
A3
A4
A5
L
M
VH
VH
H
H
H
H
VH
H
L
M
VH
VH
H
M
M
VH
VH
VH
H
H
VH
H
H
C2
A1
A2
A3
A4
A5
H
H
VH
H
M
H
M
H
H
H
VL
H
H
VH
VH
H
M
H
H
VH
M
H
H
VH
VH
C3
A1
A2
A3
A4
A5
L
L
M
VH
M
VL
L
L
H
M
VL
M
L
VH
H
M
M
L
M
H
M
M
M
H
M
C4
A1
A2
A3
A4
A5
M
M
H
H
VH
M
L
H
H
VH
VL
H
H
VH
VH
L
H
H
H
VH
L
H
L
M
H
C5
A1
A2
A3
A4
A5
H
M
M
M
VL
L
L
M
H
L
L
M
M
H
L
L
M
M
M
M
L
M
M
H
L
C6
A1
A2
A3
A4
A5
H
H
VH
VH
H
M
M
VH
VH
H
H
H
H
VH
H
H
VH
H
VH
H
M
M
H
VH
H
C7
A1
A2
A3
A4
A5
M
H
VH
H
M
H
L
H
H
H
VL
VL
H
VH
VH
M
M
H
H
VH
M
H
H
VH
VH
A1 A2 A3 A4 A5
C1 (0.282,0.657) (0.351, 0.585) (0.51,0.441) (0.518, 0.434) (0.439, 0.499)
C2 (0.357, 0.579) (0.381, 0.553) (0.468, 0.477) (0.47, 0.475) (0.472, 0.478)
C3 (0.188,0.771) (0.289, 0.649) (0.282, 0.657) (0.664, 0.284) (0.475, 0.451)
C4 (0.02, 0.978) (0.03, 0.967) (0.036, 0.962) (0.041, 0.958) (0.047, 0.953)
C5 (0.244, 0.698) (0.267, 0.677) (0.304, 0.638) (0.375, 0.560) (0.119, 0.846)
C6 (0.382, 0.552) (0.413, 0.528) (0.494, 0.455) (0.523, 0.429) (0.414, 0.518)
C7 (0.301, 0.641) (0.293, 0.647) (0.468, 0.477) (0.47, 0.475) (0.472, 0.478)

89
elements of A+ and A- are used because some of the attributes (criteria) for the
selection of the company distributing agents were deemed as benefits and some
as costs. In determining A+ and A−, criteria (C1, C2, C4, C5 and C7) are
considered as benefits whiles the C3 is designated as a cost criterion.
0.518, 0.434, 0.048 , 0.47, 0.475, 0.055 ,
0.188, 0.771, 0.041 , 0.047, 0.953, 0.00 ,
0.375, 0.560, 0.065 , 0.523, 0.429, 0.048 ,
0.468, 0.477, 0.055
A
(57)
0.282,0.657, 0.061 , 0.357, 0.579, 0.065 ,
0.664, 0.284, 0.053 , 0.02, 0.978, 0.002 ,
0.119, 0.846, 0.035 , 0.382, 0.552, 0.066 ,
0.293, 0.647, 0.06
A
(58)
The result of the distance measurement is shown in Table 21 together with their
relative closeness coefficient (CCi) and the resulting rank of each alternative
(distributing company).
Table 21. Relative closeness coefficient and ranking
Fig. 19: Final ranking of distributing company distributor
The results in Table 21 and figure 19 show that alternative A3 is adjudged the
ideal solution. The overall result shows the seamless integration of two decision
points from different decision making bodies.
D+ D- CCi Ranking of Alternatives
A1 0.507 0.709 0.583 2
A2 0.445 0.582 0.567 3
A3 0.188 0.753 0.8 1
A4 0.682 0.612 0.473 4
A5 0.604 0.449 0.426 5
0 0.1 0.2 0.3 0.4 0.5 0.6 0.7 0.8 0.9
A5 A4 A3 A2 A1

90
9.3 NUMERICAL EXAMPLE 3
(Managers’ Preferences and Trade-offs in recruitment Process Outsourcing Vendor Selections)
9.3.1 Background to the problem
As multinational companies evolve, outsourcing decisions have become an
integral part of key management decisions. In outsourcing, an organization
decides to purchase a product or a service that hitherto was provided in-house
[162] through a third party company. This process is used by many organizations
to transfer recurring internal activities and decision rights to third party providers
governed by a contract [163]. One of several key management decisions that
organizations were reluctant to outsource was human resource recruitment.
Today, there are tens of thousands of recruitment process outsourcing vendors
across the globe partnering organizations in selecting and training high quality job
candidates. Recruitment process outsourcing vendors, popularly known simply as
recruitment agencies, play key roles in attracting, recruiting and training high
caliber staff for various job positions. Since recruiting the right human resource
or otherwise can have positive or negative implications for organizations, the
decision to select a recruitment agency as a Human Resource (HR) partner must
be handled with outmost care.
The satisfaction of an organization regarding a recruitment process outsourcing
vendor can ultimately be measured by the caliber of quality job candidates they
recruit. However, other relevant criteria may include the cost to the organization
(fees), the time taken to hire as well as the quality of communication during
recruitment process. In view of this, organizations have to have in place relevant
sets of criteria to identify and select the right recruitment agency to partner in their
staff recruitments. Typically, recruitment process outsourcing vendors provide
their unique skills and competencies, brand name as well as their recruitment
database full of contacts. Since recruitment of a right agency is key, the decision
making model to select has to be thorough involving those who matter. In this
numerical example, the proposed hybrid two-tier decision making model
consisting of conjoint analysis and intuitionistic fuzzy TOPSIS is used to
incorporate HR managers’ preferences and trade-offs into management decisions
about selecting a recruitment process outsourcing vendor from a list of shortlisted
agencies. The numerical example again demonstrates how two levels of decision
making can merged into achieving the same selection goals.
9.3.2 The Decision Problem
The problem involves selecting by ranking, candidate recruitment process
outsourcing vendor to partner a Manufacturing firm in its staff recruitments. The
ultimate decision to select a recruitment agency lies with the company’s directors.
However, to get the best of their decision, the company has decided to involve
HR managers’ preferences and trade-offs regarding the selection of the

91
recruitment agency. A questionnaire designed with the help of a conjoint analysis
fractionated factorial design is presented to 150 HR managers. The profiles allow
the HR managers to make trade-offs in their quest to making their preferences on
the right criteria characteristics mix for an ideal recruitment agency. Again
conjoint analysis is preferred because of its ability to model trade-offs and handle
large preferential inputs. The relative weights of criteria (attributes) derived from
the preference data of the HR managers are incorporated into the final selection
process by company directors. Intuitionistic fuzzy TOPSIS is utilized because of
its ability to determine the satisfaction, dissatisfaction and hesitancy in a decision
maker’s rating and the use of distance separation to distinguish ideal solutions
from worse solutions.
Phase 1: Selecting Attributes and Levels for modelling with Conjoint Analysis
In this numerical example, 5 criteria (attributes) are identified as relevant for
the selection decision of an ideal recruitment agency. These are:
• Previous Experience in industry
• Quality of service by the agency
• Size of their database
• Recruitment service costs
• Duration of contract
In Table 22, the relevant attributes (criteria) and their levels are shown. An
optimized fractionated factorial design of 12 profiles (packages) were used to
elicit responses. Table 23, shows these 12 different profiles used in the HR
managers’ preferences regarding criteria characteristic mix of an ideal recruitment
process outsourcing vendor. The aggregate conjoint analysis model was employed
in generating the part-worths of each attribute. Further, the MONANOVA
(Monotone Analysis of Variance) estimation method was adopted for estimating
the part-worths utilities [151]. Table 22 shows the attributes (criteria), their
respective levels, the part-worth utilities of each level and the relative importance
(weights) of each attribute (criteria) attained in the preference modelling
computation.

92
Table 22. Attributes (Criteria) and Levels with their part-worths utilities relative importance
Table 23. Profiles of preferred distributors’ characteristics sought by customers in the
experimental design
In Table 22, the preferred profile for a recruitment process outsourcing vendor
as adjudged by HR managers through their preferences, is one with the following
composite attributes. The agency must have at least 3-5 years of experience (𝐶12),
Fair level of quality of service (𝐶22), a low size of database (𝐶32), low recruitment
costs (𝐶43), 1 yr. (𝐶53). The HR managers by their responses indicated that,
management/directors in their evaluation and selection of a partner recruitment
agency, must consider the quality of service, followed by the recruitment costs
Attribute (criteria) Levels Part-worth
utilities
(Mean)
Relative
importance
(Weight %)
C1: Experience 5-8 yrs. (𝐶11)
3-5 yrs. (𝐶12)
No experience (𝐶13)
-0.1010
0.2387
-0.1377
19.3008
C2: Quality of service Excellent (𝐶21)
Fair (𝐶22)
Poor (𝐶23)
-2.0658
1.5221
0.5437
34.6071
C3: Size of database
Adequate (𝐶31)
Low (𝐶32)
-0.1528
0.1528
9.0100
C4: Recruitment service
costs (fees)
High (𝐶41)
Acceptable (𝐶42)
Low (𝐶43)
-0.2524
-0.3545
0.6070
22.4235
C5: Duration of Contract 5-8 yrs. (𝐶51)
3-5 yrs. (𝐶52)
1 yr. (𝐶53)
-0.2669
0.0481
0.2188
14.6587
Observation
Experience
Quality of
service
Size of
database
Recruitment
service cost
Duration of
Contract
Profile 1 No experience Poor Adequate Acceptable 3-5 yrs.
Profile 2 3-5 yrs. Excellent Low Acceptable 3-5 yrs.
Profile 3 No experience Fair Adequate Acceptable 5-8 yrs.
Profile 4 5-8 yrs. Poor Low Low 5-8 yrs.
Profile 5 3-5 yrs. Fair Low High 5-8 yrs.
Profile 6 5-8 yrs. Fair Adequate Low 3-5 yrs.
Profile 7 5-8 yrs. Fair Low Acceptable 1 yr.
Profile 8 No experience Fair Low High 3-5 yrs.
Profile 9 3-5 yrs. Poor Adequate High 1 yr.
Profile 10 5-8 yrs. Excellent Adequate High 5-8 yrs.
Profile 11 3-5 yrs. Fair Adequate Low 1 yr.
Profile 12 No experience Excellent Low Low 1 yr.

93
(service fees) and experience in the order of importance as seen in Table 22. The
weights from the HR managers’ preferences are now incorporated into the
evaluation, ranking and selection of relatively best recruitment agency for the
manufacturing company.
Phase 2: Determining importance weights of decision makers
This stage assigns weights of importance to each of the decision makers
assuming that not all the decision makers are equal in importance. Using Eq. 43,
the importance weights of each of the 5 decision makers are presented in Table
24. The judgements of decision maker 3 is the most important in terms of the final
composite decision.
Table 24. Importance weights of decision makers
Phase 3: Determining the linguistic Variables and Terms
The numerical example uses 6 alternatives, 5 criteria and 5 decision makers.
The third party company distributors are evaluated using linguistic terms (Very
Low, Low, Medium, High or Very high) to rate their performances. Table 25 below
shows the linguistic terms with their assigned IFNs.
Table 25. Linguistic scales used in the ratings
Phase 4: Constructing and aggregating the intuitionistic fuzzy decision matrix
The aggregation is carried out using intuitionistic fuzzy weighted averaging
operator (IFWA) expressed in Eq. (45). In Table 27, the ratings aggregated
represent the judgements of each of the 5 DMs regarding the performance of each
candidate recruitment agency.
Phase 5: Constructing weighted aggregation of intuitionistic fuzzy matrix
At this stage, the weights derived from the preferences of HR managers
regarding the characteristics they prefer to see in an ideal recruitment process
outsourcing vendor, are multiplied by the aggregated intuitionistic fuzzy matrix
as expressed in Eq. (46). The results of the weighted intuitionistic fuzzy decision
matrix are as shown in Table 27 below.
D1 D2 D3 D4 D5
Weight 0.25 0.25 0.3 0.12 0.08
Linguistic terms IFS fuzzy number Ratings of Alternatives
Very Low (VL) 0.05,0.95 Very Low (VL)
Low (L) 0.2,0.75 Low (L)
Medium(M) 0.55,0.4 Medium(M)
High (H) 0.75,0.2 High (H)
Very High (VH) 0.95,0.05 Very High (VH)

94
Table 26. Decision makers’ ratings of alternatives
Table 27. Aggregated weighted intuitionistic fuzzy decision matrix (A+,A-)
In Table 27, the weighted aggregated intuitionistic fuzzy decision matrix
depicts decision makers’ aggregated decision to be very satisfied with alternative
A6, since most of its membership functions according to Eq. 29 are relatively
higher than their non-membership and hesitancy degrees. This is further reflected
in the final ranking.
Phase 6: Determining distance of each alternative from IFPIS and IFNIS
The separation measures of distances from the intuitionistic fuzzy positive-
ideal solution (FPIS) and the intuitionistic fuzzy negative-ideal solution (FNIS)
are computed at this stage. Using Eqs. 52 and 53, A+ and A- are presented in Eq.
59 and 60 respectively. The elements of A+ and A- are used because some of the
Criteria Alternatives
D1
D2
Decision-Makers
D3
D4
D5
C1
A1
A2
A3
A4
A5
A6
M
M
H
H
H
VH
H
H
H
H
H
VH
L
M
H
H
H
VH
M
M
H
H
VH
H
H
H
H
H
H
VH
C2
A1
A2
A3
A4
A5
A6
H
H
M
H
M
H
H
M
M
H
H
VH
VL
H
M
VH
VH
VH
H
M
H
H
VH
H
M
H
H
VH
VH
M
C3
A1
A2
A3
A4
A5
A6
M
L
M
M
M
VH
VL
L
L
H
M
VH
VL
M
L
H
H
VH
M
M
L
M
H
VH
M
M
M
H
M
VH
C4
A1
A2
A3
A4
A5
A6
M
M
H
H
H
VH
M
L
H
H
M
VH
VL
H
H
H
M
VH
L
H
H
H
M
VH
L
H
L
M
H
H
C5
A1
A2
A3
A4
A5
A6
H
M
M
M
M
H
L
L
M
H
H
M
L
M
M
H
L
VH
L
M
M
M
M
VH
L
M
M
H
M
VH
A1 A2 A3 A4 A5 A6
C1 (0.373,0.557) (0.42, 0.509) (0.50,0.424) (0.50, 0.424) (0.53, 0.402) (0.627, 0.323)
C2 (0.426, 0.528) (0.687,0.553) (0.563, 0.387) (0.854, 0.138) (0.858, 0.138) (0.837, 0.152)
C3 (0.102,0.868) (0.153, 0.803) (0.108, 0.855) (0.219, 0.725) (0.221, 0.722) (0.302, 0.648)
C4 (0.19, 0.775) (0.565, 0.366 (0.578, 0.353) (0.587, 0.344) (0.501, 0.433) (0.723, 0.238)
C5 (0.183, 0.763) (0.251, 0.692) (0.251, 0.692) (0.174, 0.619) (0.119, 0.777) (0.422, 0.522)

95
attributes (criteria) for the selection of the recruitment process outsourcing vendor
were deemed as benefits and some as costs. In determining A+ and A−, criteria
(C4); recruitment service costs (fees), was categorized as costs whiles the rest of
the criteria are designated as benefits.
0.627, 0.323 , 0.858, 0.138 ,
0.302, 0.648 , 0.19, 0.775 ,
0.422, 0.522 ,
A
(59)
0.373,0.557 , 0.426, 0.528 ,
0.102,0.868 , 0.723, 0.238 ,
0.119, 0.777
A
(60)
The result of the distance measurement is shown in Table 28 together with their
relative closeness coefficient (CCi) and the resulting rank of each alternative
(distributing company). The results in Table 28 and figure 19 show that alternative
A6 is adjudged the ideal solution. The overall result shows the seamless
integration of two decision points from different decision making bodies.
Table 28. Relative closeness coefficient and ranking
Fig. 20: Final ranking of recruitment process outsourcing vendor
D+ D- CCi Ranking of Alternatives
A1 1.009819 0.6299274 0.38 4
A2 0.8418322 0.3972025 0.32 5
A3 0.9567217 0.3220188 0.25 6
A4 0.6210018 0.7100465 0.53 2
A5 0.7330459 0.6658741 0.48 3
A6 0.6293374 1.0216568 0.62 1
0
0.1
0.2
0.3
0.4
0.5
0.6
0.7
1
A1 A2 A3 A4 A5 A6

96
SENSITIVITY ANALYSIS

97
10 SENSITIVITY ANALYSIS IN MCDM
Sensitivity analysis plays an important role in many input-output systems. It is
a technique primarily used to determine how different values of input variables
will impact a particular output variable under a given set of assumptions.
According to [166] sensitivity analysis is useful for a wide range of purposes
including the following:
Decision making: Sensitivity analysis is useful in decision making as it
helps to identify critical values/parameters, to test for decision
robustness and to assess the overall riskiness of decisions made.
Communication: In communication, sensitivity analysis is used to
enhance confidence and credibility which increases confidence. It also
brings to the fore critical assumptions in a communication system.
Model development: Measurement of accuracy in model development is
always a requirement in scientific disciplines. Sensitivity analysis
therefore helps to understand models by identifying loopholes in the
system. This helps to acquire more information when relevant to improve
the model.
In multi-criteria decision making, sensitivity analysis helps to test for the
reliability of decisions made by decision makers by investigating the congruent
effect on the final decision (ranking order) if certain key input parameters are
altered. In other words, the process is invoked to determine how sensitive the
overall decision is to certain alterations owing to uncertainties in the model [164].
According to [167], the presence of uncertainties in decision problems of multi-
criteria nature, call for great care to be exercised when interpreting results
especially in real-life applications. Literature on MCDM basically provides three
kinds of approaches necessary for handling issues of variation in input parameters
in a decision framework. These according to [168], [169] as cited in [167], are
using a weaker information on the criteria; employing weight specification
methods and or using sensitivity analyses to determine the effects on results when
changes are made to the weights.
In MCDM approaches, weights are normally assigned to two things; the criteria
or the decision makers. Since both are key input parameters, a change in their
values can potentially change a final decision. In view of this, a sensitivity
analysis model that adequately captures all scenarios of possible changes to the
weights, be it criteria or decision makers, and presents possible effects on the final
decision making is desirable.
This dissertation presents 3 different schemas of modelling sensitivity analysis
in MCDM which are subsequently tested on the results of the 3 numerical
examples used in the previous sections. Sensitivity analysis was deemed
particularly necessary given the fact of incorporating two different decision points
into one composite decision. Secondly, given the anticipated large number of
preference data converted into criteria weights in the proposed conjoint analysis

98
– intuitionistic fuzzy TOPSIS framework, a use of sensitivity analysis helped to
ascertain how changes to the weights assigned by the large decision making body
ultimately affects the decision by the small decision body. The following 3 novel
schemas are anticipated as possible cases that can alter the final decisions obtained
in the numerical examples. The following are the 3 schemas used.
10.1 Schema 1: Swapping Criteria Weight
In this schema, the usual notion of anticipating criteria changes and its effect
on final decision is modelled. To do this, several scenario-case based tests were
conducted of possible changes to the criteria weights. These were tested on each
of the 3 numerical examples. In the first scenario, the weight of the most important
criteria is alternated or swapped case by case with the weights of the remaining
criteria. Additionally, in each instance of swapping the weight of the most
important criterion with another, the weights of all the other criteria are held
constant. For example the expression, 𝑊𝐶𝐶52, 𝑊𝐶1, 𝑊𝐶3-𝑊𝐶4 means the
alternation of the weights of criteria 5 and 2 whiles the weights of criteria 1, 3 and
4 are held constant. Similarly in scenario 2, the weights of the next most important
criteria is swapped with the remaining criteria. Therefore the expression 𝑊𝐶𝐶24,
𝑊𝐶1, 𝑊𝐶3, 𝑊𝐶5 implies interchanging of weights between criteria 2 and 4 whiles
maintaining the weights of criteria 1, 3 and 5 constant. The weights swapping is
conducted for the rest of the criteria in similar fashion.
Schema 1 - Numerical Example 1
In the first numerical example, the modelling of shareholder preferences
resulted in the following order of importance for the attributes (criteria): 𝐶1 >𝐶2 > 𝐶4 > 𝐶5 > 𝐶3. In the first 4 cases of scenario 1 as shown in Table 29, the
weight of shareholders’ most important criterion (𝐶1: Knowledge of
Organization) is alternated or swapped case by case with the weights of the
remaining criteria. It must be noted that in each instance of swapping the weight
of the most important criterion with another, all other criteria weights are held
constant as shown in Table 29. For example in scenario 1 case 1, 𝑊𝐶𝐶12, 𝑊𝐶3-
𝑊𝐶5 means the swapping of the weights of criteria 1 and 2 whiles the weights of
criteria 3, 4 and 5 were held constant. Similarly for example, in scenario 2 case 7,
the expression 𝑊𝐶𝐶25, 𝑊𝐶1, 𝑊𝐶3-𝑊𝐶4 implies interchanging of weights
between criteria 2 and 5 whiles maintaining the weights of criteria 1, 3 and 4
constant. This interpretation of the scenario-case analysis is replicated all
throughout Table 29.
In Table 30, the results of the sensitivity analysis based on the 10-cases in the
4-scenarios are shown along with the original ranking of the alternatives. The
results show that the ranking remains unchanged in almost all the scenarios except
in scenario 1 case 2 where alternative A1 outranks alternative A5 at fourth
position as compared to the original ranking. However, since the ultimate aim of

99
the decision making framework was to select the best alternative (candidate) to
fill the position of a new manager, changes occurring outside the best alternative
are not of utmost importance.
Table 29. Inputs for sensitivity analysis (Schema 1, Numerical example 1)
Table 30. Results of sensitivity analysis (Schema 1, Numerical example 1)
The sensitivity analysis therefore confirms that no matter the changes made to
the weights of the criteria or the attributes, alternative A3 remains the best
candidate in the selection of a new manager. It must be noted that these sensitivity
analysis results may change depending on the decision problem. The novelty in
the modelling is the focus in this dissertation.
Schema 1 - Numerical Example 2
The sensitivity analysis approach of swapping criteria weights is adopted also
for numerical example 2. Here the resulting ranking order for the criteria as well
as the alternatives are respectively; 𝐶3 > 𝐶7 > 𝐶5 > 𝐶1 > 𝐶2 > 𝐶6 > 𝐶4 and
𝐴3 > 𝐴1 > 𝐴2 > 𝐴2 > 𝐴5. The focus is to alter the weights for the criteria set to
see if there are congruent effect on the alternatives ranking. In the first 6 cases of
scenario 1, the weight of customers’ most preferred criterion (𝐶3: Cost) is
Case (Changes made in Wjt), J= C1, C2, …, Cn, t=1,2,...,n
Scenario 1 Case 1 𝑊𝐶𝐶12, Wc3-Wc5
Case 2 𝑊𝐶𝐶13, Wc2, Wc4-Wc5
Case 3 𝑊𝐶𝐶14, Wc2-Wc3, Wc5
Case 4 𝑊𝐶𝐶15, Wc2-Wc4,
Scenario 2 Case 5 𝑊𝐶𝐶23, Wc1, Wc4-Wc5
Case 6 𝑊𝐶𝐶24, Wc1, Wc3, Wc5
Case 7 𝑊𝐶𝐶25, Wc1,Wc3-Wc4
Scenario 3 Case 8 𝑊𝐶𝐶34, Wc1-Wc2, Wc5
Case 9 𝑊𝐶𝐶35, Wc2, Wc4-Wc5
Scenario 4 Case 10 𝑊𝐶𝐶45, Wc1-Wc3
Scenario 1 Scenario 2 Scenario 3 Scenario 4
Original
Ranking
C1 C2 C3 C4 C5 C6 C7 C8 C9 C10
A1 5 5 4 5 5 5 5 5 5 5 5
A2 3 3 3 3 3 3 3 3 3 3 3
A3 1 1 1 1 1 1 1 1 1 1 1
A4 2 2 2 2 2 2 2 2 2 2 2
A5 4 4 5 4 4 4 4 4 4 4 4

100
swapped case by case with the weights of the remaining criteria. Further, at each
instance of swapping the weight of the most important criterion with another, all
other criteria weights are held constant as shown in Table 31. Next the second
most important criterion (𝐶7: relationship with distributor) is also swapped case
by case with the other criteria whiles holding the rest constant. The scenario-case
based sensitivity analysis is replicated all throughout in Table 31. In Table 32 and
Figure 20, the results of the sensitivity analysis based on the 10-cases in the 4-
scenarios are shown along with the original ranking of the alternatives. The results
show that, the best 3 alternatives (A3, A1 and A4) maintain their positions in the
original ranking all throughout the 10 cases. However, there are changes to the
original ranking when criteria; A4 and A5 are considered.
Table 31. Inputs for sensitivity analysis (Schema 1, Numerical example 2)
Table 32. Results of sensitivity analysis (Schema 1, Numerical example 2)
It can be seen that alternative A5 outranks alternative A4 in cases C3, C5, C6
and C10 when their positions are compared to the original ranking in column 2 of
Table 32. However, since the aim of the decision making framework was to select
Case (Changes made in Wjt), J= C1, C2, …, Cn, t=1,2,...,n
Scenario 1 Case 1 𝑊𝐶𝐶31, Wc2, Wc4-Wc7
Case 2 𝑊𝐶𝐶32, Wc1, Wc4-Wc7
Case 3 𝑊𝐶𝐶34, Wc1-Wc2, Wc5-Wc7,
Case 4 𝑊𝐶𝐶35, Wc1-Wc2, Wc4, Wc6-Wc7
Case 5 𝑊𝐶𝐶36, Wc1-Wc2, Wc4-Wc5, Wc7
Case 6 𝑊𝐶𝐶37, Wc1-Wc2, Wc4, Wc5-Wc6
Scenario 2 Case 7 𝑊𝐶𝐶71, Wc2-Wc6
Case 8 𝑊𝐶𝐶75, Wc1- Wc4, Wc6
Scenario 3 Case 9 𝑊𝐶𝐶72, Wc1, Wc3-Wc6
Scenario 4 Case 10 𝑊𝐶𝐶51, Wc2-Wc4, Wc6-Wc7
Scenario 1 Scenario 2 Scenario 3 Scenario 4
Original
Ranking C1 C2 C3 C4 C5 C6 C7 C8 C9 C10
A1 2 2 2 2 2 2 2 2 2 2 2
A2 3 3 3 3 3 3 3 3 3 3 3
A3 1 1 1 1 1 1 1 1 1 1 1
A4 4 4 4 5 4 5 5 4 4 4 5
A5 5 5 5 4 5 4 4 5 5 5 4

101
the best alternative (distributing company), changes occurring outside the best
alternative are not of utmost importance. The sensitivity analysis affirms A3 as
the best distributing company in the year under review.
Fig. 21: Plot of sensitivity analysis (schema 1, Numerical example 2)
Schema 1 - Numerical Example 3
The order of importance of criteria set in numerical example 3 as shown in
Table 22, are 𝐶2 > 𝐶4 > 𝐶1 > 𝐶5 > 𝐶3. Following the weights swapping
approach as demonstrated in numerical examples 1 and 2, the results of the
scenario-case based sensitivity analysis is as shown in Table 34 guided by the
inputs in Table 33.
Table 33. Inputs for sensitivity analysis (Schema 1, Numerical example 3)
Case (Changes made in Wjt), J= C1, C2, …, Cn, t=1,2,...,n
Scenario 1 Case 1 𝑊𝐶𝐶21, Wc3-Wc5
Case 2 𝑊𝐶𝐶23, Wc1, Wc4-Wc5
Case 3 𝑊𝐶𝐶24, Wc1, Wc3,Wc5
Case 4 𝑊𝐶𝐶25, Wc1, Wc3-Wc4
Scenario 2 Case 5 𝑊𝐶𝐶41, Wc2-Wc3, Wc5
Case 6 𝑊𝐶𝐶45, Wc1- Wc3
Case 7 𝑊𝐶𝐶43, Wc1- Wc2, Wc5
Scenario 3 Case 8 𝑊𝐶𝐶15, Wc2-Wc4
Case 9 𝑊𝐶𝐶13, Wc2, Wc4-Wc5
Scenario 4 Case 10 𝑊𝐶𝐶35, Wc1-Wc2, Wc4
01
23
45
Original Ranking
Case 1
Case 2
Case 3
Case 4
Case 5Case 6
Case 7
Case 8
Case 9
Case 10
A1 A2 A3 A4 A5

102
The results show that, the best alternatives A6 is outranked by A4 in scenario
1 case 4 as shown in Table 34 and Figure 21. This means the best alternative A6,
is susceptible to be been outranked when changes are made. Alternative A2 and
A3 also alternate in terms of their positions in the original ranking.
Table 34. Results of sensitivity analysis (Schema 1, Numerical example 3)
Fig. 22: Plot of sensitivity analysis (Schema 1, Numerical example 3)
10.2 Schema 2: Swapping Decision Makers’ Weights
The notion of assigning weights to decision makers is not as popular as
assigning weights to criteria. When used however, it is premised on the fact that
not all decision makers are of equal importance. Thus the judgements of some
DMs are relatively highly regarded than others. In this schema, the effects of
changing DMs weights on the final decision ranking order are investigated. To do
this, the scenario-case based tests were conducted where DMs weights are
tweaked in 4 scenarios in 10 different cases. The investigation again uses the 3
numerical examples to ascertain the effects of decision makers’ weight changes
Scenario 1 Scenario 2 Scenario 3 Scenario 4
Original
Ranking C1 C2 C3 C4 C5 C6 C7 C8 C9 C10
A1 4 4 4 4 4 4 4 4 4 5 4
A2 5 5 5 5 5 5 5 6 5 4 5
A3 6 6 6 6 6 6 6 5 6 6 6
A4 2 2 2 2 1 2 2 2 2 2 2
A5 3 3 3 3 3 3 3 3 3 3 3
A6 1 1 1 1 2 1 1 1 1 1 1
0
1
2
3
4
5
6Original Ranking
Case 1
Case 2
Case 3
Case 4
Case 5Case 6
Case 7
Case 8
Case 9
Case 10
A1 A2 A3 A4 A5 A6

103
on the final ranking. In all the 3 numerical examples, weights were assigned to
both DMs and criteria alike. However in this schema, just as in schema 1, when
DMs weights are been tweaked, the weights of the criteria are held constant.
Similar to schema 1, the first scenario under this schema alternates the weight of
the most important DM in a case by case scenario with the weights of the
remaining DMs. Whiles swapping the weights in each instance, the weights of all
other remaining DMs are held constant. Accordingly, the expression 𝑊𝐷𝐷12, 𝑊𝐷3-
𝑊𝐷5 means the swapping of the weights of DMs 1 and 2 whiles the weights of
DMs 3, 4 and 5 are held constant. This is repeated for the next most important
DM with the remaining criteria in a 4 scenario 10 cases investigation. This
sensitivity analysis model is applied on all the 3 numerical examples.
Schema 2 - Numerical Example 1
In numerical example 1, the order of importance of the decision makers are the
following: 𝐷3 > 𝐷1 > 𝐷2 > 𝐷7 > 𝐷6 > 𝐷4 > 𝐷5. Table 35 presents the inputs
for the sensitivity analysis with scenario 1 having 4 cases, scenario 2 with 3 cases,
scenario 3 with 2 cases and scenario 4 having only one case. In the first 4 cases in
scenario 1, the weight of the most important decision maker (𝐷3) is alternated case
by case with the weights of the remaining decision makers (DMs). In each
instance of alternating the weight of the most important DM with another, the
weights of all other DMs are held constant as shown in Table 35. For instance in
scenario 1 case 1, 𝑊𝐷𝐷31, 𝑊𝐷2, 𝑊𝐷4-𝑊𝐷7 means the interchange of weights of
DMs 3 and 1 whiles that of DMs 2, 4, 5, 6 and 5 were held constant. In scenario
2 case 8, the expression 𝑊𝐷𝐷17, 𝑊𝐷2-𝑊𝐷6 implies interchanging of weights
between DMs 1 and 7 whiles maintaining the weights of DMs 2, 3, 4, 5 and 6
constant. This approach is replicated all throughout Table 35.
Table 35. Inputs for sensitivity analysis (Schema 2, Numerical example 1)
Case (Changes made in Wjt), J=𝐃𝐌𝟏, 𝐃𝐌𝟐, …, 𝐃𝐌𝒏, t=1,2,...,n
Scenario 1 Case 1 𝑊𝐷𝐷31, 𝑊𝐷2, 𝑊𝐷4-𝑊𝐷7
Case 2 𝑊𝐷𝐷32, 𝑊𝐷1,𝑊𝐷4-𝑊𝐷7
Case 3 𝑊𝐷𝐷34, ,𝑊𝐷1-𝑊𝐷2,𝑊𝐷5-𝑊𝐷7
Case 4 𝑊𝐷𝐷35, 𝑊𝐷1-𝑊𝐷2,𝑊𝐷4,𝑊𝐷6-𝑊𝐷7
Case 5 𝑊𝐷𝐷36, 𝑊𝐷1-𝑊𝐷2,𝑊𝐷4 −𝑊𝐷5,𝑊𝐷7
Case 6 𝑊𝐷𝐷37, 𝑊𝐷1-𝑊𝐷2, 𝑊𝐷4-𝑊𝐷6
Scenario 2 Case 7 𝑊𝐷𝐷12, 𝑊𝐷3-𝑊𝐷7
Case 8 𝑊𝐷𝐷17, 𝑊𝐷2-𝑊𝐷6
Scenario 3 Case 9 𝑊𝐷𝐷76, 𝑊𝐷1-𝑊𝐷5
Scenario 4 Case 10 𝑊𝐷𝐷45, 𝑊𝐷1-𝑊𝐷3,𝑊𝐷6-𝑊𝐷7

104
In Table 36, the results of the sensitivity analysis based on the 10-cases in the
4-scenarios are shown along with the original ranking of the alternatives. The
results indicate that the original ranking obtained remains unchanged in most part
of the scenarios except in scenario 1 case 4 and 6 where alternative A1 outranks
alternative A5 at fourth position as compared to the original ranking. It must be
added that the results would always depend on the particular decision problem at
hand. Table 36. Results of sensitivity analysis (Schema 2, Numerical example 1)
Fig. 23: Plot of sensitivity analysis (Schema 2, Numerical example 1)
The sensitivity analysis confirms that no matter the changes made to the
weights of the decision makers, alternative A3 would remain the best candidate
in the selection of a new manager.
Schema 2 - Numerical Example 2
The idea of swapping decision makers’ weights as described in schema 2 is
again investigated on numerical example 2. In numerical example 2, the order of
importance of the decision makers were the following: 𝐷1 > 𝐷2 > 𝐷3 > 𝐷4 >𝐷5. Table 37 presents the inputs of the sensitivity analysis with scenario 1 having
4 cases, scenario 2 with 3 cases, scenario 3 with 2 cases and scenario 4 having
only one case. In the first 4 cases in scenario 1, the weight of the most important
Scenario 1 Scenario 2 Scenario 3 Scenario 4
Original
Ranking C1 C2 C3 C4 C5 C6 C7 C8 C9 C10
A1 5 5 5 5 4 5 4 5 5 5 5
A2 3 3 3 3 3 3 3 3 3 3 3
A3 1 1 1 1 1 1 1 1 1 1 1
A4 2 2 2 2 2 2 2 2 2 2 2
A5 4 4 4 4 5 4 5 4 4 4 4
0
1
2
3
4
5
6
R A N K I N G
O R I G I N A L C 1 C 2 C 3 C 4 C 5 C 6 C 7 C 8 C 9 C 1 0
A1 A2 A3 A4 A5

105
decision maker (𝐷1) is alternated case by case with the weights of the remaining
decision makers (DMs). In each instance of alternating the weight of the most
important DM with another, the weights of all other DMs are held constant as
shown and replicated through Table 37.
Table 37. Inputs for sensitivity analysis (Schema 2, Numerical example 2)
The results of the sensitivity analysis based on schema 2 as applied on
numerical example 2, is shown in Table 38 and figure 24. It can be seen that the
ranking largely remains unchanged especially among the first 2 ideal alternatives.
The changes that occur in the original ranking comes in cases 4, 5, 7 and 9
respectively.
Table 38. Results of sensitivity analysis (Schema 2, Numerical example 2)
The results after the sensitivity analysis still places A3 as the best alternative or
the best distributing company in light of the proposed 2-tier hybrid decision
model.
Case (Changes made in Wjt), J=𝐃𝐌𝟏, 𝐃𝐌𝟐, …, 𝐃𝐌𝒏, t=1,2,...,n
Scenario 1 Case 1 𝑊𝐷𝐷12, 𝑊𝐷3-𝑊𝐷5
Case 2 𝑊𝐷𝐷13, 𝑊𝐷2,𝑊𝐷4-𝑊𝐷5
Case 3 𝑊𝐷𝐷14, 𝑊𝐷2-𝑊𝐷3, 𝑊𝐷5
Case 4 𝑊𝐷𝐷15, 𝑊𝐷2-𝑊𝐷4
Scenario 2 Case 5 𝑊𝐷𝐷23, 𝑊𝐷1,𝑊𝐷4-𝑊𝐷5
Case 6 𝑊𝐷𝐷24, 𝑊𝐷1,𝑊𝐷3,𝑊𝐷5
Case 7 𝑊𝐷𝐷25, 𝑊𝐷1, 𝑊𝐷3,𝑊𝐷4
Scenario 3 Case 8 𝑊𝐷𝐷34, 𝑊𝐷1-𝑊𝐷2, 𝑊𝐷5
Case 9 𝑊𝐷𝐷35, 𝑊𝐷1-𝑊𝐷2, 𝑊𝐷4
Scenario 4 Case 10 𝑊𝐷𝐷45, 𝑊𝐷1-𝑊𝐷3
Scenario 1 Scenario 2 Scenario 3 Scenario 4
Original
Ranking C1 C2 C3 C4 C5 C6 C7 C8 C9 C10
A1 2 2 2 2 2 2 2 2 3 2 2
A2 3 3 3 3 3 3 3 3 2 3 3
A3 1 1 1 1 1 1 1 1 1 1 1
A4 4 4 4 4 4 5 4 5 4 4 4
A5 5 5 5 5 5 4 5 4 5 5 5

106
Fig. 24: Plot of sensitivity analysis (Schema 2, Numerical example 2)
Schema 2 - Numerical Example 3
In schema 2 numerical example 3, the inputs in Table 39 are compared to the
original ranking results as achieved in Table 28. The order of importance of the
decision makers were the following: 𝐷3 > 𝐷2 = 𝐷1 > 𝐷4 > 𝐷5. In the first 4
cases in scenario 1, the weight of the most important decision maker (𝐷3) is
alternated case by case with the weights of the remaining decision makers (DMs).
This approach is repeated all throughout Table 39.
Table 39. Inputs for sensitivity analysis (Schema 2, Numerical example 3)
The results in Table 40 and figure 25 show some changes to the original ranking
as a result of the changes to decision makers’ weights. These changes however
are seen among alternatives 4, 5 and 6. This means that if the goal of the decision
Case (Changes made in Wjt), J=𝐃𝐌𝟏, 𝐃𝐌𝟐, …, 𝐃𝐌𝒏, t=1,2,...,n
Scenario 1 Case 1 𝑊𝐷𝐷31, 𝑊𝐷2, 𝑊𝐷4-𝑊𝐷5
Case 2 𝑊𝐷𝐷32, 𝑊𝐷1,𝑊𝐷4-𝑊𝐷5
Case 3 𝑊𝐷𝐷34, 𝑊𝐷1-𝑊𝐷2, 𝑊𝐷5
Case 4 𝑊𝐷𝐷35, 𝑊𝐷1-𝑊𝐷2, 𝑊𝐷4
Scenario 2 Case 5 𝑊𝐷𝐷21, 𝑊𝐷3-𝑊𝐷5
Case 6 𝑊𝐷𝐷24, 𝑊𝐷1,𝑊𝐷3,𝑊𝐷5
Case 7 𝑊𝐷𝐷25, 𝑊𝐷1, 𝑊𝐷3,𝑊𝐷4
Scenario 3 Case 8 𝑊𝐷𝐷41, 𝑊𝐷2-𝑊𝐷3, 𝑊𝐷5
Case 9 𝑊𝐷𝐷45, 𝑊𝐷1-𝑊𝐷3
Scenario 4 Case 10 𝑊𝐷𝐷51, 𝑊𝐷2-𝑊𝐷4
0
1
2
3
4
5
6
7
R A N K I N G
O R I G I N A L C 1 C 2 C 3 C 4 C 5 C 6 C 7 C 8 C 9 C 1 0
A1 A2 A3 A4 A5
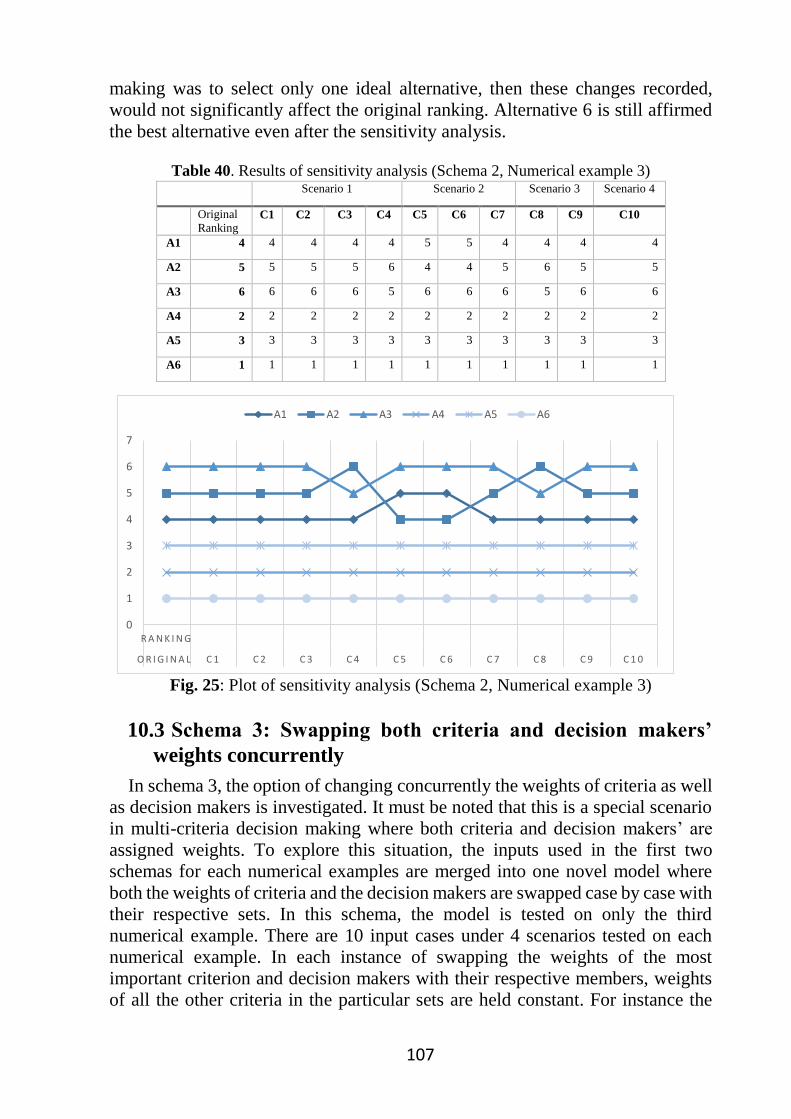
107
making was to select only one ideal alternative, then these changes recorded,
would not significantly affect the original ranking. Alternative 6 is still affirmed
the best alternative even after the sensitivity analysis.
Table 40. Results of sensitivity analysis (Schema 2, Numerical example 3)
Fig. 25: Plot of sensitivity analysis (Schema 2, Numerical example 3)
10.3 Schema 3: Swapping both criteria and decision makers’
weights concurrently
In schema 3, the option of changing concurrently the weights of criteria as well
as decision makers is investigated. It must be noted that this is a special scenario
in multi-criteria decision making where both criteria and decision makers’ are
assigned weights. To explore this situation, the inputs used in the first two
schemas for each numerical examples are merged into one novel model where
both the weights of criteria and the decision makers are swapped case by case with
their respective sets. In this schema, the model is tested on only the third
numerical example. There are 10 input cases under 4 scenarios tested on each
numerical example. In each instance of swapping the weights of the most
important criterion and decision makers with their respective members, weights
of all the other criteria in the particular sets are held constant. For instance the
Scenario 1 Scenario 2 Scenario 3 Scenario 4
Original
Ranking C1 C2 C3 C4 C5 C6 C7 C8 C9 C10
A1 4 4 4 4 4 5 5 4 4 4 4
A2 5 5 5 5 6 4 4 5 6 5 5
A3 6 6 6 6 5 6 6 6 5 6 6
A4 2 2 2 2 2 2 2 2 2 2 2
A5 3 3 3 3 3 3 3 3 3 3 3
A6 1 1 1 1 1 1 1 1 1 1 1
0
1
2
3
4
5
6
7
R A N K I N G
O R I G I N A L C 1 C 2 C 3 C 4 C 5 C 6 C 7 C 8 C 9 C 1 0
A1 A2 A3 A4 A5 A6

108
expression, 𝑊𝐷𝐷31,𝑊𝐷2,𝑊𝐷4-𝑊𝐷5 ∧ 𝑊𝐶𝐶21,Wc3-Wc5 would mean the
alternation of the weights of decision makers 3 and 1; criteria 2 and 1 whiles the
weights of the rest of the elements in each set of decision makers and criteria are
held constant. The weights swapping is conducted for all the rest of the criteria
and decision makers in similar manner.
Schema 3 - Numerical Example 3
In numerical example 3, the decision problem was to select the best recruitment
agency as an HR partner to a manufacturing company using the proposed conjoint
analysis-intuitionistic fuzzy TOPSIS method. The decision making process
realized the following order of importance 𝐶2 > 𝐶4 > 𝐶1 > 𝐶5 > 𝐶3 , 𝐷3 > 𝐷2 =𝐷1 > 𝐷4 > 𝐷5 respectively for the criteria and the decision makers. In Table 41,
the inputs of the sensitivity analysis for schema 1 as tested on numerical example
3 are presented. In the first 4 cases in scenario 1, the weight of the most important
criteria (𝐶2) and decision maker (𝐷3) are concurrently alternated case by case with
the weights of their respective elements in the set. Furthermore, the rest of the
elements in the set of either criteria or decision makers are held constant whiles
the swapping is been carried out.
Table 41. Inputs for sensitivity analysis (Schema 3, Numerical example 3)
In Table 42, the results of the sensitivity analysis based on the 10-cases in the 4-
scenarios are shown along with the original ranking of the alternatives. The results
indicate that the original ranking obtained remains unchanged in most part of the
scenarios except in scenario 1 case 4 and 6 where alternative A1 outranks
alternative A5 at fourth position as compared to the original ranking. It must be
added that the results would always depend on the particular decision problem at
hand.
Case (Changes made in Wjt), i=𝐃𝐌𝟏, 𝐃𝐌𝟐, …, 𝐃𝐌𝒏, J= C1, C2, …, Cn, t=1,2,...,n
Scenario 1 Case 1 𝑊𝐶𝐶21, Wc3-Wc5 ∧ 𝑊𝐷𝐷31, 𝑊𝐷2, 𝑊𝐷4-𝑊𝐷5
Case 2 𝑊𝐶𝐶23, Wc1, Wc4-Wc5 ∧ 𝑊𝐷𝐷32, 𝑊𝐷1,𝑊𝐷4-𝑊𝐷5
Case 3 𝑊𝐶𝐶24, Wc1, Wc3,Wc5 ∧ 𝑊𝐷𝐷34, 𝑊𝐷1-𝑊𝐷2, 𝑊𝐷5
Case 4 𝑊𝐶𝐶25, Wc1, Wc3-Wc4 ∧ 𝑊𝐷𝐷35, 𝑊𝐷1-𝑊𝐷2, 𝑊𝐷4 Scenario 2 Case 5 𝑊𝐷𝐷21, 𝑊𝐷3-𝑊𝐷5 ∧ 𝑊𝐶𝐶41, Wc2-Wc3, Wc5
Case 6 𝑊𝐶𝐶45, Wc1- Wc3 ∧ 𝑊𝐷𝐷24, 𝑊𝐷1,𝑊𝐷3,𝑊𝐷5
Case 7 𝑊𝐶𝐶43, Wc1- Wc2, Wc5 ∧ 𝑊𝐷𝐷25, 𝑊𝐷1, 𝑊𝐷3,𝑊𝐷4
Scenario 3 Case 8 𝑊𝐶𝐶15, Wc2-Wc4 ∧ 𝑊𝐷𝐷41, 𝑊𝐷2-𝑊𝐷3, 𝑊𝐷5
Case 9 𝑊𝐶𝐶13, Wc2, Wc4-Wc5 ∧ 𝑊𝐷𝐷45, 𝑊𝐷1-𝑊𝐷3 Scenario 4 Case 10 𝑊𝐶𝐶35, Wc1-Wc2, Wc4 ∧ 𝑊𝐷𝐷51, 𝑊𝐷2-𝑊𝐷4

109
Table 42. Results of sensitivity analysis (Schema 3, Numerical example 3)
Fig. 26: Plot of sensitivity analysis (Schema 3, Numerical example 3)
Scenario 1 Scenario 2 Scenario 3 Scenario 4
Original
Ranking
C1 C2 C3 C4 C5 C6 C7 C8 C9 C10
A1 4 4 4 4 4 4 5 4 4 4 5
A2 5 5 5 5 5 5 4 4 5 5 4
A3 6 6 6 6 6 6 6 5 6 6 6
A4 2 2 3 2 3 2 2 3 2 3 2
A5 3 3 2 3 2 3 3 2 3 2 3
A6 1 1 1 1 1 1 1 1 1 1 1
0
1
2
3
4
5
6
7
R A N K I N G
O R I G I N A L C 1 C 2 C 3 C 4 C 5 C 6 C 7 C 8 C 9 C 1 0
A1 A2 A3 A4 A5 A6

110
11 CONCLUSION AND DISCUSSION
Research in Multi-criteria decision making (MCDM) has come of age with
growing number of methods and approaches used for optimal decision making.
The use of fuzzy sets which extend the scope of solutions in MCDM, especially
for uncertainty modelling, helps to bridge the array of tools between computer
science and operations research. Such multidisciplinary approach to MCDM has
helped to usher in wide array of tools with some outside the scope of MCDM.
Some of the multidisciplinary approaches in MCDM combine several methods at
various stages in the multi-criteria decision steps. This integration of methods are
popularly known as ‘hybrid’ methods. In recent times the use of such hybrid
methods has increased significantly. However, the choice and appropriateness of
hybrid methods over single method solutions especially in MCDM applications,
are most often not fully explained.
This dissertation was organized into two parts. The first investigated the trend
of use of fuzzy hybrid MCDM methods as well as the appropriateness of such
methods over single MCDM method solutions. The use of hybrid and single or
one-method solutions were compared. The results showed that whiles literature is
abound lately with many hybrid MCDM solutions, more often, a single method
also achieves the same or similar results especially regarding the final ranking of
alternatives. However the results also demonstrated that the ranking order of
alternatives in a single MCDM method solutions compared with a hybrid method,
tends to be different when the two methods in the ‘hybrid’ come from different
categories or types of MCDM methods. For instance when the hybrid is composed
of one method from a full aggregation background (American School) and the
other from an outranking method (French School), the results (ranking order)
changes when one of the methods in the hybrid is used. Such irresolution or
inconclusiveness in the results demonstrated that hybrid methods in MCDM must
be treated with care and used in special decision problems. Based on results of the
investigative part of the research, a second part proposed a hybrid MCDM method
and demonstrated its use in special decision problems.
The proposed hybrid MCDM framework introduced in the second part of the
dissertation mirrors ideal scenarios of real-world decision problems. With 3
numerical examples, the proposed 2-tier hybrid decision framework demonstrates
how two decision points; one based on preferences from a large decision making
group and the other from a relatively small group can be merged to achieve an
optimal decision making. Conjoint analysis and intuitionistic fuzzy TOPSIS
methods are the tools in the proposed hybrid method. The proposed method uses
these two existing methods; one from marketing research and the other, a fuzzy
extension of TOPSIS to demonstrate the applicability of such hybrid method. The
conjoint analysis was used to model preference data of a relatively lager decision
making group where trade-offs are necessary to be made in decisions. The
preference data are converted into criteria weights and subsequently merged with

111
decisions from a relatively small group (experts). The intuitionistic fuzzy TOPSIS
method aided in the ranking and selection of alternatives. The intuitionistic fuzzy
TOPSIS method is specially selected because of its ability to readily reveal or
impugn meaning into decision makers’ ratings. The inherent meaning behind a
decision maker’s rating is known through the use of the intuitionistic fuzzy sets.
TOPSIS helped to separate ideal solutions (alternatives) from anti-ideal solutions.
The proposed method was tested on 3 numerical examples to demonstrate the
strength and the special use of such method. In the first numerical example, the
proposed conjoint analysis – intuitionistic fuzzy TOPSIS framework is
demonstrated in a decision problem involving incorporating shareholder
preferences into management decisions. This decision problem is premised on the
growing power struggle between shareholders of companies and their
management boards. The proposed decision making framework demonstrates
how shareholder preferences can be incorporated into management decisions
regarding the selection of a new manager in a microfinance organization. Since
shareholders tend to be many in number, their views and preferences on
characteristics of ‘their’ ideal candidate are modelled into criteria weights to guide
management in their final selection of the best candidate. Further, board of
management uses the intuitionistic fuzzy TOPSIS method to rank and select the
ideal candidate for the vacant managerial position.
In the numerical example 2, the decision solution was unique in how customer
preferences could be incorporated into management decision about selecting an
ideal third party distributing company based on their previous performances.
Similar to problem 1, conjoint analysis – intuitionistic fuzzy TOPSIS was ideal
for such problem. In numerical example 3, similar approach of testing the
proposed approach was carried out with a decision problem involving merging
managers’ preferences and trade-offs in recruitment process outsourcing vendor
selection decisions. The conjoint analysis – intuitionistic fuzzy TOPSIS
framework again proved reliable and adequate for such special decision problems
of incorporating two decision points into a composite one. It must be noted that
the numerical examples provide a guide to how the proposed hybrid method can
be extended into other real-life decision problems.
The last stage in the decision framework in this dissertation focused on
providing novel sensitivity analysis models that can be used to test the reliability
of the final decisions and by extension the congruent effect produced when certain
changes are made to the input parameters. Three models conveniently named as
‘schemas’ were developed for the sensitivity analysis. The sensitivity analysis
model can be extended into other real-life decisions.
The extensive literature review on hybrid fuzzy MCDM methods revealed in
two ways how the concept of ‘hybrid’ MCDM are typically approached. Hybrid
MCDM normally (1) describes the nature of the problem and (2) the nature of the
solution (methods). This dissertation focused on the aspect relating to the latter
concerning methods and solutions used. In future works, the researcher hopes to

112
investigate into hybrid MCDM methods regarding the nature of the underlying
problem.
The results obtained in both the investigative part and in the proposed hybrid
method, give reason to believe that hybrid MCDM methods should only be used
in special decision problems. Additionally, it should be used only when the use of
a single MCDM method would not be adequate. As demonstrated in this
dissertation, the proposed hybrid method was used in some of these complex and
challenging decision problems.
One remarkable strength of the dissertation is the introduction of conjoint
analysis method which is typically outside MCDM methods and demonstrating
its similarities to most MCDM methods. Though the two methods used in the
proposed hybrid solution are existing methods from different fields of disciplines,
harnessing their strengths in this unique 2-tier hybrid decision making model has
been novel. The novel integration of conjoint analysis and intuitionistic fuzzy
TOPSIS could spur further research into discovering other methods outside the
scope of MCDM methods that could be paired seamlessly with MCDM methods
to solve real-life problems. Furthermore, the schemas designed for the sensitivity
analysis also provide a means to understanding variety of ways of modelling
sensitivity analysis in MCDM.
Overall, the dissertation was successful both in the investigative and the design
aspects. The investigative part offered the chance to understand the use of hybrid
methods especially in relation to single-method solutions. The proposed hybrid
conjoint analysis-intuitionistic fuzzy TOPSIS method compared favourably with
other hybrid fuzzy MCDM methods. In particular, the conjoint analysis method
faired better compared to AHP regarding criteria weight setting from the relatively
large decision group. It can therefore be concluded that conjoint analysis is a
better choice than AHP when the number of preference inputs are large. It must
however be added that, quality of results achieved in any MCDM exercise,
depends largely on the complexity of the evaluation task and the knowledge of
the respondent/decision maker regarding preference measurement. Again, in
terms of time complexity, AHP is slower compared to conjoint analysis because
of its many pairwise comparisons.
The aims of the dissertation were achieved:
To investigate the use of hybridized or integrated MCDM methods against
one-method solutions. To determine:
o when a hybrid method solution is useful to a selection problem.
o which MCDM method is ideal for setting criteria weights in a
hybridized method.
o the appropriate use of subjective and objective weights in a
hybridized method for a selection problem.

113
The investigative part of the dissertation offered the researcher the chance to
compare hybrid MCDM methods with single MCDM methods on same decision
problems. Through the investigation, it can be concluded that hybrid MCDM
methods should be deployed only in very special cases where a one-method
solution would not be helpful. It was also observed that the AHP method has
superior qualities for setting criteria weights but when decision inputs are
relatively large and trade-offs need to be modelled, conjoint analysis performs
better with clearer results for interpretation.
Design a new hybridized MCDM method that embodies user (consumers,
shareholder) preferences and experts in an ideal decision making situation.
o Conjoint Analysis – Intuitionistic Fuzzy TOPSIS Method
o Conjoint Analysis for setting criteria weights
o Intuitionistic Fuzzy TOPSIS for ranking competing alternatives
o Test the proposed hybrid MCDM model with real-life examples
A new hybrid MCDM method was designed from two existing methods which
was adequately tested on numerical examples. The proposed hybrid method
compares favourably with other hybrid MCDM methods. The strength of the
proposed method is its ability to seamlessly merge two decision points into a
composite decision.
Test the proposed hybrid MCDM model with real-life examples.
The proposed hybrid decision model was tested on numerical examples that
mirror real-life situations. Three examples were demonstrated on how decisions
of preferences from a large decision making group are merged with decisions
from a relatively small decision making group. The reliability of final decisions
in each numerical example was tested using novel sensitivity analysis models.
The author would like to add that most of the results in the dissertation have been
published in several conferences and impacted journals such as Applied Artificial
Intelligence, Kybernetes, Quality & Quantity, Journal of Multi-Criteria Decision
Analysis, International Journal of Fuzzy Systems as seen in the list of publications.

114
REFERENCES
[1] Gwo-Hshiung, T. (2010). Multiple attribute decision making: methods and
applications. Multiple Attribute Decision Making: Methods and
Applications. ISBN: 1439861579
[2] Triantaphyllou, E. (2000). Multi-criteria decision making methods. In
Multi-criteria Decision Making Methods: A Comparative Study (pp. 5-21).
Springer US. ISBN-13: 978-0792366072.
[3] Zadeh, L. A. (1965). Fuzzy sets. Information and control, 8(3), 338-353.
[4] Afful-Dadzie, E., Nabareseh, S., Afful-Dadzie, A., & Oplatková, Z. K.
(2014). A fuzzy TOPSIS framework for selecting fragile states for support
facility. Quality & Quantity, 49 (5), 1835-1855. ISSN 0033-5177.
[5] Kahraman, C. (2008). Fuzzy multi-criteria decision making: theory and
applications with recent developments (Vol. 16). Springer Science &
Business Media. ISBN 978-0-387-76813-7
[6] Szmidt, E. (2014). Distances and similarities in intuitionistic fuzzy sets.
Springer. ISBN 978-3-319-01640-5.
[7] Zadeh, L. A. (1983). A computational approach to fuzzy quantifiers in
natural languages. Computers & Mathematics with applications, 9(1), 149-
184. ISSN: 0898-1221.
[8] Pawlak, Z. (1982). Rough sets. International Journal of Computer &
Information Sciences, 11(5), 341-356. ISSN:1525-9293.
[9] Dempster, A. P. (1967). Upper and lower probabilities induced by a
multivalued mapping. The annals of mathematical statistics, 325-339.
[10] Dempster, A. P. (1967). Upper and lower probability inferences based on
a sample from a finite univariate population. Biometrika, 54(3-4), 515-
528. ISBN-13: 978-0198509936.
[11] Shafer, G. (1976). A mathematical theory of evidence (Vol. 1). Princeton:
Princeton university press. ISBN: 9780691100425.
[12] Atanassov, K. T. (1986). Intuitionistic fuzzy sets. Fuzzy sets and Systems,
20(1), 87-96. ISSN: 0165-0114.
[13] Atanassov, K. T. (1989). More on intuitionistic fuzzy sets. Fuzzy sets and
systems, 33(1), 37-45. ISSN: 0165-0114.
[14] Atanassov, K. T. (1994). New operations defined over the intuitionistic
fuzzy sets. Fuzzy sets and Systems, 61(2), 137-142. ISSN: 0165-0114.
[15] Keeney, R. L., & Raiffa, H. (1993). Decisions with multiple objectives:
preferences and value trade-offs. Cambridge university press. ISBN 0-
521-44185-4.
[16] Kleindorfer, P.R., H.C. Kunreuther, and P.J.H. Schoemaker. (1993).
Decision sciences: An integrative perspective. Cambridge: Cambridge
University Press. ISBN 0-521-32867-5.
[17] Czogała, E., & Łęski, J. (2000). Classical sets and fuzzy sets Basic
definitions and terminology. In Fuzzy and Neuro-Fuzzy Intelligent
Systems (pp. 1-26). Physica-Verlag HD. ISBN: 978-3-662-00389-3.

115
[18] Carlsson, C., & Fullér, R. (2005). On additions of interactive fuzzy
numbers. Acta Polytechnica Hungarica, 2, 59-73. ISSN: 17858860.
[19] Kaufmann, A., & Gupta, M. M. (1991). Introduction to fuzzy arithmetic:
theory and applications. Arden Shakespeare. ISBN-10: 0442230079.
[20] Boran, F. E., Genç, S., Kurt, M., & Akay, D. (2009). A multi-criteria
intuitionistic fuzzy group decision making for supplier selection with
TOPSIS method. Expert Systems with Applications, 36(8), 11363-11368.
ISSN: 09574174.
[21] Carlsson, C., & Fullér, R. (1996). Fuzzy multiple criteria decision making:
Recent developments. Fuzzy sets and systems, 78(2), 139-153. ISSN:
0165-0114.
[22] Chu, T. C., & Lin, Y. (2009). An extension to fuzzy MCDM. Computers
& Mathematics with Applications, 57(3), 445-454. ISSN: 0898-1221.
[23] Ribeiro, R. A. (1996). Fuzzy multiple attribute decision making: a review
and new preference elicitation techniques. Fuzzy sets and systems, 78(2),
155-181. ISSN: 0165-0114.
[24] Büyüközkan, G., & Çifçi, G. (2012). A novel hybrid MCDM approach
based on fuzzy DEMATEL, fuzzy ANP and fuzzy TOPSIS to evaluate
green suppliers. Expert Systems with Applications, 39(3), 3000-3011.
ISSN: 09574174.
[25] Zhang, S. F., & Liu, S. Y. (2011). A GRA-based intuitionistic fuzzy multi-
criteria group decision making method for personnel selection. Expert
Systems with Applications, 38(9), 11401-11405. ISSN: 09574174.
[26] Wu, J., Chen, F., Nie, C., & Zhang, Q. (2013). Intuitionistic fuzzy-valued
Choquet integral and its application in multi-criteria decision making.
Information Sciences, 222, 509-527. ISSN: 00200255.
[27] Chai, J., Liu, J. N., & Xu, Z. (2012). A new rule-based SIR approach to
supplier selection under intuitionistic fuzzy environments. International
Journal of Uncertainty, Fuzziness and Knowledge-Based Systems, 20(03),
451-471. ISSN: 0218-4885.
[28] Chen, S. M., Yang, M. W., Yang, S. W., Sheu, T. W., & Liau, C. J. (2012).
Multi-criteria fuzzy decision making based on interval-valued
intuitionistic fuzzy sets. Expert Systems with Applications, 39(15), 12085-
12091. ISSN: 09574174.
[29] Krohling, R. A., Pacheco, A. G., & Siviero, A. L. (2013). IF-TODIM: An
intuitionistic fuzzy TODIM to multi-criteria decision making. Knowledge-
Based Systems, 53, 142-146. ISSN: 09507051.
[30] Hashemi, H., Bazargan, J., & Mousavi, S. M. (2013). A compromise ratio
method with an application to water resources management: An
intuitionistic fuzzy set. Water resources management, 27(7), 2029-2051.
ISSN: 09204741.

116
[31] Meng, F., Tan, C., & Zhang, Q. (2014). Some interval-valued intuitionistic
uncertain linguistic hybrid Shapley operators. Systems Engineering and
Electronics, Journal of, 25(3), 452-463. ISSN: 10044132.
[32] Zhang, X. M., Xu, Z. S., & Yu, X. H. (2011). Shapley value and Choquet
integral-based operators for aggregating correlated intuitionistic fuzzy
information. Information: An International Interdisciplinary Journal,
14(6), 1847-1858.
[33] Chen, T. Y., & Li, C. H. (2010). Determining objective weights with
intuitionistic fuzzy entropy measures: a comparative analysis. Information
Sciences, 180(21), 4207-4222. ISSN: 00200255
[34] Daneshvar Rouyendegh, B. (2011). The DEA and intuitionistic fuzzy
TOPSIS approach to departments' performances: a pilot study. Journal of
Applied Mathematics, 2011. ISSN: 16870042
[35] Li, D. F. (2014). Decision and game theory in management with
intuitionistic fuzzy sets (Vol. 308, pp. 1-441). Springer. ISBN 978-3-642-
40712-3.
[36] Xu, Z. (2007). Intuitionistic fuzzy aggregation operators. Fuzzy Systems,
IEEE Transactions on, 15(6), 1179-1187. ISSN: 10636706.
[37] Chen, S. M., & Tan, J. M. (1994). Handling multicriteria fuzzy decision-
making problems based on vague set theory. Fuzzy sets and Systems,
67(2), 163-172. ISSN: 0165-0114.
[38] Zeng, S., & Su, W. (2011). Intuitionistic fuzzy ordered weighted distance
operator. Knowledge-Based Systems, 24(8), 1224-1232. ISSN: 09507051.
[39] Yang, W., & Chen, Z. (2012). The quasi-arithmetic intuitionistic fuzzy
OWA operators. Knowledge-Based Systems, 27, 219-233. ISSN:
09507051.
[40] Yager, R. R. (2001). The power average operator. Systems, Man and
Cybernetics, Part A: Systems and Humans, IEEE Transactions on, 31(6),
724-731. ISBN 0780309111.
[41] Merigó, J. M. (2012). Probabilities in the OWA operator. Expert Systems
with Applications, 39(13), 11456-11467. ISSN: 09574174.
[42] Yager, R. R. (1988). On ordered weighted averaging aggregation operators
in multi-criteria decision making. Systems, Man and Cybernetics, IEEE
Transactions on, 18(1), 183-190. ISBN 0780309111.
[43] Yager, R. R. (2004). Generalized OWA aggregation operators. Fuzzy
Optimization and Decision Making, 3(1), 93-107. ISSN: 15732908.
[44] Yager, R. R. (2003). Induced aggregation operators. Fuzzy Sets and
Systems, 137(1), 59-69. ISSN: 0165-0114.
[45] Saaty, T. L. (1990). How to make a decision: the analytic hierarchy
process. European journal of operational research, 48(1), 9-26. ISSN:
03772217.
[46] Saaty, T. L. (2001). Analytic network process. In Encyclopedia of
Operations Research and Management Science (pp. 28-35). Springer US.

117
[47] Hwang, C., & Yoon, K. (1981). Multiple attribute decision making
methods and application, Springer, New York. ISBN 978-3-642-48318-
9.
[48] Opricovic, S., & Tzeng, G. H. (2007). Extended VIKOR method in
comparison with outranking methods. European Journal of Operational
Research, 178(2), 514-529. ISSN: 03772217.
[49] Chou, S. Y., Chang, Y. H., & Shen, C. Y. (2008). A fuzzy simple additive
weighting system under group decision-making for facility location
selection with objective/subjective attributes. European Journal of
Operational Research, 189(1), 132-145. ISSN: 03772217.
[50] Roy, B. (1978). ELECTRE III: Un algorithme de classements fondé sur
une représentation floue des préférences en présence de criteres multiples.
Cahiers du CERO, 20(1), 3-24.
[51] Brans, J. P., Vincke, P., & Mareschal, B. (1986). How to select and how
to rank projects: The PROMETHEE method. European journal of
operational research, 24(2), 228-238. ISSN: 03772217.
[52] Chang, B., Chang, C. W., & Wu, C. H. (2011). Fuzzy DEMATEL method
for developing supplier selection criteria. Expert Systems with
Applications, 38(3), 1850-1858. ISSN: 09574174.
[53] Roy, B. (1981). The optimisation problem formulation: Criticism and
overstepping. Journal of the Operational Research Society, 32(6), 427–
436. ISSN: 14769360.
[54] Roy, B., & Słowiński, R. (2013). Questions guiding the choice of a
multicriteria decision aiding method. EURO Journal on Decision
Processes, 1(1-2), 69-97. ISSN: 2193-9438
[55] Hanne, T. (2012). Intelligent strategies for meta multiple criteria decision
making (Vol. 33). Springer Science & Business Media. ISBN 978-1-4615-
1595-1.
[56] Ishizaka, A., & Nemery, P. (2013). Multi-criteria decision analysis:
methods and software. John Wiley & Sons. ISBN: 1119974070
[57] Bell, D.E., H. Raiffa, and A. Tversky. (1988). Decision making:
Descriptive, normative, and prescriptive interactions. Cambridge:
Cambridge University Press. isbn: 9780521368513.
[58] Pawlak, Z., 1982. Rough sets. International Journal of Computer &
Information Sciences, 11(5), 341-356. ISSN:1525-9293.
[59] Grattan‐Guinness, I. (1976). Fuzzy Membership Mapped onto Intervals
and Many‐Valued Quantities. Mathematical Logic Quarterly, 22(1), 149-
160. ISSN: 15213870.
[60] Torra, V. (2010). Hesitant fuzzy sets. International Journal of Intelligent
Systems, 25(6), 529-539. ISSN: 1098111X.
[61] Molodtsov, D. (1999). Soft set theory—first results. Computers &
Mathematics with Applications, 37(4), 19-31. ISSN: 0898-1221.

118
[62] Zadeh, L. A. (1974). The concept of a linguistic variable and its application
to approximate reasoning (pp. 1-10). Springer US. ISBN: 978-1-4684-
2108-8
[63] Zadeh, L. A. (1975). Fuzzy logic and approximate reasoning. Synthese,
30(3-4), 407-428. ISSN: 0039-7857
[64] Zeleny, M. (2008). The KM-MCDM interface in decision design:
tradeoffs-free conflict dissolution. International Journal of Applied
Decision Sciences, 1(1), 3-23. ISSN: 17558085.
[65] Sawaragi, Y., Nakayama, H., & Tanino, T. (1985). Theory of
multiobjective optimization, Acad.
[66] Hwang, C. L., & Masud, A. S. M. (1979). Multiple objective decision
making—methods and applications. ISBN: 3540091114
[67] Zeleny, M. (1982). Multi criteria decision making. TIMS Studies in
Manage, 31-57. ISBN 10: 0720407648.
[68] Vincke, P. (1992). Multicriteria decision-aid. John Wiley & Sons. ISBN:
978-0-471-93184-3
[69] Steuer, R. E. (1986). Multiple criteria optimization: theory, computation,
and applications. Wiley. ISBN-10: 047188846X.
[70] Costa, E., Bana, C. A., & Vansnick, J. C. (1994). MACBETH—An
interactive path towards the construction of cardinal value functions.
International transactions in operational Research, 1(4), 489-500. ISSN:
09696016.
[71] Hansen, P., & Ombler, F. (2008). A new method for scoring additive multi‐attribute value models using pairwise rankings of alternatives. Journal of
Multi‐Criteria Decision Analysis, 15(3‐4), 87-107. ISSN: 1099-1360.
[72] Xu, X. (2001). The SIR method: A superiority and inferiority ranking
method for multiple criteria decision making. European Journal of
Operational Research, 131(3), 587-602. ISSN: 03772217.
[72] Xu, L., & Yang, J. B. (2001). Introduction to multi-criteria decision
making and the evidential reasoning approach. Manchester School of
Managment, University of Manchester Institute of Science and
Technology.
[73] Dyer, J. S., Fishburn, P. C., Steuer, R. E., Wallenius, J., & Zionts, S.
(1992). Multiple criteria decision making, multiattribute utility theory: the
next ten years. Management science, 38(5), 645-654. ISSN: 15265501.
[74] Geoffrion, A. M. (1968). Proper efficiency and the theory of vector
maximization. Journal of Mathematical Analysis and Applications, 22(3),
618-630. ISSN: 10960813.
[75] Evans, J. P., & Steuer, R. E. (1973). A revised simplex method for linear
multiple objective programs. Mathematical Programming, 5(1), 54-72.
ISSN: 14364646.

119
[76] Yu, P. L., & Zeleny, M. (1975). The set of all non-dominated solutions in
linear cases and a multicriteria simplex method. Journal of Mathematical
Analysis and Applications, 49(2), 430-468. ISSN: 10960813.
[77] Gal, T. (1977). A general method for determining the set of all efficient
solutions to a linear vector maximum problem. European journal of
operational research, 1(5), 307-322. ISSN: 03772217.
[78] Isermann, H. (1977). The enumeration of the set of all efficient solutions
for a linear multiple objective program. Operational Research Quarterly,
711-725.
[79] Bitran, G. R. (1979). Theory and algorithms for linear multiple objective
programs with zero–one variables. Mathematical Programming, 17(1),
362-390. ISSN: 14364646.
[80] Nakayama, H., & Sawaragi, Y. (1984). Satisficing trade-off method for
multiobjective programming. In Interactive decision analysis (pp. 113-
122). Springer Berlin Heidelberg. ISBN: 978-3-540-13354-4.
[81] Benayoun, R., De Montgolfier, J., Tergny, J., & Laritchev, O. (1971).
Linear programming with multiple objective functions: Step method
(STEM). Mathematical programming, 1(1), 366-375.
[82] Simon, H. A. (1950). Administrative behaviour. Australian Journal of
Public Administration, 9(1), 241-245. ISSN: 03136647.
[ 83] Lakhmi, J., & Lim, C. P. (2010). Handbook on Decision Making:
Techniques and Applications. Intelligent Systems Reference Library, 4,
548. ISBN 978-3-642-13639-9.
[84] Hajkowicz, S. A., McDonald, G. T., & Smith, P. N. (2000). An evaluation
of multiple objective decision support weighting techniques in natural
resource management. Journal of Environmental Planning and
Management, 43(4), 505-518. ISSN: 09640568.
[85] Bouyssou, D. (1993). Décision multicritère ou aide multicritère.
Newsletter of the European Working Group—Multicriteria Aid for
Decisions, 1-2.
[86] Guitouni, A., Martel, J. M., & Bélanger, M. (1999). A multiple criteria
aggregation procedure for the evaluation of courses of action in the context
of the Canadian Airspace Protection. DREV TR, 1999-215.
[87] Kao, C., & Liu, S. T. (2000). Fuzzy efficiency measures in data
envelopment analysis. Fuzzy sets and systems, 113(3), 427-437.
[88] Lertworasirikul, S., Fang, S. C., Joines, J. A., & Nuttle, H. L. (2003). Fuzzy
data envelopment analysis (DEA): a possibility approach. Fuzzy sets and
systems, 139(2), 379-394. ISSN: 0165-0114.
[89] Yoon, K. P., & Hwang, C. L. (1995). Multiple attribute decision making:
an introduction (Vol. 104). Sage publications. ISBN: 0803954867.
[90] Sivanandam, S. N., Sumathi, S., & Deepa, S. N. (2007). Introduction to
fuzzy logic using MATLAB (Vol. 1). Berlin: Springer. ISBN-13: 978-
3642071447.

120
[91] Zadeh, L. A., Klir, G. J., & Yuan, B. (1996). Fuzzy sets, fuzzy logic, and
fuzzy systems: selected papers (Vol. 6). World Scientific. ISBN
9810224214.
[92] Klir, G., & Yuan, B. (1995). Fuzzy sets and fuzzy logic (Vol. 4). New
Jersey: Prentice Hall. ISBN-13: 978-0131011717.
[93] Singh, H., Gupta, M. M., Meitzler, T., Hou, Z. G., Garg, K. K., Solo, A.
M., & Zadeh, L. A. (2013). Real-life applications of fuzzy logic. Advances
in Fuzzy Systems. ISSN: 1687711X.
[94] Yu, D., & Shi, S. (2015). Researching the development of Atanassov
intuitionistic fuzzy set: Using a citation network analysis. Applied Soft
Computing, 32, 189-198. ISSN: 15684946.
[95] Chen, T. Y. (2015). IVIF-PROMETHEE outranking methods for multiple
criteria decision analysis based on interval-valued intuitionistic fuzzy sets.
Fuzzy Optimization and Decision Making, 14(2), 173-198. ISSN:
15732908.
[96] Pourahmad, A., Hosseini, A., Banaitis, A., Nasiri, H., Banaitienė, N., &
Tzeng, G. H. (2015). Combination of fuzzy-AHP and DEMATEL-ANP
with GIS in a new hybrid MCDM model used for the selection of the best
space for leisure in a blighted urban site. Technological and Economic
Development of Economy, 21(5), 773-796. ISSN: 13928619.
[97] Su, C. H., Tzeng, G. H., & Tseng, H. L. (2012, November). Improving
cloud computing service in fuzzy environment—combining fuzzy DANP
and fuzzy VIKOR with a new hybrid FMCDM model. In Fuzzy Theory and
it's Applications (iFUZZY), 2012 International Conference on (pp. 30-35).
IEEE.
[98] Büyüközkan, G., & Çifçi, G. (2012). A novel hybrid MCDM approach
based on fuzzy DEMATEL, fuzzy ANP and fuzzy TOPSIS to evaluate
green suppliers. Expert Systems with Applications, 39(3), 3000-3011.
ISSN: 09574174.
[99] Tzeng, G. H., Chiang, C. H., & Li, C. W. (2007). Evaluating intertwined
effects in e-learning programs: A novel hybrid MCDM model based on
factor analysis and DEMATEL. Expert systems with Applications, 32(4),
1028-1044. ISSN: 09574174.
[100] Hsu, C. H., Wang, F. K., & Tzeng, G. H. (2012). The best vendor
selection for conducting the recycled material based on a hybrid MCDM
model combining DANP with VIKOR. Resources, Conservation and
Recycling, 66, 95-111. ISSN: 09213449.
[101] Lee, A. H., Chen, W. C., & Chang, C. J. (2008). A fuzzy AHP and BSC
approach for evaluating performance of IT department in the
manufacturing industry in Taiwan. Expert systems with applications,
34(1), 96-107. ISSN: 09574174.
[102] Li, M., Jin, L., & Wang, J. (2014). A new MCDM method combining
QFD with TOPSIS for knowledge management system selection from the

121
user's perspective in intuitionistic fuzzy environment. Applied soft
computing, 21, 28-37. ISSN: 15684946.
[103] Azimi, R., Yazdani-Chamzini, A., Fouladgar, M. M., Zavadskas, E. K.,
& Basiri, M. H. (2011). Ranking the strategies of mining sector through
ANP and TOPSIS in a SWOT framework. Journal of Business Economics
and Management, 12(4), 670-689. ISSN: 20294433.
[104] Chen, M. K., & Wang, S. C. (2010). The use of a hybrid fuzzy-Delphi-
AHP approach to develop global business intelligence for information
service firms. Expert Systems with Applications, 37(11), 7394-7407.
ISSN: 09574174.
[105] Dalalah, D., Hayajneh, M., & Batieha, F. (2011). A fuzzy multi-criteria
decision making model for supplier selection. Expert systems with
applications, 38(7), 8384-8391. ISSN: 09574174.
[106] Paksoy, T., Pehlivan, N. Y., & Kahraman, C. (2012). Organizational
strategy development in distribution channel management using fuzzy
AHP and hierarchical fuzzy TOPSIS. Expert Systems with Applications,
39(3), 2822-2841. ISSN: 09574174.
[107] Patil, S. K., & Kant, R. (2014). A fuzzy AHP-TOPSIS framework for
ranking the solutions of Knowledge Management adoption in Supply
Chain to overcome its barriers. Expert Systems with Applications, 41(2),
679-693. ISSN: 09574174.
[108] Taha, Z., & Rostam, S. (2012). A hybrid fuzzy AHP-PROMETHEE
decision support system for machine tool selection in flexible
manufacturing cell. Journal of Intelligent Manufacturing, 23(6), 2137-
2149. ISSN: 15728145.
[109] Kabak, M., Burmaoğlu, S., & Kazançoğlu, Y. (2012). A fuzzy hybrid
MCDM approach for professional selection. Expert Systems with
Applications, 39(3), 3516-3525. ISSN: 09574174.
[110] Fetanat, A., & Khorasaninejad, E. (2015). A novel hybrid MCDM
approach for offshore wind farm site selection: A case study of Iran.
Ocean & Coastal Management, 109, 17-28. ISSN: 09645691.
[111] Liou, J. J., & Chuang, M. L. (2008). A hybrid MCDM model for
evaluating the corporate image of the airline industry. International
Journal of Applied Management Science, 1(1), 41-54. ISSN: 17558913.
[112] Zolfani, S. H., Esfahani, M. H., Bitarafan, M., Zavadskas, E. K., & Arefi,
S. L. (2013). Developing a new hybrid MCDM method for selection of
the optimal alternative of mechanical longitudinal ventilation of tunnel
pollutants during automobile accidents. Transport, 28(1), 89-96. ISSN:
16484142.
[113] Tavana, M., Zandi, F., & Katehakis, M. N. (2013). A hybrid fuzzy group
ANP–TOPSIS framework for assessment of e-government readiness
from a CiRM perspective. Information and Management, 50(7), 383-397.
ISSN: 0378-7206.

122
[114] IJzerman, M. J., Van Til, J. A., & Bridges, J. F. (2012). A comparison of
analytic hierarchy process and conjoint analysis methods in assessing
treatment alternatives for stroke rehabilitation. The Patient-Patient-
Centered Outcomes Research, 5(1), 45-56. ISSN: 1178-1653.
[115] Bouyssou, D., & Pirlot, M. (2005). Conjoint measurement tools for
MCDM. In Multiple Criteria Decision Analysis: State of the Art Surveys
(pp. 73-112). Springer New York. ISBN: 0-387-23067-X.
[116] Scholl, A., Manthey, L., Helm, R., & Steiner, M. (2005). Solving
multiattribute design problems with analytic hierarchy process and
conjoint analysis: An empirical comparison. European Journal of
Operational Research, 164(3), 760-777. ISSN: 03772217.
[117] Peniwati, K. (2007). Criteria for evaluating group decision-making
methods. Mathematical and Computer Modelling, 46(7), 935-947.
ISSN: 08957177.
[118] Luce, R. D., & Tukey, J. W. (1964). Simultaneous conjoint measurement:
A new type of fundamental measurement. Journal of mathematical
psychology, 1(1), 1-27. ISSN: 10960880.
[119]Krantz, D. H. (1964). Conjoint measurement: The Luce-Tukey
axiomatization and some extensions. Journal of Mathematical
Psychology, 1(2), 248-277. ISSN: 10960880
[120]Tversky, A. (1967). A general theory of polynomial conjoint
measurement. Journal of Mathematical Psychology, 4(1), 1-20. ISSN:
10960880.
[121] Simon, H. A. (1957). Models of man: social and rational; mathematical
essays on rational human behavior in society setting. Wiley. ASIN:
B0007ELZJ4.
[122] Hoffman, P. J. (1967). Cue-consistency and configurality in human
judgment. Oregon Research Institute.
[123] Churchman, C. W., & Churchman, C. W. (1961). Prediction and optimal
decision: Philosophical issues of a science of values. Englewood Cliffs,
NJ: Prentice-Hall. ISBN: 9780313234187.
[124] Raghavarao, D., Wiley, J. B., & Chitturi, P. (2010). Choice-based
conjoint analysis: models and designs. CRC Press. ISBN: 1420099965
[125] Green, P. E., & Rao, V. R. (1971). Conjoint measurement for quantifying
judgmental data. Journal of Marketing research, 355-363. ISSN:
15477193.
[126] Green, P. E., & Srinivasan, V. (1990). Conjoint analysis in marketing:
new developments with implications for research and practice. Journal
of Marketing, 3-19. ISSN: 15477185.
[127] Johnson, R.M. (1987). Adaptive conjoint analysis. In Proceedings of
Sawtooth Software Conference on Perceptual Mapping, Conjoint
analysis, and Computer Interviewing, Sawtooth Software, Ketcham,
253-265.

123
[128] Elrod, T., Louviere, J. J., & Davey, K. S. (1992). An empirical
comparison of ratings-based and choice-based conjoint models. Journal
of Marketing research, 29(3), 368-377. ISSN: 15477193.
[129] Acito, F. (1977). An investigation of some data collection issues in
conjoint measurement. Contemporary marketing thought (82-85).
Chicago: Proceedings. American Marketing Association.
[130] Scott, J. E., & Wright, P. (1976). Modeling an organizational buyer's
product evaluation strategy: Validity and procedural considerations.
Journal of Marketing Research, 211-224. ISSN: 15477193.
[131] McCullough, J., & Best, R. (1979). Conjoint measurement: temporal
stability and structural reliability. Journal of Marketing Research, 26-31.
ISSN: 15477193.
[132] Acito, F., and Olshavsky, R. W. (1981). Limits to accuracy in conjoint
analysis. Advances in Consumer Research, 8(1). ISSN: 00989258.
[133] Kuhfeld, W. F. (2005). Marketing research methods in SAS.
Experimental Design, Choice, Conjoint, and Graphical Techniques.
Cary, NC, SAS-Institute TS-722.
[134]Green, P. E., & Srinivasan, V. (1978). Conjoint analysis in consumer
research: issues and outlook. Journal of consumer research, 103-123.
ISSN: 00935301.
[135] Deng, H., Yeh, C. H., & Willis, R. J. (2000). Inter-company comparison
using modified TOPSIS with objective weights. Computers & Operations
Research, 27(10), 963-973. ISSN: 03050548.
[136] Shih, H. S., Shyur, H. J., & Lee, E. S. (2007). An extension of TOPSIS
for group decision making. Mathematical and Computer Modelling,
45(7), 801-813. ISSN: 08957177
[137] Klir, G. J., St Clair, U., & Yuan, B. (1997). Fuzzy set theory: foundations
and applications. Prentice-Hall, Inc. ISBN: 0131011715.
[138] Phillips, J. K., Klein, G., and Sieck, W. R. (2004). Expertise in judgment
and decision making: A case for training intuitive decision skills.
Blackwell handbook of judgment and decision making, pp. 297-315.
ISBN: 9781405107464.
[139] Eeckloo, K., Van Herck, G., Van Hulle, C., and Vleugels, A. (2004).
From Corporate Governance To Hospital Governance: Authority,
transparency and accountability of Belgian non-profit hospitals’ board
and management. Health Policy, Vol. 68 No. 1, pp. 1-15. ISSN:
01688510.
[140] Bebchuk, L. A. (2005). The case for increasing shareholder power.
Harvard Law Review, pp. 833-914. ISSN: 0017811X.
[141] Carnegie, G. D., and O’Connell, B. T. (2014). A longitudinal study of the
interplay of corporate collapse, accounting failure and governance
change in Australia: Early 1890s to early 2000s. Critical Perspectives on
Accounting, Vol. 25 No. 6, pp. 446-468. ISSN: 10959955.

124
[142] Tricker, R. I. (2015). Corporate governance: Principles, policies, and
practices. Oxford University Press, USA. ISBN-13: 978-0199607969.
[143] Joseph, J., Ocasio, W., and McDonnell, M. H. (2014). The structural
elaboration of board independence: Executive power, institutional
logics, and the adoption of CEO-only board structures in US corporate
governance. Academy of Management Journal, Vol. 57 No. 6, pp. 1834-
1858. ISSN: 00014273.
[144] Markham, J. W. (2015). A financial history of modern US corporate
scandals: From Enron to reform. Routledge. ISBN-13: 978-0765615831.
[145] Soltani, B. (2014). The anatomy of corporate fraud: A comparative
analysis of high profile American and European corporate scandals.
Journal of business ethics, Vol. 120 No. 2, pp. 251-274. ISSN: 15730697.
[146] Furrer, O., Rajendran Pandian, J., and Thomas, H. (2007). Corporate
strategy and shareholder value during decline and turnaround.
Management Decision, Vol. 45 No. 3, pp. 372-392. ISSN: 00251747.
[147] Judge, W. Q., Gaur, A., and Muller‐Kahle, M. I. (2010). Antecedents of
shareholder activism in target firms: evidence from a multi‐country
study. Corporate Governance: An International Review, Vol. 18 No. 4,
pp. 258-273. ISSN: 14678683.
[148] Raviv, A. (2011). Shareholders vs. Management: Split Decision. Kellogg
School of Management, available at:
http://insight.kellogg.northwestern.edu/article/
[149] Rust, R. T., & Zahorik, A. J. (1993). Customer satisfaction, customer
retention, and market share. Journal of retailing, 69(2), 193-215. ISSN:
00224359.
[150] Elrod, T., Johnson, R. D., & White, J. (2004). A new integrated model of
noncompensatory and compensatory decision strategies. Organizational
Behavior and Human Decision Process, 95, 1–19. ISSN: 10959920.
[151] Kruskal, J. B. (1965). Analysis of factorial experiments by estimating
monotone transformations of the data. Journal of the Royal Statistical
Society, Series B (Methodological), pp. 251-263. ISSN: 13697412.
[152] Tervonen, T., Figueira, J. R., Lahdelma, R., Dias, J. A., & Salminen, P.
(2009). A stochastic method for robustness analysis in sorting problems.
European Journal of Operational Research, 192(1), 236-242. ISSN:
03772217.
[153] Zardari, N. H., Ahmed, K., Shirazi, S. M., & Yusop, Z. B. (2014).
Weighting Methods and Their Effects on Multi-Criteria Decision Making
Model Outcomes in Water Resources Management. Springer. ISBN 978-
3-319-12586-2.
[154] Hobbs, B. F. (1980). A comparison of weighting methods in power plant
siting*. Decision Sciences, 11(4), 725-737.
[155] Hajkowicz, S. A., McDonald, G. T., & Smith, P. N. (2000). An evaluation
of multiple objective decision support weighting techniques in natural

125
resource management. Journal of Environmental Planning and
Management, 43(4), 505-518. ISSN: 09640568.
[156] Eckenrode, R. T. (1965). Weighting multiple criteria. Management
science, 12(3), 180-192. ISSN: 15265501.
[157] Nijkamp, P., Rietveld, P., & Voogd, H. (2013). Multicriteria evaluation
in physical planning. Elsevier. ISBN-13: 978-0444881243.
[158] Hobbs, B. F., & Meier, P. (2012). Energy decisions and the environment:
a guide to the use of multicriteria methods (Vol. 28). Springer Science &
Business Media. ISBN: 079237875X
[159] Voogd, H. (1983). Multicriteria evaluation for urban and regional
planning. Taylor & Francis. ISBN-10: 0-85086-106-3.
[160] Rao, V. R. (2014). Applied conjoint analysis (p. 56). New York:
Springer. ISBN: 3540877533.
[161] McFadden, D. (1973). Conditional logit analysis of qualitative choice
behavior.
[162] Monczka, R.M., Carter, J.R., Markham, W.J., Blascovich, J.D. and
Slaight, T.H. (2005). Outsourcing Strategically for Sustainable
Competitive Advantage. A Joint Research Study, CAPS Research/A.T.
Kearney, Inc., Tempe, AZ/Alexandria, VA
[163] Ghodeswar, B., & Vaidyanathan, J. (2008). Business process
outsourcing: an approach to gain access to world-class capabilities.
Business Process Management Journal, 14(1), 23-38. ISSN: 14637154.
[164] Simanaviciene, R., & Ustinovichius, L. (2010). Sensitivity analysis for
multiple criteria decision making methods: TOPSIS and SAW. Procedia-
Social and Behavioral Sciences, 2(6), 7743-7744. ISSN: 1877-0428.
[165] Alinezhad, A., & Amini, A. (2011). Sensitivity analysis of TOPSIS
technique: the results of change in the weight of one attribute on the final
ranking of alternatives. Journal of Optimization in Industrial
Engineering, 23-28.
[166] Pannell, D. J. (1997). Sensitivity analysis of normative economic models:
theoretical framework and practical strategies. Agricultural economics,
16(2), 139-152. ISSN: 01695150.
[167] Wolters, W. T. M., & Mareschal, B. (1995). Novel types of sensitivity
analysis for additive MCDM methods. European Journal of Operational
Research, 81(2), 281-290. ISSN: 03772217.
[168] Mareschal, B. (1991). Weight stability analysis for additive multicriteria
methods (No. 2013/9377). ULB--Universite Libre de Bruxelles.
[169] Mareschal, B. (1988). Weight stability intervals in multicriteria decision
aid. European Journal of Operational Research, 33(1), 54-64. ISSN:
03772217.

126
LIST OF AUTHORS PUBLICATIONS
The following section presents a summary of the researcher’s publication
activities. In Table 43 is a breakdown of the author’s number of publications in
impacted journals indexed in Web of Science (ISI) and Scopus, together with
book chapters and conference papers. In addition is a full list of all the selected
publications.
The following is the list of selected publications in reference format.
Complete overview
Table 43: Publications as at 05.12.2015
Impacted journals 5
Scopus Journals 1
Conference papers 9
Impacted journals:
[1] AFFUL-DADZIE, E., AFFUL-DADZIE, A., KOMÍNKOVÁ OPLATKOVÁ,
Z. Measuring progress of the millennium development goals: A fuzzy
comprehensive evaluation approach. Applied Artificial Intelligence: an
international journal, 2014, vol. 28, no. 1, p. 1-15. ISSN 0883-9514.
[2] AFFUL-DADZIE, A., AFFUL-DADZIE, E., NABARESEH, S.,
KOMÍNKOVÁ OPLATKOVÁ, Z. Tracking progress of African Peer
Review Mechanism (APRM) using fuzzy comprehensive evaluation method.
Kybernetes, 2014, vol. 43, no. 8, p. 1193-1208. ISSN 0368-492X.
[3] AFFUL-DADZIE, E., NABARESEH, S., AFFUL-DADZIE, A.,
KOMÍNKOVÁ OPLATKOVÁ, Z. A fuzzy TOPSIS framework for selecting
fragile states for support facility. Quality and Quantity: International Journal
of Methodology, 2014, vol. 48, no. 6, p. -. ISSN 0033-5177.
[4] AFFUL-DADZIE, A., AFFUL-DADZIE, E. A TOPSIS Extension
Framework for Re-Conceptualizing Sustainability Measurement.
Kybernetes, 2015, vol. 45, no. 1. ISSN 0368-492X.
[5] AFFUL-DADZIE, E., NABARESEH, S., KOMÍNKOVÁ OPLATKOVÁ,
Z., KLÍMEK, P. Model for Assessing Quality of Online Health Information:
A Fuzzy VIKOR Based Method. Journal of Multi‐Criteria Decision
Analysis, 2015. ISSN: 1099-1360.
[6] AFFUL-DADZIE, E., AFFUL-DADZIE, A., KOMÍNKOVÁ
OPLATKOVÁ, Z. Assessing Commercial Viability of Technology Start-up
Businesses in a Government Venture Capital under Fuzzy Intuitionistic
Environment. International Journal of Fuzzy Systems, 2016. ISSN: 1562-
2479.

127
Conference papers
[7]AFFUL-DADZIE, E., NABARESEH, S., KOMÍNKOVÁ OPLATKOVÁ, Z.,
KLÍMEK, P. Ranking Fragile States for Support Facility: A Fuzzy TOPSIS
Approach. In The 2014 10th International Conference on Natural
Computation. New Jersey, Piscataway: IEEE, 2014, p. 263-269. ISBN 978-
1-4799-5150-5.
[8] AFFUL-DADZIE, E., NABARESEH, S., KOMÍNKOVÁ OPLATKOVÁ, Z.
Patterns and Trends in the Concept of Green Economy: A Text Mining
Approach. In Advances in Intelligent Systems and Computing. 285.
Heidelberg: Springer-Verlag Berlin, 2014, p. 143-154. ISSN 2194-5357.
ISBN 978-3-319-06739-1.
[9] AFFUL-DADZIE, E., NABARESEH, S., KOMÍNKOVÁ OPLATKOVÁ, Z.,
KLÍMEK, P. Enterprise Competitive Analysis and Consumer Sentiments on
Social Media: Insights from Telecommunication Companies. In DATA 2014
3rd International Conference on Data Management Technologies and
Applications. Wien : Springer Wien, 2014, p. 22-32. ISBN 978-989-758-035-
2.
[10] AFFUL-DADZIE, E., NABARESEH, S., KOMÍNKOVÁ OPLATKOVÁ,
Z. Fuzzy VIKOR Approach: Evaluating Quality of Internet Health
Information. In Federated Conference on Computer Science and Information
Systems. New Jersey, Piscataway : IEEE, 2014, p. 191-198. ISBN 978-83-
60810-57-6.
[11] AFFUL-DADZIE, E. PERFORMANCE EVALUATION OF THE
MILLENNIUM DEVELOPMENT GOALS USING FUZZY
COMPREHENSIVE EVALUATION METHOD. In MENDEL 2013 19th
International Conference on Soft Computing. Brno : Vysoké učení technické
v Brně, Fakulta strojního inženýrství, 2013, p. 265-272. ISSN 1803-3814.
ISBN 978-80-214-4755-4.
[12] NABARESEH, S., AFFUL-DADZIE, E., KLÍMEK, P. Security of electronic
transactions in developing countries: a cluster and decision tree mining
approach. In Proceedings of ICIME 2015. Academic Conference and
Publishing International Limited, 2015, ISBN 978-1-910810-08-8.
[13] AFFUL-DADZIE, E., KOMÍNKOVÁ OPLATKOVÁ, Z., NABARESEH,
S. Selecting start-up businesses in a public Venture capital financing using
Fuzzy PROMETHEE. In 19th International Conference on Knowledge-
Based and Intelligent Information & Engineering Systems, Procedia
Computer Science, 60, 63-72, 2015, ISSN: 1877-0509.
[14] AFFUL-DADZIE, E., KOMÍNKOVÁ OPLATKOVÁ, Z., NABARESEH,
S. Selecting Start-up Businesses in a Public Venture Capital with
Intuitionistic Fuzzy TOPSIS. In proceedings of International Conference on
Soft Computing and Applications, 2015.

128
[15] NABARESEH, S., AFFUL-DADZIE, E., KOMÍNKOVÁ OPLATKOVÁ,
Z., KLÍMEK, P. Selecting Countries for Developmental Aid Programs using
Fuzzy PROMETHEE. In proceedings of SAI Intelligent Systems
Conference, 2015.

129
Curriculum Vitae
Personal information
First name / Surname Eric Afful-Dadzie
Address Nam. T.G Masaryka 3050, 76001-Zlin
Telephone(s) +420 777 546 790 (personal)
Email(s) [email protected] (personal)
[email protected] (work)
Nationality Ghanaian
Date of birth 20. 09. 1981
Education and training Dates 2012 – present
Title of qualification awarded Ph.D.
Principal subjects/occupational
skills covered Engineering Informatics
Name and type of organisation
providing education and
training
Tomas Bata University in Zlín, Faculty of Applied Informatics
Education and training
Dates 2010 – 2012
Title of qualification awarded Ing. (M.Sc.)
Principal subjects/occupational
skills covered Systems Engineering and Informatics
Name and type of organisation
providing education and
training
Czech University of Life Sciences Prague
(Česká zemědělská univerzita v Praze)
Education and training
Dates 2002 – 2006
Title of qualification awarded B.Ed.
Principal subjects/occupational
skills covered Computer Science
Name and type of organisation
providing education and
training
University of Cape Coast - Ghana

130
Education and training
Dates 1997 – 1999
Title of qualification awarded Senior Secondary School Certificate Examination
Principal subjects/occupational
skills covered Elective Science
Name and type of organisation
providing education and
training
St. John’s School, Sekondi - Ghana
Personal skills and
competences
Mother tongue Fante
Other language(s)
Self-assessment Understanding Speaking Writing
English Listening Reading Spoken interaction Spoken
production
Advanced Advanced Pre-advanced Intermediate Advanced