CRISIL IER - CERA Sanitaryware Limited · PDF filemarketing-and-distribution agreement with...
28
CRISIL IER Independent Equity Research Enhancing investment decisions Cera Sanitaryware Ltd Detailed Report
Transcript of CRISIL IER - CERA Sanitaryware Limited · PDF filemarketing-and-distribution agreement with...
CRISIL IER Independent Equity Research
Enhancing investment decisions
Cera Sanitaryware Ltd
Detailed Report
Explanation of CRISIL Fundamental and Valuation (CFV) matrix
The CFV Matrix (CRISIL Fundamental and Valuation Matrix) addresses the two important analysis of an investment making process – Analysis
of Fundamentals (addressed through Fundamental Grade) and Analysis of Returns (Valuation Grade) The fundamental grade is assigned on a
five-point scale from grade 5 (indicating Excellent fundamentals) to grade 1 (Poor fundamentals) The valuation grade is assigned on a five-point
scale from grade 5 (indicating strong upside from the current market price (CMP)) to grade 1 (strong downside from the CMP).
CRISIL
Fundamental Grade Assessment
CRISIL
Valuation Grade Assessment
5/5 Excellent fundamentals 5/5 Strong upside (>25% from CMP)
4/5 Superior fundamentals 4/5 Upside (10-25% from CMP)
3/5 Good fundamentals 3/5 Align (+-10% from CMP)
2/5 Moderate fundamentals 2/5 Downside (negative 10-25% from CMP)
1/5 Poor fundamentals 1/5 Strong downside (<-25% from CMP)
Research Analysts
Bhaskar Bukrediwala
Kaushal Bothra
Sayan Das Sharma
Client servicing desk
+91 22 3342 3561
Cera Sanitaryware Ltd
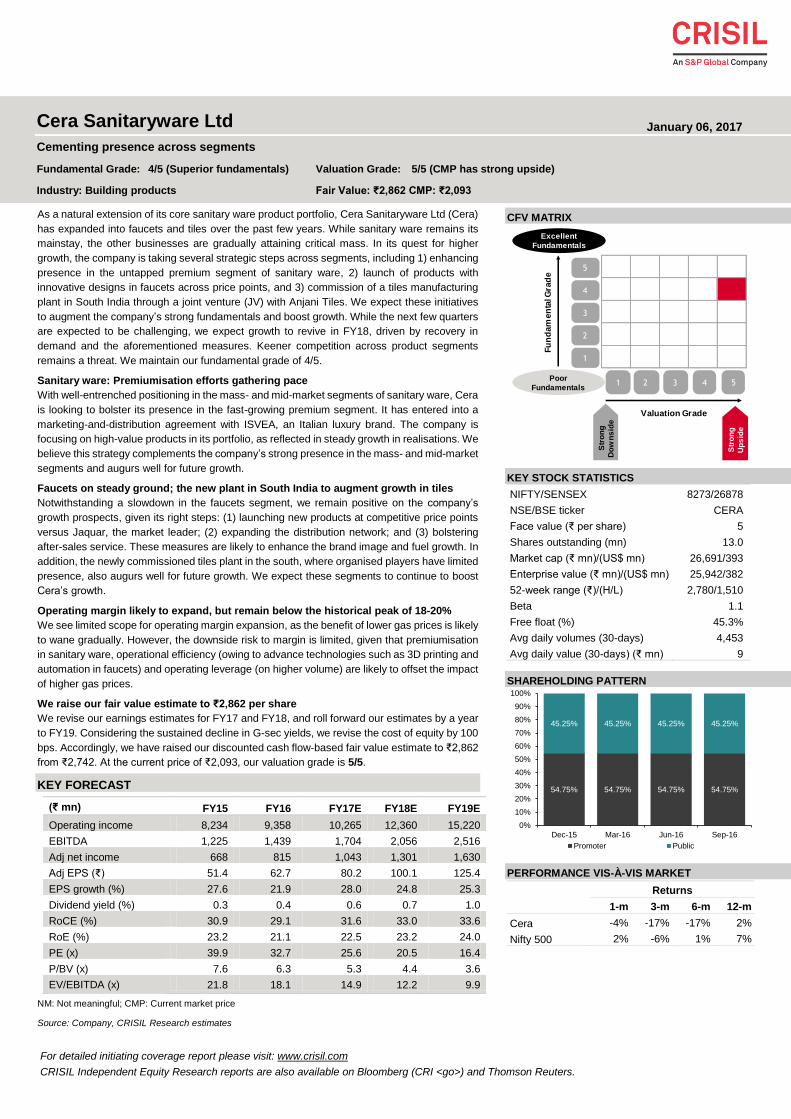
Cementing presence across segments
Fundamental Grade: 4/5 (Superior fundamentals) Valuation Grade: 5/5 (CMP has strong upside)
Industry: Building products Fair Value: ₹2,862 CMP: ₹2,093
January 06, 2017
For detailed initiating coverage report please visit: www.crisil.com
CRISIL Independent Equity Research reports are also available on Bloomberg (CRI <go>) and Thomson Reuters.
As a natural extension of its core sanitary ware product portfolio, Cera Sanitaryware Ltd (Cera)
has expanded into faucets and tiles over the past few years. While sanitary ware remains its
mainstay, the other businesses are gradually attaining critical mass. In its quest for higher
growth, the company is taking several strategic steps across segments, including 1) enhancing
presence in the untapped premium segment of sanitary ware, 2) launch of products with
innovative designs in faucets across price points, and 3) commission of a tiles manufacturing
plant in South India through a joint venture (JV) with Anjani Tiles. We expect these initiatives
to augment the company’s strong fundamentals and boost growth. While the next few quarters
are expected to be challenging, we expect growth to revive in FY18, driven by recovery in
demand and the aforementioned measures. Keener competition across product segments
remains a threat. We maintain our fundamental grade of 4/5.
Sanitary ware: Premiumisation efforts gathering pace
With well-entrenched positioning in the mass- and mid-market segments of sanitary ware, Cera
is looking to bolster its presence in the fast-growing premium segment. It has entered into a
marketing-and-distribution agreement with ISVEA, an Italian luxury brand. The company is
focusing on high-value products in its portfolio, as reflected in steady growth in realisations. We
believe this strategy complements the company’s strong presence in the mass- and mid-market
segments and augurs well for future growth.
Faucets on steady ground; the new plant in South India to augment growth in tiles
Notwithstanding a slowdown in the faucets segment, we remain positive on the company’s
growth prospects, given its right steps: (1) launching new products at competitive price points
versus Jaquar, the market leader; (2) expanding the distribution network; and (3) bolstering
after-sales service. These measures are likely to enhance the brand image and fuel growth. In
addition, the newly commissioned tiles plant in the south, where organised players have limited
presence, also augurs well for future growth. We expect these segments to continue to boost
Cera’s growth.
Operating margin likely to expand, but remain below the historical peak of 18-20%
We see limited scope for operating margin expansion, as the benefit of lower gas prices is likely
to wane gradually. However, the downside risk to margin is limited, given that premiumisation
in sanitary ware, operational efficiency (owing to advance technologies such as 3D printing and
automation in faucets) and operating leverage (on higher volume) are likely to offset the impact
of higher gas prices.
We raise our fair value estimate to ₹2,862 per share
We revise our earnings estimates for FY17 and FY18, and roll forward our estimates by a year
to FY19. Considering the sustained decline in G-sec yields, we revise the cost of equity by 100
bps. Accordingly, we have raised our discounted cash flow-based fair value estimate to ₹2,862
from ₹2,742. At the current price of ₹2,093, our valuation grade is 5/5.
KEY FORECAST
(₹ mn) FY15 FY16 FY17E FY18E FY19E
Operating income 8,234 9,358 10,265 12,360 15,220
EBITDA 1,225 1,439 1,704 2,056 2,516
Adj net income 668 815 1,043 1,301 1,630
Adj EPS (₹) 51.4 62.7 80.2 100.1 125.4
EPS growth (%) 27.6 21.9 28.0 24.8 25.3
Dividend yield (%) 0.3 0.4 0.6 0.7 1.0
RoCE (%) 30.9 29.1 31.6 33.0 33.6
RoE (%) 23.2 21.1 22.5 23.2 24.0
PE (x) 39.9 32.7 25.6 20.5 16.4
P/BV (x) 7.6 6.3 5.3 4.4 3.6
EV/EBITDA (x) 21.8 18.1 14.9 12.2 9.9
NM: Not meaningful; CMP: Current market price
Source: Company, CRISIL Research estimates
CFV MATRIX
KEY STOCK STATISTICS
NIFTY/SENSEX 8273/26878
NSE/BSE ticker CERA
Face value (₹ per share) 5
Shares outstanding (mn) 13.0
Market cap (₹ mn)/(US$ mn) 26,691/393
Enterprise value (₹ mn)/(US$ mn) 25,942/382
52-week range (₹)/(H/L) 2,780/1,510
Beta 1.1
Free float (%) 45.3%
Avg daily volumes (30-days) 4,453
Avg daily value (30-days) (₹ mn) 9
SHAREHOLDING PATTERN
PERFORMANCE VIS-À-VIS MARKET
Returns
1-m 3-m 6-m 12-m
Cera -4% -17% -17% 2%
Nifty 500 2% -6% 1% 7%
1 2 3 4 5
1
2
3
4
5
Valuation Grade
Fu
nd
am
en
tal G
rad
e
Poor
Fundamentals
Excellent
Fundamentals
Str
on
g
Do
wn
sid
e
Str
on
g
Up
sid
e
54.75% 54.75% 54.75% 54.75%
45.25% 45.25% 45.25% 45.25%
0%
10%
20%
30%
40%
50%
60%
70%
80%
90%
100%
Dec-15 Mar-16 Jun-16 Sep-16
Promoter Public
2
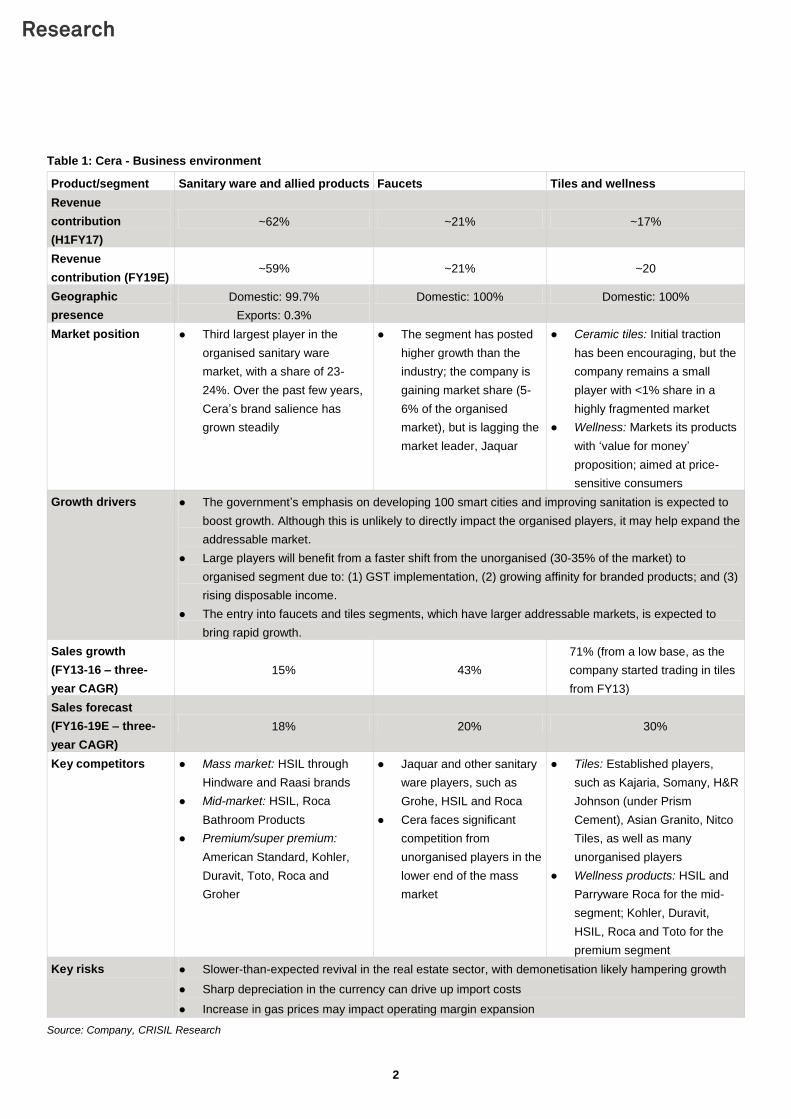
Table 1: Cera - Business environment
Product/segment Sanitary ware and allied products Faucets Tiles and wellness
Revenue
contribution
(H1FY17)
~62% ~21% ~17%
Revenue
contribution (FY19E) ~59% ~21% ~20
Geographic
presence
Domestic: 99.7%
Exports: 0.3%
Domestic: 100% Domestic: 100%
Market position ● Third largest player in the
organised sanitary ware
market, with a share of 23-
24%. Over the past few years,
Cera’s brand salience has
grown steadily
● The segment has posted
higher growth than the
industry; the company is
gaining market share (5-
6% of the organised
market), but is lagging the
market leader, Jaquar
● Ceramic tiles: Initial traction
has been encouraging, but the
company remains a small
player with <1% share in a
highly fragmented market
● Wellness: Markets its products
with ‘value for money’
proposition; aimed at price-
sensitive consumers
Growth drivers ● The government’s emphasis on developing 100 smart cities and improving sanitation is expected to
boost growth. Although this is unlikely to directly impact the organised players, it may help expand the
addressable market.
● Large players will benefit from a faster shift from the unorganised (30-35% of the market) to
organised segment due to: (1) GST implementation, (2) growing affinity for branded products; and (3)
rising disposable income.
● The entry into faucets and tiles segments, which have larger addressable markets, is expected to
bring rapid growth.
Sales growth
(FY13-16 – three-
year CAGR)
15% 43%
71% (from a low base, as the
company started trading in tiles
from FY13)
Sales forecast
(FY16-19E – three-
year CAGR)
18% 20% 30%
Key competitors ● Mass market: HSIL through
Hindware and Raasi brands
● Mid-market: HSIL, Roca
Bathroom Products
● Premium/super premium:
American Standard, Kohler,
Duravit, Toto, Roca and
Groher
● Jaquar and other sanitary
ware players, such as
Grohe, HSIL and Roca
● Cera faces significant
competition from
unorganised players in the
lower end of the mass
market
● Tiles: Established players,
such as Kajaria, Somany, H&R
Johnson (under Prism
Cement), Asian Granito, Nitco
Tiles, as well as many
unorganised players
● Wellness products: HSIL and
Parryware Roca for the mid-
segment; Kohler, Duravit,
HSIL, Roca and Toto for the
premium segment
Key risks ● Slower-than-expected revival in the real estate sector, with demonetisation likely hampering growth
● Sharp depreciation in the currency can drive up import costs
● Increase in gas prices may impact operating margin expansion
Source: Company, CRISIL Research
3
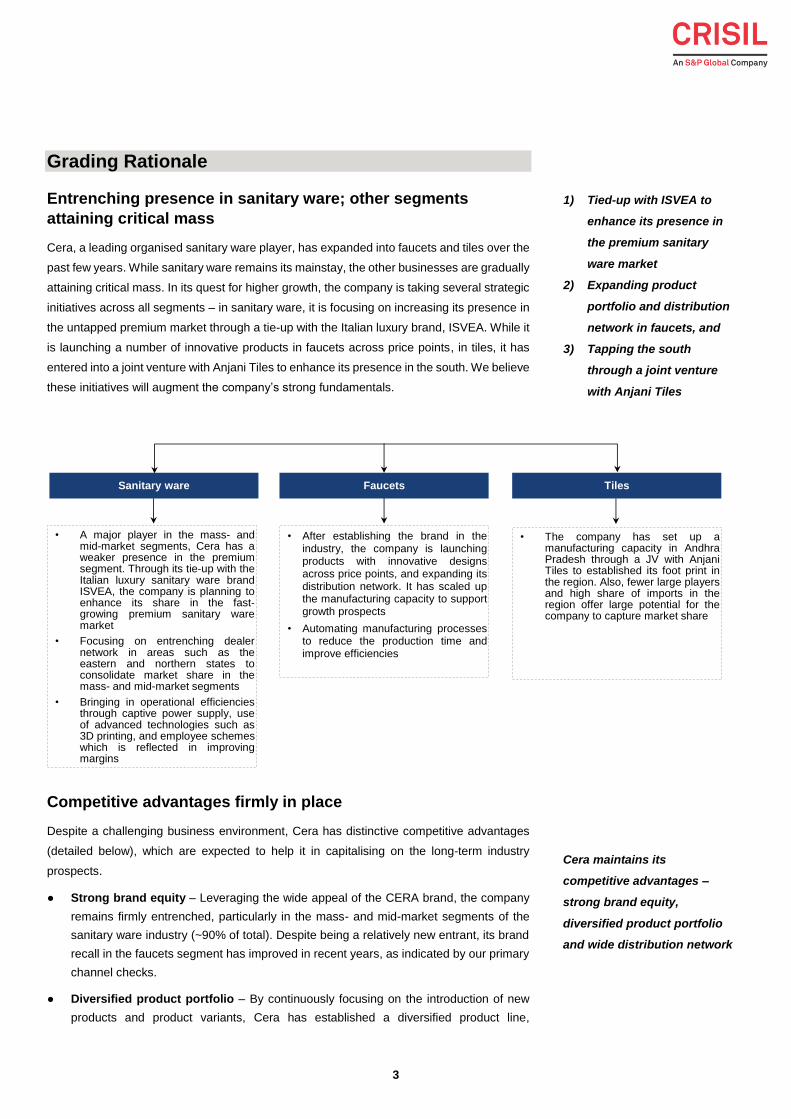
Grading Rationale
Entrenching presence in sanitary ware; other segments
attaining critical mass
Cera, a leading organised sanitary ware player, has expanded into faucets and tiles over the
past few years. While sanitary ware remains its mainstay, the other businesses are gradually
attaining critical mass. In its quest for higher growth, the company is taking several strategic
initiatives across all segments – in sanitary ware, it is focusing on increasing its presence in
the untapped premium market through a tie-up with the Italian luxury brand, ISVEA. While it
is launching a number of innovative products in faucets across price points, in tiles, it has
entered into a joint venture with Anjani Tiles to enhance its presence in the south. We believe
these initiatives will augment the company’s strong fundamentals.
Competitive advantages firmly in place
Despite a challenging business environment, Cera has distinctive competitive advantages
(detailed below), which are expected to help it in capitalising on the long-term industry
prospects.
● Strong brand equity – Leveraging the wide appeal of the CERA brand, the company
remains firmly entrenched, particularly in the mass- and mid-market segments of the
sanitary ware industry (~90% of total). Despite being a relatively new entrant, its brand
recall in the faucets segment has improved in recent years, as indicated by our primary
channel checks.
● Diversified product portfolio – By continuously focusing on the introduction of new
products and product variants, Cera has established a diversified product line,
Sanitary ware Faucets Tiles
• A major player in the mass- andmid-market segments, Cera has aweaker presence in the premiumsegment. Through its tie-up with theItalian luxury sanitary ware brandISVEA, the company is planning toenhance its share in the fast-growing premium sanitary waremarket
• Focusing on entrenching dealernetwork in areas such as theeastern and northern states toconsolidate market share in themass- and mid-market segments
• Bringing in operational efficienciesthrough captive power supply, useof advanced technologies such as3D printing, and employee schemeswhich is reflected in improvingmargins
• After establishing the brand in theindustry, the company is launchingproducts with innovative designsacross price points, and expanding itsdistribution network. It has scaled upthe manufacturing capacity to supportgrowth prospects
• Automating manufacturing processesto reduce the production time andimprove efficiencies
• The company has set up amanufacturing capacity in AndhraPradesh through a JV with AnjaniTiles to established its foot print inthe region. Also, fewer large playersand high share of imports in theregion offer large potential for thecompany to capture market share
Cera maintains its
competitive advantages –
strong brand equity,
diversified product portfolio
and wide distribution network
1) Tied-up with ISVEA to
enhance its presence in
the premium sanitary
ware market
2) Expanding product
portfolio and distribution
network in faucets, and
3) Tapping the south
through a joint venture
with Anjani Tiles
4
encompassing the entire range of sanitary ware, faucets and tiles. With presence across
categories and price points, Cera has emerged as a one-stop shop for all bathroom-
related products.
● Wide distribution network – Over the years, the company has expanded its
distribution network across the country. It currently has ~1,600 distributors/dealers and
16,000 retailers (vis-à-vis ~600 dealers and 6,000 retailers in FY11). The company also
established 10 Cera style studios in metros and tier-1 cities to promote ‘concept
bathrooms’ and enhance its presence in premium category. Although it lacks the scale
of market leaders, HSIL (>3,000 dealers) and Jaquar (~2,000 dealers), the wide
distribution reach is an advantage vis-à-vis smaller organised players and unorganised
players.
● Robust financials – These advantages translate into strong financials for the company,
characterised by a lean working capital cycle, healthy cash flow generation, superior
RoCE and low financial leverage. We believe the company’s strong financials keep it
less vulnerable to external shocks and provide more headroom for future growth.
Robust long-term opportunity outshines bleak near-term
industry outlook
Prolonged slowdown in end-user demand to mar near-term growth
prospects of the building products industry…
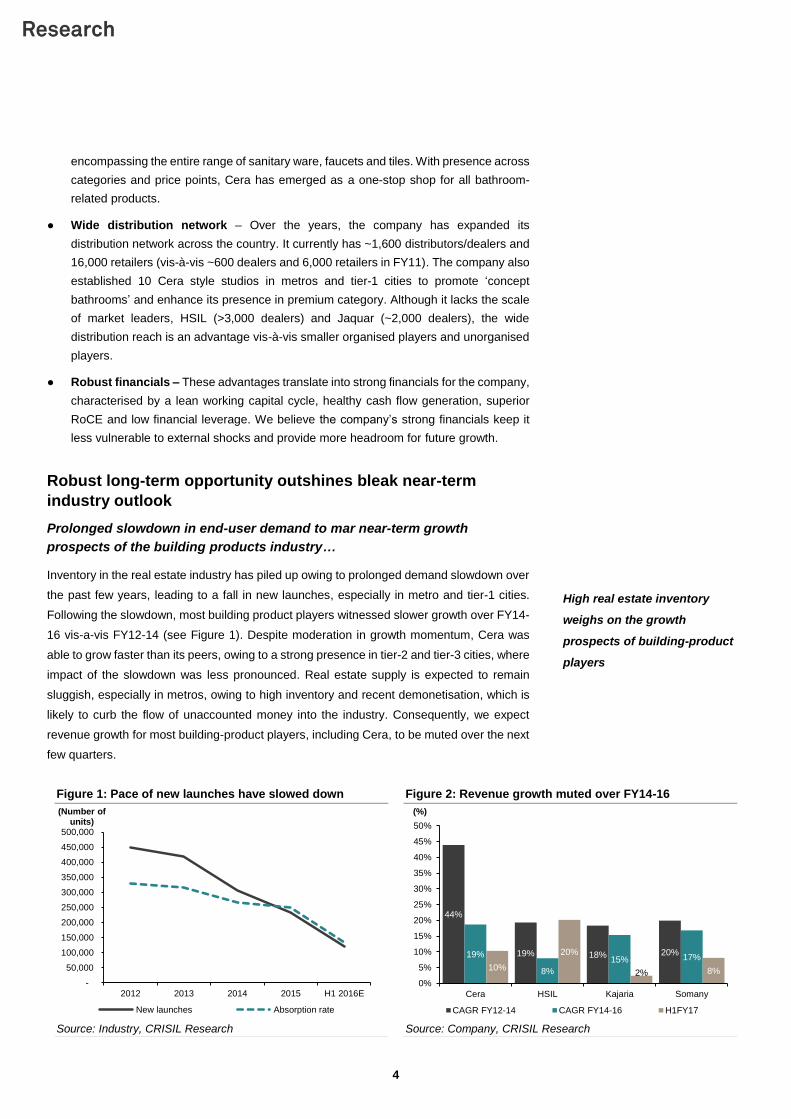
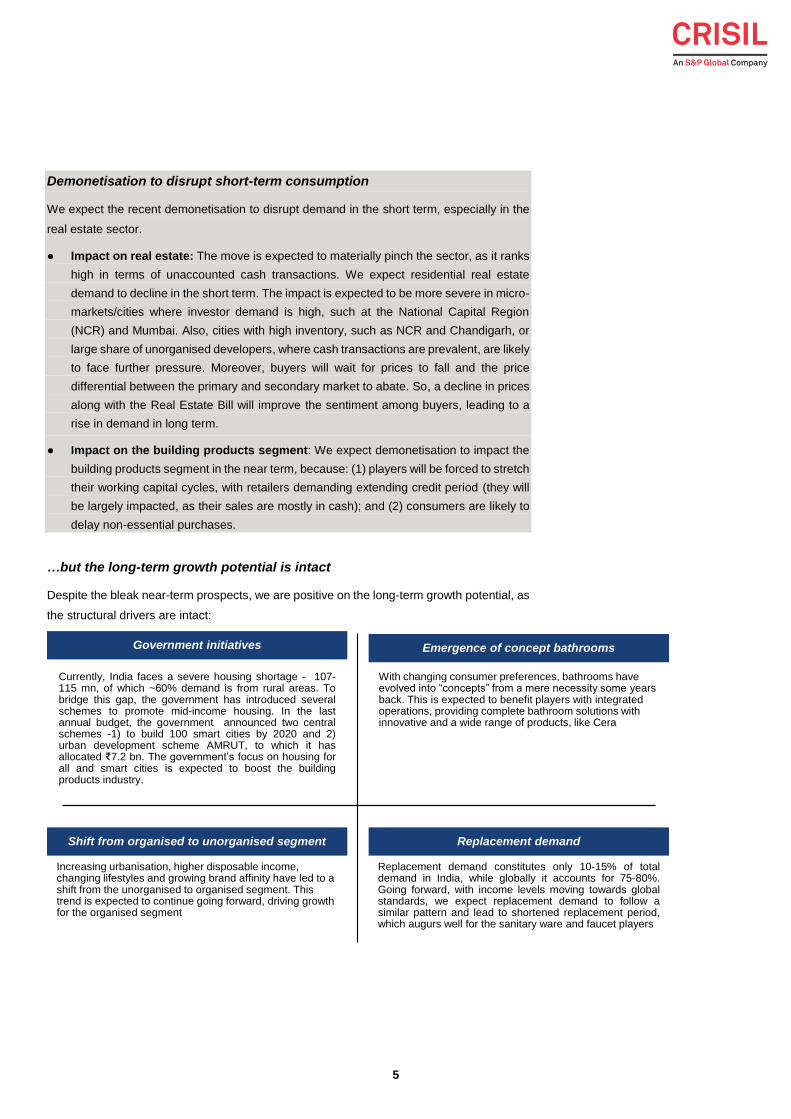
Inventory in the real estate industry has piled up owing to prolonged demand slowdown over
the past few years, leading to a fall in new launches, especially in metro and tier-1 cities.
Following the slowdown, most building product players witnessed slower growth over FY14-
16 vis-a-vis FY12-14 (see Figure 1). Despite moderation in growth momentum, Cera was
able to grow faster than its peers, owing to a strong presence in tier-2 and tier-3 cities, where
impact of the slowdown was less pronounced. Real estate supply is expected to remain
sluggish, especially in metros, owing to high inventory and recent demonetisation, which is
likely to curb the flow of unaccounted money into the industry. Consequently, we expect
revenue growth for most building-product players, including Cera, to be muted over the next
few quarters.
Figure 1: Pace of new launches have slowed down Figure 2: Revenue growth muted over FY14-16
Source: Industry, CRISIL Research Source: Company, CRISIL Research
-
50,000
100,000
150,000
200,000
250,000
300,000
350,000
400,000
450,000
500,000
2012 2013 2014 2015 H1 2016E
(Number of units)
New launches Absorption rate
44%
19% 18% 20%19%
8%
15% 17%10%
20%
2% 8%
0%
5%
10%
15%
20%
25%
30%
35%
40%
45%
50%
Cera HSIL Kajaria Somany
(%)
CAGR FY12-14 CAGR FY14-16 H1FY17
High real estate inventory
weighs on the growth
prospects of building-product
players
5
Demonetisation to disrupt short-term consumption
We expect the recent demonetisation to disrupt demand in the short term, especially in the
real estate sector.
● Impact on real estate: The move is expected to materially pinch the sector, as it ranks
high in terms of unaccounted cash transactions. We expect residential real estate
demand to decline in the short term. The impact is expected to be more severe in micro-
markets/cities where investor demand is high, such at the National Capital Region
(NCR) and Mumbai. Also, cities with high inventory, such as NCR and Chandigarh, or
large share of unorganised developers, where cash transactions are prevalent, are likely
to face further pressure. Moreover, buyers will wait for prices to fall and the price
differential between the primary and secondary market to abate. So, a decline in prices
along with the Real Estate Bill will improve the sentiment among buyers, leading to a
rise in demand in long term.
● Impact on the building products segment: We expect demonetisation to impact the
building products segment in the near term, because: (1) players will be forced to stretch
their working capital cycles, with retailers demanding extending credit period (they will
be largely impacted, as their sales are mostly in cash); and (2) consumers are likely to
delay non-essential purchases.
…but the long-term growth potential is intact
Despite the bleak near-term prospects, we are positive on the long-term growth potential, as
the structural drivers are intact:
Government initiatives Emergence of concept bathrooms
Currently, India faces a severe housing shortage - 107-115 mn, of which ~60% demand is from rural areas. Tobridge this gap, the government has introduced severalschemes to promote mid-income housing. In the lastannual budget, the government announced two centralschemes -1) to build 100 smart cities by 2020 and 2)urban development scheme AMRUT, to which it hasallocated ₹7.2 bn. The government’s focus on housing forall and smart cities is expected to boost the buildingproducts industry.
With changing consumer preferences, bathrooms have evolved into “concepts” from a mere necessity some years back. This is expected to benefit players with integrated operations, providing complete bathroom solutions with innovative and a wide range of products, like Cera
Shift from organised to unorganised segment
Increasing urbanisation, higher disposable income, changing lifestyles and growing brand affinity have led to a shift from the unorganised to organised segment. This trend is expected to continue going forward, driving growth for the organised segment
Replacement demand
Replacement demand constitutes only 10-15% of totaldemand in India, while globally it accounts for 75-80%.Going forward, with income levels moving towards globalstandards, we expect replacement demand to follow asimilar pattern and lead to shortened replacement period,which augurs well for the sanitary ware and faucet players
6
Sanitary ware: Maintains the apex position in the mass market;
premiumisation efforts gathering pace
Cera maintains a strong market position in the mass market segment, because of its ‘value
for money’ proposition and a wide brand appeal. Currently, the company derives bulk of its
sanitary ware revenue from these segments. Competitive intensity is also relatively lower in
these segments because of the lower presence of foreign players. Led by various
government schemes, such as affordable housing, and the shift in consumer sentiment
towards organised players, we expect this segment to grow at a steady pace.
Tapping the premium segment with the ISVEA tie-up, market share gain is a
key monitorable
As highlighted in our previous reports, the company did not have a second brand to cater to
the premium market, and the mass-market perception associated with the CERA brand
limited its ability to compete with the leading domestic and premium brands. Although the
segment accounts for only ~10% of the sanitary ware market, it is one of the fastest growing.
The company has addressed this concern through its marketing-and-distribution agreement
with the Italian company, ECE Banyo, manufacturer of the luxury sanitary ware brand,
ISVEA. We understand that Cera is currently in the process of a pan-India launch of ISVEA’s
products. While we believe this is a step in the right direction, the company’s ability to gain
a substantial market share in this highly competitive segment - characterised by the
presence of several domestic (HSIL and Parryware) and international players (Kohler, ToTo,
Duravit and American Standard) - is a monitorable.
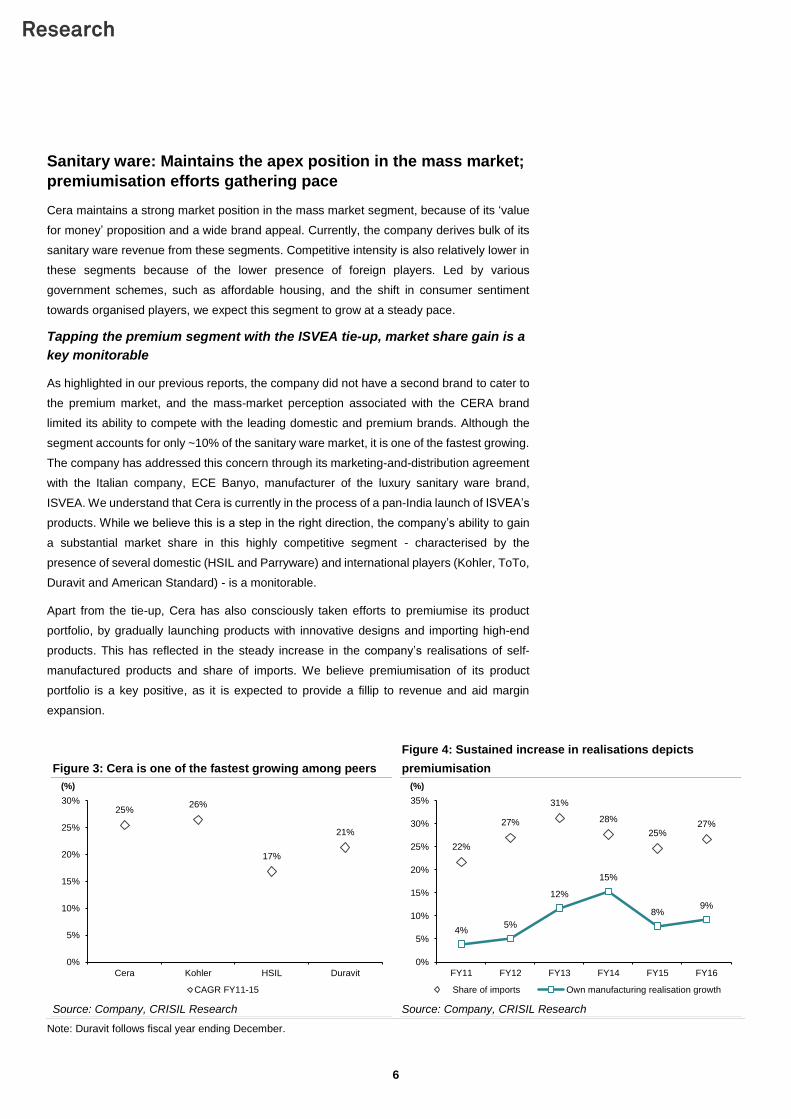
Apart from the tie-up, Cera has also consciously taken efforts to premiumise its product
portfolio, by gradually launching products with innovative designs and importing high-end
products. This has reflected in the steady increase in the company’s realisations of self-
manufactured products and share of imports. We believe premiumisation of its product
portfolio is a key positive, as it is expected to provide a fillip to revenue and aid margin
expansion.
Figure 3: Cera is one of the fastest growing among peers
Figure 4: Sustained increase in realisations depicts
premiumisation
Source: Company, CRISIL Research Source: Company, CRISIL Research
Note: Duravit follows fiscal year ending December.
25%26%
17%
21%
0%
5%
10%
15%
20%
25%
30%
Cera Kohler HSIL Duravit
(%)
CAGR FY11-15
22%
27%
31%
28%
25%27%
4%5%
12%
15%
8%9%
0%
5%
10%
15%
20%
25%
30%
35%
FY11 FY12 FY13 FY14 FY15 FY16
(%)
Share of imports Own manufacturing realisation growth
7
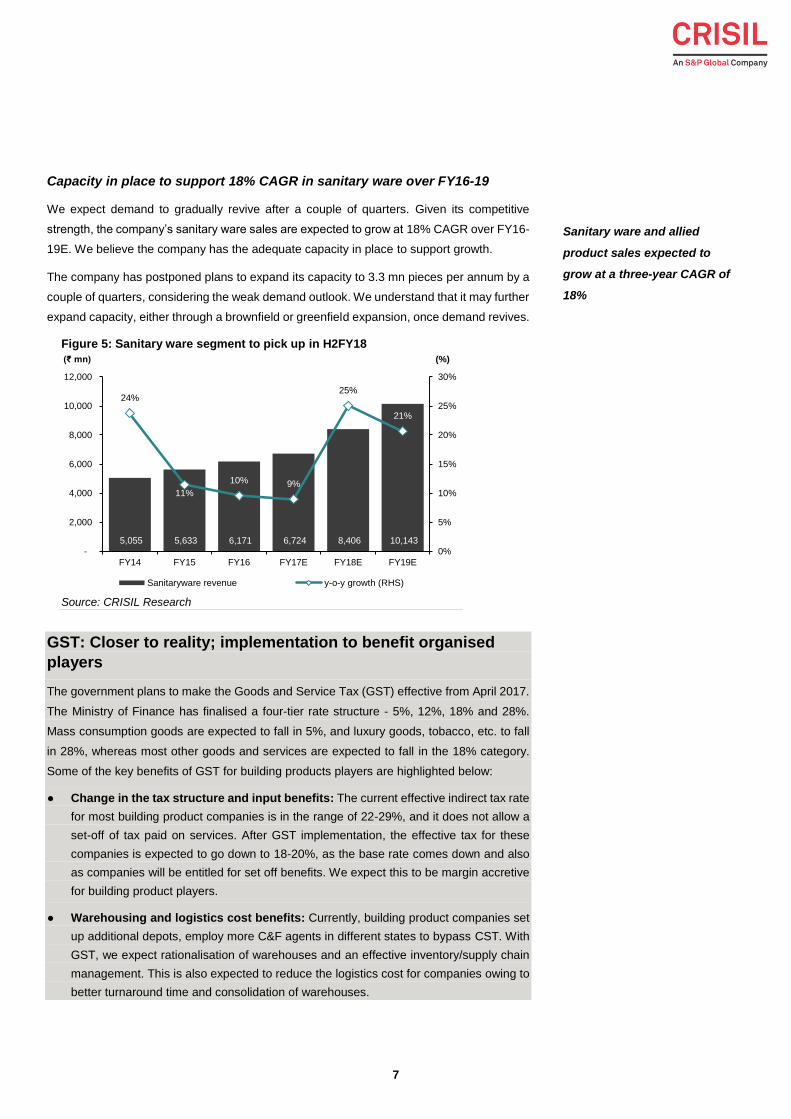
Capacity in place to support 18% CAGR in sanitary ware over FY16-19
We expect demand to gradually revive after a couple of quarters. Given its competitive
strength, the company’s sanitary ware sales are expected to grow at 18% CAGR over FY16-
19E. We believe the company has the adequate capacity in place to support growth.
The company has postponed plans to expand its capacity to 3.3 mn pieces per annum by a
couple of quarters, considering the weak demand outlook. We understand that it may further
expand capacity, either through a brownfield or greenfield expansion, once demand revives.
Figure 5: Sanitary ware segment to pick up in H2FY18
Source: CRISIL Research
GST: Closer to reality; implementation to benefit organised
players
The government plans to make the Goods and Service Tax (GST) effective from April 2017.
The Ministry of Finance has finalised a four-tier rate structure - 5%, 12%, 18% and 28%.
Mass consumption goods are expected to fall in 5%, and luxury goods, tobacco, etc. to fall
in 28%, whereas most other goods and services are expected to fall in the 18% category.
Some of the key benefits of GST for building products players are highlighted below:
● Change in the tax structure and input benefits: The current effective indirect tax rate
for most building product companies is in the range of 22-29%, and it does not allow a
set-off of tax paid on services. After GST implementation, the effective tax for these
companies is expected to go down to 18-20%, as the base rate comes down and also
as companies will be entitled for set off benefits. We expect this to be margin accretive
for building product players.
● Warehousing and logistics cost benefits: Currently, building product companies set
up additional depots, employ more C&F agents in different states to bypass CST. With
GST, we expect rationalisation of warehouses and an effective inventory/supply chain
management. This is also expected to reduce the logistics cost for companies owing to
better turnaround time and consolidation of warehouses.
5,055 5,633 6,171 6,724 8,406 10,143
24%
11%
10% 9%
25%
21%
0%
5%
10%
15%
20%
25%
30%
-
2,000
4,000
6,000
8,000
10,000
12,000
FY14 FY15 FY16 FY17E FY18E FY19E
(%)(₹ mn)
Sanitaryware revenue y-o-y growth (RHS)
Sanitary ware and allied
product sales expected to
grow at a three-year CAGR of
18%
8
● Shift from the unorganised to organised segment: Currently, the unorganised sector
accounts for 30-35% of the industry. The GST is expected to accelerate the shift towards
the organised segment, as the law is expected to reduce/eliminate tax sops enjoyed by
unorganised players, leading to higher compliance. We expect this to create a level-
playing field and benefit organised players such as Cera.
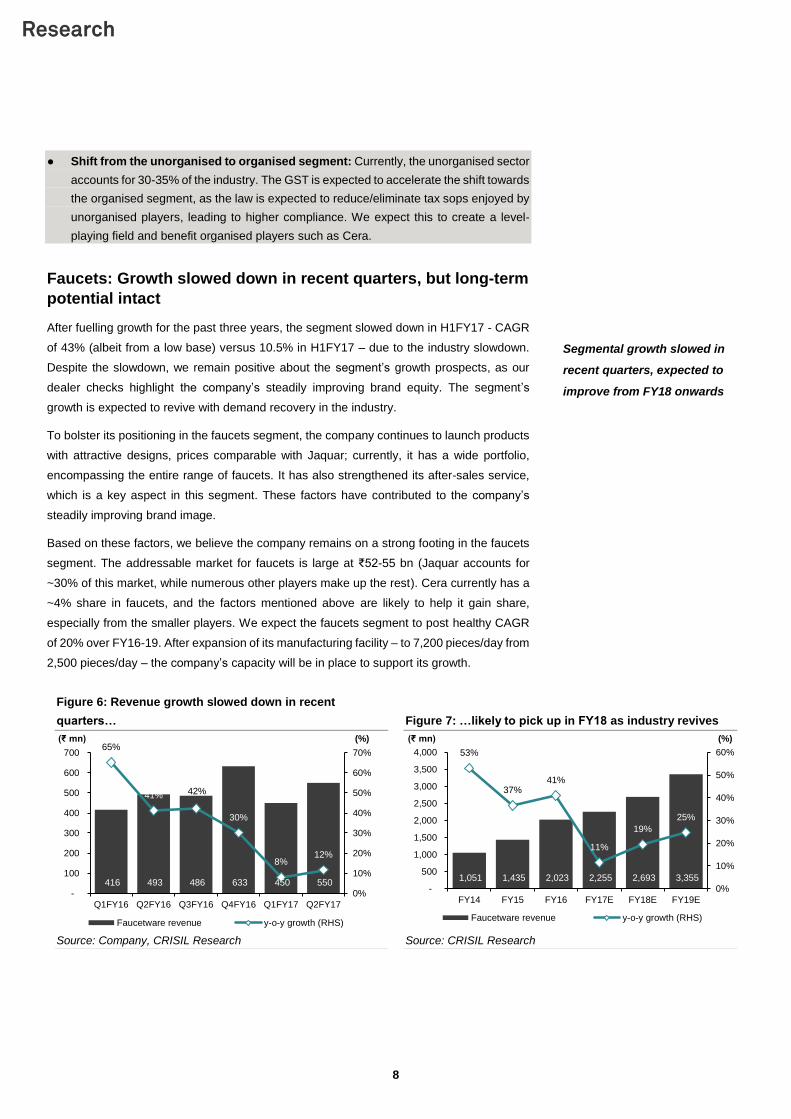
Faucets: Growth slowed down in recent quarters, but long-term
potential intact
After fuelling growth for the past three years, the segment slowed down in H1FY17 - CAGR
of 43% (albeit from a low base) versus 10.5% in H1FY17 – due to the industry slowdown.
Despite the slowdown, we remain positive about the segment’s growth prospects, as our
dealer checks highlight the company’s steadily improving brand equity. The segment’s
growth is expected to revive with demand recovery in the industry.
To bolster its positioning in the faucets segment, the company continues to launch products
with attractive designs, prices comparable with Jaquar; currently, it has a wide portfolio,
encompassing the entire range of faucets. It has also strengthened its after-sales service,
which is a key aspect in this segment. These factors have contributed to the company’s
steadily improving brand image.
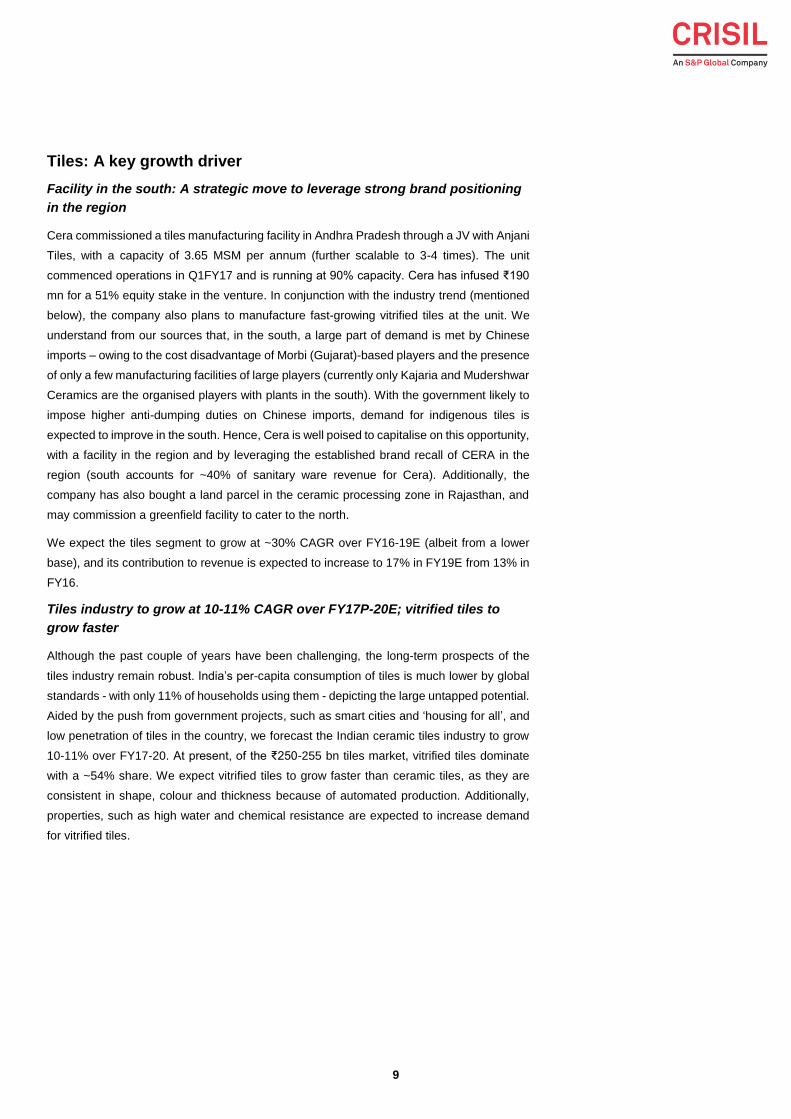
Based on these factors, we believe the company remains on a strong footing in the faucets
segment. The addressable market for faucets is large at ₹52-55 bn (Jaquar accounts for
~30% of this market, while numerous other players make up the rest). Cera currently has a
~4% share in faucets, and the factors mentioned above are likely to help it gain share,
especially from the smaller players. We expect the faucets segment to post healthy CAGR
of 20% over FY16-19. After expansion of its manufacturing facility – to 7,200 pieces/day from
2,500 pieces/day – the company’s capacity will be in place to support its growth.
Figure 6: Revenue growth slowed down in recent
quarters… Figure 7: …likely to pick up in FY18 as industry revives
Source: Company, CRISIL Research Source: CRISIL Research
416 493 486 633 450 550
65%
41% 42%
30%
8%12%
0%
10%
20%
30%
40%
50%
60%
70%
-
100
200
300
400
500
600
700
Q1FY16 Q2FY16 Q3FY16 Q4FY16 Q1FY17 Q2FY17
(%)(₹ mn)
Faucetware revenue y-o-y growth (RHS)
1,051 1,435 2,023 2,255 2,693 3,355
53%
37%41%
11%
19%
25%
0%
10%
20%
30%
40%
50%
60%
-
500
1,000
1,500
2,000
2,500
3,000
3,500
4,000
FY14 FY15 FY16 FY17E FY18E FY19E
(%)(₹ mn)
Faucetware revenue y-o-y growth (RHS)
Segmental growth slowed in
recent quarters, expected to
improve from FY18 onwards
9
Tiles: A key growth driver
Facility in the south: A strategic move to leverage strong brand positioning
in the region
Cera commissioned a tiles manufacturing facility in Andhra Pradesh through a JV with Anjani
Tiles, with a capacity of 3.65 MSM per annum (further scalable to 3-4 times). The unit
commenced operations in Q1FY17 and is running at 90% capacity. Cera has infused ₹190
mn for a 51% equity stake in the venture. In conjunction with the industry trend (mentioned
below), the company also plans to manufacture fast-growing vitrified tiles at the unit. We
understand from our sources that, in the south, a large part of demand is met by Chinese
imports – owing to the cost disadvantage of Morbi (Gujarat)-based players and the presence
of only a few manufacturing facilities of large players (currently only Kajaria and Mudershwar
Ceramics are the organised players with plants in the south). With the government likely to
impose higher anti-dumping duties on Chinese imports, demand for indigenous tiles is
expected to improve in the south. Hence, Cera is well poised to capitalise on this opportunity,
with a facility in the region and by leveraging the established brand recall of CERA in the
region (south accounts for ~40% of sanitary ware revenue for Cera). Additionally, the
company has also bought a land parcel in the ceramic processing zone in Rajasthan, and
may commission a greenfield facility to cater to the north.
We expect the tiles segment to grow at ~30% CAGR over FY16-19E (albeit from a lower
base), and its contribution to revenue is expected to increase to 17% in FY19E from 13% in
FY16.
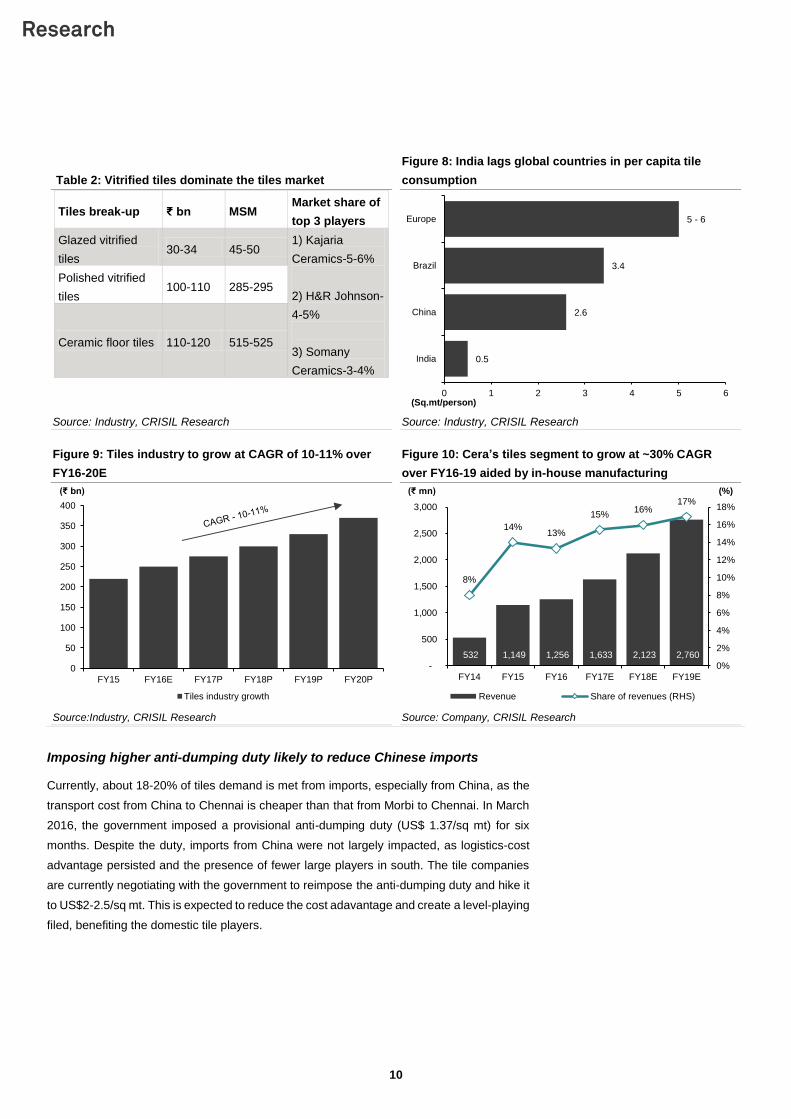
Tiles industry to grow at 10-11% CAGR over FY17P-20E; vitrified tiles to
grow faster
Although the past couple of years have been challenging, the long-term prospects of the
tiles industry remain robust. India’s per-capita consumption of tiles is much lower by global
standards - with only 11% of households using them - depicting the large untapped potential.
Aided by the push from government projects, such as smart cities and ‘housing for all’, and
low penetration of tiles in the country, we forecast the Indian ceramic tiles industry to grow
10-11% over FY17-20. At present, of the ₹250-255 bn tiles market, vitrified tiles dominate
with a ~54% share. We expect vitrified tiles to grow faster than ceramic tiles, as they are
consistent in shape, colour and thickness because of automated production. Additionally,
properties, such as high water and chemical resistance are expected to increase demand
for vitrified tiles.
10
Table 2: Vitrified tiles dominate the tiles market
Figure 8: India lags global countries in per capita tile
consumption
Tiles break-up ₹ bn MSM Market share of
top 3 players
Glazed vitrified
tiles 30-34 45-50
1) Kajaria
Ceramics-5-6%
2) H&R Johnson-
4-5%
3) Somany
Ceramics-3-4%
Polished vitrified
tiles 100-110 285-295
Ceramic floor tiles 110-120 515-525
Source: Industry, CRISIL Research Source: Industry, CRISIL Research
Figure 9: Tiles industry to grow at CAGR of 10-11% over
FY16-20E
Figure 10: Cera’s tiles segment to grow at ~30% CAGR
over FY16-19 aided by in-house manufacturing
Source:Industry, CRISIL Research Source: Company, CRISIL Research
Imposing higher anti-dumping duty likely to reduce Chinese imports
Currently, about 18-20% of tiles demand is met from imports, especially from China, as the
transport cost from China to Chennai is cheaper than that from Morbi to Chennai. In March
2016, the government imposed a provisional anti-dumping duty (US$ 1.37/sq mt) for six
months. Despite the duty, imports from China were not largely impacted, as logistics-cost
advantage persisted and the presence of fewer large players in south. The tile companies
are currently negotiating with the government to reimpose the anti-dumping duty and hike it
to US$2-2.5/sq mt. This is expected to reduce the cost adavantage and create a level-playing
filed, benefiting the domestic tile players.
0.5
2.6
3.4
5 - 6
0 1 2 3 4 5 6
India
China
Brazil
Europe
(Sq.mt/person)
0
50
100
150
200
250
300
350
400
FY15 FY16E FY17P FY18P FY19P FY20P
(₹ bn)
Tiles industry growth
532 1,149 1,256 1,633 2,123 2,760
8%
14%13%
15%16%
17%
0%
2%
4%
6%
8%
10%
12%
14%
16%
18%
-
500
1,000
1,500
2,000
2,500
3,000
FY14 FY15 FY16 FY17E FY18E FY19E
(%)(₹ mn)
Revenue Share of revenues (RHS)
11
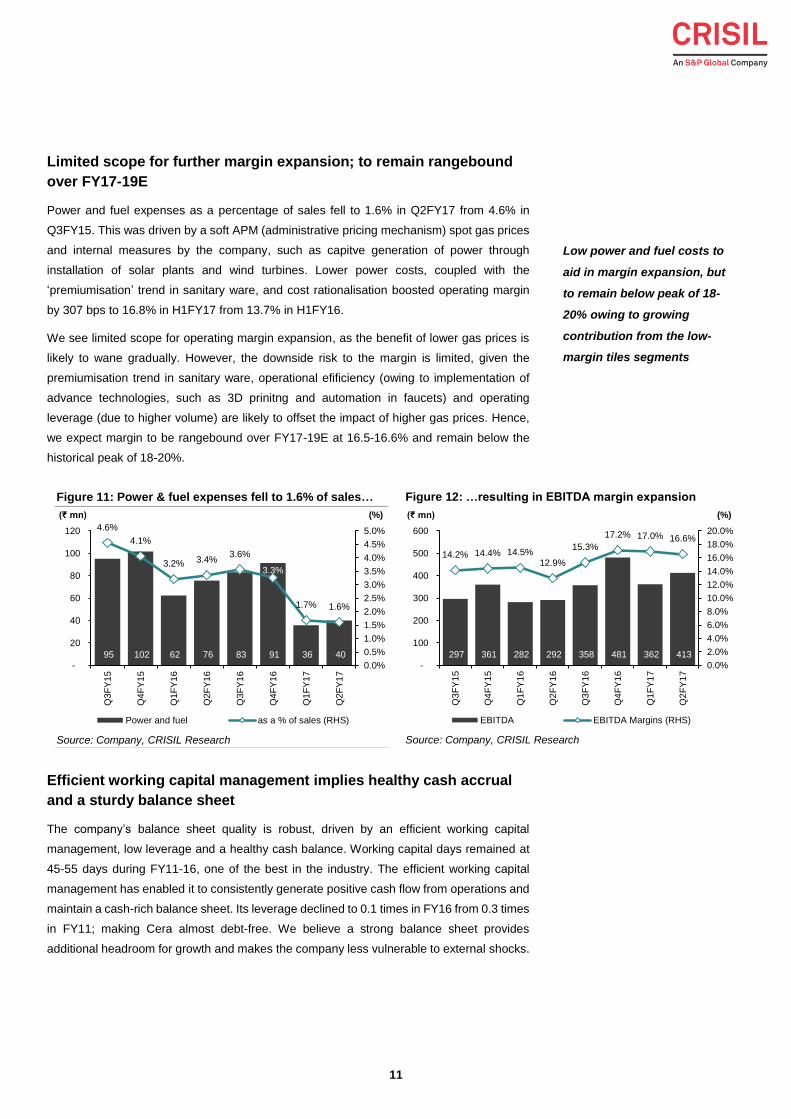
Limited scope for further margin expansion; to remain rangebound
over FY17-19E
Power and fuel expenses as a percentage of sales fell to 1.6% in Q2FY17 from 4.6% in
Q3FY15. This was driven by a soft APM (administrative pricing mechanism) spot gas prices
and internal measures by the company, such as capitve generation of power through
installation of solar plants and wind turbines. Lower power costs, coupled with the
‘premiumisation’ trend in sanitary ware, and cost rationalisation boosted operating margin
by 307 bps to 16.8% in H1FY17 from 13.7% in H1FY16.
We see limited scope for operating margin expansion, as the benefit of lower gas prices is
likely to wane gradually. However, the downside risk to the margin is limited, given the
premiumisation trend in sanitary ware, operational efificiency (owing to implementation of
advance technologies, such as 3D prinitng and automation in faucets) and operating
leverage (due to higher volume) are likely to offset the impact of higher gas prices. Hence,
we expect margin to be rangebound over FY17-19E at 16.5-16.6% and remain below the
historical peak of 18-20%.
Figure 11: Power & fuel expenses fell to 1.6% of sales… Figure 12: …resulting in EBITDA margin expansion
Source: Company, CRISIL Research Source: Company, CRISIL Research
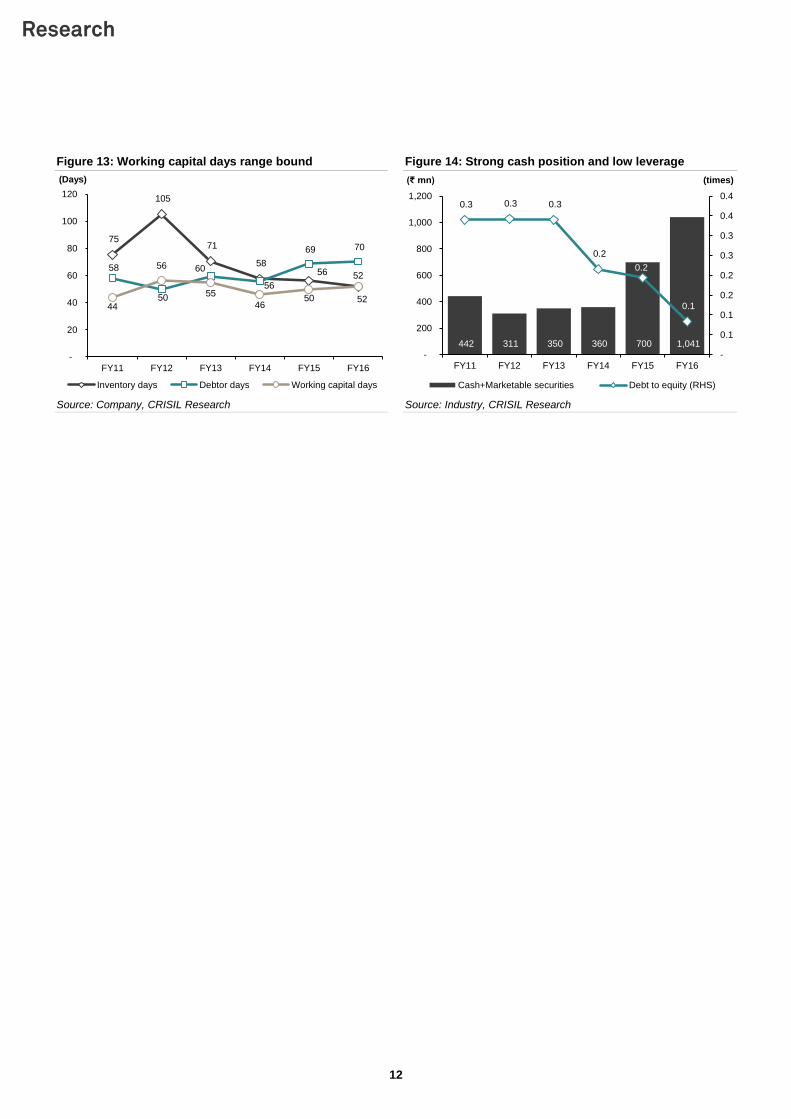
Efficient working capital management implies healthy cash accrual
and a sturdy balance sheet
The company’s balance sheet quality is robust, driven by an efficient working capital
management, low leverage and a healthy cash balance. Working capital days remained at
45-55 days during FY11-16, one of the best in the industry. The efficient working capital
management has enabled it to consistently generate positive cash flow from operations and
maintain a cash-rich balance sheet. Its leverage declined to 0.1 times in FY16 from 0.3 times
in FY11; making Cera almost debt-free. We believe a strong balance sheet provides
additional headroom for growth and makes the company less vulnerable to external shocks.
95 102 62 76 83 91 36 40
4.6%
4.1%
3.2% 3.4%3.6%
3.3%
1.7% 1.6%
0.0%
0.5%
1.0%
1.5%
2.0%
2.5%
3.0%
3.5%
4.0%
4.5%
5.0%
-
20
40
60
80
100
120
Q3
FY
15
Q4
FY
15
Q1
FY
16
Q2
FY
16
Q3
FY
16
Q4
FY
16
Q1
FY
17
Q2
FY
17
(%)(₹ mn)
Power and fuel as a % of sales (RHS)
297 361 282 292 358 481 362 413
14.2% 14.4% 14.5%12.9%
15.3%
17.2% 17.0% 16.6%
0.0%
2.0%
4.0%
6.0%
8.0%
10.0%
12.0%
14.0%
16.0%
18.0%
20.0%
-
100
200
300
400
500
600
Q3
FY
15
Q4
FY
15
Q1
FY
16
Q2
FY
16
Q3
FY
16
Q4
FY
16
Q1
FY
17
Q2
FY
17
(%)(₹ mn)
EBITDA EBITDA Margins (RHS)
Low power and fuel costs to
aid in margin expansion, but
to remain below peak of 18-
20% owing to growing
contribution from the low-
margin tiles segments
12
Figure 13: Working capital days range bound Figure 14: Strong cash position and low leverage
Source: Company, CRISIL Research Source: Industry, CRISIL Research
75
105
71
58 56
52
58
50
60
56
69 70
44
56
55
4650
52
-
20
40
60
80
100
120
FY11 FY12 FY13 FY14 FY15 FY16
(Days)
Inventory days Debtor days Working capital days
442 311 350 360 700 1,041
0.3 0.3 0.3
0.2
0.2
0.1
-
0.1
0.1
0.2
0.2
0.3
0.3
0.4
0.4
-
200
400
600
800
1,000
1,200
FY11 FY12 FY13 FY14 FY15 FY16
(times)(₹ mn)
Cash+Marketable securities Debt to equity (RHS)
13
Key Risks
Slower-than-expected revival in real estate post
demonetisation may hamper growth
The prospects of the sanitary ware and faucet segments are linked to the macroeconomic
scenario, in general, and the real estate industry, in particular. Real estate supply shrunk
over FY13-16 across metros and tier-I cities, impacting growth in recent quarters.
Demonetisation is further expected to impact the real estate industry and disrupt
consumption in the short term. We expect the move to delay recovery by three to four
quarters. However, a slower-than-expected recovery may adversely impact growth.
Sudden increase in gas prices
Gas prices have been trending down for the past few quarters. Since gas prices are linked
closely to long-term contract rates, a rise in spot prices is expected to impact the company’s
profitability.
Sharp depreciation of rupee
Cera imports 20% of its raw materials, stores and spare parts. A sharp depreciation in the
rupee could drive up import cost. If the company is unable to pass on the cost increase, its
operating margin would be impacted.
A sustained slowdown in the
real estate industry may
impact the prospects of
sanitary ware and faucet
players
14
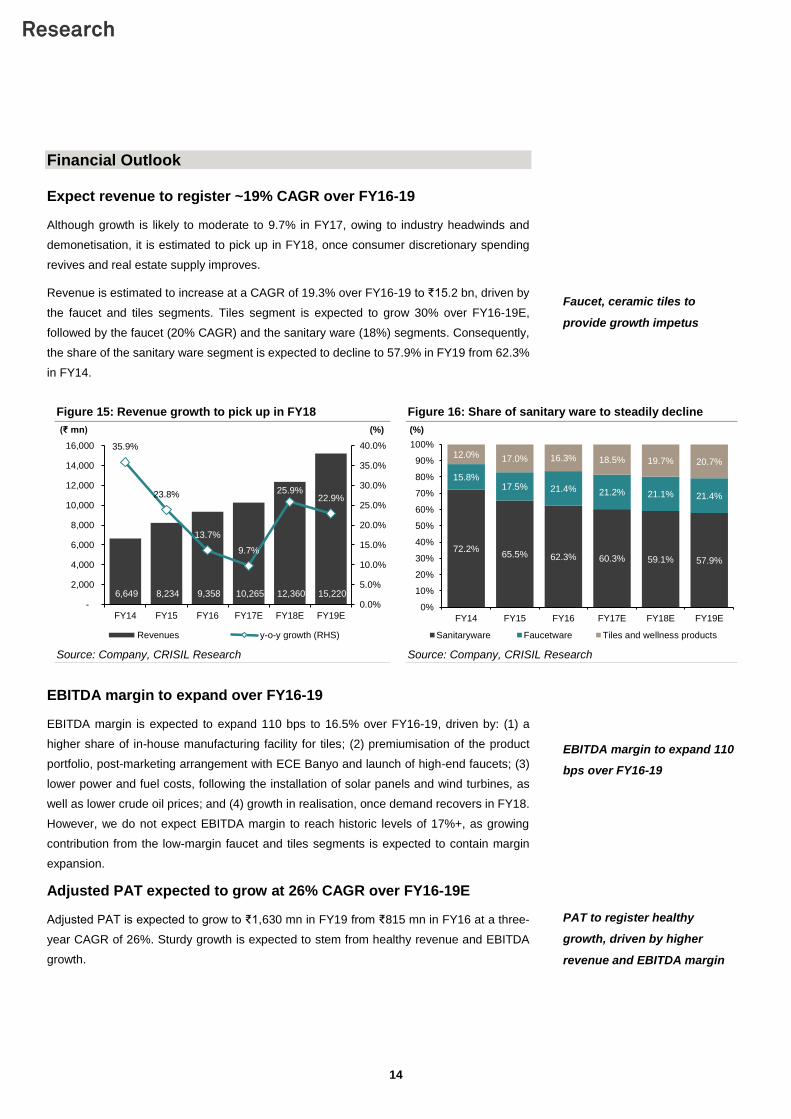
Financial Outlook
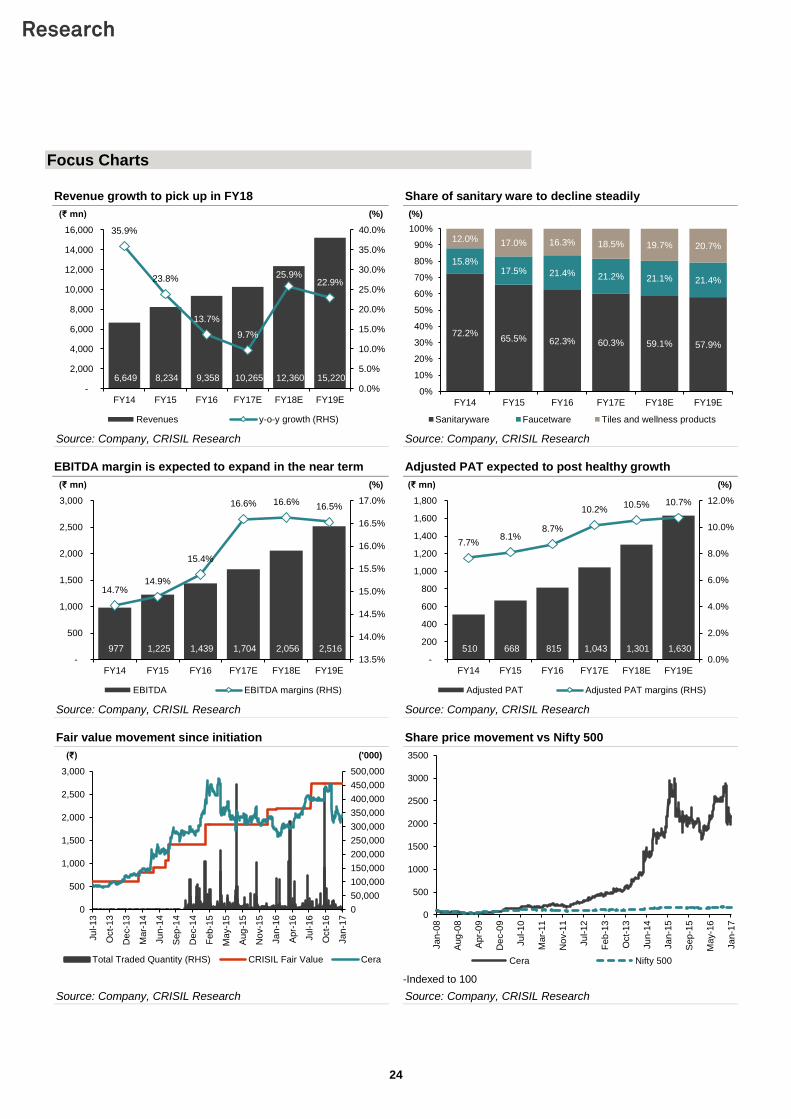
Expect revenue to register ~19% CAGR over FY16-19
Although growth is likely to moderate to 9.7% in FY17, owing to industry headwinds and
demonetisation, it is estimated to pick up in FY18, once consumer discretionary spending
revives and real estate supply improves.
Revenue is estimated to increase at a CAGR of 19.3% over FY16-19 to ₹15.2 bn, driven by
the faucet and tiles segments. Tiles segment is expected to grow 30% over FY16-19E,
followed by the faucet (20% CAGR) and the sanitary ware (18%) segments. Consequently,
the share of the sanitary ware segment is expected to decline to 57.9% in FY19 from 62.3%
in FY14.
Figure 15: Revenue growth to pick up in FY18 Figure 16: Share of sanitary ware to steadily decline
Source: Company, CRISIL Research Source: Company, CRISIL Research
EBITDA margin to expand over FY16-19
EBITDA margin is expected to expand 110 bps to 16.5% over FY16-19, driven by: (1) a
higher share of in-house manufacturing facility for tiles; (2) premiumisation of the product
portfolio, post-marketing arrangement with ECE Banyo and launch of high-end faucets; (3)
lower power and fuel costs, following the installation of solar panels and wind turbines, as
well as lower crude oil prices; and (4) growth in realisation, once demand recovers in FY18.
However, we do not expect EBITDA margin to reach historic levels of 17%+, as growing
contribution from the low-margin faucet and tiles segments is expected to contain margin
expansion.
Adjusted PAT expected to grow at 26% CAGR over FY16-19E
Adjusted PAT is expected to grow to ₹1,630 mn in FY19 from ₹815 mn in FY16 at a three-
year CAGR of 26%. Sturdy growth is expected to stem from healthy revenue and EBITDA
growth.
6,649 8,234 9,358 10,265 12,360 15,220
35.9%
23.8%
13.7%
9.7%
25.9%22.9%
0.0%
5.0%
10.0%
15.0%
20.0%
25.0%
30.0%
35.0%
40.0%
-
2,000
4,000
6,000
8,000
10,000
12,000
14,000
16,000
FY14 FY15 FY16 FY17E FY18E FY19E
(%)(₹ mn)
Revenues y-o-y growth (RHS)
72.2%65.5% 62.3% 60.3% 59.1% 57.9%
15.8%17.5% 21.4% 21.2% 21.1% 21.4%
12.0% 17.0% 16.3% 18.5% 19.7% 20.7%
0%
10%
20%
30%
40%
50%
60%
70%
80%
90%
100%
FY14 FY15 FY16 FY17E FY18E FY19E
(%)
Sanitaryware Faucetware Tiles and wellness products
EBITDA margin to expand 110
bps over FY16-19
Faucet, ceramic tiles to
provide growth impetus
PAT to register healthy
growth, driven by higher
revenue and EBITDA margin
expansion
15
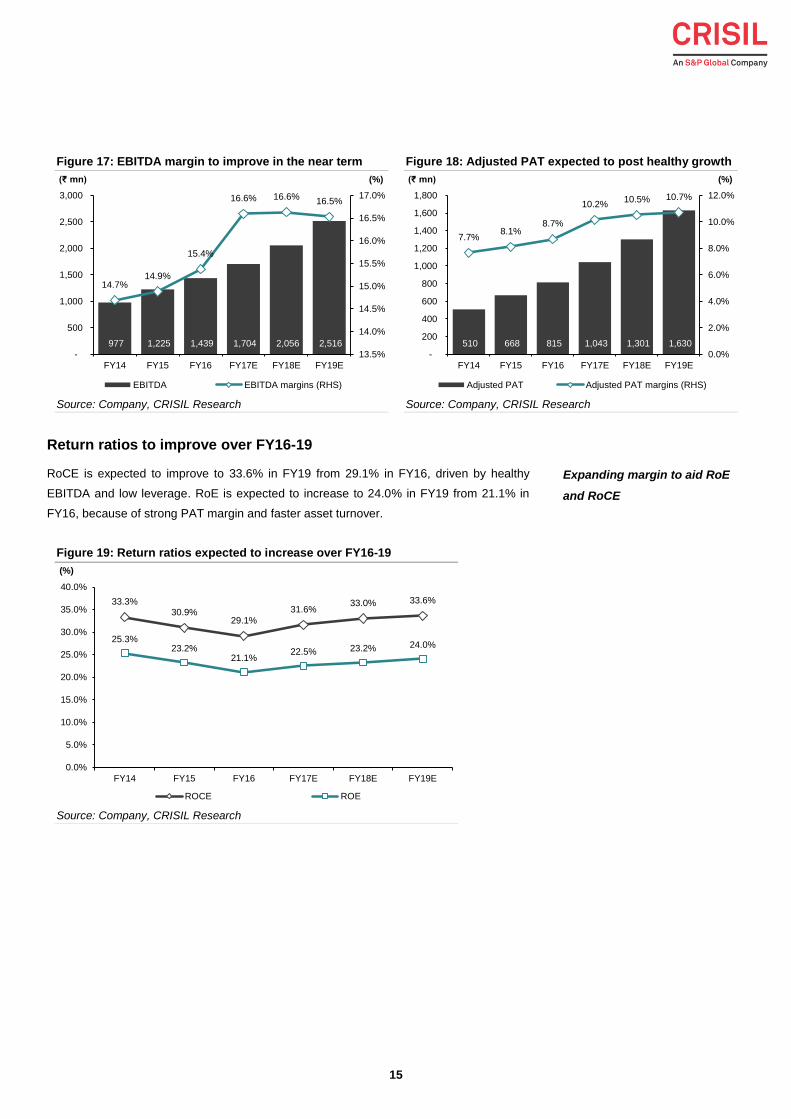
Figure 17: EBITDA margin to improve in the near term Figure 18: Adjusted PAT expected to post healthy growth
Source: Company, CRISIL Research Source: Company, CRISIL Research
Return ratios to improve over FY16-19
RoCE is expected to improve to 33.6% in FY19 from 29.1% in FY16, driven by healthy
EBITDA and low leverage. RoE is expected to increase to 24.0% in FY19 from 21.1% in
FY16, because of strong PAT margin and faster asset turnover.
Figure 19: Return ratios expected to increase over FY16-19
Source: Company, CRISIL Research
977 1,225 1,439 1,704 2,056 2,516
14.7%14.9%
15.4%
16.6% 16.6%16.5%
13.5%
14.0%
14.5%
15.0%
15.5%
16.0%
16.5%
17.0%
-
500
1,000
1,500
2,000
2,500
3,000
FY14 FY15 FY16 FY17E FY18E FY19E
(%)(₹ mn)
EBITDA EBITDA margins (RHS)
510 668 815 1,043 1,301 1,630
7.7%8.1%
8.7%
10.2%10.5% 10.7%
0.0%
2.0%
4.0%
6.0%
8.0%
10.0%
12.0%
-
200
400
600
800
1,000
1,200
1,400
1,600
1,800
FY14 FY15 FY16 FY17E FY18E FY19E
(%)(₹ mn)
Adjusted PAT Adjusted PAT margins (RHS)
33.3%30.9%
29.1%
31.6%33.0% 33.6%
25.3%23.2%
21.1%22.5% 23.2% 24.0%
0.0%
5.0%
10.0%
15.0%
20.0%
25.0%
30.0%
35.0%
40.0%
FY14 FY15 FY16 FY17E FY18E FY19E
(%)
ROCE ROE
Expanding margin to aid RoE
and RoCE
16
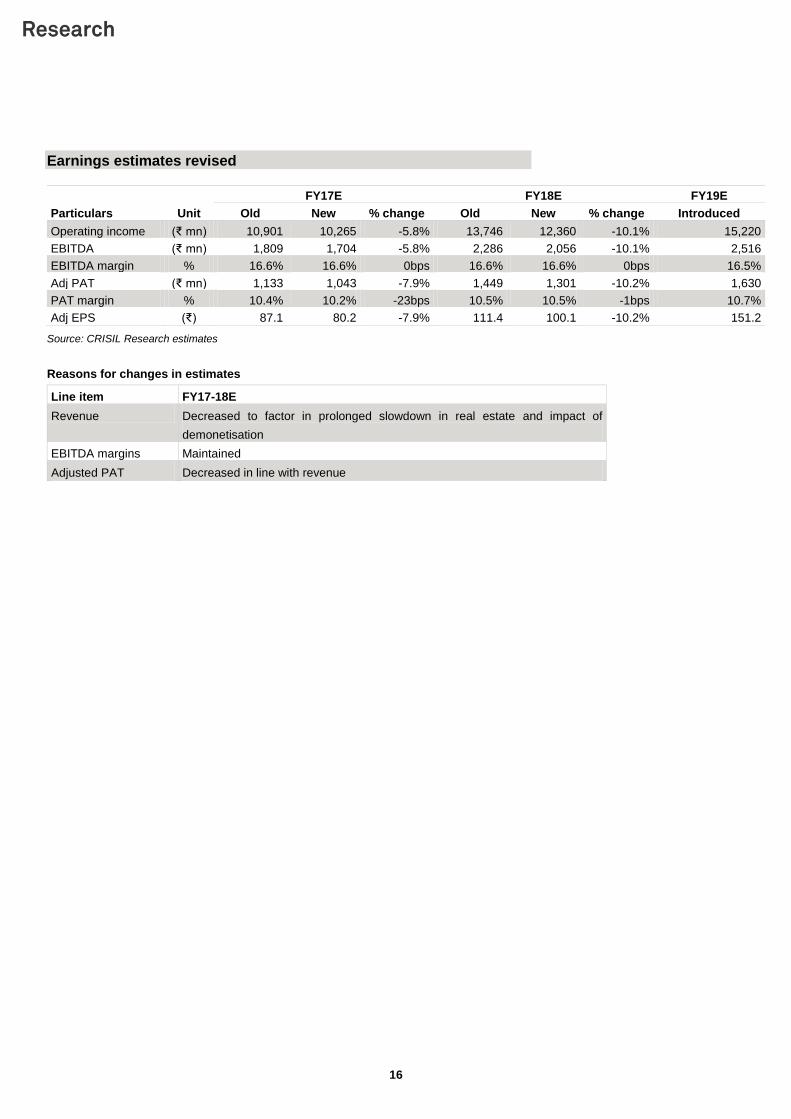
Earnings estimates revised
Unit
FY17E FY18E FY19E
Particulars Old New % change Old New % change Introduced
Operating income (₹ mn) 10,901 10,265 -5.8% 13,746 12,360 -10.1% 15,220
EBITDA (₹ mn) 1,809 1,704 -5.8% 2,286 2,056 -10.1% 2,516
EBITDA margin % 16.6% 16.6% 0bps 16.6% 16.6% 0bps 16.5%
Adj PAT (₹ mn) 1,133 1,043 -7.9% 1,449 1,301 -10.2% 1,630
PAT margin % 10.4% 10.2% -23bps 10.5% 10.5% -1bps 10.7%
Adj EPS (₹) 87.1 80.2 -7.9% 111.4 100.1 -10.2% 151.2
Source: CRISIL Research estimates
Reasons for changes in estimates
Line item FY17-18E
Revenue Decreased to factor in prolonged slowdown in real estate and impact of
demonetisation
EBITDA margins Maintained
Adjusted PAT Decreased in line with revenue
17
Management Overview
CRISIL’s fundamental grading methodology includes a broad assessment of management
quality, apart from other key factors, such as industry and business prospects and financial
performance.
Experienced top management…
Promoted by Vikram Somany, Chairman and Managing Director, Cera has a decentralised
decision-making process. Mr Somany has over three decades of experience in the sanitary
ware business, and has successfully steered the company to become a leading player in the
domestic sanitary ware industry. He is ably supported by a professional top management
team, headed by Mr Subhash Chandra Kothari, Chief Executive Officer; Mr Atul Sanghvi,
Executive Director; and Mr Bharat Mody, strategic advisor.
…aptly supported by a strong second line
Based on our interaction, we believe the company has a professional second line of
management, which is well versed with the day-to-day operations. Most of the second line
has been with the company for some time.
Successful in executing growth strategies
Our confidence in the execution capability of the management team has grown over the past
couple of years. Management has successfully demonstrated its capability to execute growth
strategies by ramping up new businesses - faucets and tiles. Management remains proactive
in identifying and executing growth strategies.
Successfully ramped up
faucets and tiles businesses
18
Corporate Governance
CRISIL’s fundamental grading methodology includes a broad assessment of corporate
governance and management quality, apart from other key factors such as industry and
business prospects, and financial performance. In this context, CRISIL Research analyses
the shareholding structure, board composition, typical board processes, disclosure
standards and related-party transactions. Any qualifications by regulators or auditors also
serve as useful inputs while assessing a company’s corporate governance.
Board processes satisfactory
Board processes and systems are satisfactory. The board comprises eight directors, of
whom four are independent, which meets Clause 49 of the SEBI’s listing agreement. The
company has all the necessary committees – audit, remuneration and investor grievance –
in place. Board meetings are held at regular intervals and agenda papers are circulated in
advance.
Maintains healthy quality of earnings
● Healthy earnings: We believe the quality of earnings is strong, which is reflected in the
following parameters:
– Debtor and inventory days remain largely stable. Cera has consistently
generated operating cash flows over the past few years, in line with
growth in organic revenue.
● Treatment of minority shareholders: Despite consistent capacity addition, the
company has maintained a steady dividend payout ratio.
● Limited related-party transactions: In our opinion, there are no material related-party
transactions or capital allocation issues with the company.
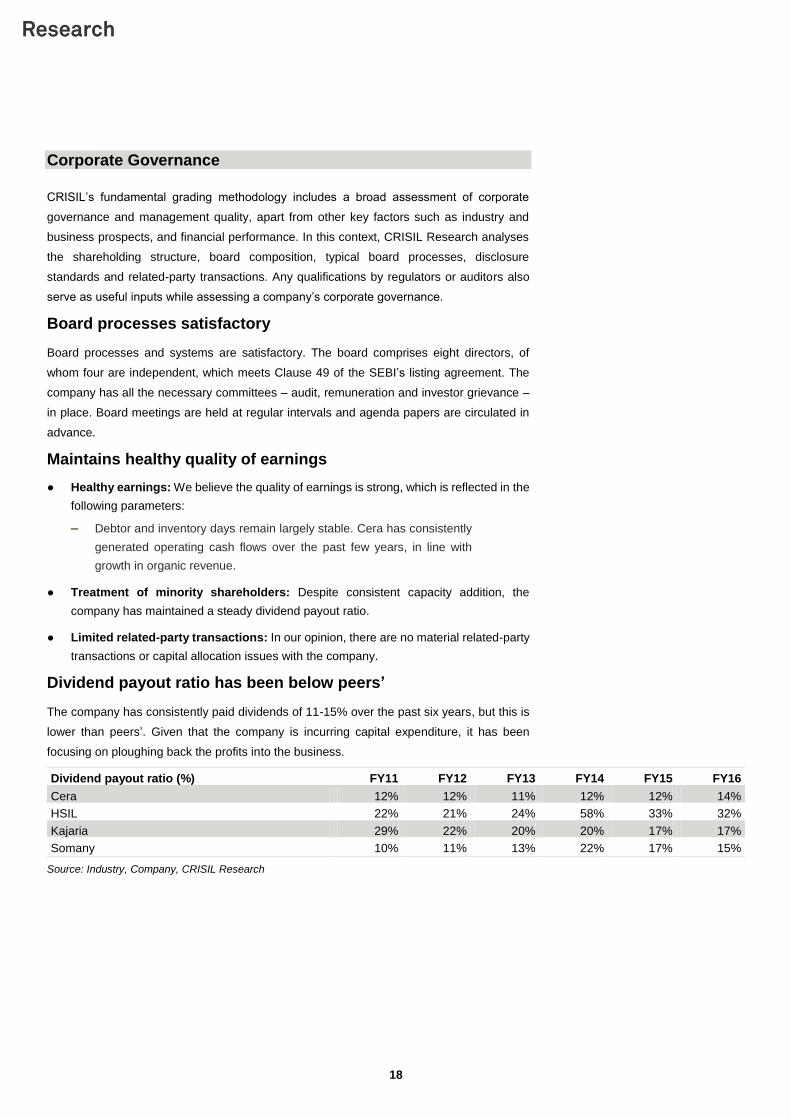
Dividend payout ratio has been below peers’
The company has consistently paid dividends of 11-15% over the past six years, but this is
lower than peers’. Given that the company is incurring capital expenditure, it has been
focusing on ploughing back the profits into the business.
Dividend payout ratio (%) FY11 FY12 FY13 FY14 FY15 FY16
Cera 12% 12% 11% 12% 12% 14%
HSIL 22% 21% 24% 58% 33% 32%
Kajaria 29% 22% 20% 20% 17% 17%
Somany 10% 11% 13% 22% 17% 15%
Source: Industry, Company, CRISIL Research
19
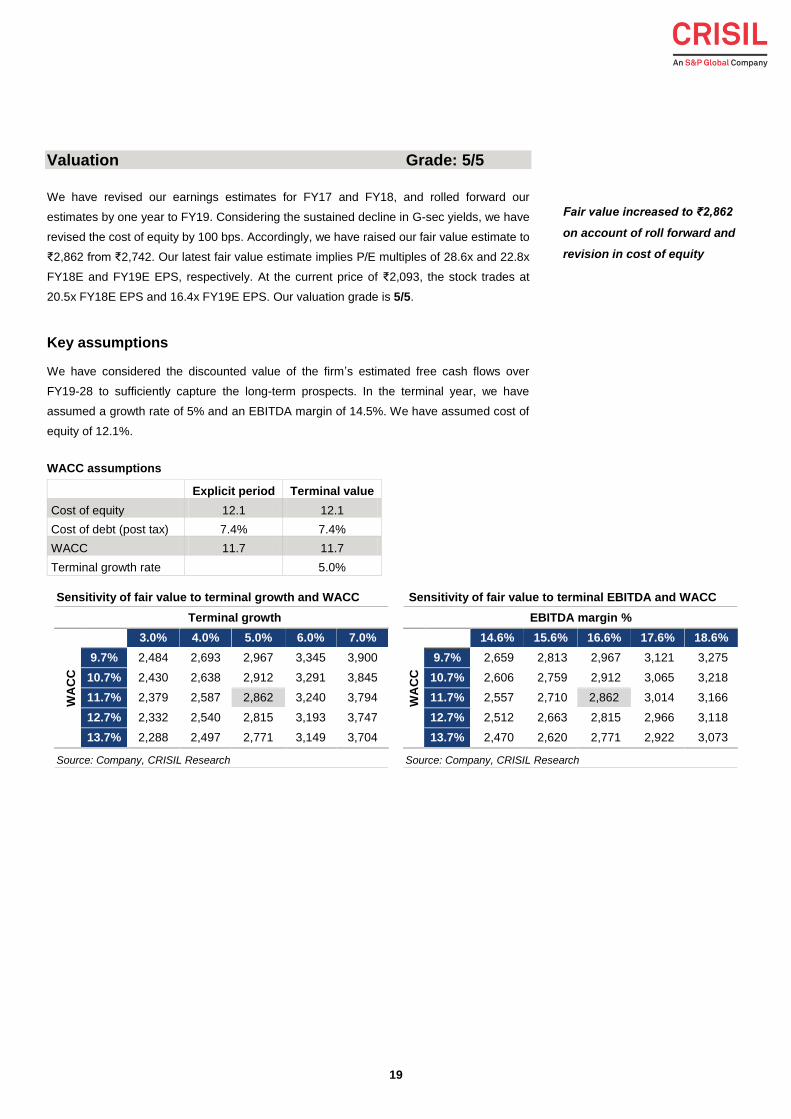
Valuation Grade: 5/5
We have revised our earnings estimates for FY17 and FY18, and rolled forward our
estimates by one year to FY19. Considering the sustained decline in G-sec yields, we have
revised the cost of equity by 100 bps. Accordingly, we have raised our fair value estimate to
₹2,862 from ₹2,742. Our latest fair value estimate implies P/E multiples of 28.6x and 22.8x
FY18E and FY19E EPS, respectively. At the current price of ₹2,093, the stock trades at
20.5x FY18E EPS and 16.4x FY19E EPS. Our valuation grade is 5/5.
Key assumptions
We have considered the discounted value of the firm’s estimated free cash flows over
FY19-28 to sufficiently capture the long-term prospects. In the terminal year, we have
assumed a growth rate of 5% and an EBITDA margin of 14.5%. We have assumed cost of
equity of 12.1%.
WACC assumptions
Explicit period Terminal value
Cost of equity 12.1 12.1
Cost of debt (post tax) 7.4% 7.4%
WACC 11.7 11.7
Terminal growth rate 5.0%
Sensitivity of fair value to terminal growth and WACC Sensitivity of fair value to terminal EBITDA and WACC
Terminal growth
WA
CC
3.0% 4.0% 5.0% 6.0% 7.0%
9.7% 2,484 2,693 2,967 3,345 3,900
10.7% 2,430 2,638 2,912 3,291 3,845
11.7% 2,379 2,587 2,862 3,240 3,794
12.7% 2,332 2,540 2,815 3,193 3,747
13.7% 2,288 2,497 2,771 3,149 3,704
EBITDA margin %
WA
CC
14.6% 15.6% 16.6% 17.6% 18.6%
9.7% 2,659 2,813 2,967 3,121 3,275
10.7% 2,606 2,759 2,912 3,065 3,218
11.7% 2,557 2,710 2,862 3,014 3,166
12.7% 2,512 2,663 2,815 2,966 3,118
13.7% 2,470 2,620 2,771 2,922 3,073
Source: Company, CRISIL Research Source: Company, CRISIL Research
Fair value increased to ₹2,862
on account of roll forward and
revision in cost of equity
20
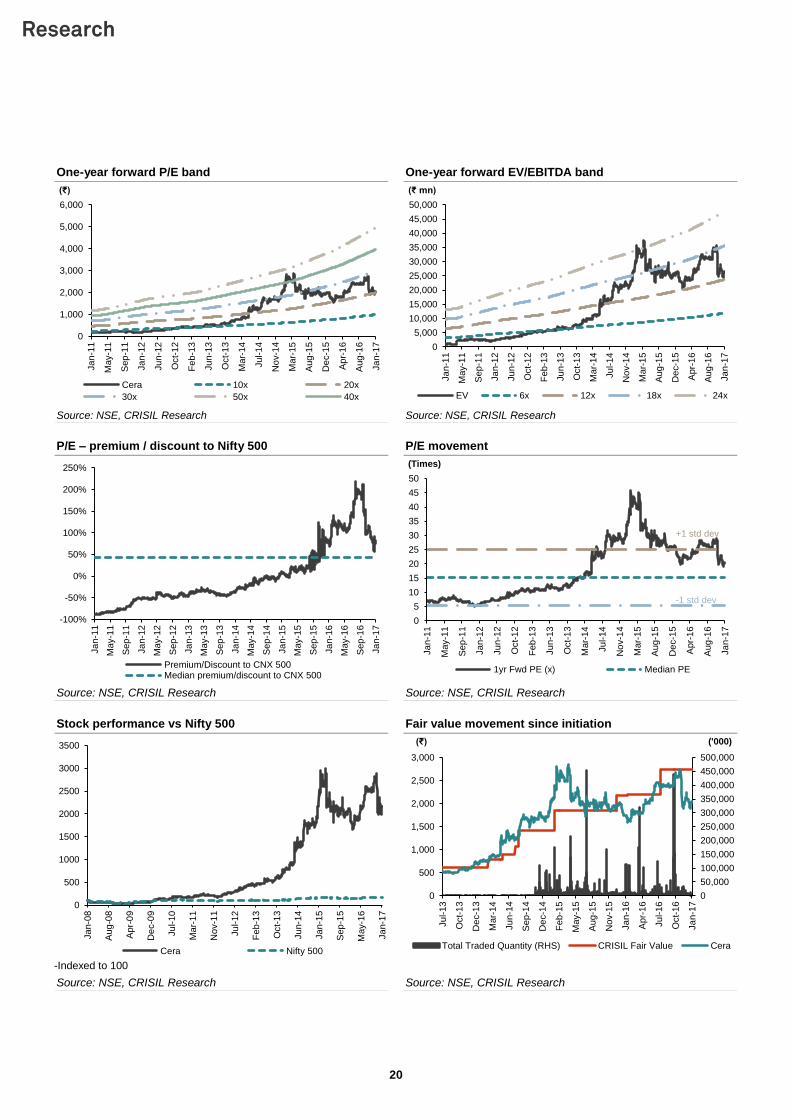
One-year forward P/E band One-year forward EV/EBITDA band
Source: NSE, CRISIL Research Source: NSE, CRISIL Research
P/E – premium / discount to Nifty 500 P/E movement
Source: NSE, CRISIL Research Source: NSE, CRISIL Research
Stock performance vs Nifty 500 Fair value movement since initiation
-Indexed to 100
Source: NSE, CRISIL Research Source: NSE, CRISIL Research
0
1,000
2,000
3,000
4,000
5,000
6,000
Ja
n-1
1
May-1
1
Sep
-11
Ja
n-1
2
Ju
n-1
2
Oct-
12
Feb
-13
Ju
n-1
3
Oct-
13
Mar-
14
Ju
l-14
No
v-1
4
Mar-
15
Aug
-15
De
c-1
5
Apr-
16
Aug
-16
Ja
n-1
7
(₹)
Cera 10x 20x
30x 50x 40x
0
5,000
10,000
15,000
20,000
25,000
30,000
35,000
40,000
45,000
50,000
Ja
n-1
1
May-1
1
Sep
-11
Ja
n-1
2
Ju
n-1
2
Oct-
12
Feb
-13
Ju
n-1
3
Oct-
13
Ma
r-1
4
Ju
l-14
No
v-1
4
Ma
r-1
5
Aug
-15
De
c-1
5
Apr-
16
Aug
-16
Ja
n-1
7
(₹ mn)
EV 6x 12x 18x 24x
-100%
-50%
0%
50%
100%
150%
200%
250%
Ja
n-1
1
May-1
1
Sep
-11
Ja
n-1
2
May-1
2
Sep
-12
Ja
n-1
3
May-1
3
Sep
-13
Ja
n-1
4
May-1
4
Sep
-14
Ja
n-1
5
May-1
5
Sep
-15
Ja
n-1
6
May-1
6
Sep
-16
Ja
n-1
7
Premium/Discount to CNX 500Median premium/discount to CNX 500
0
5
10
15
20
25
30
35
40
45
50
Ja
n-1
1
May-1
1
Sep
-11
Ja
n-1
2
Ju
n-1
2
Oct-
12
Feb
-13
Ju
n-1
3
Oct-
13
Mar-
14
Ju
l-14
No
v-1
4
Mar-
15
Aug
-15
De
c-1
5
Apr-
16
Aug
-16
Ja
n-1
7
(Times)
1yr Fwd PE (x) Median PE
+1 std dev
-1 std dev
0
500
1000
1500
2000
2500
3000
3500
Ja
n-0
8
Aug
-08
Apr-
09
De
c-0
9
Ju
l-10
Mar-
11
No
v-1
1
Ju
l-12
Feb
-13
Oct-
13
Ju
n-1
4
Ja
n-1
5
Sep
-15
May-1
6
Ja
n-1
7
Cera Nifty 500
0
50,000
100,000
150,000
200,000
250,000
300,000
350,000
400,000
450,000
500,000
0
500
1,000
1,500
2,000
2,500
3,000
Ju
l-13
Oct-
13
De
c-1
3
Mar-
14
Ju
n-1
4
Sep
-14
De
c-1
4
Feb
-15
May-1
5
Aug
-15
No
v-1
5
Ja
n-1
6
Apr-
16
Ju
l-16
Oct-
16
Ja
n-1
7
('000)(₹)
Total Traded Quantity (RHS) CRISIL Fair Value Cera
21
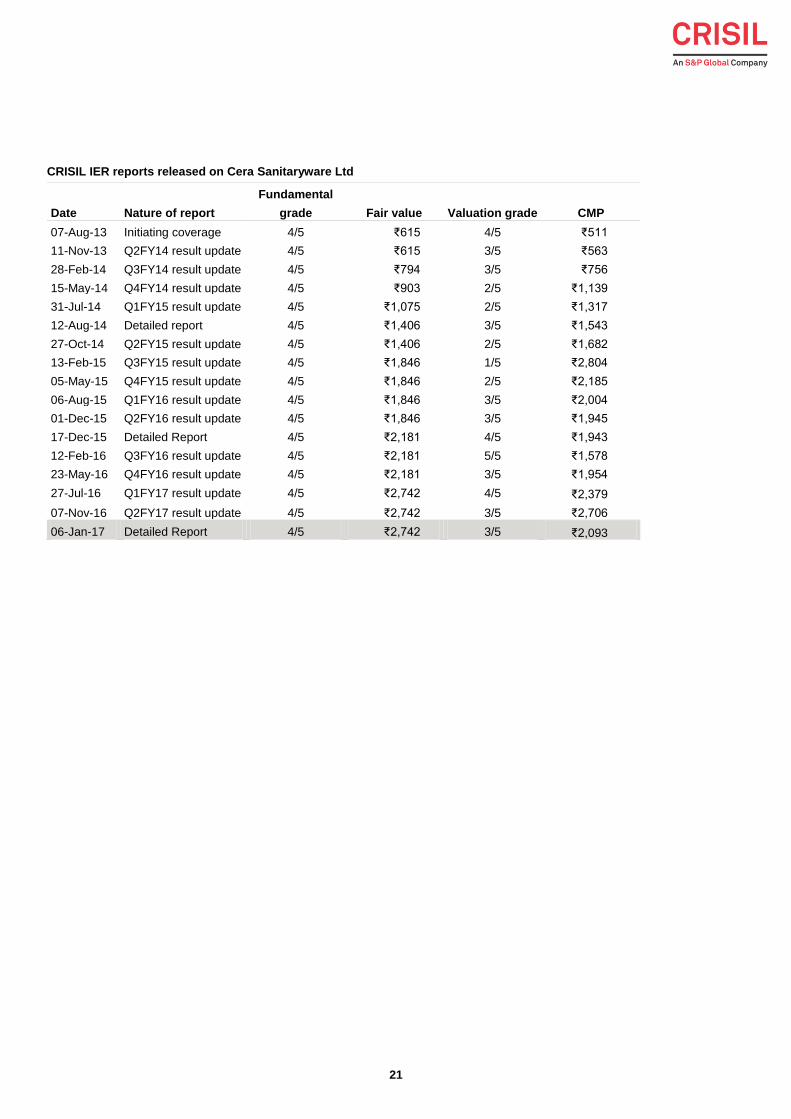
CRISIL IER reports released on Cera Sanitaryware Ltd
Date Nature of report
Fundamental
grade Fair value Valuation grade CMP
07-Aug-13 Initiating coverage 4/5 ₹615 4/5 ₹511
11-Nov-13 Q2FY14 result update 4/5 ₹615 3/5 ₹563
28-Feb-14 Q3FY14 result update 4/5 ₹794 3/5 ₹756
15-May-14 Q4FY14 result update 4/5 ₹903 2/5 ₹1,139
31-Jul-14 Q1FY15 result update 4/5 ₹1,075 2/5 ₹1,317
12-Aug-14 Detailed report 4/5 ₹1,406 3/5 ₹1,543
27-Oct-14 Q2FY15 result update 4/5 ₹1,406 2/5 ₹1,682
13-Feb-15 Q3FY15 result update 4/5 ₹1,846 1/5 ₹2,804
05-May-15 Q4FY15 result update 4/5 ₹1,846 2/5 ₹2,185
06-Aug-15 Q1FY16 result update 4/5 ₹1,846 3/5 ₹2,004
01-Dec-15 Q2FY16 result update 4/5 ₹1,846 3/5 ₹1,945
17-Dec-15 Detailed Report 4/5 ₹2,181 4/5 ₹1,943
12-Feb-16 Q3FY16 result update 4/5 ₹2,181 5/5 ₹1,578
23-May-16 Q4FY16 result update 4/5 ₹2,181 3/5 ₹1,954
27-Jul-16 Q1FY17 result update 4/5 ₹2,742 4/5 ₹2,379
07-Nov-16 Q2FY17 result update 4/5 ₹2,742 3/5 ₹2,706
06-Jan-17 Detailed Report 4/5 ₹2,742 3/5 ₹2,093
22
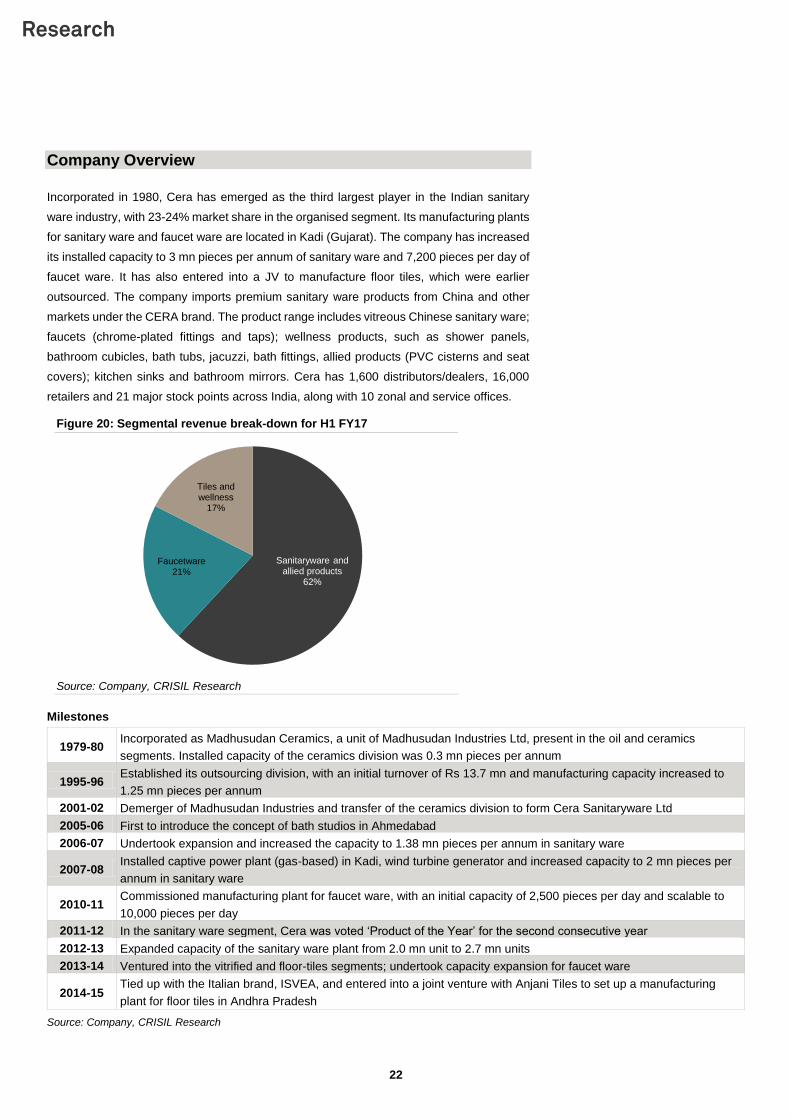
Company Overview
Incorporated in 1980, Cera has emerged as the third largest player in the Indian sanitary
ware industry, with 23-24% market share in the organised segment. Its manufacturing plants
for sanitary ware and faucet ware are located in Kadi (Gujarat). The company has increased
its installed capacity to 3 mn pieces per annum of sanitary ware and 7,200 pieces per day of
faucet ware. It has also entered into a JV to manufacture floor tiles, which were earlier
outsourced. The company imports premium sanitary ware products from China and other
markets under the CERA brand. The product range includes vitreous Chinese sanitary ware;
faucets (chrome-plated fittings and taps); wellness products, such as shower panels,
bathroom cubicles, bath tubs, jacuzzi, bath fittings, allied products (PVC cisterns and seat
covers); kitchen sinks and bathroom mirrors. Cera has 1,600 distributors/dealers, 16,000
retailers and 21 major stock points across India, along with 10 zonal and service offices.
Figure 20: Segmental revenue break-down for H1 FY17
Source: Company, CRISIL Research
Milestones
1979-80 Incorporated as Madhusudan Ceramics, a unit of Madhusudan Industries Ltd, present in the oil and ceramics
segments. Installed capacity of the ceramics division was 0.3 mn pieces per annum
1995-96 Established its outsourcing division, with an initial turnover of Rs 13.7 mn and manufacturing capacity increased to
1.25 mn pieces per annum
2001-02 Demerger of Madhusudan Industries and transfer of the ceramics division to form Cera Sanitaryware Ltd
2005-06 First to introduce the concept of bath studios in Ahmedabad
2006-07 Undertook expansion and increased the capacity to 1.38 mn pieces per annum in sanitary ware
2007-08 Installed captive power plant (gas-based) in Kadi, wind turbine generator and increased capacity to 2 mn pieces per
annum in sanitary ware
2010-11 Commissioned manufacturing plant for faucet ware, with an initial capacity of 2,500 pieces per day and scalable to
10,000 pieces per day
2011-12 In the sanitary ware segment, Cera was voted ‘Product of the Year’ for the second consecutive year
2012-13 Expanded capacity of the sanitary ware plant from 2.0 mn unit to 2.7 mn units
2013-14 Ventured into the vitrified and floor-tiles segments; undertook capacity expansion for faucet ware
2014-15 Tied up with the Italian brand, ISVEA, and entered into a joint venture with Anjani Tiles to set up a manufacturing
plant for floor tiles in Andhra Pradesh
Source: Company, CRISIL Research
Sanitaryware and allied products
62%
Faucetware21%
Tiles and wellness
17%
23
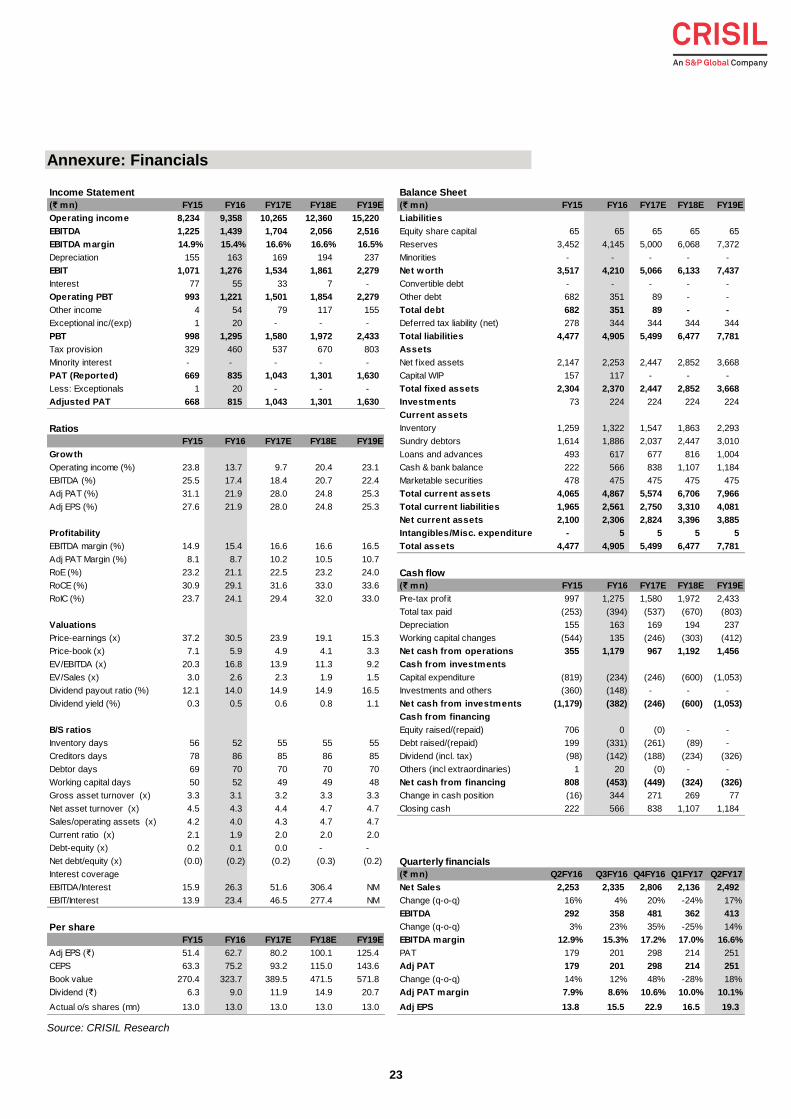
Annexure: Financials
Source: CRISIL Research
Income Statement Balance Sheet
(₹ mn) FY15 FY16 FY17E FY18E FY19E (₹ mn) FY15 FY16 FY17E FY18E FY19E
Operating income 8,234 9,358 10,265 12,360 15,220 Liabilities
EBITDA 1,225 1,439 1,704 2,056 2,516 Equity share capital 65 65 65 65 65
EBITDA margin 14.9% 15.4% 16.6% 16.6% 16.5% Reserves 3,452 4,145 5,000 6,068 7,372
Depreciation 155 163 169 194 237 Minorities - - - - -
EBIT 1,071 1,276 1,534 1,861 2,279 Net worth 3,517 4,210 5,066 6,133 7,437
Interest 77 55 33 7 - Convertible debt - - - - -
Operating PBT 993 1,221 1,501 1,854 2,279 Other debt 682 351 89 - -
Other income 4 54 79 117 155 Total debt 682 351 89 - -
Exceptional inc/(exp) 1 20 - - - Deferred tax liability (net) 278 344 344 344 344
PBT 998 1,295 1,580 1,972 2,433 Total liabilities 4,477 4,905 5,499 6,477 7,781
Tax provision 329 460 537 670 803 Assets
Minority interest - - - - - Net f ixed assets 2,147 2,253 2,447 2,852 3,668
PAT (Reported) 669 835 1,043 1,301 1,630 Capital WIP 157 117 - - -
Less: Exceptionals 1 20 - - - Total fixed assets 2,304 2,370 2,447 2,852 3,668
Adjusted PAT 668 815 1,043 1,301 1,630 Investments 73 224 224 224 224
Current assets
Ratios Inventory 1,259 1,322 1,547 1,863 2,293
FY15 FY16 FY17E FY18E FY19E Sundry debtors 1,614 1,886 2,037 2,447 3,010
Growth Loans and advances 493 617 677 816 1,004
Operating income (%) 23.8 13.7 9.7 20.4 23.1 Cash & bank balance 222 566 838 1,107 1,184
EBITDA (%) 25.5 17.4 18.4 20.7 22.4 Marketable securities 478 475 475 475 475
Adj PAT (%) 31.1 21.9 28.0 24.8 25.3 Total current assets 4,065 4,867 5,574 6,706 7,966
Adj EPS (%) 27.6 21.9 28.0 24.8 25.3 Total current liabilities 1,965 2,561 2,750 3,310 4,081
Net current assets 2,100 2,306 2,824 3,396 3,885
Profitability Intangibles/Misc. expenditure - 5 5 5 5
EBITDA margin (%) 14.9 15.4 16.6 16.6 16.5 Total assets 4,477 4,905 5,499 6,477 7,781
Adj PAT Margin (%) 8.1 8.7 10.2 10.5 10.7
RoE (%) 23.2 21.1 22.5 23.2 24.0 Cash flow
RoCE (%) 30.9 29.1 31.6 33.0 33.6 (₹ mn) FY15 FY16 FY17E FY18E FY19E
RoIC (%) 23.7 24.1 29.4 32.0 33.0 Pre-tax profit 997 1,275 1,580 1,972 2,433
Total tax paid (253) (394) (537) (670) (803)
Valuations Depreciation 155 163 169 194 237
Price-earnings (x) 37.2 30.5 23.9 19.1 15.3 Working capital changes (544) 135 (246) (303) (412)
Price-book (x) 7.1 5.9 4.9 4.1 3.3 Net cash from operations 355 1,179 967 1,192 1,456
EV/EBITDA (x) 20.3 16.8 13.9 11.3 9.2 Cash from investments
EV/Sales (x) 3.0 2.6 2.3 1.9 1.5 Capital expenditure (819) (234) (246) (600) (1,053)
Dividend payout ratio (%) 12.1 14.0 14.9 14.9 16.5 Investments and others (360) (148) - - -
Dividend yield (%) 0.3 0.5 0.6 0.8 1.1 Net cash from investments (1,179) (382) (246) (600) (1,053)
Cash from financing
B/S ratios 2.2 2.2 Equity raised/(repaid) 706 0 (0) - -
Inventory days 56 52 55 55 55 Debt raised/(repaid) 199 (331) (261) (89) -
Creditors days 78 86 85 86 85 Dividend (incl. tax) (98) (142) (188) (234) (326)
Debtor days 69 70 70 70 70 Others (incl extraordinaries) 1 20 (0) - -
Working capital days 50 52 49 49 48 Net cash from financing 808 (453) (449) (324) (326)
Gross asset turnover (x) 3.3 3.1 3.2 3.3 3.3 Change in cash position (16) 344 271 269 77
Net asset turnover (x) 4.5 4.3 4.4 4.7 4.7 Closing cash 222 566 838 1,107 1,184
Sales/operating assets (x) 4.2 4.0 4.3 4.7 4.7
Current ratio (x) 2.1 1.9 2.0 2.0 2.0
Debt-equity (x) 0.2 0.1 0.0 - -
Net debt/equity (x) (0.0) (0.2) (0.2) (0.3) (0.2) Quarterly financials
Interest coverage (₹ mn) Q2FY16 Q3FY16 Q4FY16 Q1FY17 Q2FY17
EBITDA/Interest 15.9 26.3 51.6 306.4 NM Net Sales 2,253 2,335 2,806 2,136 2,492
EBIT/Interest 13.9 23.4 46.5 277.4 NM Change (q-o-q) 16% 4% 20% -24% 17%
EBITDA 292 358 481 362 413
Per share Change (q-o-q) 3% 23% 35% -25% 14%
FY15 FY16 FY17E FY18E FY19E EBITDA margin 12.9% 15.3% 17.2% 17.0% 16.6%
Adj EPS (₹) 51.4 62.7 80.2 100.1 125.4 PAT 179 201 298 214 251
CEPS 63.3 75.2 93.2 115.0 143.6 Adj PAT 179 201 298 214 251
Book value 270.4 323.7 389.5 471.5 571.8 Change (q-o-q) 14% 12% 48% -28% 18%
Dividend (₹) 6.3 9.0 11.9 14.9 20.7 Adj PAT margin 7.9% 8.6% 10.6% 10.0% 10.1%
Actual o/s shares (mn) 13.0 13.0 13.0 13.0 13.0 Adj EPS 13.8 15.5 22.9 16.5 19.3
24
Focus Charts
Revenue growth to pick up in FY18 Share of sanitary ware to decline steadily
Source: Company, CRISIL Research Source: Company, CRISIL Research
EBITDA margin is expected to expand in the near term Adjusted PAT expected to post healthy growth
Source: Company, CRISIL Research Source: Company, CRISIL Research
Fair value movement since initiation Share price movement vs Nifty 500
-Indexed to 100
Source: Company, CRISIL Research Source: Company, CRISIL Research
6,649 8,234 9,358 10,265 12,360 15,220
35.9%
23.8%
13.7%
9.7%
25.9%22.9%
0.0%
5.0%
10.0%
15.0%
20.0%
25.0%
30.0%
35.0%
40.0%
-
2,000
4,000
6,000
8,000
10,000
12,000
14,000
16,000
FY14 FY15 FY16 FY17E FY18E FY19E
(%)(₹ mn)
Revenues y-o-y growth (RHS)
72.2%65.5% 62.3% 60.3% 59.1% 57.9%
15.8%17.5% 21.4% 21.2% 21.1% 21.4%
12.0% 17.0% 16.3% 18.5% 19.7% 20.7%
0%
10%
20%
30%
40%
50%
60%
70%
80%
90%
100%
FY14 FY15 FY16 FY17E FY18E FY19E
(%)
Sanitaryware Faucetware Tiles and wellness products
977 1,225 1,439 1,704 2,056 2,516
14.7%14.9%
15.4%
16.6% 16.6%16.5%
13.5%
14.0%
14.5%
15.0%
15.5%
16.0%
16.5%
17.0%
-
500
1,000
1,500
2,000
2,500
3,000
FY14 FY15 FY16 FY17E FY18E FY19E
(%)(₹ mn)
EBITDA EBITDA margins (RHS)
510 668 815 1,043 1,301 1,630
7.7%8.1%
8.7%
10.2%10.5% 10.7%
0.0%
2.0%
4.0%
6.0%
8.0%
10.0%
12.0%
-
200
400
600
800
1,000
1,200
1,400
1,600
1,800
FY14 FY15 FY16 FY17E FY18E FY19E
(%)(₹ mn)
Adjusted PAT Adjusted PAT margins (RHS)
0
50,000
100,000
150,000
200,000
250,000
300,000
350,000
400,000
450,000
500,000
0
500
1,000
1,500
2,000
2,500
3,000
Ju
l-13
Oct-
13
De
c-1
3
Mar-
14
Ju
n-1
4
Sep
-14
De
c-1
4
Feb
-15
May-1
5
Aug
-15
No
v-1
5
Ja
n-1
6
Apr-
16
Ju
l-16
Oct-
16
Ja
n-1
7
('000)(₹)
Total Traded Quantity (RHS) CRISIL Fair Value Cera
0
500
1000
1500
2000
2500
3000
3500
Ja
n-0
8
Aug
-08
Apr-
09
De
c-0
9
Ju
l-10
Mar-
11
No
v-1
1
Ju
l-12
Feb
-13
Oct-
13
Ju
n-1
4
Ja
n-1
5
Sep
-15
May-1
6
Ja
n-1
7
Cera Nifty 500
CRISIL Research Team
Senior Director
Nagarajan Narasimhan CRISIL Research +91 22 3342 3540 [email protected]
Analytical Contacts
Prasad Koparkar Senior Director, Industry & Customised Research +91 22 3342 3137 [email protected]
Binaifer Jehani Director, Customised Research +91 22 3342 4091 [email protected]
Manoj Damle Director, Customised Research +91 22 3342 3342 [email protected]
Jiju Vidyadharan Director, Funds & Fixed Income Research +91 22 3342 8091 [email protected]
Ajay Srinivasan Director, Industry Research +91 22 3342 3530 [email protected]
Rahul Prithiani Director, Industry Research +91 22 3342 3574 [email protected]
Bhaskar S. Bukrediwala Director +91 22 3342 1983 [email protected]
Miren Lodha Director +91 22 3342 1977 [email protected]
Business Development
Prosenjit Ghosh Director, Industry & Customised Research +91 99206 56299 [email protected]
Megha Agrawal Associate Director +91 98673 90805 [email protected]
Neeta Muliyil Associate Director +91 99201 99973 [email protected]
Dharmendra Sharma Associate Director (North) +91 98189 05544 [email protected]
Ankesh Baghel Regional Manager (West) +91 98191 21510 [email protected]
Sonal Srivastava Regional Manager (West) +91 98204 53187 [email protected]
Sarrthak Sayal Regional Manager (North) +91 95828 06789 [email protected]
Priyanka Murarka Regional Manager (East) +91 99030 60685 [email protected]
Sanjay Krishnaa Regional Manager (Tamil Nadu & AP) +91 98848 06606 [email protected]
Argentina | China | Hong Kong | India | Poland | Singapore | UK | USA
CRISIL Limited: CRISIL House, Central Avenue, Hiranandani Business Park, Powai, Mumbai – 400076. India
Phone: + 91 22 3342 3000 | Fax: + 91 22 3342 3001 | www.crisil.com
About CRISIL Limited
CRISIL is a global analytical company providing ratings, research, and risk and policy advisory services. We are India's leading ratings
agency. We are also the foremost provider of high-end research to the world's largest banks and leading corporations.
CRISIL is majority owned by S&P Global Inc., a leading provider of transparent and independent ratings, benchmarks, analytics and data
to the capital and commodity markets worldwide.
About CRISIL Research
CRISIL Research is India's largest independent integrated research house. We provide insights, opinion and analysis on the Indian
economy, industry, capital markets and companies. We also conduct training programs to financial sector professionals on a wide array
of technical issues. We are India's most credible provider of economy and industry research. Our industry research covers 86 sectors
and is known for its rich insights and perspectives. Our analysis is supported by inputs from our network of more than 5,000 primary
sources, including industry experts, industry associations and trade channels. We play a key role in India's fixed income markets. We are
the largest provider of valuation of fixed income securities to the mutual fund, insurance and banking industries in the country. We are
also the sole provider of debt and hybrid indices to India's mutual fund and life insurance industries. We pioneered independent equity
research in India, and are today the country's largest independent equity research house. Our defining trait is the ability to convert
information and data into expert judgements and forecasts with complete objectivity. We leverage our deep understanding of the macro-
economy and our extensive sector coverage to provide unique insights on micro-macro and cross-sectoral linkages. Our talent pool
comprises economists, sector experts, company analysts and information management specialists.
CRISIL Privacy
CRISIL respects your privacy. We use your contact information, such as your name, address, and email id, to fulfil your request and service your
account and to provide you with additional information from CRISIL and other parts of S&P Global Inc. and its subsidiaries (collectively, the
“Company”) you may find of interest.
For further information, or to let us know your preferences with respect to receiving marketing materials, please visit www.crisil.com/privacy. You
can view the Company’s Customer Privacy at https://www.spglobal.com/privacy
Last updated: April 2016
Analyst Disclosure
Each member of the team involved in the preparation of the grading report, hereby affirms that there exists no conflict of interest that can bias the
grading recommendation of the company.
Disclaimer:
This Company commissioned CRISIL IER report is based on data publicly available or from sources considered reliable. CRISIL Ltd. (CRISIL)
does not represent that it is accurate or complete and hence, it should not be relied upon as such. The data / report is subject to change without
any prior notice. Opinions expressed herein are our current opinions as on the date of this report. Nothing in this report constitutes investment,
legal, accounting or tax advice or any solicitation, whatsoever. The subscriber / user assume the entire risk of any use made of this data / report.
CRISIL especially states that, it has no financial liability whatsoever, to the subscribers / users of this report. This report is for the personal
information only of the authorised recipient in India only. This report should not be reproduced or redistributed or communicated directly or indirectly
in any form to any other person – especially outside India or published or copied in whole or in part, for any purpose. As per CRISIL’s records,
none of the analysts involved has any ownership / directorship in the company. However CRISIL or its associates may have commercial
transactions with the company.