STATE OF THE MUNICIPALITY ADDRESS 2016 OF HON. MAYOR RUDY S. CAOAGDAN, DPA - ACCOMPLISHMENTS
bulletin
CJ
Twenty-Five Years of Crimein the San Diego Region: 1982 through 2006
April 2007
Criminal Justice Research Division, SANDAG
401 B StreetSuite 800San Diego, CA 92101(619) 699-1900
A SANDAG CJ BULLETIN
Cynthia Burke, Ph.D., Division Director
BOARD OF DIRECTORS
The 18 cities and county government are SANDAG serving as the forum
for regional decision-making. SANDAG builds consensus; plans, engineers, and builds public transit; makes strategic plans; obtains and allocates resources; and provides information on a broad range of topics pertinent to
the region’s quality of life.
CHAIR Hon. Mary Teresa Sessom
FIRST VICE CHAIR Hon. Lori Holt Pfeiler
SECOND VICE CHAIR Hon. Jerome Stocks
EXECUTIVE DIRECTOR Gary L. Gallegos
CITY OF CARLSBAD Hon. Matt Hall, Councilmember (A) Hon. Bud Lewis, Mayor (A) Hon. Ann Kulchin, Mayor Pro Tem CITY OF CHULA VISTA Hon. Cheryl Cox, Mayor (A) Hon. Jerry Rindone, Deputy Mayor (A) Hon. John McCann, Councilmember CITY OF CORONADO Hon. Phil Monroe, Councilmember (A) Hon. Carrie Downey, Mayor Pro Tem (A) Hon. Al Ovrom, Councilmember CITY OF DEL MAR Hon. Crystal Crawford, Councilmember (A) Hon. David Druker, Deputy Mayor (A) Hon. Henry Abarbanel, Councilmember CITY OF EL CAJON Hon. Mark Lewis, Mayor (A) Hon. Jillian Hanson-Cox, Councilmember CITY OF ENCINITAS Hon. Jerome Stocks, Deputy Mayor (A) Hon. Teresa Barth, Councilmember CITY OF ESCONDIDO Hon. Lori Holt Pfeiler, Mayor (A) Hon. Ed Gallo, Councilmember (A) Hon. Sam Abed, Mayor Pro Tem CITY OF IMPERIAL BEACH Hon. Jim Janney, Mayor (A) Hon. Patricia McCoy, Councilmember (A) Hon. Mayda Winter, Mayor Pro Tem CITY OF LA MESA Hon. Art Madrid, Mayor (A) Hon. David Allan, Councilmember (A) Hon. Mark Arapostathis, Councilmember CITY OF LEMON GROVE Hon. Mary Teresa Sessom, Mayor (A) Hon. Jerry Jones, Councilmember (A) Hon. Jerry Selby, Councilmember CITY OF NATIONAL CITY Hon. Ron Morrison, Mayor (A) Hon. Frank Parra, Councilmember (A) Hon. Louie Natividad, Councilmember CITY OF OCEANSIDE Hon. Jim Wood, Mayor (A) Hon. Jerry Kern, Councilmember (A) Hon. Jack Feller, Councilmember CITY OF POWAY Hon. Mickey Cafagna, Mayor (A) Hon. Robert Emery, Councilmember (A) Hon. Don Higginson, Councilmember CITY OF SAN DIEGO Hon. Jerry Sanders, Mayor Hon. Toni Atkins, Councilmember (A) Hon. Jim Madaffer, Councilmember (A) Hon. Scott Peters, Council President CITY OF SAN MARCOS Hon. Jim Desmond, Mayor (A) Hon. Hal Martin, Vice Mayor
CITY OF SANTEEHon. Jack Dale, Councilmember (A) Hon. Hal Ryan, Councilmember (A) Hon. John Minto, Councilmember CITY OF SOLANA BEACH Hon. Lesa Heebner, Mayor (A) Hon. Dave Roberts, Councilmember (A) Hon. Mike Nichols, Councilmember CITY OF VISTA Hon. Judy Ritter, Mayor Pro Tem (A) Hon. Bob Campbell, Councilmember (A) Hon. Steve Gronke, Councilmember COUNTY OF SAN DIEGO Hon. Ron Roberts, Chairman Hon. Bill Horn, Supervisor (A) Hon. Greg Cox, Vice Chairman (A) Hon. Dianne Jacob, Chair Pro Tem IMPERIAL COUNTY (Advisory Member) Hon. Victor Carrillo, Chairman (A) Hon. David Ouzan, Councilmember CALIFORNIA DEPARTMENT OF TRANSPORTATION (Advisory Member) Will Kempton, Director (A) Pedro Orso-Delgado, District 11 Director METROPOLITAN TRANSIT SYSTEM (Advisory Member) Harry Mathis, Chairman (A) Hon. Jerry Rindone, Vice Chairman (A) Hon. Bob Emery, Board Member NORTH COUNTY TRANSIT DISTRICT (Advisory Member) Hon. Ed Gallo, Chairman (A) Hon. Jerome Stocks, Planning Committee Chair (A) Hon. David Druker, Monitoring Committee Chair U.S. DEPARTMENT OF DEFENSE (Advisory Member) CAPT Michael Giorgione, USN, CEC Commanding Officer, Southwest Division Naval Facilities Engineering Command (A) CAPT Steve Wirsching, USN, CEC Executive Officer, Southwest Division Naval Facilities Engineering Command SAN DIEGO UNIFIED PORT DISTRICT (Advisory Member) Sylvia Rios, Chair (A) Michael Bixler, Commissioner SAN DIEGO COUNTY WATER AUTHORITY (Advisory Member) Marilyn Dailey, Commissioner (A) Mark Muir, Commissioner (A) Gary Croucher, Commissioner SOUTHERN CALIFORNIA TRIBAL CHAIRMEN’S ASSOCIATION (Advisory Member) Chairman Robert Smith (Pala), SCTCA Chair (A) Chairman Allen Lawson (San Pasqual) MEXICO (Advisory Member) Hon. Luis Cabrera C. Consulate General of Mexico
As of March 1, 2007
TWENTY-FIVE YEARS OF CRIME IN THE SAN DIEGO REGION: 1982 THROUGH 2006
INTRODUCTION
Since 1980, SANDAG has been reporting regional crime statistics for the San Diego region through a cooperative agreement with local law enforcement agencies. This report presents and discusses crime trend data for the past 25 years. Crime rates per 1,000 resident population1, as well as the actual number of crimes reported are presented. SANDAG is the only local entity to compile these statistics across the 18 incorporated cities, as well as the unincorporated areas of the county, making this information some of the most frequently requested from SANDAG’s Criminal Justice Clearinghouse. These data are useful to local law enforcement agencies as they track the effectiveness of their prevention and response efforts on regional crime rates.
OVERALL CRIME
There was a total of 106,931 Part I (or FBI Index) crimes in the San Diego region in 2006 (Appendix Tables 1 and 5), which equated to 34.87 crimes per 1,000 population (Appendix Table 2). Part I crimes include four violent offenses (homicide, rape, robbery, and aggravated assault) and three property offenses (burglary, larceny, and motor vehicle theft) that are tracked nationwide in a standardized manner by the FBI, with agencies submitting crime data through the Uniform Crime Reporting (UCR) system.
1 The populations used to calculate rates are provided in Appendix Table 20.
FAST FACTS
The chance of being a crime victim in the San Diego region was less in 2006 than in 2005. One in 226 San Diego County residents was the victim of a violent crime in 2006, and one in 33 was the victim of a property crime.
Thirteen of the 25 jurisdictions had a lower violent crime rate in 2006 compared to 2005. Twenty had a lower property crime rate compared to the previous year.
The 2006 violent crime rate of 4.43 was the lowest in the past 25 years, despite recent increases in the number of homicides (1 year increase of 29%) and robberies (1 year increase of 9%).
In 2006, 19,886 domestic violence incidents were reported to law enforcement, the lowest number since 1997.
Larceny was down five percent from 2005, but was still the most common crime reported to police (about one every ten minutes).
The number of vehicles stolen in the region decreased for the first time in five years. This decline also was the largest one-year change in the property crime category.
Compared to other large U.S. cities, the City of San Diego had the fifth lowest FBI Index crime rate in 2005, the most recent comparison year possible.
3

VIOLENT CRIME
Over the past 25 years, the violent crime rate in the San Diego region declined during the first half of the 1980s and began to increase in 1986 (from 5.20 in 1985), reaching a peak of 9.76 in 1992 (Figure 1)2. In 2006, there were 13,576 Part I violent crimes reported to law enforcement in the region (Appendix Tables 1 and 6)3. This equated to 4.43 violent crimes per 1,000 residents and represented a three percent decrease from 2005 (when the rate was 4.56) (Appendix Table 3). In fact, the 2006 violent crime rate was the lowest in the last 25 years, despite recent increases in some violent crime categories. A number of theories have been provided regarding possible factors related to this overall drop in crime since the 1990s, including declining numbers of young males in high crime-associated age groups, legislation which increased jail and prison time for violent offenses, economic factors, and the implementation of effective crime prevention programs. The most common type of reported violent crime was aggravated assault, which represented almost two-thirds (62%) of all violent crime in 2006 (robbery represented 32%, rape 6%, and homicide 1%) (not shown).
Each jurisdiction also documents violent crimes committed against senior citizens. In 2006, there were 448 violent crimes against senior citizens, a decrease of 8 percent from the previous year. These crimes included 5 homicides, 7 rapes, 205 robberies, and 231 aggravated assaults (not shown).
2 The crime rates/numbers of crimes in the current year, and 1, 5, 10, 20, and 25 years ago, are presented, as well as the highest and lowest rates/ numbers over the past 25 years. 3 The numbers of violent crimes reported in each jurisdiction for 2002 through 2006 also are presented in Appendix Tables 10 through 14.
Figure 1 VIOLENT CRIME RATE LOWEST
IN 25 YEARS
4.814.56
4.43
5.48
7.32
9.76
6.79
0.0
2.0
4.0
6.0
8.0
10.0
12.0
1982
1984
1986
1988
1990
1992
1994
1996
1998
2000
2002
2004
2006
Vio
len
t C
rim
e R
ate
per
1,0
00 P
op
ula
tio
n
SOURCES: SANDAG; California Department of Finance;
U.S. Census 1990; U.S. Census 2000
Across jurisdictions, the 2006 violent crime rate per 1,000 population ranged from 0.88 in Coronado to 8.25 in National City (Appendix Table 3 and Appendix Map 1). Over the past year, 13 jurisdictions had lower and 9 had higher violent crime rates, compared to 2005 (3 had numbers too small for valid comparisons). Recent efforts by individual departments to address violent crime in their communities have included strategies targeting gangs and other specific offender groups, as well as prevention efforts for youth. The jurisdictions with the largest one-year decreases included Fallbrook, Ramona, other unincorporated, Vista, Spring Valley, and El Cajon.
Statistics from the FBI were used to compare changes over time in the violent crime rate reported in the San Diego region to those reported across the United States4. As Figure 2 shows, the San Diego region experienced a greater rise in violent crime in the late 1980s
4 National statistics currently are available through 2005 only.
4

and early 1990s, compared to the nation, returning to a similar violent crime rate after 1998. This increase possibly was related to the prevalence of methamphetamine distribution and use in the region during this time period. In 2005, the violent crime rate in the San Diego region was 4.56, versus 4.69 for the nation as a whole.
Figure 2 SAN DIEGO REGION HAD A GREATER INCREASE IN VIOLENT CRIME THAN
THE NATION IN LATE 1980s
0
2
4
6
8
10
12
1982
1984
1986
1988
1990
1992
1994
1996
1998
2000
2002
2004
2006
San Diego Region United States
Vio
len
t C
rim
e R
ate
per
1,0
00 P
op
ula
tio
n
SOURCES: SANDAG; U.S. Department of Justice
Homicide
Over the past 25 years, the number of homicides peaked at 278 in 1991 and decreased fairly steadily to a low of 86 in 1998 (Figure 3 and Appendix Table 8). Between 1998 and 2002, the number of homicides ranged between 86 and 106, but jumped to 130 and 128 in 2003 and 2004, respectively. There was a one-year drop to 98 in 2005, but another increase to 126 in 2006. (Appendix Table 1). This possible trend of increased violence also has been reported in a number of other large U.S. cities, including Boston, Cincinnati, Detroit, and Miami. According to the Police Executive Research
Forum (PERF)5, this recent change in the extent and nature of violent crime may be more than just a “blip” and deserves attention and resources before a true tipping point occurs.
Figure 3 NUMBER OF HOMICIDES INCREASED
AGAIN IN PAST YEAR
125
86 87
278
177
98
126
124
0
50
100
150
200
250
300
1982
1984
1986
1988
1990
1992
1994
1996
1998
2000
2002
2004
2006
Nu
mb
er o
f H
om
icid
es
SOURCE: SANDAG
Rape
There were 777 rapes reported in the San Diego region in 2006, which was a five percent decrease from 2005 (when there were 814) (Appendix Table 1). As Figure 4 and Appendix Table 8 show, the number of rapes reported to law enforcement has remained relatively stable over the past 25 years, compared to the number of homicides during the same period of time. The greatest number of rapes reported to law enforcement was 969 in 1991, and the lowest was 596 in 1985. In 2006, 79 percent of the rapes reported to law enforcement were completed and 21 percent were attempted (not shown).
5 Police Executive Research Forum (2006). Chief Concerns – A Gathering Storm – Violent Crime in America 2006. Available on-line at www.policeforum.org.
5
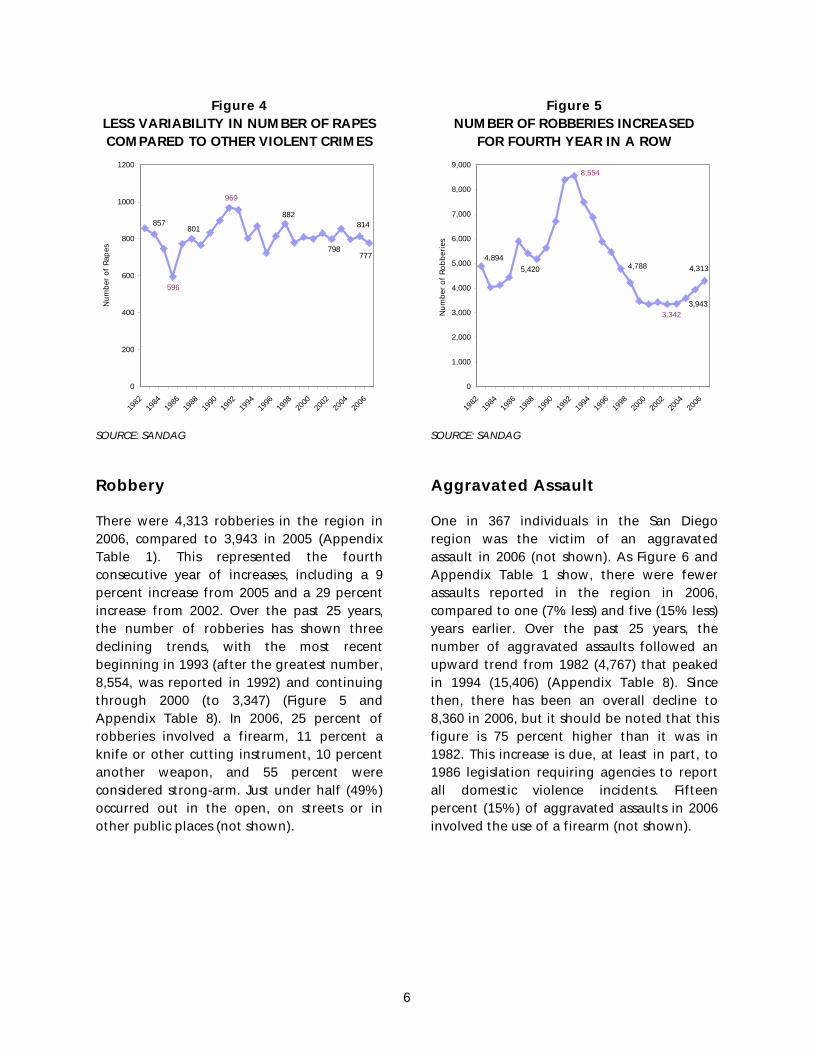
Figure 4 LESS VARIABILITY IN NUMBER OF RAPES COMPARED TO OTHER VIOLENT CRIMES
857882
596
801
969
798
814
777
0
200
400
600
800
1000
1200
1982
1984
1986
1988
1990
1992
1994
1996
1998
2000
2002
2004
2006
Nu
mb
er o
f R
apes
SOURCE: SANDAG
Robbery
There were 4,313 robberies in the region in 2006, compared to 3,943 in 2005 (Appendix Table 1). This represented the fourth consecutive year of increases, including a 9 percent increase from 2005 and a 29 percent increase from 2002. Over the past 25 years, the number of robberies has shown three declining trends, with the most recent beginning in 1993 (after the greatest number, 8,554, was reported in 1992) and continuing through 2000 (to 3,347) (Figure 5 and Appendix Table 8). In 2006, 25 percent of robberies involved a firearm, 11 percent a knife or other cutting instrument, 10 percent another weapon, and 55 percent were considered strong-arm. Just under half (49%) occurred out in the open, on streets or in other public places (not shown).
Figure 5 NUMBER OF ROBBERIES INCREASED
FOR FOURTH YEAR IN A ROW
4,313
3,9433,342
4,894
5,420
8,554
4,788
0
1,000
2,000
3,000
4,000
5,000
6,000
7,000
8,000
9,000
1982
1984
1986
1988
1990
1992
1994
1996
1998
2000
2002
2004
2006
Nu
mb
er o
f R
ob
ber
ies
SOURCE: SANDAG
Aggravated Assault
One in 367 individuals in the San Diego region was the victim of an aggravated assault in 2006 (not shown). As Figure 6 and Appendix Table 1 show, there were fewer assaults reported in the region in 2006, compared to one (7% less) and five (15% less) years earlier. Over the past 25 years, the number of aggravated assaults followed an upward trend from 1982 (4,767) that peaked in 1994 (15,406) (Appendix Table 8). Since then, there has been an overall decline to 8,360 in 2006, but it should be noted that this figure is 75 percent higher than it was in 1982. This increase is due, at least in part, to 1986 legislation requiring agencies to report all domestic violence incidents. Fifteen percent (15%) of aggravated assaults in 2006 involved the use of a firearm (not shown).
6

In 2006, there were almost three simple assaults for every aggravated assault that was reported (for a total of 22,220 simple assaults), which are not included in these Part I statistics. Simple assaults include all assaults and attempted assaults which are not of an aggravated nature and do not result in serious injury to the victim (not shown).
Figure 6 NUMBER OF AGGRAVATED ASSAULTS
CONTINUED TO DECLINE
8,360
8,996
9,8059,883
4,767
15,406
12,209
0
2,000
4,000
6,000
8,000
10,000
12,000
14,000
16,000
18,000
1982
1984
1986
1988
1990
1992
1994
1996
1998
2000
2002
2004
2006
Nu
mb
er o
f A
gg
rava
ted
Ass
ault
s
SOURCE: SANDAG
PROPERTY CRIME
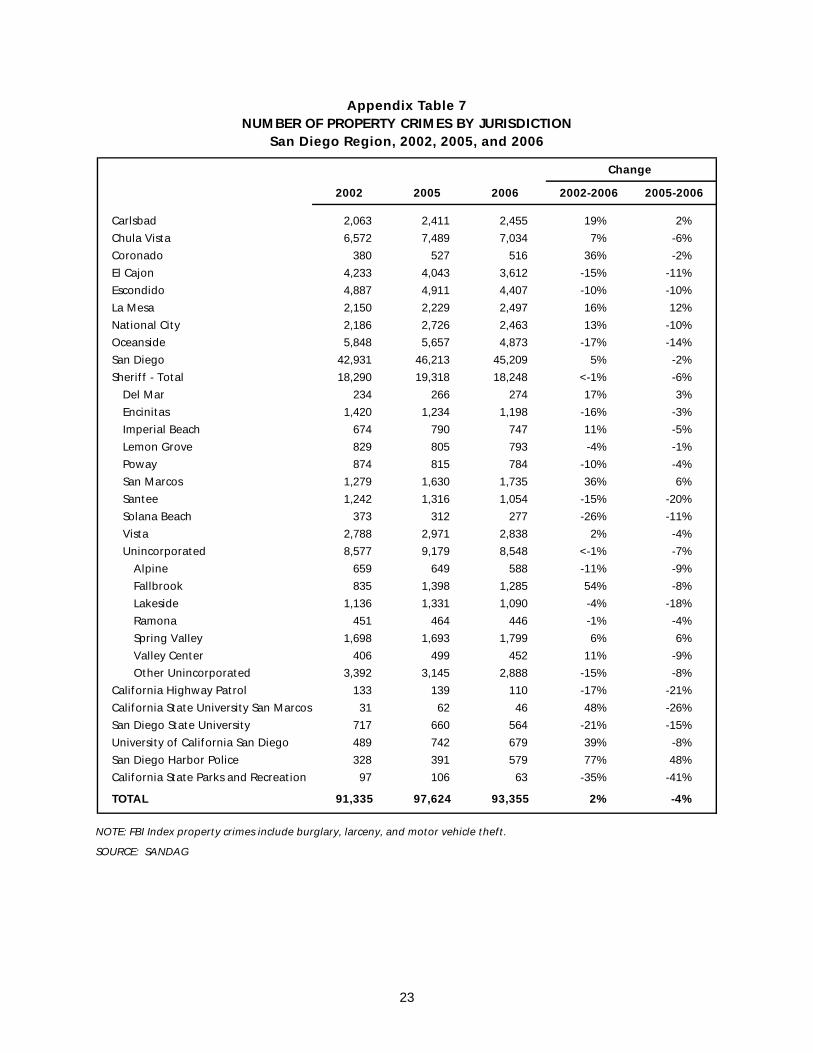
With 93,355 property crimes reported (Appendix Tables 1 and 7), one in every 33 residents was the victim of a property crime in 2006, and almost nine in every ten crimes (87%) reported to law enforcement in the region represented property crime (not shown). In contrast to the 2006 violent crime rate, which was at its lowest point in 25 years, the property crime rate was at its lowest point in 2000 (28.67 per 1,000 population) (Figure 7). In 2006, the property crime rate of 30.44 was 6 percent higher than this 25-year low, but was still 45 percent lower than it was in 1982.
Over half (55%) of all property crimes in 2006 were larcenies, 26 percent were motor vehicle thefts, and 19 percent were burglaries (not shown).
Figure 7 PROPERTY CRIME RATE DECREASED
SLIGHTLY FOR THIRD YEAR
28.67
31.28 32.12
30.44
63.5855.66
67.26
38.20
0.00
10.00
20.00
30.00
40.00
50.00
60.00
70.00
80.00
1982
1984
1986
1988
1990
1992
1994
1996
1998
2000
2002
2004
2006
Pro
per
ty C
rim
e R
ate
per
1,0
00 P
op
ula
tio
n
SOURCES: SANDAG; California Department of Finance;
U.S. Census 1990; U.S. Census 2000
Across the region, 20 jurisdictions had a lower property crime rate in 2006 than 2005, and 5 had a higher rate. These 2006 rates ranged from 12.54 (in Ramona) to 60.57 (in Del Mar) per 1,000 (Appendix Table 4 and Appendix Map 2)6. When interpreting these statistics, it is important to note that a variety of factors can affect a jurisdiction’s crime rate, such as daytime populations and accessibility.
In terms of dollar value, over $293 million worth of property was stolen in the San Diego region in 2006, compared to approximately $269 million in 2005 (Appendix Table 17). Forty-two percent (42%) of this property, which was valued at almost $124 million, was recovered in 2006 (Appendix Tables 18 and 19).
6 The number of property crimes reported in each jurisdiction for 2002 through 2006 also are presented in Appendix Tables 10 through 14.
7

Figure 8 compares property crimes reported to law enforcement in the San Diego region from 1982 through 2006 to national statistics from 1982 through 2005 (the most recent available, as previously noted). In the early 1980s, the San Diego region had a similar property crime rate to the nation, but beginning in 1985, experienced a greater increase than the U.S. However, the local property crime rate began to decline in the mid 1990s, and has remained somewhat lower than the national rate since then. In 2005, the property crime rate for the region was 32.12, compared to 34.30 for the nation.
Figure 8 SAN DIEGO REGION HAS HAD A LOWER
PROPERTY CRIME RATE THAN THE NATION SINCE 1995
0
10
20
30
40
50
60
70
80
1982
1984
1986
1988
1990
1992
1994
1996
1998
2000
2002
2004
2006
San Diego Region United States
Pro
per
ty C
rim
e R
ate
per
1,0
00 P
op
ula
tio
n
SOURCES: SANDAG; U.S. Department of Justice
Burglary
Over the past 25 years, the number of burglaries was greatest between 1982 (32,385) and 1991 (34,844), when it began to decline in 1992, reaching a low of 15,230 in 1999. Since then, there have been several years of increases, as well as one small decrease (Figure 9 and Appendix Table 8). There were 17,855 burglaries in the San Diego
region in 2006, with slightly over half (55%) representing household burglaries, which equates to 1 in every 109 households being burglarized. In 2006, 31 percent of all burglaries involved a forced entry, with the rest described as no forced entry (51%) or unsuccessful/attempt (18%) (not shown).
Figure 9 NUMBER OF BURGLARIES INCREASED
SLIGHTLY FROM 2005
32,385
35,176
18,199
15,230
17,668
17,855
35,233
20,428
0
5,000
10,000
15,000
20,000
25,000
30,000
35,000
40,000
1982
1984
1986
1988
1990
1992
1994
1996
1998
2000
2002
2004
2006
Nu
mb
er o
f B
urg
lari
es
SOURCE: SANDAG
Larceny
Larceny, or theft, is the most common crime, with one reported to law enforcement about every ten minutes in 2006 (not shown). Beginning in 1985, the number of larcenies reported in the San Diego region began an upward trend, peaking at 85,448 in 1989, and then decreasing to a low of 47,851 in 2000 (Figure 10 and Appendix Table 8). Since then, there were four years of increases, with decreases seen again in 2005 and 2006 (to 51,454). The most common larceny type was theft from inside motor vehicles (47%), with the second most common from buildings (19%). Additionally, most larcenies (62%) involved property valued at $400 or less (not shown).
8
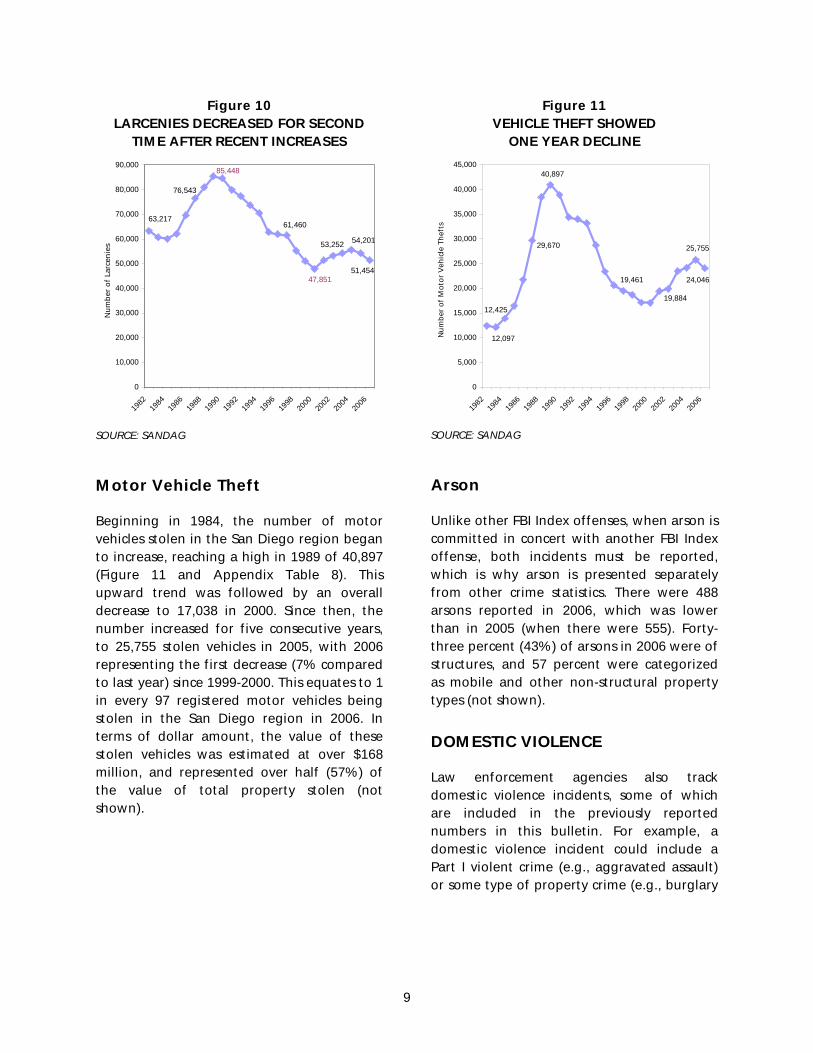
Figure 10 LARCENIES DECREASED FOR SECOND
TIME AFTER RECENT INCREASES
53,252
61,460
76,543
85,448
63,217
54,201
51,45447,851
0
10,000
20,000
30,000
40,000
50,000
60,000
70,000
80,000
90,000
1982
1984
1986
1988
1990
1992
1994
1996
1998
2000
2002
2004
2006
Nu
mb
er o
f La
rcen
ies
SOURCE: SANDAG
Motor Vehicle Theft
Beginning in 1984, the number of motor vehicles stolen in the San Diego region began to increase, reaching a high in 1989 of 40,897 (Figure 11 and Appendix Table 8). This upward trend was followed by an overall decrease to 17,038 in 2000. Since then, the number increased for five consecutive years, to 25,755 stolen vehicles in 2005, with 2006 representing the first decrease (7% compared to last year) since 1999-2000. This equates to 1 in every 97 registered motor vehicles being stolen in the San Diego region in 2006. In terms of dollar amount, the value of these stolen vehicles was estimated at over $168 million, and represented over half (57%) of the value of total property stolen (not shown).
Figure 11 VEHICLE THEFT SHOWED
ONE YEAR DECLINE
12,097
12,425
25,755
24,046
40,897
29,670
19,884
19,461
0
5,000
10,000
15,000
20,000
25,000
30,000
35,000
40,000
45,000
1982
1984
1986
1988
1990
1992
1994
1996
1998
2000
2002
2004
2006
Nu
mb
er o
f M
oto
r V
ehic
le T
hef
ts
SOURCE: SANDAG
Arson
Unlike other FBI Index offenses, when arson is committed in concert with another FBI Index offense, both incidents must be reported, which is why arson is presented separately from other crime statistics. There were 488 arsons reported in 2006, which was lower than in 2005 (when there were 555). Forty-three percent (43%) of arsons in 2006 were of structures, and 57 percent were categorized as mobile and other non-structural property types (not shown).
DOMESTIC VIOLENCE
Law enforcement agencies also track domestic violence incidents, some of which are included in the previously reported numbers in this bulletin. For example, a domestic violence incident could include a Part I violent crime (e.g., aggravated assault) or some type of property crime (e.g., burglary
9

or vandalism). Over the past ten years7, the number of domestic violence incidents has varied from a high of 24,266 in 1997 to a low of 19,886 in 2006 (Figure 12). This represented the fourth consecutive decrease.
Across the 19 jurisdictions (statistics are not available for the unincorporated areas separately), 8 agencies reported one-year increases in the number of domestic violence incidents (ranging from 1% to 27%), 10 reported decreases (ranging from 1% to 17%), and one had a small number of incidents across the years, limiting the types of valid comparisons that could be made (Appendix Table 9).
Figure 12 DOMESTIC VIOLENCE DOWN
FOR FOURTH CONSECUTIVE YEAR
24,266
19,886
21,10421,855
0
5,000
10,000
15,000
20,000
25,000
30,000
19971998
19992000
20012002
20032004
20052006
Nu
mb
er o
f D
om
esti
c V
iole
nce
Inci
den
ts
SOURCE: SANDAG
CLEARANCE RATES
A crime is cleared or solved for crime-reporting purposes when at least one person
7 Due to changes to legislation regarding mandated reporting, only ten years of trend data are compared for statistical purposes.
is arrested and charged with the offense8. Not surprisingly, the clearance rates in 2006 varied by crime type, with violent crimes cleared more frequently than property crimes. Overall, 48 percent of violent crimes that were open for investigation in the region were cleared (with a range across departments of 25% to 83%), compared to 12 percent of property crimes (with a range of 5% to 22%) (Appendix Tables 15 and 16). As Figure 13 shows, the crimes of homicide and aggravated assault consistently have had the highest clearance rates, which is related to the fact that these crimes more frequently involve individuals with face-to-face contact. While the motor vehicle theft clearance rate is the lowest of the seven Part I crimes, it is important to note that the vehicle recovery rate is higher (68% of the dollar value of stolen vehicles) (not shown).
Figure 13 HOMICIDES AND ASSAULTS HAVE THE HIGHEST CLEARANCE RATES
59%
83%
54%41%
35%31%
72%
58%
15%
15%17%
14%
4%7%0%
20%
40%
60%
80%
100%
1997 1998 1999 2000 2001 2002 2003 2004 2005 2006
Homicide RapeRobbery Aggravated AssaultBurglary LarcenyMV Theft
Perc
ent
of
Cri
mes
Cle
ared
SOURCE: SANDAG
8 It is important to note that a crime that occurred in one calendar year may be cleared in that year or a future year.
10
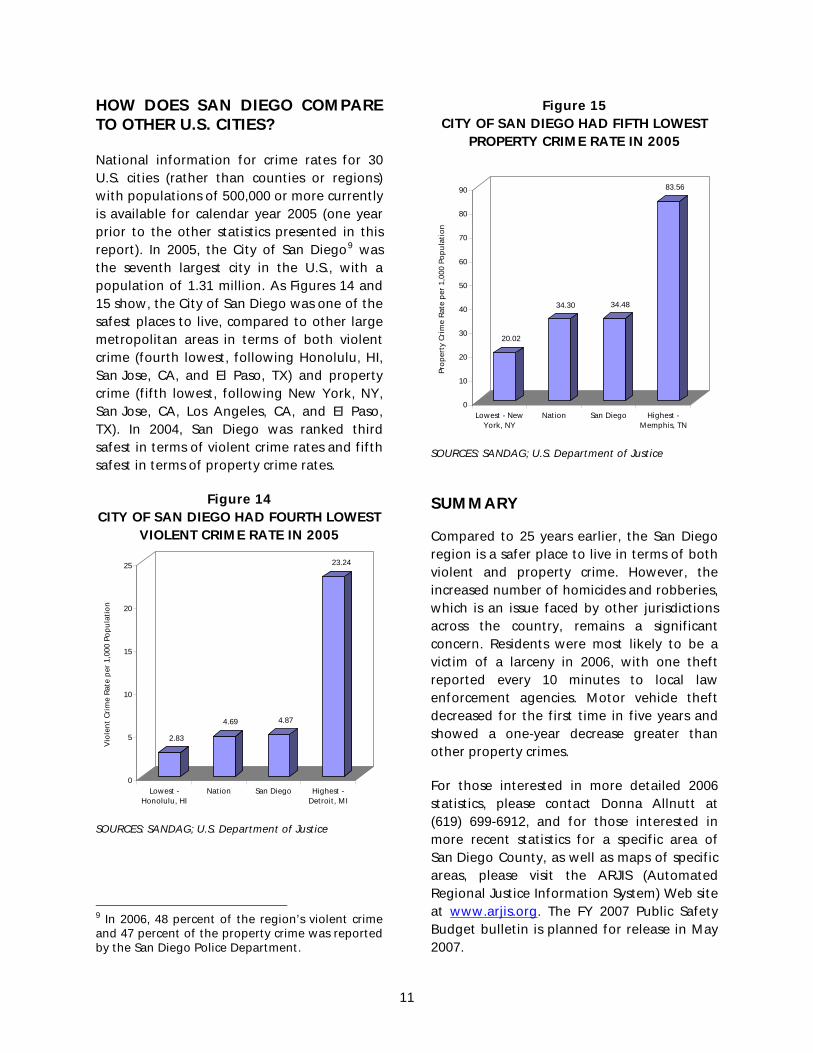
HOW DOES SAN DIEGO COMPARE TO OTHER U.S. CITIES?
Figure 15 CITY OF SAN DIEGO HAD FIFTH LOWEST
PROPERTY CRIME RATE IN 2005 National information for crime rates for 30
U.S. cities (rather than counties or regions) with populations of 500,000 or more currently is available for calendar year 2005 (one year prior to the other statistics presented in this report). In 2005, the City of San Diego9 was the seventh largest city in the U.S., with a population of 1.31 million. As Figures 14 and 15 show, the City of San Diego was one of the safest places to live, compared to other large metropolitan areas in terms of both violent crime (fourth lowest, following Honolulu, HI, San Jose, CA, and El Paso, TX) and property crime (fifth lowest, following New York, NY, San Jose, CA, Los Angeles, CA, and El Paso, TX). In 2004, San Diego was ranked third safest in terms of violent crime rates and fifth safest in terms of property crime rates.
20.02
34.30 34.48
83.56
0
10
20
30
40
50
60
70
80
90
Lowest - NewYork, NY
Nation San Diego Highest -Memphis, TN
Pro
per
ty C
rim
e R
ate
per
1,0
00 P
op
ula
tio
n
SOURCES: SANDAG; U.S. Department of Justice
Figure 14 SUMMARY
CITY OF SAN DIEGO HAD FOURTH LOWEST VIOLENT CRIME RATE IN 2005 Compared to 25 years earlier, the San Diego
region is a safer place to live in terms of both violent and property crime. However, the increased number of homicides and robberies, which is an issue faced by other jurisdictions across the country, remains a significant concern. Residents were most likely to be a victim of a larceny in 2006, with one theft reported every 10 minutes to local law enforcement agencies. Motor vehicle theft decreased for the first time in five years and showed a one-year decrease greater than other property crimes.
2.83
4.69 4.87
23.24
0
5
10
15
20
25
Lowest -Honolulu, HI
Nation San Diego Highest -Detroit, MI
Vio
len
t C
rim
e R
ate
per
1,0
00 P
op
ula
tio
n
For those interested in more detailed 2006 statistics, please contact Donna Allnutt at (619) 699-6912, and for those interested in more recent statistics for a specific area of San Diego County, as well as maps of specific areas, please visit the ARJIS (Automated Regional Justice Information System) Web site at www.arjis.org. The FY 2007 Public Safety Budget bulletin is planned for release in May 2007.
SOURCES: SANDAG; U.S. Department of Justice
9 In 2006, 48 percent of the region’s violent crime and 47 percent of the property crime was reported by the San Diego Police Department.
11


APPENDIX


15

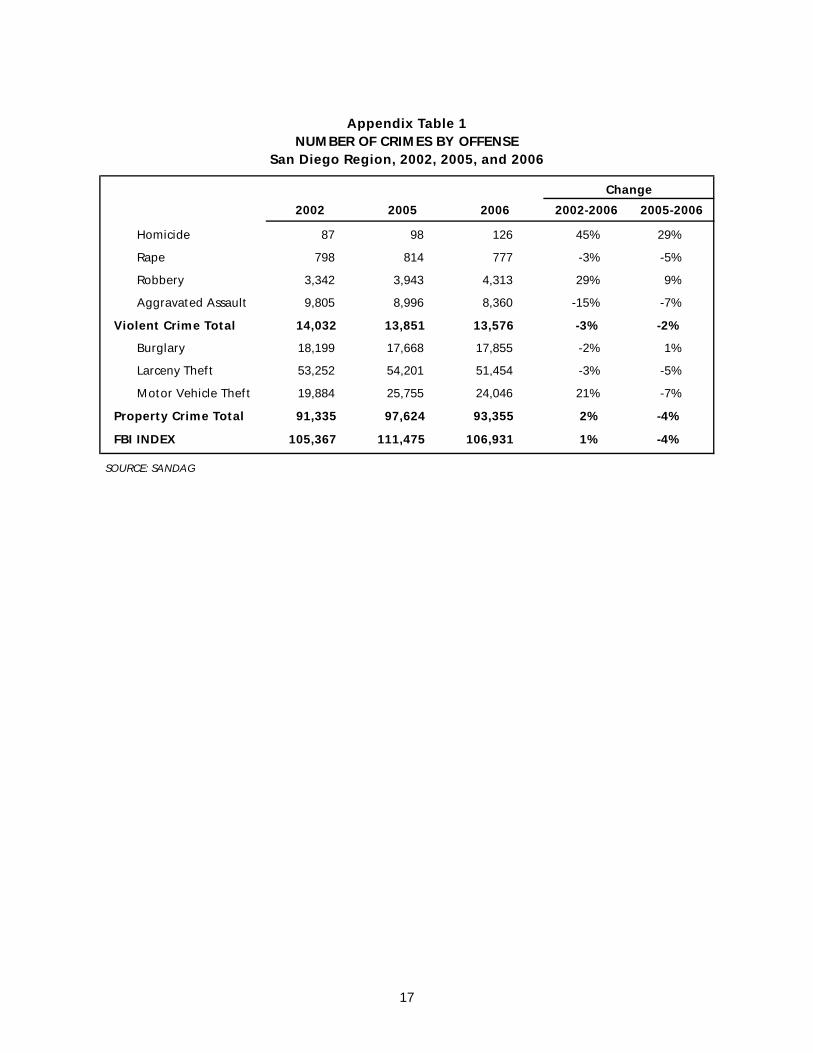
Appendix Table 1
NUMBER OF CRIMES BY OFFENSE San Diego Region, 2002, 2005, and 2006
2002 2005 2006 2002-2006 2005-2006
Homicide 87 98 126 45% 29%
Rape 798 814 777 -3% -5%
Robbery 3,342 3,943 4,313 29% 9%
Aggravated Assault 9,805 8,996 8,360 -15% -7%
Violent Crime Total 14,032 13,851 13,576 -3% -2%
Burglary 18,199 17,668 17,855 -2% 1%
Larceny Theft 53,252 54,201 51,454 -3% -5%
Motor Vehicle Theft 19,884 25,755 24,046 21% -7%
Property Crime Total 91,335 97,624 93,355 2% -4%
FBI INDEX 105,367 111,475 106,931 1% -4%
Change
SOURCE: SANDAG
17
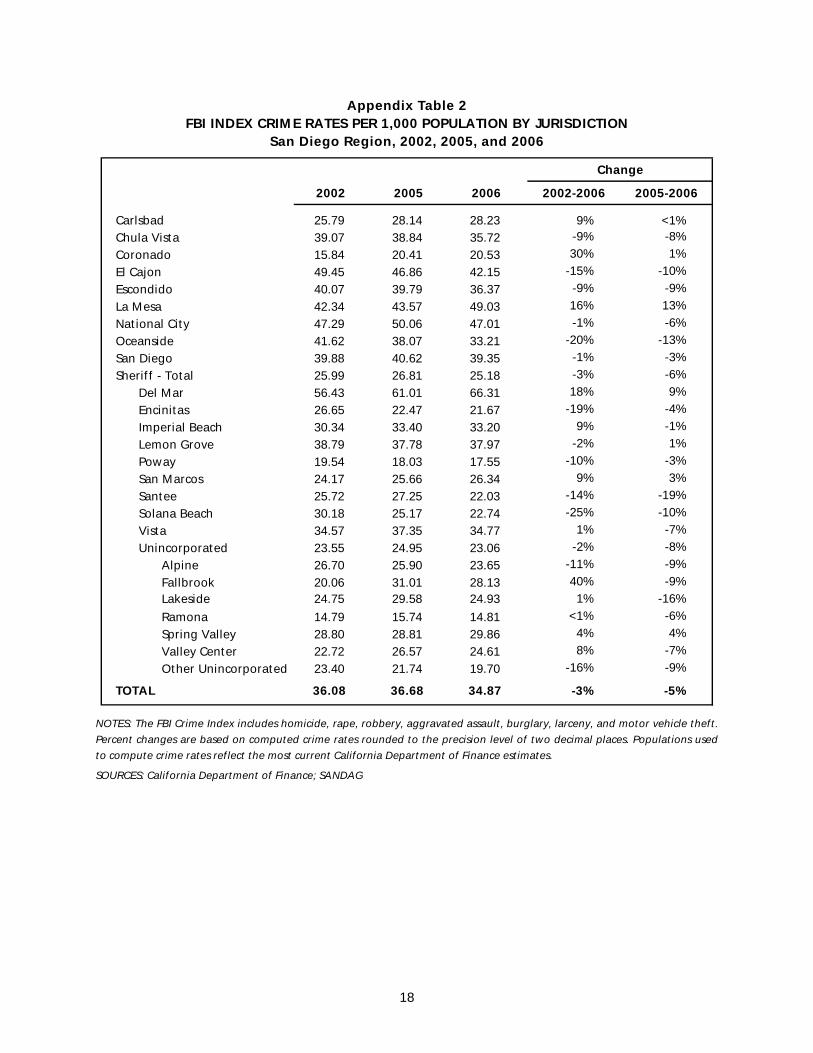
Appendix Table 2 FBI INDEX CRIME RATES PER 1,000 POPULATION BY JURISDICTION
San Diego Region, 2002, 2005, and 2006
Change
2002 2005 2006 2002-2006 2005-2006
Carlsbad 25.79 28.14 28.23 9% <1%Chula Vista 39.07 38.84 35.72 -9% -8%
Coronado 15.84 20.41 20.53 30% 1%
El Cajon 49.45 46.86 42.15 -15% -10%
Escondido 40.07 39.79 36.37 -9% -9%
La Mesa 42.34 43.57 49.03 16% 13%
National City 47.29 50.06 47.01 -1% -6%
Oceanside 41.62 38.07 33.21 -20% -13%
San Diego 39.88 40.62 39.35 -1% -3%
Sheriff - Total 25.99 26.81 25.18 -3% -6%
Del Mar 56.43 61.01 66.31 18% 9%
Encinitas 26.65 22.47 21.67 -19% -4%
Imperial Beach 30.34 33.40 33.20 9% -1%
Lemon Grove 38.79 37.78 37.97 -2% 1%
Poway 19.54 18.03 17.55 -10% -3%
San Marcos 24.17 25.66 26.34 9% 3%
Santee 25.72 27.25 22.03 -14% -19%
Solana Beach 30.18 25.17 22.74 -25% -10%
Vista 34.57 37.35 34.77 1% -7%
Unincorporated 23.55 24.95 23.06 -2% -8%
Alpine 26.70 25.90 23.65 -11% -9%
Fallbrook 20.06 31.01 28.13 40% -9% Lakeside 24.75 29.58 24.93 1% -16%
Ramona 14.79 15.74 14.81 <1% -6%
Spring Valley 28.80 28.81 29.86 4% 4%
Valley Center 22.72 26.57 24.61 8% -7%
Other Unincorporated 23.40 21.74 19.70 -16% -9%
TOTAL 36.08 36.68 34.87 -3% -5%
NOTES: The FBI Crime Index includes homicide, rape, robbery, aggravated assault, burglary, larceny, and motor vehicle theft.
Percent changes are based on computed crime rates rounded to the precision level of two decimal places. Populations used
to compute crime rates reflect the most current California Department of Finance estimates.
SOURCES: California Department of Finance; SANDAG
18

Appendix Table 3 VIOLENT CRIME RATE PER 1,000 POPULATION BY JURISDICTION
San Diego Region, 2002, 2005, and 2006
Change
2002 2005 2006 2002-2006 2005-2006
Carlsbad 2.38 2.70 3.34 40% 24%
Chula Vista 4.66 4.28 4.24 -9% -1%
Coronado 1.05 0.82 0.88 -- --
El Cajon 5.62 5.32 4.86 -14% -9%
Escondido 4.43 4.91 5.07 14% 3%
La Mesa 3.72 3.60 4.22 13% 17%
National City 9.51 7.17 8.25 -13% 15%
Oceanside 6.67 5.64 5.35 -20% -5%
San Diego 5.72 5.08 4.87 -15% -4%
Sheriff - Total 3.30 3.72 3.50 6% -6%
Del Mar 4.44 2.21 5.75 -- --
Encinitas 2.95 2.73 2.59 -12% -5%
Imperial Beach 5.88 4.78 6.10 4% 28%
Lemon Grove 6.08 6.13 6.70 10% 9%
Poway 1.95 1.88 2.04 5% 9%
San Marcos 3.14 3.26 3.73 19% 14%
Santee 2.57 3.00 2.76 7% -8%
Solana Beach 2.11 1.80 1.95 -- --
Vista 4.30 5.65 4.72 10% -16%
Unincorporated 3.09 3.68 3.25 5% -12%
Alpine 2.73 2.68 2.61 -4% -3%
Fallbrook 2.77 3.49 2.82 2% -19%
Lakeside 3.02 4.13 3.86 28% -7%
Ramona 1.69 2.70 2.28 35% -16%
Spring Valley 4.23 4.64 4.07 -4% -12%
Valley Center 4.20 3.63 3.82 -9% 5%
Other Unincorporated 2.93 3.59 3.10 6% -14%
TOTAL 4.81 4.56 4.43 -8% -3%
NOTES: FBI Index violent crimes include homicide, rape, robbery, and aggravated assault. Percent changes are based on
computed crime rates rounded to the precision level of two decimal places. Populations used to compute crime rates reflect
the most current California Department of Finance estimates. Percent changes are not presented for crime rates based on
offense numbers of 30 or less.
SOURCES: California Department of Finance; SANDAG
19
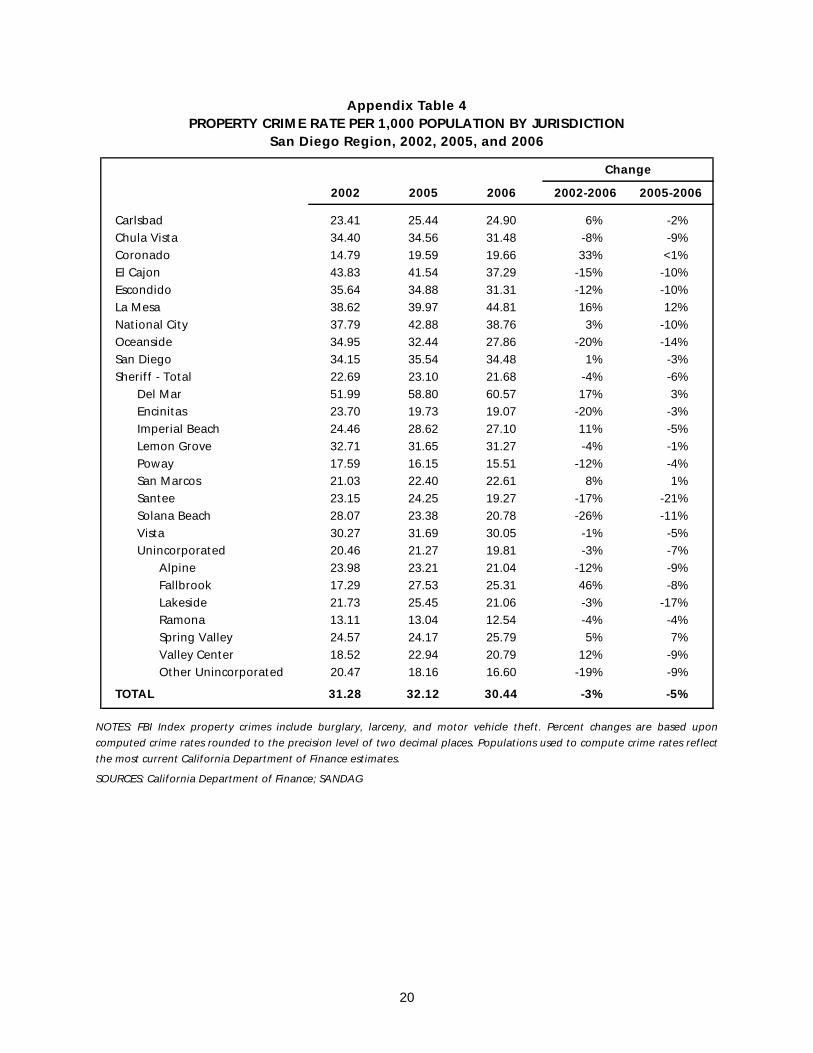
Appendix Table 4 PROPERTY CRIME RATE PER 1,000 POPULATION BY JURISDICTION
San Diego Region, 2002, 2005, and 2006
Change
2002 2005 2006 2002-2006 2005-2006
Carlsbad 23.41 25.44 24.90 6% -2% Chula Vista 34.40 34.56 31.48 -8% -9% Coronado 14.79 19.59 19.66 33% <1%El Cajon 43.83 41.54 37.29 -15% -10% Escondido 35.64 34.88 31.31 -12% -10% La Mesa 38.62 39.97 44.81 16% 12% National City 37.79 42.88 38.76 3% -10% Oceanside 34.95 32.44 27.86 -20% -14% San Diego 34.15 35.54 34.48 1% -3% Sheriff - Total 22.69 23.10 21.68 -4% -6%
Del Mar 51.99 58.80 60.57 17% 3% Encinitas 23.70 19.73 19.07 -20% -3% Imperial Beach 24.46 28.62 27.10 11% -5% Lemon Grove 32.71 31.65 31.27 -4% -1% Poway 17.59 16.15 15.51 -12% -4% San Marcos 21.03 22.40 22.61 8% 1% Santee 23.15 24.25 19.27 -17% -21% Solana Beach 28.07 23.38 20.78 -26% -11% Vista 30.27 31.69 30.05 -1% -5% Unincorporated 20.46 21.27 19.81 -3% -7%
Alpine 23.98 23.21 21.04 -12% -9% Fallbrook 17.29 27.53 25.31 46% -8% Lakeside 21.73 25.45 21.06 -3% -17% Ramona 13.11 13.04 12.54 -4% -4% Spring Valley 24.57 24.17 25.79 5% 7% Valley Center 18.52 22.94 20.79 12% -9% Other Unincorporated 20.47 18.16 16.60 -19% -9%
TOTAL 31.28 32.12 30.44 -3% -5%
NOTES: FBI Index property crimes include burglary, larceny, and motor vehicle theft. Percent changes are based upon
computed crime rates rounded to the precision level of two decimal places. Populations used to compute crime rates reflect
the most current California Department of Finance estimates.
SOURCES: California Department of Finance; SANDAG
20

Appendix Table 5 NUMBER OF FBI INDEX CRIMES BY JURISDICTION
San Diego Region, 2002, 2005, and 2006
Change
2002 2005 2006 2002-2006 2005-2006
Carlsbad 2,273 2,667 2,784 22% 4%
Chula Vista 7,463 8,416 7,981 7% -5%
Coronado 407 549 539 32% -2%
El Cajon 4,776 4,561 4,083 -15% -10%
Escondido 5,495 5,603 5,120 -7% -9%
La Mesa 2,357 2,430 2,732 16% 12%
National City 2,736 3,182 2,987 9% -6%
Oceanside 6,964 6,640 5,809 -17% -13%
San Diego 50,124 52,816 51,600 3% -2%
Sheriff - Total 20,948 22,425 21,190 1% -6%
Del Mar 254 276 300 18% 9%
Encinitas 1,597 1,405 1,361 -15% -3%
Imperial Beach 836 922 915 9% -1%
Lemon Grove 983 961 963 -2% <1%
Poway 971 910 887 -9% -3%
San Marcos 1,470 1,867 2,021 37% 8%
Santee 1,380 1,479 1,205 -13% -19%
Solana Beach 401 336 303 -24% -10%
Vista 3,184 3,501 3,284 3% -6%
Unincorporated 9,872 10,768 9,951 1% -8%
Alpine 734 724 661 -10% -9%
Fallbrook 969 1,575 1,428 47% -9%
Lakeside 1,294 1,547 1,290 <-1% -17%
Ramona 509 560 527 4% -6%
Spring Valley 1,990 2,018 2,083 5% 3%
Valley Center 498 578 535 7% -7%
Other Unincorporated 3,878 3,766 3,427 -12% -9%
California Highway Patrol 134 159 126 -6% -21%
California State University San Marcos 31 65 48 55% -26%
San Diego State University 730 689 589 -19% -15%
University of California San Diego 493 754 682 38% -10%
San Diego Harbor Police 337 408 595 77% 46%
California State Parks and Recreation 99 111 66 -33% -41%
TOTAL 105,367 111,475 106,931 1% -4%
NOTE: The FBI Crime Index includes homicide, rape, robbery, aggravated assault, burglary, larceny, and motor vehicle theft.
SOURCE: SANDAG
21

Appendix Table 6 NUMBER OF VIOLENT CRIMES BY JURISDICTION
San Diego Region, 2002, 2005, and 2006
Change
2002 2005 2006 2002-2006 2005-2006
Carlsbad 210 256 329 57% 29%
Chula Vista 891 927 947 6% 2%
Coronado 27 22 23 -- --
El Cajon 543 518 471 -13% -9%
Escondido 608 692 713 17% 3%
La Mesa 207 201 235 14% 17%
National City 550 456 524 -5% 15%
Oceanside 1,116 983 936 -16% -5%
San Diego 7,193 6,603 6,391 -11% -3%
Sheriff - Total 2,658 3,107 2,942 11% -5%
Del Mar 20 10 26 -- --
Encinitas 177 171 163 -8% -5%
Imperial Beach 162 132 168 4% 27%
Lemon Grove 154 156 170 10% 9%
Poway 97 95 103 6% 8%
San Marcos 191 237 286 50% 21%
Santee 138 163 151 9% -7%
Solana Beach 28 24 26 -- --
Vista 396 530 446 13% -16%
Unincorporated 1,295 1,589 1,403 8% -12%
Alpine 75 75 73 -3% -3%
Fallbrook 134 177 143 7% -19%
Lakeside 158 216 200 27% -7%
Ramona 58 96 81 40% -16%
Spring Valley 292 325 284 -3% -13%
Valley Center 92 79 83 -10% 5%
Other Unincorporated 486 621 539 11% -13%
California Highway Patrol 1 20 16 -- --
California State University San Marcos 0 3 2 -- --
San Diego State University 13 29 25 -- --
University of California San Diego 4 12 3 -- --
San Diego Harbor Police 9 17 16 -- --
California State Parks and Recreation 2 5 3 -- --
TOTAL 14,032 13,851 13,576 -3% -2%
NOTES: FBI Index violent crimes include homicide, rape, robbery, and aggravated assault. Percent changes are not presented
for offense numbers of 30 or less.
SOURCE: SANDAG
22
23
Change
2002 2005 2006 2002-2006 2005-2006
Carlsbad 2,063 2,411 2,455 19% 2%
Chula Vista 6,572 7,489 7,034 7% -6%
Coronado 380 527 516 36% -2%
El Cajon 4,233 4,043 3,612 -15% -11%
Escondido 4,887 4,911 4,407 -10% -10%
La Mesa 2,150 2,229 2,497 16% 12%
National City 2,186 2,726 2,463 13% -10%
Oceansi
San Di
Sheriff -
Del M
Encini
Imper
Lem
Poway
San M
Sant
Sola
Vista
Uninc
Alpi
Fall
Lakes
Ram
Spr
Val
Ot
Californ
Californ
San Di
Univers
San Di
Californ
TOTAL
SOURCE: SANDAG
NOTE: FBI Index property crimes include burglary, larceny, and motor vehicle theft.
de 5,848 5,657 4,873 -17% -14%
ego 42,931 46,213 45,209 5% -2%
Total 18,290 19,318 18,248 <-1% -6%
ar 234 266 274 17% 3%
tas 1,420 1,234 1,198 -16% -3%
ial Beach 674 790 747 11% -5%
on Grove 829 805 793 -4% -1%
874 815 784 -10% -4%
arcos 1,279 1,630 1,735 36% 6%
ee 1,242 1,316 1,054 -15% -20%
na Beach 373 312 277 -26% -11%
2,788 2,971 2,838 2% -4%
orporated 8,577 9,179 8,548 <-1% -7%
ne 659 649 588 -11% -9%
brook 835 1,398 1,285 54% -8%
ide 1,136 1,331 1,090 -4% -18%
ona 451 464 446 -1% -4%
ing Valley 1,698 1,693 1,799 6% 6%
ley Center 406 499 452 11% -9%
her Unincorporated 3,392 3,145 2,888 -15% -8%
ia Highway Patrol 133 139 110 -17% -21%
ia State University San Marcos 31 62 46 48% -26%
ego State University 717 660 564 -21% -15%
ity of California San Diego 489 742 679 39% -8%
ego Harbor Police 328 391 579 77% 48%
ia State Parks and Recreation 97 106 63 -35% -41%
91,335 97,624 93,355 2% -4%
NUMBER OF PROPERTY CRIMES BY JURISDICTION San Diego Region, 2002, 2005, and 2006
Appendix Table 7

24
1997
1998
1999
2000
2001
2002
2003
2004
2005
2006
NOTES: The FBI Crime Index includes homicide, rape, robbery, and aggravated assault in the violent category and burglary, larceny, and motor vehicle theft in the property category. The
California Crime Index includes all FBI Index crimes except larceny.
Homicide Rape RobberyAggravated
AssaultResidential
Burglary
Non-Residential
BurglaryTotal
Burglary
LarcenyOver$400
Larceny$400 and
UnderTotal
Larceny
MotorVehicleTheft
FBICrimeIndex
CaliforniaCrimeIndex Population
125 882 4,788 12,209 12,675 7,753 20,428 17,699 43,761 61,460 19,461 119,353 57,893 2,653,400
86 779 4,227 11,501 10,966 7,412 18,378 16,484 38,767 55,251 18,685 108,907 53,656 2,702,800
106 810 3,468 9,915 8,772 6,458 15,230 15,820 35,263 51,083 17,113 97,725 46,642 2,751,000
97 801 3,347 9,504 9,066 6,711 15,777 15,457 32,394 47,851 17,038 94,415 46,564 2,813,833
92 830 3,430 10,237 9,681 7,044 16,725 17,164 34,156 51,320 19,421 102,055 50,735 2,863,657
87 798 3,342 9,805 10,236 7,963 18,199 18,568 34,684 53,252 19,884 105,367 52,115 2,920,010
130 856 3,375 9,646 10,706 8,187 18,893 18,179 36,102 54,281 23,460 110,641 56,360 2,971,805
128 797 3,588 9,367 10,108 7,437 17,545 19,293 36,376 55,669 24,172 111,266 55,597 3,013,014
98 814 3,943 8,996 9,948 7,720 17,668 19,892 34,309 54,201 25,755 111,475 57,274 3,039,277
126 777 4,313 8,360 9,783 8,072 17,855 19,657 31,797 51,454 24,046 106,931 55,477 3,066,820
NUMBER OF CRIMES BY OFFENSE San Diego Region, 1997-2006
Appendix Table 8
SOURCE: SANDAG

25
Change
2002 2005 2006 2002-2006 2005-2006
Carlsbad 345 372 472 37% 27% Chula Vista 1,840 1,972 1,841 <1% -7% Coronado 62 54 50 -19% -7% El Cajon 903 732 634 -30% -13% Escondido 975 961 1,020 5% 6% La Mesa 347 352 363 5% 3% National City 598 577 479 -20% -17% Oceans 12% 2% San Di -20% -10% Sheriff 3% -5%
De -- --Enc 10% 27% Imper 9% 7% Le 10% -1% Pow -5% -14% Sa 5% 1% San -10% -11% So 12% 19% Vista 4% -1% Un 3% -10%
TOTAL -9% -6%
SOURCE: SANDAG
NOTES: Total includes a relatively small number of incidents reported by the San Diego Harbor Police, California Highway
Patrol, California Department of Parks and Recreation, California State University San Marcos, San Diego State University,
University of California San Diego, and individual unincorporated areas in the Sheriff's jurisdiction. If comparison numbers
equal 30 or less, percent changes are omitted.
ide 2,069 2,267 2,310 ego 10,856 9,614 8,673 - Total 3,827 4,153 3,951 l Mar 9 22 27 initas 203 176 223
ial Beach 215 220 235 mon Grove 150 167 165
ay 155 171 147 n Marcos 356 371 373
tee 308 309 276 lana Beach 34 32 38
521 551 543 incorporated 1,876 2,134 1,924
21,855 21,104 19,886
NUMBER OF DOMESTIC VIOLENCE INCIDENTS BY JURISDICTION San Diego Region, 2002, 2005, and 2006
Appendix Table 9

Appendix Table 10 NUMBER OF CRIMES BY OFFENSE BY JURISDICTION
San Diego Region, 2002
Homicide Rape RobberyAggravated
AssaultResidential
Burglary
Non-Residential
BurglaryTotal
Burglary
LarcenyOver$400
Larceny$400 and
UnderTotal
Larceny
MotorVehicleTheft Arson
FBICrimeIndex
CaliforniaCrimeIndex
Carlsbad 1 16 49 144 199 227 426 494 902 1,396 241 13 2,273 877 Chula Vista 5 50 257 579 621 447 1,068 1,079 2,654 3,733 1,771 86 7,463 3,730 Coronado 0 7 7 13 55 46 101 100 133 233 46 2 407 174 El Cajon 3 56 125 359 401 384 785 800 1,756 2,556 892 36 4,776 2,220 Escondido 4 40 165 399 567 393 960 962 2,149 3,111 816 21 5,495 2,384 La Mesa 2 11 89 105 180 195 375 436 974 1,410 365 12 2,357 947 National City 4 32 156 358 99 298 397 289 811 1,100 689 10 2,736 1,636 Oceanside 5 75 285 751 709 400 1,109 1,173 2,651 3,824 915 40 6,964 3,140 San Diego 47 330 1,627 5,189 4,599 3,040 7,639 9,020 15,557 24,577 10,715 206 50,124 25,547 Sheriff - Total 16 178 574 1,890 2,777 2,428 5,205 3,650 6,229 9,879 3,206 149 20,948 11,069
Del Mar 0 1 5 14 25 37 62 66 75 141 31 3 254 113 Encinitas 0 13 42 122 161 197 358 328 545 873 189 7 1,597 724 Imperial Beach 0 20 28 114 85 85 170 101 215 316 188 9 836 520 Lemon Grove 0 8 57 89 91 158 249 128 258 386 194 4 983 597 Poway 0 5 11 81 114 129 243 183 354 537 94 11 971 434 San Marcos 1 8 46 136 200 237 437 229 414 643 199 6 1,470 827 Santee 0 11 18 109 139 146 285 228 541 769 188 8 1,380 611 Solana Beach 0 1 13 14 60 52 112 84 128 212 49 2 401 189 Vista 4 23 112 257 408 378 786 577 1,013 1,590 412 13 3,184 1,594 Unincorporated 11 88 242 954 1,494 1,009 2,503 1,726 2,686 4,412 1,662 86 9,872 5,460
Alpine 3 4 15 53 97 68 165 133 219 352 142 8 734 382 Fallbrook 2 11 26 95 174 117 291 161 260 421 123 5 969 548 Lakeside 0 9 20 129 188 102 290 220 395 615 231 0 1,294 679 Ramona 1 3 12 42 59 67 126 98 166 264 61 4 509 245 Spring Valley 2 18 87 185 279 176 455 315 504 819 424 0 1,990 1,171 Valley Center 2 4 17 69 70 59 129 90 107 197 80 2 498 301 Other Unincorporated 1 39 65 381 627 420 1,047 709 1,035 1,744 601 67 3,878 2,134
California Highway Patrol 0 0 0 1 0 2 2 6 41 47 84 0 134 87 California State University San Marcos 0 0 0 0 0 4 4 5 20 25 2 0 31 6 San Diego State University 0 2 2 9 18 17 35 248 355 603 79 2 730 127 University of California San Diego 0 1 1 2 11 38 49 111 277 388 52 2 493 105 San Diego Harbor Police 0 0 4 5 0 14 14 174 140 314 0 1 337 23 California State Parks and Recreation 0 0 1 1 0 30 30 21 35 56 11 5 99 43
TOTAL 87 798 3,342 9,805 10,236 7,963 18,199 18,568 34,684 53,252 19,884 585 105,367 52,115
NOTE: The California Crime Index (CCI) includes all FBI Index crimes except larceny theft.
SOURCE: SANDAG
26

Appendix Table 11 NUMBER OF CRIMES BY OFFENSE BY JURISDICTION
San Diego Region, 2003
Homicide Rape RobberyAggravated
AssaultResidential
Burglary
Non-Residential
BurglaryTotal
Burglary
Larceny Over $400
Larceny $400 and
UnderTotal
Larceny
Motor Vehicle Theft Arson
FBI Crime Index
California Crime Index
Carlsbad 4 14 64 184 240 256 496 493 952 1,445 258 13 2,465 1,020 Chula Vista 7 48 249 472 606 398 1,004 1,137 2,817 3,954 2,148 44 7,882 3,928 Coronado 0 5 3 27 73 31 104 144 280 424 72 11 635 211 El Cajon 4 43 154 354 557 330 887 689 1,611 2,300 1,152 26 4,894 2,594 Escondido 5 46 161 379 499 464 963 952 2,142 3,094 997 32 5,645 2,551 La Mesa 2 12 66 93 198 160 358 367 847 1,214 554 15 2,299 1,085 National City 9 33 155 349 132 205 337 407 1,000 1,407 996 13 3,286 1,879 Oceanside 8 63 332 687 650 464 1,114 1,010 2,627 3,637 739 20 6,580 2,943 San Diego 65 406 1,626 5,269 4,925 3,151 8,076 9,155 16,584 25,739 12,567 238 53,748 28,009 Sheriff - Total 26 178 550 1,781 2,787 2,600 5,387 3,306 6,380 9,686 3,676 159 21,284 11,598
Del Mar 0 3 3 4 35 34 69 60 66 126 58 1 263 137 Encinitas 0 10 40 100 157 172 329 288 516 804 244 7 1,527 723 Imperial Beach 0 8 34 102 139 97 236 119 319 438 181 11 999 561 Lemon Grove 1 4 50 90 90 142 232 110 251 361 237 3 975 614 Poway 2 3 11 62 83 146 229 193 336 529 100 12 936 407 San Marcos 3 18 46 138 166 274 440 248 517 765 270 12 1,680 915 Santee 0 15 18 96 117 176 293 252 572 824 208 9 1,454 630 Solana Beach 0 3 5 12 40 63 103 70 87 157 38 1 318 161 Vista 2 30 122 227 405 430 835 397 896 1,293 474 26 2,983 1,690 Unincorporated 18 84 221 950 1,555 1,066 2,621 1,569 2,820 4,389 1,866 77 10,149 5,760
Alpine 0 1 11 54 88 76 164 126 198 324 146 1 700 376 Fallbrook 1 10 21 75 223 155 378 197 364 561 129 3 1,175 614 Lakeside 1 11 26 124 154 114 268 215 440 655 268 0 1,353 698 Ramona 2 5 7 79 79 105 184 116 282 398 54 1 729 331 Spring Valley 0 25 81 168 231 168 399 202 428 630 444 0 1,747 1,117 Valley Center 1 2 13 64 76 93 169 108 151 259 116 6 624 365 Other Unincorporated 13 30 62 386 704 355 1,059 605 957 1,562 709 66 3,821 2,259
California Highway Patrol 0 0 0 11 0 2 2 7 46 53 78 0 144 91 California State University San Marcos 0 0 0 1 0 6 6 6 19 25 1 0 33 8 San Diego State University 0 7 7 18 16 16 32 181 290 471 160 4 695 224 University of California San Diego 0 1 3 3 22 41 63 109 341 450 54 2 574 124 Harbor Police 0 0 4 9 0 25 25 184 128 312 2 3 352 40 California State Parks and Recreation 0 0 1 9 1 38 39 32 38 70 6 3 125 55
TOTAL 130 856 3,375 9,646 10,706 8,187 18,893 18,179 36,102 54,281 23,460 583 110,641 56,360
NOTE: The California Crime Index (CCI) includes all FBI Index crimes except larceny theft.
SOURCE: SANDAG
27

Appendix Table 12 NUMBER OF CRIMES BY OFFENSE BY JURISDICTION
San Diego Region, 2004
Homicide Rape RobberyAggravated
AssaultResidential
Burglary
Non-Residential
BurglaryTotal
Burglary
Larceny Over $400
Larceny $400 and
UnderTotal
Larceny
Motor Vehicle Theft Arson
FBI Crime Index
California Crime Index
Carlsbad 2 13 42 213 253 204 457 502 974 1,476 230 8 2,433 957 Chula Vista 15 50 296 477 687 497 1,184 1,252 2,735 3,987 2,043 31 8,052 4,065 Coronado 0 10 15 16 74 41 115 108 347 455 88 1 699 244 El Cajon 7 21 164 353 395 420 815 736 1,618 2,354 1,090 32 4,804 2,450 Escondido 3 22 198 453 412 373 785 1,026 2,268 3,294 1,576 35 6,331 3,037 La Mesa 0 10 72 118 183 210 393 399 886 1,285 534 5 2,412 1,127 National City 5 16 139 261 135 255 390 366 1,178 1,544 900 15 3,255 1,711 Oceanside 9 77 289 648 706 419 1,125 1,181 2,985 4,166 824 33 7,138 2,972 San Diego 62 373 1,650 4,689 4,495 2,810 7,305 9,399 15,769 25,168 12,970 191 52,217 27,049 Sheriff - Total 25 192 709 2,096 2,713 2,119 4,832 3,802 6,711 10,513 3,709 160 22,076 11,563
Del Mar 0 2 3 8 14 15 29 78 63 141 27 0 210 69 Encinitas 2 15 38 95 145 140 285 298 503 801 165 6 1,401 600 Imperial Beach 1 8 48 133 137 99 236 124 332 456 203 23 1,085 629 Lemon Grove 1 7 47 115 83 150 233 115 338 453 228 5 1,084 631 Poway 0 4 10 61 83 107 190 202 359 561 98 13 924 363 San Marcos 1 17 61 171 148 198 346 264 580 844 305 12 1,745 901 Santee 1 16 44 104 103 135 238 260 530 790 204 4 1,397 607 Solana Beach 0 0 17 19 25 47 72 111 98 209 53 1 370 161 Vista 3 28 162 272 473 268 741 567 1,069 1,636 519 16 3,361 1,725 Unincorporated 16 95 279 1,118 1,502 960 2,462 1,783 2,839 4,622 1,907 80 10,499 5,877
Alpine 0 2 21 72 99 74 173 119 178 297 139 4 704 407 Fallbrook 1 13 22 77 248 124 372 229 426 655 154 7 1,294 639 Lakeside 3 14 28 105 173 146 319 238 433 671 277 0 1,417 746 Ramona 0 6 2 68 70 60 130 91 161 252 78 1 536 284 Spring Valley 9 12 110 255 242 165 407 273 483 756 497 0 2,046 1,290 Valley Center 1 8 26 53 76 70 146 99 113 212 102 11 548 336 Other Unincorporated 2 40 70 488 594 321 915 734 1,045 1,779 660 57 3,954 2,175
California Highway Patrol 0 0 0 15 0 3 3 2 36 38 71 0 127 89 California State University San Marcos 0 2 0 1 3 4 7 4 38 42 0 0 52 10 San Diego State University 0 9 6 9 19 31 50 162 270 432 83 6 589 157 University of California San Diego 0 2 1 3 32 31 63 157 375 532 47 4 648 116 Harbor Police 0 0 7 10 0 12 12 167 150 317 1 1 347 30 California State Parks and Recreation 0 0 0 5 1 8 9 30 36 66 6 3 86 20
TOTAL 128 797 3,588 9,367 10,108 7,437 17,545 19,293 36,376 55,669 24,172 525 111,266 55,597
NOTE: The California Crime Index (CCI) includes all FBI Index crimes except larceny theft.
SOURCE: SANDAG
28

Appendix Table 13 NUMBER OF CRIMES BY OFFENSE BY JURISDICTION
San Diego Region, 2005
Homicide Rape RobberyAggravated
AssaultResidential
Burglary
Non-Residential
BurglaryTotal
Burglary
LarcenyOver$400
Larceny$400 and
UnderTotal
Larceny
MotorVehicleTheft Arson
FBICrimeIndex
CaliforniaCrimeIndex
Carlsbad 2 11 79 164 285 232 517 540 1,108 1,648 246 11 2,667 1,019 Chula Vista 5 66 338 518 626 609 1,235 1,277 2,481 3,758 2,496 23 8,416 4,658 Coronado 0 6 6 10 69 20 89 127 222 349 89 5 549 200 El Cajon 2 40 171 305 296 473 769 658 1,480 2,138 1,136 36 4,561 2,423 Escondido 2 31 186 473 399 402 801 996 2,035 3,031 1,079 37 5,603 2,572 La Mesa 2 10 107 82 190 138 328 453 892 1,345 556 6 2,430 1,085 National City 4 16 182 254 122 254 376 369 1,040 1,409 941 15 3,182 1,773 Oceanside 7 78 264 634 718 347 1,065 1,096 2,750 3,846 746 33 6,640 2,794 San Diego 51 376 1,862 4,314 4,611 2,851 7,462 9,771 14,842 24,613 14,138 233 52,816 28,203 Sheriff - Total 23 170 725 2,189 2,589 2,320 4,909 3,982 6,361 10,343 4,066 151 22,425 12,082
Del Mar 0 0 1 9 24 26 50 87 92 179 37 0 276 97 Encinitas 3 11 45 112 165 159 324 330 394 724 186 7 1,405 681 Imperial Beach 0 3 41 88 99 89 188 111 224 335 267 4 922 587 Lemon Grove 1 6 59 90 93 115 208 102 237 339 258 6 961 622 Poway 1 11 20 63 70 102 172 201 350 551 92 7 910 359 San Marcos 0 15 57 165 121 238 359 318 671 989 282 10 1,867 878 Santee 1 16 30 116 143 138 281 301 499 800 235 9 1,479 679 Solana Beach 0 1 12 11 48 39 87 81 98 179 46 1 336 157 Vista 4 21 190 315 404 367 771 547 1,074 1,621 579 29 3,501 1,880 Unincorporated 13 86 270 1,220 1,422 1,047 2,469 1,904 2,722 4,626 2,084 78 10,768 6,142
Alpine 1 5 15 54 104 71 175 164 189 353 121 1 724 371 Fallbrook 0 11 43 123 259 203 462 260 499 759 177 7 1,575 816 Lakeside 0 13 34 169 169 138 307 289 426 715 309 0 1,547 832 Ramona 1 7 12 76 58 61 119 116 145 261 84 1 560 299 Spring Valley 7 14 77 227 245 135 380 275 466 741 572 0 2,018 1,277 Valley Center 1 9 6 63 62 101 163 114 116 230 106 13 578 348 Other Unincorporated 3 27 83 508 525 338 863 686 881 1,567 715 56 3,766 2,199
California Highway Patrol 0 0 2 18 2 9 11 4 28 32 96 0 159 127 California State University San Marcos 0 1 0 2 1 7 8 9 43 52 2 0 65 13 San Diego State University 0 8 10 11 14 11 25 217 330 547 88 0 689 142 University of California San Diego 0 1 4 7 25 30 55 157 462 619 68 1 754 135 San Diego Harbor Police 0 0 7 10 0 9 9 204 177 381 1 2 408 27 California State Parks and Recreation 0 0 0 5 1 8 9 32 58 90 7 2 111 21
TOTAL 98 814 3,943 8,996 9,948 7,720 17,668 19,892 34,309 54,201 25,755 555 111,475 57,274
NOTE: The California Crime Index (CCI) includes all FBI Index crimes except larceny theft.
SOURCE: SANDAG
29
30
CaliforniaCrimeIndex
Carlsbad 1,136 Chula Vista 4,164 Coronado 160 El Cajon 2,129 Escondido 2,433 La Mesa 1,273 National City 1,862 Oceanside 2,548 San Diego 27,475 Sheriff - Total 11,780
Del Mar 110 Encinitas 657 Imperial Beac 573 Lemon Grov 644 Poway 432 San Marcos 1,103 Santee 620 Solana Beac 143 Vista 1,762 Unincorporated 5,736
Alpine 380 Fallbrook 638 Lakesid 739 Ramona 288 Spring V 1,355 Valley Center 283 Other Uni 2,053
California Hi 104 California St
Homicide Rape RobberyAggravated
AssaultResidential
Burglary
Non-Residential
BurglaryTotal
Burglary
LarcenyOver$400
Larceny$400 and
UnderTotal
Larceny
MotorVehicleTheft Arson
FBICrimeIndex
1 11 77 240 320 267 587 657 991 1,648 220 18 2,784 7 70 351 519 687 497 1,184 1,321 2,496 3,817 2,033 41 7,981 0 3 9 11 48 19 67 114 265 379 70 1 539 4 28 154 285 270 368 638 618 1,336 1,954 1,020 25 4,083 3 33 235 442 407 351 758 885 1,802 2,687 962 17 5,120 3 8 111 113 222 225 447 480 979 1,459 591 16 2,732 2 9 211 302 143 310 453 314 811 1,125 885 12 2,987 8 48 245 635 682 297 979 999 2,262 3,261 633 21 5,809
68 348 2,164 3,811 4,491 3,255 7,746 9,824 14,301 24,125 13,338 185 51,600 30 211 737 1,964 2,459 2,366 4,825 3,754 5,656 9,410 4,013 144 21,190
0 1 7 18 22 32 54 108 82 190 30 0 300 3 8 48 104 160 164 324 279 425 704 170 3 1,361
h 1 17 34 116 94 75 169 119 223 342 236 3 915 e 1 12 65 92 65 146 211 99 220 319 263 9 963
0 13 21 69 84 126 210 207 248 455 119 5 887 3 19 75 189 196 288 484 311 607 918 333 14 2,021 0 14 44 93 122 148 270 243 342 585 199 8 1,205
h 1 0 12 13 31 46 77 68 92 160 40 1 303 1 34 152 259 383 346 729 541 981 1,522 587 19 3,284
20 93 279 1,011 1,302 995 2,297 1,779 2,436 4,215 2,036 82 9,951 1 4 17 51 102 82 184 127 154 281 123 4 661 2 11 46 84 179 163 342 329 461 790 153 7 1,428
e 2 16 32 150 151 120 271 233 318 551 268 0 1,290 0 6 16 59 61 76 137 95 144 239 70 4 527
alley 2 14 84 184 256 177 433 268 460 728 638 0 2,083 4 7 15 57 55 77 132 100 152 252 68 3 535
ncorporated 9 35 69 426 498 300 798 627 747 1,374 716 64 3,427 ghway Patrol 0 0 0 16 2 10 12 2 20 22 76 0 126 ate University San Marcos 0 1 0 1 0 6 6 6 33 39 1 0 48 tate University 0 7 13 5 20 15 35 152 258 410 119 2 589
ifornia San Diego 0 0 1 2 30 61 91 176 337 513 75 5 682 ice 0 0 5 11 1 23 24 334 219 553 2 0 595
ate Parks and Recreation 0 0 0 3 1 2 3 21 31 52 8 1 66
126 777 4,313 8,360 9,783 8,072 17,855 19,657 31,797 51,454 24,046 488 106,931
9 San Diego S 179 University of Cal 169 San Diego Harbor Pol 42 California St 14
TOTAL 55,477
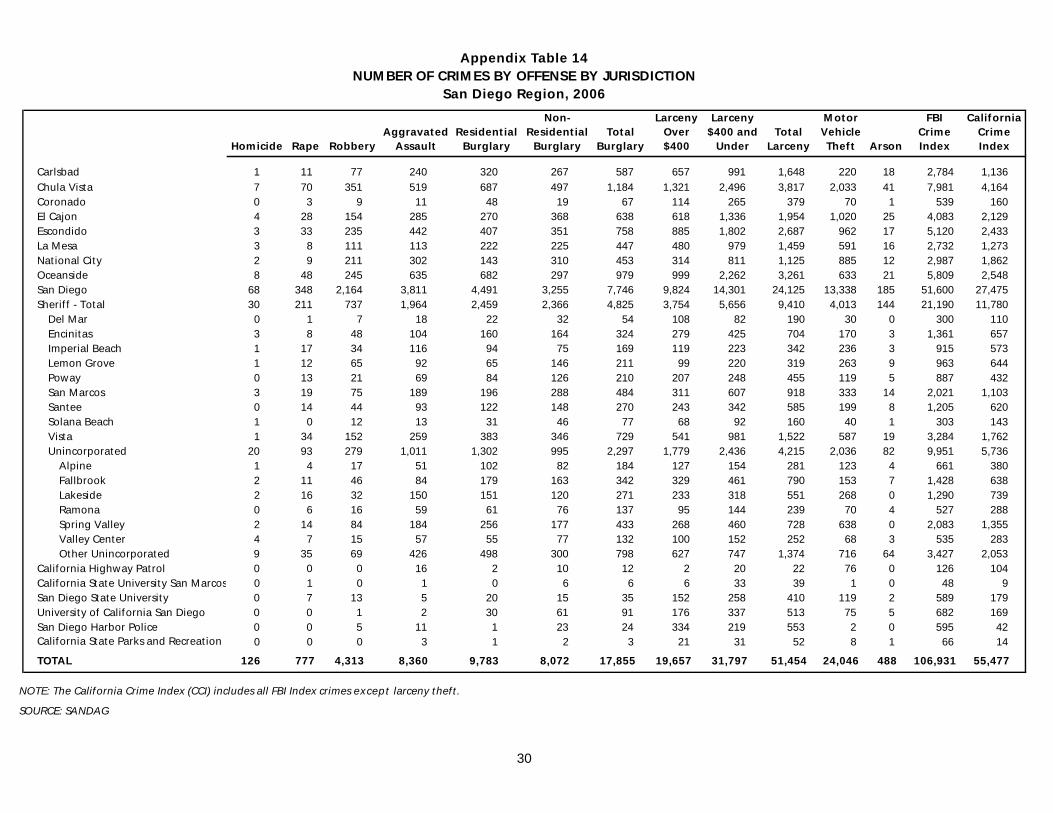
NUMBER OF CRIMES BY OFFENSE BY JURISDICTION San Diego Region, 2006
Appendix Table 14
NOTE: The California Crime Index (CCI) includes all FBI Index crimes except larceny theft.
SOURCE: SANDAG

Appendix Table 15 VIOLENT CRIME CLEARANCE RATE BY JURISDICTION
San Diego Region, 2002, 2005, and 2006
Difference
2002 2005 2006 2002-2006 2005-2006
Carlsbad 47% 49% 42% -5% -7%
Chula Vista 41% 34% 37% -4% 3%
Coronado 52% 77% 52% 0% -25%
El Cajon 58% 54% 54% -4% 0%
Escondido 55% 43% 44% -11% 1%
La Mesa 66% 53% 51% -15% -2%
National City 39% 29% 25% -14% -4%
Oceanside 47% 35% 39% -8% 4%
San Diego 60% 52% 46% -14% -6%
Sheriff - Total 64% 44% 64% 0% 20%
Del Mar 50% 30% 62% 12% 32%
Encinitas 54% 49% 55% 1% 6%
Imperial Beach 60% 42% 66% 6% 24%
Lemon Grove 56% 37% 63% 7% 26%
Poway 61% 54% 51% -10% -3%
San Marcos 76% 36% 58% -18% 22%
Santee 75% 50% 63% -12% 13%
Solana Beach 32% 33% 50% 18% 17%
Vista 59% 39% 67% 8% 28%
Unincorporated 67% 45% 66% -1% 21%
Alpine 63% 39% 40% -23% 1%
Fallbrook 77% 48% 55% -22% 7%
Ramona 88% 48% 83% -5% 35%
Valley Center 57% 52% 65% 8% 13%
Other Unincorporated 126% 84% 130% 4% 46%
California Highway Patrol 0% 60% 75% 75% 15%
California State University San Marcos -- 0% 100% -- --
San Diego State University 31% 17% 36% -- --
University of California San Diego 50% 58% 33% -17% -25%
San Diego Harbor Police 67% 47% 25% -42% -22%
California State Parks and Recreation 50% 20% 67% 17% 47%
TOTAL 57% 46% 48% -9% 2%
NOTE: California State University San Marcos did not receive any violent crime reports in 2002 and reported very few violent
crime incidents or clearances in 2005 and 2006.
SOURCE: SANDAG
31

Appendix Table 16 PROPERTY CRIME CLEARANCE RATE BY JURISDICITON
San Diego Region, 2002, 2005, and 2006
Difference
2002 2005 2006 2002-2006 2005-2006
Carlsbad 16% 21% 16% 0% -5%
Chula Vista 14% 12% 14% 0% 2%
Coronado 7% 13% 12% 5% -1%
El Cajon 14% 18% 17% 3% -1%
Escondido 14% 15% 16% 2% 1%
La Mesa 15% 15% 14% -1% -1%
National City 13% 15% 12% -1% -3%
Oceanside 10% 13% 11% 1% -2%
San Diego 11% 10% 10% -1% 0%
Sheriff - Total 12% 10% 13% 1% 3%
Del Mar 3% 2% 5% 2% 3%
Encinitas 11% 9% 13% 2% 4%
Imperial Beach 9% 6% 9% 0% 3%
Lemon Grove 16% 14% 19% 3% 5%
Poway 17% 15% 16% -1% 1%
San Marcos 11% 20% 18% 7% -2%
Santee 16% 14% 17% 1% 3%
Solana Beach 8% 7% 11% 3% 4%
Vista 12% 12% 12% 0% 0%
Unincorporated 11% 8% 11% 0% 3%
Alpine 15% 6% 11% -4% 5%
Fallbrook 9% 8% 8% -1% 0%
Ramona 16% 8% 22% 6% 14%
Valley Center 8% 7% 15% 7% 8%
Other Unincorporated 19% 15% 21% 2% 6%
California Highway Patrol 0% 4% 12% 12% 8%
California State University San Marcos 0% 2% 11% 11% 9%
San Diego State University 7% 12% 14% 7% 2%
University of California San Diego 7% 7% 5% -2% -2%
San Diego Harbor Police 13% 7% 9% -4% 2%
California State Parks and Recreation 2% 3% 8% 6% 5%
TOTAL 12% 11% 12% 0% 1%
SOURCE: SANDAG
32

Appendix Table 17 DOLLAR VALUE OF PROPERTY STOLEN BY JURISDICTION
San Diego Region, 2002, 2005, and 2006
Change
2002 2005 2006 2002-2006 2005-2006
Carlsbad $5,976,114 $7,116,017 $5,975,189 <-1% -16%
Chula Vista 19,140,233 23,721,811 26,749,110 40% 13%
Coronado 1,073,144 1,269,384 1,569,441 46% 24%
El Cajon 9,553,053 11,524,166 11,055,443 16% -4%
Escondido 9,016,970 10,930,321 10,024,850 11% -8%
La Mesa 4,222,395 5,789,586 5,741,366 36% -1%
National City 6,232,461 7,879,328 8,102,703 30% 3%
Oceanside 10,053,496 8,246,456 8,128,425 -19% -1%
San Diego 111,867,154 131,449,777 149,020,961 33% 13%
Sheriff - Total 37,516,539 58,359,676 62,101,402 66% 6%
Del Mar 598,016 2,312,438 1,068,863 79% -54%
Encinitas 3,260,550 4,183,802 2,876,991 -12% -31%
Imperial Beach 1,574,371 2,103,170 2,036,472 29% -3%
Lemon Grove 1,610,835 2,479,902 2,038,988 27% -18%
Poway 2,627,369 1,458,137 2,406,108 -8% 65%
San Marcos 500,781 3,380,317 3,602,935 619% 7%
Santee 2,063,003 2,753,888 2,966,456 44% 8%
Solana Beach -834,232 1,232,303 817,414 n/a n/a
Vista 4,662,310 8,889,000 7,425,969 59% -16%
Unincorporated 21,453,536 29,566,719 36,861,206 72% 25%
Alpine 1,583,876 1,697,962 1,950,597 23% 15%
Fallbrook 2,011,018 3,465,165 3,064,576 52% -12%
Ramona 842,234 1,472,675 1,103,441 31% -25%
Valley Center 1,183,306 1,509,664 11,264,956 852% 646%
Other Unincorporated 15,833,102 21,421,253 19,477,636 23% -9%
California Highway Patrol 449,626 562,281 384,985 -14% -32%
California State University San Marcos 16,642 25,779 36,614 120% 42%
San Diego State University 789,186 926,063 1,522,051 93% 64%
University of California San Diego 632,295 864,206 1,315,760 108% 52%
San Diego Harbor Police 507,707 612,035 1,146,358 126% 87%
California State Parks and Recreation 106,602 190,336 161,619 52% -15%
TOTAL $217,153,617 $269,467,222 $293,036,277 35% 9%
NOTES: Dollar amounts are not adjusted for inflation and reflect the reported dollar values associated with stolen items reported
by individual jurisdictions. Minus dollar value in Solana Beach in 2002 due to adjustments involving a stolen jewelry case. Relics
valued at ten million dollars were stolen from a mission in Valley Center in 2006.
SOURCE: SANDAG
33

Appendix Table 18 DOLLAR VALUE OF PROPERTY RECOVERED BY JURISDICTION
San Diego Region, 2002, 2005, and 2006
2002 2005 2006 2002-2006 2005-2006
Carlsbad $1,614,996 $1,662,509 $1,873,912 16% 13%
Chula Vista 9,608,969 12,025,919 12,194,691 27% 1%
Coronado 391,693 427,988 473,332 21% 11%
El Cajon 4,225,323 5,699,093 4,837,724 14% -15%
Escondido 4,527,605 5,882,123 5,393,843 19% -8%
La Mesa 2,025,927 2,779,914 3,119,583 54% 12%
National City 3,368,472 4,207,667 4,013,175 19% -5%
Oceanside 5,076,987 3,951,505 3,722,034 -27% -6%
San Diego 50,334,081 56,942,378 67,849,368 35% 19%
Sheriff - Total 14,527,295 18,271,249 19,551,821 35% 7%
Del Mar 165,810 329,498 314,508 90% -5%
Encinitas 1,235,960 1,092,395 854,446 -31% -22%
Imperial Beach 538,050 889,239 1,038,369 93% 17%
Lemon Grove 778,586 1,232,618 1,143,434 47% -7%
Poway 637,002 609,913 869,393 36% 43%
San Marcos 729,730 1,395,888 1,430,319 96% 2%
Santee 694,393 792,750 950,177 37% 20%
Solana Beach 350,518 327,516 284,265 -19% -13%
Vista 1,851,620 2,254,856 2,760,868 49% 22%
Unincorporated 7,545,626 9,346,576 9,906,042 31% 6%
Alpine 684,460 700,931 642,615 -6% -8%
Fallbrook 542,840 998,491 865,933 60% -13%
Ramona 288,356 356,562 459,632 59% 29%
Valley Center 396,386 424,250 517,988 31% 22%
Other Unincorporated 5,633,584 6,866,342 7,419,874 32% 8%
California Highway Patrol 250,722 142,630 78,700 -69% -45%
California State University San Marcos 0 4,156 20,901 -- 403%
San Diego State University 213,812 330,445 215,013 1% -35%
University of California San Diego 261,602 147,373 363,537 39% 147%
San Diego Harbor Police 40,281 12,589 116,127 188% 822%
California State Parks and Recreation 29,917 58,195 19,330 -35% -67%
TOTAL $96,497,682 $112,545,733 $123,843,091 28% 10%
Change
NOTES: Dollar amounts are not adjusted for inflation and reflect the reported dollar values associated with recovered items
reported by individual jurisdictions. There was no property recovered by the police at California State University San Marcos in
2002.
SOURCE: SANDAG
34

Appendix Table 19 PROPERTY RECOVERY RATE BY JURISDICTION
San Diego Region, 2002, 2005, and 2006
Difference
2002 2005 2006 2002-2006 2005-2006
Carlsbad 27% 23% 31% 4% 8%
Chula Vista 50% 51% 46% -4% -5%
Coronado 36% 34% 30% -6% -4%
El Cajon 44% 49% 44% 0% -5%
Escondido 50% 54% 54% 4% 0%
La Mesa 48% 48% 54% 6% 6%
National City 54% 53% 50% -4% -3%
Oceanside 50% 48% 46% -4% -2%
San Diego 45% 43% 46% 1% 3%
Sheriff - Total 39% 31% 31% -8% 0%
Del Mar 28% 14% 29% 1% 15%
Encinitas 38% 26% 30% -8% 4%
Imperial Beach 34% 42% 51% 17% 9%
Lemon Grove 48% 50% 56% 8% 6%
Poway 24% 42% 36% 12% -6%
San Marcos 146% 41% 40% -106% -1%
Santee 34% 29% 32% -2% 3%
Solana Beach -42% 27% 35% 77% 8%
Vista 40% 25% 37% -3% 12%
Unincorporated 35% 32% 27% -8% -5%
Alpine 43% 41% 33% -10% -8%
Fallbrook 27% 29% 28% 1% -1%
Ramona 34% 24% 42% 8% 18%
Valley Center 33% 28% 5% -28% -23%
Other Unincorporated 35% 32% 27% -8% -5%
California Highway Patrol 56% 25% 20% -36% -5%
California State University San Marcos 0% 16% 57% -- 41%
San Diego State University 27% 36% 14% -13% -22%
University of California San Diego 41% 17% 28% -13% 11%
San Diego Harbor Police 8% 2% 10% 2% 8%
California State Parks and Recreation 28% 31% 12% -16% -19%
TOTAL 44% 42% 42% -2% 0%
NOTE: There was no property recovered by the police at California State University San Marcos in 2002.
SOURCE: SANDAG
35

Appendix Table 20 POPULATION BY JURISDICTION
San Diego Region, 2002, 2005, and 2006
Change
2002 2005 2006 2002-2006 2005-2006
Carlsbad 88,120 94,776 98,607 12% 4%Chula Vista 191,033 216,694 223,423 17% 3%Coronado 25,690 26,902 26,248 2% -2%El Cajon 96,578 97,331 96,867 <1% <-1%Escondido 137,130 140,803 140,766 3% <-1%La Mesa 55,671 55,766 55,724 <1% <-1%National City 57,853 63,569 63,537 10% <-1%Oceanside 167,334 174,404 174,925 5% <1%San Diego 1,256,981 1,300,343 1,311,162 4% 1%Sheriff - Total 806,078 836,319 841,512 4% 1%
Del Mar 4,501 4,524 4,524 1% 0%
Encinitas 59,919 62,530 62,815 5% <1%
Imperial Beach 27,550 27,604 27,563 <1% <-1%
Lemon Grove 25,342 25,434 25,363 <1% <-1%
Poway 49,684 50,477 50,542 2% <1%
San Marcos 60,825 72,768 76,725 26% 5%
Santee 53,655 54,267 54,709 2% 1%
Solana Beach 13,287 13,347 13,327 <1% <-1%
Vista 92,116 93,746 94,440 3% 1%
Unincorporated 419,199 431,622 431,504 3% <-1%
Alpine 27,486 27,959 27,951 2% <-1%Fallbrook 48,305 50,783 50,769 5% <-1%Lakeside 52,286 52,291 51,751 -1% -1%Ramona 34,407 35,586 35,576 3% <-1%Spring Valley 69,096 70,055 69,764 1% <-1%Valley Center 21,918 21,751 21,740 -1% <-1%Other Unincorporated 165,701 173,197 173,953 5% <1%
Camp Pendleton 37,542 32,370 34,049 -9% 5%
TOTAL 2,920,010 3,039,277 3,066,820 5% 1%
Occupied Households 1,017,385 1,061,021 1,067,846 5% 1%
Registered Vehicles 2,138,823 2,232,633 2,320,808 4% 4%
Female Population 1,458,773 1,518,581 1,531,155 5% 1%
NOTES: Population figures are based upon current California Department of Finance estimates. “Sheriff-Total" includes
contract cities and the unincorporated area served by the San Diego County Sheriff's Department. Camp Pendleton is
not included. "Unincorporated" includes Alpine, Campo, Fallbrook, Julian, Lakeside, Pine Valley, Ramona, Ranchita,
Spring Valley, and Valley Center, as well as the unincorporated areas of Encinitas, Imperial Beach, Lemon Grove, San
Marcos, Poway, Santee, and Vista. "Other Unincorporated" is equal to the unincorporated area of the Sheriff's
jurisdiction minus Alpine, Fallbrook, Lakeside, Ramona, Spring Valley, and Valley Center.
SOURCES: California Department of Finance; SANDAG
36