Seniors and Crime Prevention National Crime Prevention Council 2007–2008.

CRIME PREVENTION ISSUES 1No.7
CRIME PREVENTION ISSUESJune 09 No.7
Crime Prevention Division Level 5, Justice Precinct Offices 160 Marsden Street, Parramatta 2150 T: 02 8688 3277 F: 02 8688 9627 E: [email protected] W: www.crimeprevention.nsw.gov.au
Background The Magistrates Early Referral Into Treatment (MERIT) program and the Rural Alcohol Diversion (RAD) programs are both court-based pre-plea diversion schemes operating in selected New South Wales Local Courts. These schemes are available to defendants with a demonstrable history of problematic drug or alcohol use, and unlike other diversion initiatives do not require an admission of guilt for referral or acceptance [1-4]. Willing clients who meet eligibility criteria are provided with treatment to address substance use (including residential and emergency detoxification and rehabilitation services, pharmacotherapy, case management, counselling and community outpatient services).
The MERIT program commenced with a pilot in the year 2000 in Lismore and focuses primarily on defendants with a history of illicit drug use. Only MERIT teams servicing the Wilcannia and Broken Hill Local Courts are permitted to also accept referrals of defendants citing alcohol as their principal drug of concern [5]. Based on the successful operating model of MERIT, the RAD program provides services to adult defendants on bail who have alcohol abuse or dependence problems. The RAD pilot program
commenced at Orange Local Court in December 2004 and expanded to cover Bathurst Court in May 2005.
Preliminary analyses conducted for the “Women and the MERIT program” bulletin [6] suggest that client characteristics and program outcomes may vary significantly depending on the principal drug of concern. For example, men were found to be significantly younger, less likely to inject and more likely to live with their parents. It is possible, however, that these differences are more accurately attributable to the principal drug of concern, rather than gender. Specifically, 46% of all male participants indicated that cannabis was their primary drug of concern compared with only 28% of female participants, and anecdotally1, it is this group of cannabis users who are actually younger, living at home and less likely to engage in injecting drug use. Accordingly, it is proposed that analyses be conducted to determine the extent to which the principal drug may underpin these and other observed differences.
1 This matter was discussed by the authors with MERIT managers of the Greater Mur-ray, North Sydney and Central Coast, South East Sydney and Illawarra, Sydney South West and Sydney West regions on September 3rd 2008.
Martire, K. A., & Larney, S.
Principal drug of concern: An analysis of MERIT and RAD client characteristics and outcomes.
Executive SummaryBetween 2004 and 2008 over 6,000 participants, primarily illicit drug users, commenced the drug treatment intervention offered by the MERIT program. Additionally, over 200 people with identified alcohol problems entered treatment through RAD, a program based on the MERIT model and one of few diversion schemes available to clients whose principal substance of concern is alcohol. Participants with alcohol or cannabis as their principal drug of concern were more likely than those in the ‘other’ group (made up primarily of meth/amphetamine and heroin users) to complete their program and less likely to be convicted of a new offence following completion. These groups also presented with significantly lower levels of drug dependence and better general and mental health, though all groups reported poorer health than that observed in the wider community. Despite the differences observed based on principal drug, all groups experienced equivalent gains over time in terms of reductions in severity of dependence and psychological distress and improvements in general and mental health. This evidence, and the finding that almost half of participants who had alcohol as a principal substance of concern reported that MERIT/RAD was their first experience of substance misuse treatment, suggests positive implications for use of the MERIT diversion model for defendants with alcohol problems.
National Drug and Alcohol Research Centre

CRIME PREVENTION ISSUES 2No.7
Such a focus on principal drug of concern also provides a valuable opportunity to make descriptive comparisons between clients participating in MERIT as a result of illicit drug problems, and those who have participated in MERIT or RAD as a result of problematic alcohol use. This is important because although both illicit drugs and alcohol have been implicated in the cycle of substance use and crime [7], contributing an estimated $4.0 billion and $1.7 billion respectively to drug-attributable costs of crime in Australia during 2004/05 [8], there are few diversion schemes which accept clients whose principal drug of concern is a licit substance (i.e., alcohol). Accordingly, there is relatively little information regarding the characteristics of clients accessing such diversionary programs, or the efficacy of such interventions [9]. This report aims to extend upon the existing literature in this domain.
Data Used
Sources
Program and health outcomes data from a cohort of MERIT participants with referral dates between August 2004 and June 2008 have been analysed for the purposes of this report. The data were extracted from NSW Health’s MERIT Information Management System (MIMS), a database designed specifically to facilitate the monitoring and evaluation of the MERIT program. Program data includes client demographic information, as well as court dates, program entry and exit dates, and treatments received. Participants’ health status was also assessed at program entry and again at program exit using the Severity of Dependence Scale (SDS) as a measure of drug dependence and the SF-36 Health Survey (SF-36) and Kessler-10 Psychological Distress Scale (K-10) as indicators of physical and psychological well-being2.
Program and health outcomes data were also sought from a cohort of RAD participants with referral dates between program commencement at each site and June 2008. These data were extracted from an information management system closely based upon the MIMS database described above. As such the same program and health status information were analysed for the purposes of this report.
To assist in determining MERIT and RAD participants’ rate of re-offending after leaving the program, data pertaining to offences and criminal justice outcomes were provided by the NSW Bureau of Crime Statistics and Research from its Reoffending Database (ROD). MERIT clients participating between January 1st 2004
2 Please note that while health outcomes data is sought from all participants at both program entry and exit, it is not always practically possible to obtain pre- and post-measures for each participant.
and December 31st 2005 and RAD clients participating between January 1st and December 31st 2005 were included in this cohort and tracked for a standard two year follow-up period.
Analysis
Where the sample size was large, i.e., more than 1500 participants, categorical data were analysed using the chi-square (χ2) statistic and a significance level of .01 (rather than the conventional .05 level) in order to minimize the reporting of statistically significant effects with limited clinical significance. In other instances, i.e., where there were fewer than 1500 participants in the analysis, the .05 criterion was adopted to increase the statistical power. χ2 was used to assess categorical data. For multidimensional χ2, adjusted standardised residuals (ASR) were analysed to identify factors contributing significantly to observed differences, with ASR of greater than ± 2 taken as significant. Continuous, normally distributed data were analysed using t-tests (t) and mixed ANOVA (F). Mann-Whitney U was used to analyse non-normally distributed data and logistic regression was used to identify predictors of drug convictions post-program participation.
Comparison of participants reporting alcohol as their principal drug, by program (MERIT or RAD)
Eighty-four participants in the MERIT dataset reported alcohol to be their principal drug, while there were 217 RAD participants with alcohol as their principal drug. These two groups were for the most part similar. There were no significant differences between groups for age, gender, program exit status, accommodation type or educational attainment. However, RAD participants were significantly less likely to be Aboriginal as compared to MERIT alcohol participants (RAD 29% Aboriginal vs. MERIT alcohol 53%)a, and RAD participants were more likely to be in full-time employment than MERIT alcohol participants (RAD 26% employed full-time vs. MERIT alcohol 12% employed full-time)b. These differences are likely to be an artefact of geography, with RAD sites (Orange and Bathurst) having proportionally lower Aboriginal populations and higher full-time employment than MERIT sites (Wilcannia and Broken Hill)[10].
Given the few between-program differences observed above, and the small likelihood that these can be attributed to an interaction between principal drug and program type, MERIT alcohol and RAD participants are treated as a single group in the analyses that follow. This increases the statistical power to detect differences in outcomes associated with the participant’s principal drug and eases interpretation of results.

CRIME PREVENTION ISSUES 3No.7
Limitations
Program attrition and the necessity to leave a two-year follow-up for the reoffending analysis serve to substantially reduce the size of the sample. It should also be noted that when conducting the reoffending analysis the MIMS datasets for MERIT and RAD participants and the BoCSAR cohorts differ considerably in size (6,847 and 1,360 cases respectively). Moreover, it is also likely that a strong selection bias is in place with regard to the health outcomes information, as only clients who completed the MERIT program provided health information post-participation. Thus, it is likely that changes observed between pre- and post-participation measures may be significantly larger than those likely to be observed for all MERIT and RAD clients3. This limits the extent to which inferences made from these analyses generalise across contexts.
It should be noted that any changes associated with program completion may reflect an effect of time, treatment in general, or participation in the MERIT or RAD programs specifically. This study does not contain the “no-treatment” control group necessary to disentangle these possible interpretations.
Program Activity The MERIT program received 10,682 referrals between August 2004 and June 2008, of which 6,626 (62%) were accepted, and the RAD program received 350 referrals between November 20044 and June 2008, of which 221 (63%) were accepted5 (Figure 1).
MERIT referrals (August 2004- June 2008) n=10,682
MERIT referrals accepted n=6,626
RAD referrals (November2004 - June 2008) n=350
RAD referrals accepted n=221
Total accepted referrals n=6,847
Figure 1: Program activity participant flowchart
3 This is of particular relevance when making inferences based on data presented in Tables 1 and 2 and Figure 11.
4 Although the RAD program officially commenced in December 2004, referrals were received up to one month before this time.
5 It was not possible to analyse the effect of principal drug on program acceptance, as principal drug is only recorded following acceptance to the program.
All analyses from this point on will compare program participants according to their self reported “principal drug” (PD), utilising three categories: those citing alcohol as their PD (alcohol PD group; n=303); those citing cannabis as their PD (cannabis PD group; n=2,777); and those reporting any other illicit drug6 as their PD (Other PD group; n=3,767).
Exit Status
The exit status of program participants was significantly associated with principal drug (Figure 2)c. Participants in the alcohol and cannabis PD groups were more likely to complete the program than those in the Other PD group. Those in the cannabis PD group were the most likely to withdraw from the program voluntarily, while participants in the Other PD group were the most likely to be breached by the program.
Completedprogram
Other illicits(n=3,542)
Alcohol(n=297)
Withdrewvoluntarily
Breached byprogram
Removed byCourt
Other
Cannabis(n=2,566)
7061
78
1625
1510 7 5 4 6 1 1 1 1
39
% o
f Par
ticip
ants
0
20
40
60
80
100
Figure 2: Exit status of program participants, by principal drug (n=6,405)7
6 Drugs included in the ‘other illicit drug’ category were amphetamine and meth-amphetamine (n=1726), heroin or other opioids (n=1,610), extra-medical benzodi-azepines (n=244), MDMA (ecstasy) and related drugs (GHB, ketamine, LSD) (n=85), cocaine (n=95) and other drugs of concern not elsewhere classified (n=7).
7 Exit status not available for 442 participants due to ongoing participation in MERIT or RAD at the time data was obtained.
CRIME PREVENTION ISSUES 4No.7
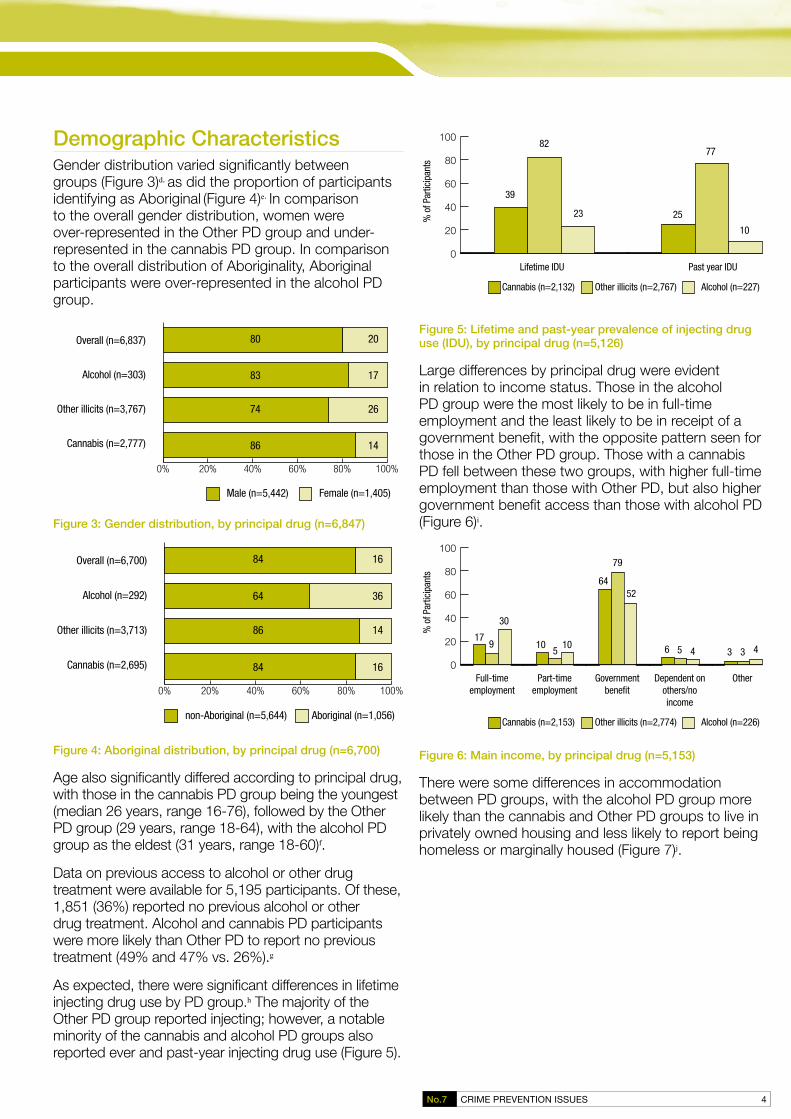
Demographic Characteristics Gender distribution varied significantly between groups (Figure 3)d, as did the proportion of participants identifying as Aboriginal (Figure 4)e. In comparison to the overall gender distribution, women were over-represented in the Other PD group and under-represented in the cannabis PD group. In comparison to the overall distribution of Aboriginality, Aboriginal participants were over-represented in the alcohol PD group.
0% 20% 40% 60% 80% 100%
80
83
74
86
20
17
26
14
Male (n=5,442) Female (n=1,405)
Overall (n=6,837)
Alcohol (n=303)
Other illicits (n=3,767)
Cannabis (n=2,777)
Figure 3: Gender distribution, by principal drug (n=6,847)
0% 20% 40% 60% 80% 100%
84
64
86
84
16
36
14
16
non-Aboriginal (n=5,644) Aboriginal (n=1,056)
Overall (n=6,700)
Alcohol (n=292)
Other illicits (n=3,713)
Cannabis (n=2,695)
Figure 4: Aboriginal distribution, by principal drug (n=6,700)
Age also significantly differed according to principal drug, with those in the cannabis PD group being the youngest (median 26 years, range 16-76), followed by the Other PD group (29 years, range 18-64), with the alcohol PD group as the eldest (31 years, range 18-60)f.
Data on previous access to alcohol or other drug treatment were available for 5,195 participants. Of these, 1,851 (36%) reported no previous alcohol or other drug treatment. Alcohol and cannabis PD participants were more likely than Other PD to report no previous treatment (49% and 47% vs. 26%).g
As expected, there were significant differences in lifetime injecting drug use by PD group.h The majority of the Other PD group reported injecting; however, a notable minority of the cannabis and alcohol PD groups also reported ever and past-year injecting drug use (Figure 5).
Lifetime IDU
Other illicits (n=2,767) Alcohol (n=227)
Past year IDU
Cannabis (n=2,132)
39
82
23 25
77
10
% o
f Par
ticip
ants
0
20
40
60
80
100
Figure 5: Lifetime and past-year prevalence of injecting drug use (IDU), by principal drug (n=5,126)
Large differences by principal drug were evident in relation to income status. Those in the alcohol PD group were the most likely to be in full-time employment and the least likely to be in receipt of a government benefit, with the opposite pattern seen for those in the Other PD group. Those with a cannabis PD fell between these two groups, with higher full-time employment than those with Other PD, but also higher government benefit access than those with alcohol PD (Figure 6)i.
Full-timeemployment
Part-timeemployment
Governmentbenefit
Dependent onothers/noincome
Other
Other illicits (n=2,774) Alcohol (n=226)Cannabis (n=2,153)
179
30
105
10
64
79
52
6 5 4 3 3 4
% o
f Par
ticip
ants
0
20
40
60
80
100
Figure 6: Main income, by principal drug (n=5,153)
There were some differences in accommodation between PD groups, with the alcohol PD group more likely than the cannabis and Other PD groups to live in privately owned housing and less likely to report being homeless or marginally housed (Figure 7)j.

CRIME PREVENTION ISSUES 5No.7
Rentalaccomodation
Privatelyowned
Homeless/marginallyhoused
Other
Other illicits (n=2,797) Alcohol (n=227)Cannabis (n=2,171)
66 65 63
27 2633
5 70 2 3 4
% o
f Par
ticip
ants
0
20
40
60
80
100
Figure 7: Accommodation, by principal drug (n=5,195)
Regardless of principal drug, the majority of participants reported education to a Year 10 or lower level (Figure 8). In comparison to cannabis and Other PD participants, very few alcohol PD reported TAFE or trade qualificationsk.
Year 10 or less Year 11 or 12 TAFE/trade Tertiary
Other illicits (n=2,587) Alcohol (n=204)Cannabis (n=2,005)
73 6977
17 17 20
8 123 2 2 2
% o
f Par
ticip
ants
0
20
40
60
80
100
Figure 8: Educational attainment, by principal drug (n=4,796)
A history of previous incarceration was reported significantly more often by Other PD participants (62%) than cannabis or alcohol PD participants (both 38%)l.
Service Provision Data on external treatment access were only available for those participants who attended a residential treatment service i.e. detoxification or residential rehabilitation (n=1,271). There was a significant association between principal drug and external treatment type, with those in the alcohol PD group the most likely to attend both detoxification and residential rehabilitation servicesm (Figure 9).
Detoxification only Residential rehabilitationonly
Both detoxificationand res. rehab.
Other illicits (n=718) Alcohol (n=52)Cannabis (n=501)
% o
f Par
ticip
ants
0
20
40
60
80
100
32 35 29
49 4531
19 20
40
Figure 9: Residential treatment access, by principal drug (n=1,271)
Participants spent a mean of 36 days in residential treatment. An overall one-way ANOVA comparing the mean number of days in residential treatment by principal drug was significant, with planned pairwise comparisons demonstrating that participants in the Other PD group spent significantly fewer days in residential treatment than the alcohol PD group (33 vs. 49 days). All other pairwise comparisons were non-significantn.
Health Outcomes
Drug and alcohol use
Severity of alcohol and illicit drug use was assessed using the Severity of Dependence Scale [11], with higher scores indicating more severe dependence. Mean SDS scores are shown in Table 1.
Principal drug SDS mean (SD)
Pre-program (n=4,987) Post-program (n=2,555)
Cannabis 7.7 (3.3) 5.3 (3.4)
Other illicits 8.7 (3.3) 5.8 (3.6)
Alcohol 6.9 (3.3) 5.2 (2.5)
Table 1: Mean (Standard Deviation) SDS scores pre- and post-program, by principal drug
At both pre- and post-program, those in the Other PD group had significantly higher SDS scores than the remaining groups, suggesting greater severity of dependence. Cannabis PD participants also had significantly higher scores than the alcohol PD group at program entry, but post-program this difference was no longer evidento. Considering only those participants with pre- and post-program SDS results, there was a significant improvement in SDS scores for all principal drug groups, with Other PD participants showing the most improvement (Figure 10)p.

CRIME PREVENTION ISSUES 6No.7
Pre-program Post-program
Other illicits (n=1,261) Alcohol (n=18)Cannabis (n=1,248)
SDS
Scor
e
0
2
4
6
8
10
Figure 10: Changes in SDS scores, by principal drug (n=2,527)
It should be noted that the diagnostic cut-off for cannabis or alcohol dependence on the SDS is three [12, 13]; hence, although participants in the alcohol and cannabis groups showed improvement in SDS scores, at post-program they still exceeded the dependence cut-off score. Cut-off scores for other illicit drugs vary, but are generally between 3-5 [11, 14, 15]. Hence, the final mean SDS score for those in the Other PD group remained high in comparison to established dependence thresholds.
Health status
Psychological distress was examined using the Kessler-10 [16], with lower scores indicating lower levels of psychological distress. Prior to and following program participation, alcohol PD were significantly more likely than the cannabis or other PD groups to show lower levels of psychological distress (Figure 11)q. Among participants with both pre- and post-program K10 scores, there was a significant improvement (i.e., reduction) in scores over time (Figure 12)r. Despite this, at post-program one-quarter of those in the Other PD group continued to report moderate to severe psychological distress.
None Mild Moderate Severe
Other (n=1,269) Alcohol (n=14)Cannabis (n=1,257)
Post-program (n=2,670)
% o
f Par
ticip
ants
0
20
40
60
80
100
None Mild Moderate Severe
Other (n=2,710) Alcohol (n=227)Cannabis (n=2,140)
Pre-program (n=5,077)
% o
f Par
ticip
ants
0
20
40
60
80
100
Figure 11: Distribution of K10 scores, by principal drug
Pre-program Post-program
Other illicits (n=1,243) Alcohol (n=144)Cannabis (n=1,248)
K10
Scor
e
0
5
10
15
20
25
30
Figure 12: Changes in K10 scores, by principal drug (n=2,635)
General and mental health status were assessed using the SF-36 Health Survey (SF-36) [17], with higher scores indicating better functioning. Mean scores are shown in Table 2. At both pre- and post-program, alcohol PDs had significantly higher scores, indicating better general and mental health, than cannabis PDs, who in turn had significantly better general and mental health than the Other PD groups.

CRIME PREVENTION ISSUES 7No.7
Principal drug SF-36 General Health mean (SD) SF-36 Mental Health mean (SD)
Pre-program (n=5,014)
Post-program (n= 2,664)
Pre-program(n=5,014)
Post-program(n=2,664)
Cannabis 59.9 (22.6) 72.2 (20.5) 58.3 (22.3) 74.9 (18.4)
Other 56.9 (22.9) 67.2 (21.8) 54.6 (22.1) 69.6 (20.1)
Alcohol 65.6 (21.4) 79.0 (16.6) 67.1 (22.3) 81.5 (13.4)
Table 2: Mean (SD) SF-36 scores pre- and post-program, by principal drug
When considering only participants with pre- and post-program SF-36 scores, there was a significant improvement in general and mental health over time (Figure 13)t. Pre-program, all three groups had General and Mental Health scores well below Australian norms [18]; at post-program, scores for those with cannabis or alcohol PDs approached or even exceeded Australian norms, but scores for those in the Other PD group remained lower than those seen in the general population.
Pre-program
SF-36 Mental Health
Post-program
Other illicits (n=1,231) Alcohol (n=143)Cannabis (n=1,243)
SF-3
6 M
H Sc
ore
0
20
40
60
80
100
Pre-program
SF-36 General Health
Post-program
Other illicits (n=1,231) Alcohol (n=143)Cannabis (n=1,243)
SF-3
6 GH
Sco
re
0
20
40
60
80
100
Figure 13: Changes in SF-36 General and Mental Health scores, by principal drug (n=2,617)
Criminal Justice Outcomes Data on offences at index Court appearance were available for 6,847 participants. Because participants could have more than one charge type at their index Court appearance, the National Offence Index [19] was used to identify each participants’ most serious offence. Overall, there was a significant association between the most serious offences at index Court appearance and principal drug typeu. The most common charges against the cannabis PD group were illicit drug offences, compared to theft and related offences for Other PDs and dangerous/negligent acts endangering persons for the alcohol PD group (Table 3).
Total n (%) n (%) within principal drug category
Cannabis Other illicits Alcohol
Illicit drug offences 1,737 (25) 978 (35) 754 (20) 5 (2)
Theft and related offences 1,484 (22) 330 (12) 1150 (31) 4 (1)
Acts intended to cause injury 1,037 (15) 505 (18) 433 (12) 99 (33)
Dangerous/negligent acts endan-gering persons
554 (8) 244 (9) 183 (5) 127 (42)
Unlawful entry with intent/bur-glary, break & enter
480 (7) 153 (6) 323 (9) 4 (1)
Offences against justice proce-dures
361 (5) 153 (6) 199 (5) 9 (3)
Traffic/motor vehicle regulatory offences
334 (5) 117 (4) 211 (6) 6 (2)
Property damage 247 (4) 120 (4) 97 (3) 30 (10)
Weapons and explosives offences 173 (3) 60 (2) 109 (3) 4 (1)
Deception and related offences 139 (2) 28 (1) 111 (3) 0 (0)
Robbery, extortion and related offences
138 (2) 30 (1) 107 (3) 1 (<1)
Miscellaneous offences 123 (2) 43 (2) 80 (2) 0 (0)
Public order offences 34 (<1) 14 (<1) 7 (<1) 13 (4)
Homicide and related offences 6 (<1) 2 (<1) 3 (<1) 1 (<1)
Total 6,847 (100) 2,777 (100) 3,767 (100) 303 (100)
Table 3: Most serious offence (category), by principal drug (n=6,847)
Data on new convictions post-index Court appearance were available for 1,360 participants. Of these, 59% (n=799) were convicted of a new offence between the index offence finalisation date and the 31st of December 2007. New convictions varied significantly by principal drug, with 29% of the alcohol PD group receiving a new conviction, compared to almost half (48%) of those in the cannabis PD group and the majority (68%) of those in the Other PD groupv.

CRIME PREVENTION ISSUES 8No.7
Among those convicted of an offence after the finalisation of their index matter, the median number of days to offending was 212 (IQR8 76-444, n=799). There were significant differences in time to re-offending, with those in the cannabis PD group taking a median of 266 days (IQR 110-487, n=252)to reoffend, compared to 179 (IQR 61-478, n=16) days for those in the alcohol PD group and 181 (IQR 68-400, n=531) days for participants in the Other PD groupw.
Particular attention was given to assessing a limited set of predictors of conviction for a new offence using regression analysis. Whilst the focus of this analysis was to investigate the role of principal drug of concern, a select number of other predictors were also included to increase the validity of the inferences made. Cases with missing data were deleted listwise.
Cannabis or Other PD, program non-completion and previous imprisonment were all significantly associated with increased odds of new conviction post-index offence finalisation, while older age was associated with a slight reduction in odds of new conviction (Table 4). Principal drug group had the greatest impact on reconviction. Compared to those in the alcohol PD group, those in the Other PD group were five times, and those in the cannabis PD group were three times, as likely to be convicted of a new offence when controlling for age, program completion and previous imprisonment9.
8 IQR reflects the median for the highest and lowest 25% of the sample
9 Please note that the number of participants with alcohol as their principal drug in this analysis was quite small (n=55). This may limit the reliability of the derived alcohol-related results.
Factor
New conviction Univariate Multivariate
Non (%)
Yesn (%)
p OR* (95%CI) p AOR** (95%CI)
Age Mean (SD) N (%)
31 (9.6)475 (43%)
29 (7.2)623 (57%) <.0001 0.97 (0.96-0.99) <.0001 0.96 (0.94-0.97)
Gender Male Female
447(41%)114 (43%)
645(59%)154 (58%) 0.63 0.94 (0.71-1.23)
Indigenous status non-Aboriginal Aboriginal
465 (42%)85(39%)
650 (58%)134 (61%) 0.43 1.13 (0.84-1.52)
Principal drug Alcohol Cannabis Other illicits
39 (71%)271 (52%)251(32%)
16(29%)252 (48%)531 (68%)
<.00010.008
<.00012.27 (1.24-4.16)5.16 (2.83-9.41)
<.00010.008
<.0001
2.92 (1.31-6.49)5.35 (2.43-11.82)
Program completer Yes No
426 (46%)135 (32%)
507 (54%)292 (68%) <.0001 1.82 (1.43-2.31) 0.005
1.65 (1.16-2.36)
Previous imprisonment No Yes
216 (56%)142 (33%)
167 (44%)293 (67%) <.0001 2.67 (2.01-3.55) <.0001
2.97 (2.15-4.10)
Table 4: Factors associated with new conviction post-index Court appearance10
*Odds ratio
** Adjusted odds ratio; adjusted for all other factors in the model
10 Cases can only be included in a regression analysis where data is available for each predictor variable.

CRIME PREVENTION ISSUES 9No.7
Discussion Questions arising from previously published analyses of the MERIT program provided a valuable opportunity to focus on principal drug of concern as an indicator of participant characteristics and a predictor of diversion outcomes. On the basis of analyses presented in this report, the evidence suggests that the principal drug of concern has some explanatory power. Specifically, suggestions that having cannabis as the principal drug of concern accounts for observed gender differences (given that males are more likely to have a cannabis PD) are supported to the extent that cannabis users and males were both found to be significantly younger, more likely to live in a private residence and less likely to inject than females and participants with another illicit principal drug of concern.
Beyond this particular issue, distinct profiles appear to have emerged on the basis of principal drug type, fitting roughly along a continuum reflecting relatively high to low health, social and psychological functioning. Participants entering diversion with alcohol as their principal drug of concern appear to be the highest functioning of the three PD groups. Overall, those with an alcohol PD were found to be older (median 31 yrs v. 26 yrs CPD and 29 yrs OPD), most likely to be in full-time employment (29.6% v. 17.1% CPD, and 8.9% OPD), and presented with the lowest levels of dependence (6.9 v. 7.7 CPD and 8.7 OPD as measured by the SDS), the lowest pre-program levels of psychological distress (16% in the “severe” range of the K-10 v. 27% CPD and 34% OPD), and the highest levels of general and mental health both pre- and post-program participation (see Table 2). They were also the least likely to be convicted of a new offence following their index court finalisation date.
In comparison, participants entering diversion programs with an illicit drug PD other than cannabis were observed to be the least likely to complete a program, with the greatest likelihoods of being breached from the program (25.2% v. 15.9% CPD and 14.5% APD), of having a history of incarceration (62% v. 38% for CPD and APD), of spending the shortest amount of time in rehabilitation programs (33 days v. 49 days APD) and having the highest levels of dependence. By contrast, cannabis PD participants largely fell between the alcohol and Other illicit PD groups on most measures, although they were observed to be the youngest group of participants and were also the most likely to withdraw from the diversion program.
Whilst the rigour of these profiles may be subject to challenge on the basis that: a) the data for the alcohol PD group was collected across two different diversion schemes; and b) the number of participants in the alcohol PD group was small and therefore more subject to variability, the information is instructive none-the-less. Firstly, members of the alcohol PD were significantly less likely than those in the Other PD group to have previously accessed substance related treatment, this suggests that court diversion schemes may offer a useful point of entry to treatment for individuals with problematic alcohol use. Secondly, these data suggest that pre-plea diversion programs based upon the MERIT model have the potential for positive outcomes for participants with an alcohol PD despite their generally higher levels of functioning. Thus, to the extent that alcohol dependence/abuse [20] and alcohol-related crime [8] contribute significantly to the burden of disease and costs of crime in Australia, these data have positive implications for the prospect of diversion programs which are accessible to defendants with alcohol as their principal drug of concern.
Acknowledgements The authors of this report would like to thank Kevin Roberts and Peter Didcott from NSW Health for the provision of MIMS, RAD and health outcomes data. Their support and assistance throughout data receipt and interpretation made this report possible.
The authors would also like to thank the Assistant Director General, Crime Prevention and Community Programs and staff of the Crime Prevention Division of the NSW Attorney General’s Department, and, in particular, Karen Patterson and Bruce Flaherty. Thanks also to Craig Jones from the NSW Bureau of Crime Statistics and Research for providing criminal justice outcomes data for the cohort of MERIT and RAD participants.
Finally, the authors would like to thank all those who reviewed earlier versions of this report and provided considered and constructive feedback.
The MERIT and RAD programs are funded under the Commonwealth/NSW COAG Illicit Drug Diversion Initiative.

CRIME PREVENTION ISSUES 10No.7
References 1. Hughes, C.& Ritter, A. (2008). A Summary of
Diversion Programs for Drug and Drug-related Offenders in Australia: National Drug and Alcohol Research Centre.
2. Reilly, D., Scantleton, J., & Didcott, P. (2002). Magistrates’ Early Referral into Treatment (MERIT): Preliminary findings of a 12-month court diversion trial for drug offenders. Drug and Alcohol Review, 21(4), 393-396.
3. Passey, M., Flaherty, B., & Didcott, P. (2006). The Magistrates Early Referral into Treatment (MERIT) Pilot Program: A Descriptive Analysis of a Court Diversion Program in Rural Australia. Journal of Psychoactive Drugs, 38(4), 521.
4. Spooner, C., Hall, W., & Mattick, R.P. (2001). An overview of diversion strategies for Australian drug-related offenders. Drug and Alcohol Review, 20(3), 281-294.
5. Matruglio, T. (2008). MERIT Annual Report, 2006. Sydney: Crime Prevention Division, NSW Attorney General’s Department.
6. Martire, K. A.,& Larney, S. (2009). Women and the MERIT program. Sydney: Crime Prevention Division, NSW Attorney General’s Department.
7. Wilczynski, A.& Pigott, R. (2004). The Relationship Between Drugs and Crime. Canberra: Australian Government Attorney-General’s Department.
8. Collins, D.J., & Lapsley, H.M. (2008). The Costs of Tobacco, Alcohol and Illicit Drug Abuse to Australian Society in 2004/05. Canberra: Department of Health and Ageing.
9. Harvey, E., Shakeshaft, A., Hetherington, K., Sannibale, C., & Mattick, R.P. (2007). The efficacy of diversion and aftercare strategies for adult drug-involved offenders: a summary and methodological review of the outcome literature. Drug and Alcohol Review, 26(4), 379-387.
10. Australian Bureau of Statistics. (2006). Census of Population and Housing. Canberra: Australian Bureau of Statistics
11. Gossop, M., Darke, S., Griffiths, P., Hando, J., Powis, B., Hall, W., & Strang, J. (1995). The Severity of Dependence Scale: Psychometric properties of the SDS in English and Australian samples of heroin, cocaine and amphetamine users. Addiction, 90, 607-614.
12. Lawrinson, P., Copeland, J., Gerber, S., & Gilmour, S. (2007). Determining a cut-off on the Severity of Dependence Scale (SDS) for alcohol dependence. Addictive Behaviors, 32, 1474-1479.
13. Swift, W., Copeland, J., & Hall, W. (1998). Choosing a diagnostic cut-off for cannabis dependence. Addiction, 93, 1681-1692.
14. Kaye, S., & Darke, S. (2002). Determining a diagnostic cut-off on the Severity of Dependence Scale (SDS) for cocaine dependence. Addiction, 97, 727-731.
15. Topp, L., & Mattick, R.P. (1997). Choosing a cut-off on the Severity of Dependence Scale for amphetamine users. Addiction, 92, 839-845.
16. Kessler, R.C., Andrews, G., Colpe, L.J., Hiripi, E., Mroczek, D.K., Normand, S.L., Walters, E.E., & Zaslavsky, A.M. (2002). Short screening scales to monitor population prevalences and trends in non-specific psychological distress. Psychological Medicine, 32, 959-976.
17. Ware, J.E., Snow, K.K., & Kosinksi, M. (1993). SF-36 health survey manual and interpretation guide. Boston: Health Institute, New England Medical Center.
18. Australian Bureau of Statistics. (1995). National Health Survey SF-36 Population Norms. Canberra: Australian Bureau of Statistics.
19. Australian Bureau of Statistics. (2003). Criminal Courts 2001-02. Canberra: Australian Bureau of Statistics.
20. Mathers, C.D., Vos, E.T., Stevenson, C.E., & Begg, S.J. (2001). The burden of disease and injury in Australia. Bulletin of the World Health Organization, 79, 1076-1084.

CRIME PREVENTION ISSUES 11No.7
Notes a χ2=14.5, df=1, p<.0001b χ2=8.4, df=3, p=0.04c χ2=135.8, df=8, p<.0001d χ2=135.1, df=2, p<.0001e χ2=95.2, df=2, p<.0001f Kruskal-Wallis χ2=149.06, df=2, p<.0001g χ2=246.1 , df=2, p<.0001h χ2=1,096.6, df=2, p<.0001i χ2=218.6, df=8, p<.0001j χ2=40.6, df=6, p<.0001k χ2=36.3, df=6, p<.0001l χ2=212.9, df=2, p<.0001m χ2=16.3, df=4, p=.003n Cannabis mean±SD=38.2±40.4; Other illicits=33.6±40.4; Alco-hol=49.1±39.6; overall ANOVA F=4.6, df=2, p=.01. Pairwise com-parisons: other vs. cannabis t=-1.9, df=1,145, p=.06; cannabis vs. alcohol t=-1.8, df=1,145, p=.07; other illicits vs. alcohol t=-2.6, df=1,145, p=.008.
o Pre-program one way ANOVA F=65.8, df=2, p<.0001. Pairwise comparisons: Other vs. cannabis t=10.8, df=4,984, p<.0001; Can-nabis vs. alcohol t=2.1, df=4,984, p=.03; other illicits vs. alcohol t=5.0, df=4,984, p<.0001. Post-program one way ANOVA F=7.2, df=2, p=.001. Pairwise comparisons: Other vs. cannabis t=3.8, df=2,552, p<.0001; cannabis vs. alcohol t=0.1, df=2,552, p=0.9; other illicit vs. alcohol t=0.8, df=2,552, p=0.4
p Mixed ANOVA within subjects (SDS) F=45.9, df=1, p<.0001; be-tween subjects (principal drug) F=24.2, df=2, p<.0001; interaction (SDS x principal drug) F=4.3, df=2, p=.01.
q Pre-program χ2=121.5, df=6, p<.0001; post-program χ2=74.4, df=6, p<.0001
r Mixed ANOVA within subjects (K10) F=644.1, df=1, p<.0001; be-tween subjects (principal drug) F=62.2, df=2, p<.0001; interaction (K10 x principal drug) F=0.2, df=2, p=0.8
s General health: Pre-program one way ANOVA F=21.1, df=2, p<.0001. Pairwise comparisons: Other vs. cannabis t=-4.4, df=5,011, p<.0001; cannabis vs. alcohol t=-3.6, df=5,011, p<.0001; other illicits vs. alcohol t=-5.5, df=5,011, p<.0001. Post-program one way ANOVA F=31.7, df=2, p<.0001. Pairwise comparisons: Other illicits vs. cannabis t=-6.0, df=2,661, p<.0001; cannabis vs. alcohol t-3.7, df=2,661, p<.0001; other illicits vs. alcohol t=-6.4, df=2,661, p<.0001.
Mental health Pre-program one-way ANOVA F=41.7, df=2, p<.0001. Pairwise comparisons: Other illicits vs. cannabis t=-5.6, df=5,011, p<.0001; cannabis vs. alcohol t=-5.7, df=5,011, p<.0001; other illicits vs. alcohol t=-8.1, df=5,011, p<.0001. Post-program one-way ANOVA F=40.8, df=2, p<.0001. Pairwise comparisons: other illicits vs. cannabis t=-7.1, df=2,661, p<.0001; cannabis vs. alcohol t=-3.9, df=2,661, p<.0001; other illicits vs. alcohol t=-7.1, df=2,661, p<.0001.
t General health: Mixed ANOVA within subjects (SF-36 general health) F=373.1, df=1, p<.0001; between subjects (principal drug) F=26.8, df=2, p<.0001; interaction (SF-36 general health x princi-pal drug) F=3.6, df=2, p=.03
Mental health: Mixed ANOVA within subjects (SF-36 mental health) F=505.7, df=1, p<.0001; between subjects (principal drug) F=42.4, df=2, p<.0001; interaction (SF-36 mental health x principal drug) F=0.9, df=2, p=.4
u χ2=1398.9, df=26, p<.0001v χ2=71.1, df=2, p<.0001w Kruskal-Wallis χ2=11.4, df=2, p=.003

CRIME PREVENTION ISSUES 12No.7
www.crimeprevention.nsw.gov.au
ISSN 1834-3872
© State of New South Wales through the Attorney General’s Department 2009. You may freely deal with this work for any purpose, other than for profit.