Crime and Immigration: New Evidence From …personal.lse.ac.uk/machin/pdf/lj sm iza 19 OCT...
44
Crime and Immigration: New Evidence From England and Wales Laura Jaitman* and Stephen Machin** October 2013 * Department of Economics, University College London ** Department of Economics, University College London and Centre for Economic Performance, London School of Economics Abstract We study a high profile public policy question on immigration, namely the link between crime and immigration, presenting new evidence from England and Wales in the 2000s. For studying immigration impacts, this period is of considerable interest as the composition of migration to the UK altered dramatically with the accession of Eastern European countries (the A8) to the European Union in 2004. As we show, this has important implications for ensuring a causal impact of immigration can be identified. When we are able to implement a credible research design with statistical power, we find no evidence of an average causal impact of immigration on crime, nor do we when we consider A8 and Non-A8 immigration separately. We also study London by itself as the immigration changes over time in the capital city were large. Again, we find no causal impact of immigration on crime from our spatial econometric analysis and also present evidence from unique data on arrests of natives and immigrants in London which shows no immigrant differences in the likelihood of being arrested. JEL Keywords: Crime; Immigration; Enclaves; A8. JEL Classifications: F22, K42 Author Emails: [email protected]; [email protected] Acknowledgements This paper was presented at the IZA and Center on Human Capital Workshop on Migration and Human Capital in Bonn 23/24 May 2013. The Workshop was organized in collaboration with the Journal of Human Capital and the IZA Journal of Migration. We would like to thank the participants at the Workshop and at the April 2013 Norface conference on Migration, Global Developments and New Frontiers. We are especially thankful to Deborah Cobb-Clark and to an anonymous referee for their helpful comments and suggestions. We also thank the Metropolitan Police Service for providing the arrests data. Crown copyright material is reproduced with the permission of the Controller of HMSO and the Queen’s Printer for Scotland.
-
Upload
hoangkhuong -
Category
Documents
-
view
215 -
download
0
Transcript of Crime and Immigration: New Evidence From …personal.lse.ac.uk/machin/pdf/lj sm iza 19 OCT...
Crime and Immigration:New Evidence From England and Wales
Laura Jaitman* and Stephen Machin**
October 2013
* Department of Economics, University College London
** Department of Economics, University College London and Centre for EconomicPerformance, London School of Economics
Abstract
We study a high profile public policy question on immigration, namely the link betweencrime and immigration, presenting new evidence from England and Wales in the 2000s. Forstudying immigration impacts, this period is of considerable interest as the composition ofmigration to the UK altered dramatically with the accession of Eastern European countries(the A8) to the European Union in 2004. As we show, this has important implications forensuring a causal impact of immigration can be identified. When we are able to implement acredible research design with statistical power, we find no evidence of an average causalimpact of immigration on crime, nor do we when we consider A8 and Non-A8 immigrationseparately. We also study London by itself as the immigration changes over time in the capitalcity were large. Again, we find no causal impact of immigration on crime from our spatialeconometric analysis and also present evidence from unique data on arrests of natives andimmigrants in London which shows no immigrant differences in the likelihood of beingarrested.
JEL Keywords: Crime; Immigration; Enclaves; A8.JEL Classifications: F22, K42Author Emails: [email protected]; [email protected]
Acknowledgements
This paper was presented at the IZA and Center on Human Capital Workshop on Migrationand Human Capital in Bonn 23/24 May 2013. The Workshop was organized in collaborationwith the Journal of Human Capital and the IZA Journal of Migration. We would like to thankthe participants at the Workshop and at the April 2013 Norface conference on Migration,Global Developments and New Frontiers. We are especially thankful to Deborah Cobb-Clarkand to an anonymous referee for their helpful comments and suggestions. We also thank theMetropolitan Police Service for providing the arrests data. Crown copyright material isreproduced with the permission of the Controller of HMSO and the Queen’s Printer forScotland.

1
1. Introduction
A large research literature has, over the years, studied the impact of immigration on economic
outcomes. A prime focus in this work has been on the labour market impact of immigration,
asking questions about the overall impact on wages and employment, but also on whether
immigrants displace native workers or lower their wages through greater competition for jobs (see,
inter alia, Altonji and Card, 1991, Borjas, 1999; Card, 2005, 2009; or Dustmann, Frattini and
Preston, 2013). Other immigration impacts have also received attention, albeit to a lesser extent
than the labour market work, including the impact of immigration on housing markets, usage of
public services, welfare benefits and crime. In the past few years, these other impacts have
received more attention and there are now growing numbers of contributions in these areas.1
In this paper, we present some new evidence on the impact of immigration on crime, using
data from England and Wales. Ascertaining the magnitude and direction of an impact of
immigration on crime is a high profile public policy question, but it is one on which we currently
have only a limited number of robust findings. This is important since many media commentators
and responses in public opinion polls postulate that immigration causes crime. Nevertheless, and
standing contrary to this populist view, the (still relatively small) literature that does exist finds it
hard to detect an average impact of immigration on crime. For example, Bianchi, Buonanno and
Pinotti (2012) study crime and immigration across Italian areas, finding no significant empirical
connection. Bell, Fasani and Machin (2013) conclude the same studying two large immigration
waves in the UK.
A more subtle conclusion follows when a heterogeneous impact across different migrant
groups is studied and, here, the extent of attachment to the labour market, and hence a source of
legal income, seems critical. Bell, Fasani and Machin (2013) show that the very rapid influx of
1 On housing markets and immigration see Saiz (2007) for US evidence and Sa (2011) for UK evidence. For evidence(respectively for the US and UK) on use of health services see Borjas and Hilton (1996) and Wadsworth (2013).Reviews of the research on welfare benefits are given in Barrett and McCarthy (2008) and on crime in Bell andMachin (2013).

2
Eastern European migrants that entered the UK after the A8 accession countries joined the
European Union in 2004 had no detrimental crime impact since the migrants actually had higher
employment rates than natives. They do, however, find a positive, small, but statistically
significant crime impact associated with the late 1990s wave of asylum seekers who were
detached from the labour market. Spenkuch (2011) also emphasises immigrant heterogeneity in
the US, breaking the immigrant stock into Mexicans and Non-Mexicans, and reports a significant
positive crime effect for Mexican immigrants, while it is negative and insignificant for other
immigrants.
In this paper, we present new causal evidence on the impact of immigration on crime,
using a range of data sources from England and Wales. We consider the crime-immigration
relationship in the 2000s, a decade when the composition of migration altered dramatically with
the accession of Eastern European countries (the A8) to the European Union in 2004. We
estimate spatial panel data models of the crime-immigration relationship over the 2000s, and also
present an analysis of differences in arrest rates of natives and migrants using unique data from
the London Metropolitan Police Service.
As with some other work studying immigration impacts, we need to take care to identify a
causal impact of immigration. To do so we adopt and further develop the enclave approach to
immigrant settlement pioneered by Card (2001) where actual immigration flows are instrumented
by a predicted settlement variable generated from overall immigration flows on the assumption
that new migrants go to live in locations where earlier migrants from their origin country also
settled. As already noted, because we are focussing on the 2000s in England and Wales, the
significant compositional change of the structure of immigration flows has important implications
for ensuring a causal impact of immigration can be identified. Our empirical analysis takes care to
ensure we are able to implement this approach in a coherent manner for the setting we study.
3
When we are able to implement a credible research design with statistical power, we find
no evidence of an average causal impact of immigration on criminal behavior, nor do we when
we consider A8 and Non-A8 immigration separately. We also consider London by itself as the
immigration changes in the capital city in the 2000s were large. Again, we find no causal impact
of immigration on crime from our spatial econometric analysis and also present evidence from
unique data on arrests of natives and immigrants which shows no immigrant differences in the
likelihood of being arrested.
The rest of the paper is structured as follows. In Section 2, we report descriptive
information on immigration trends, placing a particular focus on the changing nature of migration
flows. Section 3 discusses how to approach this in our spatial econometric analysis and reports
evidence on when we are (and are not) able to utilise the enclave approach productively for our
data. Section 4 reports evidence on the causal impact of immigration on crime. Section 5 then
shows the analysis of arrest rates for natives and migrants. Section 6 concludes.
2. Trends in Immigration to England and Wales
Data
The main sources of immigration data for England and Wales are the decennial Population
Census (1991, 2001 and 2011). For the inter-Census period in the 2000s we are able to use data
from the Annual Population Survey (APS) which covers the financial years 2004/2005 to
2010/2011 (see the Data Appendix and Jaitman and Machin, 2013, for more details). Both data
sources show that the nature of changing immigration was a significant phenomenon in England
and Wales through the 2000s. They show the changes to be even more pronounced in London and,
for that reason (and because we have data on arrests by nationality for London), we look at
London separately in our analysis.
4
Overall Immigration Trends
According to the 2011 Census, one in eight people living in England and Wales – a total
of 7.5 million out of 56 million - were born abroad. This shows a very big increase from 4.6
million (out of 52 million) in the previous Census in 2001 which in turn was up from 3.6 million
(out of 50 million) in the 1991 Census. As Figure 1 shows, the share of immigrants therefore
almost doubled from 1991 to 2011 in England and Wales, and grew at a faster rate in the 2000s as
compared to the 1990s.
London has always been the main destination of foreigners, and changes in the capital city
are even more marked. As the Figure shows, the share of immigrants grew from 21.7 percent in
1991 to 27.1 percent in 2001 and reached 36.7 percent in 2011. Hence, a significant part of the
overall aggregate growth in the share of immigrants between 2001 and 2011 comes from London
(for the rest of England and Wales it increased from 6.0 percent to 9.4 percent). In London the
immigrant population was 1.5 million in 1991, increased to 1.9 million in 2001 and grew 58
percent in the following ten years to reach 3 million by 2011.2
The Changing Composition of Immigration
In the last decade, not only did the share of immigrants increase but also there were
important changes in terms of the composition of their country of origin. In May 2004, eight
Eastern European countries (the so called A8) joined the European Union3. The A8 countries are
Estonia, Czech Republic, Hungary, Latvia, Lithuania, Poland, Slovakia and Slovenia. In January
2007 two more countries (the A2, Bulgaria and Romania) gained access to the European Union.
For the A8 citizens there was no restriction to work or live in the UK, as long as they registered
with the Worker Registration Scheme (requirement that ended in 2011). The A2 citizens did face
restrictions to access to labour markets (which will end in 2014).
2See Table A1 of the Appendix for more details on the sub-groups of immigrants.
3Apart from the A8 countries, Cyprus (excluding that part of the country under Turkish control) and Malta also
joined the European Union.

5
This expansion of the European Union had a very big effect on the UK. Results from the
2011 Census suggest that about 1.1 million people were born in countries which joined the EU in
2004 or afterwards (almost 600,000 of those were born in Poland). This has important
implications when studying the effect of immigration as the population of migrants from these
origin countries were low in the previous Census.
For example, as shown in the first panel of Table 1, in the 2001 Census Poland did not
feature in the top countries of UK residents born in a different country. Poland was actually
placed in 17th, accounting for only 1.3 percent of the immigrant population. However, by 2011
Polish immigration is the fastest growing and it is ranked second, comprising 7.7 percent of the
immigrant population. The second panel of Table 1 shows that in London Poland was ranked 18th
in 2001, accounting for 1.1 percent of the immigrant population, and as for the country as a whole,
it jumped to second place by 2011 accounting for 5.3 percent of the immigrant population.
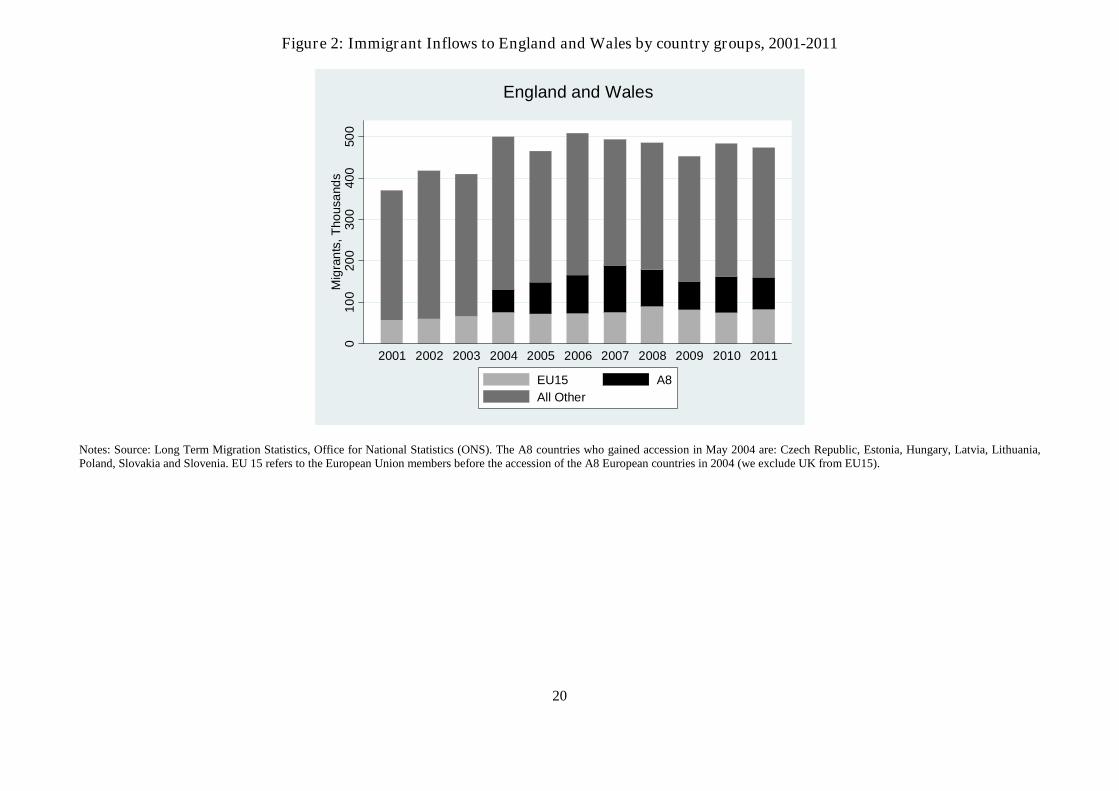
Figure 2 reports the flows, rather than the stocks, to show the same point. Prior to 2004,
the year of accession, flows from the A8 were negligible. In 2004, they rose to about 53,000
people and this steadily increased to 112,000 by 2007, decreasing to 77,000 by 2011. Thus the
increase in the A8 flows from 2004 has significantly altered the composition of immigrant stocks
in England and Wales. This has implications that should not be ignored or brushed over in
empirical analysis of the impact of immigration over this time period, and this is what we turn to
in the next Section of the paper.
3. Empirical Approach
We plan to estimate spatial panel data models of crime and immigration flows, paying careful
attention to the means of identifying a causal impact of immigration on crime. To do so we adopt
the previous settlement/enclave approach of ensuring that the direction of causation flows from
the immigrant variable to the outcome of interest, crime.

6
Estimating Equations
For spatial data over time, our main equation of interest (expressed in differences for
spatial unit s between period t and t-1, denoted by the difference operator Δ) relates the crime rate
to the immigrant/population ratio as:
∆൬Crime
Population൰
st
= β1∆൬
Immigrants
Population൰
st
+ β2∆Xst+ Tt + ε
st
(1)
where X contains a set of time-varying controls, T is a common time effect and ε is an error term.
The principal empirical challenge in estimating the key parameter of interest β1 is, as
already stated, the issue of possible reverse causation. We therefore use a 'previous settlement'
type instrumental variable to predict the immigrant share. The logic of this arises from the notion
that immigrants tend to settle in areas where there is already a high share of immigrants from their
country of origin (what we call enclaves). The exogeneity of the instrument relies on the
assumption that there are no persistent shocks that could drive the location of immigrant
settlements over time and that are correlated with the outcome variables of interest (in this case,
crime trends).
More formally, the instrumental variable we use to predict the change in the share of
immigrants for spatial unit s and initial time period t0, is the following:
∆Pst= (Icst0
c
/Ict0)∆Ict൩/Populationst0
(2)
where we use the initial distribution of immigrants from country c and allocate the flow of
immigrants from that country between period 0 and 1, according to that distribution in time 0. We
do this for 17 countries or country groups and sum the predicted change in immigrant share from
each country. The selection of countries was based in their importance as immigrant sending
7
countries or regions to the UK.4 We also include in the prediction an additional dummy variable
for whether areas historically had a high immigration share, defined as 20 percent or over in the
1991 Census.
The Changing Composition of Immigration to England and Wales
As the descriptive analysis of Section 2 showed, in the context we study the composition
of migrant flows was dramatically altered by a big influx of migrants from different places than
before. This has a potentially important impact on the usefulness or otherwise of the enclave type
instrument described in equation (2). We therefore need to be careful in our empirical analysis to
ensure that this changing composition does not invalidate the use of the enclave instrument.
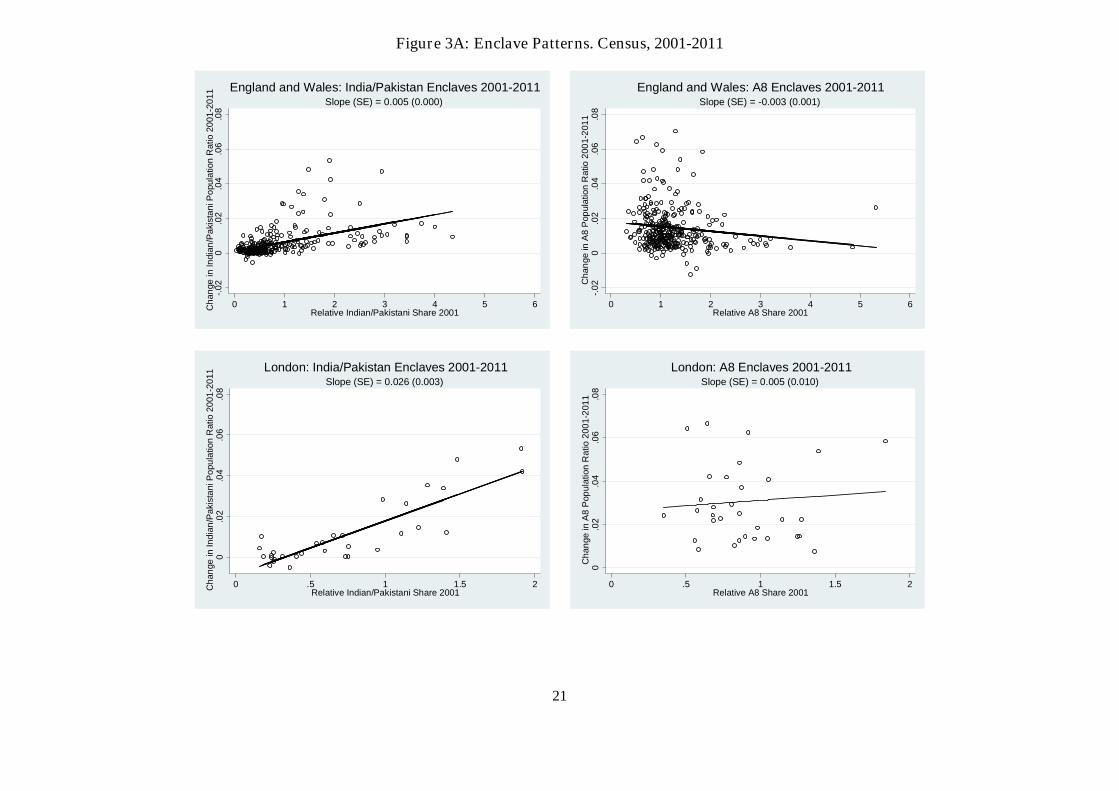
Figures 3A and 3B show enclave patterns for different sending regions and time periods
across the local authorities in England and Wales. The horizontal axis shows the relative
immigrant share ratio: the share of immigrants from country c that lived in the spatial unit s in the
year t0 divided by the share of total immigrants that lived in spatial unit s in the year t0. Values
larger than one imply that the sending country c is over-represented in the spatial unit s relative to
the average total immigrant population. A large value for the relative immigrant share from
country c thus characterises an enclave. If we represent the immigrants coming from country c as
Ic, the vertical axis shows the change in the ratio Ic/population of every spatial unit s in the period
t0 to t1. A positive correlation between the relative immigrant share ratio and the change in the
immigrant population from country c would suggest that net immigrant flows go to spatial units
where there was already a significant settlement of immigrants from that country (established
enclaves).
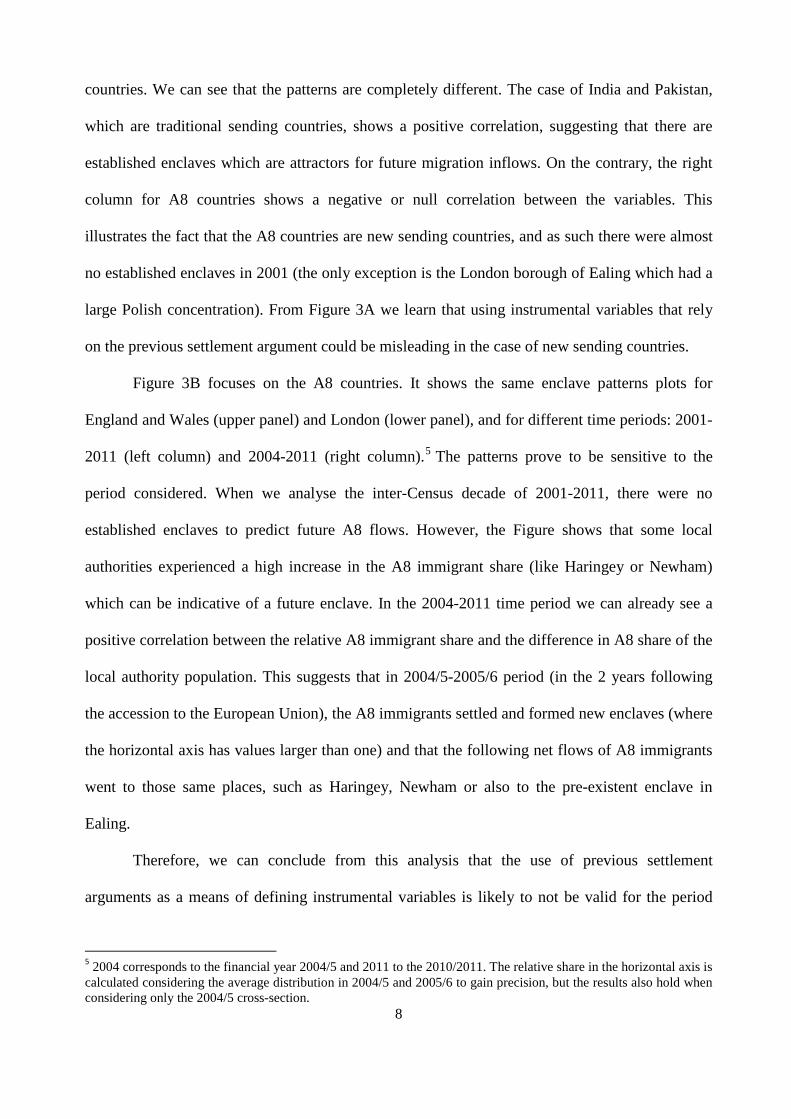
Figure 3A shows illustrative selected enclaves patterns for the period 2001-2011. The left
column is for immigrants from India and Pakistan and the right one is for immigrants from A8
4 The 17 groups are: Ireland, European Union countries as of 2001, A8 countries, Rest of Europe, India, Pakistan,Bangladesh, Sri Lanka, Rest of Asia, Kenya, South Africa, Ghana, Rest of Africa, Jamaica, North America, Rest ofAmerica and Oceania.
8
countries. We can see that the patterns are completely different. The case of India and Pakistan,
which are traditional sending countries, shows a positive correlation, suggesting that there are
established enclaves which are attractors for future migration inflows. On the contrary, the right
column for A8 countries shows a negative or null correlation between the variables. This
illustrates the fact that the A8 countries are new sending countries, and as such there were almost
no established enclaves in 2001 (the only exception is the London borough of Ealing which had a
large Polish concentration). From Figure 3A we learn that using instrumental variables that rely
on the previous settlement argument could be misleading in the case of new sending countries.
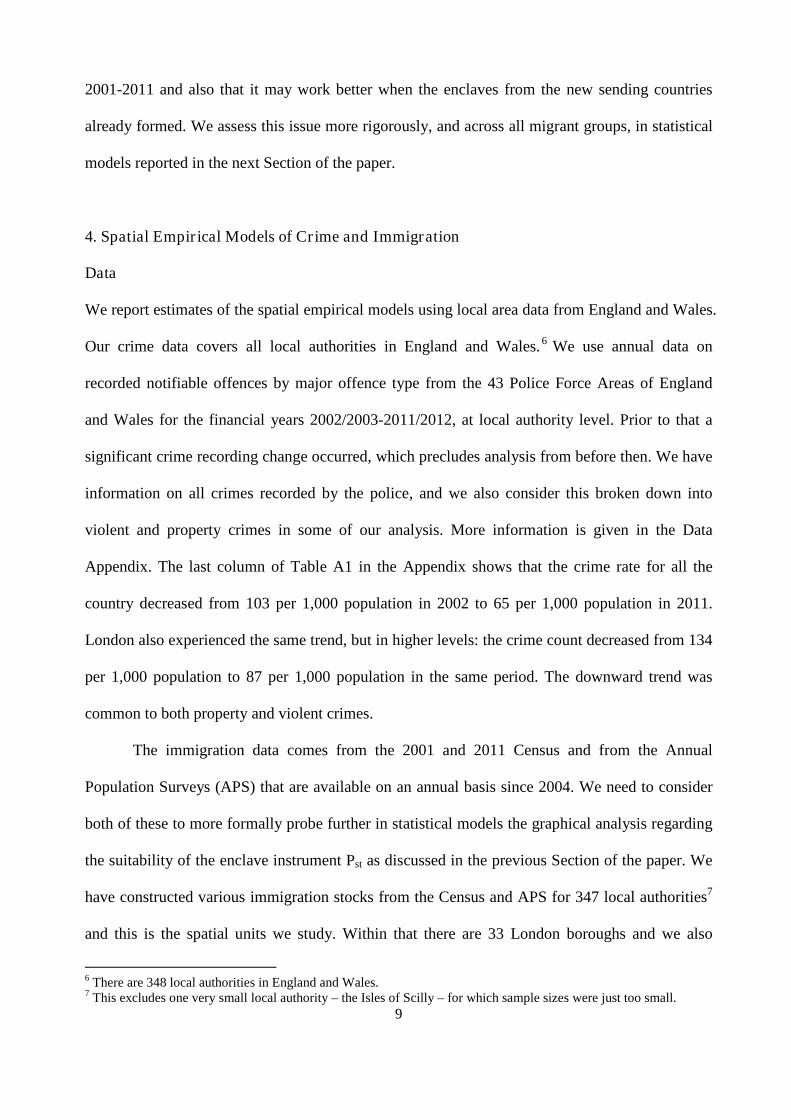
Figure 3B focuses on the A8 countries. It shows the same enclave patterns plots for
England and Wales (upper panel) and London (lower panel), and for different time periods: 2001-
2011 (left column) and 2004-2011 (right column).5 The patterns prove to be sensitive to the
period considered. When we analyse the inter-Census decade of 2001-2011, there were no
established enclaves to predict future A8 flows. However, the Figure shows that some local
authorities experienced a high increase in the A8 immigrant share (like Haringey or Newham)
which can be indicative of a future enclave. In the 2004-2011 time period we can already see a
positive correlation between the relative A8 immigrant share and the difference in A8 share of the
local authority population. This suggests that in 2004/5-2005/6 period (in the 2 years following
the accession to the European Union), the A8 immigrants settled and formed new enclaves (where
the horizontal axis has values larger than one) and that the following net flows of A8 immigrants
went to those same places, such as Haringey, Newham or also to the pre-existent enclave in
Ealing.
Therefore, we can conclude from this analysis that the use of previous settlement
arguments as a means of defining instrumental variables is likely to not be valid for the period
52004 corresponds to the financial year 2004/5 and 2011 to the 2010/2011. The relative share in the horizontal axis is
calculated considering the average distribution in 2004/5 and 2005/6 to gain precision, but the results also hold whenconsidering only the 2004/5 cross-section.
9
2001-2011 and also that it may work better when the enclaves from the new sending countries
already formed. We assess this issue more rigorously, and across all migrant groups, in statistical
models reported in the next Section of the paper.
4. Spatial Empirical Models of Crime and Immigration
Data
We report estimates of the spatial empirical models using local area data from England and Wales.
Our crime data covers all local authorities in England and Wales. 6 We use annual data on
recorded notifiable offences by major offence type from the 43 Police Force Areas of England
and Wales for the financial years 2002/2003-2011/2012, at local authority level. Prior to that a
significant crime recording change occurred, which precludes analysis from before then. We have
information on all crimes recorded by the police, and we also consider this broken down into
violent and property crimes in some of our analysis. More information is given in the Data
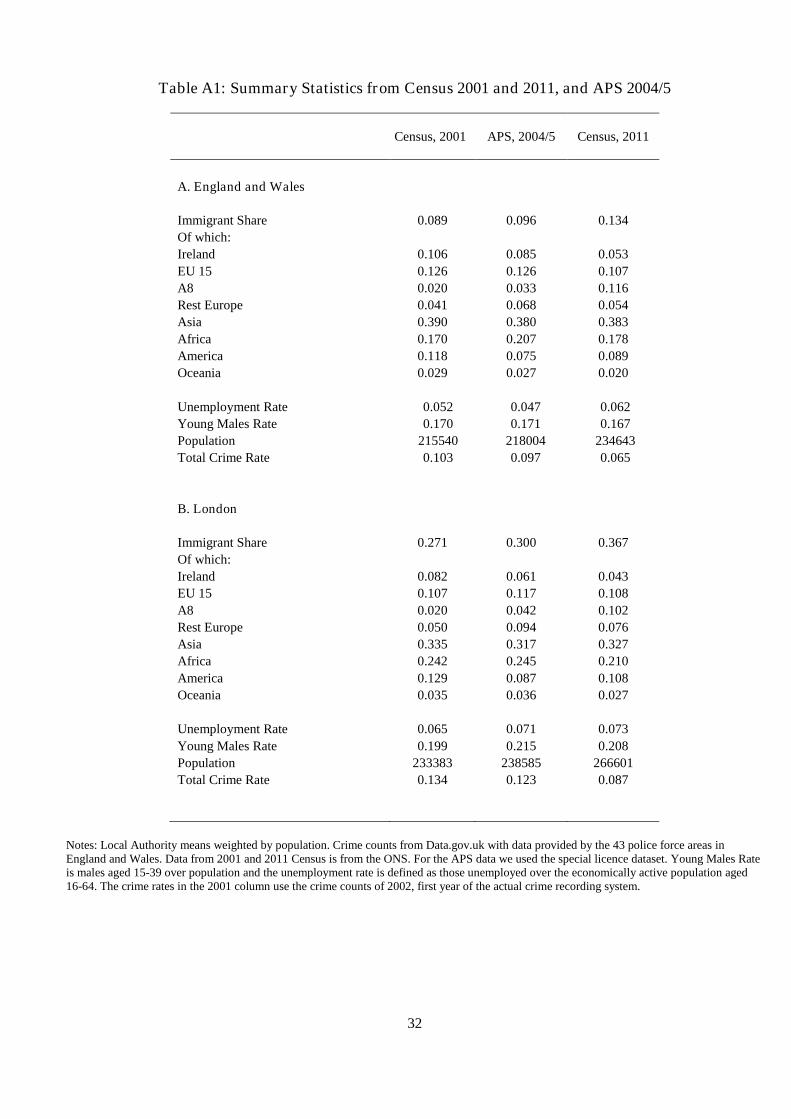
Appendix. The last column of Table A1 in the Appendix shows that the crime rate for all the
country decreased from 103 per 1,000 population in 2002 to 65 per 1,000 population in 2011.
London also experienced the same trend, but in higher levels: the crime count decreased from 134
per 1,000 population to 87 per 1,000 population in the same period. The downward trend was
common to both property and violent crimes.
The immigration data comes from the 2001 and 2011 Census and from the Annual
Population Surveys (APS) that are available on an annual basis since 2004. We need to consider
both of these to more formally probe further in statistical models the graphical analysis regarding
the suitability of the enclave instrument Pst as discussed in the previous Section of the paper. We
have constructed various immigration stocks from the Census and APS for 347 local authorities7
and this is the spatial units we study. Within that there are 33 London boroughs and we also
6 There are 348 local authorities in England and Wales.7 This excludes one very small local authority – the Isles of Scilly – for which sample sizes were just too small.
10
analyse them separately given the interesting ‘experiment’ offered by the very rapid immigration
changes seen in the 2000s in the capital city.
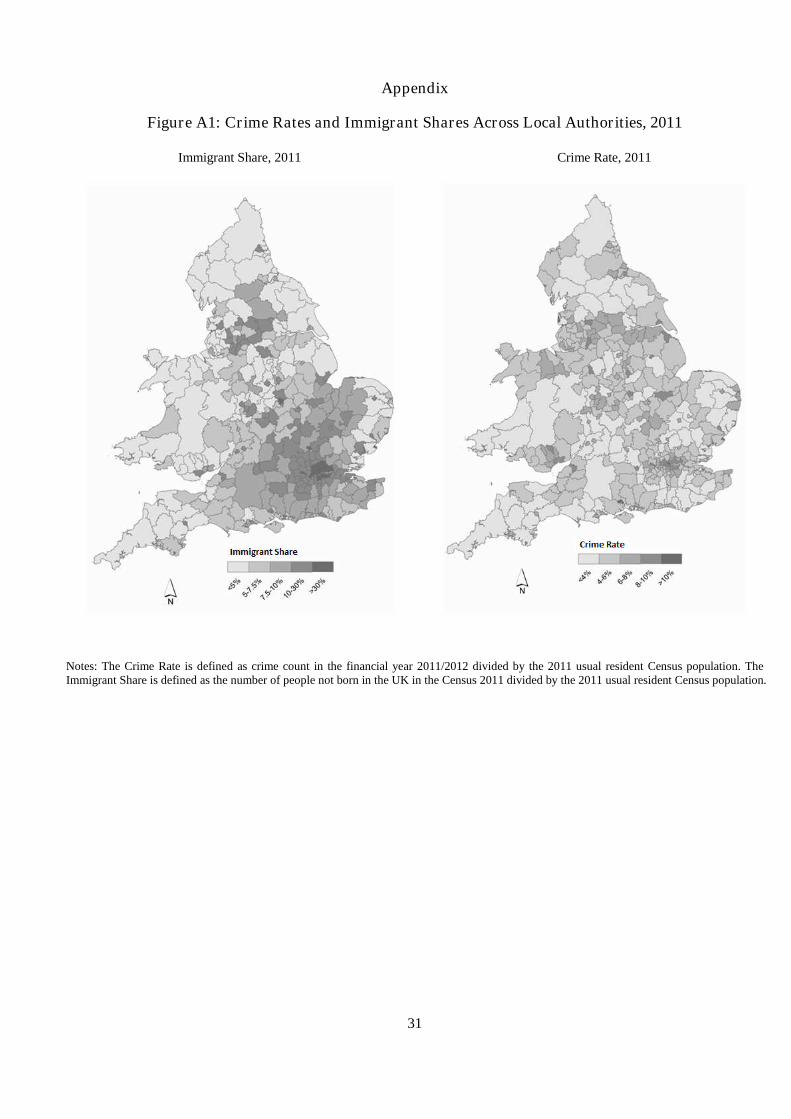
Figure A1 in the Appendix shows the spatial distribution of crime rates and
immigrant/population ratios across local authorities in 2011. It is evident in this cross-sectional
comparison that the darker areas (representing higher rates) do coincide to a degree across the two
charts, indicating a positive correlation between immigration and crime. But this only implies that
immigrants tend to settle in big cities like London, Manchester or Birmingham where crime rates
are high, but also where they can presumably find better working opportunities. However, and as
we have maintained throughout, it is important to look at changes across spatial units over time
(so as to net out unobserved fixed differences) and to be careful to adopt a research design that try
to ensure causality, which are the issues we next turn to in our statistical analysis.
Statistical Analysis – First Stage
The empirical models reported in Table 2 analyse the question of the suitability of the
enclave instrument more formally. To do so we estimate the following first stage equation:
∆൬Immigrants
Population൰
st
= δ1∆Pst+ δ2∆Xst+ Tt + υst
(3)
Estimates of (3) are given in Table 2, for various data configurations.8 The upper panel
shows results for the 347 local authorities across the whole of England and Wales, and the lower
panel for the 33 boroughs that are the 33 London local authorities. Of course, the results for
London should be interpreted with some degree of caution as the sample size is only 33 spatial
units. In all the estimations we adopt the standard practice of weighting the local authorities by
their mean population of the periods under study (the results still hold if the data were not
weighted, and if other periods' population weights were used).
8 The control variables we include in the differenced equations are: population growth, the change in theunemployment rate, the change in the share of males aged 15-39 and a dummy variable for the 33 London boroughs,the latter allowing for differential trends between London and the rest of the country. For more precise definitions,and sources, see the Data Appendix.

11
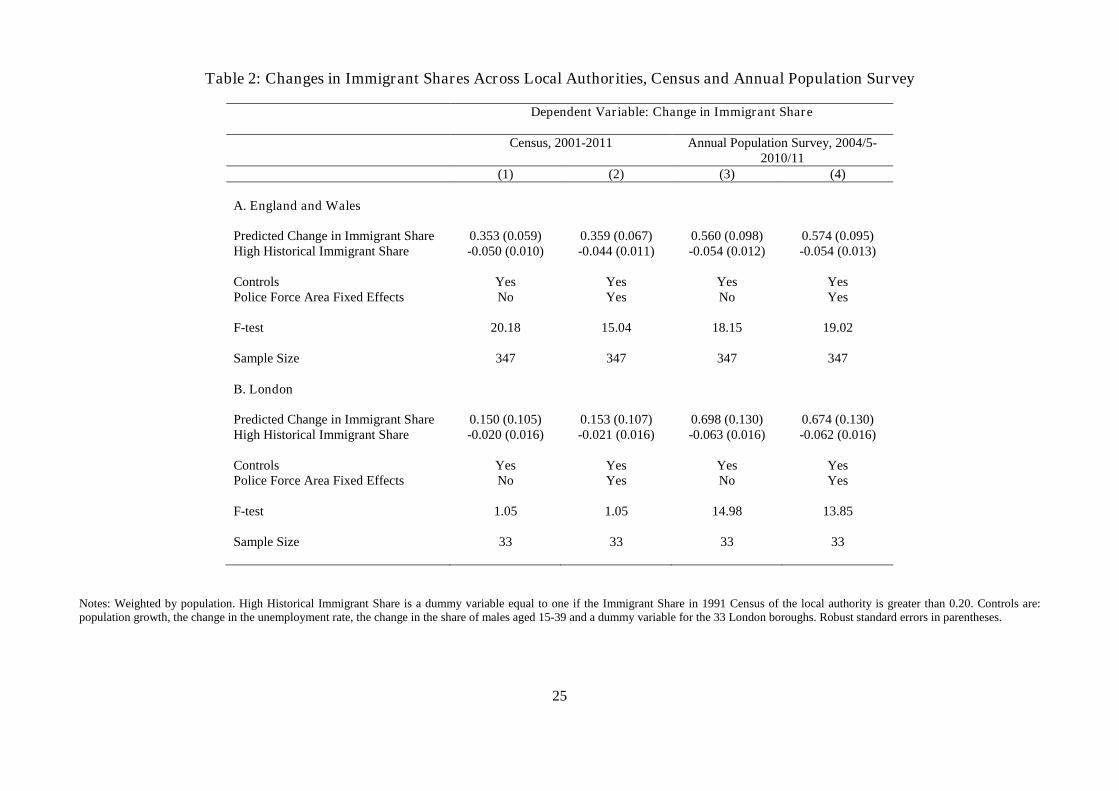
Four specifications are shown in the Table. Specifications (1) and (2) show first
differenced estimates based on Census data in 2001 and 2011, the difference between the two
being that police force area fixed effects are not included in the former but are included in the
latter (there are 43 police force areas of England and Wales and 2 police forces in London).
Specifications (3) and (4) define the start year as 2004, the year of A8 accession, and show first
differenced models from the 2004/5 and 2010/11 APS data without (3) and with (4) police force
area fixed effects.
Considering first the Census results in specifications (1) and (2), it is evident that the
enclave instrument predicts the actual change in immigration well for the whole country (as
shown in the upper panel) but not at all well for London (as shown in the lower panel). For the
latter the F-test for the instrument is very low as the estimated coefficient on ∆Pst is not
significantly different from zero. This highlights a first possible concern about the effects of
changing composition for use of the enclave instrument.
If, however, the year of accession is used as the start year, as in the APS model in columns
(3) and (4), things are a lot better. The magnitudes of the coefficients on the immigrant/population
ratios are larger than in the Census and the F-tests are strongly significant for both England and
Wales and London.9
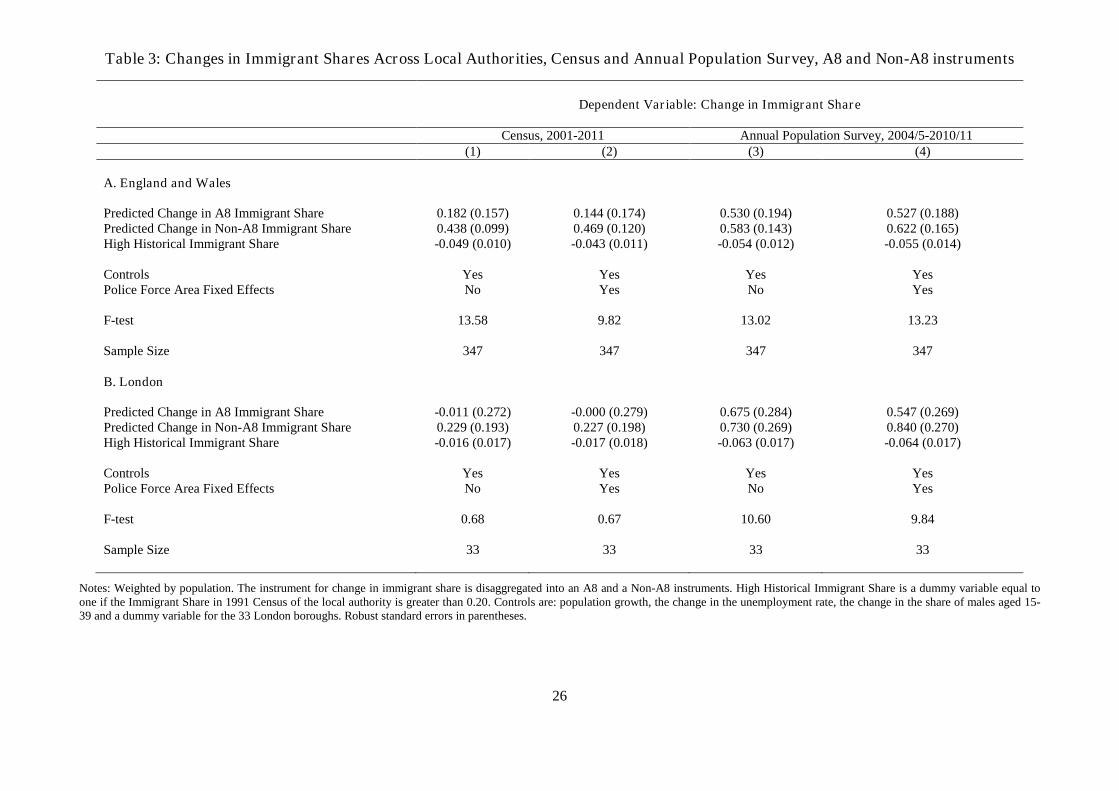
The results given in Table 3 probe the composition question further by breaking up the
instrument into A8 and Non-A8 immigrant/population ratios. This makes it very clear how the
changing composition is affecting the suitability or otherwise of the enclave instrument. For the
Census 2001 to 2011 differenced models for England and Wales, the Non-A8 immigrant variable
predicts strongly, but the A8 immigrant variable is not significant. For London, the A8 variable
has no explanatory power at all, and the Non-A8 variable is very weak. This casts strong doubt on
9 We also estimated specifications (3) and (4) using a nationality based immigration variable (instead of country ofbirth). This is available only for the APS and the instrument performs reasonably well, producing qualitativelysimilar though numerically a little smaller results, and the estimates are on the margins of significance in the Londonspecifications (see Table 2 of Jaitman and Machin, 2013, for these estimates).
12
using the enclave instrument in the 2000s using the 2001 Census settlement patterns to predict
actual immigration flows.
A far better prediction arises if 2004 is used as the initial year. This is shown in
specifications (3) and (4) of Table 3. For England and Wales as a whole and for London, both the
enclave based predicted A8 and Non-A8 immigrant/population ratios are strongly related to the
actual changes. Thus, we believe these specifications offer a sound first stage that we can use to
go on to study the impact of changes in immigration on changes in crime in the 2000s. We will
consider that next, before also showing some robustness checks that address some other possible
concerns about our means of identification.
Statistical Analysis – Second Stage
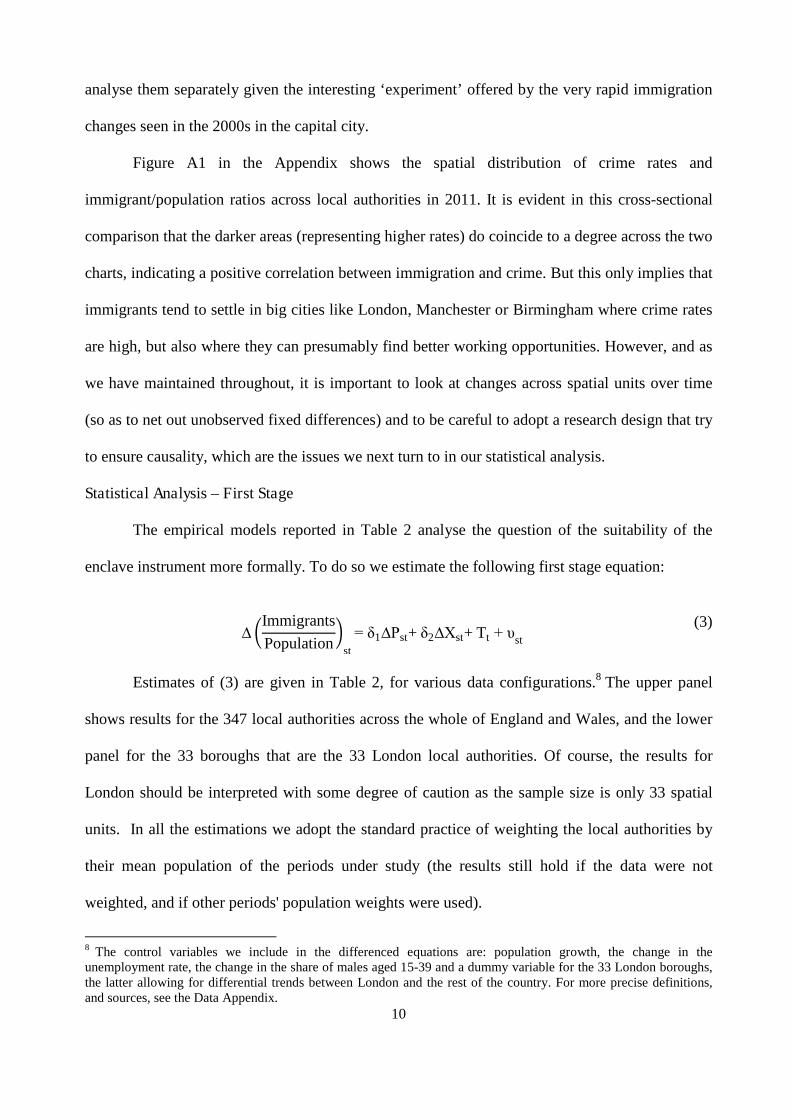
We now consider estimates of the change in crime model given in equation (1) above.
Before doing so, it is worth considering the scatterplot of spatial changes in crime rates and
changes in immigrant population shares which is given in Figure 4. For England and Wales, the
purely descriptive Figure actually shows a negative regression slope. It is noteworthy that the
places where the very big increases in immigrant shares have occurred do not seem to be
characterised by increased crime. For London, there is an upward slope, but it is not strong and is
nowhere near statistical significance. From these Figures, there seems to be no evidence of a
positive crime-immigration link. However, these raw correlations need to be subjected to the
more rigorous statistical analysis.
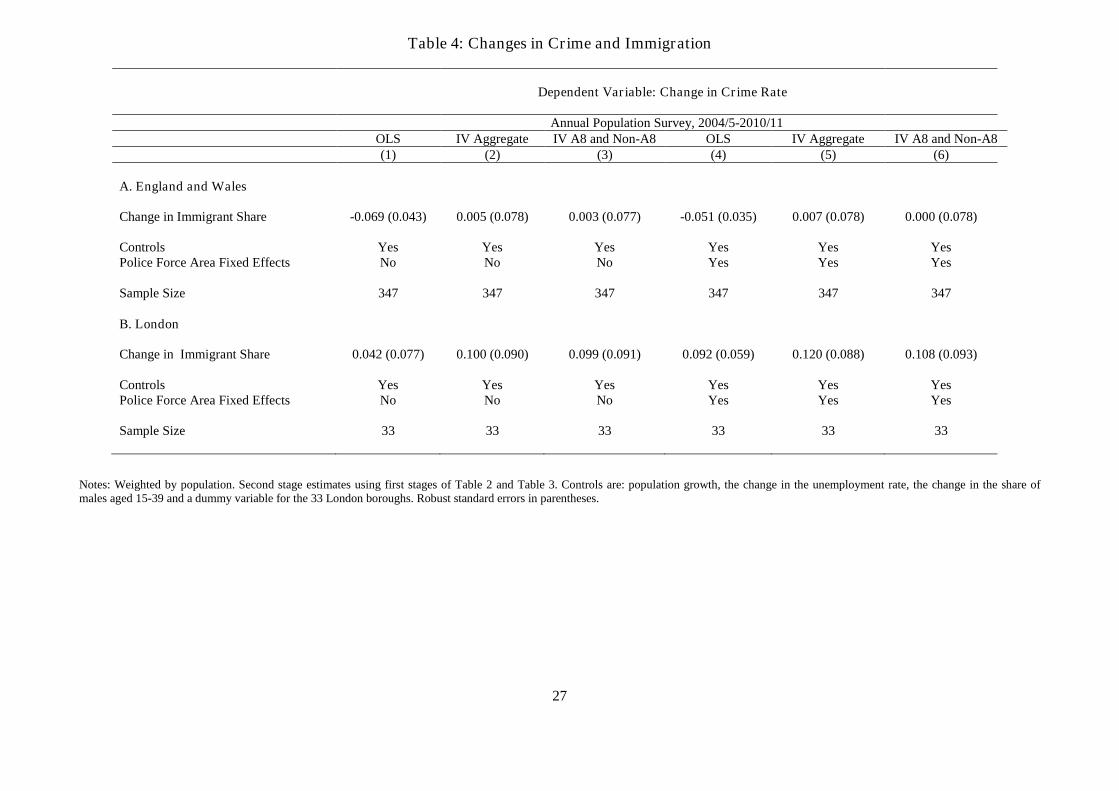
Table 4 therefore shows estimates of equation (1) across six specifications, again in the
upper panel for England and Wales and the lower panel for London. Specifications (1)-(3) and
(4)-(6) differ in that the former do not include the police force area fixed effects, whilst the latter
do. Specifications (1) and (4) are ordinary least squares estimates. For both England and Wales,
these show no significant correlation between changes in crime and changes in immigration.
13
The other four specifications are instrumental variable estimates, where (2) and (5) use the
relevant first stages from Table 2 (what we call the aggregate instrument) and (3) and (6) use the
relevant first stages from Table 3 (the separate A8 and Non-A8 instruments). In all four cases,
there is no significant empirical connection between changes in the crime rate and changes in the
immigrant/population ratio. This is the case for England and Wales, and for London. In the latter
the estimated coefficients are a little larger in magnitude, but never approach statistical
significance. Table A2 of the Appendix also confirms this to be the case when we consider
violent and property crimes separately.
Thus, it seems we can find no evidence of a connection between crime and immigration
from our descriptive analysis and from our causal research design. It seems that, despite the very
rapid changes in immigration that occurred in England and Wales in the 2000s, they were not
connected to increases in crime.
Robustness Checks
We have subjected our core findings of Table 4 to a number of robustness checks. These
are reported in Table 5. There are three main checks we undertook:
i) Specifications (1) and (2) show that the results are robust to considering specifications
defined in changes in logs rather than changes in levels;
ii) Adding a (suitably instrumented) lagged dependent variable 10 , whilst showing
evidence of spatial crime persistence, actually results in the coefficient on the change
in the immigrant/population ratio turning negative (though remaining insignificantly
different from zero);
10 We are severely constrained in this exercise by the crime recording changes that came into place first in the 2002recording year with the adoption of the National Crime Recording Standard by the 43 police forces in England andWales. This means that there are no available comparable crime records before then (see Jaitman and Machin (2013)for more details on the recording changes). So the lagged dependent variable is the change in crime between 2002and 2004. In a first differenced specification the coefficient on the lag is biased and so we need to instrument it whichwe do using the 2002 crime rate. This is strongly correlated – the F-test of this first stage regression was 13.7 forEngland and Wales and 132.68 for London. Regarding the first stage for the change in the immigrant share, we findno evidence that the settlement patterns of immigrants are correlated with the 2002 area crime rates – the relevantcoefficient estimates (standard errors) were 0.036 (0.064) for England and Wales and -0.155 (0.155) for London.
14
iii) Because of the 2002 crime recording changes we also looked at the crime type that
was least affected by these changes, namely burglary, to also implement a dynamic
crime model.11 Again, there is evidence of spatial crime persistence, but the core
finding of no connection between changes in crime and changes in immigration
remains intact.
Separate A8 and Non-A8 Effects
In the previous section, we have only distinguished between the A8 group of migrants and
other migrants in the first stage regressions. However, it is possible that they are differentially
correlated with changes in crime. Thus, in Table 6 we estimate separate regressions using A8 and
Non-A8 immigrant/population ratios as explanatory variables. Again we are unable to detect any
evidence of a causal crime-immigration relationship, for either the A8 or Non-A8 groups.
5. Arrests by Immigrant Status
So far, we have analysed recorded crime data where the crime counts we have are not available
broken down by immigrant status. To shed more light on the criminal behaviour of foreigners vis-
à-vis natives, we have been able to obtain data on arrests by nationality from the Metropolitan
Police Service (MPS), the police force that oversees policing in 32 boroughs of London.12 We can
thus present a brief empirical case study of London where we can study arrest rates of immigrants
and natives.
We have monthly data covering the time period June 2009 to June 2012. For the 32
London boroughs we have counts of arrests broken down by nationality and age. We use APS
data to construct arrest rates for UK nationals and Non-UK nationals by borough and age range (0
to 9, 10 to 15, 16 to 24, 25 to 34, 35 to 49, 50 to 64, 65 to 74 and over 75 years old).13
11 See Simmons, Legg and Hosking (2003) for evidence that burglary was less affected by the crime recordingchanges as compared to other crimes (notably violent crimes).12 There is a separate police force for the 33rd borough, the City of London.13 The reason for using APS rather than Census data is that the way nationality is defined by the police is much closerto the APS definition. See Data Appendix for more information.
15
The overall monthly arrest rate for immigrants is significantly higher at 3.8 arrests per
1000 population than that for the 2.8 arrests per 1000 population for UK nationals. However, this
includes arrests for immigration related offences, so it seems natural to exclude these.
Nonetheless, the arrest rate is still significantly higher by 0.7 arrests per 1000 (from 2.8 arrests
per 1000 population for UK nationals to 3.5 arrests per 1000 population for Non-UK nationals).
The crimes for which people were arrested are similar in their profile for both groups, with assault
and theft arrests ranking first and second for Non-UK and UK nationals.
It might be tempting to conclude from this that arrest rates are higher among Non-UK
nationals. However, there is another important feature to consider, in that the demographic
structures of the two groups are different, particularly with respect to age. As crime is committed
more by younger people this need to be taken into account. The age distribution of the population
is very different for UK and Non-UK nationals, as most of the Non-UK nationals are in their mid
20s to mid 30s, the age in which arrests are higher.
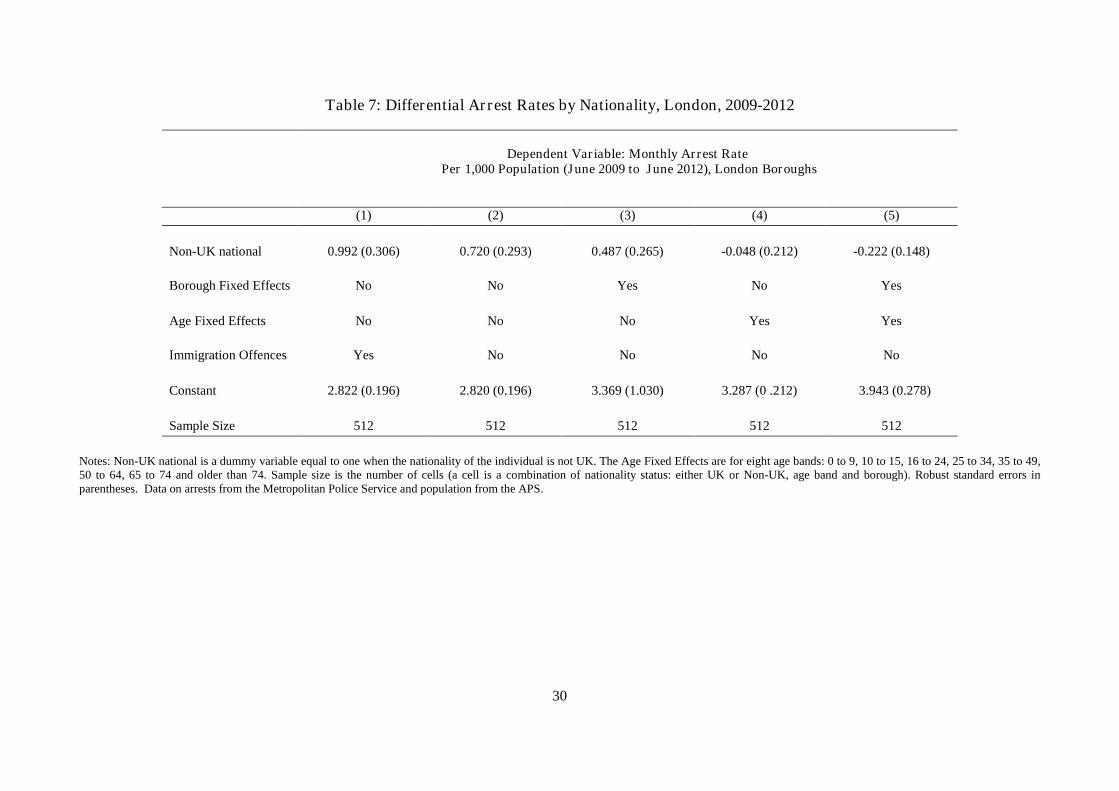
In Table 7 we therefore pool the eight age groups by the two nationality groups across the
32 London boroughs and estimate an arrest rate equation, first only including a nationality status
dummy, then borough fixed effects and then age range fixed effects. The first two specifications
just reproduce the significant positive associations described before. Inclusion of the borough
fixed effects reduces the gaps, but it remains positive and significant (at the 10 percent level).
However, the age controls matter and completely wipe out the positive effects as seen in
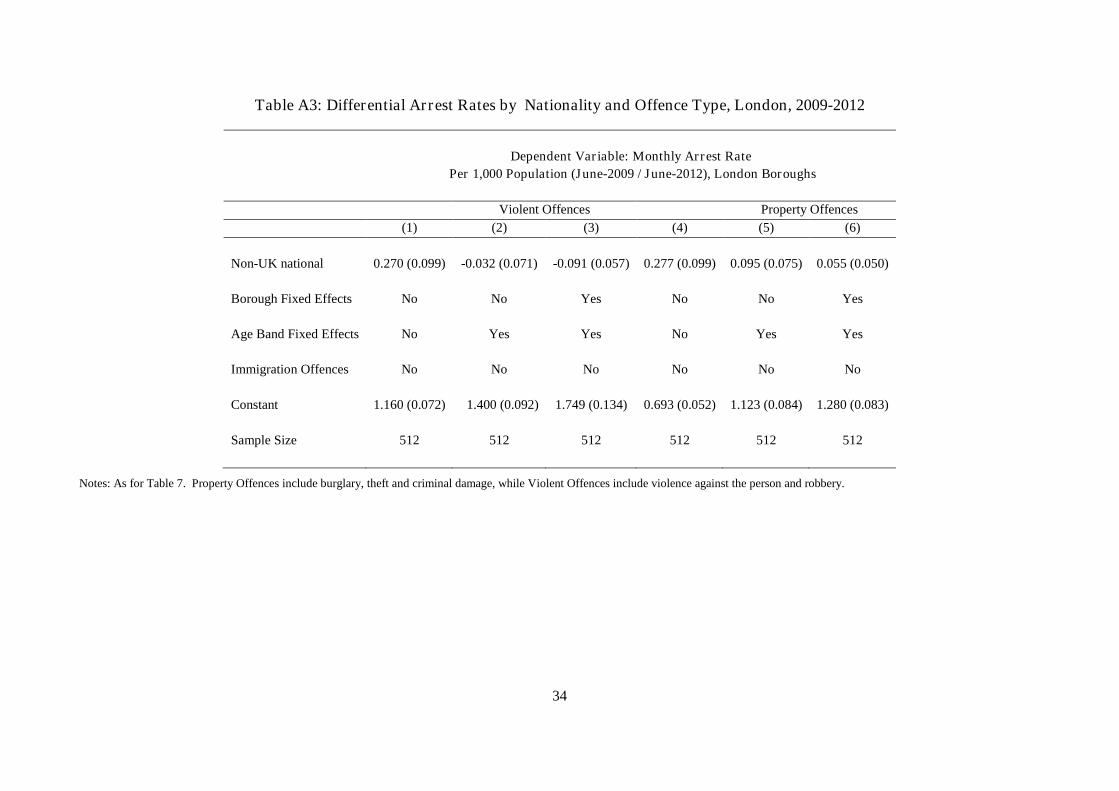
specifications (4) and (5). Table A3 of the Appendix shows the differential arrest rates for violent
and property offences. The findings are the same as for total offences: a significant higher arrest
rate for Non-UK nationals disappears once we control for age.
Thus, it is not that foreign nationals are arrested more, but the fact that they are
concentrated in young ages and crime is higher amongst younger people. This is in line with the
notion that immigrants' criminal behaviour is actually comparable to that of natives. The arrests

16
case study of London thus corroborates the overall findings from our spatial econometric analysis
and confirms we are unable to detect evidence of a positive crime-immigration link.
6. Conclusions
In this paper we offer some new evidence on whether one can detect an empirical connection
between crime and immigration. To do so, we consider the very significant changes in
immigration that occurred in England and Wales over the 2000s, where the share of immigrants in
the total population rose by over 60 percent between the 2001 and 2011 Census years. With this
change came a significant change in the composition of immigrants as the opening up to the A8
countries in 2004 resulted in a big immigration increase to England and Wales from countries
where the prior number of immigrant settlements was relatively low.
In our modelling approach, we are careful to ensure that we are able to implement the
enclave instrument traditionally used in the immigration research area in an effective way. For
that purpose we have to define a start year after the opening up to A8 migration. When we do so,
we find that the enclave instrument predicts well as the new migrants formed enclaves rapidly.
Adopting this empirical approach to implement a causal research design, and contrary to the
‘immigration causes crime’ populist view expressed in some media and political debate, we find
no evidence of an average causal impact of immigration on criminal behaviour. This is also the
case when we study A8 and Non-A8 immigration separately. We also study London by itself as
the immigration changes there were very dramatic. Again, we find no causal positive impact of
immigration on crime from our spatial econometric analysis and also present evidence from
unique data on arrests of natives and immigrants which as well shows no immigrant differences in
the likelihood of being arrested.
17
References
Altonji, J. and D. Card (1991) The Effects of Immigration on the Labor Market Outcomes ofLess-Skilled Natives, in J. Abowd and R. Freeman (eds.), Immigration, Trade and theLabor Market, Chicago: University of Chicago Press, 201–234.
Barrett, A. and Y. McCarthy (2008) Immigrants and Welfare Programmes: Exploring theInteractions Between Immigrant Characteristics, Immigrant Welfare Dependence andWelfare Policy, Oxford Review of Economic Policy, 24, 542-59.
Bell, B., F. Fasani and S. Machin (2013) Crime and Immigration: Evidence from LargeImmigrant Waves, Review of Economics and Statistics, 95(4), 1278-1290
Bell, B. and S. Machin (2013) Immigration and Crime, in A. Constant and K. Zimmerman (eds.)International Handbook on the Economics of Migration, Edward Elgar Publishing.Cheltenham, UK.
Bianchi, M., P. Buonanno and P. Pinotti. (2012) Do Immigrants Cause Crime?, Journal of theEuropean Economic Association, 10, 1318–1347.
Borjas, G. (1999) The Economic Analysis of Immigration, Chapter 28 in O. Ashenfelter and D.Card (eds), Handbook of Labor Economics, Vol. 3, Amsterdam: North Holland, 1697–1760.
Borjas, G. and L. Hilton (1996) Immigration and the Welfare State: Immigrant Participation inMeans-Tested Entitlement Programs, Quarterly Journal of Economics, 111, 575–604.
Card, D. (2001) Immigrant Inflows, Native Outflows, and the Local Market Impacts of HigherImmigration, Journal of Labor Economics, 19, 22-64.
Card, D. (2005) Is The New Immigration Really So Bad?, Economic Journal, 115, F300-F323.
Card, D. (2009) Immigration and Inequality, American Economic Review, 99, 1-21.
Dustmann, C., T. Frattini and I. Preston (2013) The Effect of Immigration along the Distributionof Wages, Review of Economic Studies, 80, 145-173.
Jaitman, L. and S. Machin (2013) Crime and Immigration: New Evidence From England andWales, Discussion Paper 1238, Centre for Economic Performance, London School ofEconomics.
Office for National Statistics (ONS), Annual Population Survey (2004-2012). Colchester, Essex:UK Data Archive, SN5257, SN5503, SN5737, SN6040, SN6311, SN6588, SN6897,SN7173.
Office for National Statistics (ONS), 2001 and 2011 Census: Aggregate data (England andWales). UK Data Service Census Support. Downloaded from: http://infuse.mimas.ac.uk
Office of Population Censuses and Surveys, 1991 Census: Aggregate data (England and Wales).UK Data Service Census Support. Downloaded from: http://casweb.mimas.ac.uk

18
Sa, F. (2011) Immigration and House Prices in the UK, IZA Discussion Paper 5893.
Saiz, A. (2007) Immigration and Housing Rents in American Cities, Journal of UrbanEconomics, 61, 345-71.
Simmons, J., C. Legg, and R. Hosking (2003) National Crime Recording Standard (NCRS): anAnalysis of the Impact on Recorded Crime. Companion Volume to Crime in England andWales 2002/2003. Home Office Online reports 31/03 and 32/03. London: Home Office.
Spenkuch, J. (2011) Understanding the Impact of Immigration on Crime, MPRA Paper No.31171, Munich: University Library of Munich.
Wadsworth, J. (2013) Mustn’t Grumble. Immigration, Health and Health Service Use in the UKand Germany, Fiscal Studies, 34, 55-82.

19
Figure 1: Immigrant Shares, Census 1991, 2001 and 2011
Notes: Source: Office for National Statistics (ONS). Immigrant share calculated as the usual resident population not born in UK over the total resident population from Census 1991, 2001 and 2011.
7.2
8.9
13.4
05
10
15
Perc
ent
1991 2001 2011
England and Wales
21.7
27.1
36.7
010
20
30
40
Perc
ent
1991 2001 2011
London
20
Figure 2: Immigrant Inflows to England and Wales by country groups, 2001-2011
Notes: Source: Long Term Migration Statistics, Office for National Statistics (ONS). The A8 countries who gained accession in May 2004 are: Czech Republic, Estonia, Hungary, Latvia, Lithuania,Poland, Slovakia and Slovenia. EU 15 refers to the European Union members before the accession of the A8 European countries in 2004 (we exclude UK from EU15).
010
020
030
040
050
0M
igra
nts
,T
ho
usa
nd
s
2001 2002 2003 2004 2005 2006 2007 2008 2009 2010 2011
England and Wales
EU15 A8
All Other
21
Figure 3A: Enclave Patterns. Census, 2001-2011
-.0
20
.02
.04
.06
.08
Ch
an
ge
inIn
dia
n/P
aki
sta
niP
opu
latio
nR
atio
20
01
-20
11
0 1 2 3 4 5 6Relative Indian/Pakistani Share 2001
Slope (SE) = 0.005 (0.000)
England and Wales: India/Pakistan Enclaves 2001-2011
-.0
20
.02
.04
.06
.08
Ch
an
ge
inA
8P
op
ula
tion
Ratio
200
1-2
01
1
0 1 2 3 4 5 6Relative A8 Share 2001
Slope (SE) = -0.003 (0.001)
England and Wales: A8 Enclaves 2001-2011
0.0
2.0
4.0
6.0
8C
han
ge
inIn
dia
n/P
aki
sta
niP
opu
latio
nR
atio
20
01
-20
11
0 .5 1 1.5 2Relative Indian/Pakistani Share 2001
Slope (SE) = 0.026 (0.003)
London: India/Pakistan Enclaves 2001-2011
0.0
2.0
4.0
6.0
8C
han
ge
inA
8P
op
ula
tion
Ratio
200
1-2
01
10 .5 1 1.5 2
Relative A8 Share 2001
Slope (SE) = 0.005 (0.010)
London: A8 Enclaves 2001-2011

22
Figure 3B: Enclave Formation
Notes: The horizontal axis shows the relative immigrant share ratio: the share of immigrants from country c that lived in the spatial unit s in the year t0 divided by the share of total immigrants thatlived in spatial unit s in the year t0. The vertical axis shows the change in the ratio immigrantc/population of every spatial unit s in the period t0 to t1. The slope and standard error of each regression isobtained from an OLS regression with population weights. Spatial units with less than 65,000 usual residents were excluded. The differences 2001-2011 are calculated with the Census data and the2004-2011 with the APS, considering the relative shares as an average of the share in 2004/5 and 2005/6.
-.0
20
.02
.04
.06
.08
Ch
an
ge
inA
8P
op
ula
tion
Ratio
200
1-2
01
1
0 1 2 3 4 5 6Relative A8 Share 2001
Slope (SE) = -0.003 (0.001)
England and Wales: A8 Enclaves 2001-2011
-.0
20
.02
.04
.06
.08
Ch
an
ge
inA
8P
op
ula
tion
Ratio
200
4-2
01
1
0 1 2 3 4 5 6Relative A8 Share 2004/5
Slope (SE) = 0.003 (0.001)
England and Wales: A8 Enclaves 2004-2011
Merton
NewhamEaling
Haringey
-.0
2-.
01
0.0
1.0
2.0
3.0
4.0
5.0
6.0
7C
han
ge
inA
8P
op
ula
tion
Ratio
200
1-2
01
1
0 .5 1 1.5 2Relative A8 Share 2001
Slope (SE) = 0.005 (0.010)
London: A8 Enclaves 2001-2011
Newham
Haringey
Merton
Ealing
-.0
2-.
01
0.0
1.0
2.0
3.0
4.0
5.0
6.0
7C
ha
nge
inA
8P
op
ula
tion
Rat
io2
00
4-2
01
1
0 .5 1 1.5 2Relative A8 Share 2004/5
Slope (SE) = 0.010 (0.004)
London: A8 Enclaves 2004-2011

23
Figure 4: Changes in Crime and Immigration
Notes: Based on 347 local authorities for England and Wales and 32 London boroughs between 2004/5 and 2010/11. Slopes (standard errors in parentheses) from population weighted regressions.
-.2
-.1
5-.
1-.
05
0C
han
ge
inC
rim
eP
er
10
00
Po
pula
tio
n
0 .05 .1 .15 .2Change in Immigrant Population Ratio
Slope (SE) = -0.278 (0.038)
England and Wales
-.2
-.1
5-.
1-.
05
0C
han
ge
inC
rim
eP
er
10
00
Po
pula
tio
n
.05 .1 .15 .2Change in Immigrant Population Ratio
Slope (SE) = 0.183 (0.165)
London

24
Table 1: Immigrant Composition by Country of Birth, Census and Annual Population Survey
Census, 1991 Census, 2001 Annual Population Survey, 2005 Census, 2011
Rank Country % Share of
Immigrants
Rank Country % Share of
Immigrants
Rank Country % Share of
Immigrants
Rank Country % Share of
Immigrants
A. England and Wales
1. Ireland 15.7 1. Ireland 10.2 1. India 9.8 1. India 9.3
2. India 11.0 2. India 9.8 2. Ireland 7.2 2. Poland 7.7
3. Pakistan 6.2 3. Pakistan 6.6 3. Pakistan 5.6 3. Pakistan 6.4
4. Germany 5.6 4. Germany 5.3 4. Bangladesh 4.4 4. Ireland 5.4
5. Jamaica 3.9 5. Bangladesh 3.3 5. Germany 4.4 5. Germany 3.6
... ... ...
11. Poland 1.9 17. Poland 1.3 7. Poland 3.2
Immigrants: 3.6 Million Immigrants: 4.6 Million Immigrants: 5.4 Million Immigrants: 7.5 Million
B. London
1. Ireland 14.8 1. India 8.9 1. India 14.8 1. India 8.7
2. India 10.4 2. Ireland 8.1 2. Bangladesh 10.4 2. Poland 5.3
3. Jamaica 5.3 3. Bangladesh 4.4 3. Ireland 5.3 3. Ireland 4.3
4. Kenya 3.9 4. Jamaica 4.1 4. Jamaica 3.9 4. Nigeria 3.8
5. Bangladesh 3.9 5. Nigeria 3.6 5. Nigeria 3.9 5. Pakistan 3.8
... ...
17. Poland 1.5 18. Poland 1.1 6. Poland 3.5
Immigrants: 1.5 Million Immigrants: 1.9 Million Immigrants: 2.1 Million Immigrants:3.0 Million
Notes: Population by country of birth was obtained from the 1991, 2001, and 2011 Census and for 2005 we employed the APS for the financial year 2005/6. For the Census years we ranked the
countries according to the list of countries available in the detailed country of birth tables (ONS).
25
Table 2: Changes in Immigrant Shares Across Local Authorities, Census and Annual Population Survey
Dependent Variable: Change in Immigrant Share
Census, 2001-2011 Annual Population Survey, 2004/5-2010/11
(1) (2) (3) (4)
A. England and Wales
Predicted Change in Immigrant Share 0.353 (0.059) 0.359 (0.067) 0.560 (0.098) 0.574 (0.095)High Historical Immigrant Share -0.050 (0.010) -0.044 (0.011) -0.054 (0.012) -0.054 (0.013)
Controls Yes Yes Yes YesPolice Force Area Fixed Effects No Yes No Yes
F-test 20.18 15.04 18.15 19.02
Sample Size 347 347 347 347
B. London
Predicted Change in Immigrant Share 0.150 (0.105) 0.153 (0.107) 0.698 (0.130) 0.674 (0.130)High Historical Immigrant Share -0.020 (0.016) -0.021 (0.016) -0.063 (0.016) -0.062 (0.016)
Controls Yes Yes Yes YesPolice Force Area Fixed Effects No Yes No Yes
F-test 1.05 1.05 14.98 13.85
Sample Size 33 33 33 33
Notes: Weighted by population. High Historical Immigrant Share is a dummy variable equal to one if the Immigrant Share in 1991 Census of the local authority is greater than 0.20. Controls are:population growth, the change in the unemployment rate, the change in the share of males aged 15-39 and a dummy variable for the 33 London boroughs. Robust standard errors in parentheses.
26
Table 3: Changes in Immigrant Shares Across Local Authorities, Census and Annual Population Survey, A8 and Non-A8 instruments
Dependent Variable: Change in Immigrant Share
Census, 2001-2011 Annual Population Survey, 2004/5-2010/11(1) (2) (3) (4)
A. England and Wales
Predicted Change in A8 Immigrant Share 0.182 (0.157) 0.144 (0.174) 0.530 (0.194) 0.527 (0.188)Predicted Change in Non-A8 Immigrant Share 0.438 (0.099) 0.469 (0.120) 0.583 (0.143) 0.622 (0.165)High Historical Immigrant Share -0.049 (0.010) -0.043 (0.011) -0.054 (0.012) -0.055 (0.014)
Controls Yes Yes Yes YesPolice Force Area Fixed Effects No Yes No Yes
F-test 13.58 9.82 13.02 13.23
Sample Size 347 347 347 347
B. London
Predicted Change in A8 Immigrant Share -0.011 (0.272) -0.000 (0.279) 0.675 (0.284) 0.547 (0.269)Predicted Change in Non-A8 Immigrant Share 0.229 (0.193) 0.227 (0.198) 0.730 (0.269) 0.840 (0.270)High Historical Immigrant Share -0.016 (0.017) -0.017 (0.018) -0.063 (0.017) -0.064 (0.017)
Controls Yes Yes Yes YesPolice Force Area Fixed Effects No Yes No Yes
F-test 0.68 0.67 10.60 9.84
Sample Size 33 33 33 33
Notes: Weighted by population. The instrument for change in immigrant share is disaggregated into an A8 and a Non-A8 instruments. High Historical Immigrant Share is a dummy variable equal toone if the Immigrant Share in 1991 Census of the local authority is greater than 0.20. Controls are: population growth, the change in the unemployment rate, the change in the share of males aged 15-39 and a dummy variable for the 33 London boroughs. Robust standard errors in parentheses.
27
Table 4: Changes in Crime and Immigration
Dependent Variable: Change in Crime Rate
Annual Population Survey, 2004/5-2010/11OLS IV Aggregate IV A8 and Non-A8 OLS IV Aggregate IV A8 and Non-A8(1) (2) (3) (4) (5) (6)
A. England and Wales
Change in Immigrant Share -0.069 (0.043) 0.005 (0.078) 0.003 (0.077) -0.051 (0.035) 0.007 (0.078) 0.000 (0.078)
Controls Yes Yes Yes Yes Yes YesPolice Force Area Fixed Effects No No No Yes Yes Yes
Sample Size 347 347 347 347 347 347
B. London
Change in Immigrant Share 0.042 (0.077) 0.100 (0.090) 0.099 (0.091) 0.092 (0.059) 0.120 (0.088) 0.108 (0.093)
Controls Yes Yes Yes Yes Yes YesPolice Force Area Fixed Effects No No No Yes Yes Yes
Sample Size 33 33 33 33 33 33
Notes: Weighted by population. Second stage estimates using first stages of Table 2 and Table 3. Controls are: population growth, the change in the unemployment rate, the change in the share ofmales aged 15-39 and a dummy variable for the 33 London boroughs. Robust standard errors in parentheses.

28
Table 5: Robustness Checks
Annual Population Survey, 2004/5-2010/11Change in Log Crime Rate Change in Crime Rate,
Crime DynamicsChange in Burglary Rate,
Burglary DynamicsFirst Stage Second Stage First Stage Second Stage First Stage Second Stage
(1) (2) (3) (4) (5) (6)A. England and Wales
Predicted Change in Immigrant Share 0.586 (0.162) 0.555 (0.099) 0.558 (0.097)High Historical Immigrant Share -0.158 (0.045) -0.055 (0.0145) -0.055 (0.014)Change in Immigrant Share 0.008 (0.060) -0.118 (0.101) 0.011 (0.017)Change in Crime/Burglary Rate, 2002-2004 0.475 (0.124) 0.292 (0.042)
Controls Yes Yes Yes Yes Yes YesPolice Force Area Fixed Effects Yes Yes Yes Yes Yes Yes
F-test 14.56 18.65 18.54
Sample Size 347 347 347 347 347 347
B. London
Predicted Change in Immigrant Share 0.761 (0.460) 0.726 (0.162) 0.671 (0.136)High Historical Immigrant Share -0.159 (0.050) -0.055 (0.017) -0.048 (0.020)Change in Immigrant Share 0.019 (0.183) -0.080 (0.056) 0.010 (0.017)Change in Crime/Burglary Rate, 2002-2004 0.182 (0.021) 0.266 (0.074)
Controls Yes Yes Yes Yes Yes YesPolice Force Area Fixed Effects Yes Yes Yes Yes Yes Yes
F-test 10.04 13.70 10.21
Sample Size 33 33 33 33 33 33
Notes: Weighted by population. High Historical Immigrant Share is a dummy variable equal to one if the Immigrant Share in 1991 Census of the local authority is greater than 0.20. Controls are:population growth, the change in the unemployment rate, the change in the share of males aged 15-39 and a dummy variable for the 33 London boroughs. Robust standard errors in parentheses. Incolumns 3 and 5 there are two instrumented endogenous variables and the Angrist-Pischke multivariate F-test of excluded instruments is reported. Burglary and Crime rates are burglary and crimecounts divided by total population from the APS.

29
Table 6: IV Estimates for A8 and Non-A8 Immigrant, Separate RegressionsDependent Variable: Change in Crime Rate
Annual Population Survey, 2004/5-2010/11A8 Immigrant Share Non-A8 Immigrant Share
First Stage Second Stage First Stage Second Stage(1) (2) (3) (4)
A. England and Wales
Predicted Change in A8 Immigrant Share 0.289 (0.075)Predicted Change in Non-A8 Immigrant Share 0.627 (0.151)High Historical Immigrant Share -0.046 (0.014)Change in A8 Immigrant Share -0.429 (0.275)Change in Non-A8 Immigrant Share 0.045 (0.096)
F-test 14.91 9.35
Controls Yes Yes Yes YesPolice Force Area Fixed Effects Yes Yes Yes Yes
Sample Size 347 347 347 347
B. London
Predicted Change in A8 Immigrant Share 0.213 (0.091)Predicted Change in Non-A8 Immigrant Share 0.921 (0.262)High Historical Immigrant Share -0.054 (0.019)Change in A8 Immigrant Share 0.130 (0.469)Change in Non-A8 Immigrant Share 0.117 (0.130)
F-test 5.37 6.24
Controls Yes Yes Yes YesPolice Force Area Fixed Effects Yes Yes Yes Yes
Sample Size 33 33 33 33
Notes: Separate population weighted regressions for A8 and Non-A8 immigrants. High Historical Immigrant Share is a dummy variable equal to one if the Immigrant Share in 1991 Census of the localauthority is greater than 0.20. For A8 regressions this dummy is not included as there was no local authorities with high historical A8 immigrant shares. Controls are: population growth, the change inthe unemployment rate, the change in the share of males aged 15-39 and a dummy variable for the 33 London boroughs. Robust standard errors in parentheses.
30
Table 7: Differential Arrest Rates by Nationality, London, 2009-2012
Dependent Variable: Monthly Arrest RatePer 1,000 Population (June 2009 to June 2012), London Boroughs
(1) (2) (3) (4) (5)
Non-UK national 0.992 (0.306) 0.720 (0.293) 0.487 (0.265) -0.048 (0.212) -0.222 (0.148)
Borough Fixed Effects No No Yes No Yes
Age Fixed Effects No No No Yes Yes
Immigration Offences Yes No No No No
Constant 2.822 (0.196) 2.820 (0.196) 3.369 (1.030) 3.287 (0 .212) 3.943 (0.278)
Sample Size 512 512 512 512 512
Notes: Non-UK national is a dummy variable equal to one when the nationality of the individual is not UK. The Age Fixed Effects are for eight age bands: 0 to 9, 10 to 15, 16 to 24, 25 to 34, 35 to 49,50 to 64, 65 to 74 and older than 74. Sample size is the number of cells (a cell is a combination of nationality status: either UK or Non-UK, age band and borough). Robust standard errors inparentheses. Data on arrests from the Metropolitan Police Service and population from the APS.
31
Appendix
Figure A1: Crime Rates and Immigrant Shares Across Local Authorities, 2011
Immigrant Share, 2011 Crime Rate, 2011
Notes: The Crime Rate is defined as crime count in the financial year 2011/2012 divided by the 2011 usual resident Census population. TheImmigrant Share is defined as the number of people not born in the UK in the Census 2011 divided by the 2011 usual resident Census population.
32
Table A1: Summary Statistics from Census 2001 and 2011, and APS 2004/5
Census, 2001 APS, 2004/5 Census, 2011
A. England and Wales
Immigrant Share 0.089 0.096 0.134
Of which:
Ireland 0.106 0.085 0.053
EU 15 0.126 0.126 0.107
A8 0.020 0.033 0.116
Rest Europe 0.041 0.068 0.054
Asia 0.390 0.380 0.383
Africa 0.170 0.207 0.178
America 0.118 0.075 0.089
Oceania 0.029 0.027 0.020
Unemployment Rate 0.052 0.047 0.062
Young Males Rate 0.170 0.171 0.167
Population 215540 218004 234643
Total Crime Rate 0.103 0.097 0.065
B. London
Immigrant Share 0.271 0.300 0.367
Of which:
Ireland 0.082 0.061 0.043
EU 15 0.107 0.117 0.108
A8 0.020 0.042 0.102
Rest Europe 0.050 0.094 0.076
Asia 0.335 0.317 0.327
Africa 0.242 0.245 0.210
America 0.129 0.087 0.108
Oceania 0.035 0.036 0.027
Unemployment Rate 0.065 0.071 0.073
Young Males Rate 0.199 0.215 0.208
Population 233383 238585 266601
Total Crime Rate 0.134 0.123 0.087
Notes: Local Authority means weighted by population. Crime counts from Data.gov.uk with data provided by the 43 police force areas inEngland and Wales. Data from 2001 and 2011 Census is from the ONS. For the APS data we used the special licence dataset. Young Males Rateis males aged 15-39 over population and the unemployment rate is defined as those unemployed over the economically active population aged16-64. The crime rates in the 2001 column use the crime counts of 2002, first year of the actual crime recording system.

33
Table A2: Changes in Crime and Immigration by Crime Types
Dependent Variable: Change in Crime RateAnnual Population Survey, 2004/5-2010/11
Total Crime Violent Crime Property CrimeIV IV IV(1) (2) (3)
A. England and Wales
Change in Immigrant Share 0.007 (0.078) -0.010 (0.021) 0.017 (0.062)
Controls Yes Yes YesPolice Force Area Fixed Effects Yes Yes Yes
Sample Size 347 347 347
B. London
Change in Immigrant Share 0.120 (0.088) 0.011 (0.019) 0.109 (0.077)
Controls Yes Yes YesPolice Force Area Fixed Effects Yes Yes Yes
Sample Size 33 33 33
Notes: As for Table 4. Total crime is the sum of Property and Violent Crime. Property Crimes include burglary, theft and criminal damage, while Violent Crimes include violence against the personand robbery. Crime rates are obtained dividing the crime counts by total population from the APS.
34
Table A3: Differential Arrest Rates by Nationality and Offence Type, London, 2009-2012
Dependent Variable: Monthly Arrest Rate
Per 1,000 Population (June-2009 / June-2012), London Boroughs
Violent Offences Property Offences
(1) (2) (3) (4) (5) (6)
Non-UK national 0.270 (0.099) -0.032 (0.071) -0.091 (0.057) 0.277 (0.099) 0.095 (0.075) 0.055 (0.050)
Borough Fixed Effects No No Yes No No Yes
Age Band Fixed Effects No Yes Yes No Yes Yes
Immigration Offences No No No No No No
Constant 1.160 (0.072) 1.400 (0.092) 1.749 (0.134) 0.693 (0.052) 1.123 (0.084) 1.280 (0.083)
Sample Size 512 512 512 512 512 512
Notes: As for Table 7. Property Offences include burglary, theft and criminal damage, while Violent Offences include violence against the person and robbery.
35
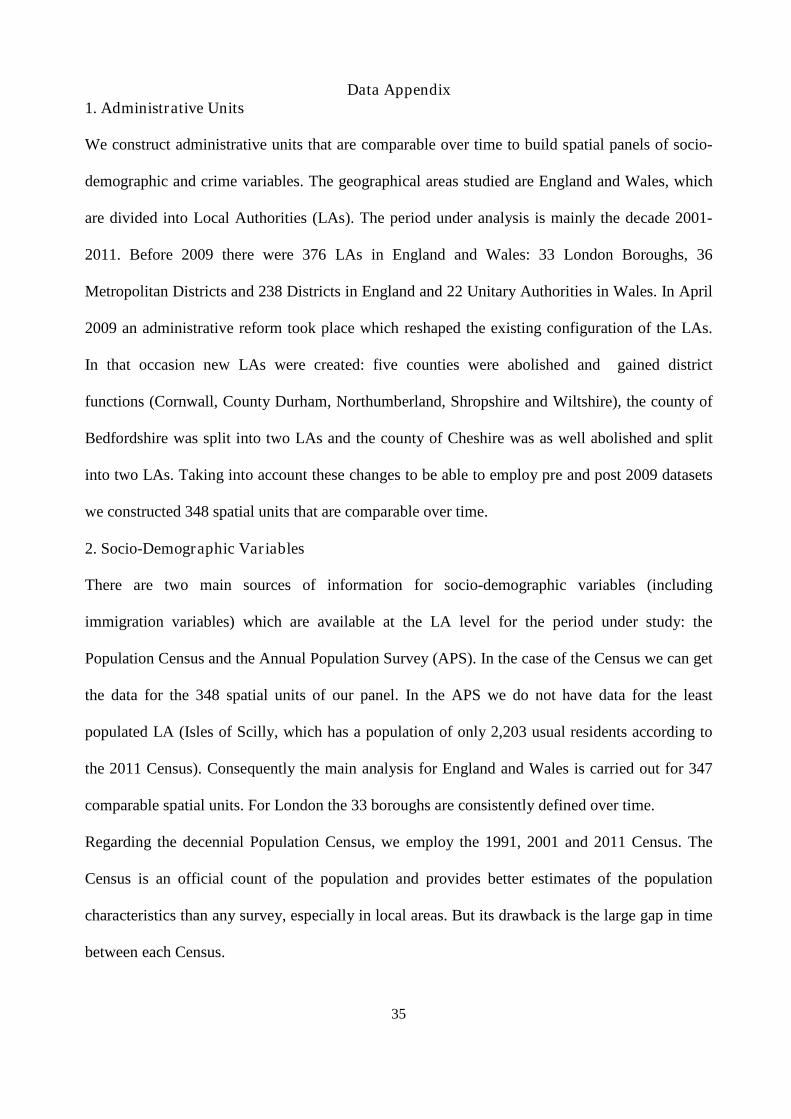
Data Appendix1. Administrative Units
We construct administrative units that are comparable over time to build spatial panels of socio-
demographic and crime variables. The geographical areas studied are England and Wales, which
are divided into Local Authorities (LAs). The period under analysis is mainly the decade 2001-
2011. Before 2009 there were 376 LAs in England and Wales: 33 London Boroughs, 36
Metropolitan Districts and 238 Districts in England and 22 Unitary Authorities in Wales. In April
2009 an administrative reform took place which reshaped the existing configuration of the LAs.
In that occasion new LAs were created: five counties were abolished and gained district
functions (Cornwall, County Durham, Northumberland, Shropshire and Wiltshire), the county of
Bedfordshire was split into two LAs and the county of Cheshire was as well abolished and split
into two LAs. Taking into account these changes to be able to employ pre and post 2009 datasets
we constructed 348 spatial units that are comparable over time.
2. Socio-Demographic Variables
There are two main sources of information for socio-demographic variables (including
immigration variables) which are available at the LA level for the period under study: the
Population Census and the Annual Population Survey (APS). In the case of the Census we can get
the data for the 348 spatial units of our panel. In the APS we do not have data for the least
populated LA (Isles of Scilly, which has a population of only 2,203 usual residents according to
the 2011 Census). Consequently the main analysis for England and Wales is carried out for 347
comparable spatial units. For London the 33 boroughs are consistently defined over time.
Regarding the decennial Population Census, we employ the 1991, 2001 and 2011 Census. The
Census is an official count of the population and provides better estimates of the population
characteristics than any survey, especially in local areas. But its drawback is the large gap in time
between each Census.

36
In particular for this study, having inter-Census data proved to be crucial for the identification
strategy exploited. Therefore we also employ the Annual Population Survey (APS) conducted
quarterly by the Office for National Statistics. We analysed the APS waves starting in the fiscal
year April-2004 to March-2005 (which we name 2004/5 in the paper) until April-2010 to March-
2011. The last Population Census was held in March 2011, so our two main sources of socio-
demographic information reach about the same date. The APS is only available at LA level since
2004. The coding of local area (until the LA) is contained in the special licence dataset, for which
we were granted access for this project. The average sample of the APS is 306,692 in 2004/5-
2010/11 for England and Wales and 28,777 for London.
2.1. Population
The base population is the 'usually resident population' which refers to people who live in the UK
for 12 months or more, including those who have been resident for less than 12 months but intend
to stay for a total period of 12 months or more. For example, in the 2011 Census, the usually
resident population of England and Wales is defined as anyone who, on the night of 27 March
2011, was either (a) resident in England and Wales and who had been resident, or intended to be
resident in the UK for a period of 12 months or more, or (b) resident outside the UK but had a
permanent England and Wales address and intended to be outside the UK for less than a year.
In the APS it is also considered as usual resident someone who was living the last year in the
country. The difference is that the APS is a household survey, and as such it does not cover most
people living in communal establishments, some NHS accommodation, or students living in halls
of residence who have non-UK resident parents. Usually the APS underestimates the population
in comparison to the Census. We always compare APS waves or Census years, thus keeping
consistency across sources of data. The usual resident population is the denominator for all the
shares we study.
37
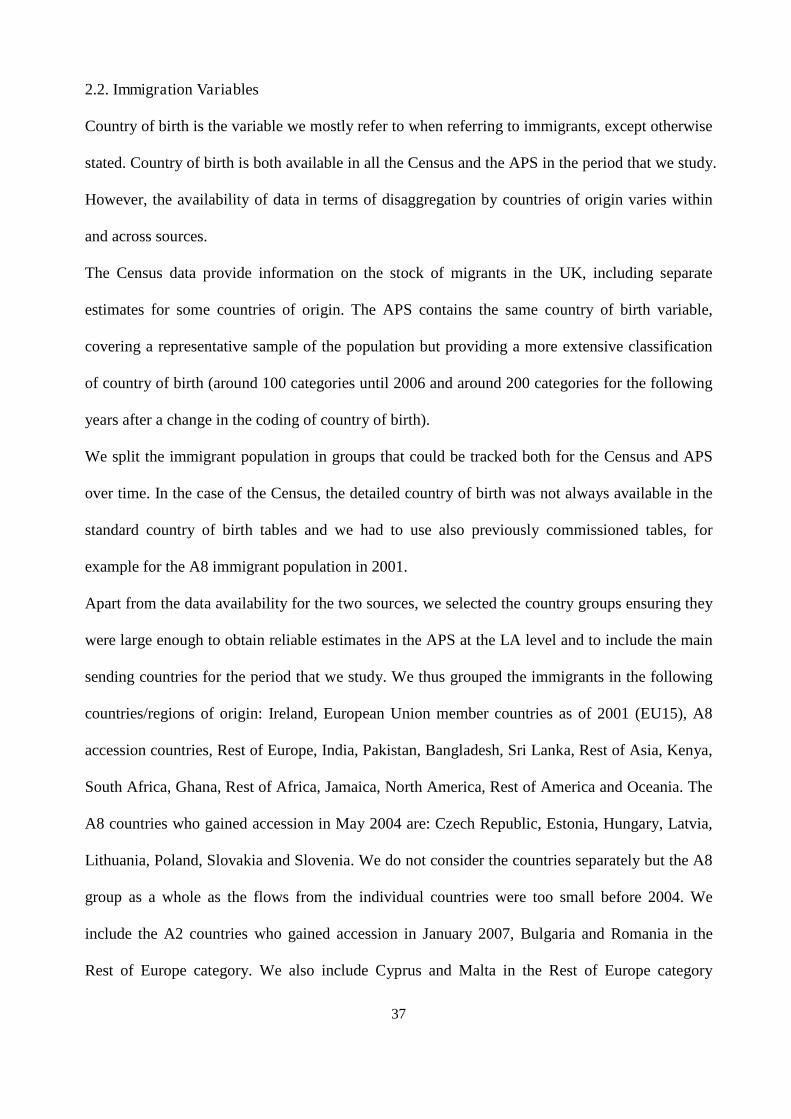
2.2. Immigration Variables
Country of birth is the variable we mostly refer to when referring to immigrants, except otherwise
stated. Country of birth is both available in all the Census and the APS in the period that we study.
However, the availability of data in terms of disaggregation by countries of origin varies within
and across sources.
The Census data provide information on the stock of migrants in the UK, including separate
estimates for some countries of origin. The APS contains the same country of birth variable,
covering a representative sample of the population but providing a more extensive classification
of country of birth (around 100 categories until 2006 and around 200 categories for the following
years after a change in the coding of country of birth).
We split the immigrant population in groups that could be tracked both for the Census and APS
over time. In the case of the Census, the detailed country of birth was not always available in the
standard country of birth tables and we had to use also previously commissioned tables, for
example for the A8 immigrant population in 2001.
Apart from the data availability for the two sources, we selected the country groups ensuring they
were large enough to obtain reliable estimates in the APS at the LA level and to include the main
sending countries for the period that we study. We thus grouped the immigrants in the following
countries/regions of origin: Ireland, European Union member countries as of 2001 (EU15), A8
accession countries, Rest of Europe, India, Pakistan, Bangladesh, Sri Lanka, Rest of Asia, Kenya,
South Africa, Ghana, Rest of Africa, Jamaica, North America, Rest of America and Oceania. The
A8 countries who gained accession in May 2004 are: Czech Republic, Estonia, Hungary, Latvia,
Lithuania, Poland, Slovakia and Slovenia. We do not consider the countries separately but the A8
group as a whole as the flows from the individual countries were too small before 2004. We
include the A2 countries who gained accession in January 2007, Bulgaria and Romania in the
Rest of Europe category. We also include Cyprus and Malta in the Rest of Europe category
38
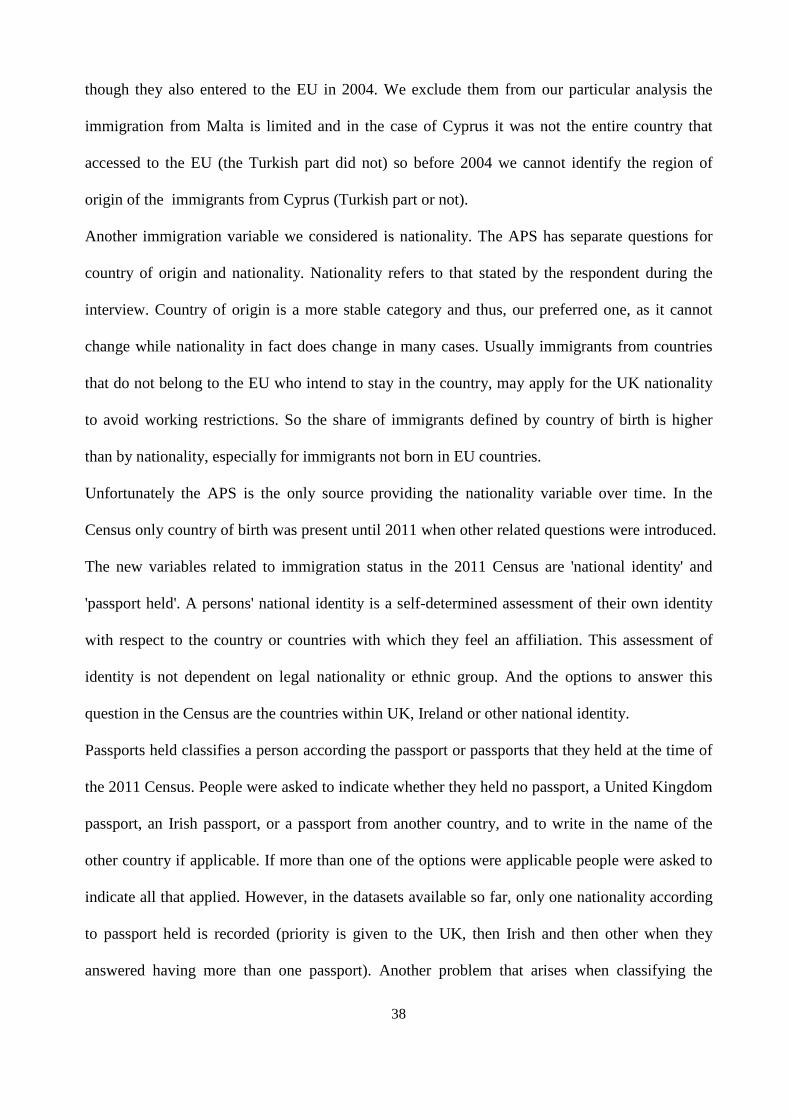
though they also entered to the EU in 2004. We exclude them from our particular analysis the
immigration from Malta is limited and in the case of Cyprus it was not the entire country that
accessed to the EU (the Turkish part did not) so before 2004 we cannot identify the region of
origin of the immigrants from Cyprus (Turkish part or not).
Another immigration variable we considered is nationality. The APS has separate questions for
country of origin and nationality. Nationality refers to that stated by the respondent during the
interview. Country of origin is a more stable category and thus, our preferred one, as it cannot
change while nationality in fact does change in many cases. Usually immigrants from countries
that do not belong to the EU who intend to stay in the country, may apply for the UK nationality
to avoid working restrictions. So the share of immigrants defined by country of birth is higher
than by nationality, especially for immigrants not born in EU countries.
Unfortunately the APS is the only source providing the nationality variable over time. In the
Census only country of birth was present until 2011 when other related questions were introduced.
The new variables related to immigration status in the 2011 Census are 'national identity' and
'passport held'. A persons' national identity is a self-determined assessment of their own identity
with respect to the country or countries with which they feel an affiliation. This assessment of
identity is not dependent on legal nationality or ethnic group. And the options to answer this
question in the Census are the countries within UK, Ireland or other national identity.
Passports held classifies a person according the passport or passports that they held at the time of
the 2011 Census. People were asked to indicate whether they held no passport, a United Kingdom
passport, an Irish passport, or a passport from another country, and to write in the name of the
other country if applicable. If more than one of the options were applicable people were asked to
indicate all that applied. However, in the datasets available so far, only one nationality according
to passport held is recorded (priority is given to the UK, then Irish and then other when they
answered having more than one passport). Another problem that arises when classifying the

39
immigrant population according to the passport held is that there are many missing values: there
were 9.2 million usual residents born in the UK who did not hold a passport and 269,000 foreign
born resident who also did not hold a passport. The reasons for this varies by country, but may
include: asylum seekers without travel documentation awaiting a decision; those born in the
Republic of Ireland who did not require a passport in order to enter the UK; those from other EU
countries who may have arrived to the UK using a national identity card; those who may have
acquired UK nationality but do not currently hold a passport (ONS, 2013). Another innovation of
the 2011 is the introduction of short term migrants (those that stay less than 12 months), but LA
estimates are not available at the time of writing.
2.3. Other variables
The rest of the socio-demographic variables employed are obtained both from the Census and the
APS for every LA and corresponding years according to the source. The immigrant share is
defined as the immigrant population divided by the total population. Population growth also refers
to the total usual resident population. The unemployment rate is defined as the number of
unemployed divided by the economically active population aged 16 to 64 years old. Density is
defined as the usual resident population divided by the land area of the LA. The young male
population share is the ratio of the males aged 15-39 to the total population.
3. Crime Variables
3.1. Notifiable Offences
We obtained data on notifiable offences from Data.gov.uk. It is supplied by each of the 43 police
forces in England and Wales (we do not consider crimes recorded by other forces such as the
British Transport Police, for example). In London there are two police forces: the Metropolitan
Police which is in charge of the security of 32 London boroughs and the City of London police
that serves the City of London borough. Total notifiable offences are available for every LA and
are classified in the major type of offences: burglary, robbery, theft and handling stolen goods,

40
violence against a person, sexual offences, drugs, fraud and forgery and other offences. We are
mainly interested in violent and property crimes, so we redefine total crime as the sum of these
two categories. In violent crimes we include violence against the person (which also includes
sexual offences) and robbery, and in property crimes we include burglary, theft and criminal
damage. The rest of the categories are volatile and we do not consider them. However, all our
findings are also robust to using a broader total crime definition.
Notifiable offences are consistently available since the fiscal year 2002/2003. Unfortunately we
cannot use previous crime records due to changes in the recording system. There have been two
major changes to the recording of crimes in recent years: in April 1998 the Home Office Counting
Rules for recorded crime were expanded to include certain additional summary offences and
counts became more victim-based (the number of victims was counted rather than the number of
offences); and in April 2002, the National Crime Recording Standard (NCRS) was introduced
across England and Wales. The aim of the NCRS was to ensure greater consistency between
forces in recording crime and to take a more victim-oriented approach to crime recording with the
police being required to record any allegation of crime unless there was credible evidence to the
contrary.
The implementation of the NCRS preclude consistent comparison of crime counts before and
after the change in the recording system. In England and Wales crime is estimated to have
increased by 10 percent (12 percent in the Metropolitan Police area) in the year of the
introduction of NCRS as a consequence of the victim-oriented approach to recording. The
introduction of NCRS affected differently the types of offences and the police force areas.
Regarding police forces, not all of them adopted the NCRS at the same time. There were a few
'early adopters', Avon and Somerset, Lancashire, Staffordshire, and West Midlands, (where 39
LAs are located) that by 2002/2003 were already following the NCRS guidelines. The rest of the

41
police forces adapted their recording practices during the first year (Simmons, Legg and Hosking,
2003). Thus, the crime count in 2002/2003 is also not completely unaffected by the change.
It has only been possible to calculate the NCRS impact within certain crime groups as incident
information at police force level is not available for all categories. The groups include violence
against the person, burglary from a dwelling, robbery, theft and total crime. No estimate was
made of the NCRS impact at smaller geographies than police force area, therefore we cannot do
any adjustment to the previous crime data to use it in our study. Violent crimes where the most
affected as a consequence of the NCRS introduction, with violence against the person increasing
a huge 23 percent across England and Wales and 20 percent in the Metropolitan Police area
(Simmons, Legg and Hosking, 2003). The least affected were burglaries (3 percent increase in
England and Wales and 4 percent in the Metropolitan Police area) and robberies (3 percent
increase in the country and 5 percent in the Metropolitan Police area).
To convert the crime counts into rates we divided the notifiable offences by total population,
using the total population of the Census or the APS according to the year under study.
3.2. Arrests
To complement our study on the effect of immigration on crime we submitted a Freedom of
Information Act request to obtain a unique dataset on arrest counts for the 32 boroughs of the
Metropolitan Police area. The records are monthly and start in April 2008. The data comes broken
down by nationality, age, offence, month and borough. This is a very rich dataset of 1,222,574
arrests from April 2008 to June 2012. We are only able to use this data by nationality since June
2009 as before the completion of the nationality field was not mandatory so the non-UK nationals
arrests are under-recorded. We also drop from the dataset those arrests that took place in
Heathrow airport. There are 864,964 arrests since June 2009. From those in 72.4 percent of the
cases the detainee was UK national and 27.6 percent non UK-nationals. The dataset includes a
list of 200 offences, which we grouped in the same categories as the recorded crime data.
42
The nationality recorded by the police is the one self-reported by the detainee. It is a free question
and then the police officer should put the option declared by the detainee choosing it from a
structured nationality list. All the nationalities are contained in that list.
To convert the arrest counts into arrest rates, we divide the arrests by total population according
to nationality status. We used the APS nationality variable detailed before. The other option
would be to use the Census variable 'passport held'. However, given that the question asked to the
detainee is the same one as in the APS interview (i.e. which refers to the self-reported nationality)
and given that the detainee is not asked to show any passport or document to prove nationality
when arrested, the passport held variable would have been incorrect.
4. Construction of Instrumental Variables
4.1. Change in Immigrant Share Instruments
To predict the change in the share of immigrants for the 2001-2011 period we use the Census
immigrant count by country of birth of each of the 17 country/region groups previously defined,
calculate their distribution across the 347 spatial units in 2001 and multiply each distribution by
the 2001-2011 inflow of immigrants to the UK from the respective country. We divide the
predicted inflow by the 2001 population. Then we add up the normalized predicted inflow of the
17 groups to instrument the actual change in immigrant share per spatial unit.
To predict the change in the share of immigrants for the 2004/5-2010/11 we use the APS country
of birth variable and follow a similar procedure as for the inter-Census period. The only
difference is that we take as reference distribution, that of the average between 2004/5 and 2005/6
waves to increase precision as the data comes from a sample of households, unlike the Census.
The A8 and non-A8 IV is constructed in the same way, but only using the relevant groups for
each case from the 17 categories.
We are also able to predict the change in the share of immigrants defined by their nationality for
the 2004/5-2010/11 period using the APS dataset. To do so, we replicate the same procedure as

43
for country of birth, but take the immigrant original distribution and inflows according to their
nationalities. We use the same 17 country/region groups as for the case of country of birth. We
also include in the IV prediction equation an additional dummy variable for whether areas
historically had a high immigration share, defined as 20 percent or over in the 1991 Census.
4.2. Lagged Change in Crime/Burglaries
To predict the change in Change in Crime/Burglary Rate, 2002-2004 we use the Crime or
Burglary Rate in 2002. We first scale the change in the Crime/Burglary Rate 2002-2004 to make
it comparable to the 6 year period we analyse, by multiplying it by three. Then, we use the Crime
or Burglary Rate (in levels) in 2002 as the instrument.