Crime & Delinquency - Sage Publications
30
http://cad.sagepub.com Crime & Delinquency DOI: 10.1177/0011128706293689 2007; 53; 552 Crime Delinquency Joel Miller and Jeffrey Lin Local Context: Some Practical and Theoretical Lessons Applying a Generic Juvenile Risk Assessment Instrument to a http://cad.sagepub.com/cgi/content/abstract/53/4/552 The online version of this article can be found at: Published by: http://www.sagepublications.com can be found at: Crime & Delinquency Additional services and information for http://cad.sagepub.com/cgi/alerts Email Alerts: http://cad.sagepub.com/subscriptions Subscriptions: http://www.sagepub.com/journalsReprints.nav Reprints: http://www.sagepub.com/journalsPermissions.nav Permissions: http://cad.sagepub.com/cgi/content/refs/53/4/552 Citations at SAGE Publications on February 27, 2009 http://cad.sagepub.com Downloaded from
Transcript of Crime & Delinquency - Sage Publications

http://cad.sagepub.com
Crime & Delinquency
DOI: 10.1177/0011128706293689 2007; 53; 552 Crime Delinquency
Joel Miller and Jeffrey Lin Local Context: Some Practical and Theoretical Lessons
Applying a Generic Juvenile Risk Assessment Instrument to a
http://cad.sagepub.com/cgi/content/abstract/53/4/552 The online version of this article can be found at:
Published by:
http://www.sagepublications.com
can be found at:Crime & Delinquency Additional services and information for
http://cad.sagepub.com/cgi/alerts Email Alerts:
http://cad.sagepub.com/subscriptions Subscriptions:
http://www.sagepub.com/journalsReprints.navReprints:
http://www.sagepub.com/journalsPermissions.navPermissions:
http://cad.sagepub.com/cgi/content/refs/53/4/552 Citations
at SAGE Publications on February 27, 2009 http://cad.sagepub.comDownloaded from
552
Applying a GenericJuvenile Risk AssessmentInstrument to a LocalContext
Some Practical and Theoretical Lessons
Joel MillerUniversity of Málaga, Spain
Jeffrey LinUniversity of California, Irvine
This article examines issues raised by the application of a generic actuarialjuvenile risk instrument (the Model Risk Assessment Instrument) to NewYork City, a context different from the one in which it was developed. Itdescribes practical challenges arising from the constraints of locally availabledata and local sensibilities and highlights important differences betweenlocally relevant recidivism predictors and generic tool predictors. The analy-sis shows that the generic tool is less predictive than a locally developedrisk-assessment tool and also performs less well than unassisted clinicaljudgment. This is true even after the generic tool has been validated andoptimized on local data. This is because the tool does not include key demo-graphic variables relevant to the New York City context.
Keywords: risk assessment; actuarial; clinical judgment; juvenile recidivism;family court
The principles underpinning actuarial risk assessment in justice popula-tions were established many decades ago when research began to
demonstrate that the characteristics of offenders were correlated with theirsubsequent behavior (Burgess, 1928; Glueck & Glueck, 1950). Theseinsights form the basis of actuarial risk assessment tools, which have incommon a core set of principles. Based on statistical analysis of offendercharacteristics and subsequent behavior, items or questions about a person’slegal, psychological, and social characteristics are scored and combined to
Crime & Delinquency Volume 53 Number 4
October 2007 552-580© 2007 Sage Publications
10.1177/0011128706293689http://cad.sagepub.com
hosted athttp://online.sagepub.com
at SAGE Publications on February 27, 2009 http://cad.sagepub.comDownloaded from

form a scale that is indicative of “risk”—such as the risk of rearrest or recon-viction, the risk of absconding while on bail, or the risk of violation of paroleor probation conditions (Clear, Wasson, & Rowland, 1988; M. R. Gottfredson& Gottfredson, 1986; S. D. Gottfredson & Moriarty, 2006). From the 1970sonward, these insights began to work their way into systematic practice, asstructured predictive tools emerged within criminal justice settings as a basisfor decision making (Andrews, 1989).
This article is concerned with risk assessment within the juvenile justice sys-tem, which has also been a fertile area for development in recent years. Today,the use of juvenile assessment tools is relatively widespread (Office of JuvenileJustice Delinquency Planning [OJJDP], 1995), and the development of empir-ically based risk assessments has been described in a number of studies andreports (Baird, 1984; Johnson, Wagner, & Matthews, 2002; LeCroy, Krysik, &Palumbo, 1998; Risler, Sutphen, & Shields, 2000; Schwalbe, Day, & Fraser,2002; Washington State Institute for Public Policy, 2004). Specifically, weexamine issues raised by the application of a generic juvenile risk instrument toa context different from the one in which it was originally developed. It appliesan “off-the-shelf” risk tool to data generated by research in New York City(NYC). In doing so, the article explores practical challenges that accompanysuch a task and examines the predictive efficacy of the generic tool, both beforeand after it has been subject to validation and adjustment using local data.
Actuarial Risk Assessment
Research in a range of contexts, including mental health and behavior(Dawes, Faust, & Meehl, 1989), child welfare (Gambrill & Shlonsky, 2000),and the justice system (Andrews, Bonta, & Wormith, 2006; Carroll, Wiener,Coates, Galegher, & Alibrio, 1982; Glaser, 1955, 1962; D. M. Gottfredson &Beverly, 1962; Holland, Holt, Levi, & Beckett, 1983), attests to the fact thatactuarial assessment tools make more accurate classifications than subjec-tive or “clinical” judgments of professionals. Most definitively, Grove, Zald,Lebow, Snitz, and Nelson (2000) report on a meta-analysis of 130 studies ofhuman health and behavior, including those in criminal justice, whichshowed that actuarial techniques were about 10% more accurate than clinicalprediction on average. Actuarial prediction substantially outperformed clini-cal prediction in 33% to 47% of studies examined, and in only 6% to 16% ofstudies was it substantially less accurate.
Despite the advantages of actuarial tools, they come with some limitations.Notably, actuarial methods are not a golden bullet for anticipating who will and
Miller, Lin / Generic Juvenile Risk Assessment 553
at SAGE Publications on February 27, 2009 http://cad.sagepub.comDownloaded from
who will not reoffend, all having substantial margins of error in this regard(Ashford & LeCroy, 1990; M. R. Gottfredson & Gottfredson, 1984; S. D.Gottfredson, 1987; S. D. Gottfredson & Moriarty, 2006; Klein & Caggiano,1986; Wiebush, Baird, Krisberg, & Onek, 1995). As such, contemporary riskassessment is more often concerned with classification of offenders into groupsof offenders with different rates of recidivism than with prediction of offendingin individuals (Ashford & LeCroy, 1990; Baird, 1984; Juvenile SanctionsCenter, 2002; Loeber & Stouthamer-Loeber, 1987; Marczyk, Heilbrun, Lander,& DeMatteo, 2003; OJJDP, 1995; Wiebush et al., 1995). Efforts to improvethe predictive efficacy and practical utility of actuarial tools have also come toemphasize the importance of the dynamic changeable factors—such as druguse, peer groups, family relationships, or employment—in addition to the sta-tic, unchangeable factors of an offender—such as his or her age, gender orprevious convictions (Andrews et al., 2006; Gendreau, Goggin, & Little, 1996;S. D. Gottfredson & Moriarty, 2006). The movement from clinical tools to actu-arial tools emphasizing static factors and, subsequently, to actuarial toolsemphasizing dynamic factors has been characterized in terms of first-, second-,and third-generation assessment tools (Bonta, 1996).
Another very important limitation of risk assessment tools—and one withwhich we are concerned in this article—is their local validity. It is clear fromexisting research that the validity of any given risk assessment tool will varyfrom place to place and across time. For example, Clear et al. (1988) showhow an adult risk screening instrument developed by the Wisconsin Bureauof Community Corrections and applied elsewhere transfers well to somejurisdictions but not to others. Wright, Clear, and Dickinson (1984), examin-ing the same tool applied to NYC probationers, showed that that tool had sig-nificant weaknesses and included variables that did not predict risk for theNYC sample. In a juvenile justice context, Krysic and LeCroy (2002) showhow a previously empirically validated assessment tool for juveniles inArizona was outstripped by probation officers’ subjective judgment severalyears later because of the changes in juvenile justice population over time.Despite these kinds of problems, the wholesale transfer of risk assessmenttools to jurisdictions other than those in which they were validated apparentlyremains common practice (S. D. Gottfredson & Moriarty, 2006).
Risk Assessment in the Juvenile Justice System
There is reasonable consensus on the predictors of juvenile recidivism.The OJJDP (1995) provides direct comparison among 8 separate risk scales
554 Crime & Delinquency
at SAGE Publications on February 27, 2009 http://cad.sagepub.comDownloaded from

empirically derived both from county and state populations. School func-tioning was found on all instruments, and age at first referral, number ofpriors, substance abuse, peers, and family function were each found on atleast 5 out of 8 instruments. Other factors included in half or fewer were(in decreasing order of frequency) current offense type, prior out-of-homeplacements, gender, runaway history, prior assault, victim of abuse andneglect, other factors, special education, and mental health problems.
Probably the most definitive empirical analysis of juvenile recidivism pre-dictors is a meta-analysis of 22 separate studies of youth within the juvenilejustice system (Cottle, Lee, & Heilbrun, 2001). They found a total of 23 fac-tors statistically significant in their prediction of recidivism, of which the 10most powerful were age at first commitment, age at first contact with the law,nonsevere pathology (e.g., stress and anxiety), family problems, conductproblems, effective use of leisure time, delinquent peers, length of first incar-ceration, number of out-of-home placements, and number of prior commit-ments. These findings have a close resemblance to the instruments reviewedby the OJJDP (1995), detailed above, though the analysis also highlights fac-tors that are more difficult to measure in justice settings (as against researchcontexts) and hence are absent from the OJJDP tools. Such factors include,for example, nonsevere pathology and conduct problems.
There is an inevitable synergy between recidivism predictors and thebroader canon of juvenile delinquency research and theory, though it isimportant to note that recidivism predictors are relevant to a specific subsetof the general youth population—one that has already come into contact withthe justice system and is therefore already in the throes of a delinquent career.For example, the prominence of age at first offense as a predictor of recidi-vism provides an important marker that helps distinguish between whatMoffit (1993) calls “adolescent-limited” delinquents who start their antisocialbehavior later in life have shorter-lived offending careers and “life-course-persistent” delinquents who have conduct problems that start earlier in lifeand have more persistent offending careers. Other factors such as familyfunction, peer group, mental health problems, and conduct problems all showup in studies of risk factors for antisocial behavior and delinquency in thegeneral youth population (Hawkins et al., 1998; Herrenkohl et al., 2000;Lipsey & Derzon, 1998; Loeber, Farrington, Stouthamer-Loeber, Moffitt, &Caspi, 1998; McCord, Widom, & Crowell, 2001; Tremblay & LeMarquand,2001; Wasserman & Seracini, 2001).
Of particular interest to the current article is the emergence of a number ofgeneric juvenile risk assessments that are promoted and used across a rangeof different populations. They include, for example, The Youth Level of
Miller, Lin / Generic Juvenile Risk Assessment 555
at SAGE Publications on February 27, 2009 http://cad.sagepub.comDownloaded from

Service/Case Management Inventory (Hodge & Andrews, 1999), the YouthAssessment and Screening Instrument (Orbis Partners, 2006), Back on Track!(Assessments.com, 2004), the Global Risk Assessment Device (Gavazziet al., 2003), and the Model Risk Assessment Instrument (MRAI; JuvenileSanctions Center, 2002). Typically, instruments to measure juvenile riskmake use of no more than a dozen questions to generate an overall risk class-ification and draw on variables from readily available information, such asinvestigatory interviews and reviews of official records (OJJDP, 1995).Inevitably, these off-the-shelf tools are validated, in the first instance, on dif-ferent populations from many of those on which they may later be applied.The premise of these tools seems to be that, when applied in new contexts,they should help predict recidivism even without local validation (e.g.,Juvenile Sanctions Center, 2002; OJJDP, 1995; Orbis Partners, 2006) but canonly be used with full confidence once validation and score adjustment(if necessary) have been performed in the new context (Flores, Travis, &Latessa, 2004; Juvenile Sanctions Center, 2002; OJJDP, 1995; Orbis Partners,2006; Turner, Fain, & Sehgal, 2005). For example, the Juvenile SanctionsCenter (2002), in discussing their MRAI, assert,
Its use of factors that consistently appear on other validated instruments sug-gest that it is a tool that can be expected to work reasonably well for anyjurisdiction that chooses to adopt it. It is imperative, however, that the adopt-ing agency eventually . . . conducts the research necessary to validate themodel scale on the local population. (p. 4)
The Current Study
This article explores the challenges of applying a generic juvenile risk assess-ment tool to a different context from the one in which it was initially developedand validated. The article exploits the opportunity afforded by the developmentand validation of a local, homegrown NYC juvenile risk assessment tool (here-after referred to as the NYC tool), which involved the collection of baseline andrecidivism data on 730 juvenile delinquents. The risk assessment tool was devel-oped for use by family court probation officers writing predisposition reports onyouth adjudicated as juvenile delinquents. It was designed to provide a riskclassification of the juveniles according to their relative likelihood of recidi-vism, which could be used to guide whether a recommendation of institu-tional placement with the state or of community disposition (primarilyprobation) was made—and the intensity of programming and supervision
556 Crime & Delinquency
at SAGE Publications on February 27, 2009 http://cad.sagepub.comDownloaded from

associated with the latter. Importantly, it was constructed from items thatmatched information that was readily available to the NYC probation officersat the time of the predisposition report.
In effect, the article simulates and evaluates the process that proponents ofgeneric tools recommend to local jurisdictions: First, introduce a tool validatedelsewhere and use it straightaway to guide decision making. Subsequently, val-idate the tool based on the recidivism of the first cohort of offenders assessedand refine the tool to further increase its predictive efficacy.1 The NYC research,as well as providing data to do this, offers two comparative benchmarks againstwhich predictive efficacy of a generic tool can be compared (both pre- and post-validation). First, the risk scale of the locally developed NYC tool provides akey reference point. Second, the NYC data include an approximation of a clini-cal risk assessment of probation officers. Recommendations they make to courtabout whether a youth should be sent to institutional placement or receive acommunity disposition such as probation can be seen as an approximation forclinical assessments of risk. This comes with an important caveat. In practice,these recommendations are a product not only of perceived risk to the publicbut also of concerns about the welfare of the youth or even other bureaucraticconsiderations (Carter & Wilkins, 1967; Hood, 1966; Neubrauer, 1974;Rosecrance, 1985). Together, these other factors will tend to dilute and compro-mise the measure as an indication of the clinical risk assessment of probationofficers, meaning that their recommendation will probably understate rather thanoverstate their actual ability to distinguish high- and low-risk youth. As such, aprobation officer recommendation ought to be an easier threshold for an actuar-ial tool to beat than a more accurately measured clinical assessment of risk.
The generic risk assessment tool assessed in this article is the JuvenileSanctions Center’s (2002) MRAI. It was chosen as an example to serve thepurposes of this case study not because it was the only tool of its kind.However, it was felt to be particularly suitable to the NYC context bothbecause of its pedigree and its design. First, the tool was developed throughthe work of the National Council on Crime and Delinquency, a key agencythat has been involved in developing juvenile risk assessments across differ-ent U.S. jurisdictions for many years. The tool actually draws on factors thatoccurred repeatedly across separate research validated juvenile risk assess-ment tools in 13 jurisdictions across the United States (a group of items thatclosely resemble those highlighted in research discussed above).2 Publishedresearch on two of the validations, by LeCroy et al. (1998) and Johnson et al.(2002), highlights robust evaluation methodologies tracking juvenile re-referralrates during 12-month follow-up periods. As such, the generic tool should bestrong: It represents the accumulated validation experience from a diverse
Miller, Lin / Generic Juvenile Risk Assessment 557
at SAGE Publications on February 27, 2009 http://cad.sagepub.comDownloaded from
558 Crime & Delinquency
range of settings, focusing on factors common across these settings while dis-regarding factors found only infrequently.
The tool was also chosen as a comparison because of its functional sim-ilarity to the NYC tool and because of its relative simplicity to apply retro-spectively. Importantly, it is explicitly targeted at those at the “front-end”(p. 1) of the juvenile justice system and includes among its possible uses arole in “structuring dispositional decisions for adjudicated youth” (p. 6)—closely resembling our focus in NYC. Also, like our NYC tool, it producesa single (risk) score that relies on a handful of scored items.
The research asks,
• Are there any obstacles to the implementation of the MRAI generic toolin the NYC juvenile justice context?
• How well does the nonvalidated MRAI perform compared, respectively, to alocally developed and validated tool (the NYC tool) and to clinical judgment?
• How well does the MRAI perform against these benchmarks after it hasbeen validated locally?
• What lessons can we therefore learn about the value of generic instru-ments applied in contexts different from which they were developed andvalidated?
Background: Data Collection andDevelopment of the NYC Tool
We first highlight the steps we took to collect data for the developmentof the NYC tool and the methods we used to create the tool as a context tothe testing of the MRAI.
Data Collection
We collected data on a total of 730 juvenile delinquents who receiveddispositions in the New York City Family Court system during the spring of2000. In New York, a juvenile delinquent is a person between the ages of 7and 15 (at the time of the offense) who is charged with committing an actthat would constitute a crime if committed by an adult.3 Study participantswere identified from family court calendars for the key juvenile delin-quency parts all five NYC boroughs and included juvenile dispositionsfound for each day in April, May, and June of 2000. Files were retrieved,on average, for 87% of identified cases (the retrieval rate in each boroughranged from 80% to 93%).4
at SAGE Publications on February 27, 2009 http://cad.sagepub.comDownloaded from

The design of our coding schedule was heavily influenced by the literatureon juvenile recidivism and the structure of existing risk assessment tools,as described above. Variables collected included demographic information,charges and justice processing information, legal history, family circum-stances, school attendance and performance, community and peer relation-ships, drug and alcohol use, mental health, and victimization history. However,the items on the data collection tool relevant to recidivism sometimes evolvedbeyond the categories received from other tools and literature. Pilot work,which involved reviewing files and refining coding protocols, helped establishlocally relevant versions of measures or locally available proxies for measuresthat could not be directly measured from available information. This meantthat measures of concepts highlighted by the existing literature and assessmenttools evolved to take a locally relevant form that could be applied in the NYCcontext. This issue is discussed in more detail later in the article.
One of the main sources of information in the files was the probationdepartment’s “investigation and recommendation” reports, written by proba-tion officers, recommending the most appropriate disposition in each case andsubmitted to family court judges. They contain fairly comprehensive legal,social, and psychological information for delinquent youth. These reportswere complemented by a series of other documents sometimes available onfile, including probation intake reports, mental health reports, assessments forintensive probation, school records, court petitions, and arrest reports.
To measure recidivism, we chose rearrest (of any kind) because of its greaterfrequency compared to other measures, such as reconviction. The measure isconsistent with a number of other juvenile risk assessment studies focused onrecidivism that have focused either on rearrest (Marczyk et al., 2003;Rodríguez-Labarca & O’Connell, 2005) or the closely related re-referral tojuvenile justice intake (Johnson et al., 2002; LeCroy et al., 1998), which tendsto follow after a juvenile is arrested. We did not wish to include probation orother supervision violations because this would have introduced biases as,unlike arrests, they are dependent on being under supervision while in thecommunity. Nor did we include summonses. We obtained arrest data (bothjuvenile and adult) from a comprehensive database maintained by NYC’sCriminal Justice Agency on all police arrests. However, to control for timespent by juveniles out of the community in our outcome measure (because ofinstitutional confinement), we also needed data on their patterns of confine-ment after disposition. Data from the New York State Office for Children andFamily Services, the agency responsible for children in placement by the juve-nile justice system, and data from the city’s Department of Juvenile Justice,responsible for detention of youth, were also added to our sample cases. Based
Miller, Lin / Generic Juvenile Risk Assessment 559
at SAGE Publications on February 27, 2009 http://cad.sagepub.comDownloaded from

on these data, we found that 97% of the sample had spent a full 18 months inthe community, or at least had been rearrested before the end of this 18-monthperiod had passed, during a 3-year follow-up period. Thus, rearrest within 18months spent in the community (across a 3-year follow-up period) became ourkey recidivism measure. Within this time, about half our total sample (48%)was rearrested and about one third (34%) was rearrested for a felony offense.Table 1 provides more details.
Tool Construction
To create and validate an assessment tool, Clear et al. (1988) highlight anumber of steps that we closely followed. These include the developmentof a study sample containing measures and potential correlates of failure.The process further involves the division of that sample into a “construc-tion” subsample, on which to derive a statistical model that provides a basisfor the assessment tool, and a “validation” subsample, on which to test thepredictive reliability of the model, to offset the possibility of shrinkage ofstatistical power when a model is applied to a different sample from the onewith which it was derived (S. D. Gottfredson, 1987). When splitting thesample, we deliberately chose a larger construction subsample (n = 499)than a validation subsample (n = 231) because we wanted enough cases inthe construction subsample to produce a robust model.5 We used a ran-domly generated number to split the sample so the characteristics of the twosubsamples are very similar in terms of key demographic and recidivismvariables. Table 1 highlights the characteristics of the two samples.
We drew on a number of independent variables for inclusion in an initiallogistic regression model that was subsequently refined through backwardstepwise procedures.6 The initial variable list was largely consistent with, butslightly more expansive than, those present elsewhere in risk assessment tools(OJJDP, 1995; Washington State Institute for Public Policy, 2004) and thosehighlighted by meta-analysis (Cottle et al., 2001). They included demo-graphic variables (sex, age), school variables (attendance, conduct, attain-ment), legal history variables (previous arrests, previous violent arrests,previous adjudications), family (obedience to parents, parental supervision),current offense (severity, offense type), community (negative peer group,gang association), drug use, and attitude to the current offense. Most of thevariables were collapsed down into binary categories following bivariateanalysis with the dependent variable, with the exception of school attendance,which was a three-category variable, and age, which was included as a con-tinuous variable (with some adjustments).7
560 Crime & Delinquency
at SAGE Publications on February 27, 2009 http://cad.sagepub.comDownloaded from

Miller, Lin / Generic Juvenile Risk Assessment 561
There are a few points to note in our initial variable list. First, we excludedvariables (including race, geography, family structure, and experiences ofabuse and neglect) where we, along with NYC stakeholders, felt that inclusionwould be discriminatory, unfair, or unpalatable among practitioners. We did,however, include gender, which other tool developers have often excluded forethical reasons (LeCroy et al., 1998; OJJDP, 2005) because of its very pro-found associations with recidivism.8 In addition, we did not include age at firstreferral, a very important predictor in the literature, principally because of itshigh correlation with current age, which we did include (which made it some-what redundant). We refer in more detail to this issue later in the article.
Secondly, we had some missing data (averaging about 8% in the finalmodel variables but ranging as high as 24% for the school misconduct vari-able), but we did not want to lose cases to missing data—we felt this wouldbe an unrealistic approach for probation officers to take in the field. We there-fore grouped missing values with appropriate nonmissing values according totheir predictive characteristics measured through bivariate analysis.9
Table 1Characteristics of Estimation and Validation Samples
Estimation Sample (%) Validation Sample (%)
Male 80 7816 and older (at disposition) 17 1714-15 66 6113 or younger 18 22White 6 6Black 63 63Hispanic 29 27Other 2 4Prior or other arrest 42 39Prior disposition for delinquency 15 15Prior delinquency placement 4 4Current felony adjudication 40 38Current adjudication for violent or 50 46
weapons offensePlacement disposition 51 49Rearrest (18 months) 49 47Felony rearrest (18 months) 34 34Violent felony rearrest (18 months) 22 212+ rearrests (12 months) 16 223+ rearrests (12 months) 9 8n (minimum) 457 212
at SAGE Publications on February 27, 2009 http://cad.sagepub.comDownloaded from

562 Crime & Delinquency
Table 2 provides the logistic regression results that formed the basis ofour risk score development. We present here our main model that was actu-ally used in the development of the NYC risk assessment tool. The tablealso provides an alternative model that does not use a sex variable for com-parative purposes with the MRAI, which excludes gender. In both cases,backwards stepwise log likelihood logistic regression was used, and in bothcases the models retained seven predictor variables.
The most powerful predictor of both models is severity of offense, thoughit only applies to a small number of cases (14 out of 15 of cases in the esti-mation subsample adjudicated as Felony A or B were rearrested). Gender toois a very powerful predictor, as we can see in the first model. Other importantvariables include age, school attendance, and, to a lesser extent, previousarrests, peer group, and substance abuse. School misconduct also is importantfor the second model, once gender is not included (the variable is significantat p < .10). These predictors show both overlaps with and differences fromvariables found in other literature already reviewed (Cottle et al., 2001;OJJDP, 1995) For example, the NYC tool contains similar variables for about4 out of the 6 core variables found in half or more instruments reviewed byOJJDP (1995): school attendance, prior arrests, substance abuse, and negativepeers. By contrast, the NYC tool did not include the core variables of age atfirst referral and family functioning. Interestingly, those variables with the
Table 2Logistic Regression Model to Develop Locally Derived
New York City Tool (and Version Without Sex)
Locally Derived Items Full Model Model Without Gender
Male 1.38**School attendance
Absences (10%-90% present) 0.17** 0.06*Rarely attends or not enrolled 1.14** 0.82*
Intervention by school for misconduct 0.41Age—standardized from 0 (young) to 1 (old) 1.06* 1.21**Prior or other arrests 0.60** 0.71**Felony A or B adjudication 2.39* 2.52*Substance use 0.46* 0.43*Negative peer group 0.52* 0.55*Constant –3.23** –2.32**Nagelkerke R2 .25 .19
Note: n = 483.*p < .05. **p < .01.
at SAGE Publications on February 27, 2009 http://cad.sagepub.comDownloaded from

greatest weights on the NYC tool (offense severity, sex, and age) are actuallyabsent from the core list of variables from other jurisdictions. Althoughgender has often been excluded in other tools on reasons of principle, offenseseverity and age presumably lack predictive power in other contexts despitetheir importance in NYC.
Coefficients from the final logistic regression model were each multi-plied by 10 and rounded for each to produce the scoring system that wasincorporated into the NYC tool. The full score for any individual, therefore,represents a direct index of the probability of rearrest. For the purposes ofthis article only, we also produced a second scoring system based on ourlogistic regression model that excluded sex as a predictor.
Tool Validation
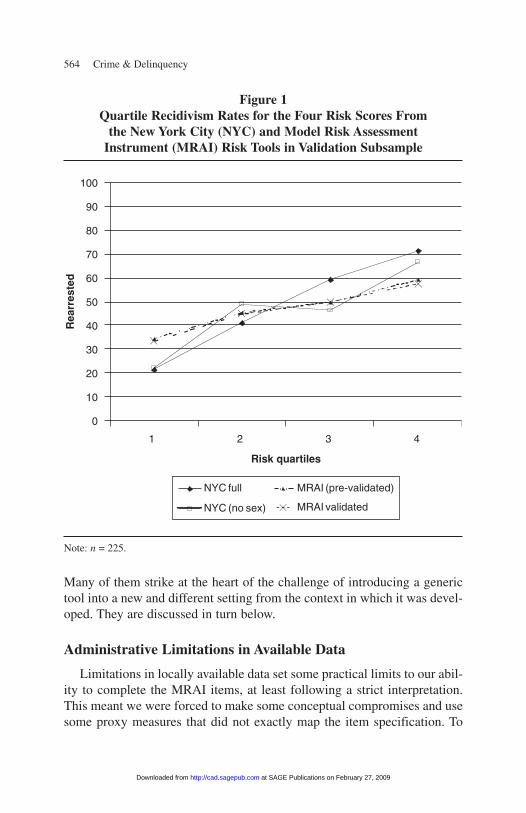
To test both model scoring systems, we applied them to the validationsubsample and, for each scoring system, divided the validation sample intoapproximate quartiles, in increasing order of risk. Both produced highly sig-nificant (p < .01) differentiation among quartiles, though the full model wasbetter overall. The full model NYC tool produced recidivism rates for quar-tiles of 21%, 41%, 59%, and 71%, respectively, and the model without sexproduced recidivism rates across quartiles of 22%, 49%, 46%, and 67%(slightly less discriminatory in the middle range). Figure 1 visually displaysthese results alongside the validation results for the MRAI tool.
Fitting the Generic MRAI Tool to NYC Data
In this section, we discuss the application of the MRAI generic tool tothe NYC data, which forms our core analysis for this article.
Table 3 shows the questions and points available for the nonvalidatedMRAI. Each of the tool items typically encompasses a number of subcate-gories associated with different subscores. For example, total number ofreferrals is grouped into three categories of one referral (0 risk points), twoor three referrals (1 point), and four or more referrals (3 points). Peerrelationships covers four categories: “friends provide positive influence”(0 points), “some delinquent friends with negative influence” (1 point), “mostfriends are delinquent; strong negative influence” (3 points), and “gangmember/associate” (4 points).10
Although in theory applying the scoring system to the NYC data wouldbe a straightforward exercise, in practice there were some difficulties.
Miller, Lin / Generic Juvenile Risk Assessment 563
at SAGE Publications on February 27, 2009 http://cad.sagepub.comDownloaded from
564 Crime & Delinquency
Many of them strike at the heart of the challenge of introducing a generictool into a new and different setting from the context in which it was devel-oped. They are discussed in turn below.
Administrative Limitations in Available Data
Limitations in locally available data set some practical limits to our abil-ity to complete the MRAI items, at least following a strict interpretation.This meant we were forced to make some conceptual compromises and usesome proxy measures that did not exactly map the item specification. To
0
10
20
30
40
50
60
70
80
90
100
Risk quartiles
Rea
rres
ted
1 2 3 4
NYC full
NYC (no sex)
MRAI (pre-validated)
MRAI validated
Figure 1Quartile Recidivism Rates for the Four Risk Scores From
the New York City (NYC) and Model Risk AssessmentInstrument (MRAI) Risk Tools in Validation Subsample
Note: n = 225.
at SAGE Publications on February 27, 2009 http://cad.sagepub.comDownloaded from

Miller, Lin / Generic Juvenile Risk Assessment 565
some extent, these limitations were a product of the choices we had alreadymade as researchers in our data collection protocol (we had not collecteddata with the MRAI in mind). However, more substantially, they reflectedlimitations in the data that were available to probation officers at the pointof their investigation—which our research data closely mirrored. Thesetended to reflect the quality and character of records available to probationofficers, in particular those passed to them by other agencies such as edu-cation, child welfare, and justice agencies.
For example, the MRAI includes an item measuring history of abuse andneglect. It reads: “Victim of child abuse or neglect (based on report to childwelfare agency, substantiated or not).” It accords a score of 1 to a yes and0 to a no. Based on the information routinely available to probation officersfrom the NYC child welfare agency, we could identify open or closed childwelfare cases relating to the youth’s family—and this information wascaptured in our data set. However, it was not clear from this informationwhether these cases were for abuse or neglect or other child welfare issues.Nor did we know whether they were related to the young person beingassessed or another family member. This posed a problem that we resolvedthrough using an imperfect compromise measure. We chose to include any
Table 3Questions for Model Risk Assessment Instrument
Risk Assessment and Their Risk Scores
Question Allocated Points
Peers 4Age at first referral 3a
Total number of referrals 3School discipline or attendance 3Substance abuse 2Number of out-of-home placements 2Parental supervision 2Referrals for violence or assault 1Parent or sibling criminality 1Victim of abuse or neglect 1All questions 22
Note: On the New York City (NYC) population, only 2 points are available for age at firstoffence. This is because juvenile delinquents only go to age 15 in NYC. Sixteen and olderwould be associated with an extra risk point in other contexts where 16-year-olds qualify asjuvenile delinquents.
at SAGE Publications on February 27, 2009 http://cad.sagepub.comDownloaded from

child welfare case that was open, closed, or with a finding as an indicatorof child abuse and neglect—knowing that this measure would be wrong inan unknown proportion of cases.
In some instances, we had to make minor adaptations to items moredirectly because of choices we had taken in our data collection protocol. Yeteven in most of these cases, it remains doubtful whether the full MRAI datawould have been consistently available on file had we tried to collect them—our measures largely reflecting the character of data readily available. Forexample, the MRAI tool asks about “school discipline/attendance during theprior 12 months,” whereas we had collected the data for the 3 months priorto arrest—which we used to fill out the MRAI. In practice, we felt these twomeasures were likely highly correlated and felt reasonably comfortable rely-ing on the 3-month measure. However, discipline and attendance data arerarely available to a probation officer for a whole year.11
Missing data also presented a problem: The average rate of missing casesacross measures was 7% and ranged up to 17% for the item measuring peergroup associations. As with the development of the NYC tool, we did notwant to ignore cases where we had missing data because this would be anunrealistic approach to completing a risk assessment instrument in the NYC(or probably any) context. Yet the MRAI provides no guidance on how toresolve the problem. We therefore developed an approach that involved sub-stituting a guessed value based on the group norm. Sometimes this was sim-ply the modal value for the remaining sample on a question. In other cases,we had some limited information that allowed us to focus on a subset ofcases. For example, when scoring someone on his or her number of refer-rals, we often knew that he or she had at least one prior referral, but we didnot know how many. We therefore took the modal value only for those withat least one prior referral (the modal value in this example was 1).
Ethical Considerations
The development of the NYC tool had already highlighted to us thatethical sensibilities among stakeholders in different settings likely vary.However, ethical dilemmas were more acutely raised through the simulatedimplementation of the MRAI in the NYC context. For example, the MRAItool included a variable on abuse and neglect, even though we had deliber-ately excluded this type of variable on ethical grounds in the developmentof the NYC tool. Similarly, an MRAI item that asked about parent or sib-ling criminality (specifically whether they had been incarcerated or on pro-bation in the past 3 years) was one that we felt would have clashed with the
566 Crime & Delinquency
at SAGE Publications on February 27, 2009 http://cad.sagepub.comDownloaded from
sensibilities of stakeholders we worked with within NYC and hence wouldhave presented a problem had our attempts at implementation of the MRAIbeen real rather than simulated.
Examining the Predictive Efficacy of the MRAI
In this section, we look in detail at the performance of the MRAI toolbased on the NYC data. In doing so, we carry out a validation exercise inwhich we simulate the approach recommended by proponents of generictools. That is, we assume the tool has been used as a basis for data collec-tion (in our case it has actually been fitted retrospectively to existing data),and we test whether the tool really is predictive. On the basis of this, wemake adjustments to the scoring of the existing MRAI items to maximizeits predictive efficacy. In addition, we analyze the prevalidated and vali-dated MRAI by assessing their performance against two comparative refer-ence points: the predictive validity of the homegrown NYC tool and thepredictive validity of the clinical judgments of probation officers.
Examining MRAI Items
To take a look at how the individual MRAI items behave as predictors inthe NYC data, we first entered each of the separate item scores into a logis-tic regression model of the NYC estimation subsample. The overall score ofan item is taken as a continuous variable, even though some items have dif-ferent values assigned for each of a number of levels (e.g., for substanceabuse, “no problem” is given 0 points, use “sometimes” is given 1 risk point,and use “frequently” is given 2 risk points). For illustrative purposes, we havealso standardized the range of each item to between 0 and 1 so that the co-efficients indicate the relative importance of each item. The first model inTable 4 illustrates what we found.
The second model in Table 4 details an optimized predictive model basedonce again on the estimation subsample. The model simulates the outcome ofa validation exercise, using the data that would have been produced if theMRAI had been used on a cohort of youth in NYC, to produce the optimumlocal scoring system. The model was produced by excluding nonpredictivevariables through a backwards stepwise procedure. Also, in creating the opti-mized model, original item scores provided by the original MRAI tool were notused, and instead items were introduced to logistic regression as categoricalvariables to optimize their predictive value. Some categories were collapsed
Miller, Lin / Generic Juvenile Risk Assessment 567
at SAGE Publications on February 27, 2009 http://cad.sagepub.comDownloaded from

568 Crime & Delinquency
together where they added no extra explanatory value. The scoring systembased on this model is hereafter referred to as the validated MRAI.
What is striking from Table 4 is that many of the items do a poor job pre-dicting recidivism despite their importance in the literature (Cottle et al.,2001; OJJDP, 1995). Referrals for violence or assault, prior placements,parental supervision, and parent or sibling criminality do nothing to predictrecidivism (and even have negative coefficients) in a multivariate model. Itis possible that parental supervision and parent or sibling criminality aredifficult to characterize and perhaps unreliably measured (relying as they
Table 4Logistic Regression Models Using Model Risk
Assessment Instrument (MRAI) Predictors
MRAI Items Prevalidated Optimized Model of Validated MRAI Items
Original Items Adjusted Items (All Comparisons(Standardized 0 to 1) Standardized 0 to 1)
Age at first referral –0.60** Age at first referral –0.68**(1 is younger than 0) (1 is younger than 0)
Total referrals 1.29** Total referrals (1)**2 or 3 0.95**4 or more 1.10**
Referrals for –0.19violence orassaults
Prior out-of-home –0.71placements
School discipline 0.81* School discipline 0.75**or attendance or attendance
Substance abuse 0.37Peer relationships 0.77** Peer relationships*
Some delinquent or negative 0.62Most delinquent or negative 0.72*Gang associate 0.87**
Victim of abuse 0.82** Victim of abuse or neglect 0.76**or neglect
Parental supervision –0.06Parent or sibling –0.12
criminalityConstant –1.29** –1.33**Nagelkerke R2 .16 .18
Note: n = 483.
at SAGE Publications on February 27, 2009 http://cad.sagepub.comDownloaded from

do primarily on interviews between the probation officer and the youth andparent), which helps explain their lack of explanatory power. However,referrals for violence and previous placement episodes are typically basedon simpler and more systematically available information, suggesting thatthese two variables are simply not predictive in a multivariate context.Substance abuse has a positive coefficient that echoes its predictive powerin the NYC risk tool models, though in this case it falls short of significanceset against the other predictors included in the model.
Particularly notable is the fact that age at first referral is statistically signif-icant but predicts recidivism in entirely the opposite fashion of that anticipatedby the MRAI and indeed other juvenile risk assessments and juvenile recidi-vism literature generally. That is, those who have a younger age of first refer-ral are less likely to recidivate than those who are older at their first referral.One possible explanation is that a narrow and young age spectrum of juveniledelinquents in NYC undermines the common association between age at firstoffense and recidivism. Youth in NYC only qualify as juvenile delinquent upto age 15, in contrast with many other jurisdictions, where they are older.Indeed, in all the jurisdictions on which the MRAI instrument was originallybased, juvenile status extends at least to 16 and in most cases to 17. It is pos-sible that the narrower age distribution in the NYC youth leaves less variationamong offenders in the cohort than the age at first arrest variable normally sig-nifies. In the NYC data, age at first referral also closely maps current age (thePearson correlation coefficient between these two measures is .69), perhapsbecause this is a relatively young cohort, which may make it a better indicatorof where people are in their offending careers (because it closely resemblestheir current age) than what type of offender they are. A different kind ofexplanation may relate to distinctive institutional practices in the NYC setting.We noted in the course of our research that a large number of arrests take placewithin schools (though we did not quantify this). It could be that children whotend to go to school rather than play truant may be disproportionately arrestedprecisely because they remain at school. This could mean that those gettingarrested younger are also those more likely to have been in school. This wouldbe precisely the group who were less prone to delinquency in the longer termbecause of their attachment to institutions.
MRAI Predictive PerformanceCompared With NYC Tool Scores
To test the MRAI in both its prevalidated and validated forms, weapplied it to the validation subsample of the NYC data. In creating quartiles
Miller, Lin / Generic Juvenile Risk Assessment 569
at SAGE Publications on February 27, 2009 http://cad.sagepub.comDownloaded from

for the two measures, we found that both were predictive of recidivism butdid not achieve high levels of statistical significance on our validation sam-ple. The prevalidated MRAI only achieved significance at the p < .10 level,producing quartiles associated with recidivism of 35%, 45%, 50%, and59%, respectively. Surprisingly, the validated MRAI produced almost iden-tical outcomes (p < .10) of 33%, 45%, 50%, and 58%.
Figure 1 displays the NYC tool measures along with the MRAI mea-sures, based on quartile recidivism rates in the validation subsample. Ininterpreting the graph, a steeper slope for any of the lines indicates morediscriminatory power. It is clear from this graph that both NYC tools (withand without the sex variable) perform better than the MRAI tool, regardlessof whether it has been validated (though the NYC no-sex tool is weak in themiddle risk score range). It is also clear that the validated MRAI shows noimprovement on the prevalidated version.
It is necessary to ask why the NYC tool continues to perform better thanthe MRAI, even after the latter has been validated, and indeed why the vali-dated MRAI tool offers little improvement over the prevalidated version. Areview of Tables 2 and 4 suggests that the main explanation relates to the roleof demographics. The NYC tool’s reliance on age and sex (and the secondNYC tool’s reliance still on age) adds substantially to its predictive power.This is true despite the fact that a crude proxy for age is effectively used bythe validated MRAI in the form of the correlated age at first referral—whichoverall appears as a less powerful predictor. Overall, it seems as if, withinNYC, demographic differences dominate others in predicting recidivism, andthese are not adequately captured by the MRAI items. Thus, even after vali-dation, the MRAI does not improve substantially because it is not adequatelycapturing these items.
There are other differences between the tools which, although importantto reflect on, apparently did not in this instance help explain the differencesin predictive power between the tools. Notably, the NYC tool includes avariable relating to the severity of the current offense—a powerful predictornot covered by the MRAI nor found in the literature on juvenile recidivismgenerally. Although this enhances the NYC tool, in practice it only compen-sates for omitting (because of local ethical judgments) a variable relating toabuse and neglect that is found on the MRAI and that is also an importantpredictor (if we remove the current offense severity variable from the NYCtool model, it reduces the Nagelkerke R2 from .25 to .23; however, addingthe abuse and neglect variable into the model raises its value back to .25).
We were also interested to see whether the poorer predictive power of theMRAI might be attributable to differences in the specification of similar
570 Crime & Delinquency
at SAGE Publications on February 27, 2009 http://cad.sagepub.comDownloaded from
items between tools. For example, both the validated MRAI and the NYCtool have items on school functioning issues, previous referrals, and peergroups, which have some differences in specification. However, we found,overall, that this did not help explain differences either (replacing the threeNYC items with the three similar MRAI items in the NYC tool model actu-ally increases the Nagelkerke R2 from .25 to .26, suggesting that the MRAIvariables are no worse predictors, overall, and perhaps may be better).
That said, some interesting lessons that are relevant to the application ofgeneric risk assessment tools did emerge from the latter comparison. Notably,the school attendance variable used in the NYC model is a better predictorthan the generic MRAI school discipline or attendance variable when welook at them in isolation (if we substitute the NYC school attendance iteminto the MRAI validated model in place of the original school functioningitem, we find that it also improves the Nagelkerke R2 from .18 to .19).Furthermore, we suspect that this reflects specific strengths and weaknessesof locally available data: School attendance is the best documented of allschool information on NYC probation officer files because it is based oncomputerized records of school attendance consistently provided by theschools. The NYC tool categories read: “Attends classes regularly (at least90% of the time),” “Regular absences and/or regular cutting (in class between50 and 90% of time),” “Present in class between 10% and 50% of the time,”“Not enrolled/rarely attending (less than 10% of time).” By contrast, theMRAI item wraps multiple school concepts into one variable (attendance,behavior, and school intervention) and in doing so relies on data that are notas consistently or reliably recorded on NYC files. The MRAI categories read:“Enrolled, attending regularly, no suspensions; or, graduated or GED,”“Some truancy; suspended 1-2 times; considered somewhat disruptive,”“Major truancy or dropped out; suspended 3+ times; considered seriouslydisruptive.” This suggests that it may be important to focus on strongerlocally available data when adapting item constructs to local circumstances.
MRAI Predictive PerformanceCompared to Clinical Judgment
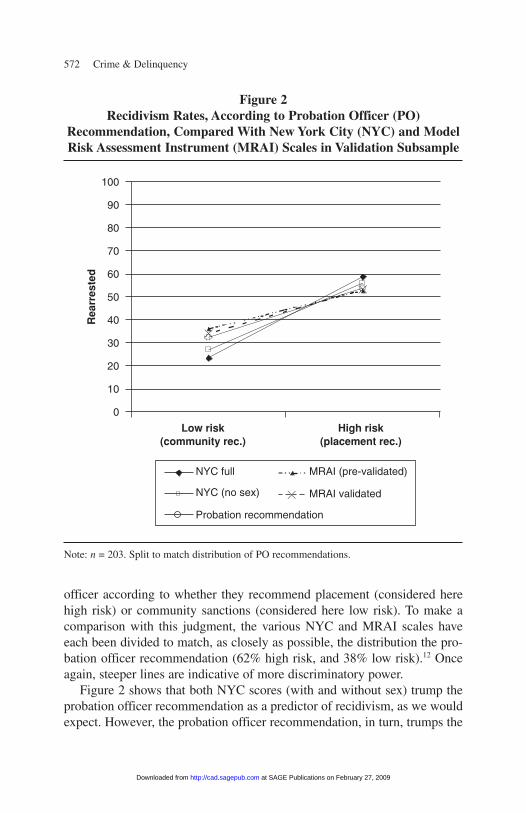
As we have already noted, our ability to make a comparison with clinicaljudgment is qualified by the fact that our benchmark comparison is not apure subjective assessment of risk. Instead, we rely on probation officers’recommendations, which reflect concern in significant part with risk but alsowith welfare and perhaps bureaucratic considerations, which may dilute themeasure. Figure 2 provides a measure of recidivism rates of the probation
Miller, Lin / Generic Juvenile Risk Assessment 571
at SAGE Publications on February 27, 2009 http://cad.sagepub.comDownloaded from
572 Crime & Delinquency
officer according to whether they recommend placement (considered herehigh risk) or community sanctions (considered here low risk). To make acomparison with this judgment, the various NYC and MRAI scales haveeach been divided to match, as closely as possible, the distribution the pro-bation officer recommendation (62% high risk, and 38% low risk).12 Onceagain, steeper lines are indicative of more discriminatory power.
Figure 2 shows that both NYC scores (with and without sex) trump theprobation officer recommendation as a predictor of recidivism, as we wouldexpect. However, the probation officer recommendation, in turn, trumps the
Figure 2Recidivism Rates, According to Probation Officer (PO)
Recommendation, Compared With New York City (NYC) and ModelRisk Assessment Instrument (MRAI) Scales in Validation Subsample
Note: n = 203. Split to match distribution of PO recommendations.
0
10
20
30
40
50
60
70
80
90
100
Rea
rres
ted
Low risk(community rec.)
High risk(placement rec.)
NYC full
NYC (no sex)
MRAI (pre-validated)
MRAI validated
Probation recommendation
at SAGE Publications on February 27, 2009 http://cad.sagepub.comDownloaded from
MRAI both prior to and after it has been validated. This is surprising andless than reassuring. We would expect the MRAI to outperform the proba-tion officer’s judgment, at least after it has been validated and adjusted. Thisfailure is particularly damning given that, in this case, our measure of pro-bation officer judgment, if anything, understates true clinical risk assess-ment. Likely, the reasons for this are those documented above: The MRAIfails to include variables that are particularly relevant to the NYC context.
Conclusions
This article has explored the practical challenges that would likely beassociated with introducing a generic juvenile risk assessment tool—theMRAI—into NYC. It has highlighted some important issues that could use-fully guide researchers and practitioners in jurisdictions that may be con-templating such an approach and some broader theoretical lessons.
Importantly, this article has put to the test the proposition, often sug-gested or implied by proponents of generic tools (Juvenile Sanctions Center,2002; OJJDP, 1995; Orbis Partners, 2006), that taking a generic juvenile riskassessment tool in a prevalidated form and applying it in a new contextprobably does a reasonable job of predicting risk in that context and that itwill—after validation and adjustment—live up to the expectations of actu-arial risk assessment (i.e., it will predict recidivism with greater accuracythan clinical judgment). In this case, that promise has not been fulfilled.
A key observation of this research is that local NYC data are not alwaysavailable in the precise form required by the generic MRAI tool, so adap-tations and proxies were required to make the tool fit the local context. InNYC, this reflects real limitations to the kind of data that are available toprobation officers when they are required to assess juveniles and in turnreflects the character of records passed to them by others (e.g., education,child welfare, and justice agencies). There were also cases where informa-tion is simply missing—a normal occurrence in the imperfect environmentin which probation officers work—and this too presents challenges for fittingthe tool to the local environment. We also speculate that local sensibilitiesabout what kinds of information are appropriately used in an assessment toolmight also have clashed with the requirements of the imported tool were weto have tried to implement it for real.
Importantly, analysis shows that the MRAI generic tool applied tolocally available information does not match the predictive power of alocally developed NYC risk assessment tool, even after the former has been
Miller, Lin / Generic Juvenile Risk Assessment 573
at SAGE Publications on February 27, 2009 http://cad.sagepub.comDownloaded from
validated and adapted in the local context. Indeed, local validation gave riseto few gains in predictive power over the prevalidated version. More dis-turbingly, the generic tool, in both pre- and postvalidated forms, performsless well than the probation officers’ clinical judgment as embodied by theirdispositional recommendation court, a measure that probably understatestheir true ability to assess risk.
These shortcomings appear to reflect the fact that predictor variablesused by the generic MRAI tool—reflecting as they do the conventionalliterature on juvenile recidivism (e.g., Cottle et al., 2001; OJJDP, 1995)—have some overlap with, but also important differences from, locally effec-tive predictor variables. Notably, the MRAI excludes age, gender, andseverity of offense, which it turns out are locally powerful predictors. Onthe other hand, the MRAI (in its prevalidated form) includes variables thathave no predictive value or that predict recidivism in the opposite directionto that expected (age at first referral): Younger age at first referral in NYCis actually a marker of lower rather than higher recidivism, contrary to thatassumed by the MRAI and the juvenile recidivism literature more gener-ally. This is a curious finding that may reflect distinctive characteristics ofthe NYC juvenile delinquent population.
Like all case studies, it is not clear whether these findings would general-ize to other places and situations. However, case studies can alert us to someimportant theoretical concerns—and this study is no exception. First of all,the findings suggest that a tendency to look toward a universal model of juve-nile recidivism may actually obscure some of its important local characteris-tics, to which risk assessment needs to pay attention. To put this in practicalterms, a reliance on only a set of core variables that predict recidivism acrosssettings—such as those identified by meta-analysis (Cottle et al., 2001) orthose that tend to occur already on validated tools (OJJDP, 1995)—may actu-ally deflect attention from locally important, and perhaps idiosyncratic, pre-dictors. These might reflect legal differences (e.g., the legally defined agegroup of juvenile delinquents), but they might also relate to local institutionalarrangements, such as the way in which the local schooling environmentintersects with the juvenile justice system.
A further theoretical issue is the issue of item validity and reliability. Inaddition to examining the predictive power of risk items, much research isdevoted to the operationalization of item constructs to enhance validity andreliability, for example, focusing on the interrater reliability of measures, thatis, the extent to which different raters come to the same conclusions about thesame cases (e.g., Austin, Coleman, Peyton, & Johnson, 2003; Lowenkamp,Holsinger, Brusman-Lovins, & Latessa, 2004; Schmidt, Hoge, & Gomes,
574 Crime & Delinquency
at SAGE Publications on February 27, 2009 http://cad.sagepub.comDownloaded from
Miller, Lin / Generic Juvenile Risk Assessment 575
2005). However, fewer studies acknowledge or examine variations in relia-bility and validity across settings and jurisdictions—and in particular howdifferent institutional contexts may provide better or worse informationalresources on which raters can form judgments. This seems to be an area thatthe risk assessment field could significantly benefit. Once again, this maypoint theoretical development away from a rigid adherence to universalizeditem constructs and toward locally specific adaptations rooted in local prac-tices and informational resources.
On a practical level, our findings caution us against the wholesale uncrit-ical adoption of generic risk assessment tools into new environments, evenwith a commitment to downstream validation. This may still leave a juris-diction unable to improve on clinical judgment, even after validation workhas been completed. We suggest a couple of precautions to help avoid thisoutcome. First of all, taking the opportunity to capture a broader range ofdata in a prevalidation phase than a single tool provides might help—perhaps drawing on the hunches of local justice officials rather than the aca-demic literature alone. Second, practitioners should avoid a blind adherenceto generic tool items. Not only may it be unfeasible to complete the itemswith available information, but even with some available data, the genericmeasures may not always reliably get at an underlying concept of interest.Instead, efforts may be best directed to adapting generic tool items tolocally available information and practices—being mindful of which data,approximating concepts of interest, are most reliable.
Notes
1. It is important to note in reading this article that there has been no practical need for ageneric tool in the New York City (NYC) context given the development of the NYC localtool. Rather, this article uses data generated by the NYC research to retrospectively examineboth likely implementation issues and predictive efficacy of a generic tool, had one beenintroduced.
2. These settings include Arizona, Cuyahoga County (Ohio), District of Columbia,Indiana, Maryland, Michigan, Missouri, Nebraska, New Mexico, Oklahoma, Rhode Island,Travis County (Texas), and Virginia.
3. The sample of juvenile delinquents does not include the most serious offenders (termedjuvenile offenders in New York) who commit 1 or more of 15 specified felonies (e.g., murder)and whose cases are waived to adult criminal court.
4. We should acknowledge two caveats about the representativeness of this sample. First, weknow, in practice, that a few juvenile cases were processed in other parts that were not specializedin juvenile delinquency. Based on our conversations with court officials, however, we came tobelieve that this is true in only a small minority of cases—though we could not actually quantify
at SAGE Publications on February 27, 2009 http://cad.sagepub.comDownloaded from

576 Crime & Delinquency
it. A second constraint is that the 3-month period in question (at the end of the school year) maybe affected by seasonal variation, which means it may look slightly different from a sample drawnfrom a whole year. We have no reason to believe the differences across the year are profound, butinsofar as there is variation, the period we sampled is probably more typical of the year in generalthan, say, a period when children would have been on vacation from school.
5. Clear, Wasson, and Rowland (1998) state that an estimation subsample should aim toinclude at least 50 cases for each predictor variable. This meant our subsample would providesufficient statistical power to support a model with up to 10 predictor variables.
6. Various other approaches have been taken to produce scoring systems for risk prediction(S. D. Gottfredson, 1987). These include the Burgess method, in which predictor variablesfrom bivariate correlations are each given a single point, with a final risk score representingthe sum of these scores (Burgess, 1928). Other approaches rely on applying a standard unitaryscore for predictor values based on regression techniques, regardless of coefficient size(Wainer, 1976). Others have also used clustering techniques to differentiate different cate-gories of offenders (e.g., Brennan, 1987). In practice, the research literature suggests there islittle difference in predictive power among these and other methods (S. D. Gottfredson &Gottfredson, 1979; Simon, 1971; Tarling & Perry, 1985).
7. We examined age as a categorical and continuous variable, but although the variable wasalways significant, individual binary variables representing different age ranges, as part of a cat-egorical variable, typically were not. We therefore chose to include it as a continuous variable,with some modifications. Importantly, in our bivariate analysis of age, we found that, despitean increase in recidivism with age, the relationship between the two variables was slightly Sshaped, with recidivism rates level for 11 years and younger and also for 15 years and older.For this reason, the continuous variable was recoded so that all cases older than 15 years wererepresented as 15 years, and all cases younger than 11 years were represented as 11 years.
8. Omitting gender would have led to many girls with low risk of recidivism being re-commended for institutional confinement because of their misleading assessment as high risk.
9. For example, for 17% of cases, we had missing school attendance information. We gavethese cases the same variable value as those who attended school more than 10% of the timebut less than 90% of the time because their recidivism rates were very similar: 44% of the miss-ing group were rearrested within 18 months compared to 47% among this category of truants.
10. In practice, these scales had some negative values. In the article, we describe the low-est values, whether negative or zero, as having no points, and the other point allocations aredescribed relative to the lowest value. This means that if a question includes a category of –1and a second category as 1, here we report this as 0 and 2.
11. Similarly, with out-of-home placements, we were not able to distinguish in our databetween separate placement episodes. Instead, we were able to count placements of differenttypes (i.e., child welfare placement, state placement in state facilities, state placement in con-tract facilities), which we felt was likely to be a close approximation of the number of place-ments. Once again, however, systematic data that counted different placement episodes wererarely available on file, and accounts of placement episodes with child welfare were primarilyanecdotal rather than based on systematically recorded data. Again, it is unlikely had we goneback to the original files that we would have been able to fill out the Model Risk AssessmentInstrument (MRAI) with much greater precision than we could from our research data set.
12. In practice exact cutpoints varied a little because the distributions of each scale scoredid not allow being cut precisely. Thus, the high-risk category ranged from 63% of cases (inthe NYC no-sex tool) to 56% in the prevalidated MRAI.
at SAGE Publications on February 27, 2009 http://cad.sagepub.comDownloaded from
References
Andrews, D. A. (1989). Re-arrest is predictable and can be influenced: Using risk assessmentsto reduce re-arrest. Forum on Corrections Research, 1, 11-18.
Andrews, D. A., Bonta, J., & Wormith, J. S. (2006). The recent past and near future of riskand/or need assessment. Crime & Delinquency, 52, 7-27.
Ashford, J. B., & LeCroy, C. W. (1990). Juvenile recidivism: A comparison of three predictioninstruments. Adolescence, 98, 441-450.
Assessments.com. (2006). Assessment catalog. Retrieved June 7, 2006, from http://www.assessments.com/purchase/category.asp?cid=3&cl=2
Austin, J., Coleman, D., Peyton, J., & Johnson, K. D. (2003). Reliability and validity study ofthe LSI-R risk assessment instrument. Washington, DC: George Washington University.
Baird, S. C. (1984). Classification of juveniles in corrections: A model systems approach. Madison,WI: National Council on Crime and Delinquency.
Bonta, J. (1996). Risk-Needs Assessment and Treatment. In A. T. Harland (Ed.), Choosing cor-rectional interventions that work: Defining the demand and evaluating the supply (pp. 18-32).Thousand Oaks, CA: Sage.
Brennan, T. (1987). Classification methods in criminology. In D. M. Gottfredson & M. Tonry(Eds.), Prediction and classification: Criminal justice decision making, Vol. 9, Crime andjustice: A review of research (pp. 201-248). Chicago: University of Chicago Press.
Burgess, E. W. (1928). Factors determining success or failure on parole. In A. A. Bruce, E. W.Burgess, & A. J. Harno (Eds.), The workings of the indeterminate sentence law and theparole system in Illinois (pp. 221-234). Springfield: Illinois State Board of Parole.
Carroll, J. S., Wiener, R. L., Coates, D., Galegher, J., & Alibrio, J. J. (1982). Evaluation, diag-nosis, and prediction in parole decision making. Law and Society Review, 17, 199-228.
Carter, R. M., & Wilkins, L. T. (1967). Some factors in sentencing policy. Journal of CriminalLaw, Criminology, and Police Science, 58, 503-514.
Clear, T., Wasson, B. F., & Rowland, J. (1988). Statistical prediction in corrections. Researchin Corrections, 1, 1-52.
Cottle, C. C., Lee, R. J., & Heilbrun, K. (2001). The prediction of criminal recidivism in juve-niles: A meta-analysis. Criminal Justice and Behavior, 28, 367-394.
Dawes, R. M., Faust, D., & Meehl, P. E. (1989). Clinical versus actuarial judgment. Science,243, 1644-1673.
Flores, A. W., Travis, L. F., & Latessa, E. J. (2004) Case classification for juvenile corrections:An assessment of the Youth Level of Service/Case Management Inventory (YLS/CMI),Executive summary (98-JB-VX-0108). Washington, DC: U.S. Department of Justice.
Gambrill, E., & Shlonsky, A. (2000). Risk assessment in context. Children and Youth ServicesReview, 22, 813-839.
Gavazzi, S. M., Slad, D., Buettner, C. K., Partridge, C., Yarcheck, C. M., & Andrews, D. W.(2003). Toward conceptual development and empirical measurement of global risk indica-tors in the lives of court-involved youth. Psychological Reports, 92, 599-615.
Gendreau, P., Goggin, C., & Little, T. (1996). A meta-analysis of the predictors of adultoffender recidivism: What works? Criminology, 34, 575-607.
Glaser, D. (1955). The efficacy of alternative approaches to parole prediction. AmericanSociological Review, 20, 283-287.
Glaser, D. (1962). Prediction tables as accounting devices for judges and parole boards. Crime& Delinquency, 8, 239-258.
Miller, Lin / Generic Juvenile Risk Assessment 577
at SAGE Publications on February 27, 2009 http://cad.sagepub.comDownloaded from
Glueck, S., & Glueck, E. (1950). Unraveling juvenile delinquency. New York: Commonwealth.Gottfredson, D. M., & Beverly, R. F. (1962). Development and operational use of prediction
methods in correctional work. Proceedings of the Social Statistics Section. Washington,DC: American Statistical Association.
Gottfredson, M. R., & Gottfredson, D. M. (1984). Decision making in criminal justice: Towarda rational exercise of discretion. New York: Plenum.
Gottfredson, S. D. (1987). Prediction: Methodological issues. In D. M. Gottfredson &M. Tonry (Eds.), Prediction and classification: Criminal justice decision making, Vol. 9,Crime and justice: A review of research (pp. 29-33). Chicago: University of Chicago.
Gottfredson, S. D., & Gottfredson, D. M. (1979). Screening for risk: A comparison of meth-ods. Washington, DC: National Institute of Corrections.
Gottfredson, S. D., & Moriarty, L. J. (2006). Statistical risk assessment: Old problems and newapplications. Crime & Delinquency, 52, 178-200.
Grove, W. M., Zald, D. H., Lebow, B. S., Snitz, B. E., & Nelson, C. (2000). Clinical versusmechanical prediction: A meta-analysis. Psychological Assessment, 12, 19-30.
Hawkins, J. D., Herrenkohl, T. L., Farrington, D. P., Brewer, D., Catalano, R. F., & Harachi,T. W. (1998). A review of predictors of youth violence. In R. Loeber & D. P. Farrington(Eds.), Serious and violent juvenile offenders: Risk factors and successful interventions(pp. 106–146). Thousand Oaks, CA: Sage.
Herrenkohl, T. L., Maguin, E., Hill, K. G., Hawkins, J. D., Abbott, R. D., & Catalano, R. F. (2000).Developmental risk factors for youth violence. Journal of Adolescent Health, 26, 176–186.
Hodge, R. D., & Andrews, D. A. (1999). The Youth Level of Service/Case ManagementInventory and manual. Ottawa, Ontario, Canada: Carleton University, Department ofPsychology.
Holland, T. R., Holt, N., Levi, M., & Beckett, G. E. (1983). Comparison and combination ofclinical and statistical predictions of recidivism among adult offenders. Journal of AppliedPsychology, 68, 203-211.
Hood, R. (1966). A study of the effectiveness of pre-sentence investigations in reducing recidi-vism. British Journal of Criminology, 6, 303-310.
Johnson, K., Wagner, D., & Matthews, T. (2002). Missouri juvenile risk assessment re-valida-tion report. Wisconsin: National Council on Crime and Delinquency.
Juvenile Sanctions Center. (2002). Structured decision making for graduated sanctions.Training and Technical Assistance Program, 1, 2.
Klein, S. P., & Caggiano, M. N. (1986). The prevalence, predictability, and policy implicationsof recidivism. Santa Monica, CA: RAND.
Krysik, J., & LeCroy, C. W. (2002). The empirical validation of an instrument to predict riskof recidivism among juvenile offenders. Research on Social Work Practice, 12, 71-81.
LeCroy, C. W., Krysik, J., & Palumbo, D. (1998). Empirical validation of the Arizona Risk/Needs instrument and assessment process. Phoenix, AZ: LeCroy & Milligan.
Lipsey, M., & Derzon, J. H. (1998). Predictors of serious delinquency in adolescence and earlyadulthood: A synthesis of longitudinal research. In R. Loeber & D. P. Farrington (Eds.),Serious and violent juvenile offenders: Risk factors and successful interventions (pp. 86-105). Thousand Oaks, CA: Sage.
Loeber, R., Farrington, D. P., Stouthamer-Loeber, M., Moffitt, T. E., & Caspi, A. (1998). Thedevelopment of male offending: Key findings from the first decade of the Pittsburgh YouthStudy. Studies in Crime and Crime Prevention, 7, 141–172.
Loeber, R., & Stouthamer-Loeber, M. (1987). Prediction. In H. C. Quay (Ed.), Handbook ofjuvenile delinquency (pp. 325-383). New York: John Wiley.
578 Crime & Delinquency
at SAGE Publications on February 27, 2009 http://cad.sagepub.comDownloaded from

Lowenkamp, C. T., Holsinger, A. M., Brusman-Lovins, L., & Latessa, E. J. (2004). Assessingthe inter-rater agreement of the Level of Service Inventory Revised. Federal Probation, 68,34-38.
Marczyk, G. R., Heilbrun, K., Lander, T., & DeMatteo, D. S. (2003). Predicting juvenilerecidivism with the PCL-YV, MAYSI, and YLS-CMI. International Journal of ForensicMental Health, 2, 7-18.
McCord, J., Widom, C. S., & Crowell, N. A. (Eds.). (2001). Juvenile crime, juvenile justice.Panel on juvenile crime: Prevention, treatment, and control. Washington, DC: NationalAcademy Press.
Moffit, T. (1993). Adolescent-limited and life-course-persistent antisocial behavior: A devel-opmental taxonomy. Psychological Review, 100, 674-701.
Neubauer, D. W. (1974). Criminal justice in middle America. Morristown, NJ: GeneralLearning Press.
Office of Juvenile Justice Delinquency Planning. (1995). Guide for implementing the compre-hensive strategy for serious, violent and chronic juvenile offenders. Washington, DC: U.S.Department of Justice
Office of Juvenile Justice Delinquency Planning. (2005). The mathematics of risk classifica-tion: Changing data into valid instruments for juvenile courts. Washington, DC: U.S.Department of Justice.
Orbis Partners. (2006). Welcome. Retrieved June 7, 2006, from http://www.orbispartners.com/frame.htm
Risler, E. A., Sutphen, R., & Shields, J. (2000). Preliminary validation of the juvenile firstoffender risk assessment index. Research on Social Work Practice, 10, 111-126.
Rodríguez-Labarca, J., & O’Connell, J. P. (2005). Delaware juvenile recidivism: 1994-2004Juvenile Level III, IV and V Recidivism Study. Dover: State of Delaware, Office of theBudget, Statistical Analysis Center.
Rosecrance, J. (1985). The probation officers’ search for credibility: Ball park recommenda-tions. Crime & Delinquency, 31, 539-554.
Schmidt, F., Hoge, R. D., & Gomes, L. (2005). Reliability and validity analyses of the youthlevel of service/case management inventory. Criminal Justice and Behavior, 32, 329-344.
Schwalbe, C., Day, S., & Fraser, M. (2002). Risk assessment in the juvenile justice system(Web report). Chapel Hill: University of North Carolina.
Simon, F. (1971). Prediction methods in criminology. London: HMSO.Tarling, R., & Perry, J. (1985). Statistical models in criminological prediction. In D. Farrington
& R. Tarling (Eds.), Prediction in criminology (pp. 210-231). Albany: State University ofNew York.
Tremblay, R. E., & LeMarquand, D. (2001). Individual risk and protective factors. InR. Loeber & D. P. Farrington (Eds.), Child delinquents: Development, intervention, andservice needs (pp. 137–164). Thousand Oaks, CA: Sage.
Turner, S., Fain, T., & Sehgal, A. (2005). Validation of the risk and resiliency assessment toolfor juveniles in the Los Angeles County probation system. Santa Monica, CA: RAND.
Wainer, H. (1976). Estimating coefficients in linear models: It don’t make no nevermind.Psychological Bulletin, 83, 312-317.
Washington State Institute for Public Policy. (2004). Assessing risk for re-offense: Validatingthe Washington State juvenile court assessment. Olympia: Author.
Wasserman, G. A., & Seracini, A. G. (2001). Family risk factors and interventions. InR. Loeber & D. P. Farrington (Eds.), Child delinquents: Development, intervention, andservice needs (pp. 165–189). Thousand Oaks, CA: Sage.
Miller, Lin / Generic Juvenile Risk Assessment 579
at SAGE Publications on February 27, 2009 http://cad.sagepub.comDownloaded from

580 Crime & Delinquency
Wiebush, R. G., Baird, C., Krisberg, B., & Onek, D. (1995). Risk assessment and classifica-tion for serious, violent, and chronic juvenile offenders. In J. C. Howell, B. Krisberg, J. D.Hawkins, & J. J. Wilson (Eds.), A sourcebook: Serious, violent, & chronic juvenile offend-ers (pp. 171-210). Thousand Oaks, CA: Sage.
Wright, K. N., Clear, T. R., & Dickinson, P. (1984). Universal applicability of probation riskassessment instruments. Criminology, 22, 113-134.
Joel Miller is a visiting professor of criminology at the University of Málaga. He has previ-ously held senior research positions at the Vera Institute of Justice, New York, and the HomeOffice of the UK government. He has carried out research on police accountability, juvenilejustice, probation, and crime and violence prevention. He has a PhD in sociology from theUniversity of Surrey, England.
Jeffrey Lin is a postdoctoral scholar at the University of California, Irvine’s Center forEvidence-Based Corrections. His research interests include parole supervision, offender reen-try, and juvenile justice. He previously worked as a research associate at the Vera Institute ofJustice, where he conducted research on juvenile justice, adult corrections, and family home-lessness. He has a PhD in sociology from New York University.
at SAGE Publications on February 27, 2009 http://cad.sagepub.comDownloaded from