Criando startups globais
56
Criando Startup Globais Estrategias de guerrilha para entrar no mercado internacional
Transcript of Criando startups globais

Criando Startup Globais
Estrategias de guerrilha para entrar no mercado
internacional

Um pouco de história…

Ano de 1807

Década de 40

Década de 90

Efeitos gerados hoje
1. Foco no mercado nacional
2. Sucateamento da industria nacional
3.Poucos cases de sucesso internacionais
4.Distanciamento do mercado mundial
5. Cultura fechada
6. Dificuldade com línguas estrangeiras
7. Baixa índice de inovação

7
8
0 10 20 30 40 50
1. Hong Kong SAR (China) (0)
2. Singapore (0)
3. Luxembourg (0)
4. Ireland (0)
5. Belgium (+1)
6. Netherlands (-1)
7. Malta (0)
8. Malaysia (+2)
9. Bahrain (+9)
10. Estonia (-2)
11. United Arab Emirates (0)
12. Switzerland (-3)
12. Hungary (+3)
14. Austria (-1)
15. Panama (-3)
16. Sweden (-2)
17. Denmark (+2)
18. Lebanon (+3)
19. Czech Republic (+12)
20. Slovenia (0)
21. Iceland (+3)
22. Lithuania (+5)
23. Guyana (+2)
24. Mauritius (-1)
25. Taiwan (China) (-9)
26. Latvia (+11)
27. Slovak Republic (+1)
28. Bahamas, The (+5)
29. Trinidad and Tobago (-3)
30. Mongolia (-8)
31. Barbados (-1)
32. Bulgaria (0)
33. Cyprus (-16)
34. Norway (-5)
35. Thailand (-1)
36. Finland (+2)
37. Cambodia (+3)
38. Germany (-3)
39. Oman (+7)
40. Brunei Darussalam (+3)
41. Jordan (-5)
42. Israel (-3)
43. Korea, Republic (+1)
44. Vietnam (-2)
45. Canada (0)
46. Portugal (+4)
47. Macedonia, FYR (0)
48. United Kingdom (-7)
49. Poland (-1)
50. Qatar (+3)
51. Kuwait (0)
52. Ukraine (+3)
53. Moldova (-1)
54. France (+2)
55. Georgia (+18)
56. Chile (-2)
57. Croatia (-8)
58. Serbia (+5)
59. Fiji (-2)
60. Kazakhstan (+2)
61. Nicaragua (+4)
62. New Zealand (-3)
63. Zimbabwe (-3)
64. Spain (+4)
65. Belarus (+2)
66. Albania (0)
67. Saudi Arabia (-9)
68. Jamaica (-7)
69. Namibia (-5)
70. Honduras (-1)
0 10 20 30 40 50
71. Italy (+1)
72. Tunisia (-1)
73. Costa Rica (+1)
74. Togo (-4)
75. Bosnia & Herzegovina (+2)
76. Kyrgyz Republic (+3)
77. Côte d'Ivoire (+8)
78. Morocco (+2)
79. Zambia (-1)
80. Botswana (-4)
81. Australia (-6)
82. Romania (-1)
83. South Africa (-1)
84. Armenia (0)
85. Mexico (+4)
86. Azerbaijan (+2)
87. Gabon (-1)
88. Greece (+3)
89. Guinea (-2)
90. Ghana (-7)
91. United States (-1)
92. El Salvador (+4)
93. Niger (+5)
94. Angola (+1)
95. Russian Federation (-1)
96. Mozambique (+3)
97. Senegal (+5)
98. Nigeria (-5)
99. Chad (-7)
100. Dominican Republic (0)
101. Paraguay (-4)
102. Peru (-1)
103. Bolivia (+2)
104. Malawi (+9)
105. Uruguay (+1)
106. Turkey (+1)
107. Guatemala (-4)
108. Ecuador (-4)
109. Yemen, Republic (-1)
110. Kenya (-1)
111. Philippines (+5)
112. Syria (0)
113. Japan (+1)
114. Lao PDR (-4)
115. Colombia (0)
116. Madagascar (+4)
117. Mali (-6)
118. Egypt, Arab Republic (+1)
119. Benin (-1)
120. Uganda (-3)
121. Sri Lanka (0)
122. China (0)
123. India (0)
124. Cameroon (+2)
125. Burkina Faso (+3)
126. Rwanda (+1)
127. Indonesia (+2)
128. Argentina (-3)
129. Uzbekistan (-5)
130. Brazil (0)
131. Venezuela, RB (0)
132. Ethiopia (0)
133. Nepal (+1)
134. Central African Republic (+2)
135. Burundi (+2)
136. Pakistan (-3)
137. Bangladesh (-2)
138. Myanmar (+1)
139. Iran, Islamic Republic (-1)
Figure 6.1The Depth Index of Globalization 2013, Overall Results (Parentheticals Reflect Rank Changes versus Prior Year)
87 6. Country Scores and Ranks
0 10 20 30 40 50
1. Hong Kong SAR (China) (0)
2. Singapore (0)
3. Luxembourg (0)
4. Ireland (0)
5. Belgium (+1)
6. Netherlands (-1)
7. Malta (0)
8. Malaysia (+2)
9. Bahrain (+9)
10. Estonia (-2)
11. United Arab Emirates (0)
12. Switzerland (-3)
12. Hungary (+3)
14. Austria (-1)
15. Panama (-3)
16. Sweden (-2)
17. Denmark (+2)
18. Lebanon (+3)
19. Czech Republic (+12)
20. Slovenia (0)
21. Iceland (+3)
22. Lithuania (+5)
23. Guyana (+2)
24. Mauritius (-1)
25. Taiwan (China) (-9)
26. Latvia (+11)
27. Slovak Republic (+1)
28. Bahamas, The (+5)
29. Trinidad and Tobago (-3)
30. Mongolia (-8)
31. Barbados (-1)
32. Bulgaria (0)
33. Cyprus (-16)
34. Norway (-5)
35. Thailand (-1)
36. Finland (+2)
37. Cambodia (+3)
38. Germany (-3)
39. Oman (+7)
40. Brunei Darussalam (+3)
41. Jordan (-5)
42. Israel (-3)
43. Korea, Republic (+1)
44. Vietnam (-2)
45. Canada (0)
46. Portugal (+4)
47. Macedonia, FYR (0)
48. United Kingdom (-7)
49. Poland (-1)
50. Qatar (+3)
51. Kuwait (0)
52. Ukraine (+3)
53. Moldova (-1)
54. France (+2)
55. Georgia (+18)
56. Chile (-2)
57. Croatia (-8)
58. Serbia (+5)
59. Fiji (-2)
60. Kazakhstan (+2)
61. Nicaragua (+4)
62. New Zealand (-3)
63. Zimbabwe (-3)
64. Spain (+4)
65. Belarus (+2)
66. Albania (0)
67. Saudi Arabia (-9)
68. Jamaica (-7)
69. Namibia (-5)
70. Honduras (-1)
0 10 20 30 40 50
71. Italy (+1)
72. Tunisia (-1)
73. Costa Rica (+1)
74. Togo (-4)
75. Bosnia & Herzegovina (+2)
76. Kyrgyz Republic (+3)
77. Côte d'Ivoire (+8)
78. Morocco (+2)
79. Zambia (-1)
80. Botswana (-4)
81. Australia (-6)
82. Romania (-1)
83. South Africa (-1)
84. Armenia (0)
85. Mexico (+4)
86. Azerbaijan (+2)
87. Gabon (-1)
88. Greece (+3)
89. Guinea (-2)
90. Ghana (-7)
91. United States (-1)
92. El Salvador (+4)
93. Niger (+5)
94. Angola (+1)
95. Russian Federation (-1)
96. Mozambique (+3)
97. Senegal (+5)
98. Nigeria (-5)
99. Chad (-7)
100. Dominican Republic (0)
101. Paraguay (-4)
102. Peru (-1)
103. Bolivia (+2)
104. Malawi (+9)
105. Uruguay (+1)
106. Turkey (+1)
107. Guatemala (-4)
108. Ecuador (-4)
109. Yemen, Republic (-1)
110. Kenya (-1)
111. Philippines (+5)
112. Syria (0)
113. Japan (+1)
114. Lao PDR (-4)
115. Colombia (0)
116. Madagascar (+4)
117. Mali (-6)
118. Egypt, Arab Republic (+1)
119. Benin (-1)
120. Uganda (-3)
121. Sri Lanka (0)
122. China (0)
123. India (0)
124. Cameroon (+2)
125. Burkina Faso (+3)
126. Rwanda (+1)
127. Indonesia (+2)
128. Argentina (-3)
129. Uzbekistan (-5)
130. Brazil (0)
131. Venezuela, RB (0)
132. Ethiopia (0)
133. Nepal (+1)
134. Central African Republic (+2)
135. Burundi (+2)
136. Pakistan (-3)
137. Bangladesh (-2)
138. Myanmar (+1)
139. Iran, Islamic Republic (-1)
Figure 6.1The Depth Index of Globalization 2013, Overall Results (Parentheticals Reflect Rank Changes versus Prior Year)
87 6. Country Scores and Ranks
Tabela de Índice de Globalização - Dr. Pankaj Ghemawat and Steven A. Altman

9
0 10 20 30 40 50
1. Hong Kong SAR (China) (0)
2. Singapore (0)
3. Luxembourg (0)
4. Ireland (0)
5. Belgium (+1)
6. Netherlands (-1)
7. Malta (0)
8. Malaysia (+2)
9. Bahrain (+9)
10. Estonia (-2)
11. United Arab Emirates (0)
12. Switzerland (-3)
12. Hungary (+3)
14. Austria (-1)
15. Panama (-3)
16. Sweden (-2)
17. Denmark (+2)
18. Lebanon (+3)
19. Czech Republic (+12)
20. Slovenia (0)
21. Iceland (+3)
22. Lithuania (+5)
23. Guyana (+2)
24. Mauritius (-1)
25. Taiwan (China) (-9)
26. Latvia (+11)
27. Slovak Republic (+1)
28. Bahamas, The (+5)
29. Trinidad and Tobago (-3)
30. Mongolia (-8)
31. Barbados (-1)
32. Bulgaria (0)
33. Cyprus (-16)
34. Norway (-5)
35. Thailand (-1)
36. Finland (+2)
37. Cambodia (+3)
38. Germany (-3)
39. Oman (+7)
40. Brunei Darussalam (+3)
41. Jordan (-5)
42. Israel (-3)
43. Korea, Republic (+1)
44. Vietnam (-2)
45. Canada (0)
46. Portugal (+4)
47. Macedonia, FYR (0)
48. United Kingdom (-7)
49. Poland (-1)
50. Qatar (+3)
51. Kuwait (0)
52. Ukraine (+3)
53. Moldova (-1)
54. France (+2)
55. Georgia (+18)
56. Chile (-2)
57. Croatia (-8)
58. Serbia (+5)
59. Fiji (-2)
60. Kazakhstan (+2)
61. Nicaragua (+4)
62. New Zealand (-3)
63. Zimbabwe (-3)
64. Spain (+4)
65. Belarus (+2)
66. Albania (0)
67. Saudi Arabia (-9)
68. Jamaica (-7)
69. Namibia (-5)
70. Honduras (-1)
0 10 20 30 40 50
71. Italy (+1)
72. Tunisia (-1)
73. Costa Rica (+1)
74. Togo (-4)
75. Bosnia & Herzegovina (+2)
76. Kyrgyz Republic (+3)
77. Côte d'Ivoire (+8)
78. Morocco (+2)
79. Zambia (-1)
80. Botswana (-4)
81. Australia (-6)
82. Romania (-1)
83. South Africa (-1)
84. Armenia (0)
85. Mexico (+4)
86. Azerbaijan (+2)
87. Gabon (-1)
88. Greece (+3)
89. Guinea (-2)
90. Ghana (-7)
91. United States (-1)
92. El Salvador (+4)
93. Niger (+5)
94. Angola (+1)
95. Russian Federation (-1)
96. Mozambique (+3)
97. Senegal (+5)
98. Nigeria (-5)
99. Chad (-7)
100. Dominican Republic (0)
101. Paraguay (-4)
102. Peru (-1)
103. Bolivia (+2)
104. Malawi (+9)
105. Uruguay (+1)
106. Turkey (+1)
107. Guatemala (-4)
108. Ecuador (-4)
109. Yemen, Republic (-1)
110. Kenya (-1)
111. Philippines (+5)
112. Syria (0)
113. Japan (+1)
114. Lao PDR (-4)
115. Colombia (0)
116. Madagascar (+4)
117. Mali (-6)
118. Egypt, Arab Republic (+1)
119. Benin (-1)
120. Uganda (-3)
121. Sri Lanka (0)
122. China (0)
123. India (0)
124. Cameroon (+2)
125. Burkina Faso (+3)
126. Rwanda (+1)
127. Indonesia (+2)
128. Argentina (-3)
129. Uzbekistan (-5)
130. Brazil (0)
131. Venezuela, RB (0)
132. Ethiopia (0)
133. Nepal (+1)
134. Central African Republic (+2)
135. Burundi (+2)
136. Pakistan (-3)
137. Bangladesh (-2)
138. Myanmar (+1)
139. Iran, Islamic Republic (-1)
Figure 6.1The Depth Index of Globalization 2013, Overall Results (Parentheticals Reflect Rank Changes versus Prior Year)
87 6. Country Scores and Ranks
0 10 20 30 40 50
1. Hong Kong SAR (China) (0)
2. Singapore (0)
3. Luxembourg (0)
4. Ireland (0)
5. Belgium (+1)
6. Netherlands (-1)
7. Malta (0)
8. Malaysia (+2)
9. Bahrain (+9)
10. Estonia (-2)
11. United Arab Emirates (0)
12. Switzerland (-3)
12. Hungary (+3)
14. Austria (-1)
15. Panama (-3)
16. Sweden (-2)
17. Denmark (+2)
18. Lebanon (+3)
19. Czech Republic (+12)
20. Slovenia (0)
21. Iceland (+3)
22. Lithuania (+5)
23. Guyana (+2)
24. Mauritius (-1)
25. Taiwan (China) (-9)
26. Latvia (+11)
27. Slovak Republic (+1)
28. Bahamas, The (+5)
29. Trinidad and Tobago (-3)
30. Mongolia (-8)
31. Barbados (-1)
32. Bulgaria (0)
33. Cyprus (-16)
34. Norway (-5)
35. Thailand (-1)
36. Finland (+2)
37. Cambodia (+3)
38. Germany (-3)
39. Oman (+7)
40. Brunei Darussalam (+3)
41. Jordan (-5)
42. Israel (-3)
43. Korea, Republic (+1)
44. Vietnam (-2)
45. Canada (0)
46. Portugal (+4)
47. Macedonia, FYR (0)
48. United Kingdom (-7)
49. Poland (-1)
50. Qatar (+3)
51. Kuwait (0)
52. Ukraine (+3)
53. Moldova (-1)
54. France (+2)
55. Georgia (+18)
56. Chile (-2)
57. Croatia (-8)
58. Serbia (+5)
59. Fiji (-2)
60. Kazakhstan (+2)
61. Nicaragua (+4)
62. New Zealand (-3)
63. Zimbabwe (-3)
64. Spain (+4)
65. Belarus (+2)
66. Albania (0)
67. Saudi Arabia (-9)
68. Jamaica (-7)
69. Namibia (-5)
70. Honduras (-1)
0 10 20 30 40 50
71. Italy (+1)
72. Tunisia (-1)
73. Costa Rica (+1)
74. Togo (-4)
75. Bosnia & Herzegovina (+2)
76. Kyrgyz Republic (+3)
77. Côte d'Ivoire (+8)
78. Morocco (+2)
79. Zambia (-1)
80. Botswana (-4)
81. Australia (-6)
82. Romania (-1)
83. South Africa (-1)
84. Armenia (0)
85. Mexico (+4)
86. Azerbaijan (+2)
87. Gabon (-1)
88. Greece (+3)
89. Guinea (-2)
90. Ghana (-7)
91. United States (-1)
92. El Salvador (+4)
93. Niger (+5)
94. Angola (+1)
95. Russian Federation (-1)
96. Mozambique (+3)
97. Senegal (+5)
98. Nigeria (-5)
99. Chad (-7)
100. Dominican Republic (0)
101. Paraguay (-4)
102. Peru (-1)
103. Bolivia (+2)
104. Malawi (+9)
105. Uruguay (+1)
106. Turkey (+1)
107. Guatemala (-4)
108. Ecuador (-4)
109. Yemen, Republic (-1)
110. Kenya (-1)
111. Philippines (+5)
112. Syria (0)
113. Japan (+1)
114. Lao PDR (-4)
115. Colombia (0)
116. Madagascar (+4)
117. Mali (-6)
118. Egypt, Arab Republic (+1)
119. Benin (-1)
120. Uganda (-3)
121. Sri Lanka (0)
122. China (0)
123. India (0)
124. Cameroon (+2)
125. Burkina Faso (+3)
126. Rwanda (+1)
127. Indonesia (+2)
128. Argentina (-3)
129. Uzbekistan (-5)
130. Brazil (0)
131. Venezuela, RB (0)
132. Ethiopia (0)
133. Nepal (+1)
134. Central African Republic (+2)
135. Burundi (+2)
136. Pakistan (-3)
137. Bangladesh (-2)
138. Myanmar (+1)
139. Iran, Islamic Republic (-1)
Figure 6.1The Depth Index of Globalization 2013, Overall Results (Parentheticals Reflect Rank Changes versus Prior Year)
87 6. Country Scores and Ranks
Tabela de Índice de Globalização - Dr. Pankaj Ghemawat and Steven A. Altman

Por que internacionalizar?
1. Vantagem competitiva a longo prazo
2. Acesso as novidades e tendências mundiais
3. Mais força frente à concorrência desleal
4. Acesso a novas fontes de investimento
5. Aceleração do crescimento empresarial
6. Proteção contra crises e governos
7. Maior potencial para inovar

Internacionalização =
Inovação

Importâncias das startups
Praticamente não existe inovação que não venha através de uma startup.

13
"Startups são organizações temporárias designadas a encontrar um modelo de negócios que seja repetível e escalável".
Steve Blank

Dólar comercial a
USD = R$ 4,00!!!
Motivador a internacionalização

Mitos
1) Internacionalizar é uma opção.

Mitos
2) Conquistar primeiro o Brasil antes de ir para o mercado internacional

Mitos
3) Devo começar internacionalizando minha empresa

Mitos
4) Só grandes empresas internacionalizam

Mitos
5) Português é tendência, muitas pessoas falam ou a gente se vira no "portunhol" !!!

20

21

Mitos
6)Preciso de muitos recursos financeiros para uma experiência internacional

Ok, já entendi mas por onde começar?!!!

Internacionalização
1. Via programas governamentais 2. Programas de aceleração 3. Parcerias estratégicas 4. Eventos / Missões 5. Bootstrapping ou seja, por sua conta e risco.


Ótimo mas pra onde ir?

Vale do Silício!!!

Vale do Silício ???
1. Tem clientes nos EUA?
2. Vai abrir sua empresa no EUA?
3. Como vai lidar com a concorrência?
4. Como se diferenciar?
5. Como se sustentar no Vale?

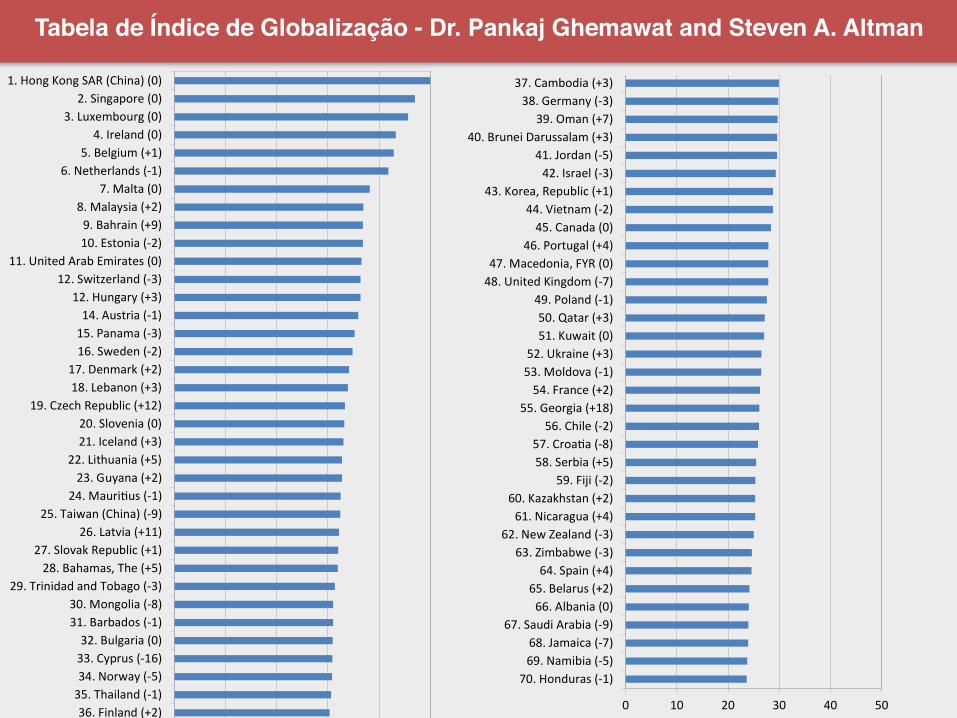
Regiões invisíveis

Regiões invisíveis

Imigração CSF
Países Alunos
Estados Unidos 5027
Portugal 2935
França 2692
Espanha 2464
Canadá 2145

BRICS
Países Alunos
Africa do Sul 9
China 6
India 2
Russia 1
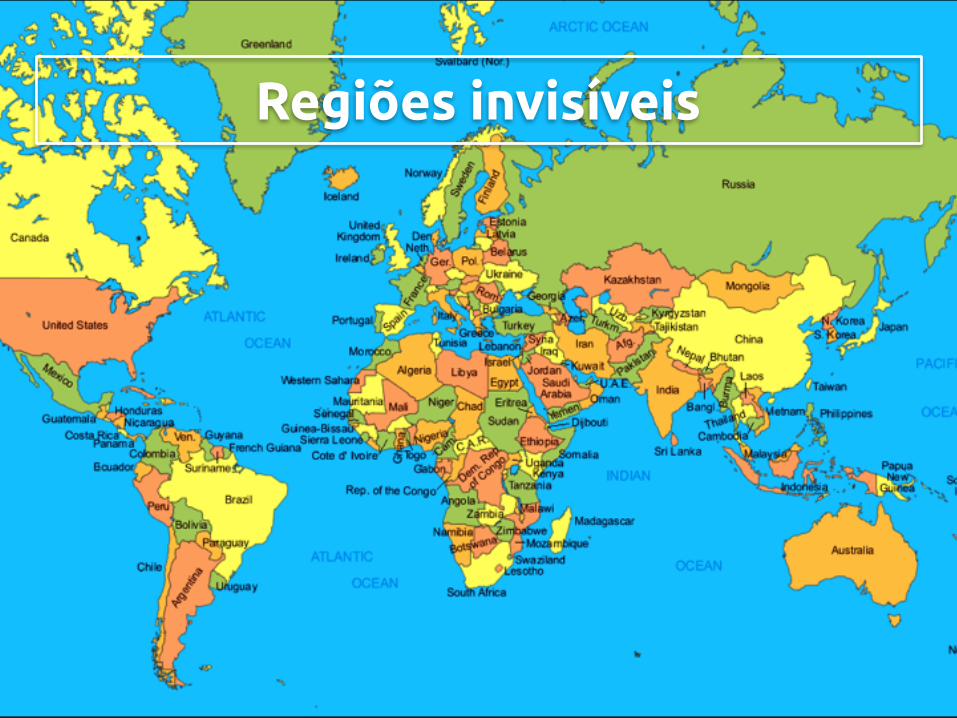
Goldman Sachs N11
Países Alunos
México 5
Turquia 6
Bangladesh, Nigéria, Egito, Paquistão, Indonésia, Filipinas, Iran, Vietnan e Coreia
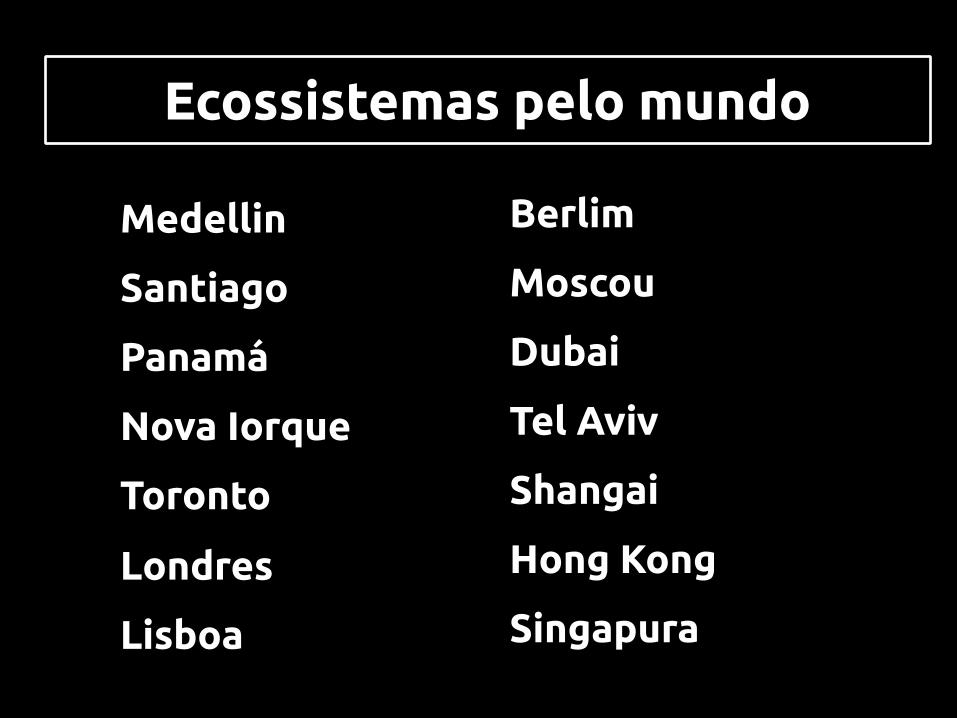
Ecossistemas pelo mundo
Medellin
Santiago
Panamá
Nova Iorque
Toronto
Londres
Lisboa
Berlim
Moscou
Dubai
Tel Aviv
Shangai
Hong Kong
Singapura

Por onde começo meu projeto de
internacionalização ???

Como "eu quero" internacionalizar

Como eu deveria pensar…

Lisboa

Lisboa
• Porta de entrada na Europa
• Quinto ecossistema de inovação da EU
• Querem ser o "Atlantic Startup Hub"
• Vencedora do prêmio: "Região
empreendedora européia do ano em
2015"
• Sede do Websummit 2016

Lisboa
• Diversos eventos internacionais
• Lisbon Challenge e Startup Lisboa
• Custo de vida mais barato
• Sem dificuldade com língua
• Mobilidade para vários países
• Diversos programas de inovação
• Cases de sucesso

Panamá

Panamá
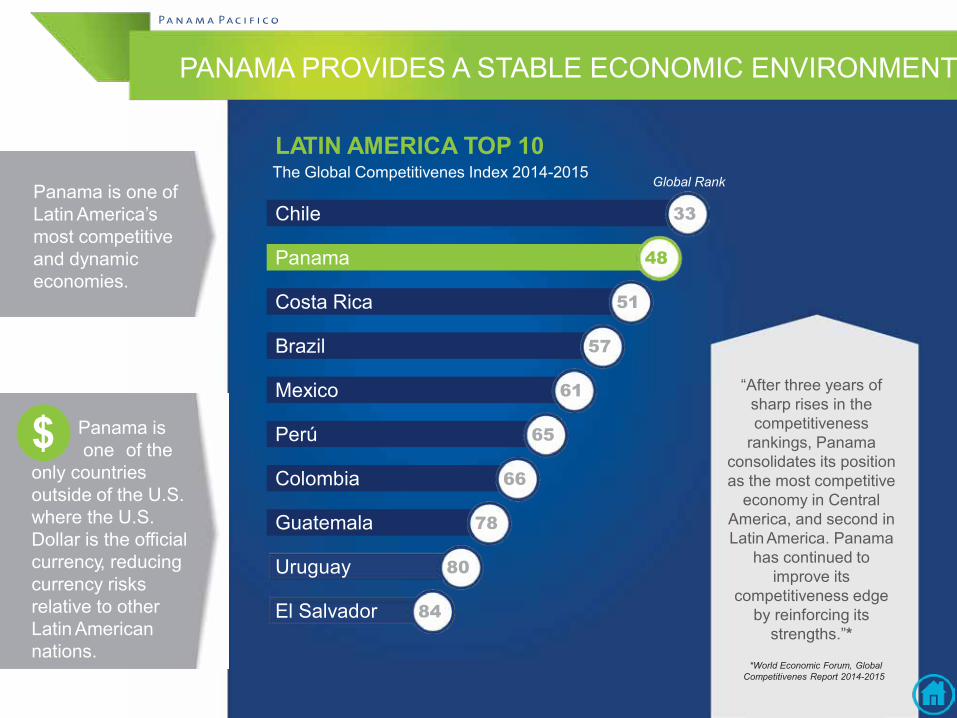
1. Economia mais competitivas e dinâmica da América Latina
2. Dólar como moeda oficial 3. Infraestrutura tecnológica 4. Um dos maiores hubs financeiros do mundo 5. Segunda maior zona de livre comercio do mundo 6. Aeroporto mais conectado das américas 7. Eleito país mais alegre do mundo 8. Zonas especiais com tarifas 0 de impostos
44
PANAMA PROVIDES A STABLE ECONOMIC ENVIRONMENT
“After three years of sharp rises in the competitiveness
rankings, Panama consolidates its position as the most competitive
economy in Central America, and second in Latin America. Panama
has continued to improve its
competitiveness edge by reinforcing its
strengths.”*
LATIN AMERICA TOP 10The Global Competitivenes Index 2014-2015
33
48
51
57
61
65
66
78
80
84
Chile
Panama
Costa Rica
Brazil
Mexico
Perú
Colombia
Guatemala
Uruguay
El Salvador
Global Rank
*World Economic Forum, Global Competitivenes Report 2014-2015
Panama is one of Latin America’s most competitive and dynamic economies.
Panama isone of the
only countries outside of the U.S. where the U.S. Dollar is the official currency, reducing currency risks relative to other Latin American nations.
$

45
PANAMA IS IDEAL FOR GLOBAL COMMUNICATIONS
Panama is an ideal place for businesses that rely onhigh-speed telecommunications
Panama is an important nodeof the world´s broadband ringand trunk route system
Through Panama pass the Maya-1, Arcos-1, SAC, MAC and the Pan American fiber optics submarine cables, through which passes 97% of international voice traffic, 90% of electronic data and 100% of regional Internet traffic.
MAYA 1
ARCOS 1
SAC 1
PAN AMERICAN
MAC

46
PANAMA HAS THE MOST CONNECTED INTERNATIONAL AIRPORT IN LATIN AMERICA
Top airportsin LatAm & the Caribbean# of international flights*
Pan
ama
City
(PTY
)
110,
306
San
Juan
(SIU
)
106,
14M
exic
oC
ity(M
EX)
90,8
44S
aoP
aulo
(GR
U)
71,7
16C
ancu
n(C
UN
)
66,3
50
*Source: Latin American and Caribbean AirTransport Association (ALTA), 2014
Tocumen Airport offers the
highest number of direct
international flights in Latin
America:
PTY
47
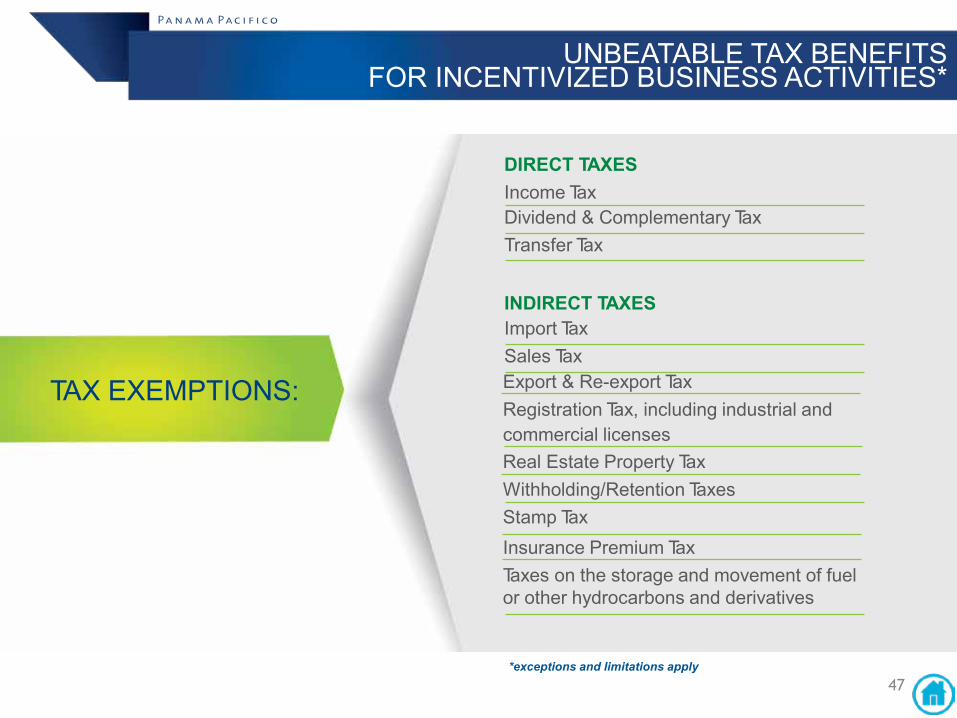
Real Estate Property Tax Withholding/Retention Taxes Stamp TaxInsurance Premium TaxTaxes on the storage and movement of fuel or other hydrocarbons and derivatives
UNBEATABLE TAX BENEFITSFOR INCENTIVIZED BUSINESS ACTIVITIES*
*exceptions and limitations apply
TAX EXEMPTIONS:
DIRECT TAXESIncome TaxDividend & Complementary Tax Transfer Tax
INDIRECT TAXESImport Tax Sales TaxExport & Re-export Tax Registration Tax, including industrial andcommercial licenses

48
INTERNATIONAL BUSINESS PARK
130+ COMPANIES
26 HECTARES
FUTURE PLAN: 16 CLASS A OFFICE BUILDINGS
8 BUILDINGS 100% DELIVERED
URBAN PLANNING BASED ON INTERNATIONAL BEST PRACTICES
BUSINESS CLUSTERS
Business Services
Logistics
Manufacturing
Maritime-AviationIndustryServices
Retail
42%
19%
19%
15%5%


Contatos
Cultivatech.com.br
Facebook / leouchoa
WhatsApp (11) 97687-2516