Crestmont Research - WordPress.com · term direction or trends; Crestmont Research focuses on ......
20
Page 1 of 20 The P/E Report: Quarterly Review Of The Price/Earnings Ratio By Ed Easterling July 7, 2017 Update All Rights Reserved AS OF: JUN 30, 2017 REPORTED ADJUSTED 1 CRESTMONT 2 “P” Closing Price (S&P 500 Index) 3 2423 2423 2423 “E” Current Estimate (S&P 500 EPS) 4 $106 $82 $81 P/E Price/Earnings Ratio 5 23.0 29.7 29.8 Notes: (1) adjusted using the methodology popularized by Robert Shiller (Yale; Irrational Exuberance), as modified for quarterly data (2) based upon historical relationship of EPS and GDP as described in chapters 5 & 7 of Probable Outcomes and chapter 7 of Unexpected Returns; useful for predicting future business cycle-adjusted EPS (3) S&P 500 Index is the value at the date listed in the table (4) ‘Reported’ is based upon actual net income for the past year (trailing four quarters); ‘Adjusted’ is an inflation-adjusted multi-year average; ‘Crestmont’ see note 2 (5) P divided by E Copyright 2008-2017, Crestmont Research (www.CrestmontResearch.com) CURRENT STATUS (Second Quarter 2017) In the second quarter, the stock market added 2.9% for a cumulative 8.2% gain in the first half, well more than underlying economic growth. As a result, normalized P/E increased to 29.8—significantly above the level justified by low inflation and low interest rates. The current status remains “significantly overvalued.” The level of volatility remained low over the past quarter. The VIX, a recognized index of stock market volatility, has had seven days below 10 this year. That’s the same number of days below 10 as all prior years since inception in 1990. It’s an eerie calm in the markets. The trend in reported earnings for the S&P 500 Index reflects a repeating pattern of overly- optimistic analysts’ forecasts. Earnings and volatility should be watched closely and investors should heighten their sensitivity to the risks confronting an increasingly vulnerable market. NOTE: Crestmont Research does not analyze the stock market or interest rates with a perspective about near- term direction or trends; Crestmont Research focuses on a longer-term, bigger picture view of market history and its fundamental drivers. Occasionally, the analysis indicates that a position has extended beyond the typical range of variation. In those times, the view can have relatively shorter-term implications. Also in those times, however, markets can take a path that is longer and farther than most investors expect before ultimately being restored toward the midrange position of balance of condition. Crestmont Research
-
Upload
truongxuyen -
Category
Documents
-
view
220 -
download
6
Transcript of Crestmont Research - WordPress.com · term direction or trends; Crestmont Research focuses on ......
Page 1 of 20
The P/E Report: Quarterly Review Of The Price/Earnings Ratio By Ed Easterling July 7, 2017 Update All Rights Reserved
AS OF: JUN 30, 2017 REPORTED ADJUSTED1 CRESTMONT2
“P” Closing Price (S&P 500 Index)3 2423 2423 2423
“E” Current Estimate (S&P 500 EPS)4 $106 $82 $81 P/E Price/Earnings Ratio5 23.0 29.7 29.8 Notes: (1) adjusted using the methodology popularized by Robert Shiller (Yale; Irrational Exuberance), as modified for quarterly data (2) based upon historical relationship of EPS and GDP as described in chapters 5 & 7 of Probable Outcomes and chapter 7 of Unexpected Returns; useful for predicting future business cycle-adjusted EPS (3) S&P 500 Index is the value at the date listed in the table (4) ‘Reported’ is based upon actual net income for the past year (trailing four quarters); ‘Adjusted’ is an inflation-adjusted multi-year average; ‘Crestmont’ see note 2 (5) P divided by E
Copyright 2008-2017, Crestmont Research (www.CrestmontResearch.com)
CURRENT STATUS (Second Quarter 2017) In the second quarter, the stock market added 2.9% for a cumulative 8.2% gain in the first half, well more than underlying economic growth. As a result, normalized P/E increased to 29.8—significantly above the level justified by low inflation and low interest rates. The current status remains “significantly overvalued.” The level of volatility remained low over the past quarter. The VIX, a recognized index of stock market volatility, has had seven days below 10 this year. That’s the same number of days below 10 as all prior years since inception in 1990. It’s an eerie calm in the markets. The trend in reported earnings for the S&P 500 Index reflects a repeating pattern of overly-optimistic analysts’ forecasts. Earnings and volatility should be watched closely and investors should heighten their sensitivity to the risks confronting an increasingly vulnerable market. NOTE: Crestmont Research does not analyze the stock market or interest rates with a perspective about near-term direction or trends; Crestmont Research focuses on a longer-term, bigger picture view of market history and its fundamental drivers. Occasionally, the analysis indicates that a position has extended beyond the typical range of variation. In those times, the view can have relatively shorter-term implications. Also in those times, however, markets can take a path that is longer and farther than most investors expect before ultimately being restored toward the midrange position of balance of condition.
Crestmont Research
Page 2 of 20
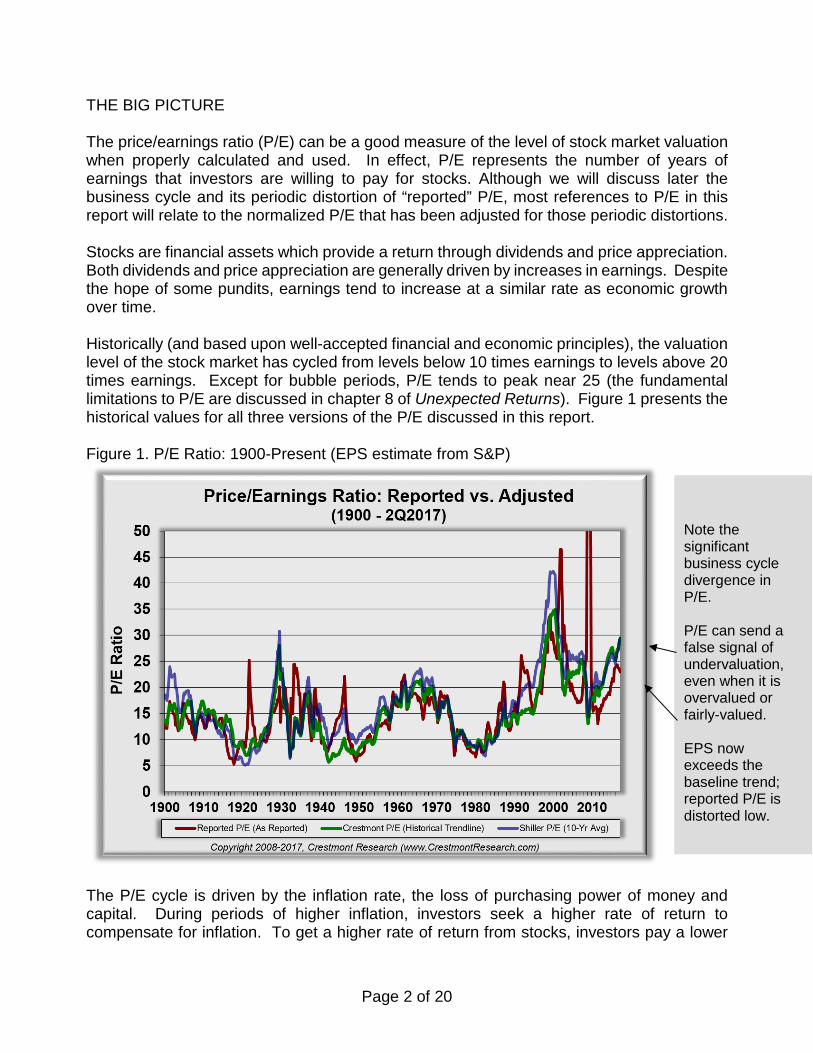
THE BIG PICTURE The price/earnings ratio (P/E) can be a good measure of the level of stock market valuation when properly calculated and used. In effect, P/E represents the number of years of earnings that investors are willing to pay for stocks. Although we will discuss later the business cycle and its periodic distortion of “reported” P/E, most references to P/E in this report will relate to the normalized P/E that has been adjusted for those periodic distortions. Stocks are financial assets which provide a return through dividends and price appreciation. Both dividends and price appreciation are generally driven by increases in earnings. Despite the hope of some pundits, earnings tend to increase at a similar rate as economic growth over time. Historically (and based upon well-accepted financial and economic principles), the valuation level of the stock market has cycled from levels below 10 times earnings to levels above 20 times earnings. Except for bubble periods, P/E tends to peak near 25 (the fundamental limitations to P/E are discussed in chapter 8 of Unexpected Returns). Figure 1 presents the historical values for all three versions of the P/E discussed in this report. Figure 1. P/E Ratio: 1900-Present (EPS estimate from S&P)
The P/E cycle is driven by the inflation rate, the loss of purchasing power of money and capital. During periods of higher inflation, investors seek a higher rate of return to compensate for inflation. To get a higher rate of return from stocks, investors pay a lower
Note the significant business cycle divergence in P/E. P/E can send a false signal of undervaluation, even when it is overvalued or fairly-valued. EPS now exceeds the baseline trend; reported P/E is distorted low.
Page 3 of 20
price for the future earnings (i.e., lower P/E). Therefore, higher inflation leads to lower P/E and declining inflation leads to higher P/E. The peak for P/E generally occurs at very low and stable rates of inflation. When inflation falls into deflation, earnings (the denominator for P/E) begins to decline on a reported basis (deflation is the nominal decline in prices). At that point, with future earnings expected to decline from deflation, the value of stocks declines in response to reduced future earnings—thus, P/E also declines under deflation. Therefore, for this discussion, assume that there are three general scenarios for inflation: rising, low, and deflation. As discussed above, rising inflation or deflation causes P/E to decline over an extended period which in turn creates a secular bear market. From periods of higher inflation or deflation, the return of inflation to a lower level causes the P/E ratio to increase over an extended period thereby creating a secular bull market. Secular bull markets can only occur when P/E gets low enough to then double or triple as inflation returns to a low level. As a result, secular market cycles are not driven by time, but rather they are dependent upon distance—as measured by the decline in P/E to a level that is low enough to then enable a significant increase. Cyclical vs. Secular The current normalized P/E is 29.8—well above the level justified by low inflation and interest rates (assuming historically-average economic growth). BUT, secular markets are driven by longer-term annual trends rather than momentary market circumstances. The secular analysis for each year relates to the average index across the year; so for each year, the price (P) in P/E (price/earnings ratio) is the average index across all days of the year. The stock market has recovered well beyond its declines from late 2008 and early 2009; therefore, it’s now fairly clear that the period in late 2008 and early 2009 was just a short-term cyclical bear market drop within a longer secular bear market cycle. Since early 2009, the market’s recovery and continued trend represent a cyclical bull market inside a secular bear market (it has happened many times before). We’re in a period with many daily (often hourly) points that represent pixels in the market’s picture. The short-run trends (the cyclical cycles) of the market are hard to predict. Without extraordinary powers of clairvoyance, the best plan is a diversified, non-correlated portfolio with a few engines to counterbalance the weaker components of the portfolio. BACKGROUND & DETAILS As described further in “The Truth About P/Es” in the Stock Market section at www.CrestmontResearch.com, P/E ratios can be based upon (a) trailing earnings or forecast earnings, (b) net earnings or operating earnings, and (c) reported earnings or business cycle-adjusted earnings.
Page 4 of 20
(a) The historical average for the normalized P/E is near 16 based upon reported ten-year trailing real earnings (i.e., the method popularized by Robert Shiller at Yale). The ultra-high P/Es of the late 1990s and early 2000s were high enough and lasted long enough to significantly distort what we now know to be the average P/E. If those years are excluded, the normalized P/E is just over one multiple point lower (i.e., approx. 15). Further, if forecast earnings is used, the average normalized P/E would be reduced by approximately one multiple point to near 14. [Note that the average reported P/E from 1900 to 2016, unadjusted for the business cycle and adjusted for the late 1990s bubble, is near 15. During significant earnings declines, P/E based upon reported earnings has at times spiked to distorted levels over 100. Such significant distortions in P/E distort the average. Excluding P/Es over 50 reduce the average to near 14. Further removing an equal number of more extreme high and low values, the average settles near 14.5. There is no single “right” average for P/E, yet a value near 15 would be representative for the average historical As Reported P/E.]
(b) Substituting forward operating earnings for trailing net earnings would further reduce the normalized average P/E by almost three points to 12. (c) Although the effect of the business cycle is muted in longer-term averages, the currently-reported P/E varies significantly due to the business cycle (more later).
It is important to ensure relevant comparisons—that is, P/E that is based upon trailing reported net earnings should only be compared to its historical average near 15. When ten years of real net earnings is used in P/E (i.e., Shiller P/E10), the relevant average is close to 16 (i.e., somewhere between 16+ using all years and ~15 excluding extreme high years). Too often, writers and analysts compare P/E that is based upon forecast operating earnings to the average for trailing reported net earnings. Although long-term forward operating earnings data is not available, Crestmont Research has developed a representative series. The appropriate P/E using forward operating earnings is near 12. Yet the most significant distortion from quarter-to-quarter or year-to-year is due to the earnings cycle, or as some refer to it, the business cycle. The Business Cycle As described further in “Beyond The Horizon: Redux 2011”, “Back To The Horizon”, and “Beyond The Horizon” in the Stock Market section at www.CrestmontResearch.com (and in more detail in chapters 5 and 7 of Probable Outcomes: Secular Stock Market Insights), corporate earnings progresses through periods of expansion that generally last two to five years followed by contractions of one to two years. The result of these business cycles is that earnings revolves around a baseline relationship to the overall economy. Keep in mind that the business cycle is distinct from the economic cycle of expansions and recessions.
Page 5 of 20
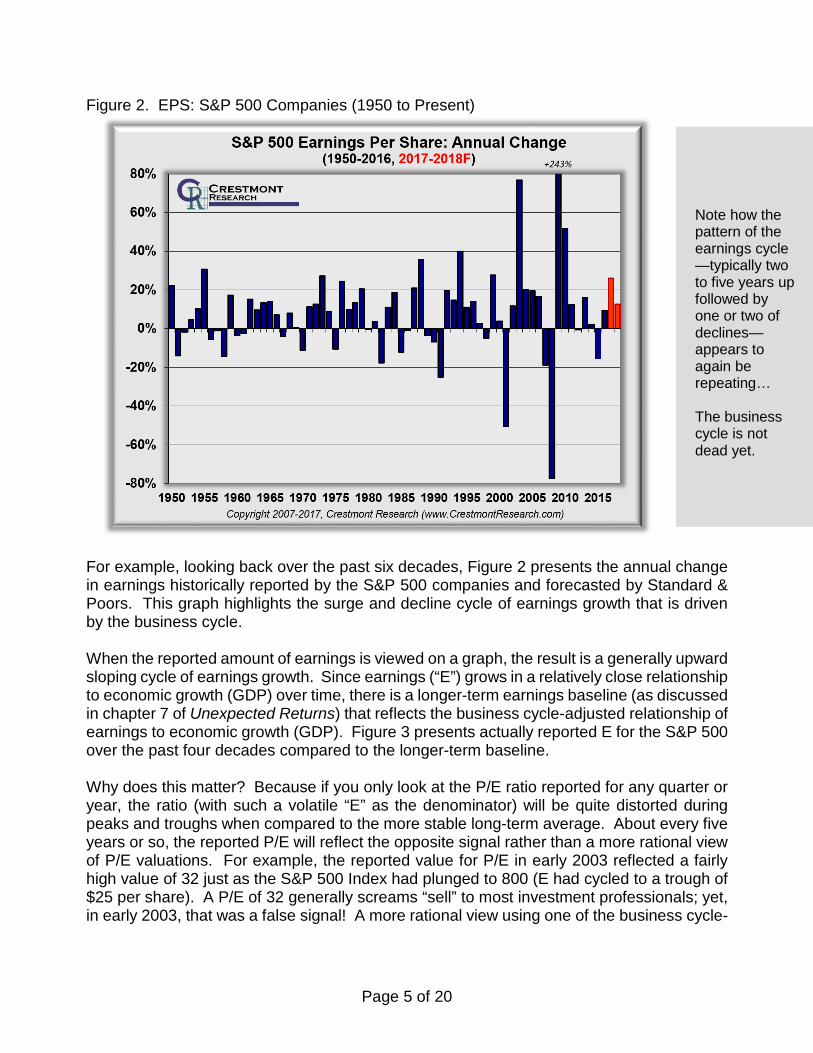
Figure 2. EPS: S&P 500 Companies (1950 to Present)
For example, looking back over the past six decades, Figure 2 presents the annual change in earnings historically reported by the S&P 500 companies and forecasted by Standard & Poors. This graph highlights the surge and decline cycle of earnings growth that is driven by the business cycle. When the reported amount of earnings is viewed on a graph, the result is a generally upward sloping cycle of earnings growth. Since earnings (“E”) grows in a relatively close relationship to economic growth (GDP) over time, there is a longer-term earnings baseline (as discussed in chapter 7 of Unexpected Returns) that reflects the business cycle-adjusted relationship of earnings to economic growth (GDP). Figure 3 presents actually reported E for the S&P 500 over the past four decades compared to the longer-term baseline. Why does this matter? Because if you only look at the P/E ratio reported for any quarter or year, the ratio (with such a volatile “E” as the denominator) will be quite distorted during peaks and troughs when compared to the more stable long-term average. About every five years or so, the reported P/E will reflect the opposite signal rather than a more rational view of P/E valuations. For example, the reported value for P/E in early 2003 reflected a fairly high value of 32 just as the S&P 500 Index had plunged to 800 (E had cycled to a trough of $25 per share). A P/E of 32 generally screams “sell” to most investment professionals; yet, in early 2003, that was a false signal! A more rational view using one of the business cycle-
Note how the pattern of the earnings cycle —typically two to five years up followed by one or two of declines—appears to again be repeating… The business cycle is not dead yet.
Page 6 of 20
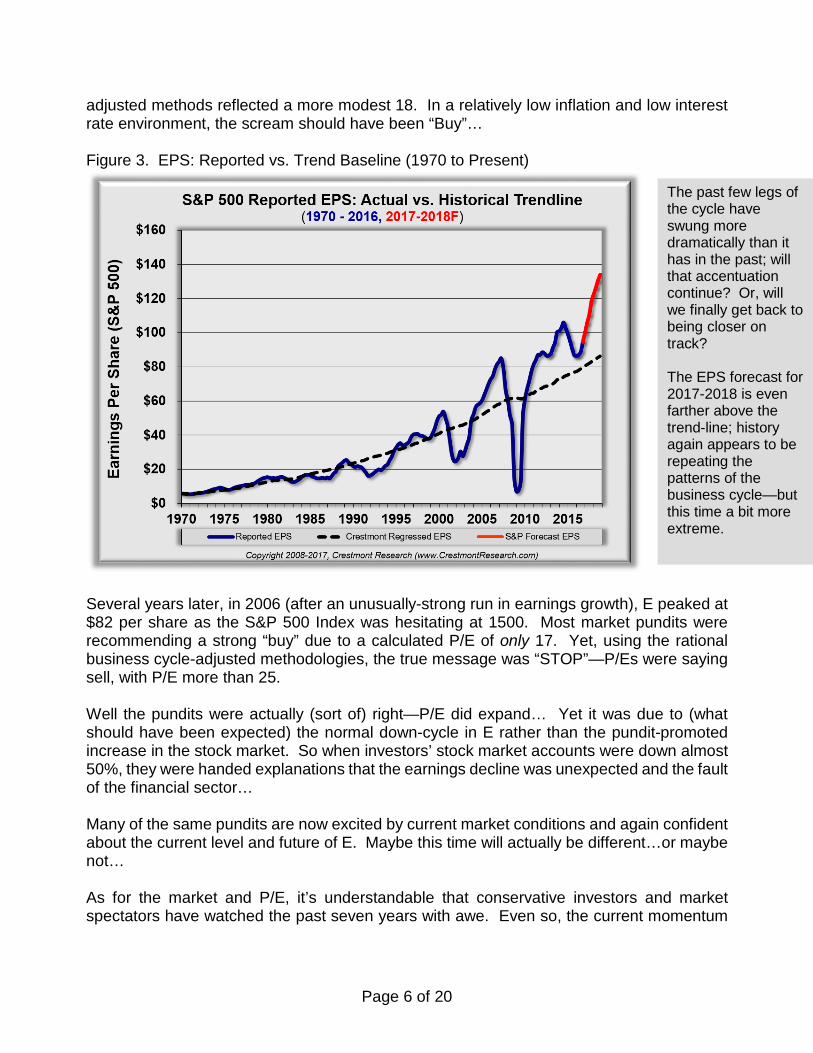
adjusted methods reflected a more modest 18. In a relatively low inflation and low interest rate environment, the scream should have been “Buy”… Figure 3. EPS: Reported vs. Trend Baseline (1970 to Present)
Several years later, in 2006 (after an unusually-strong run in earnings growth), E peaked at $82 per share as the S&P 500 Index was hesitating at 1500. Most market pundits were recommending a strong “buy” due to a calculated P/E of only 17. Yet, using the rational business cycle-adjusted methodologies, the true message was “STOP”—P/Es were saying sell, with P/E more than 25. Well the pundits were actually (sort of) right—P/E did expand… Yet it was due to (what should have been expected) the normal down-cycle in E rather than the pundit-promoted increase in the stock market. So when investors’ stock market accounts were down almost 50%, they were handed explanations that the earnings decline was unexpected and the fault of the financial sector… Many of the same pundits are now excited by current market conditions and again confident about the current level and future of E. Maybe this time will actually be different…or maybe not… As for the market and P/E, it’s understandable that conservative investors and market spectators have watched the past seven years with awe. Even so, the current momentum
The past few legs of the cycle have swung more dramatically than it has in the past; will that accentuation continue? Or, will we finally get back to being closer on track? The EPS forecast for 2017-2018 is even farther above the trend-line; history again appears to be repeating the patterns of the business cycle—but this time a bit more extreme.
Page 7 of 20
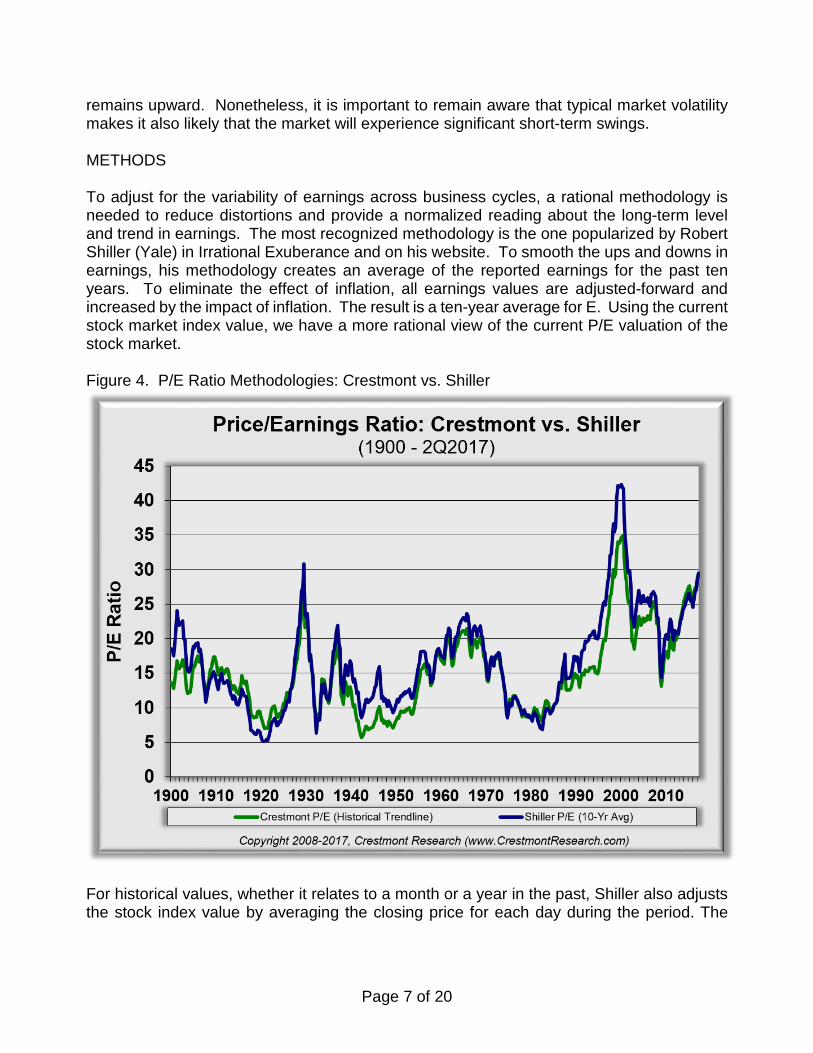
remains upward. Nonetheless, it is important to remain aware that typical market volatility makes it also likely that the market will experience significant short-term swings. METHODS To adjust for the variability of earnings across business cycles, a rational methodology is needed to reduce distortions and provide a normalized reading about the long-term level and trend in earnings. The most recognized methodology is the one popularized by Robert Shiller (Yale) in Irrational Exuberance and on his website. To smooth the ups and downs in earnings, his methodology creates an average of the reported earnings for the past ten years. To eliminate the effect of inflation, all earnings values are adjusted-forward and increased by the impact of inflation. The result is a ten-year average for E. Using the current stock market index value, we have a more rational view of the current P/E valuation of the stock market. Figure 4. P/E Ratio Methodologies: Crestmont vs. Shiller
For historical values, whether it relates to a month or a year in the past, Shiller also adjusts the stock index value by averaging the closing price for each day during the period. The
Page 8 of 20
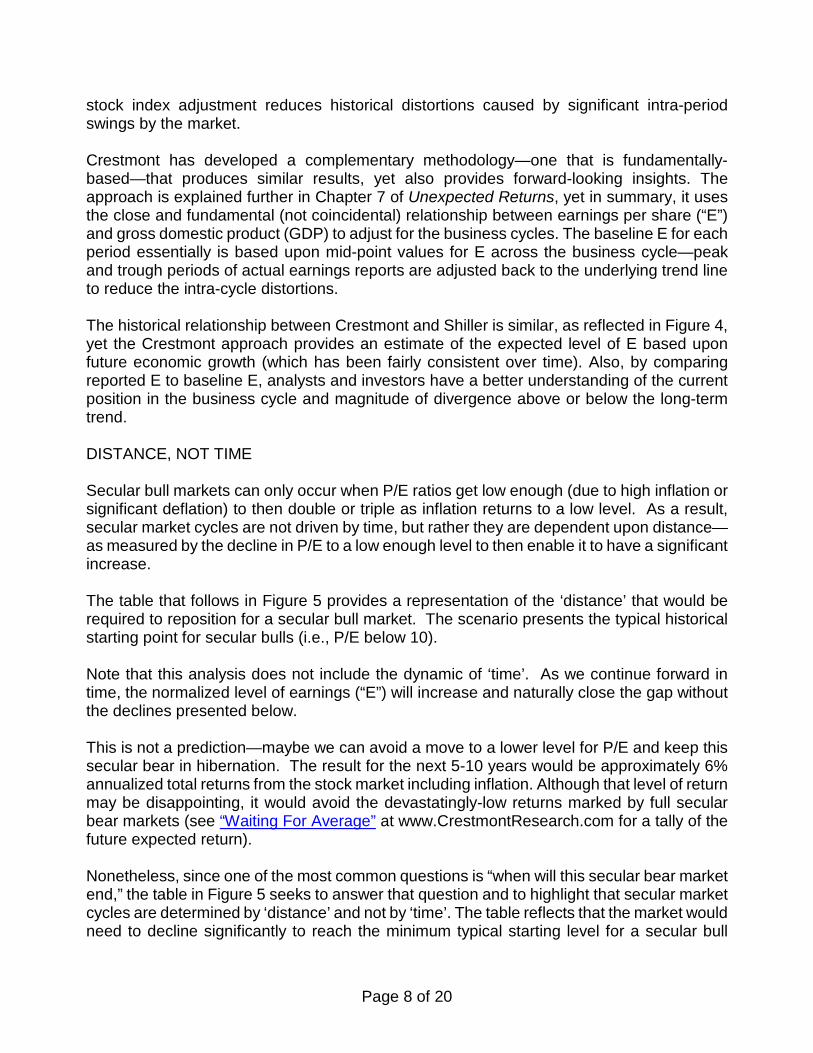
stock index adjustment reduces historical distortions caused by significant intra-period swings by the market. Crestmont has developed a complementary methodology—one that is fundamentally-based—that produces similar results, yet also provides forward-looking insights. The approach is explained further in Chapter 7 of Unexpected Returns, yet in summary, it uses the close and fundamental (not coincidental) relationship between earnings per share (“E”) and gross domestic product (GDP) to adjust for the business cycles. The baseline E for each period essentially is based upon mid-point values for E across the business cycle—peak and trough periods of actual earnings reports are adjusted back to the underlying trend line to reduce the intra-cycle distortions. The historical relationship between Crestmont and Shiller is similar, as reflected in Figure 4, yet the Crestmont approach provides an estimate of the expected level of E based upon future economic growth (which has been fairly consistent over time). Also, by comparing reported E to baseline E, analysts and investors have a better understanding of the current position in the business cycle and magnitude of divergence above or below the long-term trend. DISTANCE, NOT TIME Secular bull markets can only occur when P/E ratios get low enough (due to high inflation or significant deflation) to then double or triple as inflation returns to a low level. As a result, secular market cycles are not driven by time, but rather they are dependent upon distance—as measured by the decline in P/E to a low enough level to then enable it to have a significant increase. The table that follows in Figure 5 provides a representation of the ‘distance’ that would be required to reposition for a secular bull market. The scenario presents the typical historical starting point for secular bulls (i.e., P/E below 10). Note that this analysis does not include the dynamic of ‘time’. As we continue forward in time, the normalized level of earnings (“E”) will increase and naturally close the gap without the declines presented below. This is not a prediction—maybe we can avoid a move to a lower level for P/E and keep this secular bear in hibernation. The result for the next 5-10 years would be approximately 6% annualized total returns from the stock market including inflation. Although that level of return may be disappointing, it would avoid the devastatingly-low returns marked by full secular bear markets (see “Waiting For Average” at www.CrestmontResearch.com for a tally of the future expected return). Nonetheless, since one of the most common questions is “when will this secular bear market end,” the table in Figure 5 seeks to answer that question and to highlight that secular market cycles are determined by ‘distance’ and not by ‘time’. The table reflects that the market would need to decline significantly to reach the minimum typical starting level for a secular bull
Page 9 of 20
market. In reality, since any such decline would take months or years, natural earnings growth would mitigate some of the decline and the market would reach a P/E of 10 at a modestly higher level. Figure 5. Distance To The Next Secular Bull?
AS OF: JUN 30, 2017 ADJUSTED1 CRESTMONT2
“P” Closing Price (S&P 500 Index)3 2423 2423
“E” Current Estimate (S&P 500 EPS)4 $82 $81 P/E Price/Earnings Ratio5 29.7 29.8 Historical Secular Bull Start 10.0 Implied S&P 500 Index 816 813 Distance Away -66% -66% Notes 1-5: see footnotes in Figure 1 Copyright 2008-2017, Crestmont Research (www.CrestmontResearch.com)
Figure 6. Stock Market Gain/Loss To Low Inflation P/E Levels
AS OF: JUN 30, 2017 CRESTMONT2
“P” Closing Price (S&P 500 Index)3 2423
“E” Current Estimate (S&P 500 EPS)4 $81 P/E Price/Earnings Ratio5 29.8 P/E EPS 3-Year Restoration (2Q2020) 22.5 Projected Normalized EPS2 $92 Implied S&P 500 Index 2063 Annual Compounded Gain -5.2% 5-Year Restoration (2Q2022) 22.5 Projected Normalized EPS2 $99 Implied S&P 500 Index 2235 Annual Compounded Gain -1.6% Notes 1-5: see footnotes in Figure 1 Copyright 2008-2017, Crestmont Research (www.CrestmontResearch.com)
Page 10 of 20
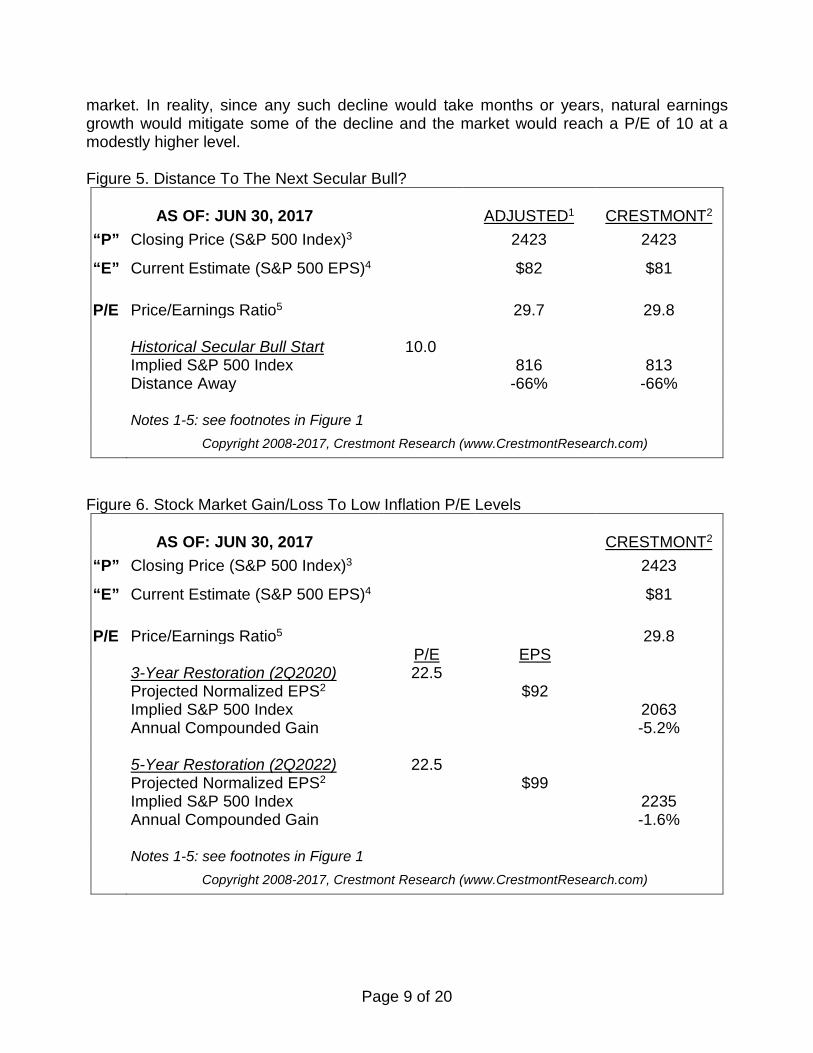
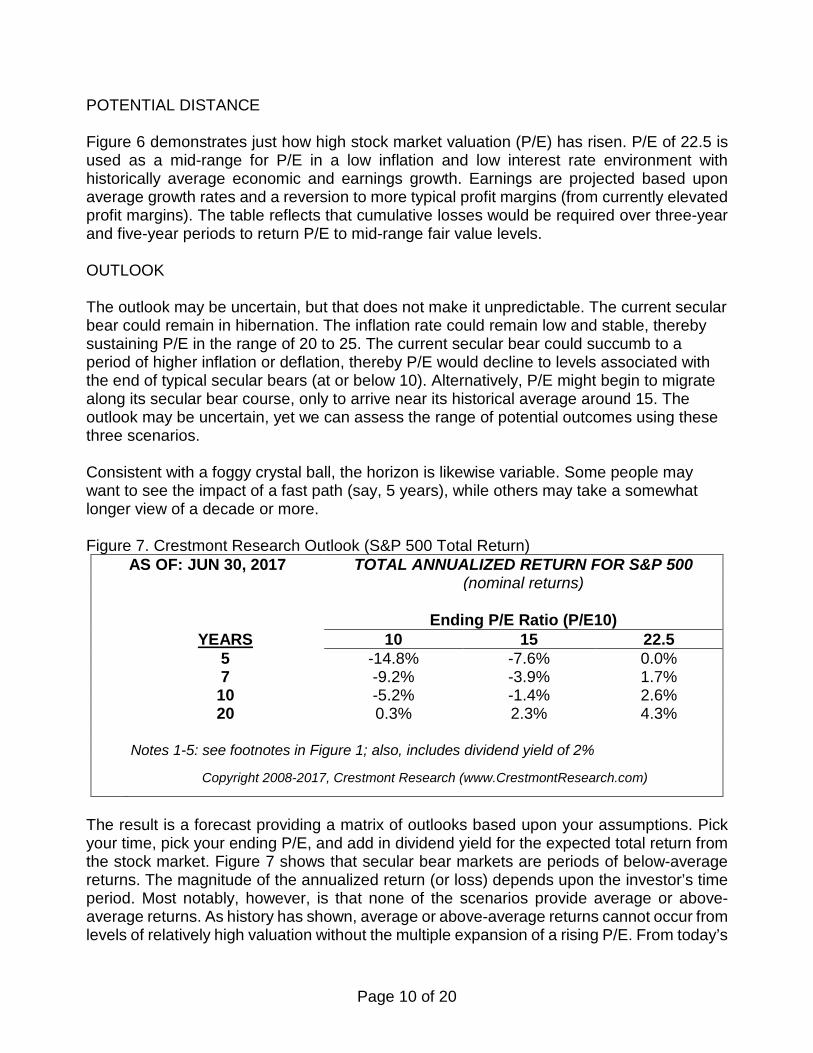
POTENTIAL DISTANCE Figure 6 demonstrates just how high stock market valuation (P/E) has risen. P/E of 22.5 is used as a mid-range for P/E in a low inflation and low interest rate environment with historically average economic and earnings growth. Earnings are projected based upon average growth rates and a reversion to more typical profit margins (from currently elevated profit margins). The table reflects that cumulative losses would be required over three-year and five-year periods to return P/E to mid-range fair value levels. OUTLOOK The outlook may be uncertain, but that does not make it unpredictable. The current secular bear could remain in hibernation. The inflation rate could remain low and stable, thereby sustaining P/E in the range of 20 to 25. The current secular bear could succumb to a period of higher inflation or deflation, thereby P/E would decline to levels associated with the end of typical secular bears (at or below 10). Alternatively, P/E might begin to migrate along its secular bear course, only to arrive near its historical average around 15. The outlook may be uncertain, yet we can assess the range of potential outcomes using these three scenarios. Consistent with a foggy crystal ball, the horizon is likewise variable. Some people may want to see the impact of a fast path (say, 5 years), while others may take a somewhat longer view of a decade or more. Figure 7. Crestmont Research Outlook (S&P 500 Total Return)
AS OF: JUN 30, 2017 TOTAL ANNUALIZED RETURN FOR S&P 500 (nominal returns) Ending P/E Ratio (P/E10) YEARS 10 15 22.5 5 -14.8% -7.6% 0.0% 7 -9.2% -3.9% 1.7% 10 -5.2% -1.4% 2.6% 20 0.3% 2.3% 4.3% Notes 1-5: see footnotes in Figure 1; also, includes dividend yield of 2%
Copyright 2008-2017, Crestmont Research (www.CrestmontResearch.com)
The result is a forecast providing a matrix of outlooks based upon your assumptions. Pick your time, pick your ending P/E, and add in dividend yield for the expected total return from the stock market. Figure 7 shows that secular bear markets are periods of below-average returns. The magnitude of the annualized return (or loss) depends upon the investor’s time period. Most notably, however, is that none of the scenarios provide average or above-average returns. As history has shown, average or above-average returns cannot occur from levels of relatively high valuation without the multiple expansion of a rising P/E. From today’s
Page 11 of 20
lofty levels, bubble conditions would be required…and that’s not a reasonable assumption for any investor’s portfolio. CONCLUSION Today’s P/E is 29.8; the stock market remains in secular bear market territory—clearly above the mid-range of fair value assuming a relatively low inflation and low interest rate environment. It is historically consistent for secular bear markets to present shorter-term periods of strong returns (cyclical bull markets) followed by periods of market declines (cyclical bear markets). The only way to reposition into a secular bull market is to experience a decline in the stock market due to significant inflation or deflation. This can occur either by a significant decline over a short period of time (e.g. the early 1930s secular bear market) or by minimal decline over a longer period of time (e.g. the 1960s-1970s secular bear market). This report assesses the current valuation level in the context of the longer-term market environment. The goal is to help investors and market spectators to assess more quickly the current conditions. In this environment, as described in chapter 10 of Unexpected Returns, investors should take a more active “rowing” approach (i.e. diversified, actively managed investment portfolio) rather than the secular bull market “sailing” approach (i.e. passive, buy-and-hold investment portfolio over-weighted in stocks). Author’s Note: For readers that are interested in the topics included in the report and elsewhere at CrestmontResearch.com, please note that the book Probable Outcomes: Secular Stock Market Insights provides greater detail about normalizing EPS and P/E than was presented in Unexpected Returns. Probable Outcomes was written to answer two recently popular questions. First, is this secular bear market almost over? Second, what are the likely returns from the stock market over the decade of the 2010s? For more details, please visit www.ProbableOutcomes.com. Ed Easterling is the author of Probable Outcomes: Secular Stock Market Insights and the award-winning Unexpected Returns: Understanding Secular Stock Market Cycles. He is currently president of an investment management and research firm. In addition, he previously served as an adjunct professor and taught the course on alternative investments and hedge funds for MBA students at SMU in Dallas, Texas. Mr. Easterling publishes provocative research and graphical analyses on the financial markets at www.CrestmontResearch.com.
Page 12 of 20
APPENDIX A RECENT STATUS
Following are the summaries from the first page of all prior reports for historical perspective. The first P/E Report was published on September 30, 2008. (First Quarter 2017) In the first quarter the stock market surged 5.5%, well more than underlying economic growth. As a result, normalized P/E increased to 29.4—significantly above the level justified by low inflation and low interest rates. The current status remains “significantly overvalued.” The level of volatility plunged over the past quarter and is now in the lowest 4% of all periods since 1950. The trend in reported earnings for the S&P 500 Index reflects a repeating pattern of overly-optimistic analysts’ forecasts. Earnings and volatility should be watched closely and investors should heighten their sensitivity to the risks confronting an increasingly vulnerable market. (Fourth Quarter 2016) In the fourth quarter, the stock market added another 3.3% to its tally for the year. As a result, normalized P/E increased to 27.9—well above the level justified by low inflation and low interest rates. The current status remains “significantly overvalued.” The level of volatility declined further over the past quarter. The trend in reported earnings may be reversing from recent declines. Earnings and volatility should be watched closely and investors should remain cognizant of the risks confronting a vulnerable market. (Third Quarter 2016) The third quarter initially surged higher and then generally maintained its ground through the quarter. In the end, the stock market added 3.3% to the year’s total and normalized P/E increased to 27.3—well above the level justified by low inflation and interest rates. The current status remains “significantly overvalued.” The level of volatility pulled-back a bit over the past quarter; as a result, the trend for volatility is unclear over the near-term. The trend in actual and forecast earnings continues to slide. Earnings and volatility should be watched closely and investors should remain cognizant of the risks confronting a vulnerable market. (Second Quarter 2016) The second quarter was another period of vulnerability and resilience. The net effect of the stock market’s gyration added 1.9% to the year’s total. As a result, normalized P/E increased slightly to 26.7—well above the level justified by low inflation and interest rates. The current status remains “significantly overvalued.” The level of volatility stalled over the past quarter, yet the trend appears to remain upward. The trend in actual and forecast earnings continues to slide. Earnings and volatility should be watched closely and investors should remain cognizant of the risks confronting a vulnerable market. (First Quarter 2015)
Page 13 of 20
The stock market swung dramatically during the first quarter and ended just 0.8% higher. As a result, normalized P/E remains unchanged at 26.5—well above the level justified by low inflation and interest rates. The current status remains “significantly overvalued.” Volatility has continued to increase, yet it is not yet above average. The trend in actual and forecast earnings continues to slide. Earnings and volatility should be watched closely and investors should remain cognizant of the risks confronting a vulnerable market. (Fourth Quarter 2015) The stock market ended the fourth quarter with a gain of 6.5%. As a result, normalized P/E increased to 26.5—well above the levels justified by low inflation and interest rates. The current status has returned to “significantly overvalued.” Volatility has continued to increase, yet it is not yet above average. The trend in actual and forecast earnings continues to slide. Earnings and volatility should be watched closely and investors should remain cognizant of the risks confronting a vulnerable market. (Third Quarter 2015) The stock market ended the third quarter with a loss of -6.9%. As a result, normalized P/E declined to 24.9—at the upper end of levels justified by low inflation and interest rates. The current status thereby has changed to “near overvalued.” Volatility has begun to increase, yet it is not yet consistently in the typical range. The trend in actual and forecast earnings continues to slide. Earnings and volatility should be watched closely and investors should remain cognizant of the risks confronting a vulnerable market. (Second Quarter 2015) The stock market ended the second quarter with a minimal loss of -0.2%. As a result, normalized P/E was virtually unchanged at 27.0—well above the levels justified by low inflation and interest rates. The current status remains near “significantly overvalued.” Volatility remains unusually low in its cycle. The trend in earnings and volatility should be watched closely and investors should remain cognizant of the risks confronting an increasingly vulnerable market. (First Quarter 2015) The stock market gyrated since the start of the year, ending the first quarter with a minimal gain of 0.4%. As a result, normalized P/E was virtually unchanged at 27.3—well above the levels justified by low inflation and interest rates. The current status remains near “significantly overvalued.” In addition, the forecast by Standard and Poor’s for 2015 earnings per share (EPS) recently took a nosedive, declining 17% during one week in the first quarter. Volatility remains unusually low in its cycle. The trend in earnings and volatility should be watched closely and investors should remain cognizant of the risks confronting an increasingly vulnerable market. (Fourth Quarter 2014) The stock market surged over the past quarter, adding to gains during 2014 that far exceed underlying economic growth. As a result, normalized P/E increased to 27.2—well above the levels justified by low inflation and interest rates. The current status is approaching “significantly overvalued.”
Page 14 of 20
(Third Quarter 2014) Over the past quarter, the stock market gyrated, only to end within a dozen points from where it started. However, the economy and normalized earnings increased just over 1%. As a result, normalized P/E decreased slightly to 26.3—yet the current status remains “overvalued.” In addition, reported earnings continued its business-cycle surge. The economy again proved that profit margins at extreme highs can go higher. Volatility remains unusually low in its cycle. The trend in earnings and volatility should be watched closely and investors should remain cognizant of the risks confronting an increasingly vulnerable market. (Second Quarter 2014) Over the past quarter, the stock market reached new highs and posted solid gains of near 5%. However, the economy and normalized earnings increased just over 1%. As a result, normalized P/E increased to 26.5. In addition, reported earnings continued its business-cycle surge. The economy again proved that profit margins at extreme highs can go higher. Volatility remains unusually low in its cycle. The trend in earnings and volatility should be watched closely and investors should remain cognizant of the risks confronting an increasingly vulnerable market. (First Quarter 2014) Over the past quarter, the stock market gyrated a bit and ended about 1% higher than the prior quarter. The economy and normalized earnings increased close to the same percentage. As a result, normalized P/E was essentially unchanged at 25.6 and the status of market valuation remains “overvalued.” Reported earnings, however, continued its business-cycle surge. The economy again proves that profit margins at extreme highs can go higher. The trend in earnings should be watched closely and investors should remain cognizant of the risks confronting an increasingly vulnerable market. (Fourth Quarter 2013) Over the past quarter, the stock market surged ahead, ending almost 10% higher—bringing the total gain for 2013 to 30%. Earnings from S&P 500 companies grow over the long-term at nearly the rate of economic growth. One result of the market surging last quarter and last year faster than normalized earnings growth is that P/E increased and now exceeds the range of “fairly-valued.” As a result, even with low inflation rate conditions, the stock market is now “overvalued.” P/E based upon reported earnings is near 19; it remains distorted below the normalized P/E of 26 due to currently high profit margins. Even though “reported” P/E is lower than “normalized” P/E, reported P/E is relatively high. The trend in earnings should be watched closely and investors should remain cognizant of the risks confronting an increasingly vulnerable market. (Third Quarter 2013) Over the past quarter, the stock market gyrated softly, ending almost 5% higher. The average daily change for the S&P 500 was 0.45%; the average since 2000 is 0.89%. Earnings from S&P 500 companies grow over the long-term at nearly the rate of economic growth. One result of the market surging last quarter faster than normalized earnings growth is that P/E increased and remains well into the range of “fairly-valued.” P/E based upon reported earnings is near 18; it remains distorted below the normalized P/E of 23 due to currently high profit margins. Even though “reported” P/E is lower than “normalized” P/E, reported P/E is relatively high. The trend in earnings should be watched closely and investors should remain cognizant of the risks confronting an increasingly vulnerable market.
Page 15 of 20
(Second Quarter 2013) Over the past quarter, the stock market added a couple percentage points to an already good year. As a result, P/E remains well into the range of “fairly-valued.” For historical perspective, the higher levels of P/E during 2007 (~25x) were near the upper limit of “fairly-valued.” P/E based upon reported earnings is near 18; it remains distorted below the normalized P/E of 23 due to currently high profit margins. Yet even though “reported” P/E is lower than “normalized” P/E, reported P/E itself is relatively high. The trend in earnings should be watched closely and investors should remain cognizant of the risks confronting an increasingly vulnerable market. (First Quarter 2013) The stock market surged 10% over the past quarter, moving P/E well into the range of “fairly-valued.” For historical perspective, the higher levels of P/E during 2007 (~25x) were near the upper limit of “fairly-valued.” P/E based upon reported earnings is near 18; it remains distorted below the normalized P/E due to currently high profit margins. Yet even though “reported” P/E is lower than “normalized” P/E, reported P/E itself is relatively high. The trend in earnings should be watched closely and investors should remain cognizant of the risks confronting an increasingly vulnerable market. (Fourth Quarter 2012) The stock market was fairly flat over the past quarter, maintaining P/E in the range of “fairly-valued.” For historical perspective, the higher levels of P/E in 2007 (~25x) were near the upper limit of “fairly-valued.” One implication could be that the current level of P/E has room to grow. Yet for investors that now foresee a greater risk of slower economic growth and/or an inflation rate trend away from price stability, the upper bound for fair-value would be much lower than historically warranted. The reported P/E remains distorted below the normalized P/E due to currently high and unsustainable profit margins. The trend in earnings should be watched closely and investors should remain cognizant of the risks confronting an increasingly vulnerable market. (Third Quarter 2012) The stock market rallied over the past quarter, increasing P/E further into the range of “fairly-valued.” P/E has returned to the same level as the end of the first quarter, which is the highest P/E since mid-2008. By historical standards, the higher levels of P/E in 2007 (~25x) were near the upper limit of “fairly-valued.” One implication could be that the current level of P/E has room to grow. Yet for investors that now foresee a greater risk of slower economic growth and/or a higher inflation rate or deflation in the future, the upper bound for P/E fair-value would be much lower than historically warranted. Further, note that the reported P/E increased this quarter not only due to the market rally, but also as a result of a decline in earnings. The reported P/E remains distorted below the normalized P/E due to currently high and unsustainable profit margins. The trend in earnings should be watched closely and investors should remain cognizant of the risks confronting an increasingly vulnerable market. (Second Quarter 2012) The stock market declined slightly over the past quarter. As a result, P/E decreased somewhat, yet remains within the range of “fairly-valued.” The reported P/E is distorted well below the normalized P/E due to currently high and unsustainable profit margins. The perception of low P/E valuation is likely providing support for the stock market. If the next downward leg in the business cycle is postponed for another year or longer, and if other economic and international headwinds remain
Page 16 of 20
contained, then the market could resurge toward new highs. At the same time, investors should remain cognizant of the risks confronting an increasingly vulnerable market. (First Quarter 2012) The stock market increased significantly over the past quarter. As a result, P/E has increased further into the range of “fairly-valued.” The reported P/E is distorted well below the normalized P/E due to currently high and unsustainable profit margins. The perception of low P/E valuation is likely providing support for the stock market. If the next downward leg in the business cycle is postponed for another year or longer, and if other economic and international headwinds remain contained, then the market could resurge toward new highs. At the same time, investors should remain cognizant of the risks confronting an increasingly vulnerable market. (Fourth Quarter 2011) As the result of a significant increase in the market over the past quarter, P/E has increased somewhat to approach “near fairly-valued.” The apparent P/E, based upon reported and expected future earnings, is likely providing support for the stock market. If the next downward leg in the business cycle is postponed for another year or longer, and if other economic and international headwinds remain contained, then the market could resurge toward new highs. At the same time, investors should remain cognizant of the risks confronting a vulnerable market. (Third Quarter 2011) P/E, as the result of a significant decline in the market over the past quarter, has decreased somewhat to be “slightly undervalued.” The momentum of the market has further stalled over the past quarter and current levels indicate that the stock market is either vulnerable to further cyclical downturn or likely to resurge toward new highs. Of particular note, reported EPS is well above the long-term baseline earnings trend. Therefore, reported P/E is distorted low and may continue to be further distorted over the next year or two until a decline in reported earnings causes EPS to fall below the baseline. (Second Quarter 2011) P/E, as the result of a near flat market over the past quarter, has decreased minimally and remains “near fairly-valued.” The momentum of the market has stalled somewhat over the past quarter and current levels indicate that the stock market is vulnerable over the next year or two to another cyclical downturn. Of particular note, reported EPS is well above the long-term baseline earnings trend. Therefore, reported P/E is distorted low and may continue to be further distorted over the next year or two until a decline in reported earnings causes EPS to fall below the baseline. (First Quarter 2011) P/E, as the result of market gains in excess of underlying economic and earnings growth, has increased further into the normalized valuation range and remains “near fairly-valued.” The momentum of the market remains upward (note that cyclical trends tend to over-shoot fair value), but current levels indicate that the stock market is vulnerable over the next year or two to another cyclical downturn. Of particular note, reported EPS is well above the long-term baseline earnings trend. Therefore, reported P/E is distorted low and is likely to continue to be further distorted over the next year or two until a decline in reported earnings causes EPS to fall below the baseline. (Year-End 2010) P/E, as the result of the market surge, is near the middle of the normalized valuation range and is now ‘near fairly-valued’. The momentum of the market remains upward (note that cyclical trends tend to over-shoot fair value), but current levels indicate that the stock market is becoming vulnerable
Page 17 of 20
over the next year or two to another cyclical downturn. Of particular note, reported EPS is again above the long-term baseline earnings trend. Therefore, reported P/E is distorted low and is likely to continue to be further distorted over the next year or two until a decline in reported earnings causes EPS to fall below the baseline. (Third Quarter-End 2010) P/E returned to the lower half of the normalized valuation range and is now ‘slightly undervalued’; the stock market remains positioned for above-average returns over the next year or two (assuming that the economy is not expected to enter a multi-year period of significant deflation or relatively high inflation). Notwithstanding the overall trend, remain aware that typical market volatility makes it likely that the recent significant short-term swings and market corrections may continue. Of particular note, reported EPS again is above the long-term baseline earnings trend. Therefore, reported P/E is distorted low and is likely to continue to be further distorted over the next year or two. (Second Quarter-End 2010) P/E has dipped to or just below the normalized valuation range and is now ‘somewhat undervalued’; the stock market remains positioned for above-average returns over the next year or two (assuming that the economy is not expected to enter a multi-year period of significant deflation or relatively high inflation). Notwithstanding the overall trend, remain aware that typical market volatility makes it likely that the recent significant short-term swings and market corrections may continue or occur again later this year. (First Quarter-End 2010) P/E remains ‘slightly undervalued’ in the lower half of the normalized valuation range; the stock market remains positioned for nearer-term above-average returns (assuming that the economy is not expected to enter a multi-year period of significant deflation or relatively high inflation). Notwithstanding the nearer-term trend, remain aware that typical market volatility makes it increasingly likely that the market will experience significant short-term swings—recent market volatility has been unusually low. (Year-End 2009) P/E remains ‘slightly undervalued’ toward the lower end of the normalized valuation range; the stock market remains positioned for nearer-term above-average returns (assuming that the economy is not expected to enter a multi-year period of significant deflation or relatively high inflation). Notwithstanding the nearer-term trend, remain aware that typical market volatility makes it increasingly likely that the market will experience significant short-term swings. The ‘Reported’ measure of EPS and P/E, reflecting the most recent four quarters, continues to become less distorted as earnings recover from the recession. (Late Fourth Quarter 2009) P/E, despite recent market gains, remains ‘slightly undervalued’; the stock market remains positioned for nearer-term above-average returns (assuming that the economy is not expected to enter a multi-year period of significant deflation or relatively high inflation). Notwithstanding the nearer-term trend, remain aware that typical market volatility makes it likely that the market will experience significant short-term swings. (Third Quarter-End 2009) P/E, despite recent market gains, is ‘slightly undervalued’; the stock market remains positioned for nearer-term above-average returns (assuming that the economy is not expected to enter a multi-year period of significant deflation or relatively high inflation). Notwithstanding the nearer-term trend,
Page 18 of 20
remain aware that typical market volatility makes it likely that the market will experience significant short-term swings. (Early Third Quarter 2009) P/E, despite recent market gains, remains ‘somewhat undervalued’; the stock market remains positioned for nearer-term above-average returns (assuming that the economy is not expected to enter a multi-year period of significant deflation or relatively high inflation). (Mid Second Quarter 2009) The P/E has returned to near year-end 2008 levels and is ‘somewhat undervalued’; the stock market remains positioned for nearer-term above-average returns (assuming that the economy is not expected to enter a multi-year period of significant deflation or relatively high inflation). (Mid First Quarter 2009) The 18.6% year-to-date decline has returned P/E to fairly undervalued (from ‘somewhat undervalued’) and has positioned the market for nearer-term above-average returns (assuming that the economy is not expected to enter a multi-year period of significant deflation or relatively high inflation). (Year-End 2008) Despite a modest recovery in the stock market since the most recent report, P/E remains somewhat undervalued and positioned for nearer-term above-average returns (assuming that the economy is not expected to enter a multi-year period of significant deflation or relatively high inflation). (Mid Fourth Quarter 2008-II) The declines in the stock market that have continued during the fourth quarter have been significant enough to further change the status: P/E is now fairly undervalued and positioned for nearer-term above average returns (assuming that the economy is not expected to enter a multi-year period of significant deflation or relatively high inflation). (Mid Fourth Quarter 2008) The declines in the stock market during October have been significant enough to change the status: P/E is now relatively undervalued and positioned for nearer-term above average returns (assuming that the economy is not expected to enter a multi-year period of significant deflation or relatively high inflation). (Late Third Quarter 2008) The reported price/earnings ratio (“P/E”) in recent years was distorted downward due to an interim peak in the earnings cycle. The reported P/E ratio has been restored to near normalized levels as the result of the reversion of earnings to near long-term trend levels. The normalized P/E is relatively-high in relation to historical averages, a reflection of relatively-low expected inflation (and long-term interest rates). But, P/E is now highly-vulnerable to decline due to expectations by some toward higher inflation and by others toward potential deflation. Low, stable inflation is required to sustain P/Es at or above 20.
Page 19 of 20
APPENDIX B EARNINGS HISTORY & FORECASTS
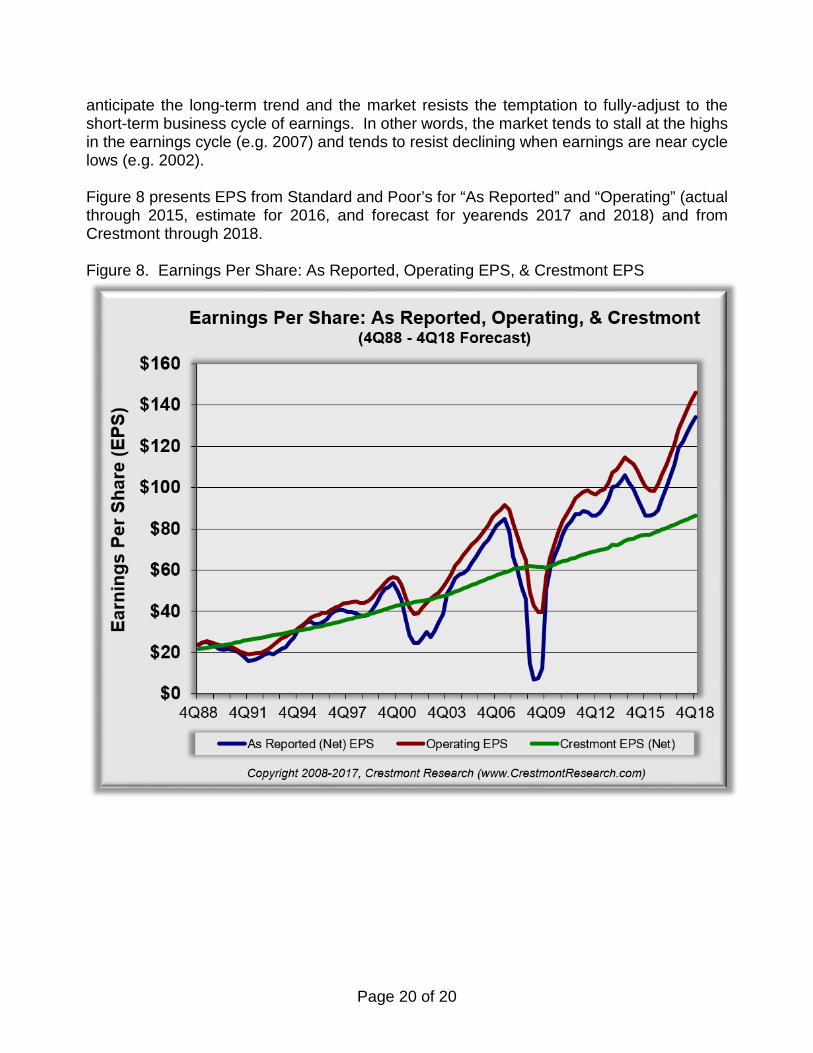
Why does the version of “earnings” matter? Stockholders generally value the stocks of publicly-traded companies based upon their future cash flows, which is largely based upon future dividends (academics employ the principles of the so-called Dividend Discount Model). To grow, companies need to retain a certain amount of their earnings; the remainder of the earnings is available to pay dividends. Dividends are paid from net earnings—net earnings are also the basis of historical P/E ratios. History confirms the basic economic principles: Earnings go through a cycle of above-average growth followed by short-term declines. Some of the short-term declines occur due to one-time charges, yet other factors also impact profit margins. Analysts have been pressured to develop a measure of earnings that is less volatile than reported earnings—a measure that is now known as ‘operating earnings per share’. Although ‘as reported’ earnings are based upon detailed accounting principles (known as GAAP), ‘operating earnings’ is a measure of profits that is developed by adding-back subjectively determined charges that reduced earnings. There are agreed standards for ‘as reported’ earnings; there is not a standard for ‘operating earnings’. As reflected in Figure 8, there are several measures of earnings. Two of them vary significantly; one of them is fairly stable. “As Reported” earnings reflects the past and projected (by S&P analysts) net income from the five hundred large companies in the S&P 500 Index. This measure is based upon Generally Accepted Accounting Principles (GAAP) and is the measure that historical averages are based upon. “Operating” earnings reflects a subjective measure of earnings (by other S&P analysts) that adds back certain costs and charges. It attempts to reduce the impact of the business cycle and one-time charges, yet it is generally considered to be an optimistic view of earnings. This measure of earnings per share (EPS) is NOT comparable to the long-term average P/E, since operating earnings excludes a variety of costs and charges that reduce the funds available for dividends. From the start of the reporting period in 1988, ‘Operating EPS’ has averaged 15% more than ‘As Reported EPS’. Since operating earnings is often viewed on a projected basis, the historical average price/earnings ratio (P/E) based upon “Operating EPS” is closer to 11 or 12. This contrasts to the historical average P/E based upon ‘As Reported EPS” of 15 or 16. “Crestmont” earnings is based upon the long-term relationship of earnings to economic growth. As described in Unexpected Returns, the relationship is fairly consistent over time and is a good measure of the baseline for earnings. ‘As Reported EPS’ has for decades varied around the Crestmont baseline. Crestmont has found that the market tends to
Page 20 of 20
anticipate the long-term trend and the market resists the temptation to fully-adjust to the short-term business cycle of earnings. In other words, the market tends to stall at the highs in the earnings cycle (e.g. 2007) and tends to resist declining when earnings are near cycle lows (e.g. 2002). Figure 8 presents EPS from Standard and Poor’s for “As Reported” and “Operating” (actual through 2015, estimate for 2016, and forecast for yearends 2017 and 2018) and from Crestmont through 2018. Figure 8. Earnings Per Share: As Reported, Operating EPS, & Crestmont EPS