CREST Cost of Renewable Energy Spreadsheet Tool: A … Energy Cost Modeling: A Toolkit for...
43
NREL is a national laboratory of the U.S. Department of Energy Office of Energy Efficiency & Renewable Energy Operated by the Alliance for Sustainable Energy, LLC This report is available at no cost from the National Renewable Energy Laboratory (NREL) at www.nrel.gov/publications. Contract No. DE-AC36-08GO28308 CREST Cost of Renewable Energy Spreadsheet Tool: A Model for Developing Cost-Based Incentives in the United States User Manual Version 4 August 2009 — March 2011 (Updated July 2013) Jason S. Gifford and Robert C. Grace Sustainable Energy Advantage, LLC Framingham, Massachusetts NREL Technical Monitor: Karlynn Cory Subcontract Report NREL/SR-6A20-50374 July 2013
-
Upload
phungduong -
Category
Documents
-
view
216 -
download
2
Transcript of CREST Cost of Renewable Energy Spreadsheet Tool: A … Energy Cost Modeling: A Toolkit for...
NREL is a national laboratory of the U.S. Department of Energy Office of Energy Efficiency & Renewable Energy Operated by the Alliance for Sustainable Energy, LLC
This report is available at no cost from the National Renewable Energy Laboratory (NREL) at www.nrel.gov/publications.
Contract No. DE-AC36-08GO28308
CREST Cost of Renewable Energy Spreadsheet Tool: A Model for Developing Cost-Based Incentives in the United States User Manual Version 4 August 2009 — March 2011 (Updated July 2013) Jason S. Gifford and Robert C. Grace Sustainable Energy Advantage, LLC Framingham, Massachusetts
NREL Technical Monitor: Karlynn Cory
Subcontract Report NREL/SR-6A20-50374 July 2013

NREL is a national laboratory of the U.S. Department of Energy Office of Energy Efficiency & Renewable Energy Operated by the Alliance for Sustainable Energy, LLC
This report is available at no cost from the National Renewable Energy Laboratory (NREL) at www.nrel.gov/publications.
National Renewable Energy Laboratory 15013 Denver West Parkway Golden, CO 80401 303-275-3000 • www.nrel.gov
Contract No. DE-AC36-08GO28308
CREST Cost of Renewable Energy Spreadsheet Tool: A Model for Developing Cost-Based Incentives in the United States User Manual Version 4 August 2009 — March 2011 (Updated July 2013) Jason S. Gifford and Robert C. Grace Sustainable Energy Advantage, LLC Framingham, Massachusetts
NREL Technical Monitor: Karlynn Cory Prepared under Subcontract No. LEU-9-99277-01
Subcontract Report NREL/SR-6A20-50374 July 2013

This publication was reproduced from the best available copy submitted by the subcontractor and received no editorial review at NREL.
NOTICE
This report was prepared as an account of work sponsored by an agency of the United States government. Neither the United States government nor any agency thereof, nor any of their employees, makes any warranty, express or implied, or assumes any legal liability or responsibility for the accuracy, completeness, or usefulness of any information, apparatus, product, or process disclosed, or represents that its use would not infringe privately owned rights. Reference herein to any specific commercial product, process, or service by trade name, trademark, manufacturer, or otherwise does not necessarily constitute or imply its endorsement, recommendation, or favoring by the United States government or any agency thereof. The views and opinions of authors expressed herein do not necessarily state or reflect those of the United States government or any agency thereof.
This report is available at no cost from the National Renewable Energy Laboratory (NREL) at www.nrel.gov/publications.
Available electronically at http://www.osti.gov/bridge
Available for a processing fee to U.S. Department of Energy and its contractors, in paper, from:
U.S. Department of Energy Office of Scientific and Technical Information P.O. Box 62 Oak Ridge, TN 37831-0062 phone: 865.576.8401 fax: 865.576.5728 email: mailto:[email protected]
Available for sale to the public, in paper, from:
U.S. Department of Commerce National Technical Information Service 5285 Port Royal Road Springfield, VA 22161 phone: 800.553.6847 fax: 703.605.6900 email: [email protected] online ordering: http://www.ntis.gov/help/ordermethods.aspx
Cover Photos: (left to right) photo by Pat Corkery, NREL 16416, photo from SunEdison, NREL 17423, photo by Pat Corkery, NREL 16560, photo by Dennis Schroeder, NREL 17613, photo by Dean Armstrong, NREL 17436, photo by Pat Corkery, NREL 17721.
Printed on paper containing at least 50% wastepaper, including 10% post consumer waste.
iii
This report is available at no cost from the National Renewable Energy Laboratory (NREL) at www.nrel.gov/publications.
Preface Version 4 of the CREST Model User Manual has been updated to reflect the addition of anaerobic digester (AD) and fuel cell technologies to the list of available models. The majority of these changes are included in Appendices D and E, which explain specific characteristics of the AD CREST and Fuel Cell CREST models, respectively. Unlike solar, wind, and geothermal technologies, both AD and fuel cell projects must account for fuel costs when calculating the price of energy and compiling pro formas; therefore, a major difference between previous versions of CREST and the newer AD CREST and Fuel Cell CREST is the requirement of inputs related to fuel. The models also feature other technology-specific inputs (for example digestate disposal in the AD model). As in the other appendices, Appendices D and E provide sample inputs for potential plants, though these inputs are often site-specific and should be used with caution.
Finally, Version 4 of the CREST Model User Manual contains various other minor additions and corrections, including updated sample inputs for the geothermal and solar models and a few minor revisions to the text explaining inputs to the geothermal model.
iv
This report is available at no cost from the National Renewable Energy Laboratory (NREL) at www.nrel.gov/publications.
Acknowledgments This work was funded by three programs of the U.S. Department of Energy’s Energy Efficiency and Renewable Energy (EERE) Division. The authors wish to thank participating staff—Jennifer DeCesaro from the EERE Solar Program, Carla Frisch and Cody Taylor from the EERE Corporate Analysis Program, Arlene Anderson from the EERE Geothermal Program, and Kate Young and Chad Augustine of the National Renewable Energy Laboratory—for providing useful insights and overall direction for this project. The authors also are grateful for the guidance and helpful input of the project managers, Karlynn Cory, Lori Bird, Mike Mendelsohn, and Claire Kreycik of NREL. Additionally, the authors appreciate the input of Robert Margolis, Gian Porro, Thomas Schneider, David Kline, and Jim Newcomb of NREL.
We are grateful for—and wish to thank—our external peer reviewers, Matt Karcher of Deacon Harbor Financial and Ryan Pletka, Mon Hong, and Carrie Bellamy of Black & Veatch Corp. for their guidance in the development of this user manual and their expert counsel during the development of the initial Cost of Renewable Energy Spreadsheet Tool (CREST) models that go along with it. We appreciate the support and feedback of the American Biogas Council and its members during the development of the Anaerobic Digester CREST and the associated updates to this User Manual. We appreciate the support of the Connecticut Department of Energy and Environmental Protection and its staff during the development of the Fuel Cell CREST. We wish to thank Kevin Porter (Exeter Associates) for his participation in, and management of, this project. We also thank the individuals who provided invaluable feedback during the final drafting and editing phases of this user manual, particularly Mimi Zhang and Silas Bauer (Sustainable Energy Advantage) and Wilson Rickerson and Andy Belden (Meister Consultants Group).
v
This report is available at no cost from the National Renewable Energy Laboratory (NREL) at www.nrel.gov/publications.
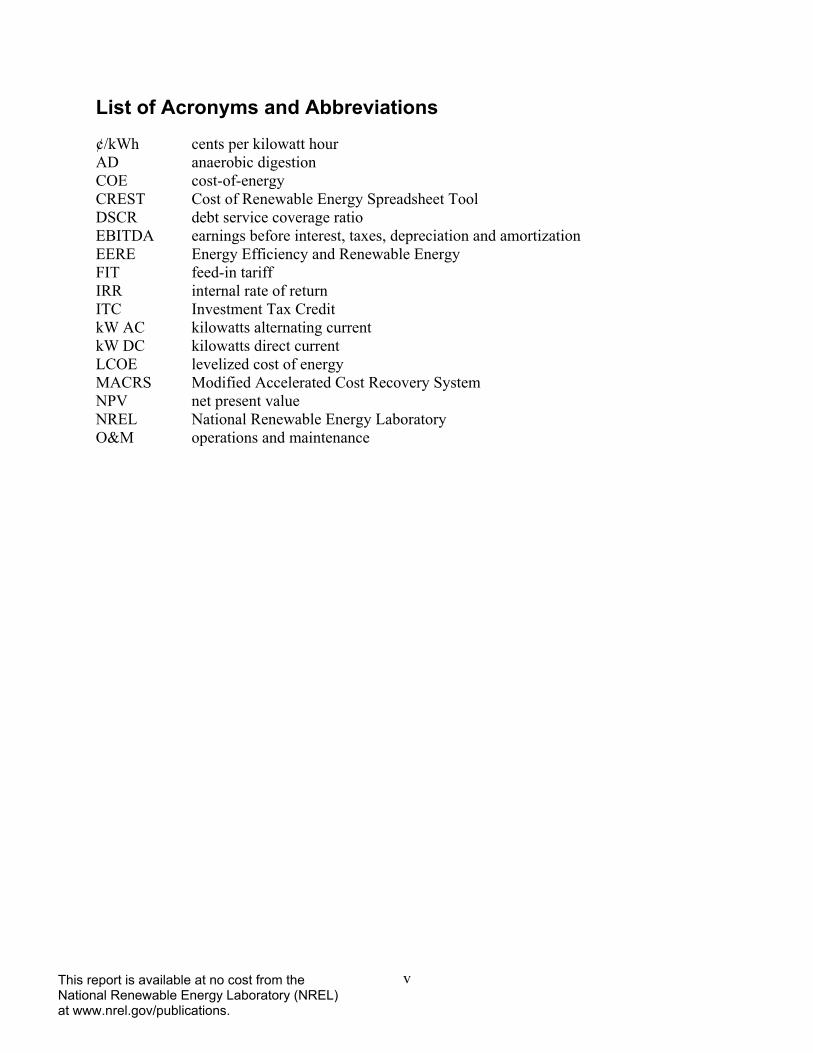
List of Acronyms and Abbreviations
¢/kWh cents per kilowatt hour AD anaerobic digestion COE cost-of-energy CREST Cost of Renewable Energy Spreadsheet Tool DSCR debt service coverage ratio EBITDA earnings before interest, taxes, depreciation and amortization EERE Energy Efficiency and Renewable Energy FIT feed-in tariff IRR internal rate of return ITC Investment Tax Credit kW AC kilowatts alternating current kW DC kilowatts direct current LCOE levelized cost of energy MACRS Modified Accelerated Cost Recovery System NPV net present value NREL National Renewable Energy Laboratory O&M operations and maintenance
vi
This report is available at no cost from the National Renewable Energy Laboratory (NREL) at www.nrel.gov/publications.
Table of Contents 1 Introduction ......................................................................................................................................... 1
1.1 Overview—User Manual ................................................................................................. 2
1.2 Model Design and Features .............................................................................................. 3
1.3 Model Outputs .................................................................................................................. 3 2 Guided Tour ......................................................................................................................................... 4
3 Understanding and Using the Inputs Worksheet............................................................................. 6
3.1 Conventions ...................................................................................................................... 6
3.2 In-Model User Support Resources ................................................................................... 8
3.3 Input Categories ............................................................................................................... 9
3.4 Levels of Input Detail: “Granularity” ............................................................................. 10 4 Operating the Model ......................................................................................................................... 14
4.1 Drop-Down Menus ......................................................................................................... 14
4.2 Permanent Financing ...................................................................................................... 15
4.3 Outputs ........................................................................................................................... 16 5 Running and Comparing Multiple Analyses ................................................................................... 17
6 Understanding the Results .............................................................................................................. 17
7 Conclusion ......................................................................................................................................... 18
Appendix A: Solar CREST ........................................................................................................................ 19
Appendix B: Wind CREST ........................................................................................................................ 22
Appendix C: Geothermal CREST ............................................................................................................. 24
Appendix D: Anaerobic Digestion CREST .............................................................................................. 29
Appendix E: Fuel Cell CREST .................................................................................................................. 32
1
This report is available at no cost from the National Renewable Energy Laboratory (NREL) at www.nrel.gov/publications.
1 Introduction
The Cost of Renewable Energy Spreadsheet Tool (CREST), its User Manual, and a report titled Renewable Energy Cost Modeling: A Toolkit for Establishing Cost-Based Incentives in the United States were initially developed in 2010 on behalf of the National Renewable Energy Laboratory (NREL) and have since been updated in 2013. Their purpose is to guide state policy makers in the evaluation and development of cost-based incentives, including feed-in tariffs (FITs) and similar policies, to support renewable energy technologies. This User Manual describes five modules of the CREST model, one for each of the following technologies:
• Solar (photovoltaic or solar thermal electric) • Wind • Geothermal • Anaerobic Digestion • Fuel Cell
These five modules of the CREST model share a common architecture. This provides for a similar “look and feel” among all five models. The common features are described in the main body of this User Manual. Features specific to the individual technologies are explained in the appendices.
The CREST models are available for download1 at no charge from NREL’s RE Project Finance Website and can be used in a number of ways. The primary intended uses include:
• Estimating the cost of energy (COE) from a range of solar, wind, geothermal, anaerobic digester, and fuel cell electricity generation projects for the purpose of informing the setting of cost-based incentive rates
• Gaining an understanding of the economic drivers of renewable energy projects, which lead to the calculated COE
• Understanding the relative economics of generation projects with differing characteristics, such as project size, resource quality, location (e.g., near or far from transmission) or ownership (e.g., public or private).
The CREST models described herein have been designed for use by:
• State policy makers, regulators, utilities, and other stakeholders to assist them in current and future rate-setting or incentive-setting processes, or in the evaluation of renewable energy projects
• Public utilities commissions and their staffs who, with limited resources and time, might need to conduct analyses of varying incentive levels and types
• Public utilities, developers (including their consultants and analysts), investors, and other stakeholders involved in proceedings to determine cost-based incentive rates, FITs, or similar incentives for renewable energy projects.
1 http://financere.nrel.gov/finance/content/crest-model
2
This report is available at no cost from the National Renewable Energy Laboratory (NREL) at www.nrel.gov/publications.
The CREST model is best used during the latter stages of policy development, once a legislative or regulatory determination has been made to pursue a cost-based incentive, standard offer contract, FIT, or similar renewable energy incentive policy. The CREST model will be most useful in supporting development of cost-based prices. The CREST model is not the right tool to determine whether a solar, wind, geothermal, anaerobic digester, or fuel cell electricity generator is appropriate for a specific location or application. In addition, the CREST model is not sufficiently detailed to address all of the demands of the investment process, and as such, is not intended for use by developers to support power purchase agreement negotiations or project financing.
The design of the CREST model has been guided by the recommendations of the report titled Renewable Energy Cost Modeling: A Toolkit for Establishing Cost-Based Incentives in the United States. Please refer to this report for a detailed discussion of energy cost modeling options and the policy implications of modeling choices. The report is available for download at NREL’s RE Project Finance Website2.
1.1 Overview—User Manual The objective of this document is to help model users understand how to use the CREST model to support renewable energy incentives, FITs, and other renewable energy rate-setting processes. This User Manual will walk the reader through the spreadsheet tool, including its layout and conventions, offering context on how and why it was created. This User Manual will also provide instructions on how to populate the model with inputs that are appropriate for a specific jurisdiction’s policy-making objectives and context. Finally, the User Manual will describe the results and outline how these results may inform decisions about long-term renewable energy support programs.
The CREST model is designed to calculate the COE, or minimum revenue per unit of production needed for the modeled renewable energy project to meet its equity investors’ assumed minimum required after-tax rate of return. This calculation depends on the development and entry of several categories of inputs, each of which is clearly identified and described in this document as well as in the CREST models themselves. Policy makers may wish to engage a broad range of stakeholders to determine the appropriate set of inputs to be used for each modeled renewable energy project. The results of a particular COE analysis (model run) should be used to inform policymakers in the setting of cost-based incentives (as opposed to dictating the rates themselves), since the COE will correspond only to a generator with the characteristics described by the specific inputs rather than all generators of the applicable technology. While the CREST model will calculate the COE associated with a set of inputs, policy makers should plan to conduct additional analyses throughout the regulatory process to consider the aggregate cost, benefits, and impacts to ratepayers of any proposed renewable energy policy. This model is not intended to be used as the only source of information and analysis in the development of a cost-based renewable energy incentive policy.
2 http://financere.nrel.gov/finance/content/crest-model
3
This report is available at no cost from the National Renewable Energy Laboratory (NREL) at www.nrel.gov/publications.
Note: Policymakers are encouraged to review the report developed along with this tool, which includes an expanded discussion of energy-cost modeling options. Among other things, the report addresses the policy implications of modeling choices, and provides important definitions that may enhance the user’s understanding prior to running the model.
1.2 Model Design and Features The CREST model was designed with dual, and sometimes competing, objectives. The model architects have sought to create an easy-to-use model that appeals to a broad audience while simultaneously building in the features and flexibility necessary to simulate a range of ownership, financing, cost detail, and incentive options. The latter features in particular are intended to generate accurate and durable results that can meaningfully contribute to any jurisdiction’s policy making process.
The CREST model includes the flexibility to analyze:
• Ownership by either a taxable (private sector investor) or non-taxable (government, non-profit, or cooperative) entity
• Financing based on equity-only or a specified proportion of equity and debt, subject to minimum debt service coverage requirements
• A range in the level of detail for capital and operating cost inputs
• All of the most commonly available federal and state renewable energy incentives to ensure that modeling results produce a COE net of other available incentives.
The CREST model also allows the user to easily conduct sensitivity analyses, including variations in:
• Incentive payment durations
• Assumed project revenue for the remainder of a generator’s expected life following the end of the incentive payment term
• The ability of equity investors to efficiently utilize tax incentives.
1.3 Model Outputs CREST model results can be calculated as either a constant fixed price (sometimes referred to as the “nominal levelized price”) or an escalating payment stream.
The primary output is the modeled project’s COE. The COE is the year-one price in cents per kilowatt hour (¢/kWh) necessary for the project to meet all expenses and debt service obligations (if applicable), as well as the equity investors’ minimum required after-tax rate of return. At the model user’s discretion, the COE can be calculated to assume an escalation rate (applied to all or a portion of the initial rate) over time. In calculating the COE, the CREST model includes the option to specify both a percentage of the tariff subject to escalation and the associated tariff escalation rate. The results can be used to inform a range of cost-based incentives, including FIT rates.
4
This report is available at no cost from the National Renewable Energy Laboratory (NREL) at www.nrel.gov/publications.
The secondary output is the modeled project’s levelized cost of energy (LCOE).3 The LCOE is a single, fixed, non-escalating value over the incentive’s payment duration. The escalating stream of payments generated by the COE and the constant stream of payments generated by the LCOE have the same Net Present Value (NPV) when discounted at the same required rate of equity return. Policymakers can refer to the LCOE output if policy objectives favor a single, fixed price per kWh for the life of the cost-based tariff. If the tariff rate escalation factor is set to zero, then the calculated COE and LCOE values will be equal. Developers, policy makers, and all other model users must understand, however, that while the LCOE may result in the same after-tax IRR as an equivalent escalating Year One COE, the two scenarios would have dramatically different cash flow implications for the project.
In addition to the COE and LCOE, annual summaries are also provided for revenues, operating expenses, debt service, reserves, pre-tax cash flow, taxable income, tax benefit or loss, after-tax cash flow, cumulative cash flow, after-tax IRR, and debt service coverage ratio (DSCR)4. These annual figures are provided to promote the transparency and credibility of the discounted cash flow calculations as reasonably realistic metrics and to facilitate collaboration among the stakeholders using this information.
The remainder of this User Manual provides a guided tour of the CREST model’s layout and operation.
2 Guided Tour
The CREST model consists of six worksheets: (1) Introduction, (2) Inputs, (3) Summary Results, (4) Annual Cash Flows & Returns, (5) Cash Flow, and (6) Complex Inputs. These worksheets are summarized below.
1. The Introduction worksheet provides basic information about the model itself, including an explanation of the model’s architecture and a description of the formatting of inputs, drop-down menus, and calculations. There is also an introduction to operating the model and understanding the results. This worksheet should be reviewed by the user prior to initially operating the model and will serve as a reference thereafter.
2. The Inputs worksheet will be the focal point of the model for all users. As a result, the most detailed descriptions in this User Manual will focus on this worksheet. The Inputs worksheet is the entry point for nearly all user-defined variables. Users who elect to enter
3 The “levelized cost-of-energy” is presented either as a constant price in each year (nominal levelized) or as a constant price adjusted for inflation (real levelized). Real LCOE is often used for comparative studies, whereas the nominal LCOE is typically used in setting, describing, or establishing actual prices. The CREST model calculates a nominal LCOE. 4 A debt service coverage ratio, or DSCR, is a fraction with EBITDA (earnings before interest, taxes, depreciation and amortization – otherwise known as operating cash flow) in the numerator and the sum of principal and interest owed for the same period in the denominator. The DSCR is one of several tools used by lending institutions to assess the risk that a project will not be able to repay its loan.
5
This report is available at no cost from the National Renewable Energy Laboratory (NREL) at www.nrel.gov/publications.
capital costs at the greatest available level of detail will also use the Complex Inputs worksheet.5 Otherwise, all user-defined variables appear on the Inputs worksheet.
The user should expect to work regularly with this worksheet to enter data that is representative of the project being modeled and to develop and run multiple scenarios to test the effect of changing various inputs. The model offers the flexibility to analyze the impact on the COE of varying project ownership (public vs. private), capital structure (the relative percentages of equity and debt), the availability and utilization of federal and state incentives, and other changes in project characteristics. A detailed discussion in Chapter 3 of this User Manual will introduce each category of inputs, discuss the type of information required to populate each of these groupings, and explain the ability to select key modeling criteria – such as input granularity. It is important to remember that the usefulness and accuracy of modeling outputs are directly linked to the accuracy of the user-defined inputs. To this end, users should take care to research all applicable inputs prior to operating the model and to consider the policy objectives and applicability of the results before drawing conclusions.
3. The Summary Results worksheet is where the COE and LCOE outputs of the model are located. The COE is the primary model output. The LCOE, displayed below and separate from the COE, provides the equivalent nominal levelized tariff rate. As previously stated, model users must understand that while the LCOE may result in the same after-tax IRR as an equivalent escalating Year One COE, the two scenarios would have significantly different cash flow implications. Specifically, a non-escalating payment stream may cause one or more years of negative cash flow as project expenses increase over time. To view the cash flow implications of setting an incentive using LCOE, the user should enter zero for Cost-Based Tariff Escalation Rate on the Inputs worksheet and then compare the Annual Cash Flows & Returns worksheet results to the COE analysis.
This worksheet also provides the framework for storing the outputs and associated key inputs of multiple model runs. After entering all assumptions on the Inputs worksheet, the user will turn to the Summary Results worksheet to identify and aggregate the summary information that will assist the decision making process, as described further in Chapter 5.
4. The Annual Cash Flows & Returns worksheet provides a summary of the modeled project’s annual economics. Although not as detailed as the Cash Flow worksheet, discussed below, this worksheet provides the user with an annual summary of the project’s key economic drivers, including revenues, operating expenses, debt service (if applicable), reserves, pre-tax cash flow, taxable income, tax benefit or loss, after-tax cash flow, cumulative cash flow, after-tax IRR, and DSCR (if applicable). These details are intended to promote transparency of the project’s cash and tax benefits. While this worksheet may be of limited interest to policy-makers, it will provide important summary
5 In addition to detailed capital cost inputs, the Complex Inputs worksheet also allows the user to input year-by-year market value of production forecast when the users has defined the FIT Payment Duration as less than the project useful life and has selected the “Year-by-Year” option under Market Value Forecast Methodology.
6
This report is available at no cost from the National Renewable Energy Laboratory (NREL) at www.nrel.gov/publications.
information to project developers, investors, and other stakeholders involved in the incentive rate-setting process.
5. The Cash Flow worksheet provides a detailed, line-by-line derivation of the modeled project's annual cash flows. This worksheet constitutes the “guts” of the model, in which the revenue, expenses, debt service (if applicable), depreciation and tax incentives (if applicable) are used to calculate the project’s pre-tax IRR, after-tax IRR, and NPV at the specified target after-tax equity IRR for the stated term. The Cash Flow worksheet also includes the calculation of the COE. Detailed supporting calculations provide the loan amortization schedule (if applicable), depreciation allocation and schedules, the utilization of tax benefits, and the use of reserve accounts to ensure coverage of debt service, operating expenses, major equipment repairs or replacements, and decommissioning. Although the cells in this worksheet are locked and therefore are not able to be manipulated by the user, the formulae are visible and more sophisticated users may wish to review the details of this worksheet to gain a further understanding of the analysis.
Note: In an effort to keep the model standardized for all users, each of the cells in the workbook is locked except for the user-defined input cells on the Inputs and Complex Inputs worksheets, and the table on the Summary Results worksheet. Users interested in a customized version of the model should send a message to [email protected].
6. The Complex Inputs worksheet will be utilized only if:
A. The user selects (on the Inputs worksheet) the option to employ a detailed, user-defined, breakdown of project costs, or
B. The user desires to model continued project revenue after the tariff payment duration ends.
In many instances, such detail may be more than is utilized in the Cost-Based Tariff rate setting process. Therefore, this worksheet may not be used in some circumstances.
By combining the functionality from the worksheets described above, the CREST model calculates and summarizes the minimum annual revenue stream (the COE) needed to enable the modeled project to secure the investment necessary for construction and operation.
3 Understanding and Using the Inputs Worksheet
3.1 Conventions All user-defined modeling assumptions are found on the Inputs worksheet, and—when complex inputs are selected by the user—the Complex Inputs worksheet. To use the Inputs and Complex Inputs worksheets, the user should take some time to get acquainted with the conventions of the CREST model. The following elements are of particular importance.
1. Text Colors: Blue bold text denotes a user-defined input. The user is responsible for modifying these cells to be consistent with the project being evaluated. These user-defined inputs are present only in the Inputs and Complex Inputs worksheets.

7
This report is available at no cost from the National Renewable Energy Laboratory (NREL) at www.nrel.gov/publications.
Black text is reserved for calculated values. These cells are protected and cannot be modified by the user to prevent inadvertent corruption of the model.
2. Cells with Blue Bold Text and Yellow Background Cells containing blue bolded text with a light yellow background highlight user-defined inputs that must be selected from among a predefined set of options via a drop-down menu list. These cells will require close attention as the user’s selections can have significant impacts on the model structure and outputs. For example, inputs controlled by drop-down menus include election of the level of complexity of inputs (which changes the available input fields), as well as choices of whether project revenues are taxable or whether certain incentive programs are available.
3. Links Within the Model For users interested in using the Complex Inputs option, the Inputs and Complex Inputs worksheets have internal hyperlinks in specified cells that provide the user with a quick and easy means of navigating between these two worksheets while entering data.
4. Units: In the Inputs worksheet, the units of measure for each section, (i.e. “Project Size and Performance,” “Capital Costs,” etc.) are designated in the second column of each table. Explanations of these units, some of which appear only in selected models, are as follows:
• (kW) kilowatt – a standard measure of electrical capacity, equal to 1,000 watts. • (kWh) kilowatt hour – a standard measure of electrical output. A 1-kW generator
operating at rated capacity for one hour will produce 1 kWh of electricity. • (DC) direct current – the unidirectional flow of electric charge • (AC) alternating current – the multidirectional flow of electric charge • ($) – All CREST model values are in nominal6 dollars or cents • ($/kW-yr) – an annual expense (or revenue) based on generator capacity • (¢/kWh) – cents per kilowatt hour • (%) – an input with units expressed as a percentage • (years or year) – an input applicable to a specified duration or project year • ($/yr) – inputs measured in dollars and applied annually • (months) –designates the number of months to which an input applies • Pass/Fail – denotes whether one of the two DSCR tests have passed or failed. • Cubic foot – a unit of volume used to measure biogas • BTU – British Thermal Unit, a unit measuring the energy content of a fuel • Therm – 100,000 BTUs
6 Nominal dollars are actual dollars of costs, payments, or revenues in the specified year, unadjusted for the relative value of dollars in different years due to the impact of inflation. The face value of currency, financial statements, and actual contractual payments are conventionally stated in nominal dollars. Nominal dollars are in contrast to real dollars, which are corrected for inflation for comparison purposes, to account for the time value of money.

8
This report is available at no cost from the National Renewable Energy Laboratory (NREL) at www.nrel.gov/publications.
• BTU/kWh- a measure of the efficiency of a power plants equal to the amount of energy it takes to produce a unit of electricity
• BTU/cubic foot - the heating value of a gas as defined by the thermal energy per unit volume of the gas
• cubic feet/year – unit of volume commonly used to measure quantities of natural gas on an annual
• $/MMBtu - dollars per one million BTU • $/therm- dollars per therm. Therm is a unit of heat energy equal to 100,000 BTUs
3.2 In-Model User Support Resources The model contains several features to promote ease of use and accuracy of results. The “check” and “notes” cells provide the user with an easily accessible set of guidelines for using the CREST model. While the “check” indicators give users instant feedback on whether or not all required fields have been populated, the “notes” provide explanations of the appropriate use of each input cell.
1. “Check” cells The “Check” column (found to the left of each input table) evaluates whether or not values have been entered in all required fields. Green denotes an accepted entry in a required field or a calculation for which the minimum required precedents have been satisfied. Red denotes the absence of an entry in a required field, or a calculation for which the minimum required precedents have NOT been satisfied. Please note that while the “Check” column ensures the population of all required fields, this column does NOT validate such entries. It is the model user's responsibility to provide inputs which accurately represent the technology and project being modeled and reflect the right units of measure. In some cases the “Notes” cells nonetheless provide guidance regarding typical inputs or ranges.
2. “Notes” cells Each cell in the “Notes” column (found to the right of each input table) provides:
• A brief description of the input in the corresponding row
• The input’s application within the model
• In some cases, the range of values that might be expected to populate that input cell.
The notes utilize the MS Excel comments feature. To view these notes, the user must simply roll the cursor over the cell containing a red question mark and located to the right of the applicable input. It is the model user’s responsibility to research and validate the applicability of, and appropriate value for, each input. Example of “Check” and “Notes” cells:
Check Project Size and Performance Notes
Generator Nameplate Capacity kW dc 2,200 ?
9
This report is available at no cost from the National Renewable Energy Laboratory (NREL) at www.nrel.gov/publications.
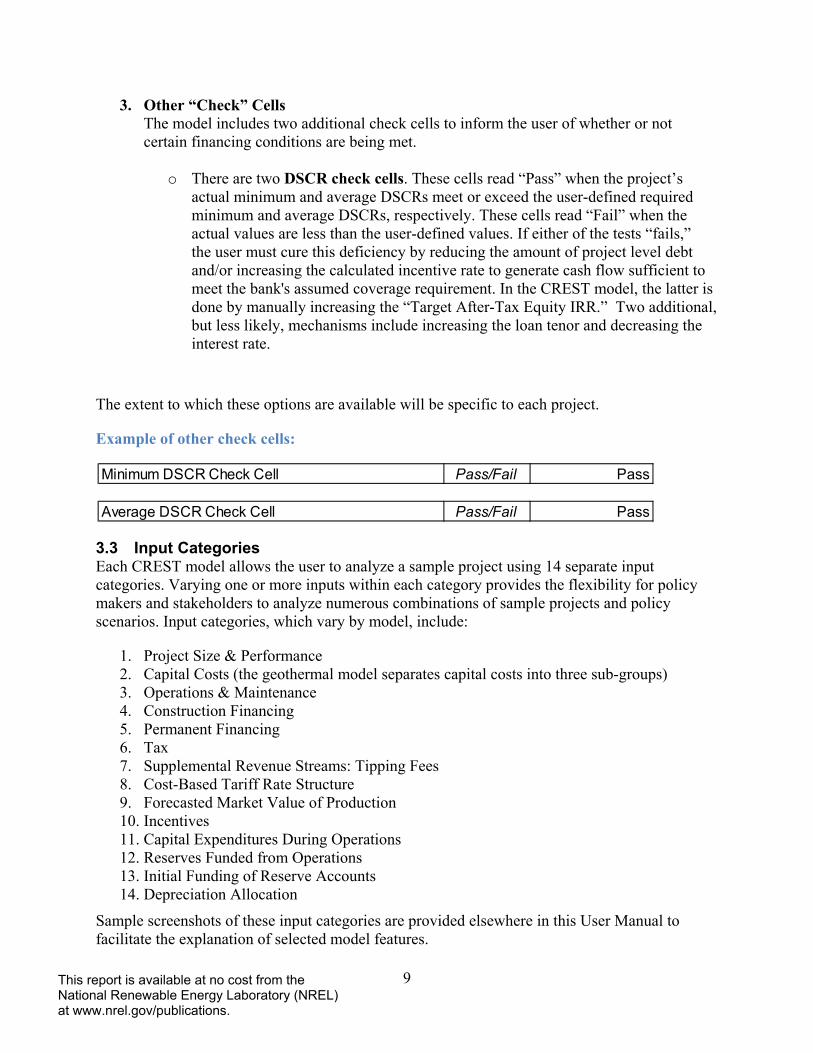
3. Other “Check” Cells The model includes two additional check cells to inform the user of whether or not certain financing conditions are being met.
o There are two DSCR check cells. These cells read “Pass” when the project’s actual minimum and average DSCRs meet or exceed the user-defined required minimum and average DSCRs, respectively. These cells read “Fail” when the actual values are less than the user-defined values. If either of the tests “fails,” the user must cure this deficiency by reducing the amount of project level debt and/or increasing the calculated incentive rate to generate cash flow sufficient to meet the bank's assumed coverage requirement. In the CREST model, the latter is done by manually increasing the “Target After-Tax Equity IRR.” Two additional, but less likely, mechanisms include increasing the loan tenor and decreasing the interest rate.
The extent to which these options are available will be specific to each project.
Example of other check cells:
3.3 Input Categories Each CREST model allows the user to analyze a sample project using 14 separate input categories. Varying one or more inputs within each category provides the flexibility for policy makers and stakeholders to analyze numerous combinations of sample projects and policy scenarios. Input categories, which vary by model, include:
1. Project Size & Performance 2. Capital Costs (the geothermal model separates capital costs into three sub-groups) 3. Operations & Maintenance 4. Construction Financing 5. Permanent Financing 6. Tax 7. Supplemental Revenue Streams: Tipping Fees 8. Cost-Based Tariff Rate Structure 9. Forecasted Market Value of Production 10. Incentives 11. Capital Expenditures During Operations 12. Reserves Funded from Operations 13. Initial Funding of Reserve Accounts 14. Depreciation Allocation
Sample screenshots of these input categories are provided elsewhere in this User Manual to facilitate the explanation of selected model features.
Minimum DSCR Check Cell Pass/Fail Pass
Average DSCR Check Cell Pass/Fail Pass
10
This report is available at no cost from the National Renewable Energy Laboratory (NREL) at www.nrel.gov/publications.
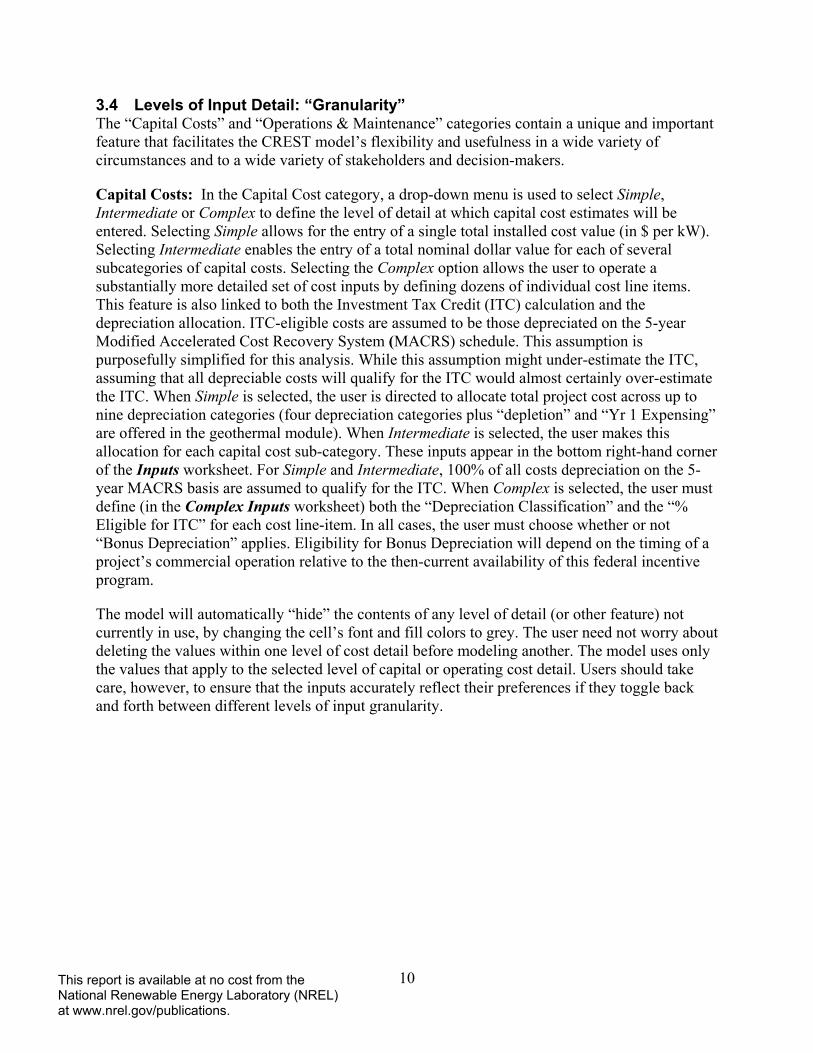
3.4 Levels of Input Detail: “Granularity” The “Capital Costs” and “Operations & Maintenance” categories contain a unique and important feature that facilitates the CREST model’s flexibility and usefulness in a wide variety of circumstances and to a wide variety of stakeholders and decision-makers.
Capital Costs: In the Capital Cost category, a drop-down menu is used to select Simple, Intermediate or Complex to define the level of detail at which capital cost estimates will be entered. Selecting Simple allows for the entry of a single total installed cost value (in $ per kW). Selecting Intermediate enables the entry of a total nominal dollar value for each of several subcategories of capital costs. Selecting the Complex option allows the user to operate a substantially more detailed set of cost inputs by defining dozens of individual cost line items. This feature is also linked to both the Investment Tax Credit (ITC) calculation and the depreciation allocation. ITC-eligible costs are assumed to be those depreciated on the 5-year Modified Accelerated Cost Recovery System (MACRS) schedule. This assumption is purposefully simplified for this analysis. While this assumption might under-estimate the ITC, assuming that all depreciable costs will qualify for the ITC would almost certainly over-estimate the ITC. When Simple is selected, the user is directed to allocate total project cost across up to nine depreciation categories (four depreciation categories plus “depletion” and “Yr 1 Expensing” are offered in the geothermal module). When Intermediate is selected, the user makes this allocation for each capital cost sub-category. These inputs appear in the bottom right-hand corner of the Inputs worksheet. For Simple and Intermediate, 100% of all costs depreciation on the 5-year MACRS basis are assumed to qualify for the ITC. When Complex is selected, the user must define (in the Complex Inputs worksheet) both the “Depreciation Classification” and the “% Eligible for ITC” for each cost line-item. In all cases, the user must choose whether or not “Bonus Depreciation” applies. Eligibility for Bonus Depreciation will depend on the timing of a project’s commercial operation relative to the then-current availability of this federal incentive program.
The model will automatically “hide” the contents of any level of detail (or other feature) not currently in use, by changing the cell’s font and fill colors to grey. The user need not worry about deleting the values within one level of cost detail before modeling another. The model uses only the values that apply to the selected level of capital or operating cost detail. Users should take care, however, to ensure that the inputs accurately reflect their preferences if they toggle back and forth between different levels of input granularity.

11
This report is available at no cost from the National Renewable Energy Laboratory (NREL) at www.nrel.gov/publications.
Example of Capital Cost inputs at “Simple” level of input detail:
Example of Capital Cost inputs at “Intermediate” level of input detail:
Capital Costs Units Input ValueSelect Cost Level of Detail Simple
Total Installed Cost $/kW $2,500Generation Equipment $ $10,000,000Balance of Plant $ $9,000,000Interconnection $ $3,000,000Development Costs & Fee $ $1,000,000Reserves & Financing Costs $ $1,609,053
Click Here for Complex Input WorksheetTotal Installed Cost $ $25,000,000Total Installed Cost $/kW $2,500
Capital CostsSelect Cost Level of Detail Intermediate
$/Watt dc $4.75Generation Equipment $ $5,500,000Balance of Plant $ $3,750,000Interconnection $ $500,000Development Costs & Fee $ $750,000Reserves & Financing Costs $ $488,815
Total Installed Cost $ $10,988,815Total Installed Cost $/Watt dc $4.99
12
This report is available at no cost from the National Renewable Energy Laboratory (NREL) at www.nrel.gov/publications.
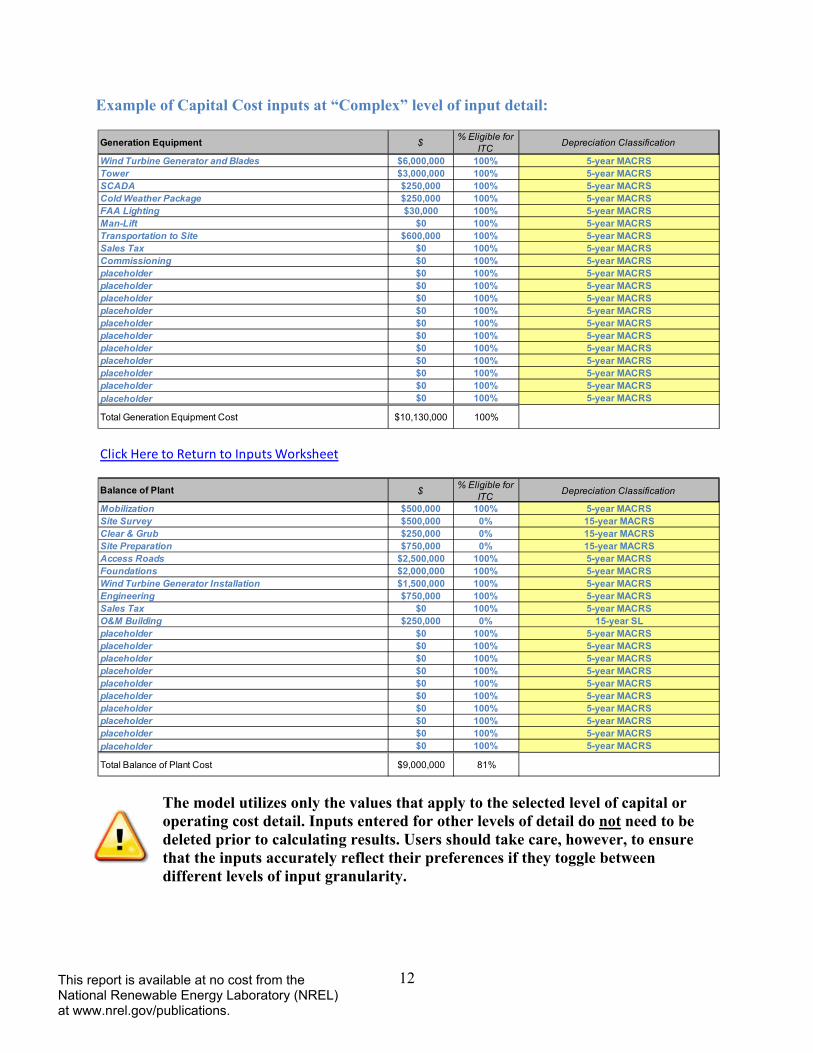
Example of Capital Cost inputs at “Complex” level of input detail:
The model utilizes only the values that apply to the selected level of capital or operating cost detail. Inputs entered for other levels of detail do not need to be deleted prior to calculating results. Users should take care, however, to ensure that the inputs accurately reflect their preferences if they toggle between different levels of input granularity.
Generation Equipment $ % Eligible for ITC Depreciation Classification
Wind Turbine Generator and Blades $6,000,000 100% 5-year MACRSTower $3,000,000 100% 5-year MACRSSCADA $250,000 100% 5-year MACRSCold Weather Package $250,000 100% 5-year MACRSFAA Lighting $30,000 100% 5-year MACRSMan-Lift $0 100% 5-year MACRSTransportation to Site $600,000 100% 5-year MACRSSales Tax $0 100% 5-year MACRSCommissioning $0 100% 5-year MACRSplaceholder $0 100% 5-year MACRSplaceholder $0 100% 5-year MACRSplaceholder $0 100% 5-year MACRSplaceholder $0 100% 5-year MACRSplaceholder $0 100% 5-year MACRSplaceholder $0 100% 5-year MACRSplaceholder $0 100% 5-year MACRSplaceholder $0 100% 5-year MACRSplaceholder $0 100% 5-year MACRSplaceholder $0 100% 5-year MACRSplaceholder $0 100% 5-year MACRS
Total Generation Equipment Cost $10,130,000 100%
Click Here to Return to Inputs Worksheet
Balance of Plant $ % Eligible for ITC Depreciation Classification
Mobilization $500,000 100% 5-year MACRSSite Survey $500,000 0% 15-year MACRSClear & Grub $250,000 0% 15-year MACRSSite Preparation $750,000 0% 15-year MACRSAccess Roads $2,500,000 100% 5-year MACRSFoundations $2,000,000 100% 5-year MACRSWind Turbine Generator Installation $1,500,000 100% 5-year MACRSEngineering $750,000 100% 5-year MACRSSales Tax $0 100% 5-year MACRSO&M Building $250,000 0% 15-year SLplaceholder $0 100% 5-year MACRSplaceholder $0 100% 5-year MACRSplaceholder $0 100% 5-year MACRSplaceholder $0 100% 5-year MACRSplaceholder $0 100% 5-year MACRSplaceholder $0 100% 5-year MACRSplaceholder $0 100% 5-year MACRSplaceholder $0 100% 5-year MACRSplaceholder $0 100% 5-year MACRSplaceholder $0 100% 5-year MACRS
Total Balance of Plant Cost $9,000,000 81%
13
This report is available at no cost from the National Renewable Energy Laboratory (NREL) at www.nrel.gov/publications.
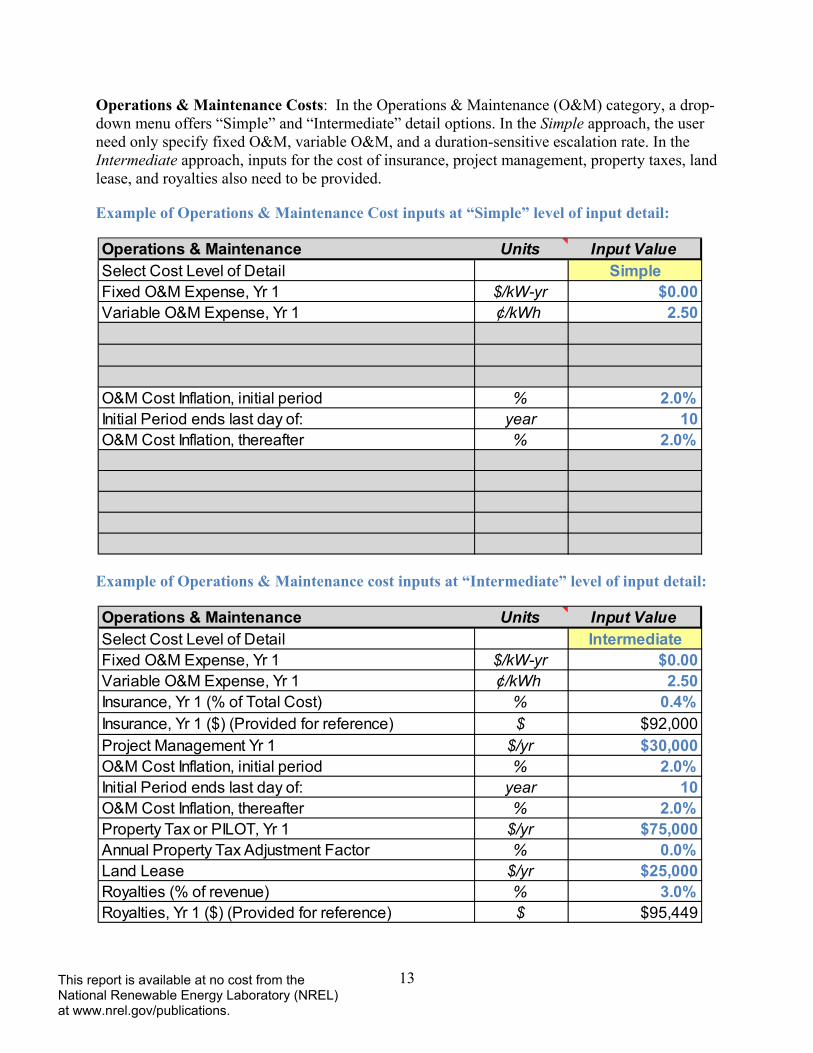
Operations & Maintenance Costs: In the Operations & Maintenance (O&M) category, a drop-down menu offers “Simple” and “Intermediate” detail options. In the Simple approach, the user need only specify fixed O&M, variable O&M, and a duration-sensitive escalation rate. In the Intermediate approach, inputs for the cost of insurance, project management, property taxes, land lease, and royalties also need to be provided.
Example of Operations & Maintenance Cost inputs at “Simple” level of input detail:
Example of Operations & Maintenance cost inputs at “Intermediate” level of input detail:
Operations & Maintenance Units Input ValueSelect Cost Level of Detail SimpleFixed O&M Expense, Yr 1 $/kW-yr $0.00Variable O&M Expense, Yr 1 ¢/kWh 2.50Insurance, Yr 1 (% of Total Cost) % 0.4%Insurance, Yr 1 ($) (Provided for reference) $ $92,000Project Management Yr 1 $/yr $30,000O&M Cost Inflation, initial period % 2.0%Initial Period ends last day of: year 10O&M Cost Inflation, thereafter % 2.0%Property Tax or PILOT, Yr 1 $/yr $75,000Annual Property Tax Adjustment Factor % 0.0%Land Lease $/yr $25,000Royalties (% of revenue) % 3.0%Royalties, Yr 1 ($) (Provided for reference) $ $0
Operations & Maintenance Units Input ValueSelect Cost Level of Detail IntermediateFixed O&M Expense, Yr 1 $/kW-yr $0.00Variable O&M Expense, Yr 1 ¢/kWh 2.50Insurance, Yr 1 (% of Total Cost) % 0.4%Insurance, Yr 1 ($) (Provided for reference) $ $92,000Project Management Yr 1 $/yr $30,000O&M Cost Inflation, initial period % 2.0%Initial Period ends last day of: year 10O&M Cost Inflation, thereafter % 2.0%Property Tax or PILOT, Yr 1 $/yr $75,000Annual Property Tax Adjustment Factor % 0.0%Land Lease $/yr $25,000Royalties (% of revenue) % 3.0%Royalties, Yr 1 ($) (Provided for reference) $ $95,449
14
This report is available at no cost from the National Renewable Energy Laboratory (NREL) at www.nrel.gov/publications.
4 Operating the Model
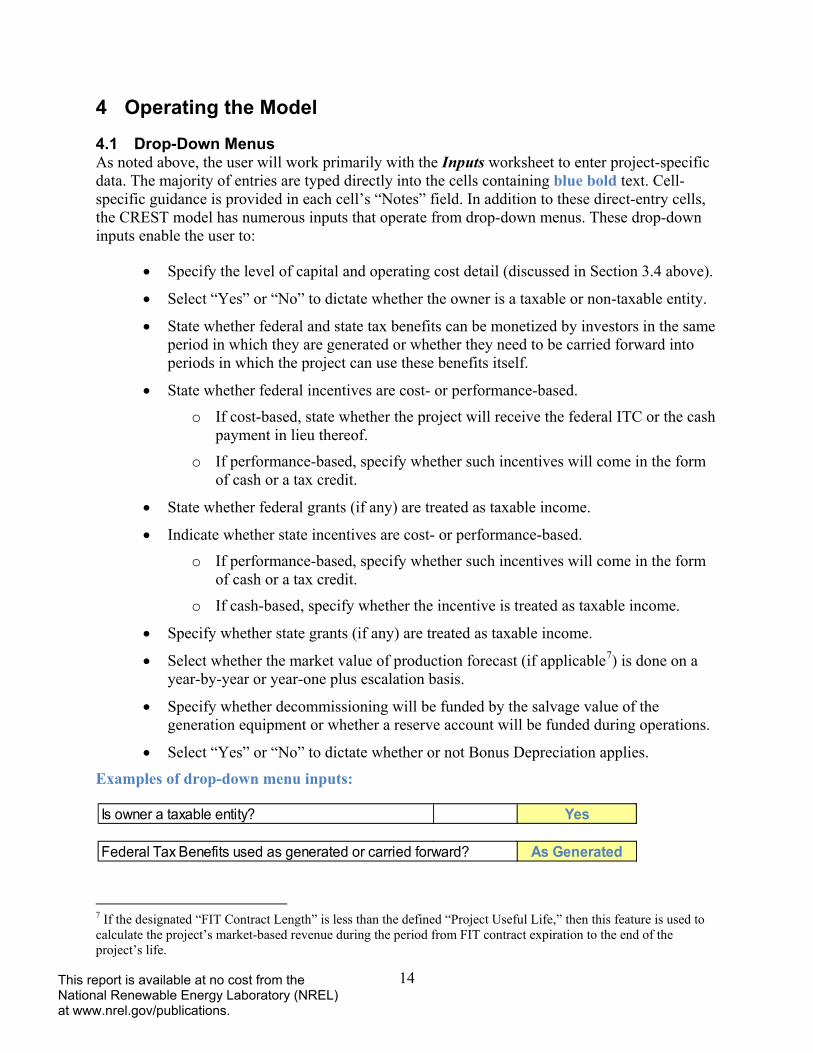
4.1 Drop-Down Menus As noted above, the user will work primarily with the Inputs worksheet to enter project-specific data. The majority of entries are typed directly into the cells containing blue bold text. Cell-specific guidance is provided in each cell’s “Notes” field. In addition to these direct-entry cells, the CREST model has numerous inputs that operate from drop-down menus. These drop-down inputs enable the user to:
• Specify the level of capital and operating cost detail (discussed in Section 3.4 above).
• Select “Yes” or “No” to dictate whether the owner is a taxable or non-taxable entity.
• State whether federal and state tax benefits can be monetized by investors in the same period in which they are generated or whether they need to be carried forward into periods in which the project can use these benefits itself.
• State whether federal incentives are cost- or performance-based.
o If cost-based, state whether the project will receive the federal ITC or the cash payment in lieu thereof.
o If performance-based, specify whether such incentives will come in the form of cash or a tax credit.
• State whether federal grants (if any) are treated as taxable income.
• Indicate whether state incentives are cost- or performance-based.
o If performance-based, specify whether such incentives will come in the form of cash or a tax credit.
o If cash-based, specify whether the incentive is treated as taxable income.
• Specify whether state grants (if any) are treated as taxable income.
• Select whether the market value of production forecast (if applicable7) is done on a year-by-year or year-one plus escalation basis.
• Specify whether decommissioning will be funded by the salvage value of the generation equipment or whether a reserve account will be funded during operations.
• Select “Yes” or “No” to dictate whether or not Bonus Depreciation applies.
Examples of drop-down menu inputs:
7 If the designated “FIT Contract Length” is less than the defined “Project Useful Life,” then this feature is used to calculate the project’s market-based revenue during the period from FIT contract expiration to the end of the project’s life.
Is owner a taxable entity? Yes
Federal Tax Benefits used as generated or carried forward? As Generated
15
This report is available at no cost from the National Renewable Energy Laboratory (NREL) at www.nrel.gov/publications.
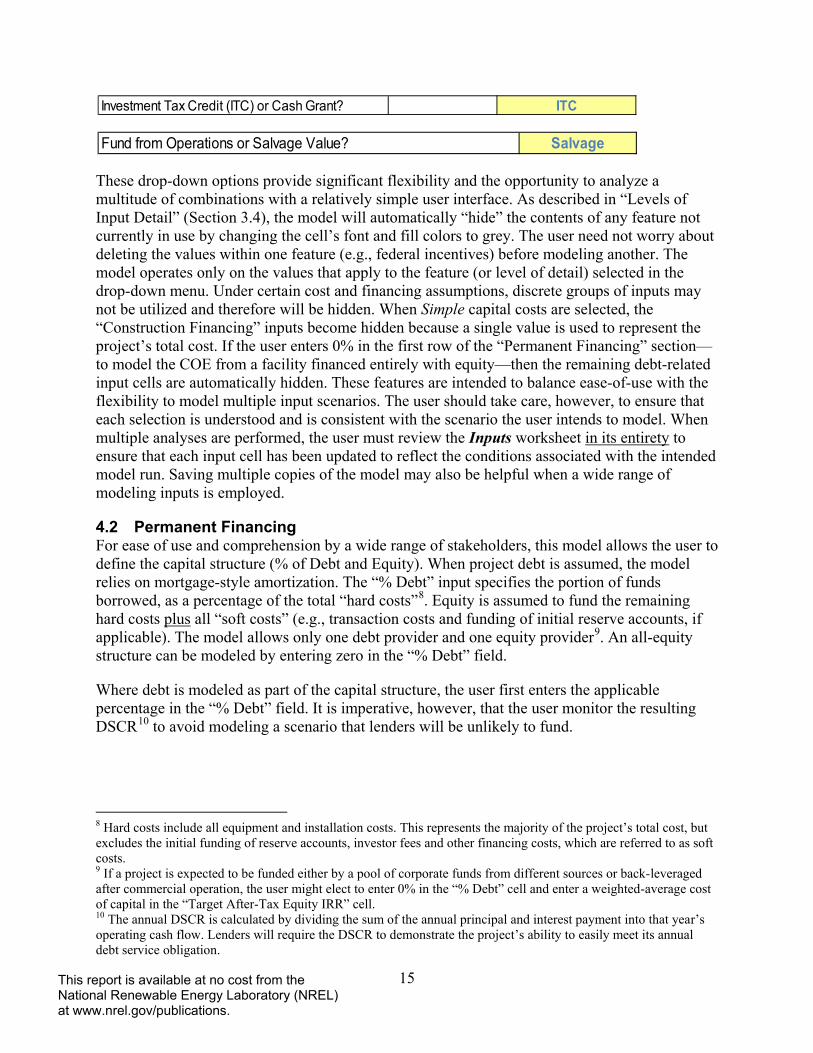
These drop-down options provide significant flexibility and the opportunity to analyze a multitude of combinations with a relatively simple user interface. As described in “Levels of Input Detail” (Section 3.4), the model will automatically “hide” the contents of any feature not currently in use by changing the cell’s font and fill colors to grey. The user need not worry about deleting the values within one feature (e.g., federal incentives) before modeling another. The model operates only on the values that apply to the feature (or level of detail) selected in the drop-down menu. Under certain cost and financing assumptions, discrete groups of inputs may not be utilized and therefore will be hidden. When Simple capital costs are selected, the “Construction Financing” inputs become hidden because a single value is used to represent the project’s total cost. If the user enters 0% in the first row of the “Permanent Financing” section—to model the COE from a facility financed entirely with equity—then the remaining debt-related input cells are automatically hidden. These features are intended to balance ease-of-use with the flexibility to model multiple input scenarios. The user should take care, however, to ensure that each selection is understood and is consistent with the scenario the user intends to model. When multiple analyses are performed, the user must review the Inputs worksheet in its entirety to ensure that each input cell has been updated to reflect the conditions associated with the intended model run. Saving multiple copies of the model may also be helpful when a wide range of modeling inputs is employed.
4.2 Permanent Financing For ease of use and comprehension by a wide range of stakeholders, this model allows the user to define the capital structure (% of Debt and Equity). When project debt is assumed, the model relies on mortgage-style amortization. The “% Debt” input specifies the portion of funds borrowed, as a percentage of the total “hard costs”8. Equity is assumed to fund the remaining hard costs plus all “soft costs” (e.g., transaction costs and funding of initial reserve accounts, if applicable). The model allows only one debt provider and one equity provider9. An all-equity structure can be modeled by entering zero in the “% Debt” field.
Where debt is modeled as part of the capital structure, the user first enters the applicable percentage in the “% Debt” field. It is imperative, however, that the user monitor the resulting DSCR10 to avoid modeling a scenario that lenders will be unlikely to fund.
8 Hard costs include all equipment and installation costs. This represents the majority of the project’s total cost, but excludes the initial funding of reserve accounts, investor fees and other financing costs, which are referred to as soft costs. 9 If a project is expected to be funded either by a pool of corporate funds from different sources or back-leveraged after commercial operation, the user might elect to enter 0% in the “% Debt” cell and enter a weighted-average cost of capital in the “Target After-Tax Equity IRR” cell. 10 The annual DSCR is calculated by dividing the sum of the annual principal and interest payment into that year’s operating cash flow. Lenders will require the DSCR to demonstrate the project’s ability to easily meet its annual debt service obligation.
Investment Tax Credit (ITC) or Cash Grant? ITC
Fund from Operations or Salvage Value? Salvage
16
This report is available at no cost from the National Renewable Energy Laboratory (NREL) at www.nrel.gov/publications.
4.3 Outputs Once the user has entered all applicable inputs, the outputs of that specific model run will be calculated automatically and displayed on the Summary Results worksheet in column D. To ensure automatic calculation, users must confirm that the “Calculation Options” feature in Microsoft Excel is set to “Automatic.” If “Calculation Options” is set to either “Automatic Except for Data Tables” or “Manual,” then the user will need to press the F9 key to calculate and update the results each time an input is changed. Even with Calculation Options set to “Automatic,” it is often necessary to press the F9 key at least once to ensure that MS Excel completes the sequential data table calculations on which the model relies.
Even with Calculation Options set to “Automatic,” it is often necessary to press the F9 key at least once to ensure that MS Excel completes the sequential data table calculations on which the model relies.
Any circumstance in which the model returns a “#N/A” reference in one or more cells denotes the need to press F9 until the data table calculations are complete and the final value is displayed in the COE and LCOE fields. The user must ensure that all inputs for the intended analysis have been entered before the user views and copies results from the Summary Results worksheet. This is important since the automatic nature of the calculation means that the Summary Results tab will re-calculate results on a continuous basis and has no means of verifying when the user has finished updating the Inputs worksheet for a particular model run. Editable fields are provided to enable the user to both name model “scenarios” and enter notes associated with each analysis.
Any circumstance in which the model returns a “#N/A” reference on one or more cells denotes the need to press F9 until the data table calculations are complete and the final value is displayed in the COE and LCOE fields.
Capital Structure Optimization
Where an amount of debt up to and including the maximum sustainable debt is desired, the user can manually adjust the “% Debt” entry upward so long as both DSCR Check Cells read “Pass.” Maximum sustainable leverage is achieved at the highest % Debt entry that does not cause the DSCRs indictors to read “Fail.” If a specific % Debt is desired (such as a municipality planning a 100% bond financing) and such percentage causes the DSCR to “Fail,” then the user must specify the desired customized debt level, confirm the accuracy of the loan tenor, interest rate, and DSCR (1.20 might be appropriate for a municipal general obligation bond) and then manually adjust the “Target After-Tax Equity IRR” until both DSCRs are met. The user can also employ MS Excel’s Solver function and make the same calculation automatically.
17
This report is available at no cost from the National Renewable Energy Laboratory (NREL) at www.nrel.gov/publications.
5 Running and Comparing Multiple Analyses
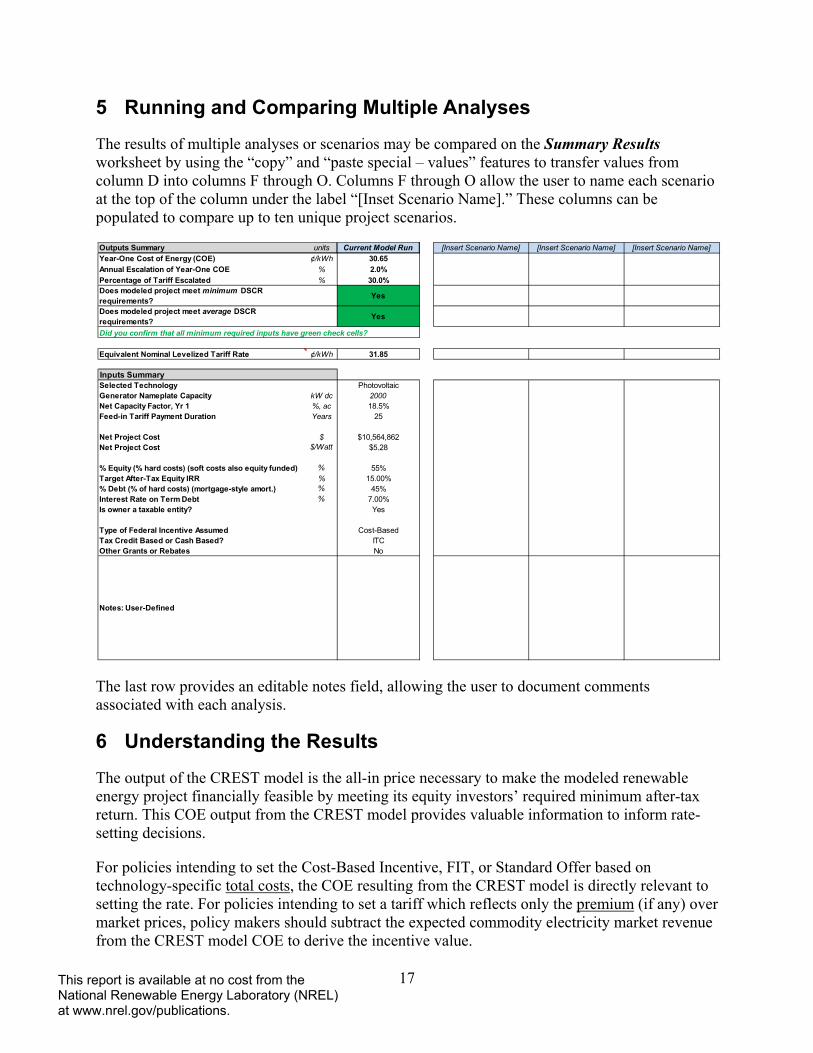
The results of multiple analyses or scenarios may be compared on the Summary Results worksheet by using the “copy” and “paste special – values” features to transfer values from column D into columns F through O. Columns F through O allow the user to name each scenario at the top of the column under the label “[Inset Scenario Name].” These columns can be populated to compare up to ten unique project scenarios.
The last row provides an editable notes field, allowing the user to document comments associated with each analysis.
6 Understanding the Results
The output of the CREST model is the all-in price necessary to make the modeled renewable energy project financially feasible by meeting its equity investors’ required minimum after-tax return. This COE output from the CREST model provides valuable information to inform rate-setting decisions.
For policies intending to set the Cost-Based Incentive, FIT, or Standard Offer based on technology-specific total costs, the COE resulting from the CREST model is directly relevant to setting the rate. For policies intending to set a tariff which reflects only the premium (if any) over market prices, policy makers should subtract the expected commodity electricity market revenue from the CREST model COE to derive the incentive value.
Outputs Summary units Current Model Run [Insert Scenario Name] [Insert Scenario Name] [Insert Scenario Name]Year-One Cost of Energy (COE) ¢/kWh 30.65Annual Escalation of Year-One COE % 2.0%Percentage of Tariff Escalated % 30.0%Does modeled project meet minimum DSCR requirements? Yes
Does modeled project meet average DSCR requirements? Yes
Did you confirm that all minimum required inputs have green check cells?
Equivalent Nominal Levelized Tariff Rate ¢/kWh 31.85
Inputs SummarySelected Technology PhotovoltaicGenerator Nameplate Capacity kW dc 2000Net Capacity Factor, Yr 1 %, ac 18.5%Feed-in Tariff Payment Duration Years 25
Net Project Cost $ $10,564,862Net Project Cost $/Watt $5.28
% Equity (% hard costs) (soft costs also equity funded) % 55%Target After-Tax Equity IRR % 15.00%% Debt (% of hard costs) (mortgage-style amort.) % 45%Interest Rate on Term Debt % 7.00%Is owner a taxable entity? Yes
Type of Federal Incentive Assumed Cost-BasedTax Credit Based or Cash Based? ITCOther Grants or Rebates No
Notes: User-Defined
18
This report is available at no cost from the National Renewable Energy Laboratory (NREL) at www.nrel.gov/publications.
Note: For this model, the COE represents the value of energy, capacity, renewable energy certificates, and other potential revenue streams. Policy makers should be explicit about which commodities are conveyed at the cost-based tariff rate.
The Summary Results worksheet provides outputs based on the data entered for each run of the model. As outlined above, users are encouraged to run multiple scenarios to gain an understanding of how each varied assumption impacts the cost of energy.
7 Conclusion
The CREST models are a cost-of-energy analysis tool intended to assist policy makers evaluating an appropriate payment rate for a cost-based renewable energy incentive. The model aims to determine the COE, or minimum revenue per unit of production needed for a sample (modeled) renewable energy project to meet its investors’ assumed minimum required after-tax rate of return. This COE can be used to establish renewable energy tariff rates. This model was developed in conjunction with a report entitled Renewable Energy Cost Modeling: A Toolkit for Establishing Cost-Based Incentives in the United States. For more information about the factors, issues, and policy decisions involved in establishing cost-based incentives and rates, please refer to the report, located on NREL’s RE Project Finance Website11.
To request CREST model customization, please contact [email protected].
11 http://financere.nrel.gov/finance/content/crest-model

19
This report is available at no cost from the National Renewable Energy Laboratory (NREL) at www.nrel.gov/publications.
Appendix A: Solar CREST
While the five CREST models (solar, wind, geothermal, anaerobic digestion, and fuel cell) share a majority of common architecture, features, and conventions, several aspects of the solar CREST model have been tailored to solar-specific inputs. The features specific to the solar module of CREST are discussed in this appendix.
Technology Choices: The solar CREST model offers the user an option to calculate the COE from either a photovoltaic or a solar thermal electric facility. For the purpose of the CREST model, the sole difference between these two technologies is that photovoltaic capacity inputs are entered in kilowatts direct current (kW DC) while solar thermal electric capacity inputs are entered in kilowatts alternating current (kW AC). When Photovoltaic is selected, a “DC-to-AC conversion efficiency” input is utilized to calculate production in kWh AC. In both cases, the capacity factor12 input is expressed in AC.
Solar-Specific Capital Cost Inputs: In the Capital Cost category, the Intermediate approach contains inputs generally representative of solar project financial analyses, including generation equipment, balance of plant, interconnection, development costs and fee, and reserves and financing costs. The Complex Inputs worksheet offers the user an opportunity to define each cost line-item. For the solar CREST model, the “Capital Expenditures During Operations” category pertains to inverter replacements. The CREST solar model allows for up to two inverter replacements over the life of the project at user-defined intervals.
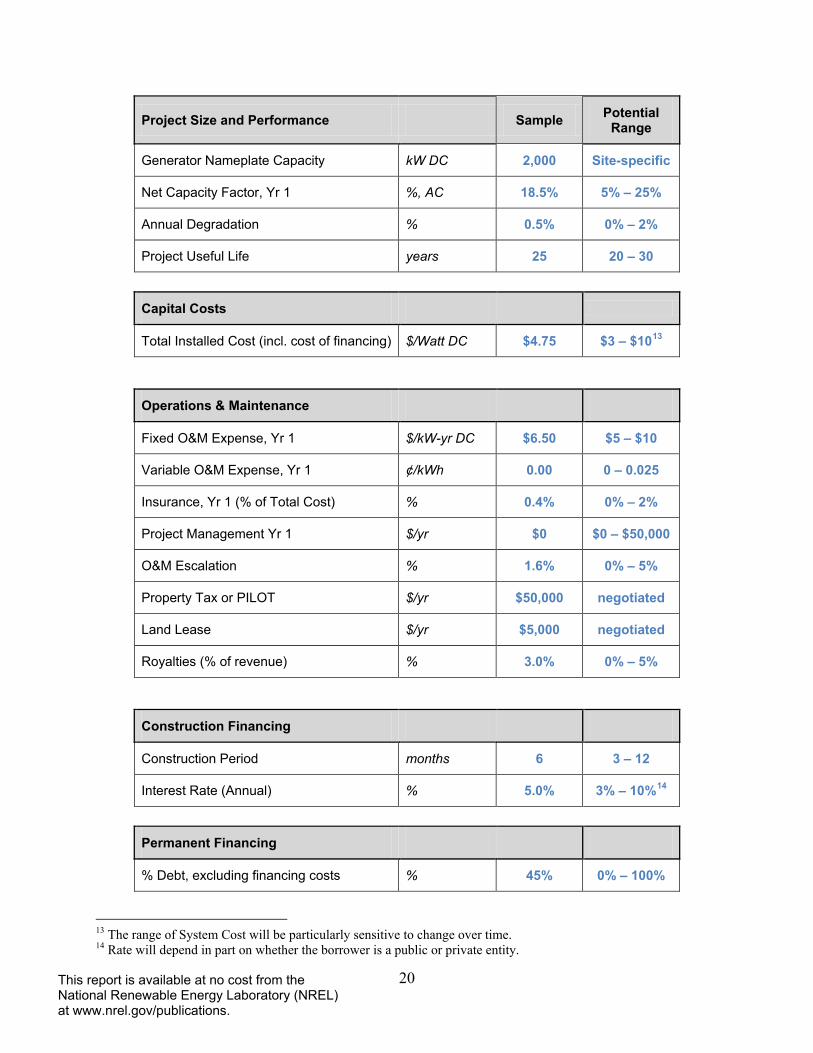
The remainder of this appendix focuses on the potential range of typical inputs that may be expected for a solar photovoltaic project (the most common anticipated use of the CREST model).
Sample Inputs
Some users of the CREST model may wish to reference sample inputs to aid in understanding how to populate and operate the model more effectively. For each of the solar, wind, geothermal, anaerobic digestion, and fuel cell modules, the CREST model comes preloaded with sample data. The values pre-populated in the model are not meant to be representative of a typical project. Site- and scale-specific issues will have a significant impact on project assumptions. Instead, these values are intended to provide the user with a sense of the magnitude that a particular input might take for the applicable technology.
The following table shows ranges of potential values based upon experience with solar photovoltaic technology to date. Disclaimer: Neither NREL nor Sustainable Energy Advantage LLC stands behind the representativeness of these values; they are provided for reference only and are based solely on anecdotal information. All values in the table below are based on 2010 market conditions. Many of the “potential ranges” should be expected to change over time with changes in technology, business practices, and policy. 12 The Capacity Factor represents the average power output (in kW) of the facility on a percentage basis. It is calculated by taking the total annual energy generation divided by the maximum possible annual generation if the facility was always operating at its rated output. Net Capacity Factor denotes that this figure has been adjusted to reflect electricity losses.
20
This report is available at no cost from the National Renewable Energy Laboratory (NREL) at www.nrel.gov/publications.
Project Size and Performance Sample Potential Range
Generator Nameplate Capacity kW DC 2,000 Site-specific
Net Capacity Factor, Yr 1 %, AC 18.5% 5% – 25%
Annual Degradation % 0.5% 0% – 2%
Project Useful Life years 25 20 – 30
Capital Costs
Total Installed Cost (incl. cost of financing) $/Watt DC $4.75 $3 – $1013
Operations & Maintenance
Fixed O&M Expense, Yr 1 $/kW-yr DC $6.50 $5 – $10
Variable O&M Expense, Yr 1 ¢/kWh 0.00 0 – 0.025
Insurance, Yr 1 (% of Total Cost) % 0.4% 0% – 2%
Project Management Yr 1 $/yr $0 $0 – $50,000
O&M Escalation % 1.6% 0% – 5%
Property Tax or PILOT $/yr $50,000 negotiated
Land Lease $/yr $5,000 negotiated
Royalties (% of revenue) % 3.0% 0% – 5%
Construction Financing
Construction Period months 6 3 – 12
Interest Rate (Annual) % 5.0% 3% – 10%14
Permanent Financing
% Debt, excluding financing costs % 45% 0% – 100%
13 The range of System Cost will be particularly sensitive to change over time. 14 Rate will depend in part on whether the borrower is a public or private entity.

21
This report is available at no cost from the National Renewable Energy Laboratory (NREL) at www.nrel.gov/publications.
Debt Tenor years 18 10 – 20
All-in Interest Rate % 7.00% 4% – 10%9
Minimum Annual DSCR 1.20 1.0 – 1.3
Average DSCR
1.45 1.3 – 1.5
Lender’s Fee (% of total borrowing) % 3.0% 1% – 5%
Target After-Tax Equity IRR % 15% 5% – 20%9
22
This report is available at no cost from the National Renewable Energy Laboratory (NREL) at www.nrel.gov/publications.
Appendix B: Wind CREST
While the five CREST models (solar, wind, geothermal, anaerobic digestion, and fuel cell) share a majority of common architecture, features and conventions, several aspects of the wind CREST model have been tailored to wind-specific inputs. The features specific to the wind module of CREST are discussed in this appendix.
Wind-Specific Capital Cost Inputs: In the Capital Cost category, the “Intermediate” approach contains inputs generally representative of wind project financial analyses, including generation equipment, balance of plant, interconnection, development costs and fee, and reserves and financing costs. The Complex Inputs worksheet offers the user an opportunity to define each cost line-item. For the wind CREST model, the “capital expenditures during operations” category pertains to gearbox and/or blade replacements. The CREST model allows for up to two major capital equipment replacements over the life of the project at user-defined intervals.
The remainder of this appendix focuses on the potential range of typical inputs which may be expected for a wind project.
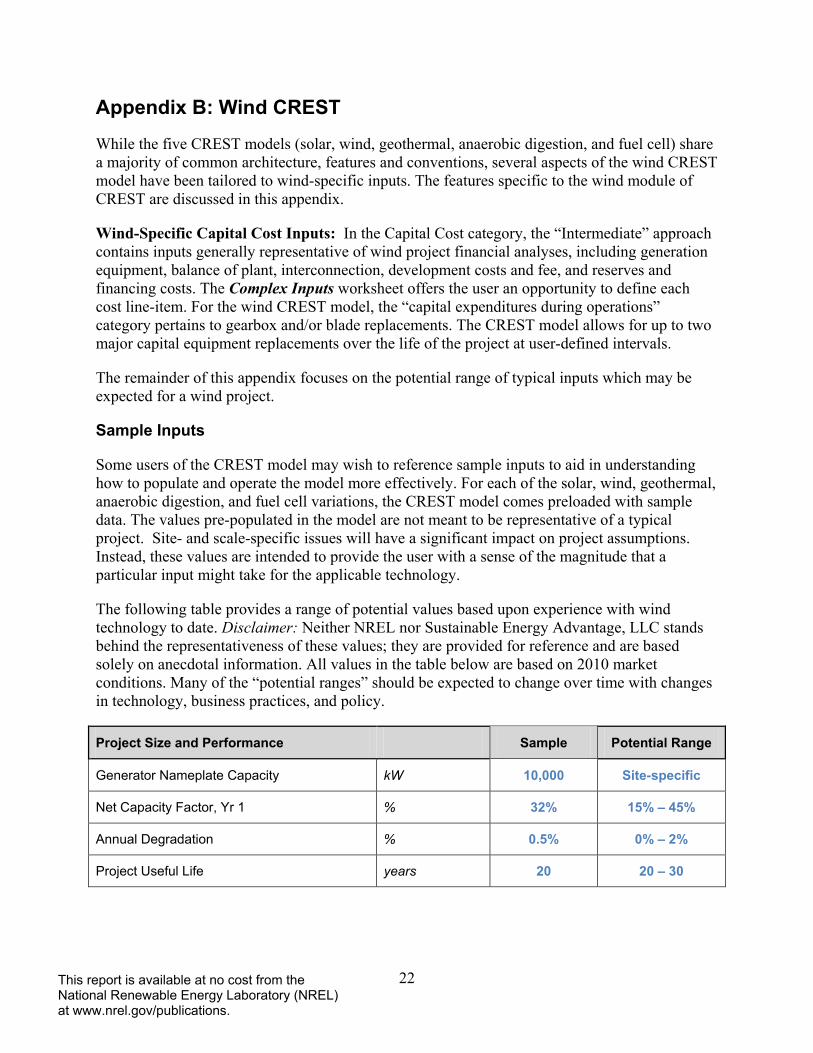
Sample Inputs
Some users of the CREST model may wish to reference sample inputs to aid in understanding how to populate and operate the model more effectively. For each of the solar, wind, geothermal, anaerobic digestion, and fuel cell variations, the CREST model comes preloaded with sample data. The values pre-populated in the model are not meant to be representative of a typical project. Site- and scale-specific issues will have a significant impact on project assumptions. Instead, these values are intended to provide the user with a sense of the magnitude that a particular input might take for the applicable technology.
The following table provides a range of potential values based upon experience with wind technology to date. Disclaimer: Neither NREL nor Sustainable Energy Advantage, LLC stands behind the representativeness of these values; they are provided for reference and are based solely on anecdotal information. All values in the table below are based on 2010 market conditions. Many of the “potential ranges” should be expected to change over time with changes in technology, business practices, and policy.
Project Size and Performance Sample Potential Range
Generator Nameplate Capacity kW 10,000 Site-specific
Net Capacity Factor, Yr 1 % 32% 15% – 45%
Annual Degradation % 0.5% 0% – 2%
Project Useful Life years 20 20 – 30
23
This report is available at no cost from the National Renewable Energy Laboratory (NREL) at www.nrel.gov/publications.
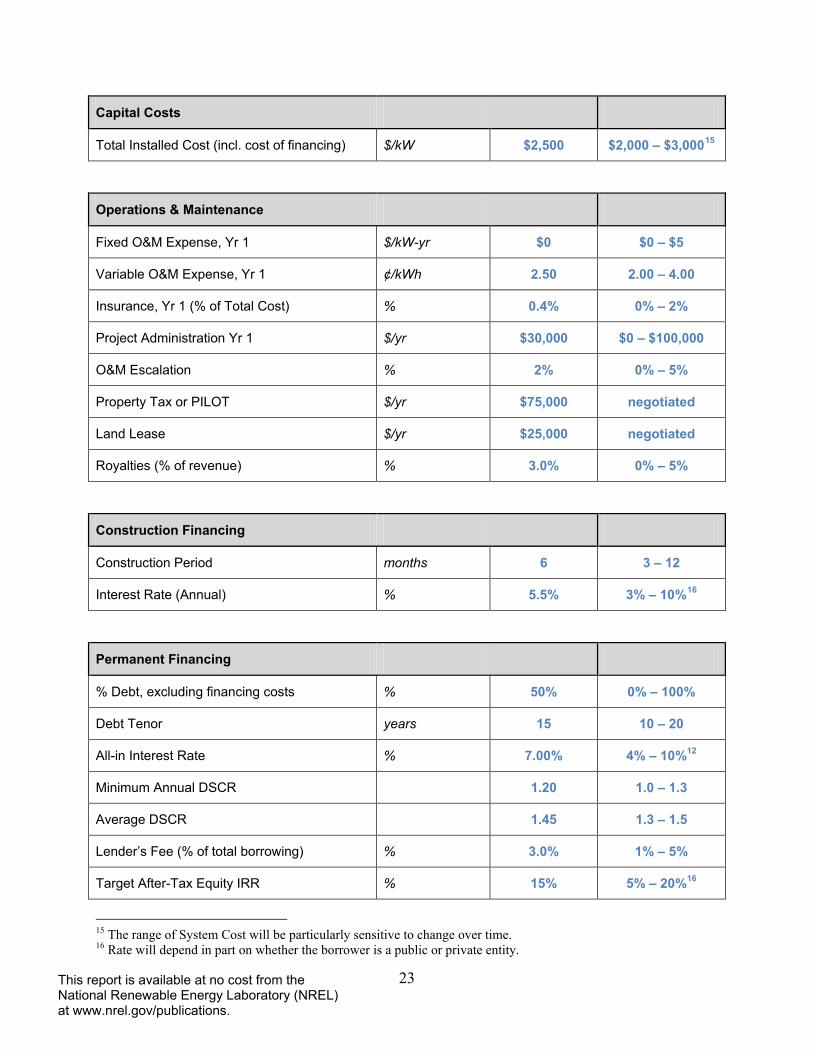
Capital Costs
Total Installed Cost (incl. cost of financing) $/kW $2,500 $2,000 – $3,00015
Operations & Maintenance
Fixed O&M Expense, Yr 1 $/kW-yr $0 $0 – $5
Variable O&M Expense, Yr 1 ¢/kWh 2.50 2.00 – 4.00
Insurance, Yr 1 (% of Total Cost) % 0.4% 0% – 2%
Project Administration Yr 1 $/yr $30,000 $0 – $100,000
O&M Escalation % 2% 0% – 5%
Property Tax or PILOT $/yr $75,000 negotiated
Land Lease $/yr $25,000 negotiated
Royalties (% of revenue) % 3.0% 0% – 5%
Construction Financing
Construction Period months 6 3 – 12
Interest Rate (Annual) % 5.5% 3% – 10%16
Permanent Financing
% Debt, excluding financing costs % 50% 0% – 100%
Debt Tenor years 15 10 – 20
All-in Interest Rate % 7.00% 4% – 10%12
Minimum Annual DSCR 1.20 1.0 – 1.3
Average DSCR
1.45 1.3 – 1.5
Lender’s Fee (% of total borrowing) % 3.0% 1% – 5%
Target After-Tax Equity IRR % 15% 5% – 20%16
15 The range of System Cost will be particularly sensitive to change over time. 16 Rate will depend in part on whether the borrower is a public or private entity.

24
This report is available at no cost from the National Renewable Energy Laboratory (NREL) at www.nrel.gov/publications.
Appendix C: Geothermal CREST
While the five CREST models share a majority of common architecture, several aspects of the geothermal CREST model have been tailored to geothermal-specific inputs. The features specific to the geothermal module of CREST are discussed in this appendix.
Geothermal-Specific Project Performance Inputs: While both the solar and wind CRESTs take into account a capacity factor and the potential for long-term degradation when calculating expected production, an accurate representation of geothermal electricity generation requires additional technology-specific variables. To capture the expectation of resource degradation over time—the inevitable depletion of the project’s original wells and the necessity of replacement wells—the geothermal CREST model incorporates additional functionality. The geothermal CREST allows the user to enter single fixed or year-by-year Production Degradation and Thermal Resource Degradation inputs. The user may define up to two sets of replacement wells, and enter the assumed increase in the project’s total thermal resource potential as a result of each set of well replacements.
This forecasting approach can capture a long-term production decline in facility output while allowing the user to model up to two discrete boosts in theoretical resource potential (as a result of well replacements) during the project’s useful life. If not for these two replacement wells, the theoretical potential of the existing wells alone would cause the production profile to drop more steeply in the project’s later operating years. A pattern of a slow resource degradation accompanied by periodic boosts in underlying resource potential is demonstrated in the figure below.
25
This report is available at no cost from the National Renewable Energy Laboratory (NREL) at www.nrel.gov/publications.
Geothermal-Specific Capital Cost Inputs: While solar and wind project development can be readily viewed and analyzed as a single and contiguous effort, geothermal project development is more accurately modeled as a series of related, but separate, development initiatives, each with its distinct set of costs (and risks). As such, the geothermal CREST model provides separate input categories for Exploration Costs Attributed to Project, Confirmation Drilling Costs, and Site Construction Costs (which include Well Field, Power Plant, Interconnection and Financing Costs). Exploration is a material part of the geothermal power plant development process. While resource assessment and characterization are needed for wind and solar projects, geothermal resource exploration represents a more costly and risky endeavor. As a result, the Exploration Costs Attributed to Project category is present and requires attention regardless of the level of cost input detail selected by the user. This category includes inputs for exploration cost, success rate, average well cost, non-well exploration cost, and expected return on exploration capital. The success rate input allows the user to provide either a project-specific or industry average “hit rate” with respect to exploration well drilling. For example, a 20% success rate implies that the fifth exploration well drilled results in the discovery of the resource necessary to develop the remainder of the project. This approach ensures that the cost of all five exploration wells is taken into account during the calculation of a cost-based incentive. Only incentives that enable the recovery of exploration costs will spur successful geothermal development. Other approaches (such as adding a risk premium to the cost of equity capital in lieu of including all exploration costs) were considered. The above-described exploration cost approach was selected because it offers the greatest degree of transparency and is therefore believed to be most applicable to a multi-stakeholder or regulatory process.
When the Simple level of cost detail is selected, the remaining cost categories are modeled using a single Total Installed Cost input. When Intermediate is selected, Confirmation and Wellfield Costs are modeled using a series of success rate and cost per well inputs for a defined number of wells. Power Plant and Interconnection costs are modeled as single inputs in total nominal dollars. Financing Costs are calculated based on other inputs related to construction periods, investor fees, and required reserves. As with the solar and wind models, selecting Complex requires inputs on a user-defined line-by-line set of cost assumptions.
For the geothermal CREST model, the Capital Expenditures During Operations category pertains to replacement well drilling. The CREST geothermal module allows for up to two major well replacement events over the life of the project at user-defined intervals.
Geothermal-Specific Operations & Maintenance Cost Inputs: The geothermal CREST separates O&M inputs into three categories: Field, Plant, and Other. The Field and Plant categories each have fixed and variable input components. The Other category includes costs that are common to all five CREST models: Insurance, Project Management, Property Taxes (or payments in lieu thereof), Land Lease, and Royalties. All three O&M cost categories are governed by a single set of cost inflation factors.
The remainder of this appendix focuses on the potential range of inputs that may be expected for a typical geothermal project.
26
This report is available at no cost from the National Renewable Energy Laboratory (NREL) at www.nrel.gov/publications.
Sample Inputs
Some users of the CREST model may wish to reference sample inputs to aid in understanding how to populate and operate the model more effectively. For each of the solar, wind, geothermal, anaerobic digestion, and fuel cell variations, the CREST model comes preloaded with sample data. The values pre-populated in the model are not meant to be representative of a typical project. Site- and scale-specific issues will have a significant impact on project assumptions. Instead, these values are intended to provide the user with a sense of the magnitude that a particular input might take for the applicable technology.
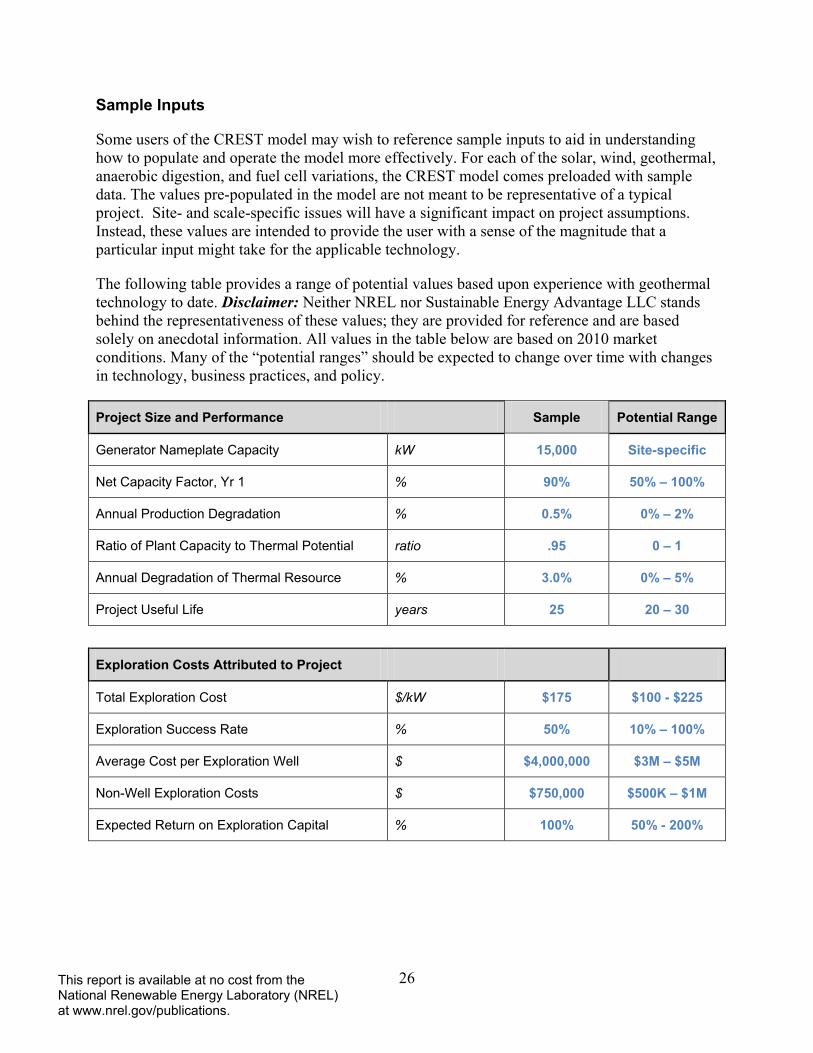
The following table provides a range of potential values based upon experience with geothermal technology to date. Disclaimer: Neither NREL nor Sustainable Energy Advantage LLC stands behind the representativeness of these values; they are provided for reference and are based solely on anecdotal information. All values in the table below are based on 2010 market conditions. Many of the “potential ranges” should be expected to change over time with changes in technology, business practices, and policy.
Project Size and Performance Sample Potential Range
Generator Nameplate Capacity kW 15,000 Site-specific
Net Capacity Factor, Yr 1 % 90% 50% – 100%
Annual Production Degradation % 0.5% 0% – 2%
Ratio of Plant Capacity to Thermal Potential ratio .95 0 – 1
Annual Degradation of Thermal Resource % 3.0% 0% – 5%
Project Useful Life years 25 20 – 30
Exploration Costs Attributed to Project
Total Exploration Cost $/kW $175 $100 - $225
Exploration Success Rate % 50% 10% – 100%
Average Cost per Exploration Well $ $4,000,000 $3M – $5M
Non-Well Exploration Costs $ $750,000 $500K – $1M
Expected Return on Exploration Capital % 100% 50% - 200%
27
This report is available at no cost from the National Renewable Energy Laboratory (NREL) at www.nrel.gov/publications.
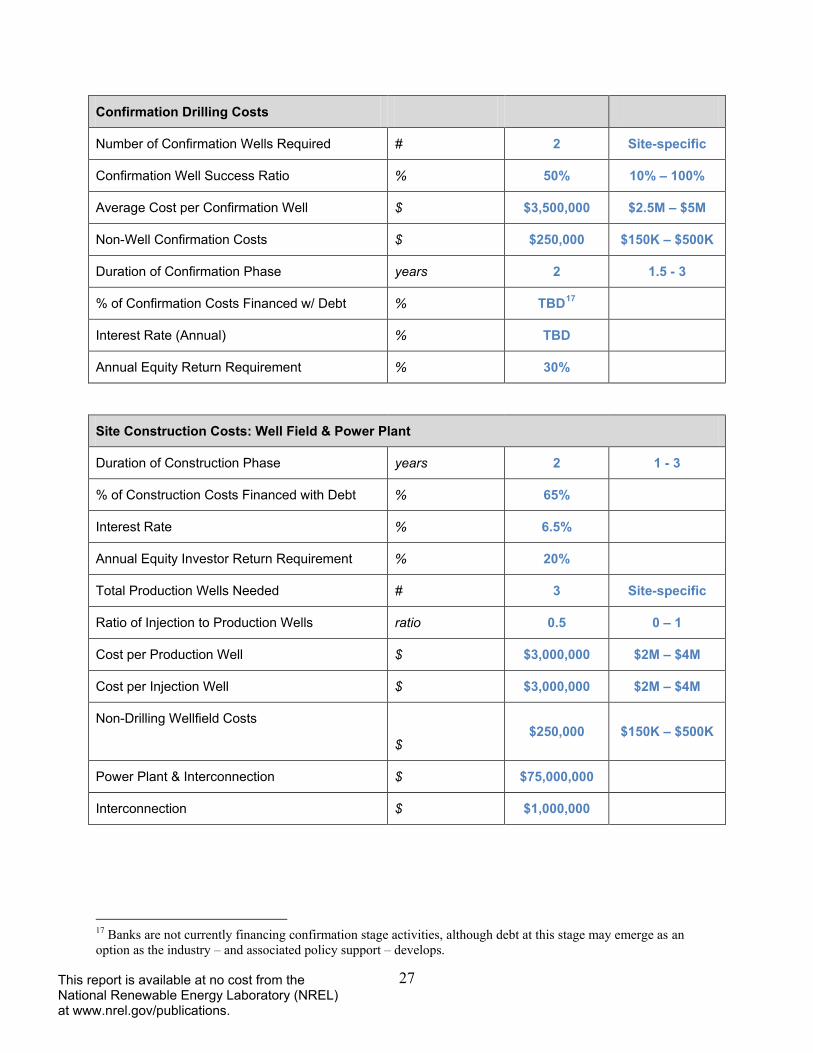
Confirmation Drilling Costs
Number of Confirmation Wells Required # 2 Site-specific
Confirmation Well Success Ratio % 50% 10% – 100%
Average Cost per Confirmation Well $ $3,500,000 $2.5M – $5M
Non-Well Confirmation Costs $ $250,000 $150K – $500K
Duration of Confirmation Phase years 2 1.5 - 3
% of Confirmation Costs Financed w/ Debt % TBD17
Interest Rate (Annual) % TBD
Annual Equity Return Requirement % 30%
Site Construction Costs: Well Field & Power Plant
Duration of Construction Phase years 2 1 - 3
% of Construction Costs Financed with Debt % 65%
Interest Rate % 6.5%
Annual Equity Investor Return Requirement % 20%
Total Production Wells Needed # 3 Site-specific
Ratio of Injection to Production Wells ratio 0.5 0 – 1
Cost per Production Well $ $3,000,000 $2M – $4M
Cost per Injection Well $ $3,000,000 $2M – $4M
Non-Drilling Wellfield Costs $
$250,000 $150K – $500K
Power Plant & Interconnection $ $75,000,000
Interconnection $ $1,000,000
17 Banks are not currently financing confirmation stage activities, although debt at this stage may emerge as an option as the industry – and associated policy support – develops.

28
This report is available at no cost from the National Renewable Energy Laboratory (NREL) at www.nrel.gov/publications.
Operations & Maintenance
Field
Fixed O&M Expense, Yr 1 $/kW-yr $2.00 0 – 4.00
Variable O&M Expense, Yr 1 ¢/kWh 1.00 0 – 3.00
Plant
Fixed O&M Expense, Yr 1 $/kW-yr $2.00 0 – 4.00
Variable O&M Expense, Yr 1 ¢/kWh 2.00 0 – 3.00
Other
Insurance, Yr 1 (% of Total Cost) % 0.4% 0% – 2%
Project Administration Yr 1 $/yr $50,000 $0 – $100,000
O&M Escalation % 2% 0% – 5%
Property Tax or PILOT $/yr $75,000 negotiated
Land Lease $/yr $5,000 negotiated
Royalties (% of revenue) % 3.0% 0% – 5%
Permanent Financing
% Debt, excluding financing costs % 50% 0% – 100%
Debt Tenor years 15 10 – 20
All-in Interest Rate % 7.00% 4% – 1012
Minimum Annual DSCR 1.20 1.0 – 1.3
Average DSCR
1.45 1.3 – 1.5
Lender's Fee (% of total borrowing) % 3.0% 1% – 5%
Target After-Tax Equity IRR % 15% 5% – 20%16
Other Closing Costs $ $0
29
This report is available at no cost from the National Renewable Energy Laboratory (NREL) at www.nrel.gov/publications.
Appendix D: Anaerobic Digestion CREST
While the five CREST models share a majority of common architecture, several aspects of the anaerobic digestion (AD) CREST model have been tailored to AD-specific inputs. The features specific to the AD module of CREST are discussed in this appendix.
AD-Specific Project Performance Inputs: While the solar, wind, and fuel cell CRESTs take into account a capacity factor and the potential for long-term degradation when calculating expected production, an accurate representation of electricity from anaerobic digestion requires additional technology-specific variables. As the only model aside from fuel cell with measurable fuel inputs, these must be taken into account and are calculated based on the generator capacity, energy content per cubic foot and the electrical conversion efficiency of the generator. These output the following figures: biogas consumption per day, biogas consumption per year, energy content per year, and the heat rate of the fuel (BTU/kWh).
AD-Specific Capital Cost Inputs: Like solar and wind project development, anaerobic digesters can be readily viewed and analyzed as a single and contiguous effort. When the Simple level of cost detail is selected, costs are modeled using a single Total Installed Cost input. When Intermediate is selected, the model allows the user to input total costs by category for generation equipment, balance of plant, interconnection, development costs and fees, and reserves and financing costs. As with the other models, selecting Complex requires inputs on a user-defined line-by-line set of cost assumptions.
AD-Specific Operations & Maintenance Cost Inputs: Under the Intermediate level of detail, the O&M inputs for AD are unique in that they must incorporate feedstock costs into the operating costs. Depending on the type of feedstock, the cost may be zero, but the quantity inputs help drive other aspects of the model. The water and sewer costs and escalation factor are also unique to this technology. The remaining O&M cost inputs are consistent with the other models and have proposed ranges detailed below.
AD-Specific Supplemental Revenue Streams: The section of the model that allows the user to input supplemental revenues from tipping fees is also unique to anaerobic digesters. It is more likely that AD plants will be able to charge a tipping fee for the acceptance of waste/feedstock, providing additional revenue for the project. The model allows for the input of three different tipping fees and quantities, a quantity, price and escalation rate for digestate, and value inputs for recaptured waste heat.
The remainder of this appendix focuses on the potential range of inputs that may be expected for a typical anaerobic digester project.
Sample Inputs
Some users of the CREST model may wish to reference sample inputs to aid in understanding how to populate and operate the model more effectively. For each of the solar, wind, geothermal, anaerobic digestion, and fuel cell variations, the CREST model comes preloaded with sample data. The values pre-populated in the model are not meant to be representative of a typical project. Site- and scale-specific issues will have a significant impact on project assumptions.
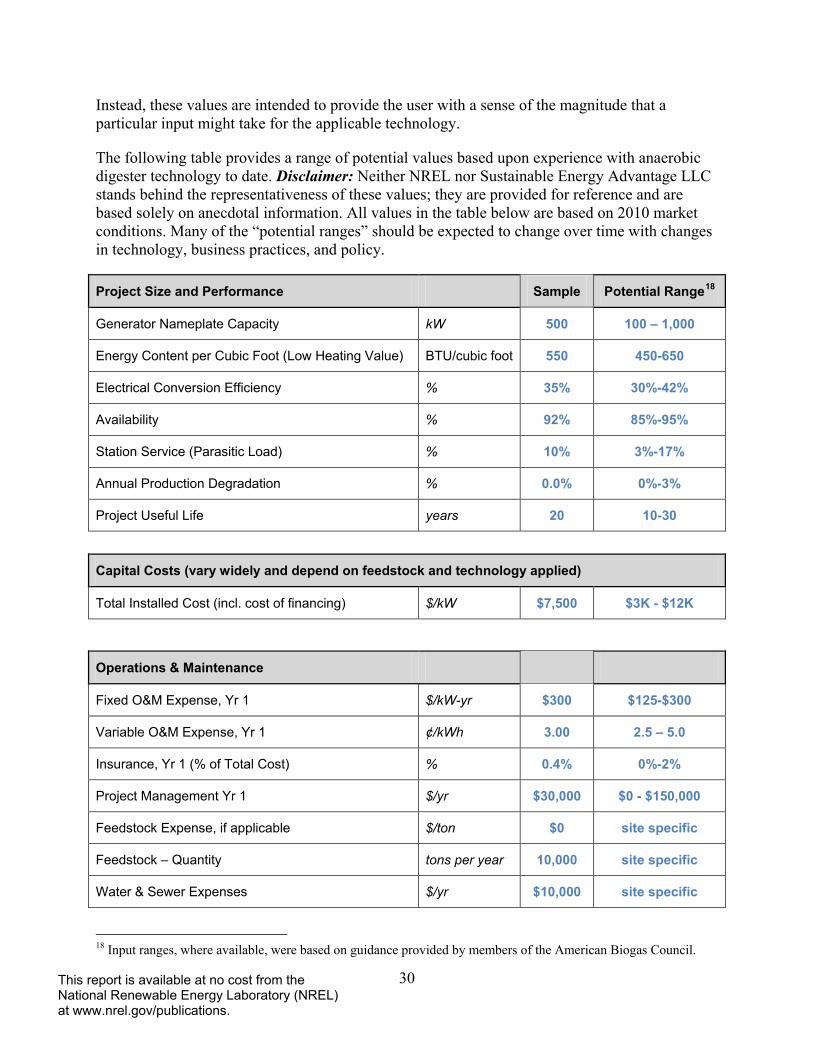
30
This report is available at no cost from the National Renewable Energy Laboratory (NREL) at www.nrel.gov/publications.
Instead, these values are intended to provide the user with a sense of the magnitude that a particular input might take for the applicable technology.
The following table provides a range of potential values based upon experience with anaerobic digester technology to date. Disclaimer: Neither NREL nor Sustainable Energy Advantage LLC stands behind the representativeness of these values; they are provided for reference and are based solely on anecdotal information. All values in the table below are based on 2010 market conditions. Many of the “potential ranges” should be expected to change over time with changes in technology, business practices, and policy.
Project Size and Performance Sample Potential Range18
Generator Nameplate Capacity kW 500 100 – 1,000
Energy Content per Cubic Foot (Low Heating Value) BTU/cubic foot 550 450-650
Electrical Conversion Efficiency % 35% 30%-42%
Availability % 92% 85%-95%
Station Service (Parasitic Load) % 10% 3%-17%
Annual Production Degradation % 0.0% 0%-3%
Project Useful Life years 20 10-30
Capital Costs (vary widely and depend on feedstock and technology applied)
Total Installed Cost (incl. cost of financing) $/kW $7,500 $3K - $12K
Operations & Maintenance
Fixed O&M Expense, Yr 1 $/kW-yr $300 $125-$300
Variable O&M Expense, Yr 1 ¢/kWh 3.00 2.5 – 5.0
Insurance, Yr 1 (% of Total Cost) % 0.4% 0%-2%
Project Management Yr 1 $/yr $30,000 $0 - $150,000
Feedstock Expense, if applicable $/ton $0 site specific
Feedstock – Quantity tons per year 10,000 site specific
Water & Sewer Expenses $/yr $10,000 site specific
18 Input ranges, where available, were based on guidance provided by members of the American Biogas Council.
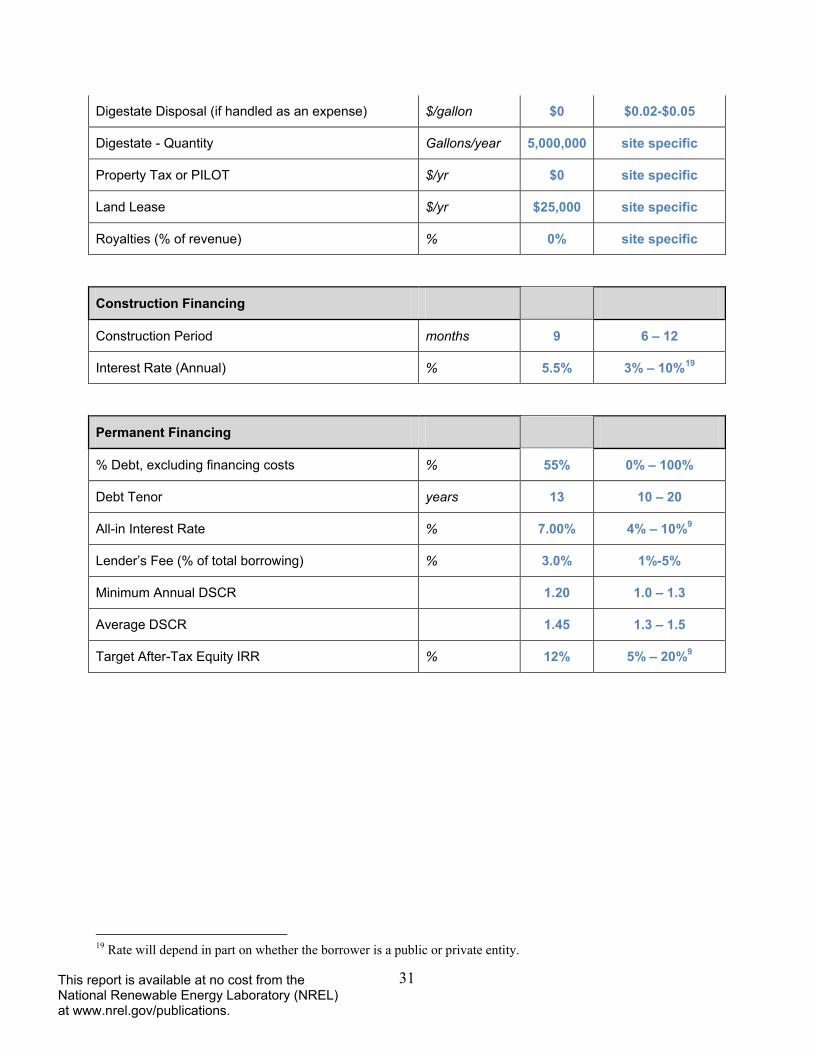
31
This report is available at no cost from the National Renewable Energy Laboratory (NREL) at www.nrel.gov/publications.
Digestate Disposal (if handled as an expense) $/gallon $0 $0.02-$0.05
Digestate - Quantity Gallons/year 5,000,000 site specific
Property Tax or PILOT $/yr $0 site specific
Land Lease $/yr $25,000 site specific
Royalties (% of revenue) % 0% site specific
Construction Financing
Construction Period months 9 6 – 12
Interest Rate (Annual) % 5.5% 3% – 10%19
Permanent Financing
% Debt, excluding financing costs % 55% 0% – 100%
Debt Tenor years 13 10 – 20
All-in Interest Rate % 7.00% 4% – 10%9
Lender’s Fee (% of total borrowing) % 3.0% 1%-5%
Minimum Annual DSCR 1.20 1.0 – 1.3
Average DSCR
1.45 1.3 – 1.5
Target After-Tax Equity IRR % 12% 5% – 20%9
19 Rate will depend in part on whether the borrower is a public or private entity.
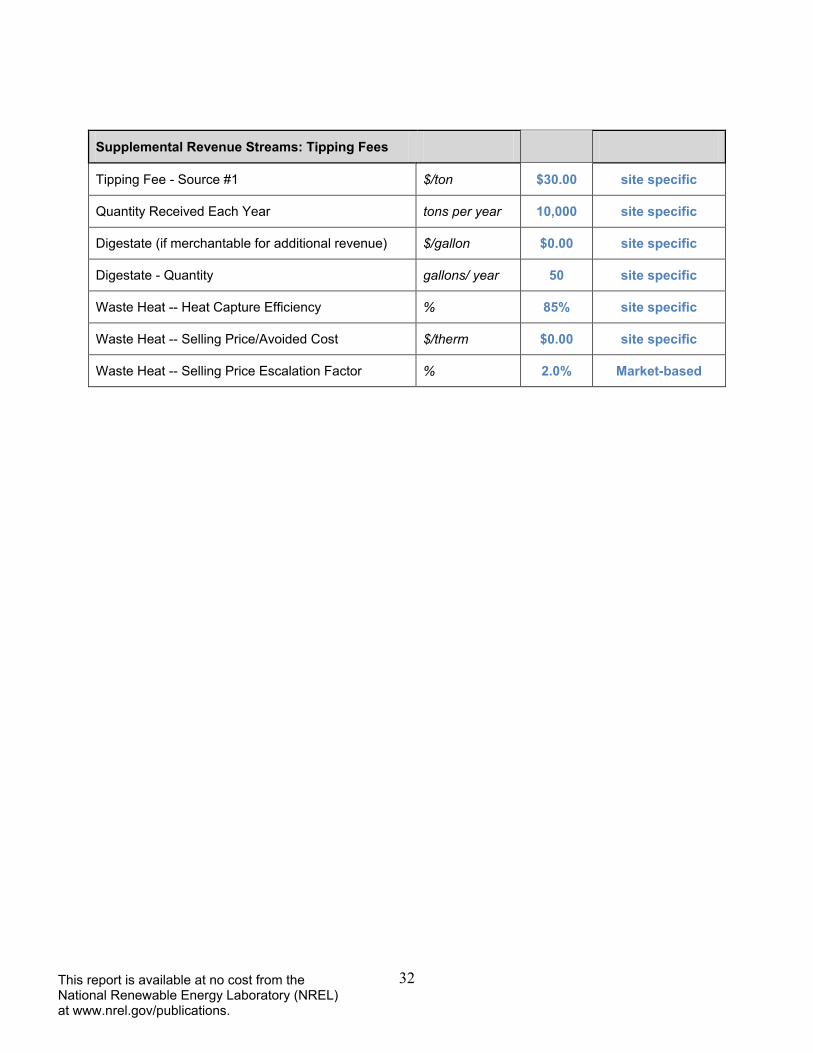
32
This report is available at no cost from the National Renewable Energy Laboratory (NREL) at www.nrel.gov/publications.
Supplemental Revenue Streams: Tipping Fees
Tipping Fee - Source #1 $/ton $30.00 site specific
Quantity Received Each Year tons per year 10,000 site specific
Digestate (if merchantable for additional revenue) $/gallon $0.00 site specific
Digestate - Quantity gallons/ year 50 site specific
Waste Heat -- Heat Capture Efficiency % 85% site specific
Waste Heat -- Selling Price/Avoided Cost $/therm $0.00 site specific
Waste Heat -- Selling Price Escalation Factor % 2.0% Market-based
33
This report is available at no cost from the National Renewable Energy Laboratory (NREL) at www.nrel.gov/publications.
Appendix E: Fuel Cell CREST
While the five CREST models share a majority of common architecture, several aspects of the fuel cell CREST model have been tailored to fuel cell-specific inputs. The features specific to the fuel cell module of CREST are discussed in this appendix.
Fuel Cell-Specific Project Performance Inputs: As the only model aside from anaerobic digestion with measurable fuel inputs, these inputs are taken into account and calculated based on the generator capacity, the fuel’s energy content, fuel consumption, and heat rate. The fuel cell model also accounts for the expected life of the fuel cell stack and its potential for long-term output degradation.
Fuel Cell-Specific Capital Cost Inputs: As with solar, wind, and anaerobic digestion, fuel cell project development can be viewed and analyzed as a single and contiguous effort. When the Simple level of cost detail is selected, costs are modeled using a single Total Installed Cost input. When Intermediate is selected, the model allows the user to input total costs by category for generation equipment, balance of plant, interconnection, development costs and fees, and reserves and financing costs. As with the other models, selecting Complex requires inputs on a user-defined line-by-line set of cost assumptions.
For the fuel cell CREST model, capital expenditures during operation refers to the need for fuel cell restacking several times during the life of the project. The CREST fuel cell model allows for up to four restackings, with the interval between restacking dependent on the user-defined life of the fuel cell stack (in total hours). Fuel cell stack replacement costs are also defined by the user, as is the expected capacity increase due to restacking.
Fuel Cell-Specific Operations & Maintenance Cost Inputs: Under the Intermediate level of detail, the O&M inputs for the fuel cell model accounts for fuel costs and includes an escalation factor for these fuel costs.
Fuel Cell-Specific Supplemental Revenue Streams: This section of the model allows the user to input supplemental revenues from waste heat generated by the fuel cell. The number of BTUs available for sale is determined by the electrical conversion efficiency (which in turn determines the initial heat rate) and the heat capture efficiency. Users input the selling price/avoided cost per BTU, along with the escalation factor, to determine the yearly effect on revenue.
Sample Inputs
Some users of the CREST model may wish to reference sample inputs to aid in understanding how to populate and operate the model more effectively. For each of the solar, wind, geothermal, anaerobic digestion, and fuel cell variations, the CREST model comes preloaded with sample data. The values pre-populated in the model are not meant to be representative of a typical project. Site- and scale-specific issues will have a significant impact on project assumptions. Instead, these values are intended to provide the user with a sense of the magnitude that a particular input might take for the applicable technology.
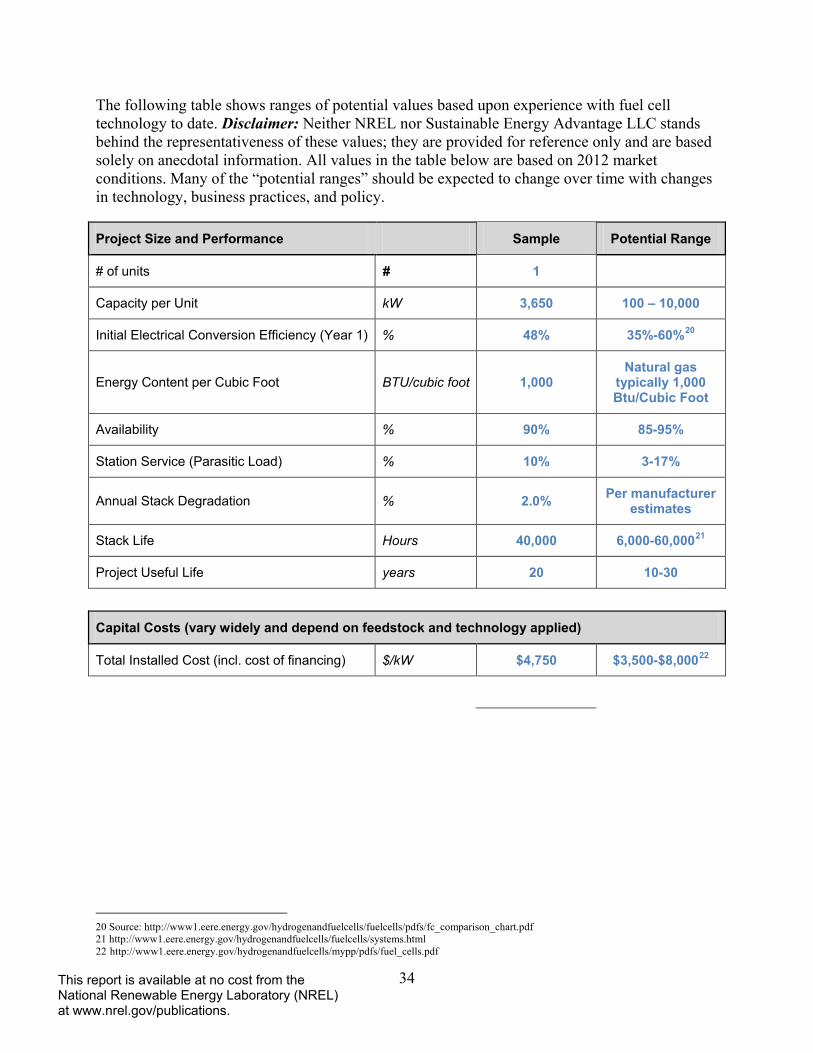
34
This report is available at no cost from the National Renewable Energy Laboratory (NREL) at www.nrel.gov/publications.
The following table shows ranges of potential values based upon experience with fuel cell technology to date. Disclaimer: Neither NREL nor Sustainable Energy Advantage LLC stands behind the representativeness of these values; they are provided for reference only and are based solely on anecdotal information. All values in the table below are based on 2012 market conditions. Many of the “potential ranges” should be expected to change over time with changes in technology, business practices, and policy.
Project Size and Performance Sample Potential Range
# of units # 1
Capacity per Unit kW 3,650 100 – 10,000
Initial Electrical Conversion Efficiency (Year 1) % 48% 35%-60%20
Energy Content per Cubic Foot BTU/cubic foot 1,000 Natural gas
typically 1,000 Btu/Cubic Foot
Availability % 90% 85-95%
Station Service (Parasitic Load) % 10% 3-17%
Annual Stack Degradation % 2.0% Per manufacturer estimates
Stack Life Hours 40,000 6,000-60,00021
Project Useful Life years 20 10-30
Capital Costs (vary widely and depend on feedstock and technology applied)
Total Installed Cost (incl. cost of financing) $/kW $4,750 $3,500-$8,00022
20 Source: http://www1.eere.energy.gov/hydrogenandfuelcells/fuelcells/pdfs/fc_comparison_chart.pdf 21 http://www1.eere.energy.gov/hydrogenandfuelcells/fuelcells/systems.html 22 http://www1.eere.energy.gov/hydrogenandfuelcells/mypp/pdfs/fuel_cells.pdf

35
This report is available at no cost from the National Renewable Energy Laboratory (NREL) at www.nrel.gov/publications.
Operations & Maintenance
Fixed O&M Expense, Yr 1 $/kW-yr $250.00 $125-$300
Variable O&M Expense, Yr 1 ¢/kWh 0.00 site specific
Insurance, Yr 1 (% of Total Cost) % 0.3% 0%-2%
Project Management Yr 1 $/yr $30,000 $0 - $150,000
Fuel Cost $/MMBtu $4.00 Market-based
Fuel Cost Escalation Factor % 2.0% Market-based
Property Tax or PILOT, Yr 1 $/yr $0 site specific
Land Lease $/yr $25,000 site specific
Royalties (% of revenue) % 0.0% site specific
Construction Financing
Construction Period months 9 6 – 12
Interest Rate (Annual) % 5.5% 3% – 10%23
Permanent Financing
% Debt, excluding financing costs % 40% 0% – 100%
Debt Tenor years 13 10 – 20
All-in Interest Rate % 7.00% 4% – 10%9
Lender’s Fee (% of total borrowing) % 3.00% 1%-5%
Minimum Annual DSCR 1.20 1.0 – 1.3
Required Average DSCR
1.45 1.3 – 1.5
Target After-Tax Equity IRR % 12% 5% – 20%9
23 Rate will depend in part on whether the borrower is a public or private entity.
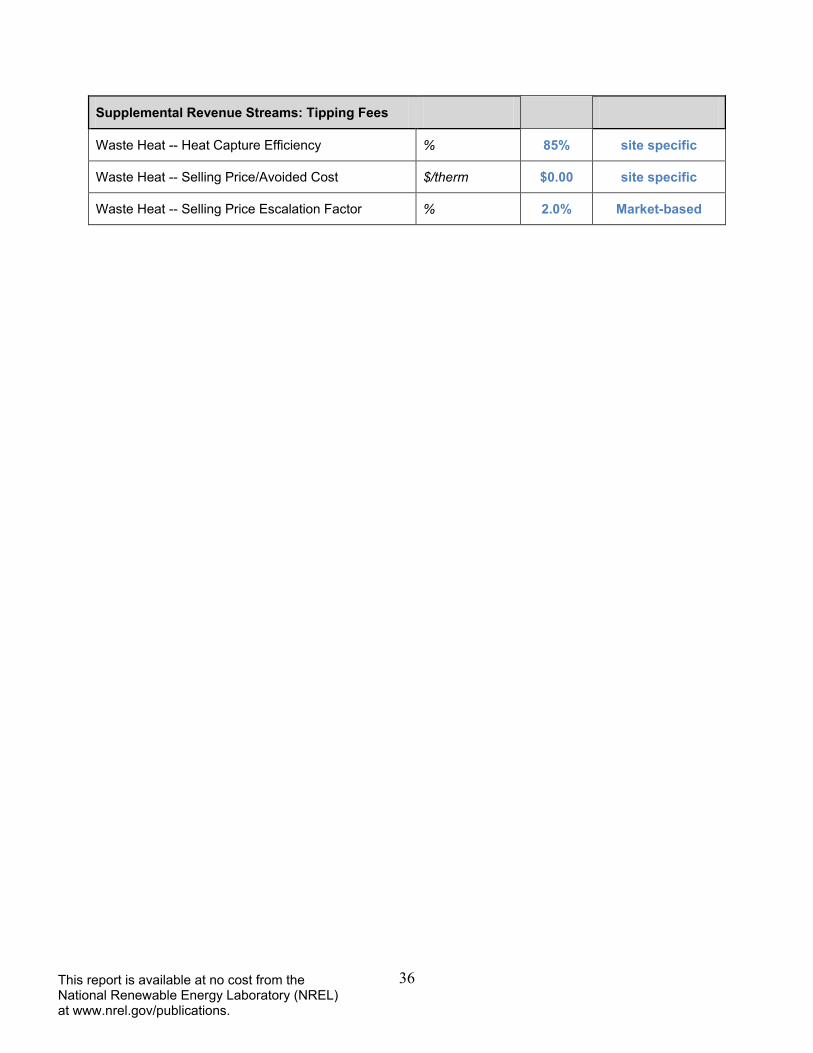
36
This report is available at no cost from the National Renewable Energy Laboratory (NREL) at www.nrel.gov/publications.
Supplemental Revenue Streams: Tipping Fees
Waste Heat -- Heat Capture Efficiency % 85% site specific
Waste Heat -- Selling Price/Avoided Cost $/therm $0.00 site specific
Waste Heat -- Selling Price Escalation Factor % 2.0% Market-based