Allied Structural Steel Co. v. Spannaus, 438 U.S. 234 (1978)
UNCONSOLIDATEDFINANCIAL STATEMENTS
CRESCENT STEEL AND ALLIED PRODUCTS LIMITED
FOR THE YEAR ENDED 30 JUNE 2021
1 24
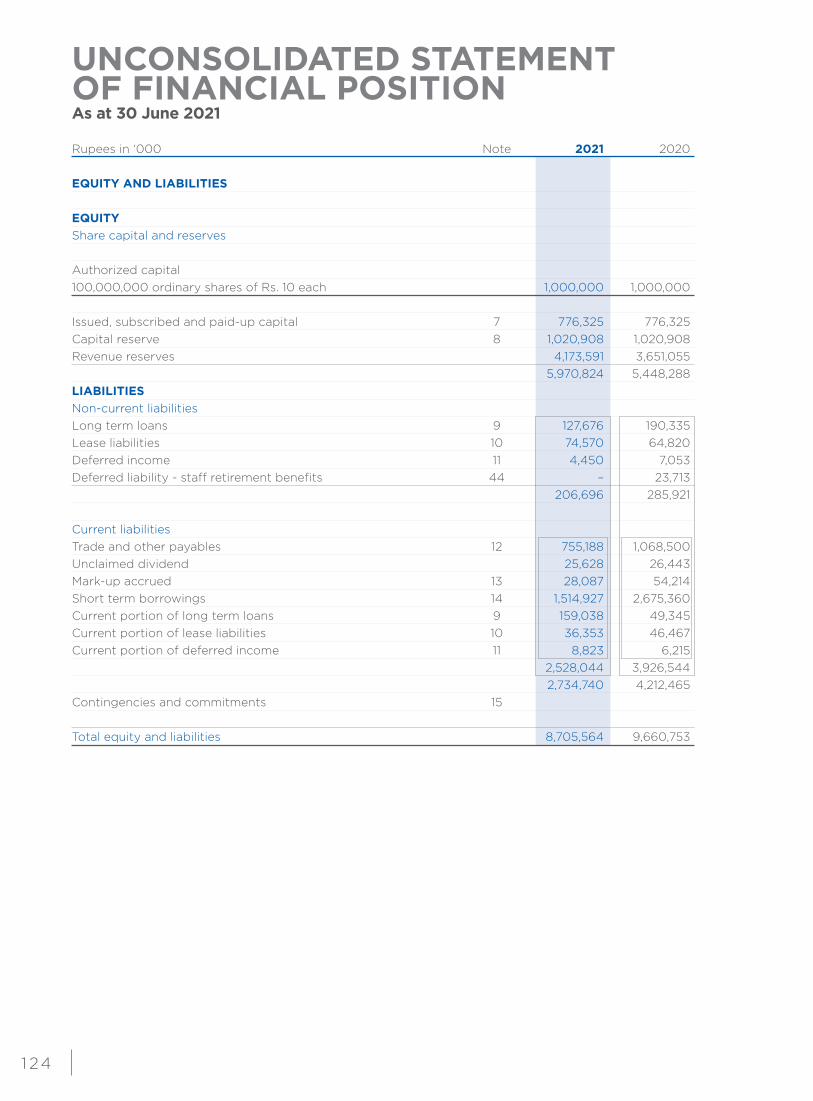
UNCONSOLIDATED STATEMENTOF FINANCIAL POSITIONAs at 30 June 2021
Rupees in ‘000 Note 2021 2020
EQUITY AND LIABILITIES EQUITY Share capital and reserves Authorized capital 100,000,000 ordinary shares of Rs. 10 each 1,000,000 1,000,000 Issued, subscribed and paid-up capital 7 776,325 776,325 Capital reserve 8 1,020,908 1,020,908 Revenue reserves 4,173,591 3,651,055 5,970,824 5,448,288 LIABILITIES Non-current liabilities Long term loans 9 127,676 190,335 Lease liabilities 10 74,570 64,820 Deferred income 11 4,450 7,053 Deferred liability - staff retirement benefits 44 – 23,713 206,696 285,921 Current liabilities Trade and other payables 12 755,188 1,068,500 Unclaimed dividend 25,628 26,443 Mark-up accrued 13 28,087 54,214 Short term borrowings 14 1,514,927 2,675,360 Current portion of long term loans 9 159,038 49,345 Current portion of lease liabilities 10 36,353 46,467 Current portion of deferred income 11 8,823 6,215 2,528,044 3,926,544 2,734,740 4,212,465 Contingencies and commitments 15 Total equity and liabilities 8,705,564 9,660,753
1 2 5
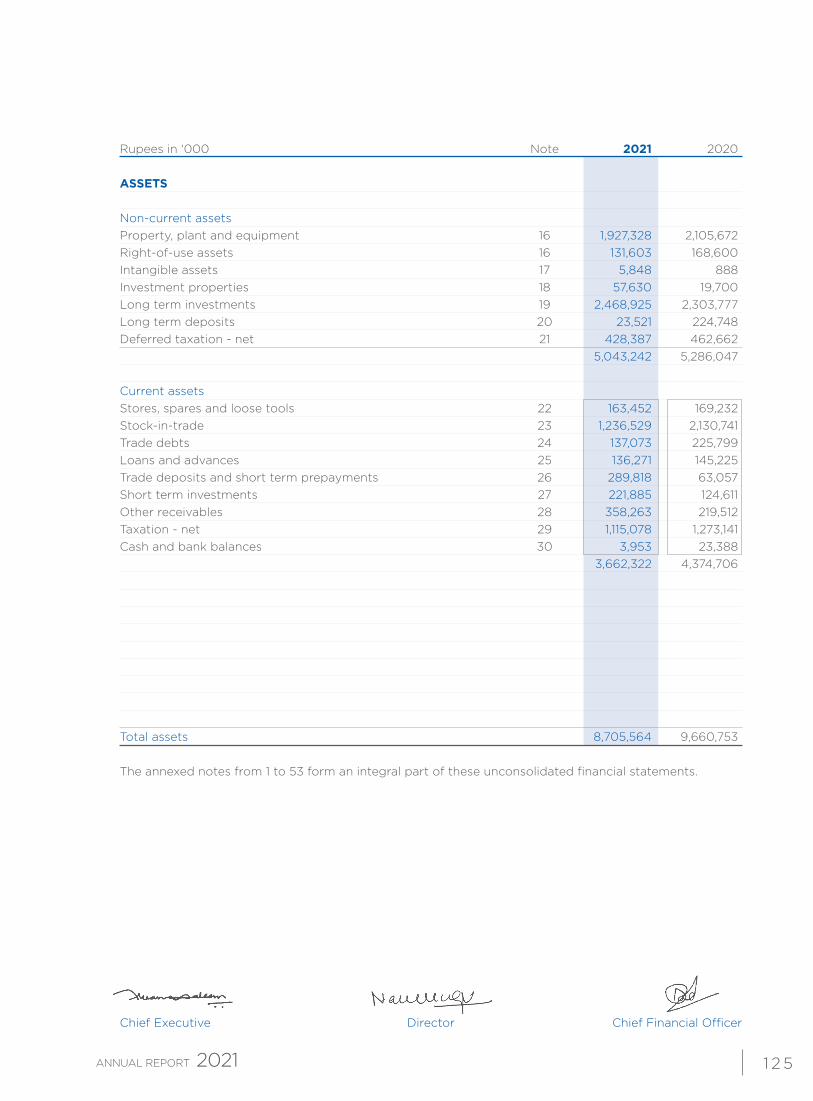
Rupees in ‘000 Note 2021 2020
ASSETS Non-current assets Property, plant and equipment 16 1,927,328 2,105,672 Right-of-use assets 16 131,603 168,600 Intangible assets 17 5,848 888 Investment properties 18 57,630 19,700 Long term investments 19 2,468,925 2,303,777 Long term deposits 20 23,521 224,748 Deferred taxation - net 21 428,387 462,662 5,043,242 5,286,047 Current assets Stores, spares and loose tools 22 163,452 169,232 Stock-in-trade 23 1,236,529 2,130,741 Trade debts 24 137,073 225,799 Loans and advances 25 136,271 145,225 Trade deposits and short term prepayments 26 289,818 63,057 Short term investments 27 221,885 124,611 Other receivables 28 358,263 219,512 Taxation - net 29 1,115,078 1,273,141 Cash and bank balances 30 3,953 23,388 3,662,322 4,374,706
Total assets 8,705,564 9,660,753 The annexed notes from 1 to 53 form an integral part of these unconsolidated financial statements.
Chief Executive Director Chief Financial Officer
1 2 6
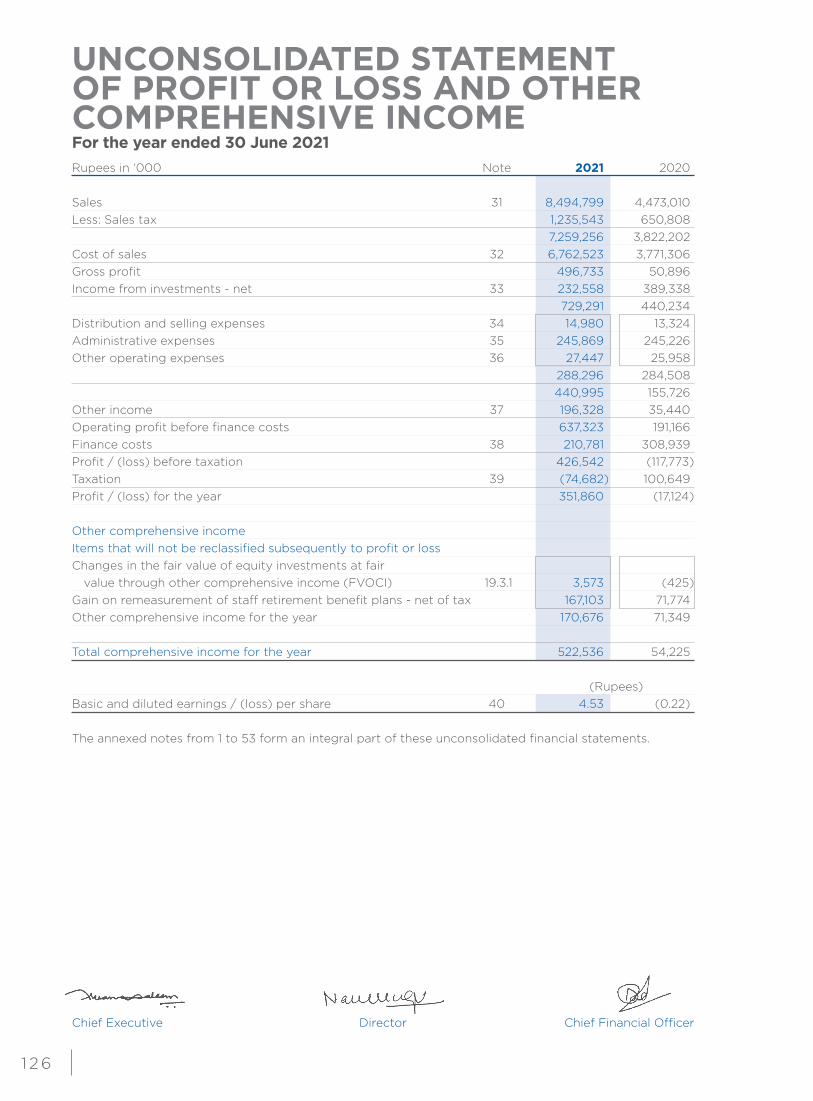
UNCONSOLIDATED STATEMENTOF PROFIT OR LOSS AND OTHER COMPREHENSIVE INCOME For the year ended 30 June 2021Rupees in ‘000 Note 2021 2020
Sales 31 8,494,799 4,473,010 Less: Sales tax 1,235,543 650,808 7,259,256 3,822,202 Cost of sales 32 6,762,523 3,771,306 Gross profit 496,733 50,896 Income from investments - net 33 232,558 389,338 729,291 440,234 Distribution and selling expenses 34 14,980 13,324 Administrative expenses 35 245,869 245,226 Other operating expenses 36 27,447 25,958 288,296 284,508 440,995 155,726 Other income 37 196,328 35,440 Operating profit before finance costs 637,323 191,166 Finance costs 38 210,781 308,939 Profit / (loss) before taxation 426,542 (117,773)Taxation 39 (74,682) 100,649 Profit / (loss) for the year 351,860 (17,124) Other comprehensive income Items that will not be reclassified subsequently to profit or loss Changes in the fair value of equity investments at fair value through other comprehensive income (FVOCI) 19.3.1 3,573 (425)Gain on remeasurement of staff retirement benefit plans - net of tax 167,103 71,774 Other comprehensive income for the year 170,676 71,349 Total comprehensive income for the year 522,536 54,225
(Rupees) Basic and diluted earnings / (loss) per share 40 4.53 (0.22) The annexed notes from 1 to 53 form an integral part of these unconsolidated financial statements.
Chief Executive Director Chief Financial Officer
1 27
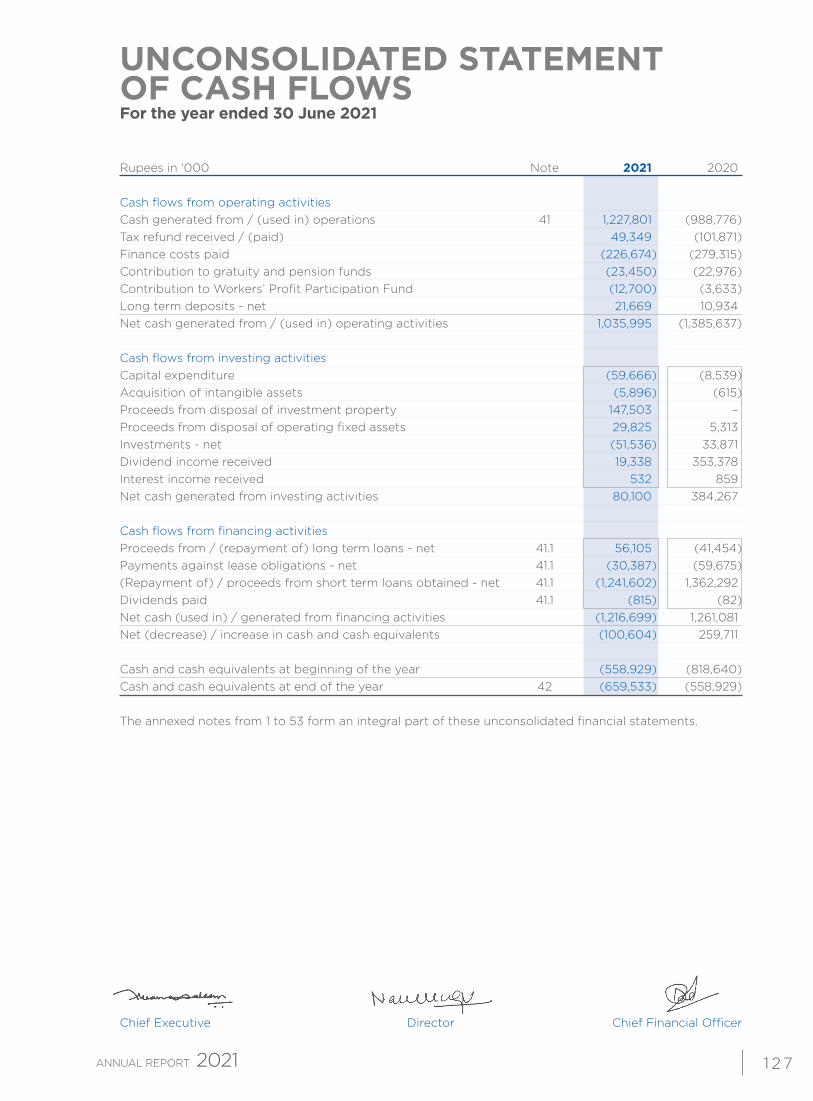
UNCONSOLIDATED STATEMENT OF CASH FLOWS For the year ended 30 June 2021
Rupees in ‘000 Note 2021 2020
Cash flows from operating activities Cash generated from / (used in) operations 41 1,227,801 (988,776)Tax refund received / (paid) 49,349 (101,871)Finance costs paid (226,674) (279,315)Contribution to gratuity and pension funds (23,450) (22,976)Contribution to Workers’ Profit Participation Fund (12,700) (3,633)Long term deposits - net 21,669 10,934 Net cash generated from / (used in) operating activities 1,035,995 (1,385,637) Cash flows from investing activities Capital expenditure (59,666) (8,539)Acquisition of intangible assets (5,896) (615)Proceeds from disposal of investment property 147,503 –Proceeds from disposal of operating fixed assets 29,825 5,313 Investments - net (51,536) 33,871 Dividend income received 19,338 353,378 Interest income received 532 859 Net cash generated from investing activities 80,100 384,267 Cash flows from financing activities Proceeds from / (repayment of) long term loans - net 41.1 56,105 (41,454)Payments against lease obligations - net 41.1 (30,387) (59,675)(Repayment of) / proceeds from short term loans obtained - net 41.1 (1,241,602) 1,362,292 Dividends paid 41.1 (815) (82)Net cash (used in) / generated from financing activities (1,216,699) 1,261,081 Net (decrease) / increase in cash and cash equivalents (100,604) 259,711 Cash and cash equivalents at beginning of the year (558,929) (818,640)Cash and cash equivalents at end of the year 42 (659,533) (558,929) The annexed notes from 1 to 53 form an integral part of these unconsolidated financial statements.
Chief Executive Director Chief Financial Officer
1 2 8
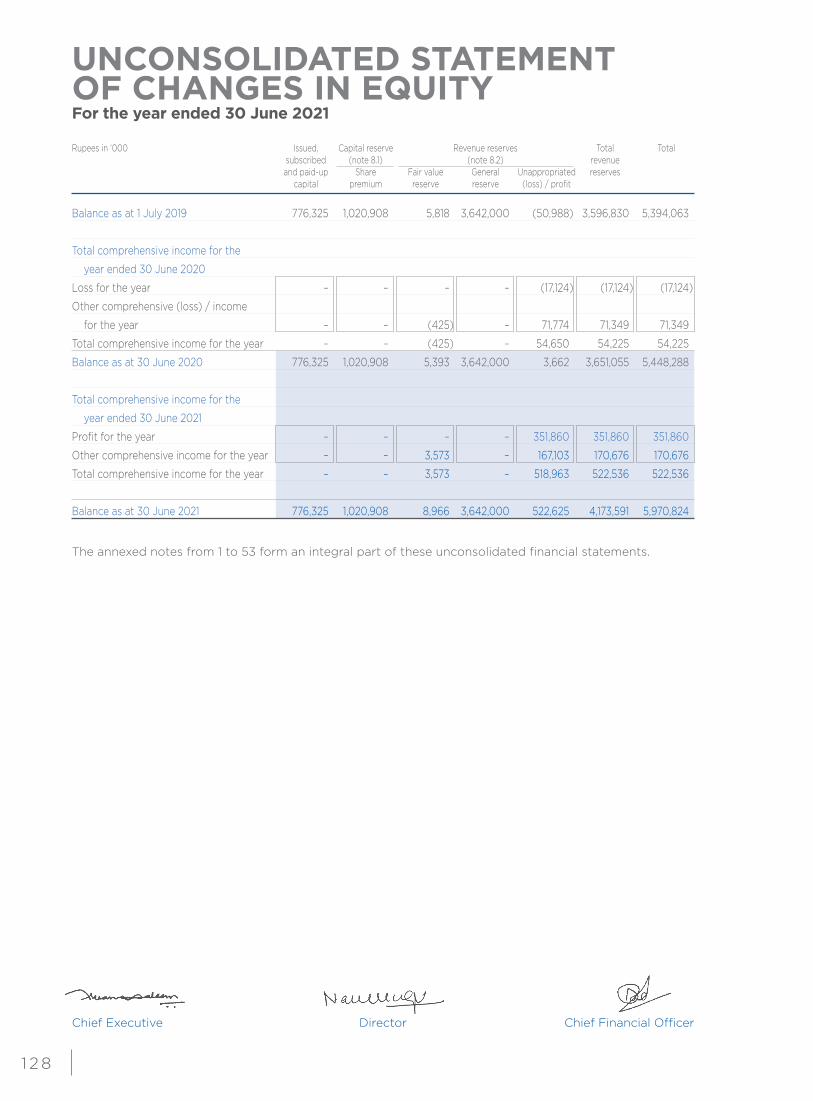
UNCONSOLIDATED STATEMENT OF CHANGES IN EQUITYFor the year ended 30 June 2021
Rupees in ‘000 Issued, Capital reserve Revenue reserves Total Total subscribed (note 8.1) (note 8.2) revenue and paid-up Share Fair value General Unappropriated reserves capital premium reserve reserve (loss) / profit
Balance as at 1 July 2019 776,325 1,020,908 5,818 3,642,000 (50,988) 3,596,830 5,394,063
Total comprehensive income for the
year ended 30 June 2020
Loss for the year – – – – (17,124) (17,124) (17,124)
Other comprehensive (loss) / income
for the year – – (425) – 71,774 71,349 71,349
Total comprehensive income for the year – – (425) – 54,650 54,225 54,225
Balance as at 30 June 2020 776,325 1,020,908 5,393 3,642,000 3,662 3,651,055 5,448,288
Total comprehensive income for the
year ended 30 June 2021
Profit for the year – – – – 351,860 351,860 351,860
Other comprehensive income for the year – – 3,573 – 167,103 170,676 170,676
Total comprehensive income for the year – – 3,573 – 518,963 522,536 522,536
Balance as at 30 June 2021 776,325 1,020,908 8,966 3,642,000 522,625 4,173,591 5,970,824
The annexed notes from 1 to 53 form an integral part of these unconsolidated financial statements.
Chief Executive Director Chief Financial Officer
1 2 9
NOTES TO THE UNCONSOLIDATED FINANCIAL STATEMENTSFor the year ended 30 June 2021
1 THE COMPANY AND ITS OPERATIONS1.1 Crescent Steel and Allied Products Limited (“the Company”) was incorporated on 1 August 1983 as a
public limited company in Pakistan under the Companies Act, 1913 (now Companies Act, 2017) and is quoted on the Pakistan Stock Exchange. The registered office of the Company is located at E-floor, IT Tower, 73-E/1, Hali Road, Gulberg-III, Lahore. Whereas its principal office is situated at 9th floor Sidco Avenue Centre 264 R.A. Lines, Karachi.
1.2 The Company’s steel segment is manufacturing large diameter spiral arc welded steel line pipes
at Nooriabad, District Jamshoro, Sindh. The Company has a coating facility capable of applying three layers high density polyethylene coating on steel line pipes. The coating plant commenced commercial production from 16 November 1992. The Company’s fabrication unit is engaged in fabrication and erection of machinery located at Dalowal, District Faisalabad, Punjab.
1.3 The Company is running cotton spinning unit at Jaranwala, District Faisalabad. This activity is carried
out by the Company under the name and title of “Crescent Cotton Products” a division of Crescent Steel and Allied Products Limited.
1.4 The Company is also managing a portfolio of equity investments and real estate through its Investment
and Infrastructure Division (IID) from the principal office of the Company. 1.5 The Company’s Hadeed (Billet) Segment is to cater to the growing demand of steel products and is
in line with the Company’s vision to organically expand in the steel long products business. The billets manufactured are used by re-rolling mills to manufacture bars and other steel long products for use in the construction and engineering sectors. The plant of the Company is located at Bhone, district Jhang, Punjab.
1.6 The Company’s energy segment’s activity is to build, own, operate and maintain a power plant and to generate, accumulate, distribute, sell and supply electricity / power to Pakistan Electric Power Company (PEPCO) / Distribution Companies (DISCOs) under an agreement with the Government of Pakistan or to any other consumer as permitted. The generation plant use bagasse in the combustion process to produce power and processed steam. The plant of the Company is located at Bhone, district Jhang, Punjab.
2 SUMMARY OF SIGNIFICANT TRANSACTIONS AND EVENTS DURING THE YEAR The Company’s net sales aggregated to Rs. 7.259 billion (2020: Rs. 3.822 billion), out of which 37.7
percent was generated from Steel division, 27.6 percent from Cotton division and rest 34.7 percent i.e. Rs. 2.519 billion were from other divisions.
Steel division net sales for 2021 amounted to Rs. 2.740 billion (2020: Rs. 1.291 billion), current year’s
sales mainly relate to bare pipe orders from SNGPL. Cotton division net sales for 2021 amounted to Rs. 2 billion (2020: Rs. 1.346 billion). During the year, KSE-100 index benchmark increased by 37.58 percent closing at 47,356 points on 30
June 2021. The Company generated income from investments on shares amounting to Rs. 228.650 million including fair value gain recognized from unlisted securities.
During the year, the board has approved to subscribe in right shares offered by CS Capital (Private)
Limited (100% subsidiary) amounting to Rs. 30 million divided into 3,000,000 ordinary shares of Rs.10 each at par.
NOTES TO THE UNCONSOLIDATED FINANCIAL STATEMENTSFor the year ended 30 June 2021
1 3 0
3 BASIS OF PREPARATION 3.1 Unconsolidated financial statements
These are the unconsolidated financial statements (herein after referred to as the financial statements) of the Company in which investments in subsidiaries and associates are stated at cost. The consolidated financial statements of the Company are prepared and presented separately.
3.2 Statement of compliance
These financial statements have been prepared in accordance with the accounting and reporting standards as applicable in Pakistan. The accounting and reporting standards applicable in Pakistan comprise of:
– International Financial Reporting Standards (IFRS Standards) issued by the International
Accounting Standards Board (IASB) as notified under the Companies Act, 2017;
– Islamic Financial Accounting Standards (IFASs) issued by Institute of Chartered Accountants of Pakistan (ICAP) as are notified under the Companies Act, 2017; and
– Provisions of and directives issued under the Companies Act, 2017. Where provisions of and directives issued under the Companies Act, 2017 differ from the IFRS
Standards or IFASs, the provisions of and directives issued under the Companies Act, 2017 have been followed.
3.3 Basis of measurement
These financial statements have been prepared under the historical cost convention except otherwise stated.
3.4 Functional and presentation currency
These financial statements are presented in Pakistan Rupees which is also the Company’s functional currency and the amounts have been rounded to the nearest thousand of Pakistan Rupees.
4 USE OF ESTIMATES, JUDGEMENTS AND ASSUMPTIONS In preparing these financial statements, management has made judgement, estimates and
assumptions that affect the application of the Company’s accounting policies and the reported amounts of assets, liabilities, income and expenses. Actual results may differ from these estimates. Estimates and underlying assumptions are reviewed on an ongoing basis. Revision to estimates are recognised prospectively in the period in which the estimates are revised if the revision affects only that period, or in the period of the revision and future periods if the revision affects both current and future periods.
Information about judgements made in applying accounting policies that have the most significant effects on the amount recognised in the financial statements to the carrying amount of assets, liabilities, assumptions and estimation uncertainties that have a significant risk resulting in a material adjustment in the subsequent years are set forth below:
– Property, plant and equipment (refer note 6.1) – Intangible assets (refer note 6.2) – Investment properties (refer note 6.3) – Investments (refer note 6.4) – Stores, spares and loose tools and stock-in-trade (refer notes 6.8 and 6.9)
1 3 1
– Employee benefits (refer note 6.12) – Leases (refer note 6.14) – Taxation (refer note 6.17) – Provision (refer note 6.21) – Impairment (refer notes 6.1, 6.2, 6.3, 6.4 and 6.22) – Contingencies (refer note 6.27)
5 NEW STANDARDS, AMENDMENTS TO ACCOUNTING AND REPORTING
STANDARDS AND NEW INTERPRETATIONS5.1 Amendments to accounting and reporting standards and interpretations which are effective during
the year ended 30 June 2021
There were certain amendments to the accounting and reporting standards which became mandatory for the Company during the year. However, the amendments did not have any significant impact on the financial reporting of the Company and, therefore, have not been disclosed in these unconsolidated financial statements.
5.2 Standards, interpretations and amendments to published accounting and reporting standards that
are not yet effective but relevant
There are certain amendments to accounting and reporting standards that will be mandatory for the Company’s annual accounting periods beginning on or after 1 July 2021 but are considered not to be relevant or have any significant effect on the Company’s financial reporting.
Further, IFRS 17 ‘Insurance contracts’ is yet to be adopted by the Securities & Exchange Commission
of Pakistan (The SECP).
6 SUMMARY OF SIGNIFICANT ACCOUNTING POLICIES
The significant accounting policies are consistently applied in the preparation of these financial statements and are the same as those applied in earlier periods presented.
6.1 Property, plant and equipment
Owned assets
Property, plant and equipment, except freehold land and capital work-in-progress are stated at cost less accumulated depreciation and impairment losses, if any. Freehold land is stated at cost.
Cost includes expenditure that is directly attributable to the acquisition of the asset. The cost of self-
constructed assets include the cost of materials and direct labour, any other cost directly attributable to bring the assets to a working condition for their intended use, the cost of dismantling and removing the items and restoring the site on which they are located and capitalized borrowing costs, if any.
Subsequent expenditure
The cost of replacing part of an item of property, plant and equipment is recognized in the carrying amount of the item if it is probable that the future economic benefits embodied within that part will flow to the Company and its cost can be measured reliably. The carrying amount of the part so replaced is derecognized. The costs relating to day-to-day servicing of property, plant and equipment are recognized in profit or loss as incurred.
NOTES TO THE UNCONSOLIDATED FINANCIAL STATEMENTSFor the year ended 30 June 2021
1 3 2
Depreciation Depreciation is charged to profit or loss on a straight line basis at the rates specified in note 16.1 to
these financial statements. Depreciation on additions to property, plant and equipment is charged from the month in which an item is acquired or capitalized while no depreciation is charged for the month in which the item is disposed off or retained.
The assets’ residual values and useful lives are reviewed at each financial year end and adjusted if appropriate.
Disposal
The gain or loss on disposal or retirement of an asset represented by the difference between the sale proceeds and the carrying amount of the asset is recognized as an income or expense in the profit or loss.
Right-of-use assets
Upon initial recognition, an asset acquired by way of lease is stated at an amount equal to the lower of its fair value and the present value of minimum lease payments, each determined at the inception of the lease. Subsequent to initial recognition, the asset is stated at the amount determined at initial recognition less accumulated depreciation and impairment losses, if any.
Depreciation is charged on the same basis as used for owned assets. Capital work-in-progress
Capital work in progress is stated at cost less impairment, if any and consists of expenditure incurred and advances made in respect of tangible and intangible assets during the course of their construction and installation. Transfers are made to relevant assets category as and when assets are available for intended use.
Impairment
The carrying amount of property, plant and equipment is reviewed at each reporting date to determine whether there is any indication of impairment. If any such indication exists then the assets recoverable amount is estimated. The recoverable amount is the greater of its value in use and fair value less cost to sell. An impairment is recognized in profit or loss if the carrying amount exceeds its estimated recoverable amount.
6.2 Intangible assets
Intangible assets are stated at cost less accumulated amortization and impairment losses, if any. Subsequent expenditure
Subsequent expenditure on intangible assets is capitalized only when it increases the future economic benefits embodied in the specific assets to which it relates. All other expenditure is expensed as incurred.
Amortization
Amortization is charged to profit or loss on a straight line basis at the rates specified in note 17 to these financial statements, over the estimated useful lives of intangible assets unless such lives are indefinite. Amortization on additions to intangible assets is charged from the month in which an item is acquired or capitalized while no amortization is charged for the month in which the item is disposed off.
1 3 3
Impairment
All intangible assets with an indefinite useful life are systematically tested for impairment at each reporting date. Where the carrying amount of an asset exceeds its estimated recoverable amount it is written down immediately to its recoverable amount. The carrying amount of other intangible assets are reviewed at each reporting date to determine whether there is any indication of impairment. If any such indication exists than the assets’ recoverable amount is estimated. The recoverable amount is the greater of its value in use and fair value less cost to sell. An impairment is recognized if the carrying amount exceeds its estimated recoverable amount.
6.3 Investment properties
Investment properties, principally comprising of land and buildings, are held for long term rental yields / capital appreciation. The investment properties of the Company comprise of land and buildings and are valued using the cost method i.e. at cost less any accumulated depreciation and impairment losses, if any.
Cost includes expenditure that is directly attributable to the acquisition of the investment properties.
The cost of self-constructed investment properties includes the cost of materials and direct labour, any other costs directly attributable to bringing the investment properties to a working condition for their intended use and capitalized borrowing costs, if any.
Depreciation
Depreciation is charged to the profit or loss on the straight line method at the rates specified in the note 18 to these financial statements so as to allocate the depreciable amount over its estimated useful life. Depreciation on additions to investment properties is charged from the month in which a property is acquired or capitalized while no depreciation is charged for the month in which the property is disposed off.
The residual values and useful lives of investment properties are reviewed at each reporting date and
adjusted, if appropriate. Impairment
The Company assesses at each reporting date whether there is any indication that an investment property may be impaired. If such indication exists, the carrying amounts of such assets are reviewed to assess whether they are recorded in excess of their recoverable amount. Where carrying values exceed the respective recoverable amounts, assets are written down to their recoverable amounts and the resulting impairment loss is recognized in profit or loss statement. The recoverable amount is the higher of an asset’s fair value less costs to sell and value in use. Where an impairment loss is recognized, the depreciation charge is adjusted in the future period to allocate the asset’s revised carrying amount over its estimated useful life.
Disposal
The gain or loss on disposal of investment properties, represented by the difference between the sale proceeds and the carrying amount of the asset is recognized as income or expense in the profit or loss.
NOTES TO THE UNCONSOLIDATED FINANCIAL STATEMENTSFor the year ended 30 June 2021
1 3 4
6.4 Financial instruments
6.4.1 Initial recognition and measurement
A financial instrument is any contract that gives rise to a financial asset of one entity and a financial liability or equity instrument of another entity.
Financial assets and financial liabilities are initially measured at fair value. Transaction costs that are
directly attributable to the acquisition or issue of financial assets and financial liabilities (other than financial assets and financial liabilities at fair value through profit or loss) are added to or deducted from the fair value of the financial assets or financial liabilities, as appropriate, on initial recognition.
6.4.2 Financial asset
Classification
On initial recognition, a financial asset is classified as measured at:
– Amortized cost;
– Fair value through other comprehensive income (FVOCI) - Debt investment;
– Fair value through other comprehensive income (FVOCI) - Equity investment; or
– Fair value through profit and loss (FVTPL). The classification depends on the Company’s business model for managing financial assets and the
contractual terms of the financial assets cash flows. Amortized cost
A financial asset is measured at amortized cost if it meets both of the following conditions and is not designated as at FVTPL:
– it is held within a business model whose objective is to hold assets in order to collect contractual cash flows; and
– the contractual terms give rise on specified dates to cash flows that are solely payments of principal and interest on the principal amount outstanding.
FVOCI - Debt investment
A debt investment is measured at FVOCI if it meets both of the following conditions and is not designated as at FVTPL:
– it is held within a business model whose objective is achieved by both collecting contractual cash flows and selling financial assets; and
– its contractual terms give rise on specified dates to cash flows that are solely payments of principal and interest on the principal amount outstanding.
FVOCI - Equity investment
On initial recognition of an equity investment that is not held for trading, the Company may irrevocably elect to present subsequent changes in investment’s fair value in OCI. This election is made on an investment-by-investment basis.
1 3 5
FVTPL
All financial assets not classified as measured at amortized cost or FVOCI as described above are measured at FVTPL. This includes all derivative financial assets. On initial recognition, the Company may irrevocably designate a financial asset that otherwise meets the requirements to be measured at amortized cost or at FVOCI as at FVTPL.
Subsequent measurement and derecognition
Financial assets are not reclassified subsequently to the initial recognition unless the Company changes its business model for managing financial assets in which case all affected financial assets are reclassified on the first day of the first reporting period following the change in the business model.
The financial assets classified at amortized cost are subsequently measured at amortized cost using the effective interest method. The amortized cost is reduced by impairment losses, if any. Interest income, foreign exchange gains and losses and impairment are recognised in profit or loss. Any gain or loss on derecognition is recognised in profit or loss.
Debt investments classified as FVOCI are subsequently measured at fair value. Interest income calculated using effective method, foreign exchange gain and losses and impairment are recognised in profit or loss. Other net gains and losses are recognised in OCI. On de-recognition, gains and losses accumulated in OCI are reclassified to profit or loss.
Equity investments classified as FVOCI are subsequently measured at fair value. Dividends are recognized as income in profit or loss, unless the dividend clearly represents a recovery of part of the cost of the investment, when the Company’s right to receive payments is established. This category only includes equity instruments, which the Company intends to hold for the foreseeable future. On de-recognition, there is no reclassification of fair value gains and losses to profit or loss. Equity instruments at FVOCI are not subject to an impairment assessment under IFRS 9.
The financial assets classified at FVTPL are subsequently measured at fair value and net gains and
losses, including any interest or dividend income, are recognised in profit or loss. Net gains and losses (unrealised and realised), including any interest or dividend income, are recognised in profit or loss.
Impairment of financial assets
IFRS 9 replaces the ‘incurred loss’ model in IAS 39 with an ‘expected credit loss’ (ECL) model. The Company recognised a loss for ECL for financial assets measured at amortized cost, contract assets and debt investments at FVOCI, but not to investments in equity instruments. ECLs are based on the difference between the contractual cash flows due in accordance with the contract and all the cash flows that the Company expects to receive. The shortfall is then discounted at an approximation to the asset’s original effective interest rate. The financial assets at amortized cost consist of trade receivables, cash and cash equivalents, and other receivables including loans to related party.
The Company applies the IFRS 9 simplified approach to measuring expected credit losses which
uses a lifetime expected loss allowance for all trade receivables. Management uses actual historical credit loss experience, adjusted for forward-looking factors specific to the debtors and the economic environment to determine lifetime expected loss allowance. For other debt financial assets (i.e., loans etc.), the ECL is based on the 12-month ECL. The 12-month ECL is the portion of lifetime ECLs that
NOTES TO THE UNCONSOLIDATED FINANCIAL STATEMENTSFor the year ended 30 June 2021
1 3 6
results from default events on a financial instrument that are possible within 12 months after the reporting date. However, when there has been a significant increase in credit risk since origination, the allowance will be based on the lifetime ECL. The Company considers that there has been a significant increase in credit risk when contractual payments are more than 30 days past due and a financial asset in default when contractual payment are 90 days past due.
Derivative financial instruments
The Company enters into derivative financial instruments, which include future contracts in stock market. Derivatives are initially recorded at fair value and are remeasured to fair value on subsequent reporting dates. The fair value of a derivative is equivalent to the unrealized gain or loss from marking to market the derivative using prevailing market rates. Derivatives with positive market values (unrealized gains) are included in other receivables and derivatives with negative market values (unrealized losses) are included in other liabilities in the unconsolidated statement of financial position. The resultant gains and losses from derivatives held for trading purposes are recognized in profit or loss. No derivative is designated as hedging instrument by the Company.
6.4.3 Financial liabilities
Classification and subsequent measurement
The Company classifies its financial liabilities as those to be measured subsequently at amortized cost using the effective interest method, if they are not:
– contingent consideration of an acquirer in a business combination
– held-for-trading
– designated as at FVTPL The Company does not classify any of its financial liabilities under FVTPL. Derecognition
The Company derecognises financial liabilities when, and only when, the Company’s obligations are discharged, cancelled or they expire. The difference between the carrying amount of the financial liability derecognised and the consideration paid and payable, including any non-cash assets transferred or liabilities assumed, is recognised in unconsolidated statement of profit or loss and other comprehensive income.
Offsetting
Financial assets and liabilities are offset and the net amount is presented in the statement of financial position when the Company has a legal right to offset the amounts and intends to settle on a net basis or to realize the asset and settle the liability simultaneously.
6.5 Investments in subsidiaries
Investments in subsidiaries are stated at cost less accumulated impairment, if any. 6.6 Investments in associates
Entities in which the Company has significant influence directly or indirectly (through subsidiaries) but not control and which are neither subsidiaries nor joint ventures of the members of the Company are associates. Investments in associates are stated at cost less accumulated impairment, if any.
1 37
6.7 Non-current assets held for sale
Non-current assets or disposal groups comprising of assets or liabilities that are expected to be recovered primarily through sale rather than through continuing use, are classified as held for sale. Immediately before classification as held for sale, the assets or components of a disposal group, are remeasured at lower of their carrying amount and fair value less costs to sell.
6.8 Stores, spares and loose tools
Stores, spares and loose tools are valued at lower of weighted average cost and net realizable value, less provision for impairment, if any. Items in transit are valued at cost comprising invoice value plus other charges incurred thereon less impairment, if any.
Provision for obsolete and slow moving stores, spares and loose tools is determined based on
management’s estimate regarding their future usability and is charged to profit or loss. Net realizable value signifies the estimated selling price in the ordinary course of business less the
estimated costs necessary to be incurred to make the sale. Spare parts of capital nature which can be used only in connection with an item of property, plant
and equipment are classified as fixed assets under the ‘plant and machinery’ category and are depreciated over a time period not exceeding the useful life of the related assets.
6.9 Stock-in-trade
Stock-in-trade is stated at the lower of cost less impairment loss, if any, and net realizable value. Cost is arrived at on a weighted average basis. Cost of work-in-process and finished goods include cost of materials and appropriate portion of production overheads. Net realizable value is the estimated selling price in the ordinary course of business less costs of completion and selling expenses. The cost of finished goods of Steel segment is assigned by using specific identification of their individual costs. Scrap stocks are valued at their estimated net realizable value.
6.10 Trade debts and other receivables
These are initially stated at fair value and subsequently measured at amortized cost less provisions for any uncollectible amounts. An estimate is made for doubtful receivables when collection of the amount is no longer probable. Debts considered irrecoverable are written off.
6.11 Cash and cash equivalents
Cash and cash equivalents comprise of cash balances and call deposits. Bank overdrafts that are repayable on demand and form an integral part of the Company’s cash management are included as a component of cash and cash equivalents for the purpose of statement of cash flows.
6.12 Employee benefits
6.12.1 Compensated absences
The Company accounts for all accumulated compensated absences when employees render services that increase their entitlement to future compensated absences. No actuarial valuation of compensated absences is carried out as management considers its financial impact would be immaterial.
NOTES TO THE UNCONSOLIDATED FINANCIAL STATEMENTSFor the year ended 30 June 2021
1 3 8
6.12.2 Post retirement benefits
6.12.2.1 Defined contribution plan - Provident fund
The Company operates a provident fund scheme for its permanent employees. Equal monthly contributions are made by the Company and its employees. Obligation for contributions to the fund are recognized as an expense in the profit or loss when they are due.
Cotton segment
Provision and collection from employees are made at the rate of 6.25% of basic pay of Cotton segment employees. A trust has been established and its approval has been obtained from the Commissioner of Income Tax.
All employees except Cotton segment
Contributions to the fund are made at the rate of 8.33% of basic pay for those employees who have served the Company for a period of less than five years and after completion of five years, contributions are made at the rate of 10%.
6.12.2.2 Defined benefit plans
Pension and gratuity fund schemes
The Company provides gratuity benefits to all its permanent eligible employees who have completed their minimum qualifying as per the terms of employment. The pension scheme provides life time pension to retired employees or to their spouses.
The Company’s obligation is determined through actuarial valuations carried out under the “Projected
Unit Credit Method”. Remeasurements which comprise actuarial gains and losses and the return on plan assets (excluding interest) are recognized immediately in other comprehensive income. The Company determines the net interest expense (income) on the net defined benefit liability (asset) for the period by applying the discount rate used to measure the defined benefit obligation at the beginning of the annual period to the then-net defined benefit liability (asset), taking into account any changes in the net defined benefit liability (asset) during the period as a result of contribution and benefit payments. Net interest expense, current service cost and any past service cost are recognized in profit or loss. Any assets resulting from this calculation is limited to the present value of available refunds or reductions in future contributions to the plan. The latest actuarial valuation was conducted at the reporting date by a qualified professional firm of actuaries.
6.12.3 Staff benevolent fund
The Company has established staff benevolent fund as a separate legal entity under the Trust Act, 1882 and registered under Income Tax Ordinance, 2001. The objective of this fund is to provide at the discretion of the trustees, post retirement medical cover / facilities for retired employees and other hardship cases of extraordinary nature of existing employees of the Company. Contributions to the fund are recognized as an expense in the profit or loss when they are incurred.
6.13 Mark-up bearing borrowings
Mark-up bearing borrowings are recognized initially at fair value, less attributable transaction costs. Subsequent to initial recognition, mark-up bearing borrowings are stated at amortized cost with any difference between cost and redemption value being recognized in the profit or loss over the period of the borrowings on an effective interest basis.
1 3 9
6.14 Leases liabilities
Lease are recognised as Right-of-use (RoU) asset and a lease liability at the lease commencement date except for short term or low value leases.
The lease liability is initially measured at the present value of the lease payments that are not paid at
the commencement date, discounted using the interest rate implicit in the lease or, if that rate cannot be readily determined, the Company’s incremental borrowing rate. Generally, the Company uses its incremental borrowing rate as the discount rate.
The lease liability is subsequently increased by the interest cost on the lease liability and decreased
by lease payment made. It is re-measured when there is a change in future lease payments arising from a change in an index or rate, a change in the estimate of the amount expected to be payable under a residual value guarantee, or as appropriate, changes in the assessment of whether a purchase or extension option is reasonably certain to be exercised or a termination option is reasonably certain not to be exercised.
For sale and lease back if the Company has obtained control of the underlying asset and the transfer
is classified as a sale in accordance with IFRS 15 and measures a right-of-use asset arising from the leaseback as the proportion of the previous carrying amount of the asset that relates to the right-of-use retained. The gain (or loss) recognised is limited to the proportion of the total gain (or loss) that relates to the rights transferred.
If the consideration for the sale is not equal to the fair value of the asset, any resulting difference
represents either a prepayment of lease payments (if the purchase price is below market terms) or an additional financing (if the purchase price is above market terms).
If the transfer is not a sale (that is, the Company does not obtain control of the asset in accordance
with IFRS 15), it does not derecognise the transferred asset and accounts for the cash received as a financial liability.
6.15 Asset held under Ijarah financing
Assets held under Ijarah financing are accounted for using the guidelines of Islamic Financial Accounting Standard - 2 (IFAS 2), “Ijarah” as issued by ICAP. The assets are not recognised on the Company’s statement of financial position and payments made under Ijarah financing are recognised in profit or loss on a straight line basis over the term of the lease.
6.16 Government grants
Government grants are transfers of resources to an entity by a government entity in return for compliance with certain past or future conditions related to the entity’s operating activities. The definition of “Government” refers to Governments, Government agencies and similar bodies, whether local, national or international.
The Company recognizes government grants when there is reasonable assurance that grants will be
received and the Company will be able to comply with conditions associated with grants. Government grants are recognised at fair value, as deferred income, when there is reasonable
assurance that the grants will be received and the Company will be able to comply with the conditions associated with the grants.
NOTES TO THE UNCONSOLIDATED FINANCIAL STATEMENTSFor the year ended 30 June 2021
1 4 0
Grants that compensate the Company for expenses incurred, are recognised on a systematic basis in the income for the year in which the related expenses are recognised. Grants that compensate for the cost of an asset are recognised in income on a systematic basis over the expected useful life of the related asset.
A loan is initially recognised and subsequently measured in accordance with IFRS 9. IFRS 9 requires
loans at below-market rates to be initially measured at their fair value - e.g. the present value of the expected future cash flows discounted at a market-related interest rate. The benefit of Government grant is measured as the difference between the fair value of the loan on initial recognition and the amount received, which is accounted for according to the nature of the grant.
6.17 Taxation
Group taxation
The Parent company has opted for Group taxation under section 59AA of the Income Tax Ordinance, 2001 along with its subsidiary CS Capital (Private) Limited. These companies are taxed as one fiscal unit under this scheme. The current and deferred income taxes have been estimated on income of each of the companies according to the applicable law and are recognised by each company separately within the Group, regardless of who has the legal liability for settlement or the legal right for recovery of the tax. Any adjustments arising solely due to Group taxation in respect of result of subsidiary is recognised in the Parent Company and the amounts paid to or receivable from the Parent company are adjusted accordingly.
Current
Provision for current taxation is based on taxable income at the current rates of taxation after taking into account tax credits and tax rebates available, if any, and contains impacts of group taxation as explained above.
Deferred
Deferred tax is provided using the balance sheet liability method, providing for temporary differences between the carrying amount of assets and liabilities for financial reporting purposes and the amounts used for taxation purposes. The amount of deferred tax provided is based on the expected manner of realization or settlement of the carrying amount of assets and liabilities, using the rates that are expected to apply to the period when the differences reverse based on tax rates that have been enacted at the reporting date.
Deferred tax liabilities are recognized for all taxable temporary differences. A deferred tax asset is
recognized for all deductible differences, carry forward of unused tax credits and unused tax losses to the extent that it is probable that future taxable profits or taxable temporary difference will be available against which the asset can be utilized. Deferred tax asset is reduced to the extent that it is no longer probable that the related tax benefits will be realized.
6.18 Revenue recognition
Revenue comprises of sales to third parties and is measured based on the consideration specified in contracts with customers and excludes rebates and amounts, if any, collected on behalf of third parties. Revenue is recognized either at a point in time or over time, when (or as) the Company satisfies the performance obligations as specified in the contract with the customer, and when it transfers control over the promised goods or services to the customer.
1 4 1
The Company manufactures and contracts with customers for the sale of bare pipes, coated pipes, billets, cotton and electricity products which generally include single performance obligation. Management has concluded that revenue from sale of goods should be recognised at the point in time when control of the product has been transferred, i.e. when the products are delivered to the customer. Invoices are generated and revenue is recognised at that point in time. Delivery occurs when the products have been shipped or delivered to the customer’s destination / specific location, the risks of loss have been transferred to the customer and the customer has accepted the product. The customer has accepted the product as per the sales contract or lapse of acceptance provision specified in the contract or the Company has objective evidence that all criteria for acceptance have been satisfied. Contract for the sale of bare and coated pipes contains penalty clause on account of delayed supply (liquiditated damages). Under IFRS 15, these amounts are referred to as ‘variable consideration’. The consideration which the Company receives in exchange for its goods or services may be fixed or variable. Variable consideration is only recognized when it is highly probable that a significant reversal will not occur. Revenue is measured based on the consideration specified in a contract with a customer, net of liquidity damages (penalties) and excludes amounts collected on behalf of third parties. A receivable is recognised when the goods are delivered.
6.19 Investment and other income
Interest income is recognized using the effective interest method. Dividend income is recognized when the right to receive the same is established i.e. the book closure
date of the investee company declaring the dividend. Gains and losses on sale of investments are accounted for when the commitment (trade date) for
sale of security is made. Rental income (net of any incentives given to lessees) from investment property is recognized on a
straight line basis over the lease term. 6.20 Borrowing costs
Borrowing costs incurred on long term finances directly attributable for the construction / acquisition of qualifying assets are capitalized up to the date the respective assets are available for intended use. All other mark-up, interest and other related charges are recognized in profit or loss.
6.21 Provisions
A provision is recognized in the unconsolidated statement of financial position when the Company has a legal or constructive obligation as a result of past events, it is probable that an outflow of economic benefits will be required to settle the obligation and a reliable estimate can be made of the amount of the obligation. Provisions are reviewed at each reporting date and adjusted to reflect the current best estimate.
6.22 Impairment
The carrying amount of the Company’s assets is reviewed at each reporting date to determine whether there is any objective evidence that an asset or group of assets may be impaired. If any such evidence exists, the asset’s or group of assets’ recoverable amount is estimated. An impairment loss is recognized whenever the carrying amount of an asset exceeds its recoverable amount. Recoverable amount is the higher of value in use and fair value less cost to sell. Impairment losses are recognized in profit or loss.
NOTES TO THE UNCONSOLIDATED FINANCIAL STATEMENTSFor the year ended 30 June 2021
1 4 2
6.23 Foreign currency translation
Foreign currency transactions are translated into Pakistan Rupees at exchange rates prevailing on the date of transaction. Monetary assets and liabilities in foreign currencies are translated into Pakistan Rupees at the rates of exchange prevailing at the reporting date. Exchange differences, if any, are recognized in the profit or loss.
6.24 Segment reporting
Operating segments are reported in a manner consistent with the internal reporting structure. Management monitors the operating results of its business units separately for the purpose of making decisions regarding resource allocation and performance assessment.
Segment capital expenditure is the total cost incurred during the period to acquire property, plant
and equipment and intangible assets. Transactions between reportable segments are reported at cost.
6.25 Proposed dividend and transfer between reserves
Dividend distributions to the Company’s shareholders are recognized as a liability in the period in which dividends are approved. Transfer between reserves made subsequent to the reporting date is considered as a non-adjusting event and is recognized in the period in which such transfers are made.
6.26 Earnings per share
The Company presents earnings per share (EPS) for its ordinary shares. EPS is calculated by dividing profit or loss attributable to ordinary shareholders of the Company by the weighted average number of ordinary shares outstanding during the year.
6.27 Contingencies
Contingencies are disclosed when Company has possible obligation that arises from past event and whose existence will be confirmed only by occurrence or non-occurrence of one or more uncertain future events not wholly within the control of entity, or a present obligation that arises from past event but is not recognised because it is not probable that an outflow of resources embodying economic benefit will be required to settle the obligation or, when amount of obligation cannot be measured with sufficient reliability.
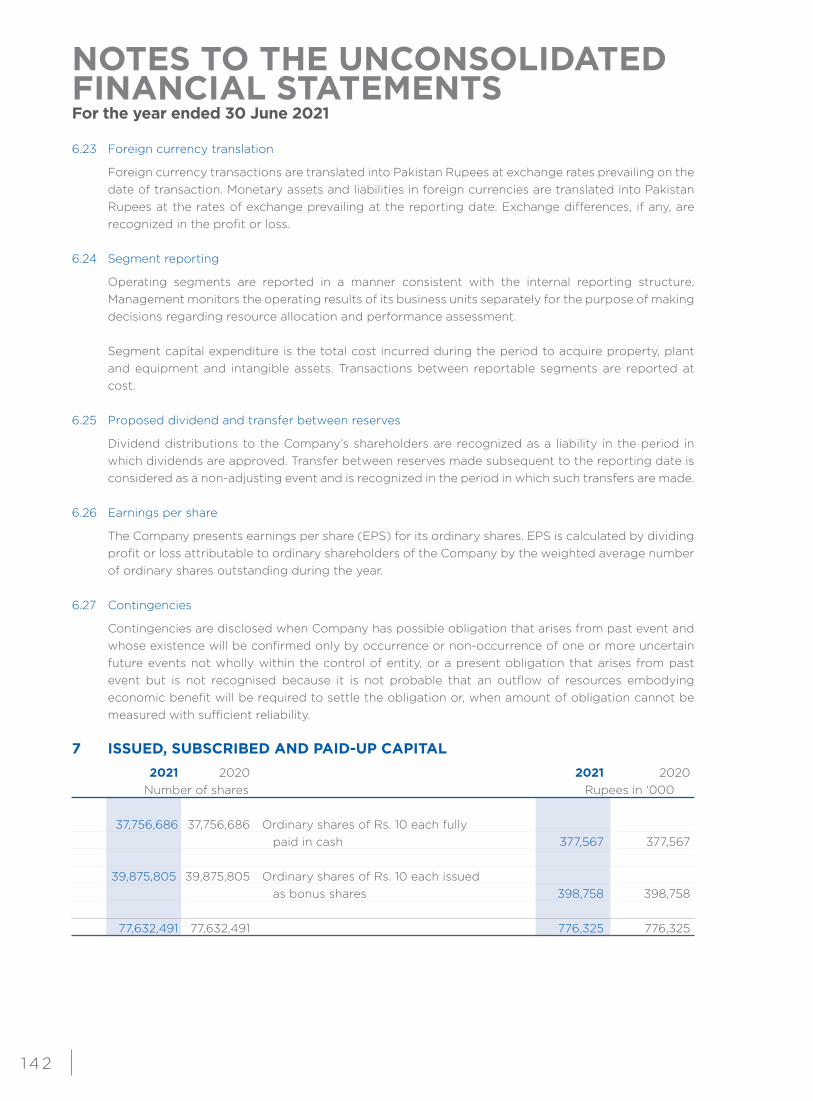
7 ISSUED, SUBSCRIBED AND PAID-UP CAPITAL
2021 2020 2021 2020 Number of shares Rupees in ‘000 37,756,686 37,756,686 Ordinary shares of Rs. 10 each fully paid in cash 377,567 377,567 39,875,805 39,875,805 Ordinary shares of Rs. 10 each issued as bonus shares 398,758 398,758 77,632,491 77,632,491 776,325 776,325
1 4 3
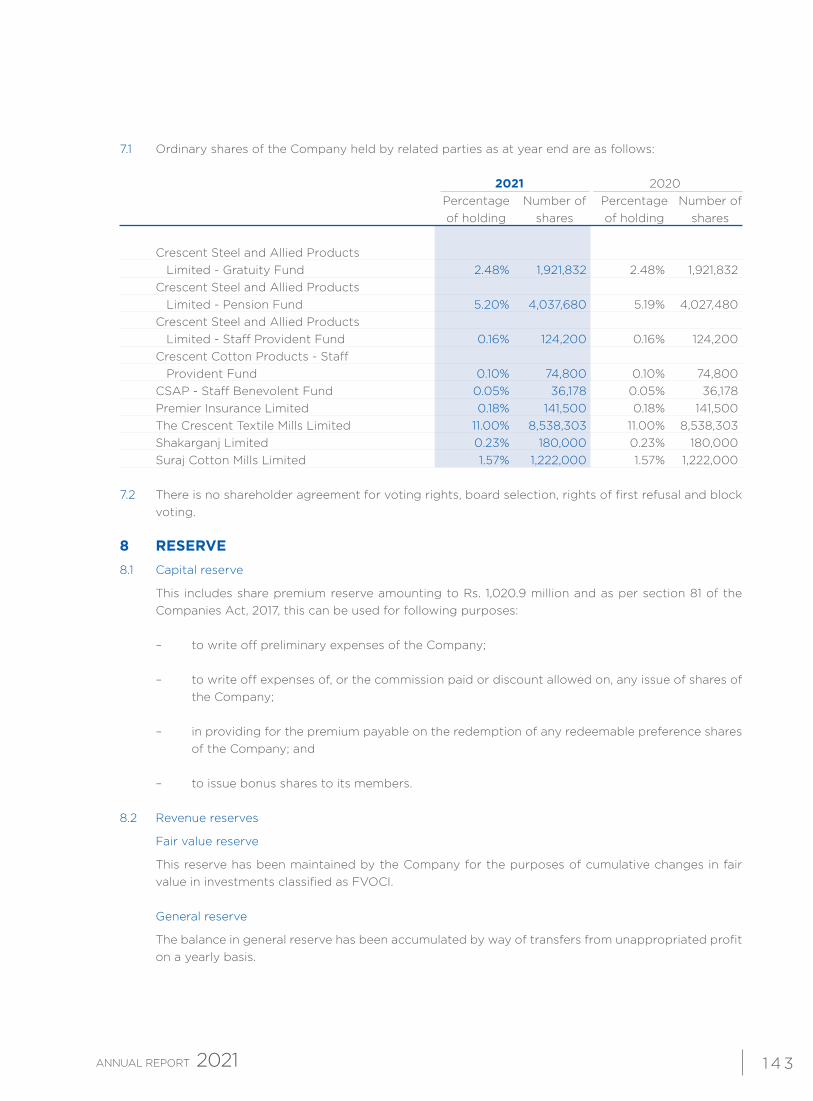
7.1 Ordinary shares of the Company held by related parties as at year end are as follows: 2021 2020 Percentage Number of Percentage Number of of holding shares of holding shares
Crescent Steel and Allied Products Limited - Gratuity Fund 2.48% 1,921,832 2.48% 1,921,832 Crescent Steel and Allied Products Limited - Pension Fund 5.20% 4,037,680 5.19% 4,027,480 Crescent Steel and Allied Products Limited - Staff Provident Fund 0.16% 124,200 0.16% 124,200 Crescent Cotton Products - Staff Provident Fund 0.10% 74,800 0.10% 74,800 CSAP - Staff Benevolent Fund 0.05% 36,178 0.05% 36,178 Premier Insurance Limited 0.18% 141,500 0.18% 141,500 The Crescent Textile Mills Limited 11.00% 8,538,303 11.00% 8,538,303 Shakarganj Limited 0.23% 180,000 0.23% 180,000 Suraj Cotton Mills Limited 1.57% 1,222,000 1.57% 1,222,000 7.2 There is no shareholder agreement for voting rights, board selection, rights of first refusal and block
voting. 8 RESERVE 8.1 Capital reserve
This includes share premium reserve amounting to Rs. 1,020.9 million and as per section 81 of the Companies Act, 2017, this can be used for following purposes:
– to write off preliminary expenses of the Company;
– to write off expenses of, or the commission paid or discount allowed on, any issue of shares of the Company;
– in providing for the premium payable on the redemption of any redeemable preference shares
of the Company; and – to issue bonus shares to its members.
8.2 Revenue reserves
Fair value reserve
This reserve has been maintained by the Company for the purposes of cumulative changes in fair value in investments classified as FVOCI.
General reserve
The balance in general reserve has been accumulated by way of transfers from unappropriated profit on a yearly basis.
NOTES TO THE UNCONSOLIDATED FINANCIAL STATEMENTSFor the year ended 30 June 2021
1 4 4
Rupees in ‘000 Note 2021 2020
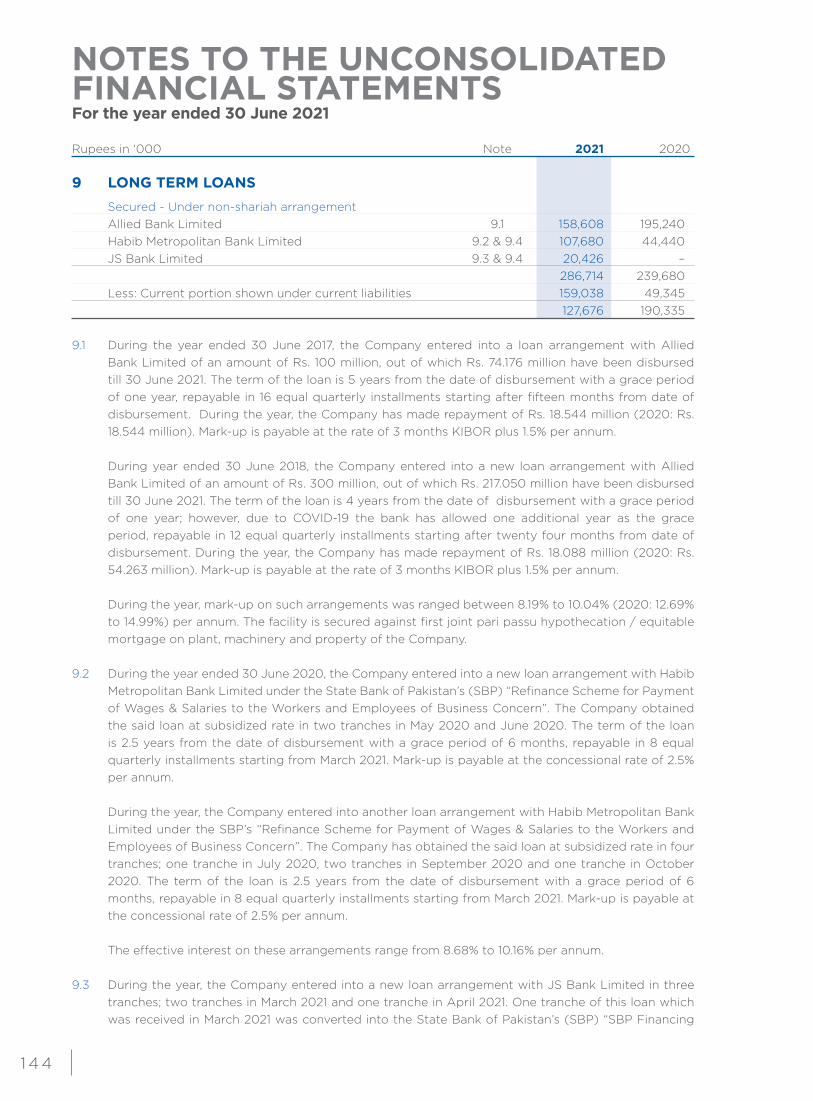
9 LONG TERM LOANS Secured - Under non-shariah arrangement Allied Bank Limited 9.1 158,608 195,240 Habib Metropolitan Bank Limited 9.2 & 9.4 107,680 44,440 JS Bank Limited 9.3 & 9.4 20,426 – 286,714 239,680 Less: Current portion shown under current liabilities 159,038 49,345 127,676 190,335 9.1 During the year ended 30 June 2017, the Company entered into a loan arrangement with Allied
Bank Limited of an amount of Rs. 100 million, out of which Rs. 74.176 million have been disbursed till 30 June 2021. The term of the loan is 5 years from the date of disbursement with a grace period of one year, repayable in 16 equal quarterly installments starting after fifteen months from date of disbursement. During the year, the Company has made repayment of Rs. 18.544 million (2020: Rs. 18.544 million). Mark-up is payable at the rate of 3 months KIBOR plus 1.5% per annum.
During year ended 30 June 2018, the Company entered into a new loan arrangement with Allied Bank Limited of an amount of Rs. 300 million, out of which Rs. 217.050 million have been disbursed till 30 June 2021. The term of the loan is 4 years from the date of disbursement with a grace period of one year; however, due to COVID-19 the bank has allowed one additional year as the grace period, repayable in 12 equal quarterly installments starting after twenty four months from date of disbursement. During the year, the Company has made repayment of Rs. 18.088 million (2020: Rs. 54.263 million). Mark-up is payable at the rate of 3 months KIBOR plus 1.5% per annum.
During the year, mark-up on such arrangements was ranged between 8.19% to 10.04% (2020: 12.69%
to 14.99%) per annum. The facility is secured against first joint pari passu hypothecation / equitable mortgage on plant, machinery and property of the Company.
9.2 During the year ended 30 June 2020, the Company entered into a new loan arrangement with Habib
Metropolitan Bank Limited under the State Bank of Pakistan’s (SBP) “Refinance Scheme for Payment of Wages & Salaries to the Workers and Employees of Business Concern”. The Company obtained the said loan at subsidized rate in two tranches in May 2020 and June 2020. The term of the loan is 2.5 years from the date of disbursement with a grace period of 6 months, repayable in 8 equal quarterly installments starting from March 2021. Mark-up is payable at the concessional rate of 2.5% per annum.
During the year, the Company entered into another loan arrangement with Habib Metropolitan Bank
Limited under the SBP’s “Refinance Scheme for Payment of Wages & Salaries to the Workers and Employees of Business Concern”. The Company has obtained the said loan at subsidized rate in four tranches; one tranche in July 2020, two tranches in September 2020 and one tranche in October 2020. The term of the loan is 2.5 years from the date of disbursement with a grace period of 6 months, repayable in 8 equal quarterly installments starting from March 2021. Mark-up is payable at the concessional rate of 2.5% per annum.
The effective interest on these arrangements range from 8.68% to 10.16% per annum. 9.3 During the year, the Company entered into a new loan arrangement with JS Bank Limited in three
tranches; two tranches in March 2021 and one tranche in April 2021. One tranche of this loan which was received in March 2021 was converted into the State Bank of Pakistan’s (SBP) “SBP Financing
1 4 5
Scheme for Renewable Energy” in the month of April 2021. The term of the loan is 10 years from the date of disbursement with a grace period of 3 months, repayable in monthly installments starting from June 2021. Mark-up is payable at the rate of 1 month KIBOR plus 1% per annum till approval of refinance from the SBP and after approval form the SBP, mark-up is payable at the concessional rate of 6% per annum.
The effective interest on this arrangement is 8.49% per annum. 9.4 The benefit of subsidized loans under notes 9.2 and 9.3 has been recognized as deferred income
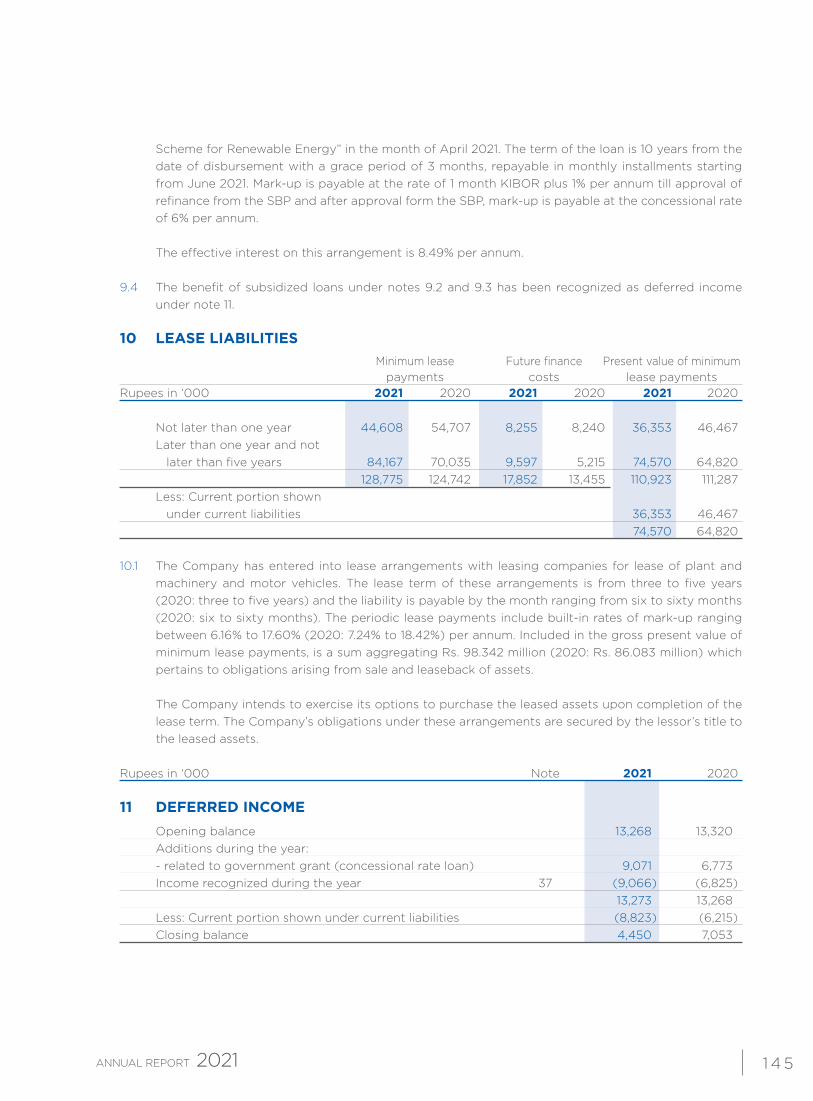
under note 11. 10 LEASE LIABILITIES Minimum lease Future finance Present value of minimum payments costs lease payments Rupees in ‘000 2021 2020 2021 2020 2021 2020 Not later than one year 44,608 54,707 8,255 8,240 36,353 46,467 Later than one year and not later than five years 84,167 70,035 9,597 5,215 74,570 64,820 128,775 124,742 17,852 13,455 110,923 111,287 Less: Current portion shown under current liabilities 36,353 46,467 74,570 64,820 10.1 The Company has entered into lease arrangements with leasing companies for lease of plant and
machinery and motor vehicles. The lease term of these arrangements is from three to five years (2020: three to five years) and the liability is payable by the month ranging from six to sixty months (2020: six to sixty months). The periodic lease payments include built-in rates of mark-up ranging between 6.16% to 17.60% (2020: 7.24% to 18.42%) per annum. Included in the gross present value of minimum lease payments, is a sum aggregating Rs. 98.342 million (2020: Rs. 86.083 million) which pertains to obligations arising from sale and leaseback of assets.
The Company intends to exercise its options to purchase the leased assets upon completion of the lease term. The Company’s obligations under these arrangements are secured by the lessor’s title to the leased assets.
Rupees in ‘000 Note 2021 2020
11 DEFERRED INCOME
Opening balance 13,268 13,320 Additions during the year: - related to government grant (concessional rate loan) 9,071 6,773 Income recognized during the year 37 (9,066) (6,825) 13,273 13,268 Less: Current portion shown under current liabilities (8,823) (6,215) Closing balance 4,450 7,053
NOTES TO THE UNCONSOLIDATED FINANCIAL STATEMENTSFor the year ended 30 June 2021
1 4 6
Rupees in ‘000 Note 2021 2020
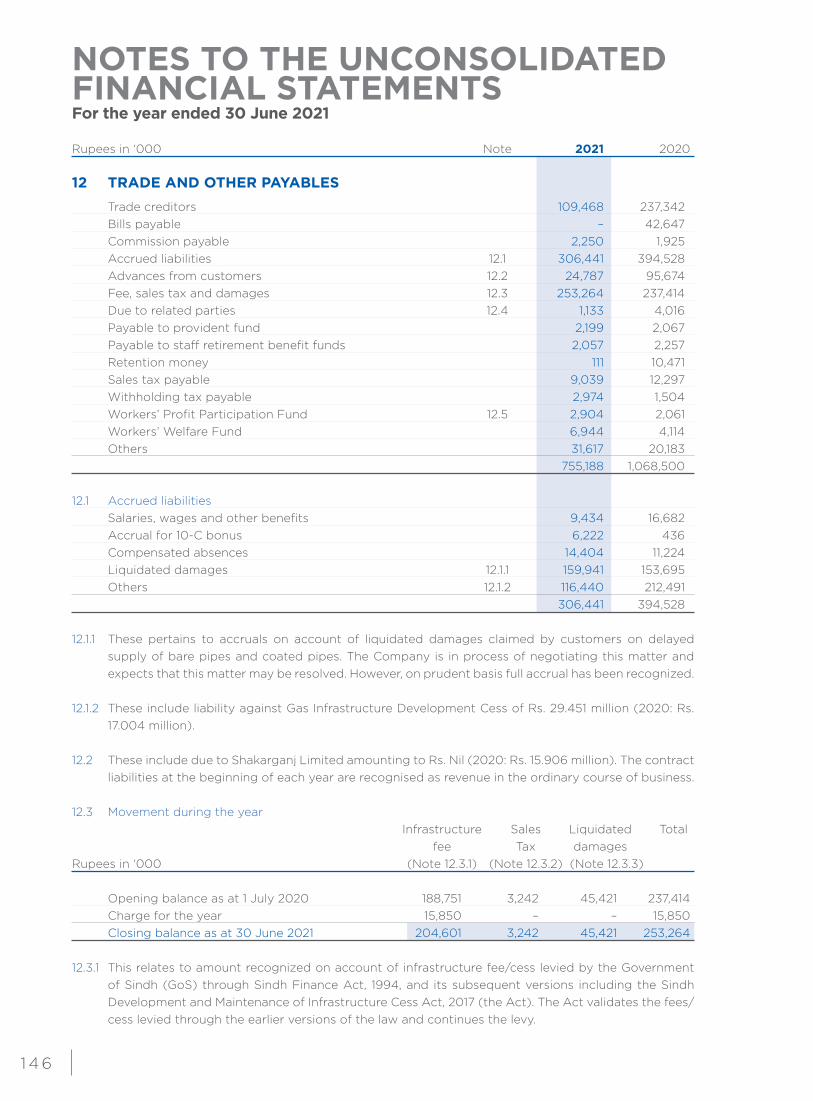
12 TRADE AND OTHER PAYABLES Trade creditors 109,468 237,342 Bills payable – 42,647 Commission payable 2,250 1,925 Accrued liabilities 12.1 306,441 394,528 Advances from customers 12.2 24,787 95,674 Fee, sales tax and damages 12.3 253,264 237,414 Due to related parties 12.4 1,133 4,016 Payable to provident fund 2,199 2,067 Payable to staff retirement benefit funds 2,057 2,257 Retention money 111 10,471 Sales tax payable 9,039 12,297 Withholding tax payable 2,974 1,504 Workers’ Profit Participation Fund 12.5 2,904 2,061 Workers’ Welfare Fund 6,944 4,114 Others 31,617 20,183 755,188 1,068,500 12.1 Accrued liabilities Salaries, wages and other benefits 9,434 16,682 Accrual for 10-C bonus 6,222 436 Compensated absences 14,404 11,224 Liquidated damages 12.1.1 159,941 153,695 Others 12.1.2 116,440 212,491 306,441 394,528 12.1.1 These pertains to accruals on account of liquidated damages claimed by customers on delayed
supply of bare pipes and coated pipes. The Company is in process of negotiating this matter and expects that this matter may be resolved. However, on prudent basis full accrual has been recognized.
12.1.2 These include liability against Gas Infrastructure Development Cess of Rs. 29.451 million (2020: Rs. 17.004 million).
12.2 These include due to Shakarganj Limited amounting to Rs. Nil (2020: Rs. 15.906 million). The contract
liabilities at the beginning of each year are recognised as revenue in the ordinary course of business. 12.3 Movement during the year Infrastructure Sales Liquidated Total fee Tax damages Rupees in ‘000 (Note 12.3.1) (Note 12.3.2) (Note 12.3.3)
Opening balance as at 1 July 2020 188,751 3,242 45,421 237,414 Charge for the year 15,850 – – 15,850 Closing balance as at 30 June 2021 204,601 3,242 45,421 253,264 12.3.1 This relates to amount recognized on account of infrastructure fee/cess levied by the Government
of Sindh (GoS) through Sindh Finance Act, 1994, and its subsequent versions including the Sindh Development and Maintenance of Infrastructure Cess Act, 2017 (the Act). The Act validates the fees/cess levied through the earlier versions of the law and continues the levy.
1 47
The Company contested this issue of levy and charging of fee/cess in the Sindh High Court (SHC) where the appeal was partly accepted and it was held in judgment dated 15 September 2008 that the levy and collection of infrastructure fee prior to 28 December 2006 was illegal and ultra vires and after that it is legal. The Company filed an appeal in the Supreme Court of Pakistan (SCP) against this judgment. Additionally, the GoS also filed appeal against the part of judgment decided against them.
The above appeals were disposed off in May 2011 with a joint statement of the parties that, during the pendency of the appeal, another law (a new version) came into existence which was not subject matter in the appeal. Therefore, the decision thereon be first obtained from the SHC before approaching the SCP with the right to appeal. Accordingly, a petition was filed in the SHC in respect of the above view. During the pendency of the appeal, an interim arrangement was agreed whereby bank guarantee furnished for consignments cleared up to 27 December 2006 were returned. Bank guarantees were furnished for 50% of the levy on the consignments released subsequent to 28 December 2006 while payment was made against the balance 50% amount.
After promulgation of the Act, 2017, the Company instituted legal proceedings against the levy in
the SHC, where interim stay was granted on similar terms of payment of 50% of the amount of cess to the GoS and on furnishing of bank guarantees for remaining 50%.Under the arrangement if the Company succeeded in the petition, GoS would refund the amount subject to their right to appeal before SCP.
The petitions pending against all the versions of this law have been decided by the SHC by a
consolidated judgment dated 4 June 2021 whereby the SHC has declared that the first four versions of the law upto the Sindh Finance (Second Amendment) Ordinance, 2001, were illegal and ultra vires as also held in the 2008 judgement of the SHC, to the extent of the petitioners who had litigated and were appellants in the earlier round for whom the applicability has attained finality and is a past and closed transaction. The 2021 judgement has validated the recovery of cess/fee effective from 28 December 2006, through the subsequent versions of the law.
The SHC has suspended its judgment till 3 September 2021 and interim arrangement of payment
of 50% of the amount of cess to the GoS and furnishing of bank guarantees for remaining 50% would continue, after which guarantees provided would be en-cashed and 100% of infrastructure cess would be payable if no such stay order is passed by the SHC in the appeals to be filed against the judgment of the SHC. The Company intends to contest the issue in the SCP and as per the advice of the Company’s legal counsel the chances of success in this litigation are in the Company’s favour.
Till 30 June 2021, the Company has provided bank guarantees amounting to Rs. 166.54 million (2020: Rs. 156.039 million) in favour of Excise and Taxation Department, GoS.
Amount charged for the year has been estimated on the value of imports during the year and forms
a component of cost of such imported raw materials. Any subsequent adjustment with respect to increase or decrease in the estimate has been recognized in the profit or loss. On a prudent basis, full amount has been recognized in this respect in these financial statements.
12.3.2 These have been made against long outstanding sales tax claims with the sales tax department.
12.3.3 This relates to amount recognised on account of liquidated damages on delayed supply of bare pipes and coated pipes. On a prudent basis full amount has been recognized in profit or loss.
NOTES TO THE UNCONSOLIDATED FINANCIAL STATEMENTSFor the year ended 30 June 2021
1 4 8
Rupees in ‘000 Note 2021 2020
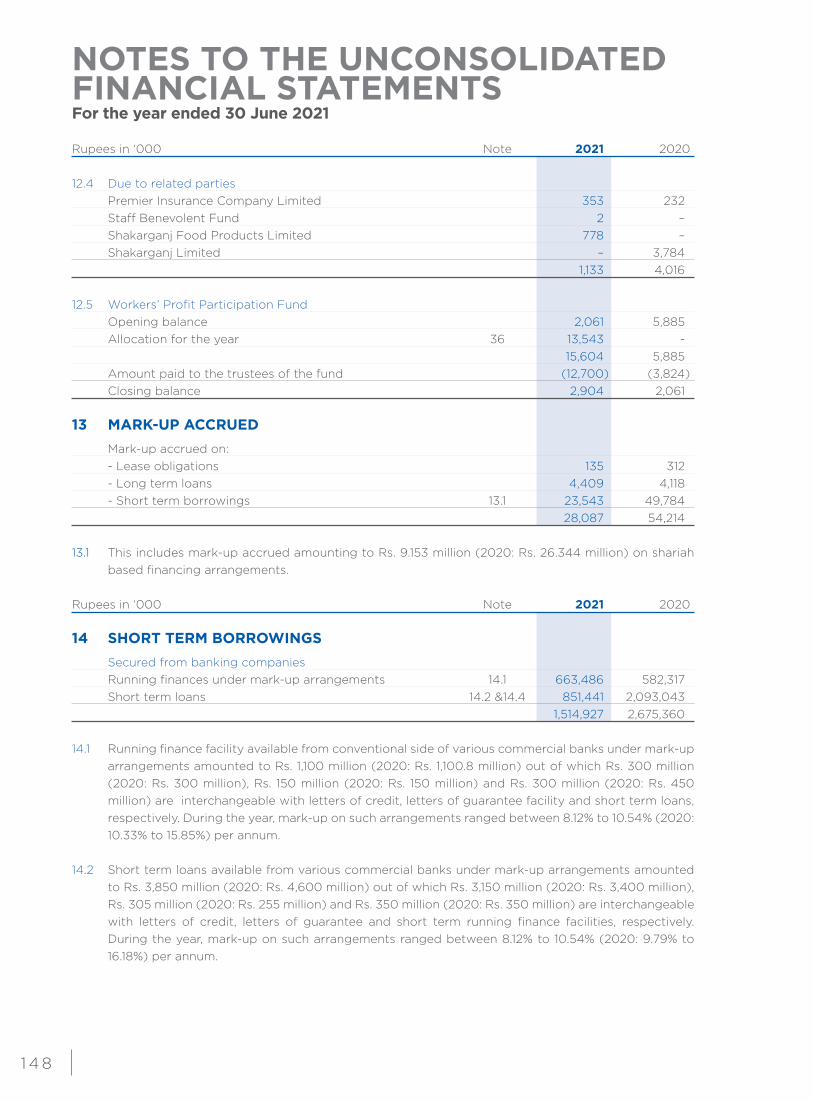
12.4 Due to related parties Premier Insurance Company Limited 353 232 Staff Benevolent Fund 2 – Shakarganj Food Products Limited 778 – Shakarganj Limited – 3,784 1,133 4,016 12.5 Workers’ Profit Participation Fund Opening balance 2,061 5,885 Allocation for the year 36 13,543 - 15,604 5,885 Amount paid to the trustees of the fund (12,700) (3,824) Closing balance 2,904 2,061 13 MARK-UP ACCRUED Mark-up accrued on: - Lease obligations 135 312 - Long term loans 4,409 4,118 - Short term borrowings 13.1 23,543 49,784 28,087 54,214 13.1 This includes mark-up accrued amounting to Rs. 9.153 million (2020: Rs. 26.344 million) on shariah
based financing arrangements.
Rupees in ‘000 Note 2021 2020 14 SHORT TERM BORROWINGS Secured from banking companies Running finances under mark-up arrangements 14.1 663,486 582,317 Short term loans 14.2 &14.4 851,441 2,093,043 1,514,927 2,675,360 14.1 Running finance facility available from conventional side of various commercial banks under mark-up
arrangements amounted to Rs. 1,100 million (2020: Rs. 1,100.8 million) out of which Rs. 300 million (2020: Rs. 300 million), Rs. 150 million (2020: Rs. 150 million) and Rs. 300 million (2020: Rs. 450 million) are interchangeable with letters of credit, letters of guarantee facility and short term loans, respectively. During the year, mark-up on such arrangements ranged between 8.12% to 10.54% (2020: 10.33% to 15.85%) per annum.
14.2 Short term loans available from various commercial banks under mark-up arrangements amounted
to Rs. 3,850 million (2020: Rs. 4,600 million) out of which Rs. 3,150 million (2020: Rs. 3,400 million), Rs. 305 million (2020: Rs. 255 million) and Rs. 350 million (2020: Rs. 350 million) are interchangeable with letters of credit, letters of guarantee and short term running finance facilities, respectively. During the year, mark-up on such arrangements ranged between 8.12% to 10.54% (2020: 9.79% to 16.18%) per annum.
1 49
14.3 The facilities for opening letters of credit amounted to Rs. 4,750 million (2020: Rs. 4,600 million) out of which Rs. 300 million (2020: Rs. 300 million), Rs. 3,150 million (2020: Rs. 3,650 million) and Rs. 305 million (2020: Rs. 255 million) are interchangeable with short term running finances, short term loans and letters of guarantee, respectively as mentioned in notes 14.1 and 14.2 above. The facility for letters of guarantee as at 30 June 2021 amounted to Rs. 1,827 million (2020: Rs. 1,794.1 million). Amounts unutilized for letters of credit and guarantees as at 30 June 2021 were Rs. 3,884.903 million and Rs. 329.442 million (2020: Rs. 4,458.25 million and Rs. 69.923 million), respectively.
14.4 This includes an amount of Rs. 424.181 million (2020: Rs. 697.11 million) outstanding against Islamic mode of financing. The Company is currently availing Islamic mode of financing from the Al Baraka Bank, Dubai Islamic Bank, and Bank Islami Pakistan Limited. Facilities availed during the year include letters of credit, bank guarantees, Wakala, Morabaha, Istisna and Ijarah financing.
14.5 The above facilities are expiring on various dates with maturity periods upto 31 January 2022. These
facilities are secured by way of mortgage of land and building, hypothecation of plant and machinery, stock-in-trade, trade debts and other current assets, pledge of shares (refer note 27.2); and lien over import / export documents. Further, these facilities (refer notes 14.1 to 14.3) are also secured against pledge of shares owned by CS Capital (Private) Limited (subsidiary company).
15 CONTINGENCIES AND COMMITMENTS 15.1 Contingencies
15.1.1 During the year 2014 - 2015, a show cause notice was issued by the Deputy Director, Directorate of Post Clearance Audit (Customs) Karachi for payment of duties and taxes on import of certain raw materials. In response the Company had contested that the said imports were exempt under bilateral agreement between Government of Pakistan and Government of Japan for projects under grant and accordingly these were cleared by the customs. However, the collector customs issued an order dated 22 May 2015 for recovery of the said duty and taxes and penalty thereon amounting to Rs. 35.773 million. The Company has filed an appeal with the Appellate Tribunal (Customs) against the order. Based on tax consultant’s opinion, no provision has been recognized in these financial statements as the case is under appeal and management considers that the same would be decided in the Company’s favour.
15.1.2 During the year 2015 - 2016, a show cause notice was received from Sindh Revenue Board (SRB) in respect of registration as a service provider and a demand aggregating to Rs. 60 million in respect of sales tax on services was raised thereby. The Company filed a constitutional writ in the SHC against the SRB and GoS in which SHC granted interim relief to the Company.
Subsequently, the writ was decided in light of SCP’s orders in similar writs where SCP had decreed
for a 50% payment of tax demand in order to keep the writs maintainable. Following closure of petition, the Company received show cause notices and demands for Sindh
Sales Tax payments amounting to Rs. 79 million, which were challenged in SHC in a civil suit as well as at the Appellate forums of the tax authority. Currently, the case is pending adjudication at the SHC as well as the Commissioner (Appeals) – SRB.
No provision has been recognized in these financial statements in this respect, since based on the opinions of tax consultant and the Company’s legal counsel, the management is confident of favorable outcome of the litigation in relation to the said matter.
NOTES TO THE UNCONSOLIDATED FINANCIAL STATEMENTSFor the year ended 30 June 2021
1 5 0
15.1.3 Sindh Industrial Trade Estate (SITE) has cancelled allotment of plot A-26 and A-27 and charged non-utilization fees of Rs. 0.285 million and Rs. 0.621 million, respectively. The Company has challenged the cancellation and filed a suit in the SHC. The SHC has restrained SITE from taking any adverse action against the Company. Therefore, management considers that the case would be decided in the Company’s favour and no provision is required to be recognized in these financial statements.
15.2 Commitments
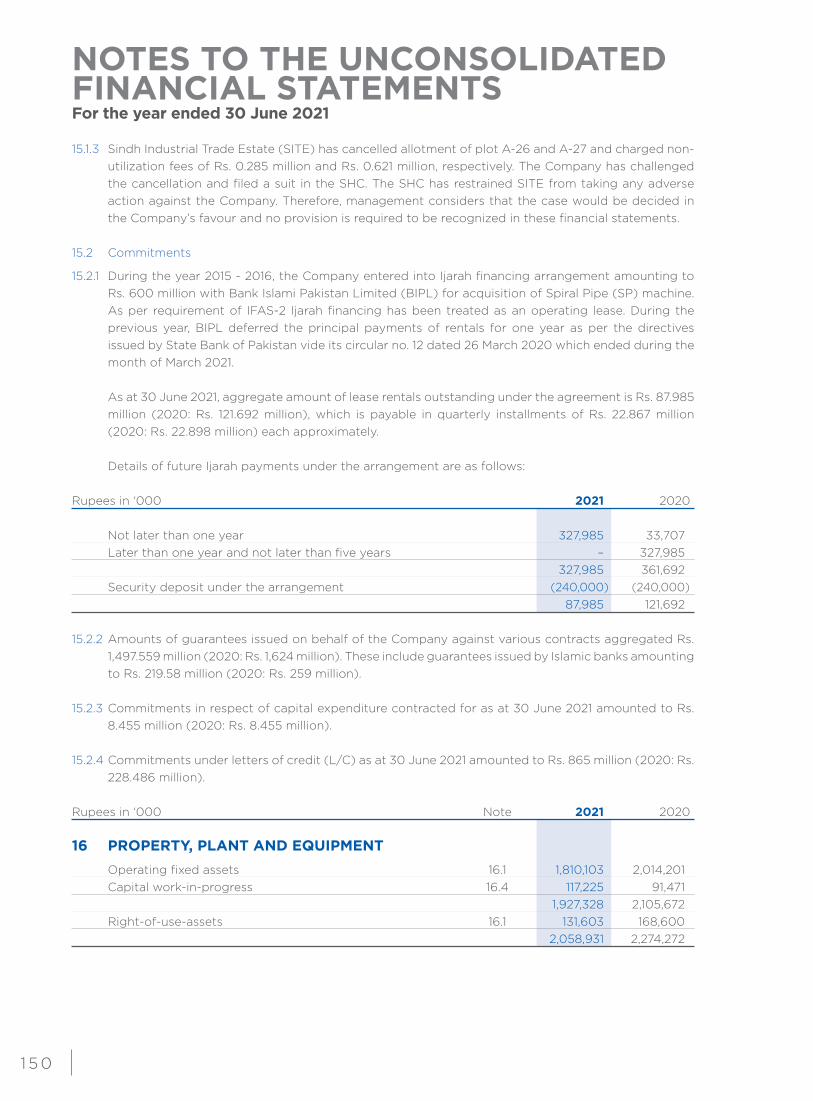
15.2.1 During the year 2015 - 2016, the Company entered into Ijarah financing arrangement amounting to Rs. 600 million with Bank Islami Pakistan Limited (BIPL) for acquisition of Spiral Pipe (SP) machine. As per requirement of IFAS-2 Ijarah financing has been treated as an operating lease. During the previous year, BIPL deferred the principal payments of rentals for one year as per the directives issued by State Bank of Pakistan vide its circular no. 12 dated 26 March 2020 which ended during the month of March 2021.
As at 30 June 2021, aggregate amount of lease rentals outstanding under the agreement is Rs. 87.985
million (2020: Rs. 121.692 million), which is payable in quarterly installments of Rs. 22.867 million (2020: Rs. 22.898 million) each approximately.
Details of future Ijarah payments under the arrangement are as follows:
Rupees in ‘000 2021 2020 Not later than one year 327,985 33,707 Later than one year and not later than five years – 327,985 327,985 361,692 Security deposit under the arrangement (240,000) (240,000) 87,985 121,692 15.2.2 Amounts of guarantees issued on behalf of the Company against various contracts aggregated Rs.
1,497.559 million (2020: Rs. 1,624 million). These include guarantees issued by Islamic banks amounting to Rs. 219.58 million (2020: Rs. 259 million).
15.2.3 Commitments in respect of capital expenditure contracted for as at 30 June 2021 amounted to Rs. 8.455 million (2020: Rs. 8.455 million).
15.2.4 Commitments under letters of credit (L/C) as at 30 June 2021 amounted to Rs. 865 million (2020: Rs.
228.486 million).
Rupees in ‘000 Note 2021 2020
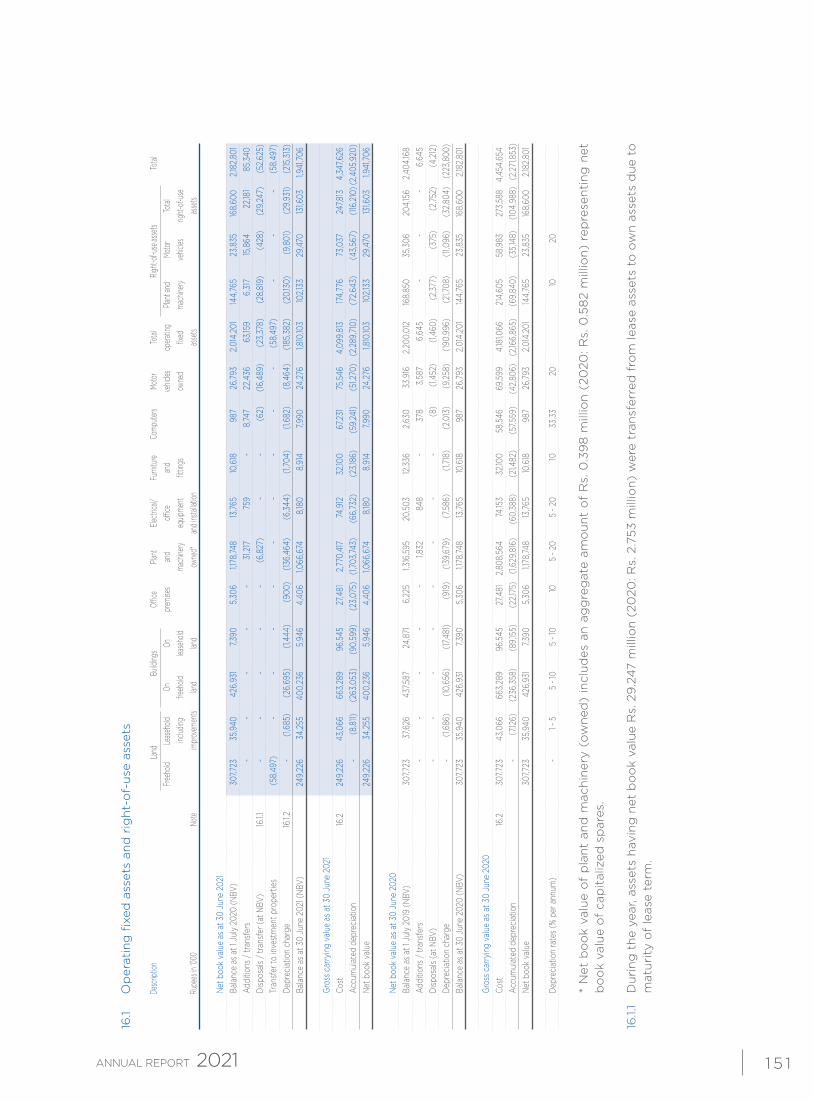
16 PROPERTY, PLANT AND EQUIPMENT Operating fixed assets 16.1 1,810,103 2,014,201 Capital work-in-progress 16.4 117,225 91,471 1,927,328 2,105,672 Right-of-use-assets 16.1 131,603 168,600 2,058,931 2,274,272
1 5 1
16.1
Op
erat
ing
fixe
d a
sset
s an
d r
igh
t-o
f-u
se a
sset
s
De
scrip
tion
Land
Bu
ilding
s Offi
ce
Plant
Ele
ctrica
l/ Fu
rnitu
re Co
mpute
rs Mo
tor
Total
Right
-of-u
se as
sets
Total
Fr
eeho
ld Le
aseh
old
On
On
prem
ises
and
office
an
d
vehic
les
opera
ting
Plant
and
Moto
r To
tal
inclu
ding
freeh
old
lease
hold
ma
chine
ry eq
uipme
nt
fittin
gs
ow
ned
fixed
ma
chine
ry ve
hicles
rig
ht-o
f-use
Ru
pees
in ‘0
00
Note
im
prov
emen
ts lan
d lan
d
owne
d*
and i
nstal
lation
asse
ts
as
sets
Ne
t boo
k va
lue
as a
t 30
June
202
1
Bala
nce
as a
t 1 J
uly
2020
(NBV
)
307
,723
3
5,94
0
426
,931
7,
390
5
,306
1,
178,
748
13
,765
10
,618
9
87
26,
793
2
,014
,201
14
4,76
5
23,
835
16
8,60
0
2,18
2,80
1
Addi
tions
/ tra
nsfe
rs
-
-
-
-
-
31,2
17
759
-
8
,747
2
2,43
6
63,1
59
6,3
17
15,8
64
22,1
81
85,
340
Di
spos
als /
tran
sfer
(at N
BV)
16.1.1
-
-
-
-
-
(6
,827
) -
-
(6
2)
(16,
489)
(2
3,37
8)
(28,
819)
(4
28)
(29,
247)
(5
2,62
5)
Tran
sfer
to in
vest
men
t pro
perti
es
(5
8,49
7)
-
-
-
-
-
-
-
-
-
(58,
497)
-
-
-
(5
8,49
7)
Depr
ecia
tion
char
ge
16.1.2
-
(1
,685
) (2
6,69
5)
(1,4
44)
(900
) (1
36,4
64)
(6,3
44)
(1,70
4)
(1,6
82)
(8,4
64)
(185
,382
) (2
0,13
0)
(9,8
01)
(29,
931)
(215
,313
)
Bala
nce
as a
t 30
June
202
1 (NB
V)
2
49,2
26
34,
255
4
00,2
36
5,9
46
4,4
06
1,06
6,67
4
8,18
0
8,9
14
7,99
0
24,
276
1,
810,
103
10
2,133
2
9,47
0
131,6
03
1,94
1,706
Gros
s car
ryin
g va
lue
as a
t 30
June
202
1
Cost
16
.2
249
,226
4
3,06
6
663
,289
9
6,54
5
27,4
81
2,77
0,41
7
74,9
12
32,1
00
67,2
31
75,
546
4
,099
,813
17
4,77
6
73,
037
2
47,8
13
4,3
47,6
26
Ac
cum
ulat
ed d
epre
ciat
ion
-
(8,8
11)
(263
,053
) (9
0,59
9)
(23,
075)
(1,
703,
743)
(6
6,73
2)
(23,1
86)
(59,
241)
(51,2
70)
(2,2
89,71
0)
(72,
643)
(4
3,56
7)
(116
,210
) (2,
405,
920)
Ne
t boo
k va
lue
2
49,2
26
34,
255
4
00,2
36
5,9
46
4,4
06
1,06
6,67
4
8,18
0
8,9
14
7,99
0
24,
276
1,
810,
103
10
2,133
2
9,47
0
131,6
03
1,94
1,706
Ne
t boo
k va
lue
as a
t 30
June
202
0
Bala
nce
as a
t 1 J
uly
2019
(NBV
)
307
,723
3
7,626
4
37,5
87
24,
871
6,2
25
1,31
6,59
5
20,
503
12
,336
2
,630
3
3,91
6
2,2
00,0
12
168,
850
3
5,30
6
204
,156
2
,404
,168
Ad
ditio
ns /
trans
fers
-
-
-
-
-
1,83
2
848
-
378
3
,587
6
,645
-
-
-
6,6
45
Di
spos
als (
at N
BV)
-
-
-
-
-
-
-
-
(8)
(1,4
52)
(1,4
60)
(2,3
77)
(375
) (2
,752)
(4
,212
)
Depr
ecia
tion
char
ge
-
(1
,686
) (1
0,65
6)
(17,4
81)
(919
) (1
39,6
79)
(7,5
86)
(1,71
8)
(2,0
13)
(9,2
58)
(190
,996
) (2
1,708
) (1
1,096
) (3
2,80
4)
(223
,800
)
Bala
nce
as a
t 30
June
202
0 (N
BV)
3
07,72
3
35,
940
4
26,9
31
7,39
0
5,3
06
1,17
8,74
8
13,76
5
10,6
18
987
2
6,79
3
2,0
14,2
01
144,
765
2
3,83
5
168,
600
2
,182,
801
Gr
oss c
arry
ing
valu
e as
at 3
0 Ju
ne 2
020
Co
st
16.2
3
07,72
3
43,
066
6
63,2
89
96,
545
2
7,481
2
,808
,564
74
,153
3
2,100
5
8,54
6
69,
599
4
,181,0
66
214
,605
5
8,98
3
273
,588
4
,454
,654
Accu
mul
ated
dep
reci
atio
n
- (7
,126)
(2
36,3
58)
(89,
155)
(2
2,175
) (1
,629
,816
) (6
0,38
8)
(21,4
82)
(57,5
59)
(42,
806)
(2
,166,
865)
(6
9,84
0)
(35,1
48)
(104
,988
) (
2,27
1,853
)
Net b
ook
valu
e
307
,723
3
5,94
0
426
,931
7,
390
5
,306
1,
178,
748
13
,765
10
,618
9
87
26,
793
2
,014
,201
14
4,76
5
23,
835
16
8,60
0
2,18
2,80
1
De
prec
iatio
n ra
tes (
% p
er a
nnum
)
-
1 - 5
5
- 10
5 - 1
0 10
5
- 20
5 - 2
0 10
33
.33
20
10
20
*
Net
bo
ok
valu
e o
f p
lan
t an
d m
ach
iner
y (o
wn
ed)
incl
ud
es a
n a
gg
reg
ate
amo
un
t o
f R
s. 0
.39
8 m
illio
n (
2020
: Rs.
0.5
82
mill
ion
) re
pre
sen
tin
g n
et
bo
ok
valu
e o
f ca
pit
aliz
ed s
par
es.
16.1.
1 D
uri
ng
th
e ye
ar, a
sset
s h
avin
g n
et b
oo
k va
lue
Rs.
29
.24
7 m
illio
n (
2020
: Rs.
2.7
53 m
illio
n)
wer
e tr
ansf
erre
d f
rom
leas
e as
sets
to
ow
n a
sset
s d
ue
to
mat
uri
ty o
f le
ase
term
.
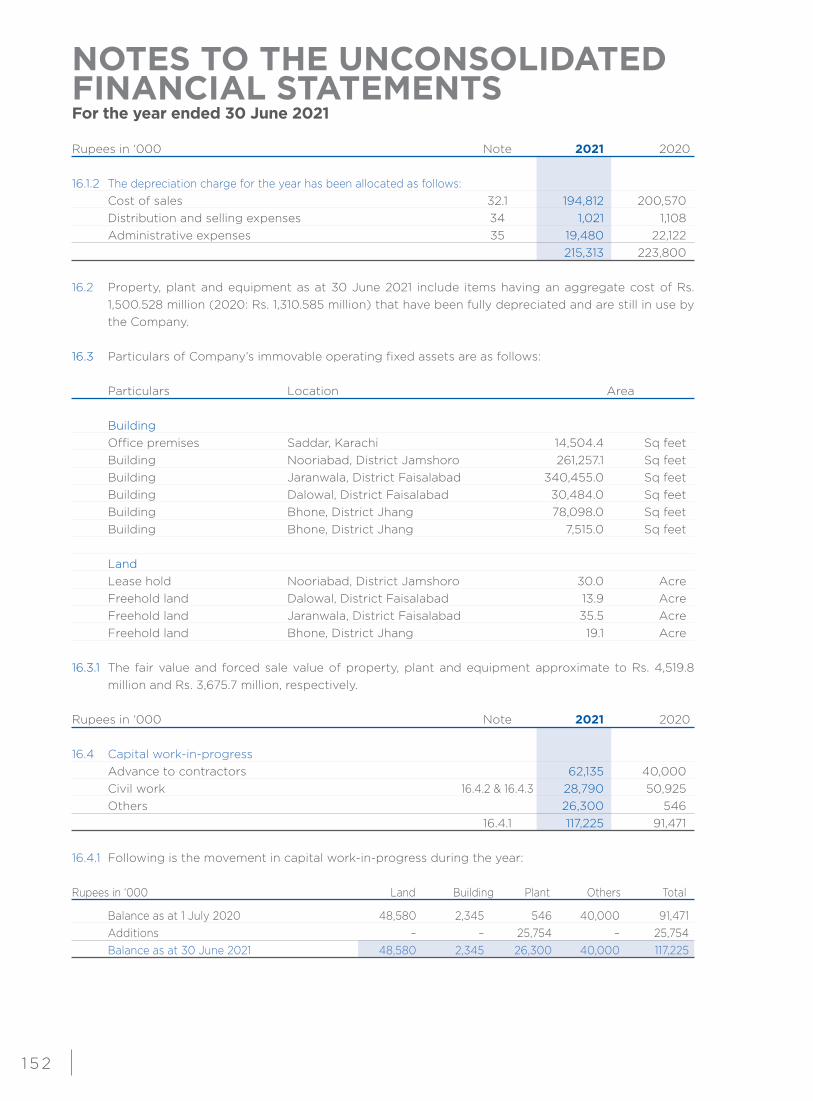
NOTES TO THE UNCONSOLIDATED FINANCIAL STATEMENTSFor the year ended 30 June 2021
1 52
Rupees in ‘000 Note 2021 2020
16.1.2 The depreciation charge for the year has been allocated as follows: Cost of sales 32.1 194,812 200,570 Distribution and selling expenses 34 1,021 1,108 Administrative expenses 35 19,480 22,122 215,313 223,800
16.2 Property, plant and equipment as at 30 June 2021 include items having an aggregate cost of Rs. 1,500.528 million (2020: Rs. 1,310.585 million) that have been fully depreciated and are still in use by the Company.
16.3 Particulars of Company’s immovable operating fixed assets are as follows: Particulars Location Area Building Office premises Saddar, Karachi 14,504.4 Sq feet Building Nooriabad, District Jamshoro 261,257.1 Sq feet Building Jaranwala, District Faisalabad 340,455.0 Sq feet Building Dalowal, District Faisalabad 30,484.0 Sq feet Building Bhone, District Jhang 78,098.0 Sq feet Building Bhone, District Jhang 7,515.0 Sq feet Land Lease hold Nooriabad, District Jamshoro 30.0 Acre Freehold land Dalowal, District Faisalabad 13.9 Acre Freehold land Jaranwala, District Faisalabad 35.5 Acre Freehold land Bhone, District Jhang 19.1 Acre 16.3.1 The fair value and forced sale value of property, plant and equipment approximate to Rs. 4,519.8
million and Rs. 3,675.7 million, respectively.
Rupees in ‘000 Note 2021 2020
16.4 Capital work-in-progress Advance to contractors 62,135 40,000 Civil work 16.4.2 & 16.4.3 28,790 50,925 Others 26,300 546 16.4.1 117,225 91,471 16.4.1 Following is the movement in capital work-in-progress during the year:
Rupees in ‘000 Land Building Plant Others Total
Balance as at 1 July 2020 48,580 2,345 546 40,000 91,471 Additions – – 25,754 – 25,754 Balance as at 30 June 2021 48,580 2,345 26,300 40,000 117,225
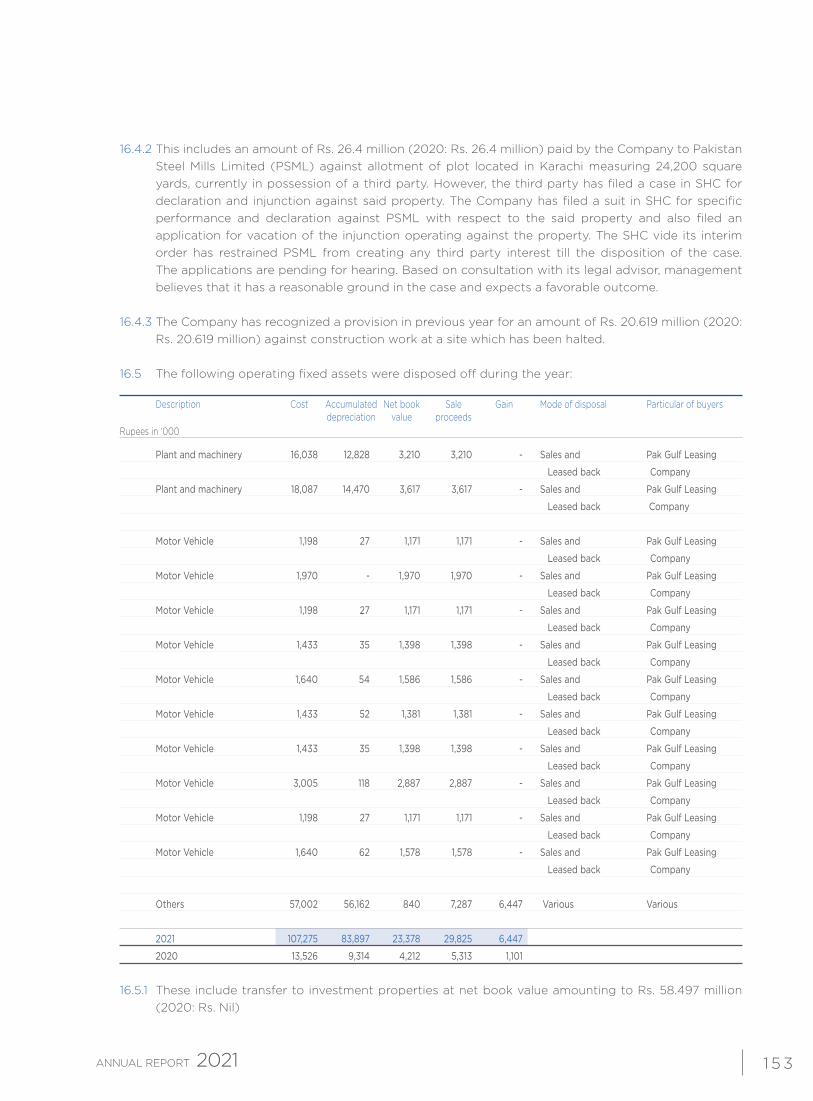
1 5 3
16.4.2 This includes an amount of Rs. 26.4 million (2020: Rs. 26.4 million) paid by the Company to Pakistan Steel Mills Limited (PSML) against allotment of plot located in Karachi measuring 24,200 square yards, currently in possession of a third party. However, the third party has filed a case in SHC for declaration and injunction against said property. The Company has filed a suit in SHC for specific performance and declaration against PSML with respect to the said property and also filed an application for vacation of the injunction operating against the property. The SHC vide its interim order has restrained PSML from creating any third party interest till the disposition of the case. The applications are pending for hearing. Based on consultation with its legal advisor, management believes that it has a reasonable ground in the case and expects a favorable outcome.
16.4.3 The Company has recognized a provision in previous year for an amount of Rs. 20.619 million (2020: Rs. 20.619 million) against construction work at a site which has been halted.
16.5 The following operating fixed assets were disposed off during the year:
Description Cost Accumulated Net book Sale Gain Mode of disposal Particular of buyers depreciation value proceedsRupees in ‘000
Plant and machinery 16,038 12,828 3,210 3,210 - Sales and Pak Gulf Leasing
Leased back Company
Plant and machinery 18,087 14,470 3,617 3,617 - Sales and Pak Gulf Leasing
Leased back Company
Motor Vehicle 1,198 27 1,171 1,171 - Sales and Pak Gulf Leasing
Leased back Company
Motor Vehicle 1,970 - 1,970 1,970 - Sales and Pak Gulf Leasing
Leased back Company
Motor Vehicle 1,198 27 1,171 1,171 - Sales and Pak Gulf Leasing
Leased back Company
Motor Vehicle 1,433 35 1,398 1,398 - Sales and Pak Gulf Leasing
Leased back Company
Motor Vehicle 1,640 54 1,586 1,586 - Sales and Pak Gulf Leasing
Leased back Company
Motor Vehicle 1,433 52 1,381 1,381 - Sales and Pak Gulf Leasing
Leased back Company
Motor Vehicle 1,433 35 1,398 1,398 - Sales and Pak Gulf Leasing
Leased back Company
Motor Vehicle 3,005 118 2,887 2,887 - Sales and Pak Gulf Leasing
Leased back Company
Motor Vehicle 1,198 27 1,171 1,171 - Sales and Pak Gulf Leasing
Leased back Company
Motor Vehicle 1,640 62 1,578 1,578 - Sales and Pak Gulf Leasing
Leased back Company
Others 57,002 56,162 840 7,287 6,447 Various Various
2021 107,275 83,897 23,378 29,825 6,447
2020 13,526 9,314 4,212 5,313 1,101 16.5.1 These include transfer to investment properties at net book value amounting to Rs. 58.497 million
(2020: Rs. Nil)
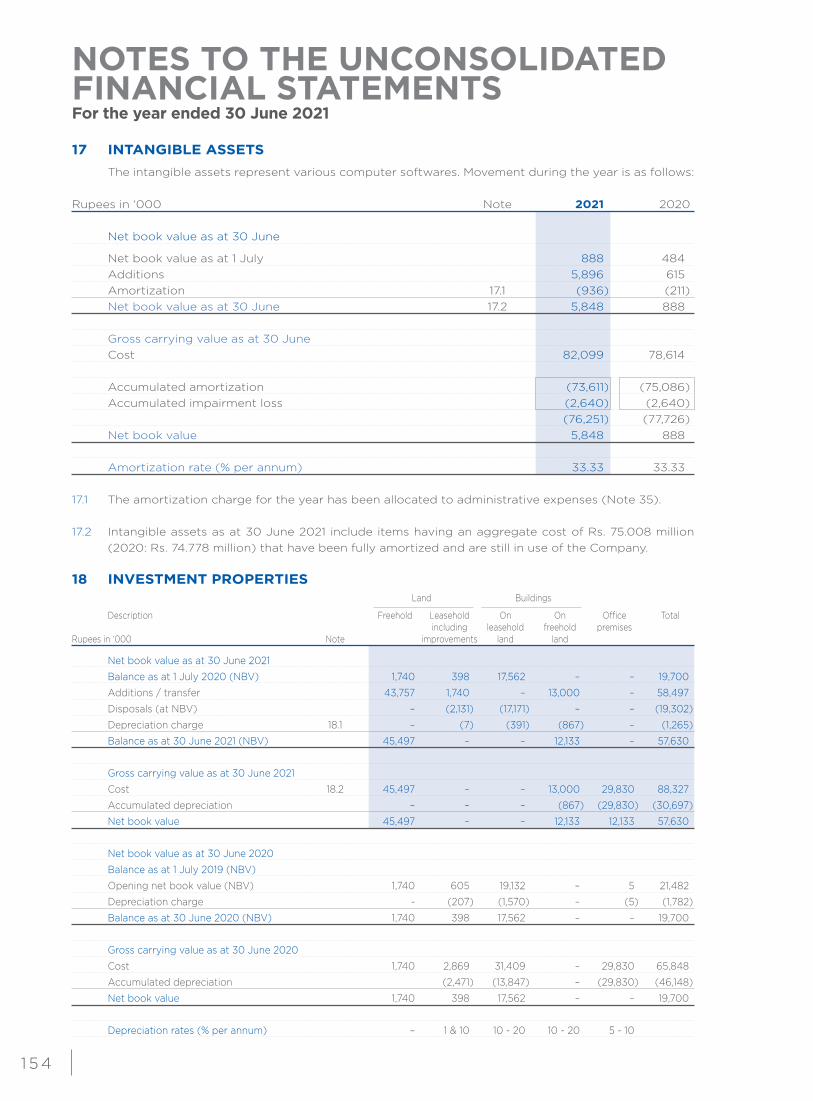
NOTES TO THE UNCONSOLIDATED FINANCIAL STATEMENTSFor the year ended 30 June 2021
1 5 4
17 INTANGIBLE ASSETS The intangible assets represent various computer softwares. Movement during the year is as follows:
Rupees in ‘000 Note 2021 2020 Net book value as at 30 June
Net book value as at 1 July 888 484 Additions 5,896 615 Amortization 17.1 (936) (211) Net book value as at 30 June 17.2 5,848 888 Gross carrying value as at 30 June Cost 82,099 78,614 Accumulated amortization (73,611) (75,086) Accumulated impairment loss (2,640) (2,640) (76,251) (77,726) Net book value 5,848 888 Amortization rate (% per annum) 33.33 33.33 17.1 The amortization charge for the year has been allocated to administrative expenses (Note 35). 17.2 Intangible assets as at 30 June 2021 include items having an aggregate cost of Rs. 75.008 million
(2020: Rs. 74.778 million) that have been fully amortized and are still in use of the Company. 18 INVESTMENT PROPERTIES
Land Buildings
Description Freehold Leasehold On On Office Total including leasehold freehold premisesRupees in ‘000 Note improvements land land
Net book value as at 30 June 2021
Balance as at 1 July 2020 (NBV) 1,740 398 17,562 – – 19,700
Additions / transfer 43,757 1,740 – 13,000 – 58,497
Disposals (at NBV) – (2,131) (17,171) – – (19,302)
Depreciation charge 18.1 – (7) (391) (867) – (1,265)
Balance as at 30 June 2021 (NBV) 45,497 – – 12,133 – 57,630
Gross carrying value as at 30 June 2021
Cost 18.2 45,497 – – 13,000 29,830 88,327
Accumulated depreciation – – – (867) (29,830) (30,697)
Net book value 45,497 – – 12,133 12,133 57,630
Net book value as at 30 June 2020
Balance as at 1 July 2019 (NBV)
Opening net book value (NBV) 1,740 605 19,132 – 5 21,482
Depreciation charge - (207) (1,570) – (5) (1,782)
Balance as at 30 June 2020 (NBV) 1,740 398 17,562 – – 19,700
Gross carrying value as at 30 June 2020
Cost 1,740 2,869 31,409 – 29,830 65,848
Accumulated depreciation (2,471) (13,847) – (29,830) (46,148)
Net book value 1,740 398 17,562 – – 19,700
Depreciation rates (% per annum) – 1 & 10 10 - 20 10 - 20 5 - 10
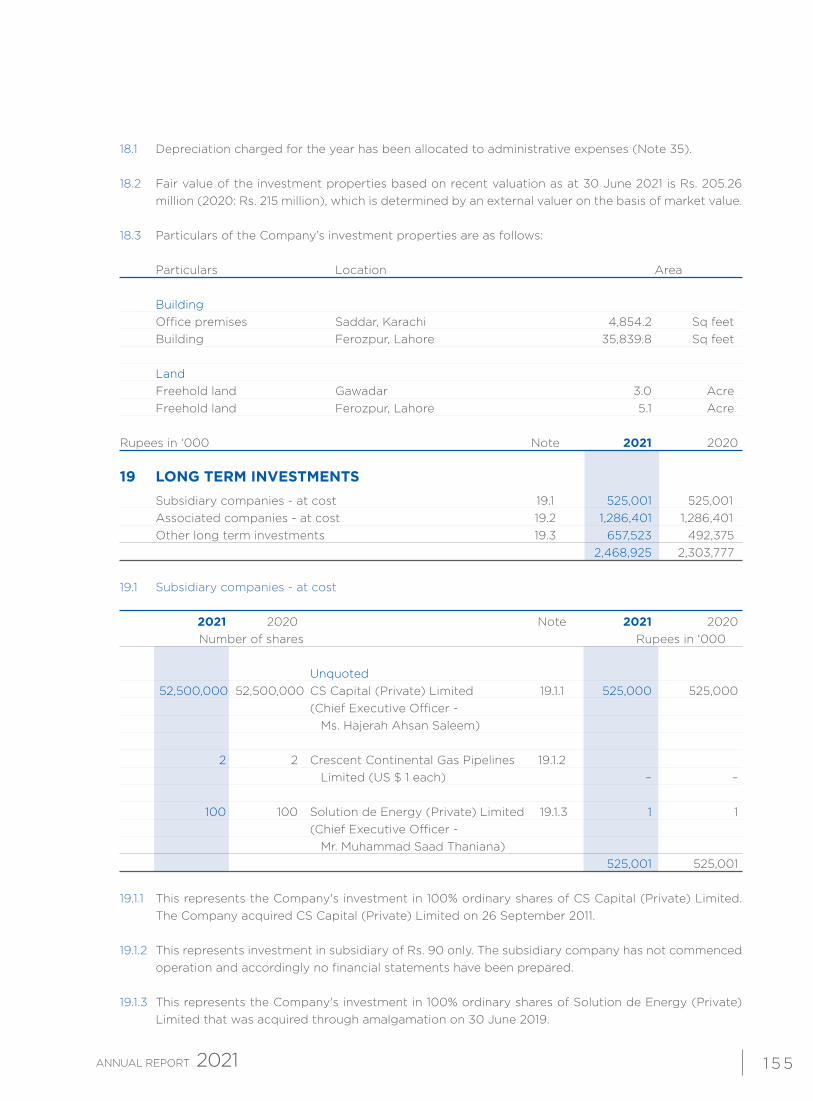
1 5 5
18.1 Depreciation charged for the year has been allocated to administrative expenses (Note 35). 18.2 Fair value of the investment properties based on recent valuation as at 30 June 2021 is Rs. 205.26
million (2020: Rs. 215 million), which is determined by an external valuer on the basis of market value. 18.3 Particulars of the Company’s investment properties are as follows:
Particulars Location Area Building Office premises Saddar, Karachi 4,854.2 Sq feet Building Ferozpur, Lahore 35,839.8 Sq feet Land Freehold land Gawadar 3.0 Acre Freehold land Ferozpur, Lahore 5.1 Acre
Rupees in ‘000 Note 2021 2020
19 LONG TERM INVESTMENTS Subsidiary companies - at cost 19.1 525,001 525,001 Associated companies - at cost 19.2 1,286,401 1,286,401 Other long term investments 19.3 657,523 492,375 2,468,925 2,303,777 19.1 Subsidiary companies - at cost 2021 2020 Note 2021 2020 Number of shares Rupees in ‘000 Unquoted 52,500,000 52,500,000 CS Capital (Private) Limited 19.1.1 525,000 525,000 (Chief Executive Officer - Ms. Hajerah Ahsan Saleem) 2 2 Crescent Continental Gas Pipelines 19.1.2 Limited (US $ 1 each) – – 100 100 Solution de Energy (Private) Limited 19.1.3 1 1 (Chief Executive Officer - Mr. Muhammad Saad Thaniana) 525,001 525,001 19.1.1 This represents the Company's investment in 100% ordinary shares of CS Capital (Private) Limited.
The Company acquired CS Capital (Private) Limited on 26 September 2011. 19.1.2 This represents investment in subsidiary of Rs. 90 only. The subsidiary company has not commenced
operation and accordingly no financial statements have been prepared. 19.1.3 This represents the Company's investment in 100% ordinary shares of Solution de Energy (Private)
Limited that was acquired through amalgamation on 30 June 2019.
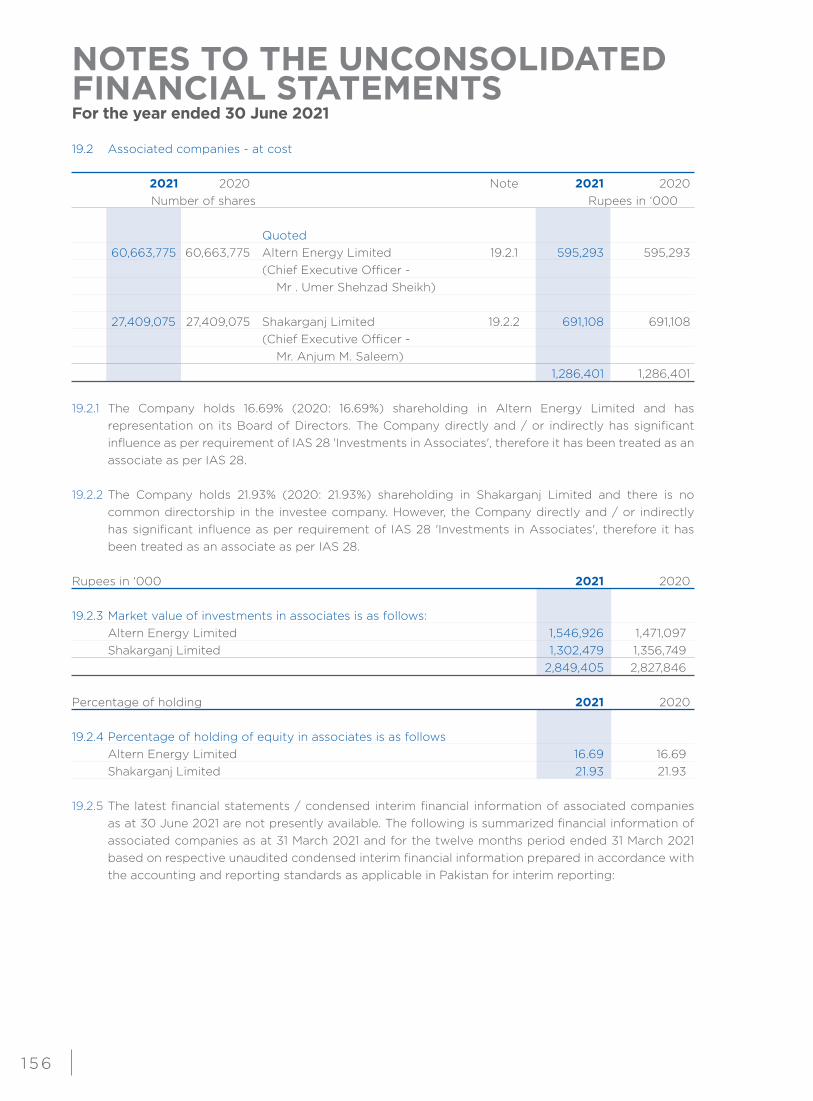
NOTES TO THE UNCONSOLIDATED FINANCIAL STATEMENTSFor the year ended 30 June 2021
1 5 6
19.2 Associated companies - at cost 2021 2020 Note 2021 2020 Number of shares Rupees in ‘000 Quoted 60,663,775 60,663,775 Altern Energy Limited 19.2.1 595,293 595,293 (Chief Executive Officer - Mr . Umer Shehzad Sheikh) 27,409,075 27,409,075 Shakarganj Limited 19.2.2 691,108 691,108 (Chief Executive Officer - Mr. Anjum M. Saleem) 1,286,401 1,286,401 19.2.1 The Company holds 16.69% (2020: 16.69%) shareholding in Altern Energy Limited and has
representation on its Board of Directors. The Company directly and / or indirectly has significant influence as per requirement of IAS 28 'Investments in Associates', therefore it has been treated as an associate as per IAS 28.
19.2.2 The Company holds 21.93% (2020: 21.93%) shareholding in Shakarganj Limited and there is no common directorship in the investee company. However, the Company directly and / or indirectly has significant influence as per requirement of IAS 28 'Investments in Associates', therefore it has been treated as an associate as per IAS 28.
Rupees in ‘000 2021 2020
19.2.3 Market value of investments in associates is as follows: Altern Energy Limited 1,546,926 1,471,097 Shakarganj Limited 1,302,479 1,356,749 2,849,405 2,827,846
Percentage of holding 2021 2020 19.2.4 Percentage of holding of equity in associates is as follows Altern Energy Limited 16.69 16.69 Shakarganj Limited 21.93 21.93 19.2.5 The latest financial statements / condensed interim financial information of associated companies
as at 30 June 2021 are not presently available. The following is summarized financial information of associated companies as at 31 March 2021 and for the twelve months period ended 31 March 2021 based on respective unaudited condensed interim financial information prepared in accordance with the accounting and reporting standards as applicable in Pakistan for interim reporting:
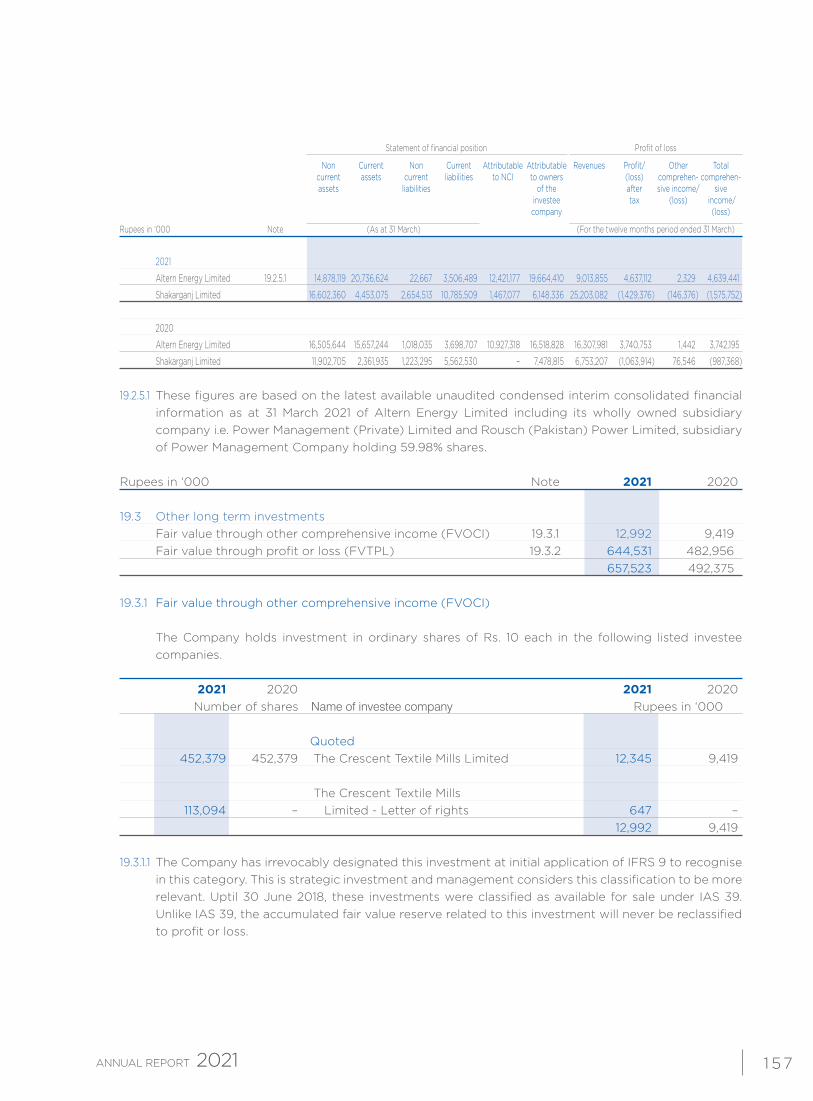
1 57
Statement of financial position Profit of loss
Non Current Non Current Attributable Attributable Revenues Profit/ Other Total current assets current liabilities to NCI to owners (loss) comprehen- comprehen- assets liabilities of the after sive income/ sive investee tax (loss) income/ company (loss)
Rupees in ‘000 Note (As at 31 March) (For the twelve months period ended 31 March)
2021
Altern Energy Limited 19.2.5.1 14,878,119 20,736,624 22,667 3,506,489 12,421,177 19,664,410 9,013,855 4,637,112 2,329 4,639,441
Shakarganj Limited 16,602,360 4,453,075 2,654,513 10,785,509 1,467,077 6,148,336 25,203,082 (1,429,376) (146,376) (1,575,752)
2020
Altern Energy Limited 16,505,644 15,657,244 1,018,035 3,698,707 10,927,318 16,518,828 16,307,981 3,740,753 1,442 3,742,195
Shakarganj Limited 11,902,705 2,361,935 1,223,295 5,562,530 – 7,478,815 6,753,207 (1,063,914) 76,546 (987,368)
19.2.5.1 These figures are based on the latest available unaudited condensed interim consolidated financial information as at 31 March 2021 of Altern Energy Limited including its wholly owned subsidiary company i.e. Power Management (Private) Limited and Rousch (Pakistan) Power Limited, subsidiary of Power Management Company holding 59.98% shares.
Rupees in ‘000 Note 2021 2020 19.3 Other long term investments Fair value through other comprehensive income (FVOCI) 19.3.1 12,992 9,419 Fair value through profit or loss (FVTPL) 19.3.2 644,531 482,956 657,523 492,375 19.3.1 Fair value through other comprehensive income (FVOCI) The Company holds investment in ordinary shares of Rs. 10 each in the following listed investee
companies. 2021 2020 2021 2020 Number of shares Name of investee company Rupees in ‘000 Quoted 452,379 452,379 The Crescent Textile Mills Limited 12,345 9,419 The Crescent Textile Mills 113,094 – Limited - Letter of rights 647 – 12,992 9,419 19.3.1.1 The Company has irrevocably designated this investment at initial application of IFRS 9 to recognise
in this category. This is strategic investment and management considers this classification to be more relevant. Uptil 30 June 2018, these investments were classified as available for sale under IAS 39. Unlike IAS 39, the accumulated fair value reserve related to this investment will never be reclassified to profit or loss.
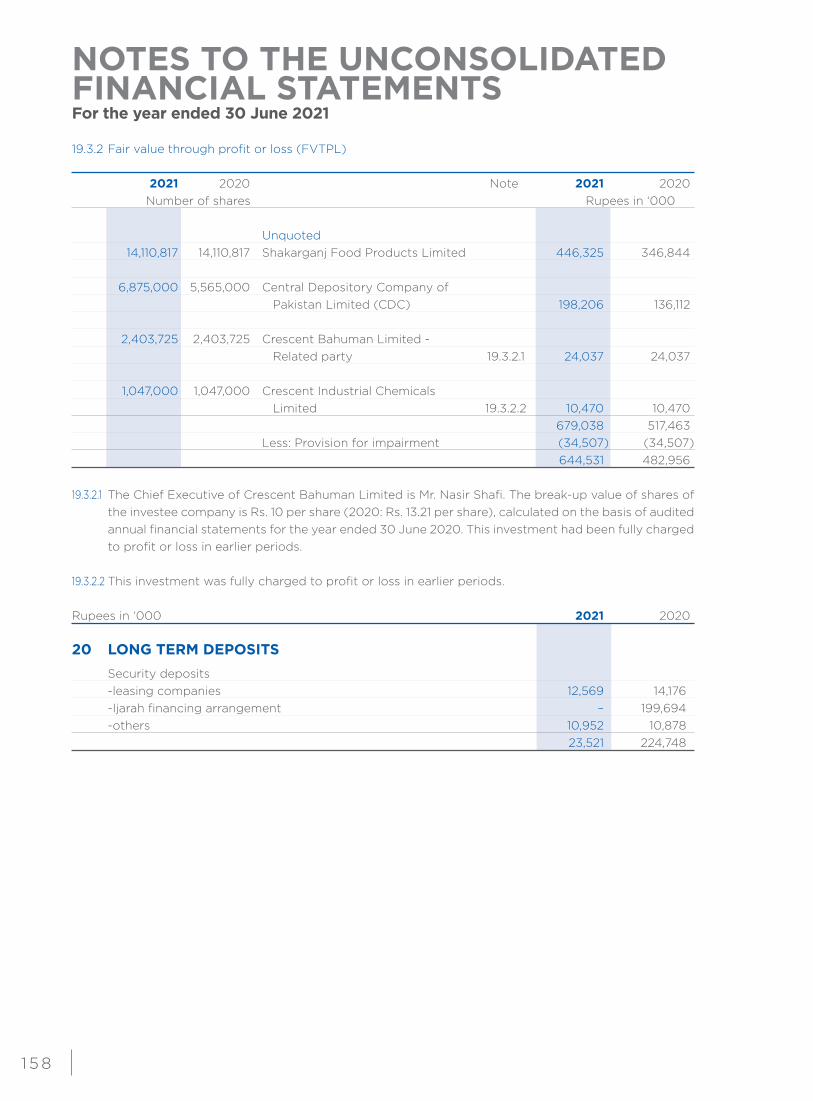
NOTES TO THE UNCONSOLIDATED FINANCIAL STATEMENTSFor the year ended 30 June 2021
1 5 8
19.3.2 Fair value through profit or loss (FVTPL) 2021 2020 Note 2021 2020 Number of shares Rupees in ‘000 Unquoted 14,110,817 14,110,817 Shakarganj Food Products Limited 446,325 346,844
6,875,000 5,565,000 Central Depository Company of Pakistan Limited (CDC) 198,206 136,112 2,403,725 2,403,725 Crescent Bahuman Limited - Related party 19.3.2.1 24,037 24,037 1,047,000 1,047,000 Crescent Industrial Chemicals Limited 19.3.2.2 10,470 10,470 679,038 517,463 Less: Provision for impairment (34,507) (34,507) 644,531 482,956 19.3.2.1 The Chief Executive of Crescent Bahuman Limited is Mr. Nasir Shafi. The break-up value of shares of
the investee company is Rs. 10 per share (2020: Rs. 13.21 per share), calculated on the basis of audited annual financial statements for the year ended 30 June 2020. This investment had been fully charged to profit or loss in earlier periods.
19.3.2.2 This investment was fully charged to profit or loss in earlier periods.
Rupees in ‘000 2021 2020
20 LONG TERM DEPOSITS Security deposits -leasing companies 12,569 14,176 -Ijarah financing arrangement – 199,694 -others 10,952 10,878 23,521 224,748
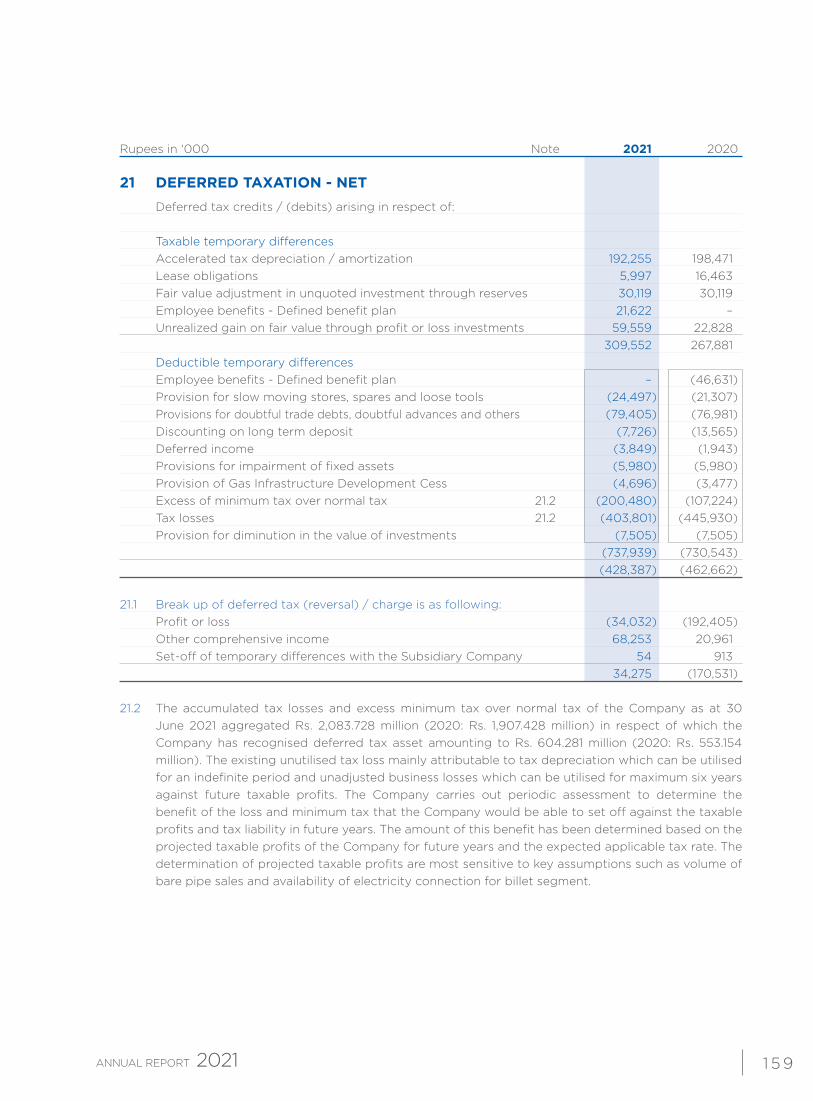
1 5 9
Rupees in ‘000 Note 2021 2020
21 DEFERRED TAXATION - NET Deferred tax credits / (debits) arising in respect of: Taxable temporary differences Accelerated tax depreciation / amortization 192,255 198,471 Lease obligations 5,997 16,463 Fair value adjustment in unquoted investment through reserves 30,119 30,119 Employee benefits - Defined benefit plan 21,622 – Unrealized gain on fair value through profit or loss investments 59,559 22,828 309,552 267,881 Deductible temporary differences Employee benefits - Defined benefit plan – (46,631) Provision for slow moving stores, spares and loose tools (24,497) (21,307) Provisions for doubtful trade debts, doubtful advances and others (79,405) (76,981) Discounting on long term deposit (7,726) (13,565) Deferred income (3,849) (1,943) Provisions for impairment of fixed assets (5,980) (5,980) Provision of Gas Infrastructure Development Cess (4,696) (3,477) Excess of minimum tax over normal tax 21.2 (200,480) (107,224) Tax losses 21.2 (403,801) (445,930) Provision for diminution in the value of investments (7,505) (7,505) (737,939) (730,543) (428,387) (462,662) 21.1 Break up of deferred tax (reversal) / charge is as following: Profit or loss (34,032) (192,405) Other comprehensive income 68,253 20,961 Set-off of temporary differences with the Subsidiary Company 54 913 34,275 (170,531) 21.2 The accumulated tax losses and excess minimum tax over normal tax of the Company as at 30
June 2021 aggregated Rs. 2,083.728 million (2020: Rs. 1,907.428 million) in respect of which the Company has recognised deferred tax asset amounting to Rs. 604.281 million (2020: Rs. 553.154 million). The existing unutilised tax loss mainly attributable to tax depreciation which can be utilised for an indefinite period and unadjusted business losses which can be utilised for maximum six years against future taxable profits. The Company carries out periodic assessment to determine the benefit of the loss and minimum tax that the Company would be able to set off against the taxable profits and tax liability in future years. The amount of this benefit has been determined based on the projected taxable profits of the Company for future years and the expected applicable tax rate. The determination of projected taxable profits are most sensitive to key assumptions such as volume of bare pipe sales and availability of electricity connection for billet segment.
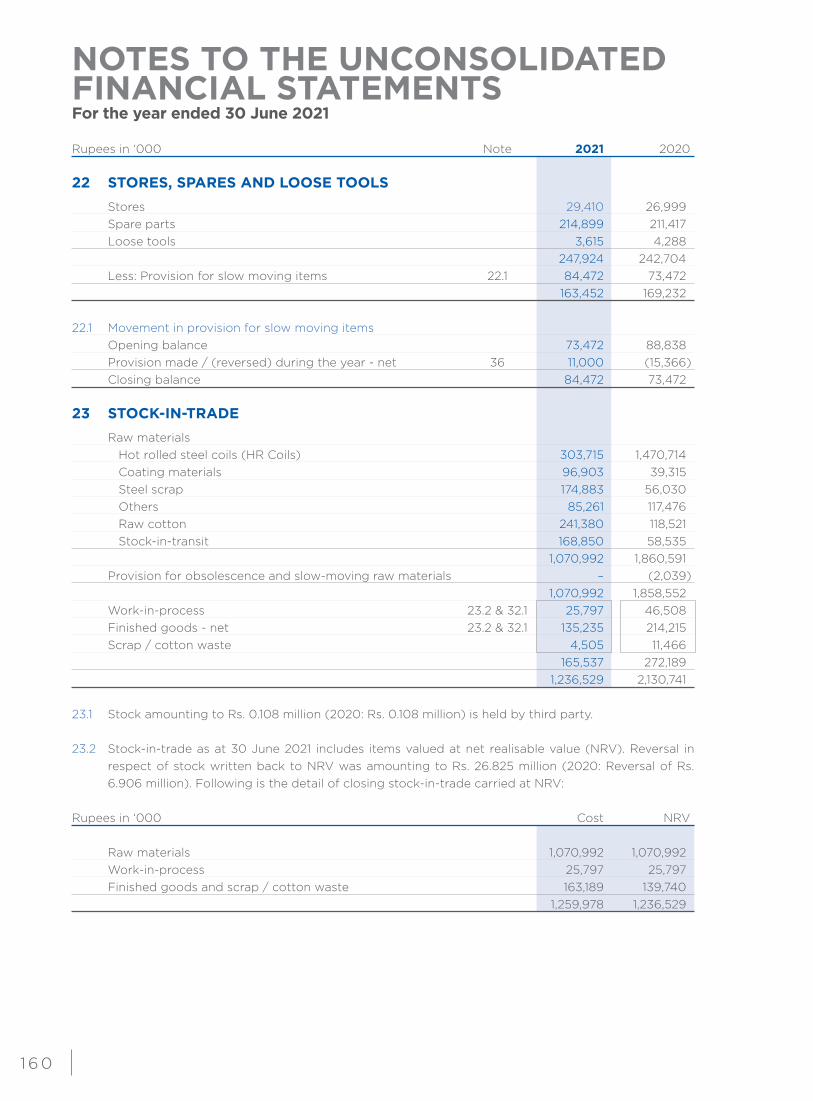
NOTES TO THE UNCONSOLIDATED FINANCIAL STATEMENTSFor the year ended 30 June 2021
1 6 0
Rupees in ‘000 Note 2021 2020 22 STORES, SPARES AND LOOSE TOOLS
Stores 29,410 26,999 Spare parts 214,899 211,417 Loose tools 3,615 4,288 247,924 242,704 Less: Provision for slow moving items 22.1 84,472 73,472 163,452 169,232 22.1 Movement in provision for slow moving items Opening balance 73,472 88,838 Provision made / (reversed) during the year - net 36 11,000 (15,366) Closing balance 84,472 73,472 23 STOCK-IN-TRADE
Raw materials Hot rolled steel coils (HR Coils) 303,715 1,470,714 Coating materials 96,903 39,315 Steel scrap 174,883 56,030 Others 85,261 117,476 Raw cotton 241,380 118,521 Stock-in-transit 168,850 58,535 1,070,992 1,860,591 Provision for obsolescence and slow-moving raw materials – (2,039) 1,070,992 1,858,552 Work-in-process 23.2 & 32.1 25,797 46,508 Finished goods - net 23.2 & 32.1 135,235 214,215 Scrap / cotton waste 4,505 11,466 165,537 272,189 1,236,529 2,130,741 23.1 Stock amounting to Rs. 0.108 million (2020: Rs. 0.108 million) is held by third party. 23.2 Stock-in-trade as at 30 June 2021 includes items valued at net realisable value (NRV). Reversal in
respect of stock written back to NRV was amounting to Rs. 26.825 million (2020: Reversal of Rs. 6.906 million). Following is the detail of closing stock-in-trade carried at NRV:
Rupees in ‘000 Cost NRV Raw materials 1,070,992 1,070,992 Work-in-process 25,797 25,797 Finished goods and scrap / cotton waste 163,189 139,740 1,259,978 1,236,529
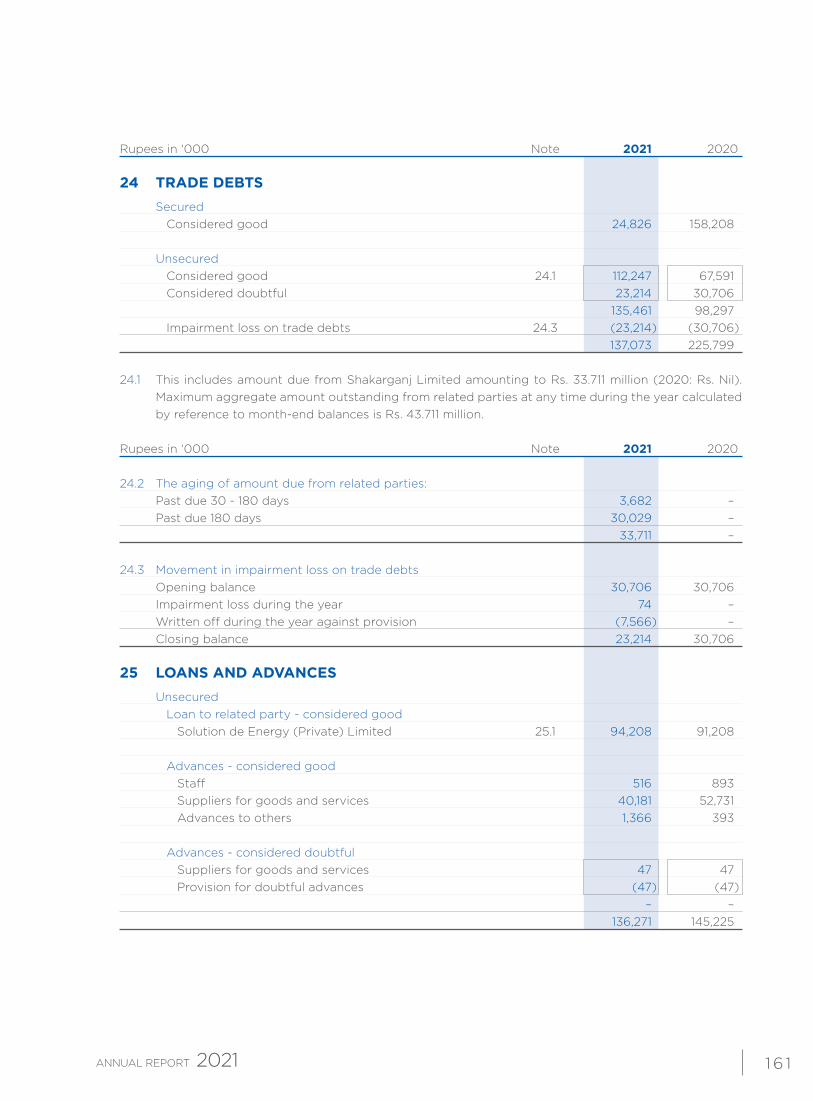
1 6 1
Rupees in ‘000 Note 2021 2020 24 TRADE DEBTS Secured Considered good 24,826 158,208 Unsecured Considered good 24.1 112,247 67,591 Considered doubtful 23,214 30,706 135,461 98,297 Impairment loss on trade debts 24.3 (23,214) (30,706) 137,073 225,799 24.1 This includes amount due from Shakarganj Limited amounting to Rs. 33.711 million (2020: Rs. Nil).
Maximum aggregate amount outstanding from related parties at any time during the year calculated by reference to month-end balances is Rs. 43.711 million.
Rupees in ‘000 Note 2021 2020 24.2 The aging of amount due from related parties: Past due 30 - 180 days 3,682 – Past due 180 days 30,029 – 33,711 – 24.3 Movement in impairment loss on trade debts Opening balance 30,706 30,706 Impairment loss during the year 74 – Written off during the year against provision (7,566) – Closing balance 23,214 30,706 25 LOANS AND ADVANCES
Unsecured Loan to related party - considered good Solution de Energy (Private) Limited 25.1 94,208 91,208
Advances - considered good Staff 516 893 Suppliers for goods and services 40,181 52,731 Advances to others 1,366 393
Advances - considered doubtful Suppliers for goods and services 47 47 Provision for doubtful advances (47) (47) – – 136,271 145,225
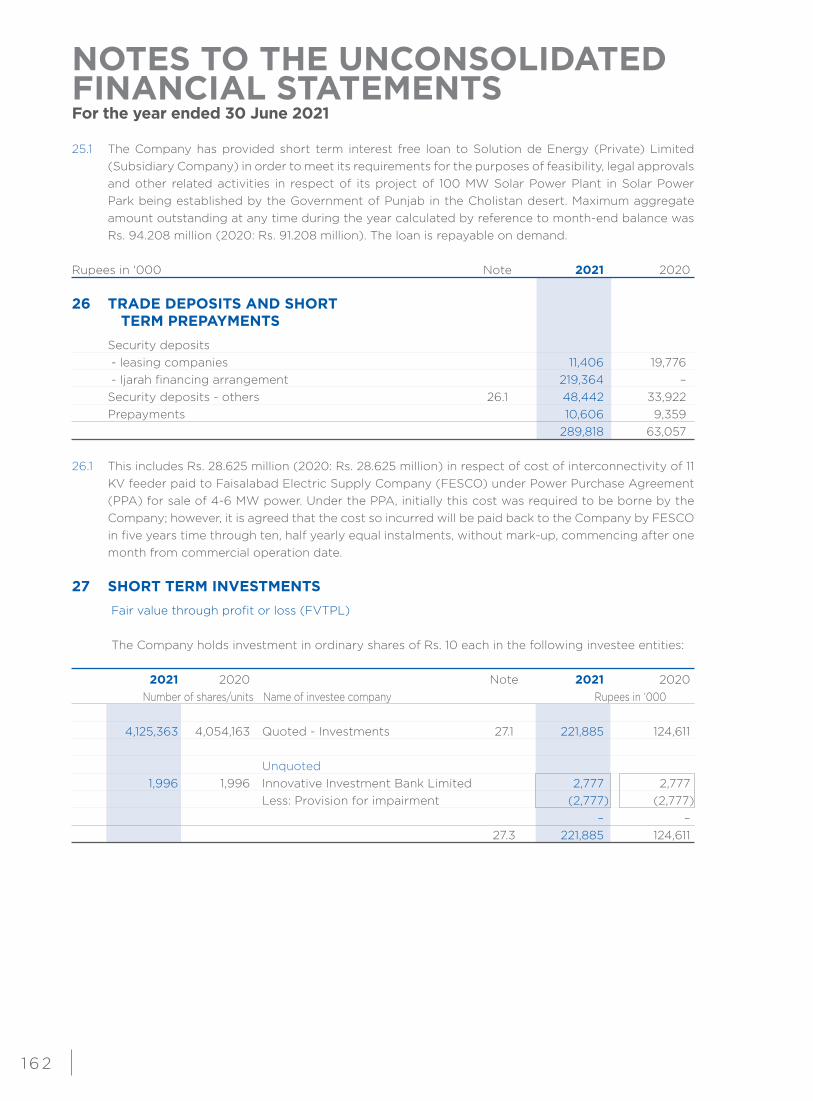
NOTES TO THE UNCONSOLIDATED FINANCIAL STATEMENTSFor the year ended 30 June 2021
1 6 2
25.1 The Company has provided short term interest free loan to Solution de Energy (Private) Limited (Subsidiary Company) in order to meet its requirements for the purposes of feasibility, legal approvals and other related activities in respect of its project of 100 MW Solar Power Plant in Solar Power Park being established by the Government of Punjab in the Cholistan desert. Maximum aggregate amount outstanding at any time during the year calculated by reference to month-end balance was Rs. 94.208 million (2020: Rs. 91.208 million). The loan is repayable on demand.
Rupees in ‘000 Note 2021 2020 26 TRADE DEPOSITS AND SHORT TERM PREPAYMENTS Security deposits - leasing companies 11,406 19,776 - Ijarah financing arrangement 219,364 – Security deposits - others 26.1 48,442 33,922 Prepayments 10,606 9,359 289,818 63,057 26.1 This includes Rs. 28.625 million (2020: Rs. 28.625 million) in respect of cost of interconnectivity of 11
KV feeder paid to Faisalabad Electric Supply Company (FESCO) under Power Purchase Agreement (PPA) for sale of 4-6 MW power. Under the PPA, initially this cost was required to be borne by the Company; however, it is agreed that the cost so incurred will be paid back to the Company by FESCO in five years time through ten, half yearly equal instalments, without mark-up, commencing after one month from commercial operation date.
27 SHORT TERM INVESTMENTS Fair value through profit or loss (FVTPL)
The Company holds investment in ordinary shares of Rs. 10 each in the following investee entities:
2021 2020 Note 2021 2020 Number of shares/units Name of investee company Rupees in ‘000 4,125,363 4,054,163 Quoted - Investments 27.1 221,885 124,611
Unquoted 1,996 1,996 Innovative Investment Bank Limited 2,777 2,777 Less: Provision for impairment (2,777) (2,777) – – 27.3 221,885 124,611
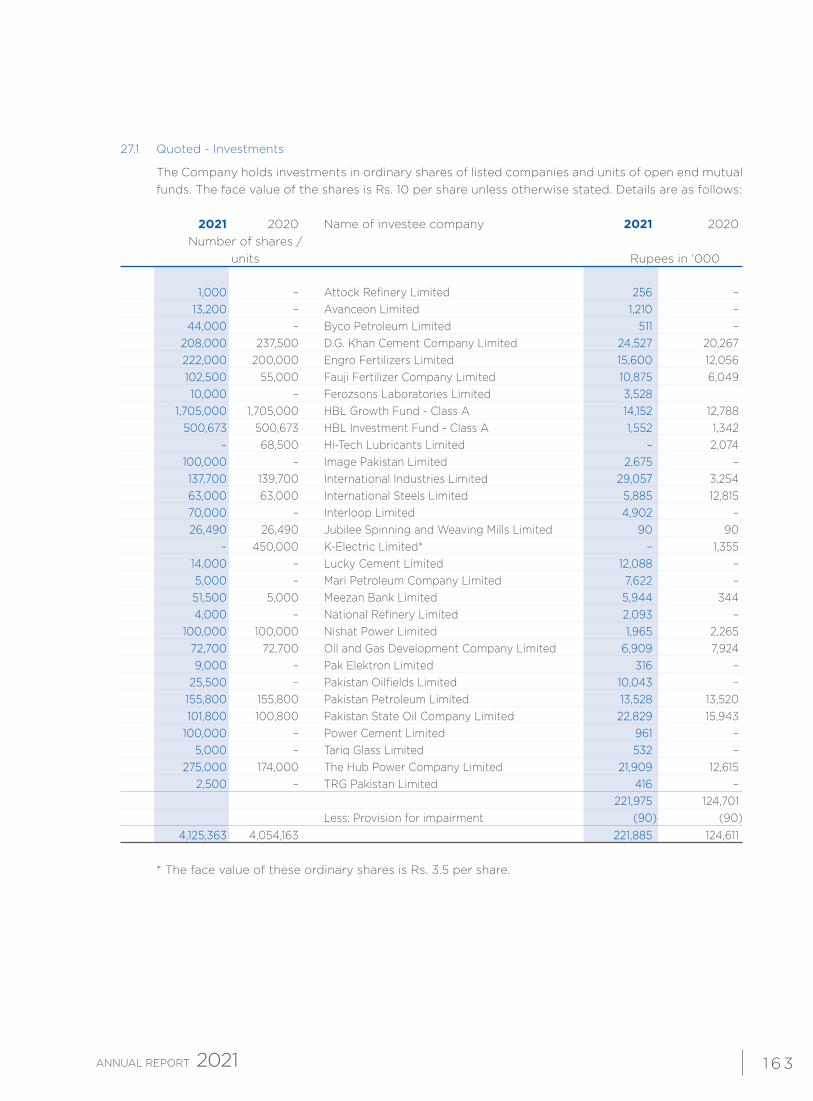
1 6 3
27.1 Quoted - Investments
The Company holds investments in ordinary shares of listed companies and units of open end mutual funds. The face value of the shares is Rs. 10 per share unless otherwise stated. Details are as follows:
2021 2020 Name of investee company 2021 2020 Number of shares / units Rupees in ‘000 1,000 – Attock Refinery Limited 256 – 13,200 – Avanceon Limited 1,210 – 44,000 – Byco Petroleum Limited 511 – 208,000 237,500 D.G. Khan Cement Company Limited 24,527 20,267 222,000 200,000 Engro Fertilizers Limited 15,600 12,056 102,500 55,000 Fauji Fertilizer Company Limited 10,875 6,049 10,000 – Ferozsons Laboratories Limited 3,528 1,705,000 1,705,000 HBL Growth Fund - Class A 14,152 12,788 500,673 500,673 HBL Investment Fund - Class A 1,552 1,342 – 68,500 Hi-Tech Lubricants Limited – 2,074 100,000 – Image Pakistan Limited 2,675 – 137,700 139,700 International Industries Limited 29,057 3,254 63,000 63,000 International Steels Limited 5,885 12,815 70,000 – Interloop Limited 4,902 – 26,490 26,490 Jubilee Spinning and Weaving Mills Limited 90 90 – 450,000 K-Electric Limited* – 1,355 14,000 – Lucky Cement Limited 12,088 – 5,000 – Mari Petroleum Company Limited 7,622 – 51,500 5,000 Meezan Bank Limited 5,944 344 4,000 – National Refinery Limited 2,093 – 100,000 100,000 Nishat Power Limited 1,965 2,265 72,700 72,700 Oil and Gas Development Company Limited 6,909 7,924 9,000 – Pak Elektron Limited 316 – 25,500 – Pakistan Oilfields Limited 10,043 – 155,800 155,800 Pakistan Petroleum Limited 13,528 13,520 101,800 100,800 Pakistan State Oil Company Limited 22,829 15,943 100,000 – Power Cement Limited 961 – 5,000 – Tariq Glass Limited 532 – 275,000 174,000 The Hub Power Company Limited 21,909 12,615 2,500 – TRG Pakistan Limited 416 – 221,975 124,701 Less: Provision for impairment (90) (90) 4,125,363 4,054,163 221,885 124,611 * The face value of these ordinary shares is Rs. 3.5 per share.
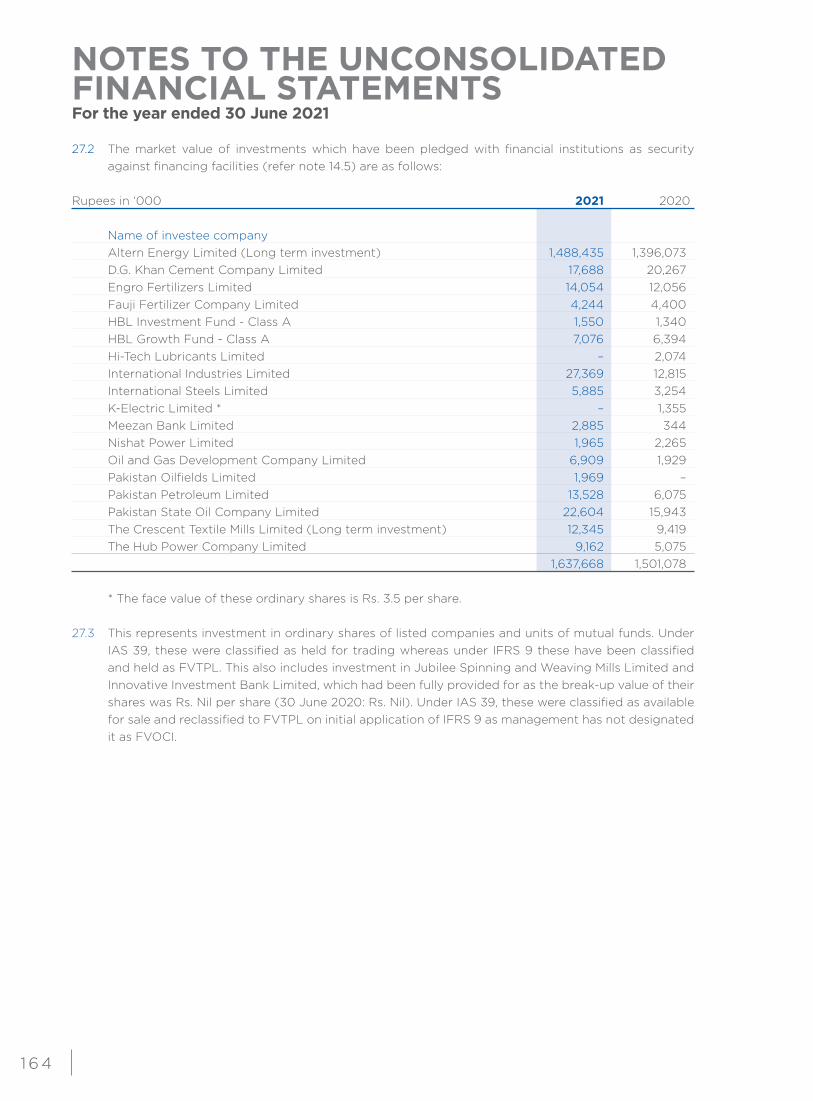
NOTES TO THE UNCONSOLIDATED FINANCIAL STATEMENTSFor the year ended 30 June 2021
1 6 4
27.2 The market value of investments which have been pledged with financial institutions as security against financing facilities (refer note 14.5) are as follows:
Rupees in ‘000 2021 2020 Name of investee company Altern Energy Limited (Long term investment) 1,488,435 1,396,073 D.G. Khan Cement Company Limited 17,688 20,267 Engro Fertilizers Limited 14,054 12,056 Fauji Fertilizer Company Limited 4,244 4,400 HBL Investment Fund - Class A 1,550 1,340 HBL Growth Fund - Class A 7,076 6,394 Hi-Tech Lubricants Limited – 2,074 International Industries Limited 27,369 12,815 International Steels Limited 5,885 3,254 K-Electric Limited * – 1,355 Meezan Bank Limited 2,885 344 Nishat Power Limited 1,965 2,265 Oil and Gas Development Company Limited 6,909 1,929 Pakistan Oilfields Limited 1,969 – Pakistan Petroleum Limited 13,528 6,075 Pakistan State Oil Company Limited 22,604 15,943 The Crescent Textile Mills Limited (Long term investment) 12,345 9,419 The Hub Power Company Limited 9,162 5,075 1,637,668 1,501,078 * The face value of these ordinary shares is Rs. 3.5 per share. 27.3 This represents investment in ordinary shares of listed companies and units of mutual funds. Under
IAS 39, these were classified as held for trading whereas under IFRS 9 these have been classified and held as FVTPL. This also includes investment in Jubilee Spinning and Weaving Mills Limited and Innovative Investment Bank Limited, which had been fully provided for as the break-up value of their shares was Rs. Nil per share (30 June 2020: Rs. Nil). Under IAS 39, these were classified as available for sale and reclassified to FVTPL on initial application of IFRS 9 as management has not designated it as FVOCI.
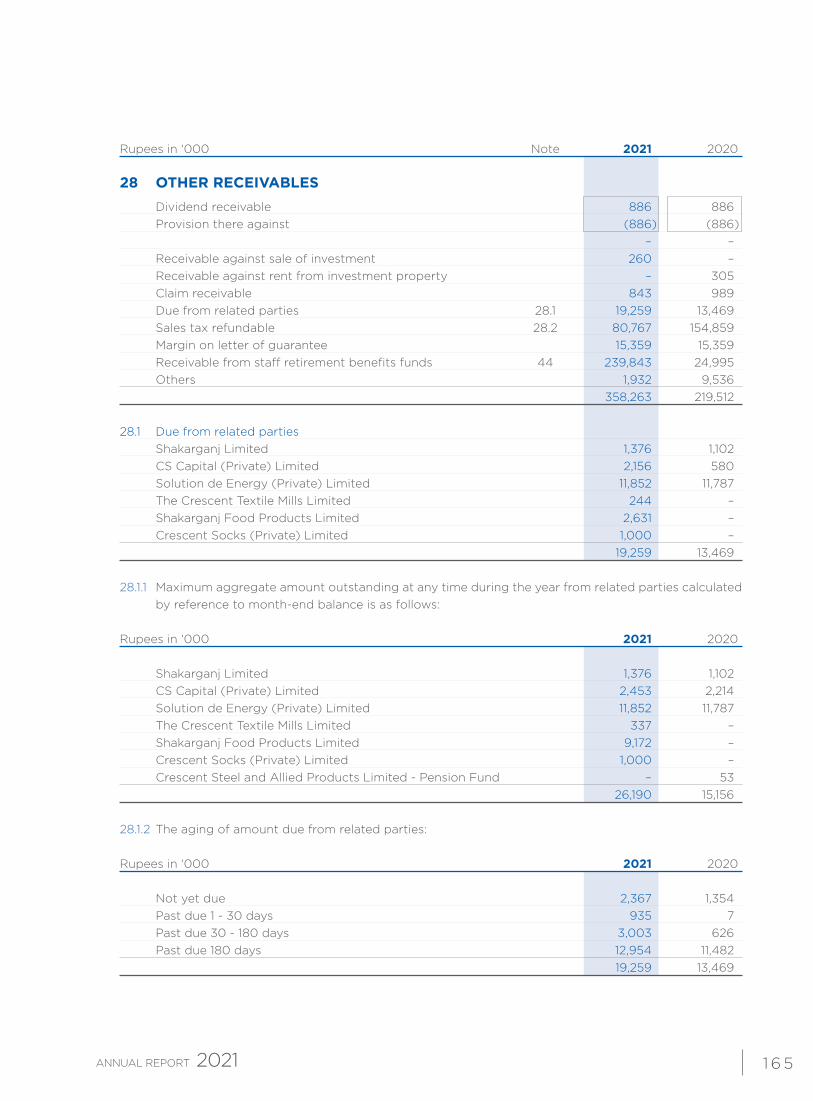
1 6 5
Rupees in ‘000 Note 2021 2020 28 OTHER RECEIVABLES Dividend receivable 886 886 Provision there against (886) (886) – – Receivable against sale of investment 260 – Receivable against rent from investment property – 305 Claim receivable 843 989 Due from related parties 28.1 19,259 13,469 Sales tax refundable 28.2 80,767 154,859 Margin on letter of guarantee 15,359 15,359 Receivable from staff retirement benefits funds 44 239,843 24,995 Others 1,932 9,536 358,263 219,512 28.1 Due from related parties Shakarganj Limited 1,376 1,102 CS Capital (Private) Limited 2,156 580 Solution de Energy (Private) Limited 11,852 11,787 The Crescent Textile Mills Limited 244 – Shakarganj Food Products Limited 2,631 – Crescent Socks (Private) Limited 1,000 – 19,259 13,469 28.1.1 Maximum aggregate amount outstanding at any time during the year from related parties calculated
by reference to month-end balance is as follows:
Rupees in ‘000 2021 2020
Shakarganj Limited 1,376 1,102 CS Capital (Private) Limited 2,453 2,214 Solution de Energy (Private) Limited 11,852 11,787 The Crescent Textile Mills Limited 337 – Shakarganj Food Products Limited 9,172 – Crescent Socks (Private) Limited 1,000 – Crescent Steel and Allied Products Limited - Pension Fund – 53 26,190 15,156 28.1.2 The aging of amount due from related parties:
Rupees in ‘000 2021 2020 Not yet due 2,367 1,354 Past due 1 - 30 days 935 7 Past due 30 - 180 days 3,003 626 Past due 180 days 12,954 11,482 19,259 13,469
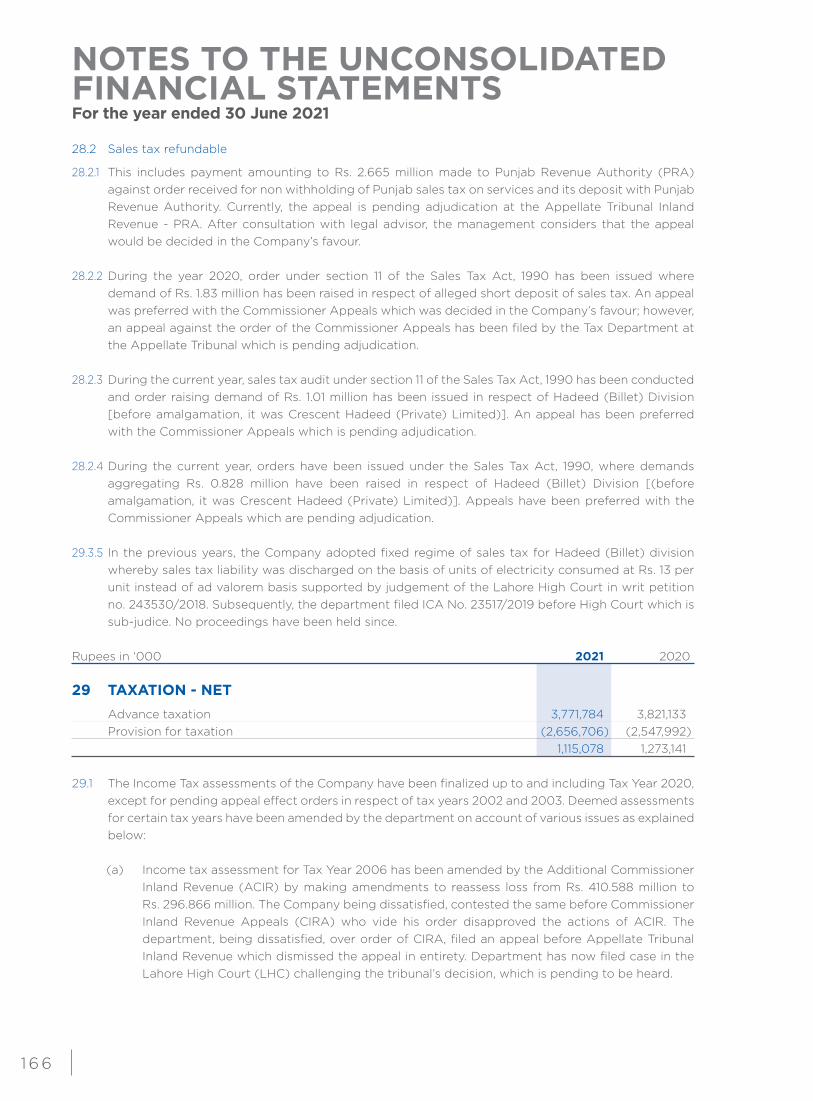
NOTES TO THE UNCONSOLIDATED FINANCIAL STATEMENTSFor the year ended 30 June 2021
1 6 6
28.2 Sales tax refundable
28.2.1 This includes payment amounting to Rs. 2.665 million made to Punjab Revenue Authority (PRA) against order received for non withholding of Punjab sales tax on services and its deposit with Punjab Revenue Authority. Currently, the appeal is pending adjudication at the Appellate Tribunal Inland Revenue - PRA. After consultation with legal advisor, the management considers that the appeal would be decided in the Company’s favour.
28.2.2 During the year 2020, order under section 11 of the Sales Tax Act, 1990 has been issued where demand of Rs. 1.83 million has been raised in respect of alleged short deposit of sales tax. An appeal was preferred with the Commissioner Appeals which was decided in the Company’s favour; however, an appeal against the order of the Commissioner Appeals has been filed by the Tax Department at the Appellate Tribunal which is pending adjudication.
28.2.3 During the current year, sales tax audit under section 11 of the Sales Tax Act, 1990 has been conducted
and order raising demand of Rs. 1.01 million has been issued in respect of Hadeed (Billet) Division [before amalgamation, it was Crescent Hadeed (Private) Limited)]. An appeal has been preferred with the Commissioner Appeals which is pending adjudication.
28.2.4 During the current year, orders have been issued under the Sales Tax Act, 1990, where demands
aggregating Rs. 0.828 million have been raised in respect of Hadeed (Billet) Division [(before amalgamation, it was Crescent Hadeed (Private) Limited)]. Appeals have been preferred with the Commissioner Appeals which are pending adjudication.
29.3.5 In the previous years, the Company adopted fixed regime of sales tax for Hadeed (Billet) division whereby sales tax liability was discharged on the basis of units of electricity consumed at Rs. 13 per unit instead of ad valorem basis supported by judgement of the Lahore High Court in writ petition no. 243530/2018. Subsequently, the department filed ICA No. 23517/2019 before High Court which is sub-judice. No proceedings have been held since.
Rupees in ‘000 2021 2020 29 TAXATION - NET Advance taxation 3,771,784 3,821,133 Provision for taxation (2,656,706) (2,547,992) 1,115,078 1,273,141 29.1 The Income Tax assessments of the Company have been finalized up to and including Tax Year 2020,
except for pending appeal effect orders in respect of tax years 2002 and 2003. Deemed assessments for certain tax years have been amended by the department on account of various issues as explained below:
(a) Income tax assessment for Tax Year 2006 has been amended by the Additional Commissioner Inland Revenue (ACIR) by making amendments to reassess loss from Rs. 410.588 million to Rs. 296.866 million. The Company being dissatisfied, contested the same before Commissioner Inland Revenue Appeals (CIRA) who vide his order disapproved the actions of ACIR. The department, being dissatisfied, over order of CIRA, filed an appeal before Appellate Tribunal Inland Revenue which dismissed the appeal in entirety. Department has now filed case in the Lahore High Court (LHC) challenging the tribunal’s decision, which is pending to be heard.
1 67
(b) Income tax assessments of the Company for the Tax Years 2013 and 2016 have been amended by the Commissioner Inland Revenue (CIR) whereby, tax demands of Rs. 95.94 million and Rs. 143.8 million have been raised, respectively. Appeals had been preferred with the Commissioner Appeals where most of the issues were decided in favour of the Company whereas for remaining issues, appeals have been preferred before the Appellate Tribunal Inland Revenue for these tax years which are pending adjudication. Cross appeal in Tax Year 2016 has been filed by the tax department which also awaits adjudication.
(c) The Additional Commissioner Inland Revenue amended the deemed assessment of the Company for Tax Year 2009 and Tax Year 2011 thereby raising demands of Rs. 4.937 million and Rs. 22.218 million, respectively. The Company filed appeals with the Commissioner Inland Revenue (appeals) in which majority of the issues were decided in the Company’s favour in case of Tax Year 2009 and the case was remanded back to the assessing officer for Tax Year 2011. The Company filed appeal with the Appellate Tribunal for Tax Year 2009 which is pending adjudication where as for Tax Year 2011, set aside proceedings have been initiated which have been duly responded to.
(d) Orders under section 161/205 of the Income Tax Ordinance 2001 have been issued by the
Assistant Commissioner Inland Revenue, whereby demands aggregating to Rs. 8.691 million (inclusive of default surcharge) have been raised in respect of Tax Year 2014 and Rs. 5.794 million in respect of Tax Year 2010. Majority of the matters have been decided in favour of the Company at the Commissioner (Appeals) level, whereas appeals have been preferred in Appellate Tribunal Inland Revenue for remaining issues.
(e) During the current year, order under section 122(5A) has been passed by the Commissioner
Inland Revenue for the Tax Year 2017 where expenses to the tune of Rs. 9.5 million have been disallowed. An appeal has been preferred with the Commissioner Appeals which is pending adjudication.
(f) During the year 2018, orders under section 161/205 of the Income Tax Ordinance 2001 have
been issued by the Assistant Commissioner Inland Revenue, whereby demand aggregating to Rs. 4.253 million (inclusive of default surcharge) has been raised in respect of Tax Year 2017. Appeal was preferred with the Commissioner Inland Revenue Appeals where majority of issues were decided in the Company’s favour along with rectification of original order. Appeal has been preferred with the Appellate Tribunal Inland Revenue for remaining issues which is pending adjudication.
(g) During the current year, orders under section 161/205 of the Income Tax Ordinance 2001 were
issued by the Assistant Commissioner Inland Revenue in respect of Tax Years 2016 through 2019 whereby demands aggregating Rs. 1 million (approximately) were raised for CS Energy (Private) Limited (previously wholly owned subsidiary - now amalgamated with and into the Company). Associated expense has been recognised accordingly in these financial statements.
No provision has been made in these financial statements in respect of demand raised by the Income
Tax authorities against matters stated in (a) to (f) as mentioned above, since based on the tax consultant’s opinion the management is confident of favourable outcome of these appeals.
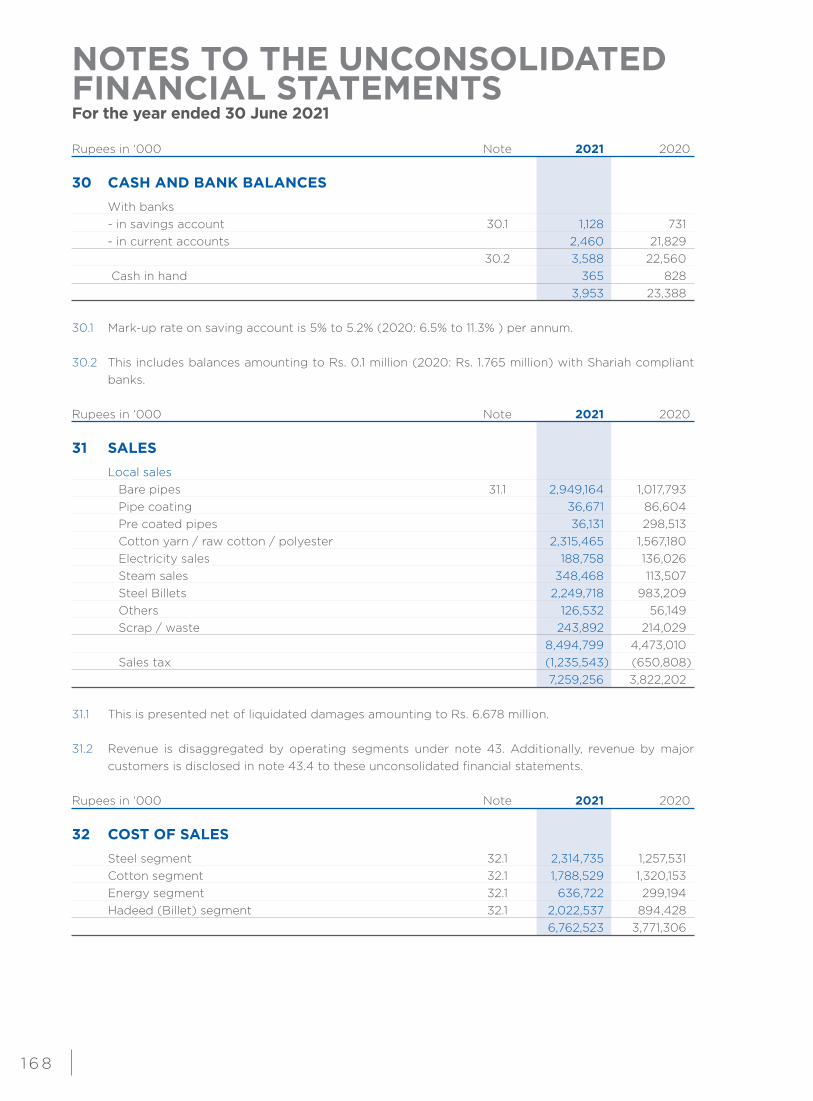
NOTES TO THE UNCONSOLIDATED FINANCIAL STATEMENTSFor the year ended 30 June 2021
1 6 8
Rupees in ‘000 Note 2021 2020 30 CASH AND BANK BALANCES With banks - in savings account 30.1 1,128 731 - in current accounts 2,460 21,829 30.2 3,588 22,560 Cash in hand 365 828 3,953 23,388 30.1 Mark-up rate on saving account is 5% to 5.2% (2020: 6.5% to 11.3% ) per annum. 30.2 This includes balances amounting to Rs. 0.1 million (2020: Rs. 1.765 million) with Shariah compliant
banks.
Rupees in ‘000 Note 2021 2020 31 SALES Local sales Bare pipes 31.1 2,949,164 1,017,793 Pipe coating 36,671 86,604 Pre coated pipes 36,131 298,513 Cotton yarn / raw cotton / polyester 2,315,465 1,567,180 Electricity sales 188,758 136,026 Steam sales 348,468 113,507 Steel Billets 2,249,718 983,209 Others 126,532 56,149 Scrap / waste 243,892 214,029 8,494,799 4,473,010 Sales tax (1,235,543) (650,808) 7,259,256 3,822,202 31.1 This is presented net of liquidated damages amounting to Rs. 6.678 million. 31.2 Revenue is disaggregated by operating segments under note 43. Additionally, revenue by major
customers is disclosed in note 43.4 to these unconsolidated financial statements.
Rupees in ‘000 Note 2021 2020
32 COST OF SALES Steel segment 32.1 2,314,735 1,257,531 Cotton segment 32.1 1,788,529 1,320,153 Energy segment 32.1 636,722 299,194 Hadeed (Billet) segment 32.1 2,022,537 894,428 6,762,523 3,771,306
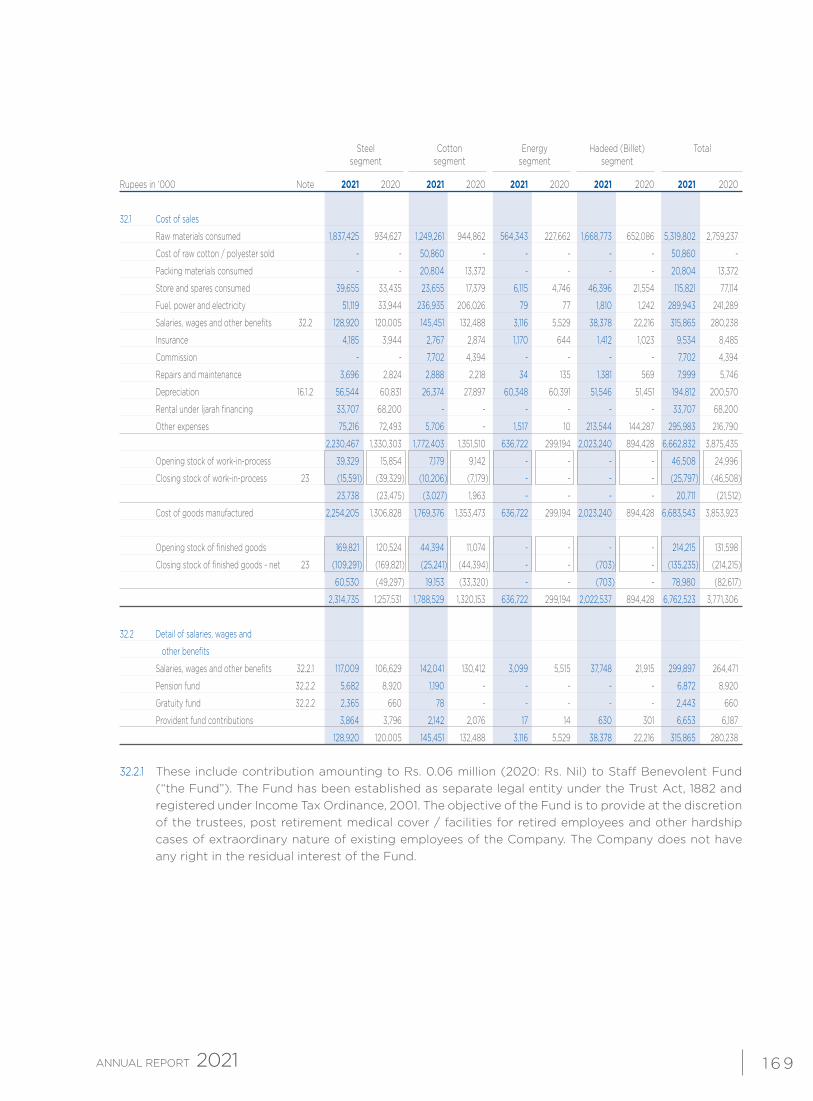
1 6 9
Steel Cotton Energy Hadeed (Billet) Total segment segment segment segment
Rupees in ‘000 Note 2021 2020 2021 2020 2021 2020 2021 2020 2021 2020
32.1 Cost of sales
Raw materials consumed 1,837,425 934,627 1,249,261 944,862 564,343 227,662 1,668,773 652,086 5,319,802 2,759,237
Cost of raw cotton / polyester sold - - 50,860 - - - - - 50,860 -
Packing materials consumed - - 20,804 13,372 - - - - 20,804 13,372
Store and spares consumed 39,655 33,435 23,655 17,379 6,115 4,746 46,396 21,554 115,821 77,114
Fuel, power and electricity 51,119 33,944 236,935 206,026 79 77 1,810 1,242 289,943 241,289
Salaries, wages and other benefits 32.2 128,920 120,005 145,451 132,488 3,116 5,529 38,378 22,216 315,865 280,238
Insurance 4,185 3,944 2,767 2,874 1,170 644 1,412 1,023 9,534 8,485
Commission - - 7,702 4,394 - - - - 7,702 4,394
Repairs and maintenance 3,696 2,824 2,888 2,218 34 135 1,381 569 7,999 5,746
Depreciation 16.1.2 56,544 60,831 26,374 27,897 60,348 60,391 51,546 51,451 194,812 200,570
Rental under Ijarah financing 33,707 68,200 - - - - - - 33,707 68,200
Other expenses 75,216 72,493 5,706 - 1,517 10 213,544 144,287 295,983 216,790
2,230,467 1,330,303 1,772,403 1,351,510 636,722 299,194 2,023,240 894,428 6,662,832 3,875,435
Opening stock of work-in-process 39,329 15,854 7,179 9,142 - - - - 46,508 24,996
Closing stock of work-in-process 23 (15,591) (39,329) (10,206) (7,179) - - - - (25,797) (46,508)
23,738 (23,475) (3,027) 1,963 - - - - 20,711 (21,512)
Cost of goods manufactured 2,254,205 1,306,828 1,769,376 1,353,473 636,722 299,194 2,023,240 894,428 6,683,543 3,853,923
Opening stock of finished goods 169,821 120,524 44,394 11,074 - - - - 214,215 131,598
Closing stock of finished goods - net 23 (109,291) (169,821) (25,241) (44,394) - - (703) - (135,235) (214,215)
60,530 (49,297) 19,153 (33,320) - - (703) - 78,980 (82,617)
2,314,735 1,257,531 1,788,529 1,320,153 636,722 299,194 2,022,537 894,428 6,762,523 3,771,306
32.2 Detail of salaries, wages and
other benefits
Salaries, wages and other benefits 32.2.1 117,009 106,629 142,041 130,412 3,099 5,515 37,748 21,915 299,897 264,471
Pension fund 32.2.2 5,682 8,920 1,190 - - - - - 6,872 8,920
Gratuity fund 32.2.2 2,365 660 78 - - - - - 2,443 660
Provident fund contributions 3,864 3,796 2,142 2,076 17 14 630 301 6,653 6,187
128,920 120,005 145,451 132,488 3,116 5,529 38,378 22,216 315,865 280,238
32.2.1 These include contribution amounting to Rs. 0.06 million (2020: Rs. Nil) to Staff Benevolent Fund
(“the Fund”). The Fund has been established as separate legal entity under the Trust Act, 1882 and registered under Income Tax Ordinance, 2001. The objective of the Fund is to provide at the discretion of the trustees, post retirement medical cover / facilities for retired employees and other hardship cases of extraordinary nature of existing employees of the Company. The Company does not have any right in the residual interest of the Fund.
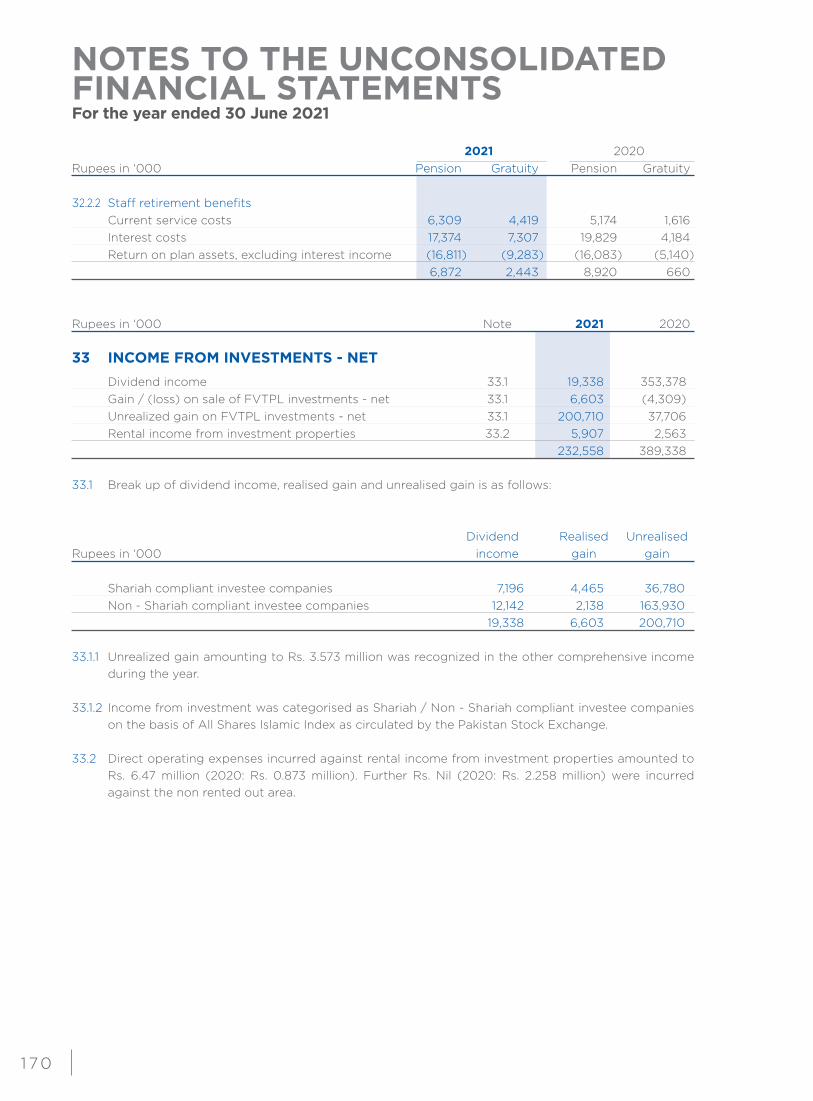
NOTES TO THE UNCONSOLIDATED FINANCIAL STATEMENTSFor the year ended 30 June 2021
1 70
2021 2020 Rupees in ‘000 Pension Gratuity Pension Gratuity 32.2.2 Staff retirement benefits Current service costs 6,309 4,419 5,174 1,616 Interest costs 17,374 7,307 19,829 4,184 Return on plan assets, excluding interest income (16,811) (9,283) (16,083) (5,140) 6,872 2,443 8,920 660
Rupees in ‘000 Note 2021 2020 33 INCOME FROM INVESTMENTS - NET Dividend income 33.1 19,338 353,378 Gain / (loss) on sale of FVTPL investments - net 33.1 6,603 (4,309) Unrealized gain on FVTPL investments - net 33.1 200,710 37,706 Rental income from investment properties 33.2 5,907 2,563 232,558 389,338 33.1 Break up of dividend income, realised gain and unrealised gain is as follows:
Dividend Realised UnrealisedRupees in ‘000 income gain gain Shariah compliant investee companies 7,196 4,465 36,780 Non - Shariah compliant investee companies 12,142 2,138 163,930 19,338 6,603 200,710 33.1.1 Unrealized gain amounting to Rs. 3.573 million was recognized in the other comprehensive income
during the year. 33.1.2 Income from investment was categorised as Shariah / Non - Shariah compliant investee companies
on the basis of All Shares Islamic Index as circulated by the Pakistan Stock Exchange. 33.2 Direct operating expenses incurred against rental income from investment properties amounted to
Rs. 6.47 million (2020: Rs. 0.873 million). Further Rs. Nil (2020: Rs. 2.258 million) were incurred against the non rented out area.
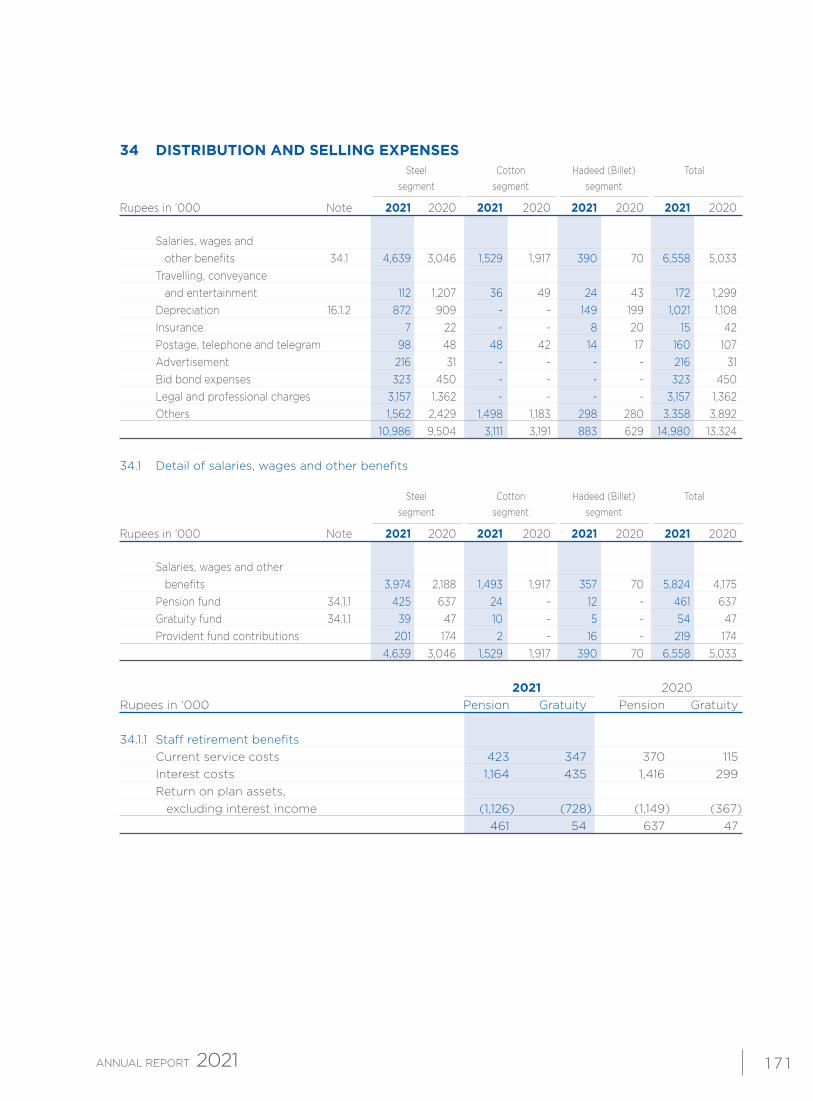
1 7 1
34 DISTRIBUTION AND SELLING EXPENSES Steel Cotton Hadeed (Billet) Total segment segment segment
Rupees in ‘000 Note 2021 2020 2021 2020 2021 2020 2021 2020
Salaries, wages and other benefits 34.1 4,639 3,046 1,529 1,917 390 70 6,558 5,033 Travelling, conveyance and entertainment 112 1,207 36 49 24 43 172 1,299 Depreciation 16.1.2 872 909 - - 149 199 1,021 1,108 Insurance 7 22 - - 8 20 15 42 Postage, telephone and telegram 98 48 48 42 14 17 160 107 Advertisement 216 31 - - - - 216 31 Bid bond expenses 323 450 - - - - 323 450 Legal and professional charges 3,157 1,362 - - - - 3,157 1,362 Others 1,562 2,429 1,498 1,183 298 280 3,358 3,892 10,986 9,504 3,111 3,191 883 629 14,980 13,324 34.1 Detail of salaries, wages and other benefits
Steel Cotton Hadeed (Billet) Total segment segment segment
Rupees in ‘000 Note 2021 2020 2021 2020 2021 2020 2021 2020
Salaries, wages and other benefits 3,974 2,188 1,493 1,917 357 70 5,824 4,175 Pension fund 34.1.1 425 637 24 - 12 - 461 637 Gratuity fund 34.1.1 39 47 10 - 5 - 54 47 Provident fund contributions 201 174 2 - 16 - 219 174 4,639 3,046 1,529 1,917 390 70 6,558 5,033 2021 2020 Rupees in ‘000 Pension Gratuity Pension Gratuity 34.1.1 Staff retirement benefits Current service costs 423 347 370 115 Interest costs 1,164 435 1,416 299 Return on plan assets, excluding interest income (1,126) (728) (1,149) (367) 461 54 637 47
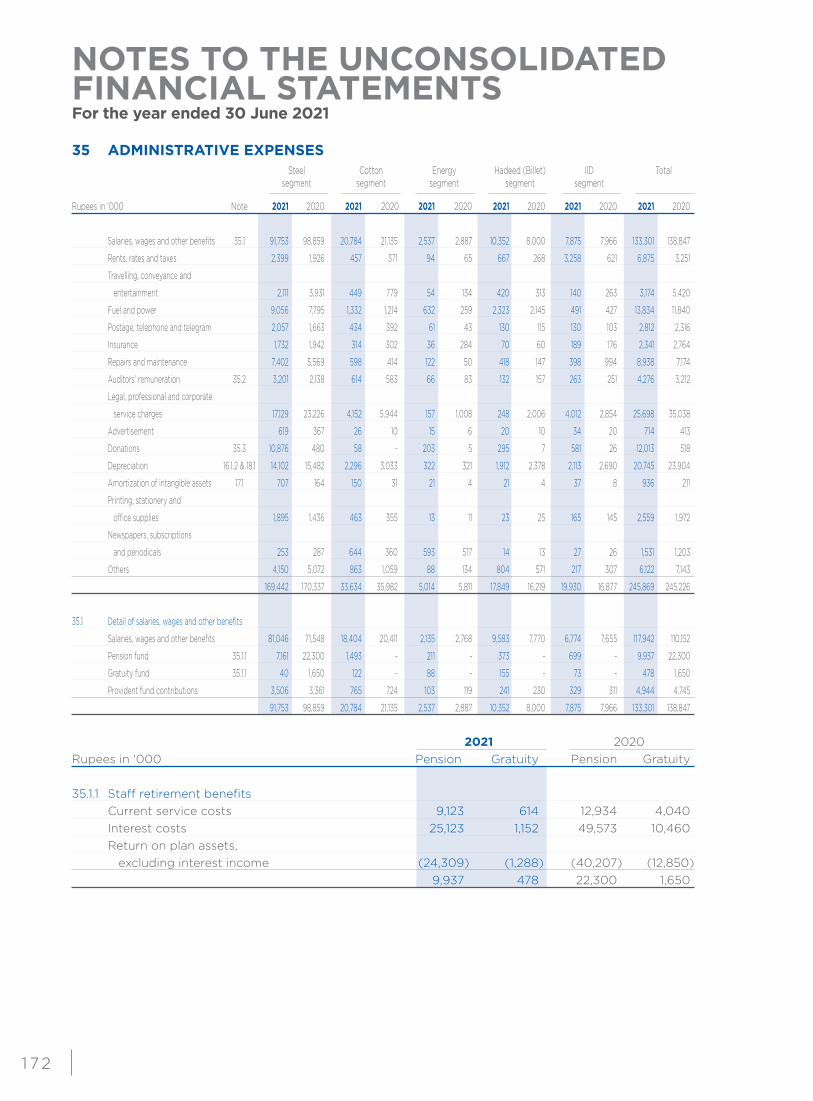
NOTES TO THE UNCONSOLIDATED FINANCIAL STATEMENTSFor the year ended 30 June 2021
1 72
35 ADMINISTRATIVE EXPENSES Steel Cotton Energy Hadeed (Billet) IID Total segment segment segment segment segment
Rupees in ‘000 Note 2021 2020 2021 2020 2021 2020 2021 2020 2021 2020 2021 2020
Salaries, wages and other benefits 35.1 91,753 98,859 20,784 21,135 2,537 2,887 10,352 8,000 7,875 7,966 133,301 138,847
Rents, rates and taxes 2,399 1,926 457 371 94 65 667 268 3,258 621 6,875 3,251
Travelling, conveyance and
entertainment 2,111 3,931 449 779 54 134 420 313 140 263 3,174 5,420
Fuel and power 9,056 7,795 1,332 1,214 632 259 2,323 2,145 491 427 13,834 11,840
Postage, telephone and telegram 2,057 1,663 434 392 61 43 130 115 130 103 2,812 2,316
Insurance 1,732 1,942 314 302 36 284 70 60 189 176 2,341 2,764
Repairs and maintenance 7,402 5,569 598 414 122 50 418 147 398 994 8,938 7,174
Auditors’ remuneration 35.2 3,201 2,138 614 583 66 83 132 157 263 251 4,276 3,212
Legal, professional and corporate
service charges 17,129 23,226 4,152 5,944 157 1,008 248 2,006 4,012 2,854 25,698 35,038
Advertisement 619 367 26 10 15 6 20 10 34 20 714 413
Donations 35.3 10,876 480 58 - 203 5 295 7 581 26 12,013 518
Depreciation 16.1.2 & 18.1 14,102 15,482 2,296 3,033 322 321 1,912 2,378 2,113 2,690 20,745 23,904
Amortization of intangible assets 17.1 707 164 150 31 21 4 21 4 37 8 936 211
Printing, stationery and
office supplies 1,895 1,436 463 355 13 11 23 25 165 145 2,559 1,972
Newspapers, subscriptions
and periodicals 253 287 644 360 593 517 14 13 27 26 1,531 1,203
Others 4,150 5,072 863 1,059 88 134 804 571 217 307 6,122 7,143
169,442 170,337 33,634 35,982 5,014 5,811 17,849 16,219 19,930 16,877 245,869 245,226
35.1 Detail of salaries, wages and other benefits
Salaries, wages and other benefits 81,046 71,548 18,404 20,411 2,135 2,768 9,583 7,770 6,774 7,655 117,942 110,152
Pension fund 35.1.1 7,161 22,300 1,493 - 211 - 373 - 699 - 9,937 22,300
Gratuity fund 35.1.1 40 1,650 122 - 88 - 155 - 73 - 478 1,650
Provident fund contributions 3,506 3,361 765 724 103 119 241 230 329 311 4,944 4,745
91,753 98,859 20,784 21,135 2,537 2,887 10,352 8,000 7,875 7,966 133,301 138,847
2021 2020 Rupees in ‘000 Pension Gratuity Pension Gratuity 35.1.1 Staff retirement benefits Current service costs 9,123 614 12,934 4,040 Interest costs 25,123 1,152 49,573 10,460 Return on plan assets, excluding interest income (24,309) (1,288) (40,207) (12,850) 9,937 478 22,300 1,650
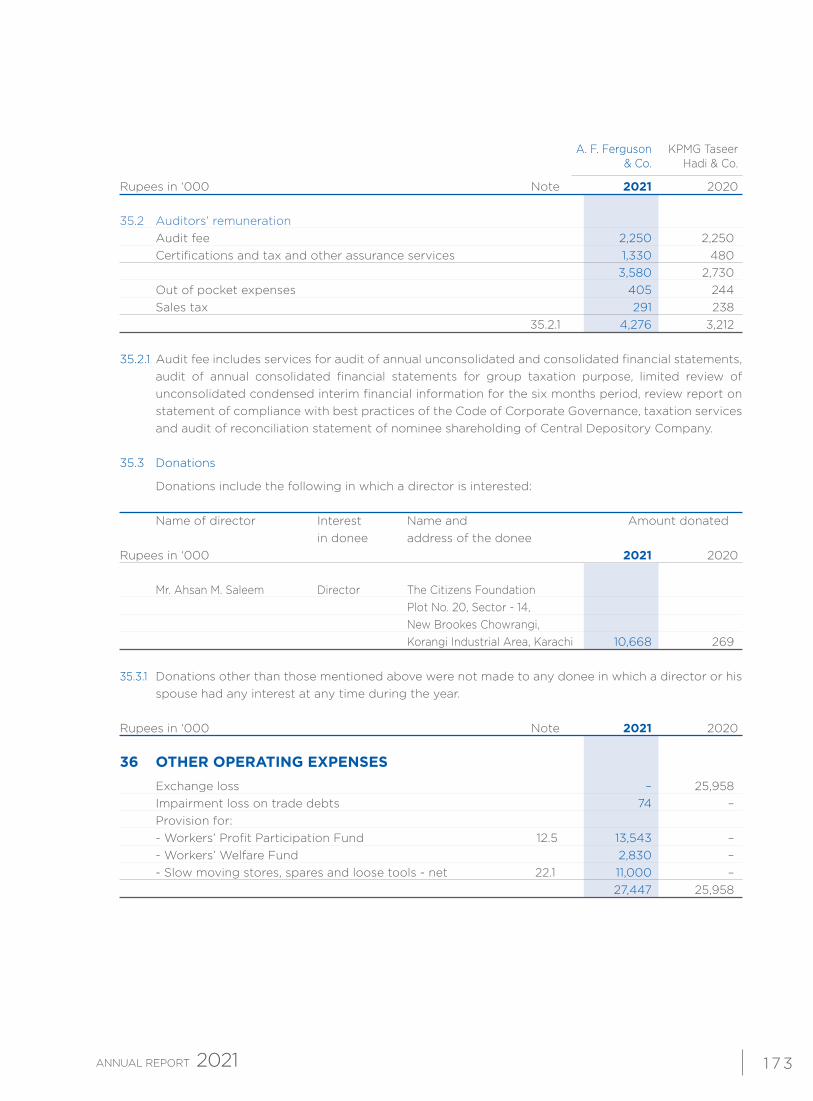
1 73
A. F. Ferguson KPMG Taseer & Co. Hadi & Co.
Rupees in ‘000 Note 2021 2020
35.2 Auditors’ remuneration Audit fee 2,250 2,250 Certifications and tax and other assurance services 1,330 480 3,580 2,730 Out of pocket expenses 405 244 Sales tax 291 238 35.2.1 4,276 3,212 35.2.1 Audit fee includes services for audit of annual unconsolidated and consolidated financial statements,
audit of annual consolidated financial statements for group taxation purpose, limited review of unconsolidated condensed interim financial information for the six months period, review report on statement of compliance with best practices of the Code of Corporate Governance, taxation services and audit of reconciliation statement of nominee shareholding of Central Depository Company.
35.3 Donations
Donations include the following in which a director is interested:
Name of director Interest Name and Amount donated in donee address of the donee Rupees in ‘000 2021 2020 Mr. Ahsan M. Saleem Director The Citizens Foundation Plot No. 20, Sector - 14, New Brookes Chowrangi, Korangi Industrial Area, Karachi 10,668 269 35.3.1 Donations other than those mentioned above were not made to any donee in which a director or his
spouse had any interest at any time during the year.
Rupees in ‘000 Note 2021 2020 36 OTHER OPERATING EXPENSES Exchange loss – 25,958 Impairment loss on trade debts 74 – Provision for: - Workers’ Profit Participation Fund 12.5 13,543 – - Workers’ Welfare Fund 2,830 – - Slow moving stores, spares and loose tools - net 22.1 11,000 – 27,447 25,958
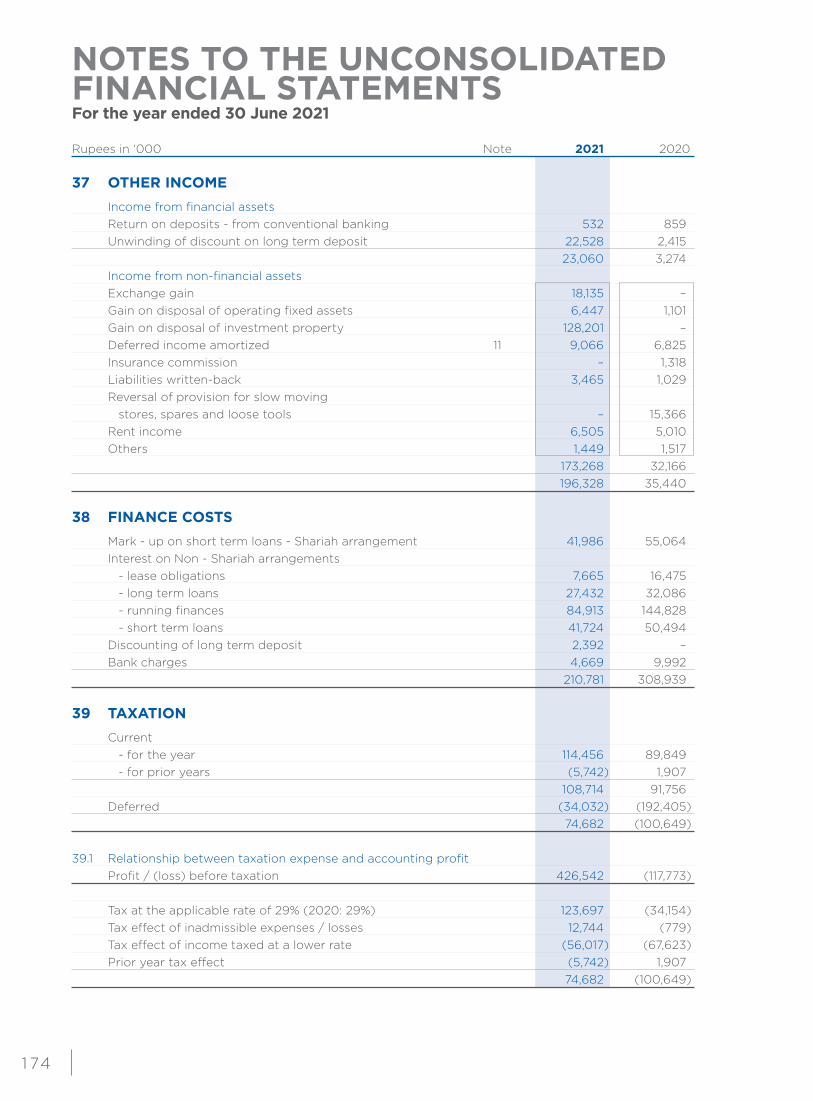
NOTES TO THE UNCONSOLIDATED FINANCIAL STATEMENTSFor the year ended 30 June 2021
1 74
Rupees in ‘000 Note 2021 2020
37 OTHER INCOME
Income from financial assets Return on deposits - from conventional banking 532 859 Unwinding of discount on long term deposit 22,528 2,415 23,060 3,274 Income from non-financial assets Exchange gain 18,135 – Gain on disposal of operating fixed assets 6,447 1,101 Gain on disposal of investment property 128,201 – Deferred income amortized 11 9,066 6,825 Insurance commission – 1,318 Liabilities written-back 3,465 1,029 Reversal of provision for slow moving stores, spares and loose tools – 15,366 Rent income 6,505 5,010 Others 1,449 1,517 173,268 32,166 196,328 35,440
38 FINANCE COSTS Mark - up on short term loans - Shariah arrangement 41,986 55,064 Interest on Non - Shariah arrangements - lease obligations 7,665 16,475 - long term loans 27,432 32,086 - running finances 84,913 144,828 - short term loans 41,724 50,494 Discounting of long term deposit 2,392 – Bank charges 4,669 9,992 210,781 308,939 39 TAXATION
Current - for the year 114,456 89,849 - for prior years (5,742) 1,907 108,714 91,756 Deferred (34,032) (192,405) 74,682 (100,649) 39.1 Relationship between taxation expense and accounting profit Profit / (loss) before taxation 426,542 (117,773) Tax at the applicable rate of 29% (2020: 29%) 123,697 (34,154) Tax effect of inadmissible expenses / losses 12,744 (779) Tax effect of income taxed at a lower rate (56,017) (67,623) Prior year tax effect (5,742) 1,907 74,682 (100,649)

1 75
39.2 Sufficient provision for tax has been made in these financial statements taking into account the profit for the year and various admissible and inadmissible allowances and deduction under the Income Tax Ordinance, 2001. Position of provisions and assessments including returns filed and deemed assessed for last three years are as follows:
Rupees in ‘000 2020 2019 2018 Tax provision including effects of prior years 81,427 63,513 222,849
Tax assessed / return filed 81,427 63,513 186,807
Rupees in ‘000 2021 2020 40 BASIC AND DILUTED EARNINGS / (LOSS) PER SHARE
Profit / (Loss) for the year 351,860 (17,124)
(Number of shares)
Weighted average number of ordinary shares in issue during the year 77,632,491 77,632,491
(Rupees)
Basic and diluted earnings / (loss) per share 4.53 (0.22)
Rupees in ‘000 Note 2021 2020
41 CASH GENERATED FROM / (USED IN) OPERATIONS Profit / (loss) before taxation 426,542 (117,773) Adjustments for non cash charges and other items: Depreciation on operating fixed assets and investment properties 216,578 225,582 Amortization of intangible assets 17 936 211 Charge for the year on staff retirement benefit funds 44.1.7 20,245 34,214 Dividend income 33.1 (19,338) (353,378) Unrealized gain on FVTPL investments - net 33.1 (200,710) (37,706) (Gain) / loss on sale of FVTPL investments - net 33.1 (6,603) 4,309 Provision / (reversal) for slow moving stores, spares and loose tools 36 11,000 (15,366) Reversal of impairment loss on trade debts - net 36 74 – Provision for Workers’ Welfare Fund 36 2,830 – Provision for Workers’ Profit Participation Fund 36 13,543 – Return on deposits 37 (532) (859) Gain on disposal of operating fixed assets 37 (6,447) (1,101) Gain on disposal of investment property 37 (128,201) – Deferred income amortized 37 (9,066) (6,825) Discounting of long term deposit 38 2,392 – Unwinding of discount on long term deposit 37 (22,528) (2,415) Liabilities written off 37 (3,465) (1,029) Finance costs 38 208,389 308,939 505,639 36,803 Changes in: - Stores, spares and loose tools (5,220) 31,918 - Stock-in-trade 894,212 (1,309,372) - Trade debts 88,652 (129,367) - Advances 8,954 (22,540) - Trade deposits and short term prepayments (27,067) (12,765) - Other receivables 76,151 35,117 - Trade and other payables (313,520) 381,430 1,227,801 (988,776)
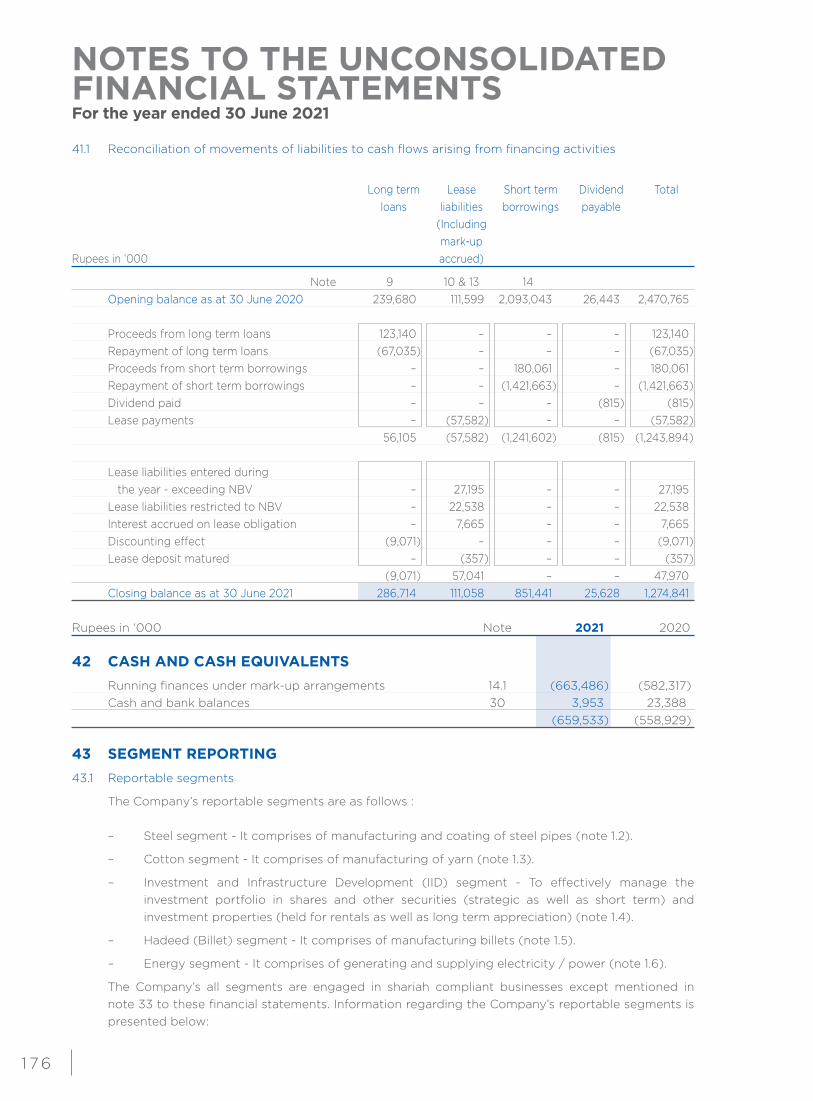
NOTES TO THE UNCONSOLIDATED FINANCIAL STATEMENTSFor the year ended 30 June 2021
1 76
41.1 Reconciliation of movements of liabilities to cash flows arising from financing activities
Long term Lease Short term Dividend Total loans liabilities borrowings payable (Including mark-upRupees in ‘000 accrued)
Note 9 10 & 13 14 Opening balance as at 30 June 2020 239,680 111,599 2,093,043 26,443 2,470,765
Proceeds from long term loans 123,140 – – – 123,140 Repayment of long term loans (67,035) – – – (67,035) Proceeds from short term borrowings – – 180,061 – 180,061 Repayment of short term borrowings – – (1,421,663) – (1,421,663) Dividend paid – – – (815) (815) Lease payments – (57,582) – – (57,582) 56,105 (57,582) (1,241,602) (815) (1,243,894) Lease liabilities entered during the year - exceeding NBV – 27,195 – – 27,195 Lease liabilities restricted to NBV – 22,538 – – 22,538 Interest accrued on lease obligation – 7,665 – – 7,665 Discounting effect (9,071) – – – (9,071) Lease deposit matured – (357) – – (357) (9,071) 57,041 – – 47,970 Closing balance as at 30 June 2021 286,714 111,058 851,441 25,628 1,274,841 Rupees in ‘000 Note 2021 2020
42 CASH AND CASH EQUIVALENTS Running finances under mark-up arrangements 14.1 (663,486) (582,317) Cash and bank balances 30 3,953 23,388 (659,533) (558,929) 43 SEGMENT REPORTING 43.1 Reportable segments
The Company’s reportable segments are as follows :
– Steel segment - It comprises of manufacturing and coating of steel pipes (note 1.2).
– Cotton segment - It comprises of manufacturing of yarn (note 1.3).
– Investment and Infrastructure Development (IID) segment - To effectively manage the investment portfolio in shares and other securities (strategic as well as short term) and investment properties (held for rentals as well as long term appreciation) (note 1.4).
– Hadeed (Billet) segment - It comprises of manufacturing billets (note 1.5).
– Energy segment - It comprises of generating and supplying electricity / power (note 1.6).
The Company’s all segments are engaged in shariah compliant businesses except mentioned in note 33 to these financial statements. Information regarding the Company’s reportable segments is presented below:
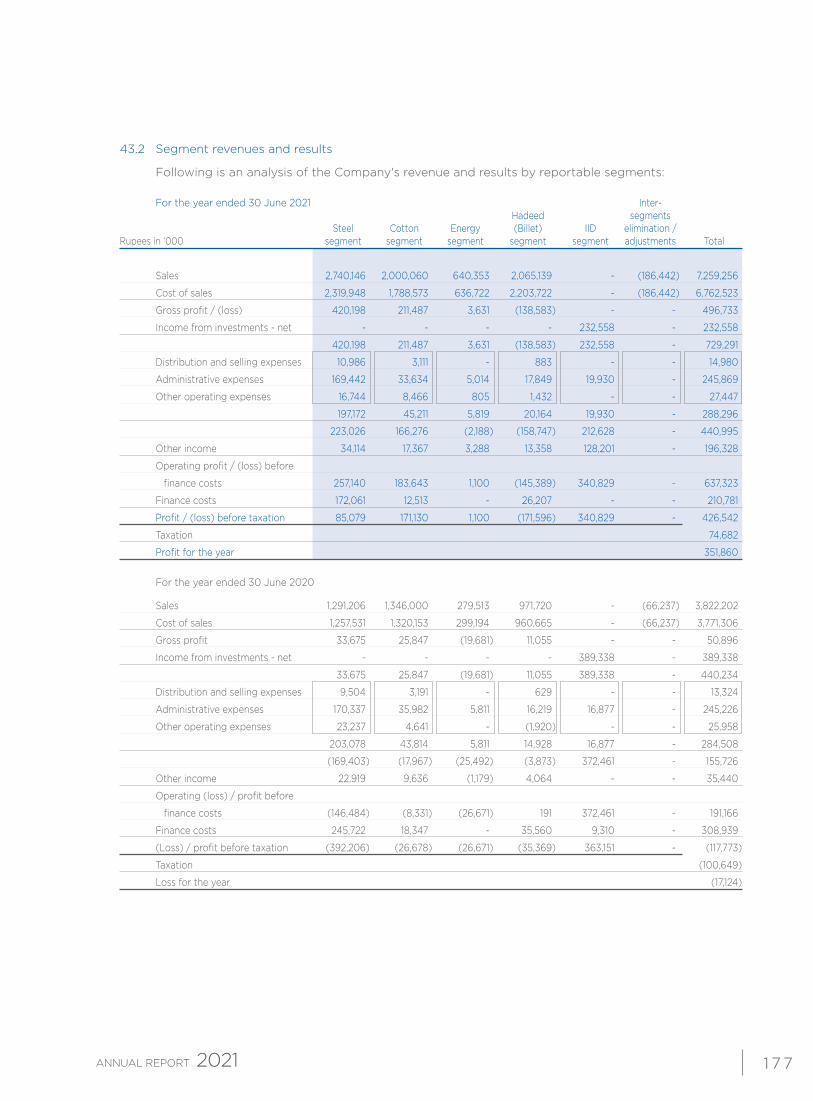
1 7 7
43.2 Segment revenues and results
Following is an analysis of the Company's revenue and results by reportable segments: For the year ended 30 June 2021 Inter- Hadeed segments Steel Cotton Energy (Billet) IID elimination /Rupees in ‘000 segment segment segment segment segment adjustments Total
Sales 2,740,146 2,000,060 640,353 2,065,139 - (186,442) 7,259,256
Cost of sales 2,319,948 1,788,573 636,722 2,203,722 - (186,442) 6,762,523
Gross profit / (loss) 420,198 211,487 3,631 (138,583) - - 496,733
Income from investments - net - - - - 232,558 - 232,558
420,198 211,487 3,631 (138,583) 232,558 - 729,291
Distribution and selling expenses 10,986 3,111 - 883 - - 14,980
Administrative expenses 169,442 33,634 5,014 17,849 19,930 - 245,869
Other operating expenses 16,744 8,466 805 1,432 - - 27,447
197,172 45,211 5,819 20,164 19,930 - 288,296
223,026 166,276 (2,188) (158,747) 212,628 - 440,995
Other income 34,114 17,367 3,288 13,358 128,201 - 196,328
Operating profit / (loss) before
finance costs 257,140 183,643 1,100 (145,389) 340,829 - 637,323
Finance costs 172,061 12,513 - 26,207 - - 210,781
Profit / (loss) before taxation 85,079 171,130 1,100 (171,596) 340,829 - 426,542
Taxation 74,682
Profit for the year 351,860
For the year ended 30 June 2020
Sales 1,291,206 1,346,000 279,513 971,720 - (66,237) 3,822,202
Cost of sales 1,257,531 1,320,153 299,194 960,665 - (66,237) 3,771,306
Gross profit 33,675 25,847 (19,681) 11,055 - - 50,896
Income from investments - net - - - - 389,338 - 389,338
33,675 25,847 (19,681) 11,055 389,338 - 440,234
Distribution and selling expenses 9,504 3,191 - 629 - - 13,324
Administrative expenses 170,337 35,982 5,811 16,219 16,877 - 245,226
Other operating expenses 23,237 4,641 - (1,920) - - 25,958
203,078 43,814 5,811 14,928 16,877 - 284,508
(169,403) (17,967) (25,492) (3,873) 372,461 - 155,726
Other income 22,919 9,636 (1,179) 4,064 - - 35,440
Operating (loss) / profit before
finance costs (146,484) (8,331) (26,671) 191 372,461 - 191,166
Finance costs 245,722 18,347 - 35,560 9,310 - 308,939
(Loss) / profit before taxation (392,206) (26,678) (26,671) (35,369) 363,151 - (117,773)
Taxation (100,649)
Loss for the year (17,124)
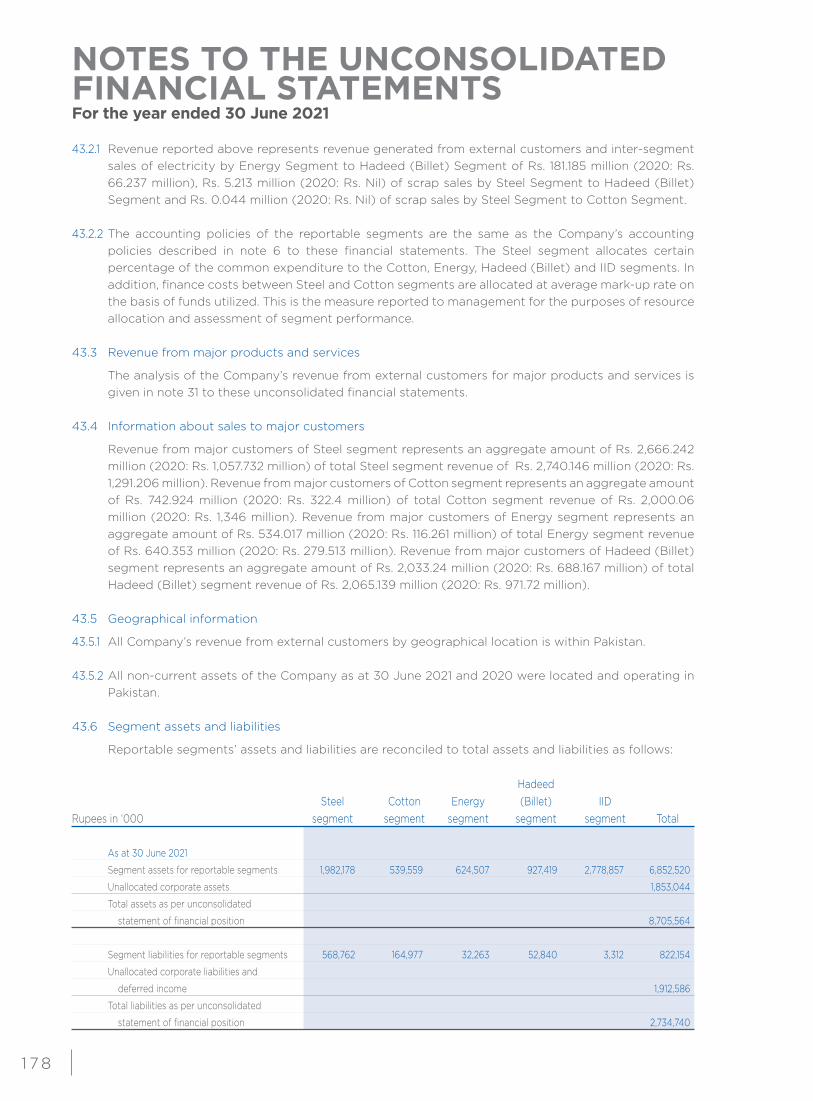
NOTES TO THE UNCONSOLIDATED FINANCIAL STATEMENTSFor the year ended 30 June 2021
1 78
43.2.1 Revenue reported above represents revenue generated from external customers and inter-segment sales of electricity by Energy Segment to Hadeed (Billet) Segment of Rs. 181.185 million (2020: Rs. 66.237 million), Rs. 5.213 million (2020: Rs. Nil) of scrap sales by Steel Segment to Hadeed (Billet) Segment and Rs. 0.044 million (2020: Rs. Nil) of scrap sales by Steel Segment to Cotton Segment.
43.2.2 The accounting policies of the reportable segments are the same as the Company’s accounting policies described in note 6 to these financial statements. The Steel segment allocates certain percentage of the common expenditure to the Cotton, Energy, Hadeed (Billet) and IID segments. In addition, finance costs between Steel and Cotton segments are allocated at average mark-up rate on the basis of funds utilized. This is the measure reported to management for the purposes of resource allocation and assessment of segment performance.
43.3 Revenue from major products and services
The analysis of the Company’s revenue from external customers for major products and services is given in note 31 to these unconsolidated financial statements.
43.4 Information about sales to major customers
Revenue from major customers of Steel segment represents an aggregate amount of Rs. 2,666.242 million (2020: Rs. 1,057.732 million) of total Steel segment revenue of Rs. 2,740.146 million (2020: Rs. 1,291.206 million). Revenue from major customers of Cotton segment represents an aggregate amount of Rs. 742.924 million (2020: Rs. 322.4 million) of total Cotton segment revenue of Rs. 2,000.06 million (2020: Rs. 1,346 million). Revenue from major customers of Energy segment represents an aggregate amount of Rs. 534.017 million (2020: Rs. 116.261 million) of total Energy segment revenue of Rs. 640.353 million (2020: Rs. 279.513 million). Revenue from major customers of Hadeed (Billet) segment represents an aggregate amount of Rs. 2,033.24 million (2020: Rs. 688.167 million) of total Hadeed (Billet) segment revenue of Rs. 2,065.139 million (2020: Rs. 971.72 million).
43.5 Geographical information
43.5.1 All Company’s revenue from external customers by geographical location is within Pakistan.
43.5.2 All non-current assets of the Company as at 30 June 2021 and 2020 were located and operating in Pakistan.
43.6 Segment assets and liabilities
Reportable segments’ assets and liabilities are reconciled to total assets and liabilities as follows: Hadeed Steel Cotton Energy (Billet) IID Rupees in ‘000 segment segment segment segment segment Total As at 30 June 2021
Segment assets for reportable segments 1,982,178 539,559 624,507 927,419 2,778,857 6,852,520
Unallocated corporate assets 1,853,044
Total assets as per unconsolidated
statement of financial position 8,705,564
Segment liabilities for reportable segments 568,762 164,977 32,263 52,840 3,312 822,154
Unallocated corporate liabilities and
deferred income 1,912,586
Total liabilities as per unconsolidated
statement of financial position 2,734,740
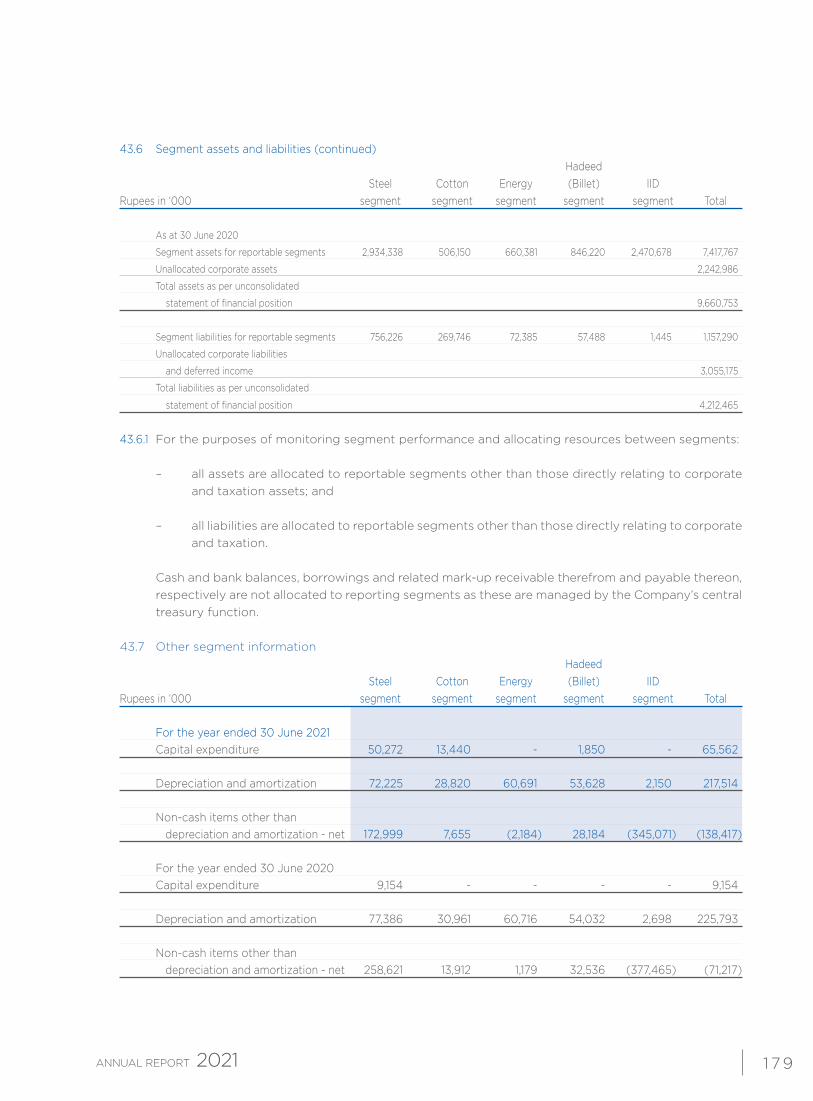
1 79
43.6 Segment assets and liabilities (continued) Hadeed Steel Cotton Energy (Billet) IID Rupees in ‘000 segment segment segment segment segment Total As at 30 June 2020
Segment assets for reportable segments 2,934,338 506,150 660,381 846,220 2,470,678 7,417,767
Unallocated corporate assets 2,242,986
Total assets as per unconsolidated
statement of financial position 9,660,753
Segment liabilities for reportable segments 756,226 269,746 72,385 57,488 1,445 1,157,290
Unallocated corporate liabilities
and deferred income 3,055,175
Total liabilities as per unconsolidated
statement of financial position 4,212,465
43.6.1 For the purposes of monitoring segment performance and allocating resources between segments:
– all assets are allocated to reportable segments other than those directly relating to corporate and taxation assets; and
– all liabilities are allocated to reportable segments other than those directly relating to corporate
and taxation. Cash and bank balances, borrowings and related mark-up receivable therefrom and payable thereon,
respectively are not allocated to reporting segments as these are managed by the Company’s central treasury function.
43.7 Other segment information Hadeed Steel Cotton Energy (Billet) IID Rupees in ‘000 segment segment segment segment segment Total
For the year ended 30 June 2021 Capital expenditure 50,272 13,440 - 1,850 - 65,562 Depreciation and amortization 72,225 28,820 60,691 53,628 2,150 217,514 Non-cash items other than depreciation and amortization - net 172,999 7,655 (2,184) 28,184 (345,071) (138,417) For the year ended 30 June 2020 Capital expenditure 9,154 - - - - 9,154 Depreciation and amortization 77,386 30,961 60,716 54,032 2,698 225,793 Non-cash items other than depreciation and amortization - net 258,621 13,912 1,179 32,536 (377,465) (71,217)
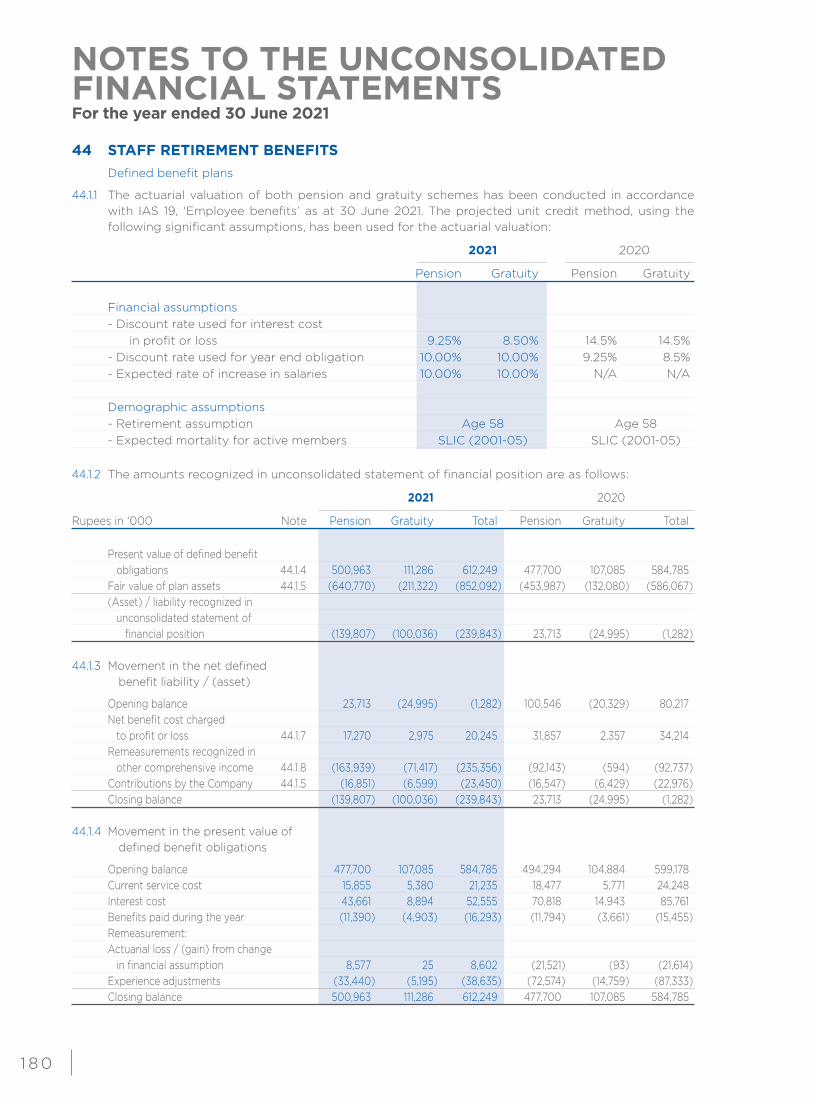
NOTES TO THE UNCONSOLIDATED FINANCIAL STATEMENTSFor the year ended 30 June 2021
1 8 0
44 STAFF RETIREMENT BENEFITS
Defined benefit plans
44.1.1 The actuarial valuation of both pension and gratuity schemes has been conducted in accordance with IAS 19, ‘Employee benefits’ as at 30 June 2021. The projected unit credit method, using the following significant assumptions, has been used for the actuarial valuation:
2021 2020
Pension Gratuity Pension Gratuity Financial assumptions - Discount rate used for interest cost in profit or loss 9.25% 8.50% 14.5% 14.5% - Discount rate used for year end obligation 10.00% 10.00% 9.25% 8.5% - Expected rate of increase in salaries 10.00% 10.00% N/A N/A Demographic assumptions - Retirement assumption Age 58 Age 58 - Expected mortality for active members SLIC (2001-05) SLIC (2001-05)
44.1.2 The amounts recognized in unconsolidated statement of financial position are as follows:
2021 2020
Rupees in ‘000 Note Pension Gratuity Total Pension Gratuity Total
Present value of defined benefit obligations 44.1.4 500,963 111,286 612,249 477,700 107,085 584,785 Fair value of plan assets 44.1.5 (640,770) (211,322) (852,092) (453,987) (132,080) (586,067) (Asset) / liability recognized in unconsolidated statement of financial position (139,807) (100,036) (239,843) 23,713 (24,995) (1,282) 44.1.3 Movement in the net defined benefit liability / (asset)
Opening balance 23,713 (24,995) (1,282) 100,546 (20,329) 80,217 Net benefit cost charged to profit or loss 44.1.7 17,270 2,975 20,245 31,857 2,357 34,214 Remeasurements recognized in other comprehensive income 44.1.8 (163,939) (71,417) (235,356) (92,143) (594) (92,737) Contributions by the Company 44.1.5 (16,851) (6,599) (23,450) (16,547) (6,429) (22,976) Closing balance (139,807) (100,036) (239,843) 23,713 (24,995) (1,282) 44.1.4 Movement in the present value of defined benefit obligations
Opening balance 477,700 107,085 584,785 494,294 104,884 599,178 Current service cost 15,855 5,380 21,235 18,477 5,771 24,248 Interest cost 43,661 8,894 52,555 70,818 14,943 85,761 Benefits paid during the year (11,390) (4,903) (16,293) (11,794) (3,661) (15,455) Remeasurement: Actuarial loss / (gain) from change in financial assumption 8,577 25 8,602 (21,521) (93) (21,614) Experience adjustments (33,440) (5,195) (38,635) (72,574) (14,759) (87,333) Closing balance 500,963 111,286 612,249 477,700 107,085 584,785
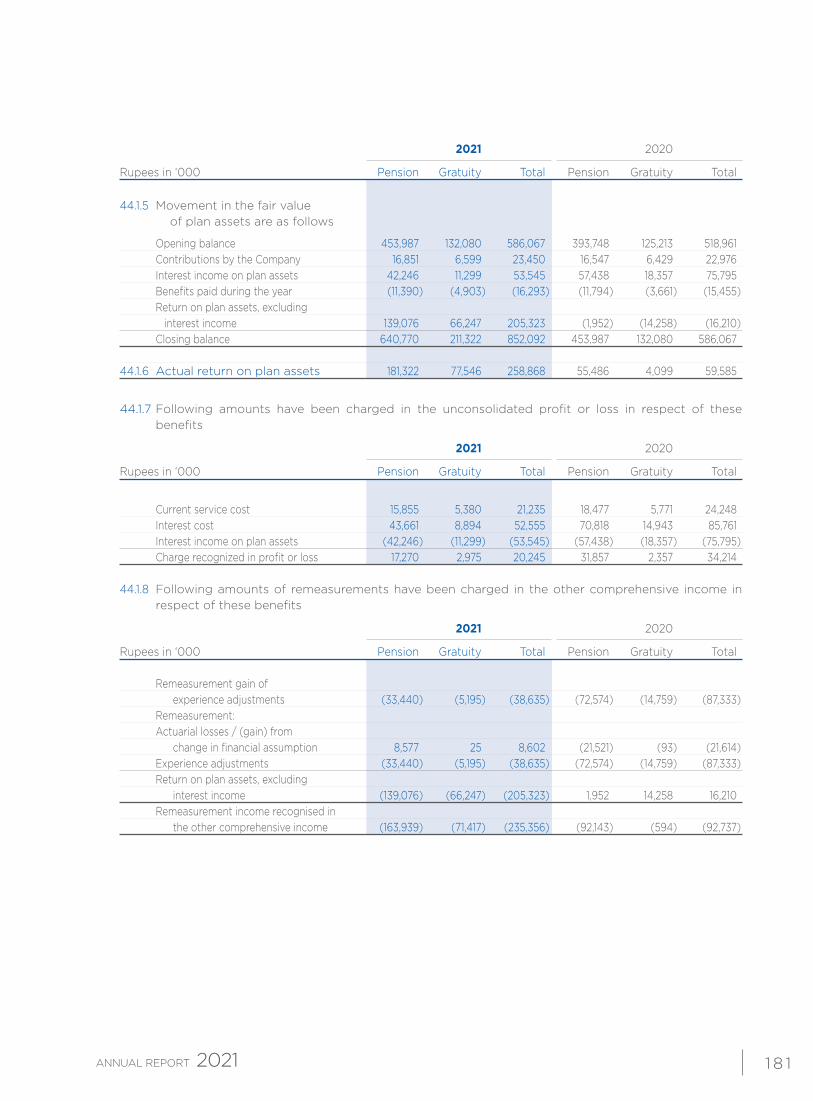
1 8 1
2021 2020
Rupees in ‘000 Pension Gratuity Total Pension Gratuity Total
44.1.5 Movement in the fair value of plan assets are as follows
Opening balance 453,987 132,080 586,067 393,748 125,213 518,961 Contributions by the Company 16,851 6,599 23,450 16,547 6,429 22,976 Interest income on plan assets 42,246 11,299 53,545 57,438 18,357 75,795 Benefits paid during the year (11,390) (4,903) (16,293) (11,794) (3,661) (15,455) Return on plan assets, excluding interest income 139,076 66,247 205,323 (1,952) (14,258) (16,210) Closing balance 640,770 211,322 852,092 453,987 132,080 586,067 44.1.6 Actual return on plan assets 181,322 77,546 258,868 55,486 4,099 59,585
44.1.7 Following amounts have been charged in the unconsolidated profit or loss in respect of these benefits
2021 2020
Rupees in ‘000 Pension Gratuity Total Pension Gratuity Total
Current service cost 15,855 5,380 21,235 18,477 5,771 24,248 Interest cost 43,661 8,894 52,555 70,818 14,943 85,761 Interest income on plan assets (42,246) (11,299) (53,545) (57,438) (18,357) (75,795) Charge recognized in profit or loss 17,270 2,975 20,245 31,857 2,357 34,214
44.1.8 Following amounts of remeasurements have been charged in the other comprehensive income in respect of these benefits
2021 2020
Rupees in ‘000 Pension Gratuity Total Pension Gratuity Total
Remeasurement gain of experience adjustments (33,440) (5,195) (38,635) (72,574) (14,759) (87,333) Remeasurement: Actuarial losses / (gain) from change in financial assumption 8,577 25 8,602 (21,521) (93) (21,614) Experience adjustments (33,440) (5,195) (38,635) (72,574) (14,759) (87,333) Return on plan assets, excluding interest income (139,076) (66,247) (205,323) 1,952 14,258 16,210 Remeasurement income recognised in the other comprehensive income (163,939) (71,417) (235,356) (92,143) (594) (92,737)
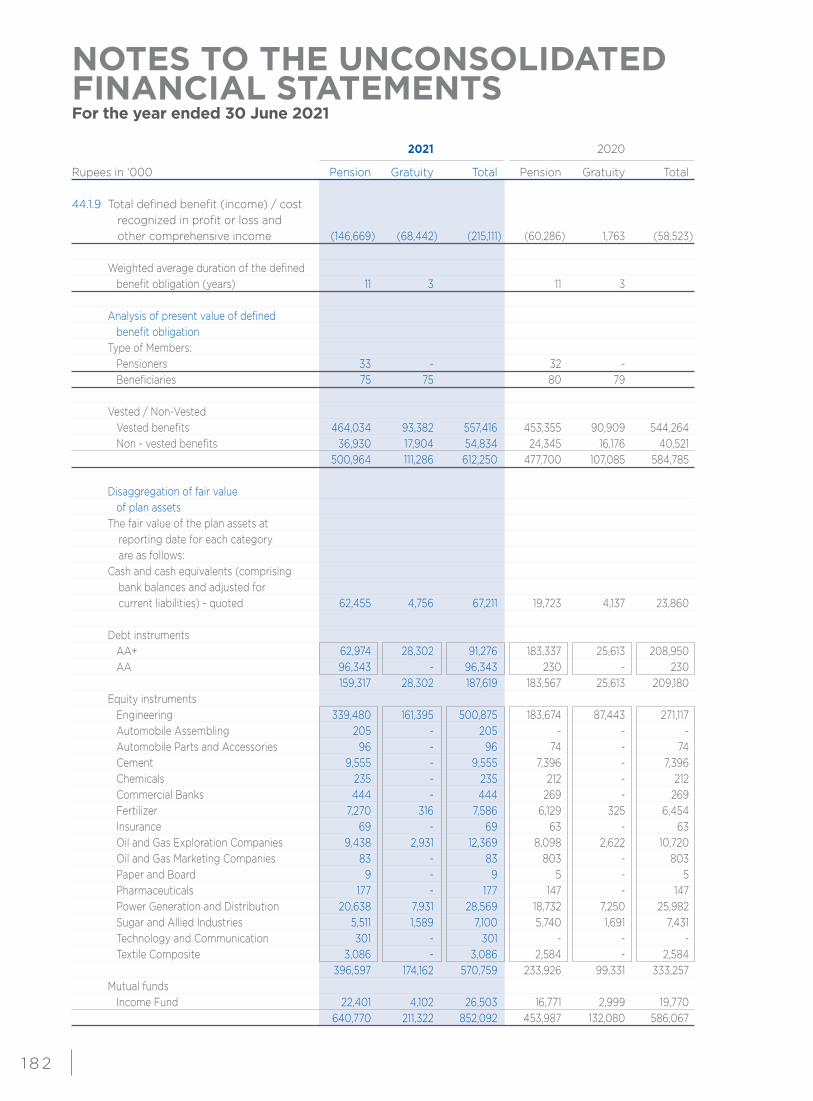
NOTES TO THE UNCONSOLIDATED FINANCIAL STATEMENTSFor the year ended 30 June 2021
1 8 2
2021 2020
Rupees in ‘000 Pension Gratuity Total Pension Gratuity Total
44.1.9 Total defined benefit (income) / cost recognized in profit or loss and other comprehensive income (146,669) (68,442) (215,111) (60,286) 1,763 (58,523) Weighted average duration of the defined benefit obligation (years) 11 3 11 3 Analysis of present value of defined benefit obligation Type of Members: Pensioners 33 - 32 - Beneficiaries 75 75 80 79 Vested / Non-Vested Vested benefits 464,034 93,382 557,416 453,355 90,909 544,264 Non - vested benefits 36,930 17,904 54,834 24,345 16,176 40,521 500,964 111,286 612,250 477,700 107,085 584,785
Disaggregation of fair value of plan assets The fair value of the plan assets at reporting date for each category are as follows: Cash and cash equivalents (comprising bank balances and adjusted for current liabilities) - quoted 62,455 4,756 67,211 19,723 4,137 23,860 Debt instruments AA+ 62,974 28,302 91,276 183,337 25,613 208,950 AA 96,343 - 96,343 230 - 230 159,317 28,302 187,619 183,567 25,613 209,180 Equity instruments Engineering 339,480 161,395 500,875 183,674 87,443 271,117 Automobile Assembling 205 - 205 - - - Automobile Parts and Accessories 96 - 96 74 - 74 Cement 9,555 - 9,555 7,396 - 7,396 Chemicals 235 - 235 212 - 212 Commercial Banks 444 - 444 269 - 269 Fertilizer 7,270 316 7,586 6,129 325 6,454 Insurance 69 - 69 63 - 63 Oil and Gas Exploration Companies 9,438 2,931 12,369 8,098 2,622 10,720 Oil and Gas Marketing Companies 83 - 83 803 - 803 Paper and Board 9 - 9 5 - 5 Pharmaceuticals 177 - 177 147 - 147 Power Generation and Distribution 20,638 7,931 28,569 18,732 7,250 25,982 Sugar and Allied Industries 5,511 1,589 7,100 5,740 1,691 7,431 Technology and Communication 301 - 301 - - - Textile Composite 3,086 - 3,086 2,584 - 2,584 396,597 174,162 570,759 233,926 99,331 333,257 Mutual funds Income Fund 22,401 4,102 26,503 16,771 2,999 19,770 640,770 211,322 852,092 453,987 132,080 586,067
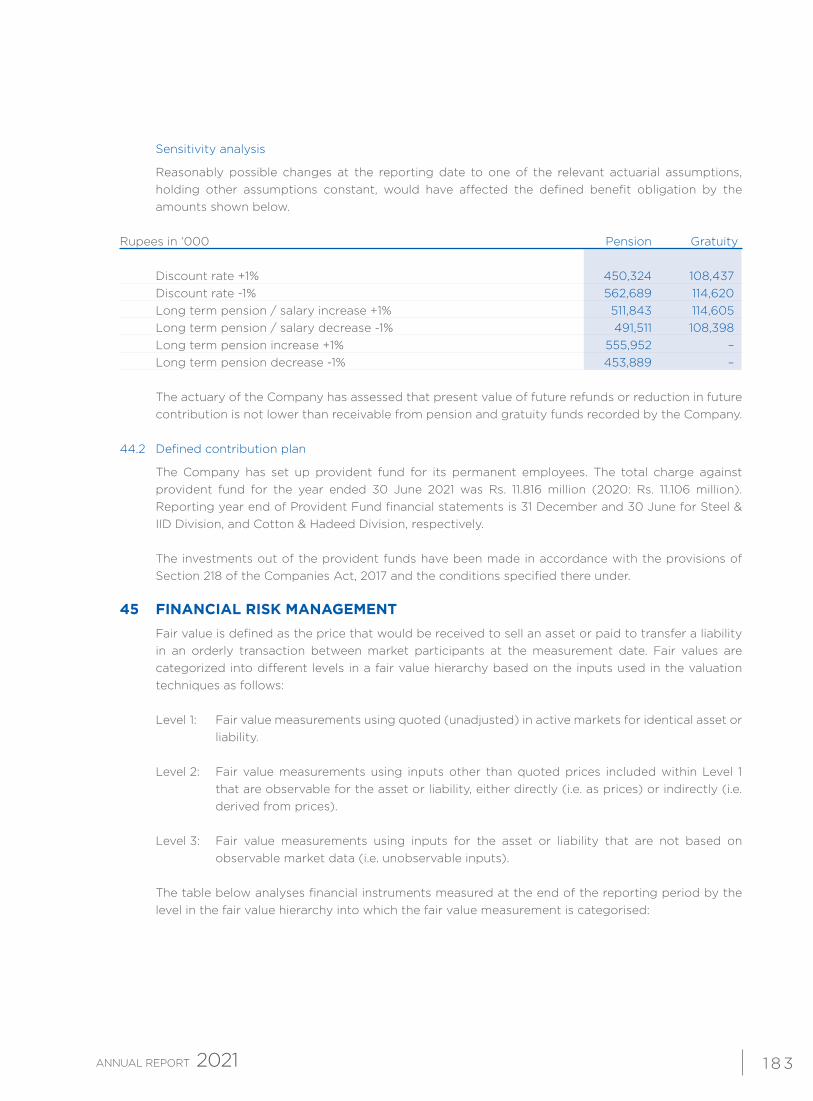
1 8 3
Sensitivity analysis
Reasonably possible changes at the reporting date to one of the relevant actuarial assumptions, holding other assumptions constant, would have affected the defined benefit obligation by the amounts shown below.
Rupees in ‘000 Pension Gratuity Discount rate +1% 450,324 108,437 Discount rate -1% 562,689 114,620 Long term pension / salary increase +1% 511,843 114,605 Long term pension / salary decrease -1% 491,511 108,398 Long term pension increase +1% 555,952 – Long term pension decrease -1% 453,889 – The actuary of the Company has assessed that present value of future refunds or reduction in future
contribution is not lower than receivable from pension and gratuity funds recorded by the Company. 44.2 Defined contribution plan
The Company has set up provident fund for its permanent employees. The total charge against provident fund for the year ended 30 June 2021 was Rs. 11.816 million (2020: Rs. 11.106 million). Reporting year end of Provident Fund financial statements is 31 December and 30 June for Steel & IID Division, and Cotton & Hadeed Division, respectively.
The investments out of the provident funds have been made in accordance with the provisions of
Section 218 of the Companies Act, 2017 and the conditions specified there under.
45 FINANCIAL RISK MANAGEMENT Fair value is defined as the price that would be received to sell an asset or paid to transfer a liability
in an orderly transaction between market participants at the measurement date. Fair values are categorized into different levels in a fair value hierarchy based on the inputs used in the valuation techniques as follows:
Level 1: Fair value measurements using quoted (unadjusted) in active markets for identical asset or
liability. Level 2: Fair value measurements using inputs other than quoted prices included within Level 1
that are observable for the asset or liability, either directly (i.e. as prices) or indirectly (i.e. derived from prices).
Level 3: Fair value measurements using inputs for the asset or liability that are not based on
observable market data (i.e. unobservable inputs). The table below analyses financial instruments measured at the end of the reporting period by the
level in the fair value hierarchy into which the fair value measurement is categorised:
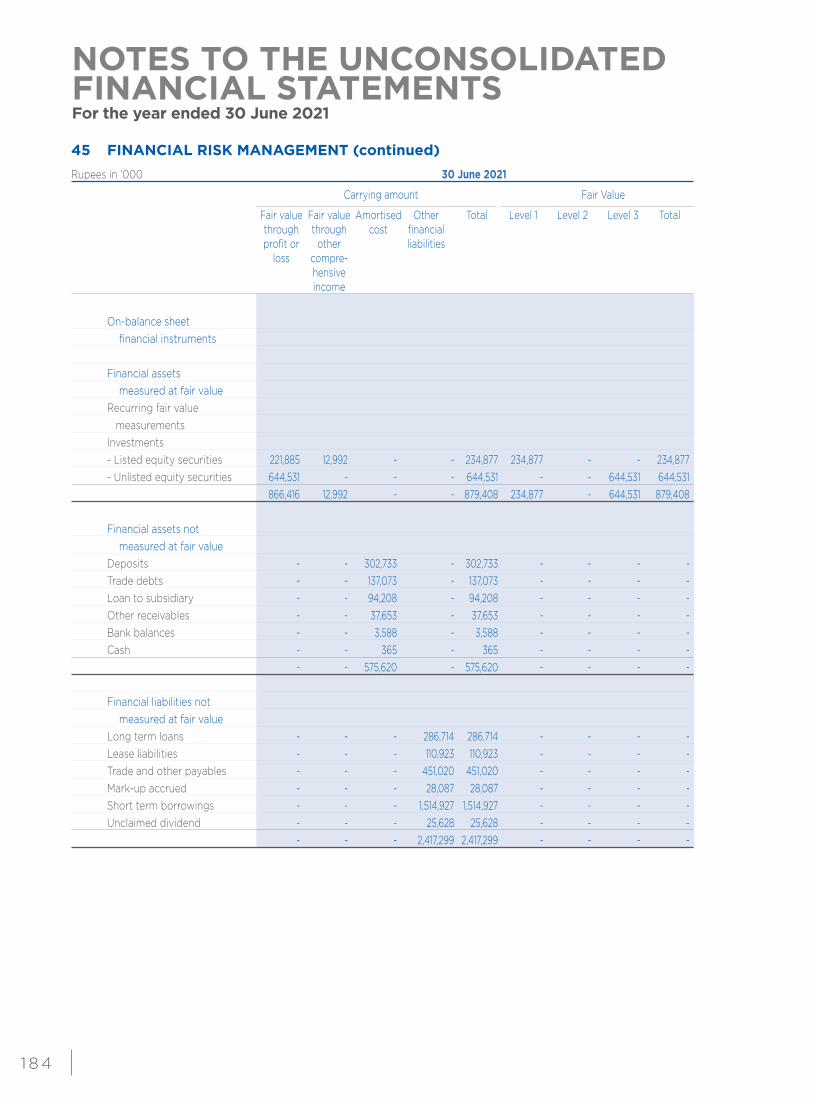
NOTES TO THE UNCONSOLIDATED FINANCIAL STATEMENTSFor the year ended 30 June 2021
1 8 4
45 FINANCIAL RISK MANAGEMENT (continued) Rupees in ‘000 30 June 2021
Carrying amount Fair Value
Fair value Fair value Amortised Other Total Level 1 Level 2 Level 3 Total through through cost financial profit or other liabilities loss compre- hensive income
On-balance sheet financial instruments Financial assets measured at fair value Recurring fair value measurements Investments - Listed equity securities 221,885 12,992 - - 234,877 234,877 - - 234,877 - Unlisted equity securities 644,531 - - - 644,531 - - 644,531 644,531 866,416 12,992 - - 879,408 234,877 - 644,531 879,408
Financial assets not measured at fair value Deposits - - 302,733 - 302,733 - - - - Trade debts - - 137,073 - 137,073 - - - - Loan to subsidiary - - 94,208 - 94,208 - - - - Other receivables - - 37,653 - 37,653 - - - - Bank balances - - 3,588 - 3,588 - - - - Cash - - 365 - 365 - - - - - - 575,620 - 575,620 - - - - Financial liabilities not measured at fair value Long term loans - - - 286,714 286,714 - - - - Lease liabilities - - - 110,923 110,923 - - - - Trade and other payables - - - 451,020 451,020 - - - - Mark-up accrued - - - 28,087 28,087 - - - - Short term borrowings - - - 1,514,927 1,514,927 - - - - Unclaimed dividend - - - 25,628 25,628 - - - - - - - 2,417,299 2,417,299 - - - -
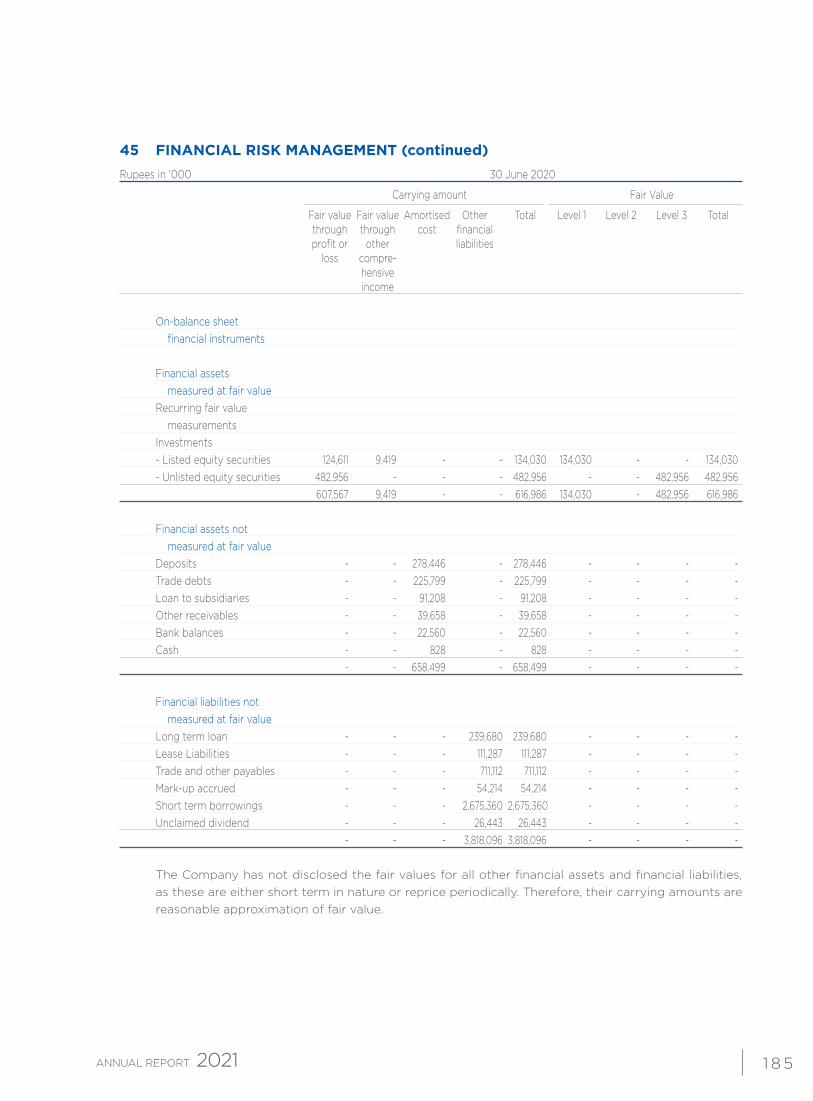
1 8 5
45 FINANCIAL RISK MANAGEMENT (continued) Rupees in ‘000 30 June 2020
Carrying amount Fair Value
Fair value Fair value Amortised Other Total Level 1 Level 2 Level 3 Total through through cost financial profit or other liabilities loss compre- hensive income On-balance sheet financial instruments Financial assets measured at fair value Recurring fair value measurements Investments - Listed equity securities 124,611 9,419 - - 134,030 134,030 - - 134,030 - Unlisted equity securities 482,956 - - - 482,956 - - 482,956 482,956 607,567 9,419 - - 616,986 134,030 - 482,956 616,986
Financial assets not measured at fair value Deposits - - 278,446 - 278,446 - - - - Trade debts - - 225,799 - 225,799 - - - - Loan to subsidiaries - - 91,208 - 91,208 - - - - Other receivables - - 39,658 - 39,658 - - - - Bank balances - - 22,560 - 22,560 - - - - Cash - - 828 - 828 - - - - - - 658,499 - 658,499 - - - - Financial liabilities not measured at fair value Long term loan - - - 239,680 239,680 - - - - Lease Liabilities - - - 111,287 111,287 - - - - Trade and other payables - - - 711,112 711,112 - - - - Mark-up accrued - - - 54,214 54,214 - - - - Short term borrowings - - - 2,675,360 2,675,360 - - - - Unclaimed dividend - - - 26,443 26,443 - - - - - - - 3,818,096 3,818,096 - - - - The Company has not disclosed the fair values for all other financial assets and financial liabilities,
as these are either short term in nature or reprice periodically. Therefore, their carrying amounts are reasonable approximation of fair value.
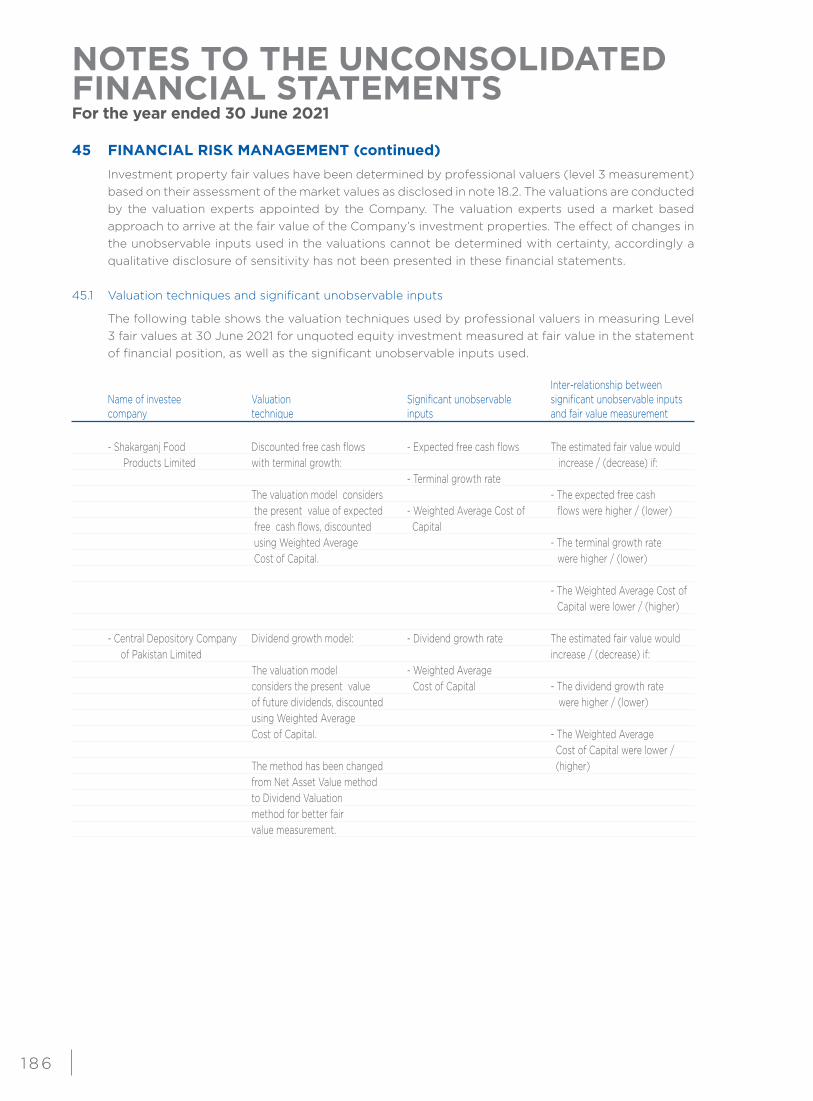
NOTES TO THE UNCONSOLIDATED FINANCIAL STATEMENTSFor the year ended 30 June 2021
1 8 6
45 FINANCIAL RISK MANAGEMENT (continued) Investment property fair values have been determined by professional valuers (level 3 measurement)
based on their assessment of the market values as disclosed in note 18.2. The valuations are conducted by the valuation experts appointed by the Company. The valuation experts used a market based approach to arrive at the fair value of the Company’s investment properties. The effect of changes in the unobservable inputs used in the valuations cannot be determined with certainty, accordingly a qualitative disclosure of sensitivity has not been presented in these financial statements.
45.1 Valuation techniques and significant unobservable inputs
The following table shows the valuation techniques used by professional valuers in measuring Level 3 fair values at 30 June 2021 for unquoted equity investment measured at fair value in the statement of financial position, as well as the significant unobservable inputs used.
Inter-relationship between Name of investee Valuation Significant unobservable significant unobservable inputs company technique inputs and fair value measurement - Shakarganj Food Discounted free cash flows - Expected free cash flows The estimated fair value would Products Limited with terminal growth: increase / (decrease) if: - Terminal growth rate The valuation model considers - The expected free cash the present value of expected - Weighted Average Cost of flows were higher / (lower) free cash flows, discounted Capital using Weighted Average - The terminal growth rate Cost of Capital. were higher / (lower)
- The Weighted Average Cost of Capital were lower / (higher)
- Central Depository Company Dividend growth model: - Dividend growth rate The estimated fair value would of Pakistan Limited increase / (decrease) if: The valuation model - Weighted Average considers the present value Cost of Capital - The dividend growth rate of future dividends, discounted were higher / (lower) using Weighted Average Cost of Capital. - The Weighted Average Cost of Capital were lower / The method has been changed (higher) from Net Asset Value method to Dividend Valuation method for better fair value measurement.
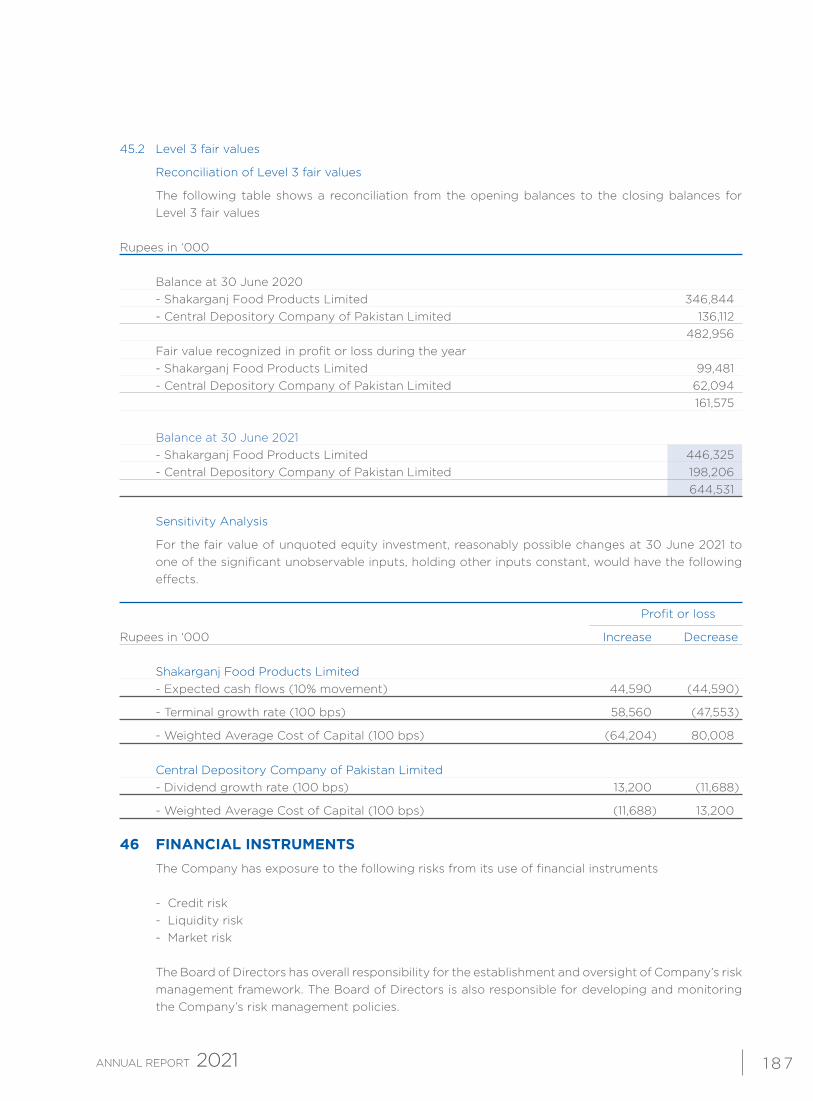
1 87
45.2 Level 3 fair values
Reconciliation of Level 3 fair values
The following table shows a reconciliation from the opening balances to the closing balances for Level 3 fair values
Rupees in ‘000 Balance at 30 June 2020 - Shakarganj Food Products Limited 346,844 - Central Depository Company of Pakistan Limited 136,112 482,956 Fair value recognized in profit or loss during the year - Shakarganj Food Products Limited 99,481 - Central Depository Company of Pakistan Limited 62,094 161,575 Balance at 30 June 2021 - Shakarganj Food Products Limited 446,325 - Central Depository Company of Pakistan Limited 198,206 644,531
Sensitivity Analysis
For the fair value of unquoted equity investment, reasonably possible changes at 30 June 2021 to one of the significant unobservable inputs, holding other inputs constant, would have the following effects.
Profit or loss
Rupees in ‘000 Increase Decrease Shakarganj Food Products Limited - Expected cash flows (10% movement) 44,590 (44,590)
- Terminal growth rate (100 bps) 58,560 (47,553)
- Weighted Average Cost of Capital (100 bps) (64,204) 80,008 Central Depository Company of Pakistan Limited - Dividend growth rate (100 bps) 13,200 (11,688)
- Weighted Average Cost of Capital (100 bps) (11,688) 13,200
46 FINANCIAL INSTRUMENTS
The Company has exposure to the following risks from its use of financial instruments
- Credit risk - Liquidity risk - Market risk The Board of Directors has overall responsibility for the establishment and oversight of Company’s risk
management framework. The Board of Directors is also responsible for developing and monitoring the Company’s risk management policies.
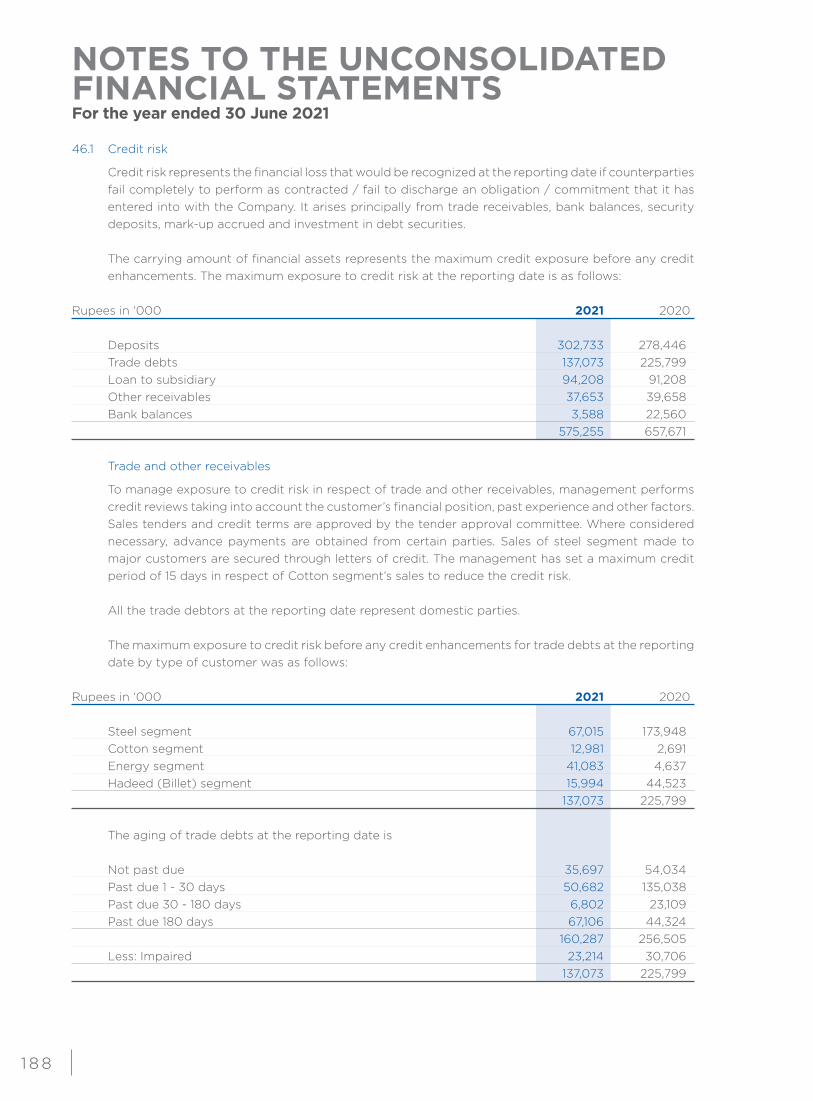
NOTES TO THE UNCONSOLIDATED FINANCIAL STATEMENTSFor the year ended 30 June 2021
1 8 8
46.1 Credit risk
Credit risk represents the financial loss that would be recognized at the reporting date if counterparties fail completely to perform as contracted / fail to discharge an obligation / commitment that it has entered into with the Company. It arises principally from trade receivables, bank balances, security deposits, mark-up accrued and investment in debt securities.
The carrying amount of financial assets represents the maximum credit exposure before any credit
enhancements. The maximum exposure to credit risk at the reporting date is as follows:
Rupees in ‘000 2021 2020 Deposits 302,733 278,446 Trade debts 137,073 225,799 Loan to subsidiary 94,208 91,208 Other receivables 37,653 39,658 Bank balances 3,588 22,560 575,255 657,671 Trade and other receivables
To manage exposure to credit risk in respect of trade and other receivables, management performs credit reviews taking into account the customer’s financial position, past experience and other factors. Sales tenders and credit terms are approved by the tender approval committee. Where considered necessary, advance payments are obtained from certain parties. Sales of steel segment made to major customers are secured through letters of credit. The management has set a maximum credit period of 15 days in respect of Cotton segment’s sales to reduce the credit risk.
All the trade debtors at the reporting date represent domestic parties. The maximum exposure to credit risk before any credit enhancements for trade debts at the reporting
date by type of customer was as follows:
Rupees in ‘000 2021 2020
Steel segment 67,015 173,948 Cotton segment 12,981 2,691 Energy segment 41,083 4,637 Hadeed (Billet) segment 15,994 44,523 137,073 225,799 The aging of trade debts at the reporting date is Not past due 35,697 54,034 Past due 1 - 30 days 50,682 135,038 Past due 30 - 180 days 6,802 23,109 Past due 180 days 67,106 44,324 160,287 256,505 Less: Impaired 23,214 30,706 137,073 225,799
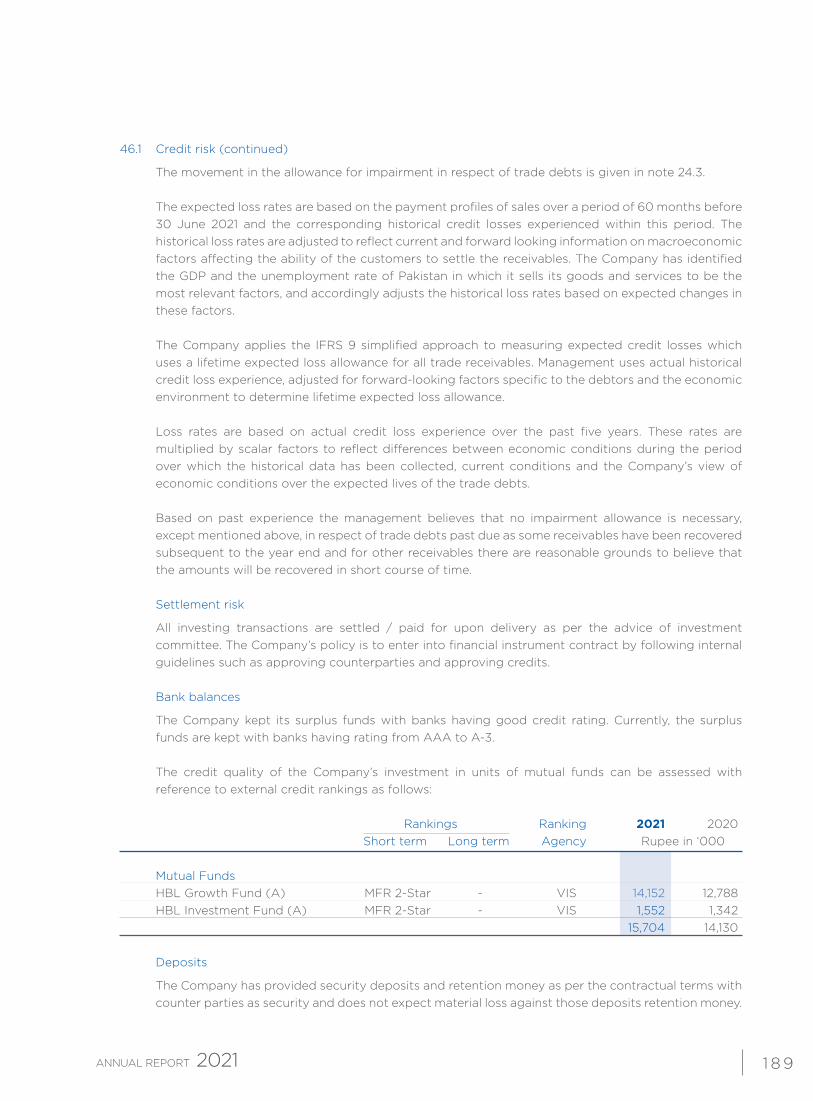
1 8 9
46.1 Credit risk (continued)
The movement in the allowance for impairment in respect of trade debts is given in note 24.3. The expected loss rates are based on the payment profiles of sales over a period of 60 months before
30 June 2021 and the corresponding historical credit losses experienced within this period. The historical loss rates are adjusted to reflect current and forward looking information on macroeconomic factors affecting the ability of the customers to settle the receivables. The Company has identified the GDP and the unemployment rate of Pakistan in which it sells its goods and services to be the most relevant factors, and accordingly adjusts the historical loss rates based on expected changes in these factors.
The Company applies the IFRS 9 simplified approach to measuring expected credit losses which uses a lifetime expected loss allowance for all trade receivables. Management uses actual historical credit loss experience, adjusted for forward-looking factors specific to the debtors and the economic environment to determine lifetime expected loss allowance.
Loss rates are based on actual credit loss experience over the past five years. These rates are
multiplied by scalar factors to reflect differences between economic conditions during the period over which the historical data has been collected, current conditions and the Company’s view of economic conditions over the expected lives of the trade debts.
Based on past experience the management believes that no impairment allowance is necessary,
except mentioned above, in respect of trade debts past due as some receivables have been recovered subsequent to the year end and for other receivables there are reasonable grounds to believe that the amounts will be recovered in short course of time.
Settlement risk
All investing transactions are settled / paid for upon delivery as per the advice of investment committee. The Company’s policy is to enter into financial instrument contract by following internal guidelines such as approving counterparties and approving credits.
Bank balances
The Company kept its surplus funds with banks having good credit rating. Currently, the surplus funds are kept with banks having rating from AAA to A-3.
The credit quality of the Company’s investment in units of mutual funds can be assessed with
reference to external credit rankings as follows: Rankings Ranking 2021 2020 Short term Long term Agency Rupee in ‘000 Mutual Funds HBL Growth Fund (A) MFR 2-Star - VIS 14,152 12,788 HBL Investment Fund (A) MFR 2-Star - VIS 1,552 1,342 15,704 14,130 Deposits
The Company has provided security deposits and retention money as per the contractual terms with counter parties as security and does not expect material loss against those deposits retention money.
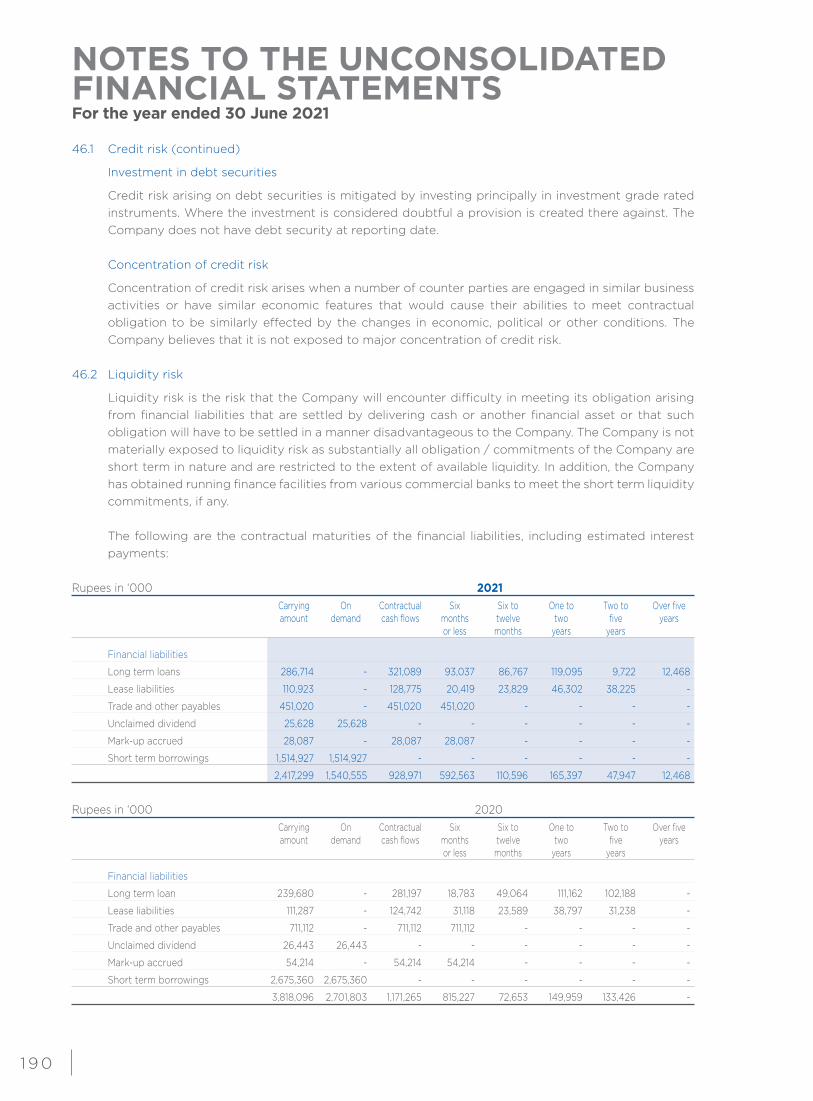
NOTES TO THE UNCONSOLIDATED FINANCIAL STATEMENTSFor the year ended 30 June 2021
1 9 0
46.1 Credit risk (continued)
Investment in debt securities
Credit risk arising on debt securities is mitigated by investing principally in investment grade rated instruments. Where the investment is considered doubtful a provision is created there against. The Company does not have debt security at reporting date.
Concentration of credit risk
Concentration of credit risk arises when a number of counter parties are engaged in similar business activities or have similar economic features that would cause their abilities to meet contractual obligation to be similarly effected by the changes in economic, political or other conditions. The Company believes that it is not exposed to major concentration of credit risk.
46.2 Liquidity risk
Liquidity risk is the risk that the Company will encounter difficulty in meeting its obligation arising from financial liabilities that are settled by delivering cash or another financial asset or that such obligation will have to be settled in a manner disadvantageous to the Company. The Company is not materially exposed to liquidity risk as substantially all obligation / commitments of the Company are short term in nature and are restricted to the extent of available liquidity. In addition, the Company has obtained running finance facilities from various commercial banks to meet the short term liquidity commitments, if any.
The following are the contractual maturities of the financial liabilities, including estimated interest payments:
Rupees in ‘000 2021 Carrying On Contractual Six Six to One to Two to Over five amount demand cash flows months twelve two five years or less months years years
Financial liabilities
Long term loans 286,714 - 321,089 93,037 86,767 119,095 9,722 12,468
Lease liabilities 110,923 - 128,775 20,419 23,829 46,302 38,225 -
Trade and other payables 451,020 - 451,020 451,020 - - - -
Unclaimed dividend 25,628 25,628 - - - - - -
Mark-up accrued 28,087 - 28,087 28,087 - - - -
Short term borrowings 1,514,927 1,514,927 - - - - - -
2,417,299 1,540,555 928,971 592,563 110,596 165,397 47,947 12,468
Rupees in ‘000 2020 Carrying On Contractual Six Six to One to Two to Over five amount demand cash flows months twelve two five years or less months years years
Financial liabilities
Long term loan 239,680 - 281,197 18,783 49,064 111,162 102,188 -
Lease liabilities 111,287 - 124,742 31,118 23,589 38,797 31,238 -
Trade and other payables 711,112 - 711,112 711,112 - - - -
Unclaimed dividend 26,443 26,443 - - - - - -
Mark-up accrued 54,214 - 54,214 54,214 - - - -
Short term borrowings 2,675,360 2,675,360 - - - - - -
3,818,096 2,701,803 1,171,265 815,227 72,653 149,959 133,426 -
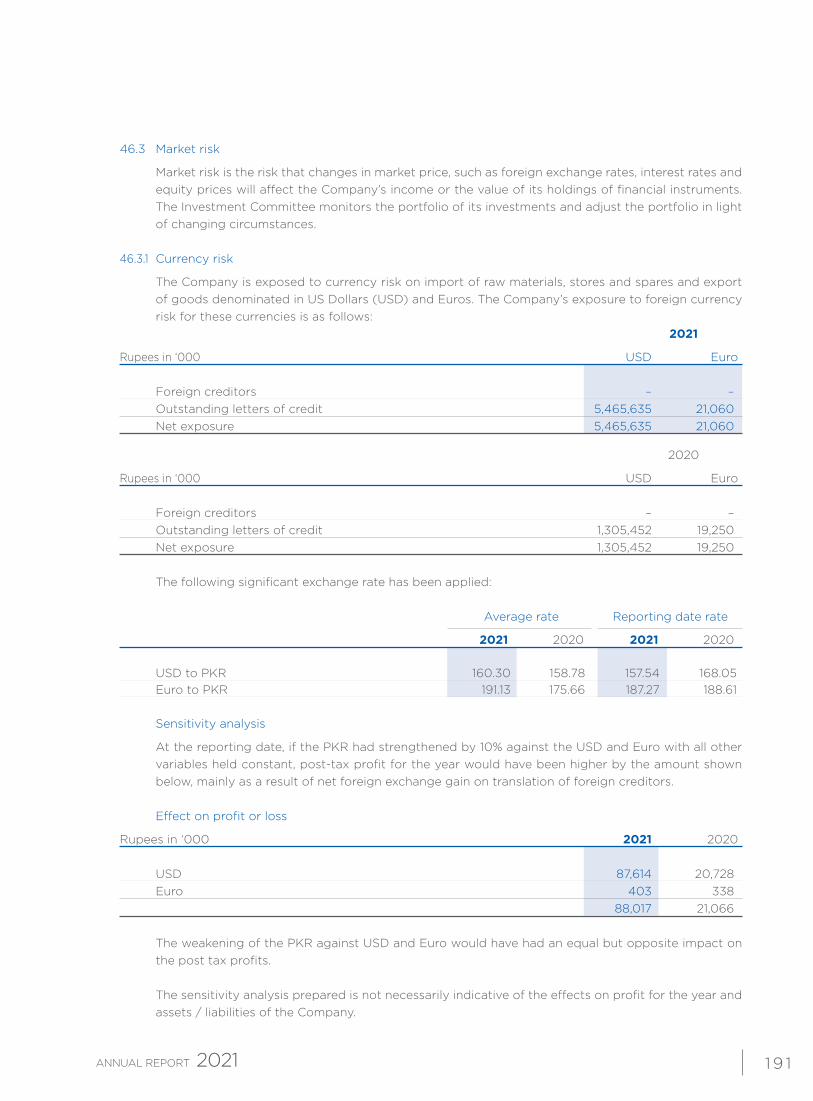
1 9 1
46.3 Market risk
Market risk is the risk that changes in market price, such as foreign exchange rates, interest rates and equity prices will affect the Company’s income or the value of its holdings of financial instruments. The Investment Committee monitors the portfolio of its investments and adjust the portfolio in light of changing circumstances.
46.3.1 Currency risk
The Company is exposed to currency risk on import of raw materials, stores and spares and export of goods denominated in US Dollars (USD) and Euros. The Company’s exposure to foreign currency risk for these currencies is as follows:
2021
Rupees in ‘000 USD Euro Foreign creditors – – Outstanding letters of credit 5,465,635 21,060 Net exposure 5,465,635 21,060
2020
Rupees in ‘000 USD Euro Foreign creditors – – Outstanding letters of credit 1,305,452 19,250 Net exposure 1,305,452 19,250 The following significant exchange rate has been applied:
Average rate Reporting date rate
2021 2020 2021 2020 USD to PKR 160.30 158.78 157.54 168.05 Euro to PKR 191.13 175.66 187.27 188.61
Sensitivity analysis
At the reporting date, if the PKR had strengthened by 10% against the USD and Euro with all other variables held constant, post-tax profit for the year would have been higher by the amount shown below, mainly as a result of net foreign exchange gain on translation of foreign creditors.
Effect on profit or loss
Rupees in ‘000 2021 2020
USD 87,614 20,728 Euro 403 338 88,017 21,066 The weakening of the PKR against USD and Euro would have had an equal but opposite impact on
the post tax profits. The sensitivity analysis prepared is not necessarily indicative of the effects on profit for the year and
assets / liabilities of the Company.
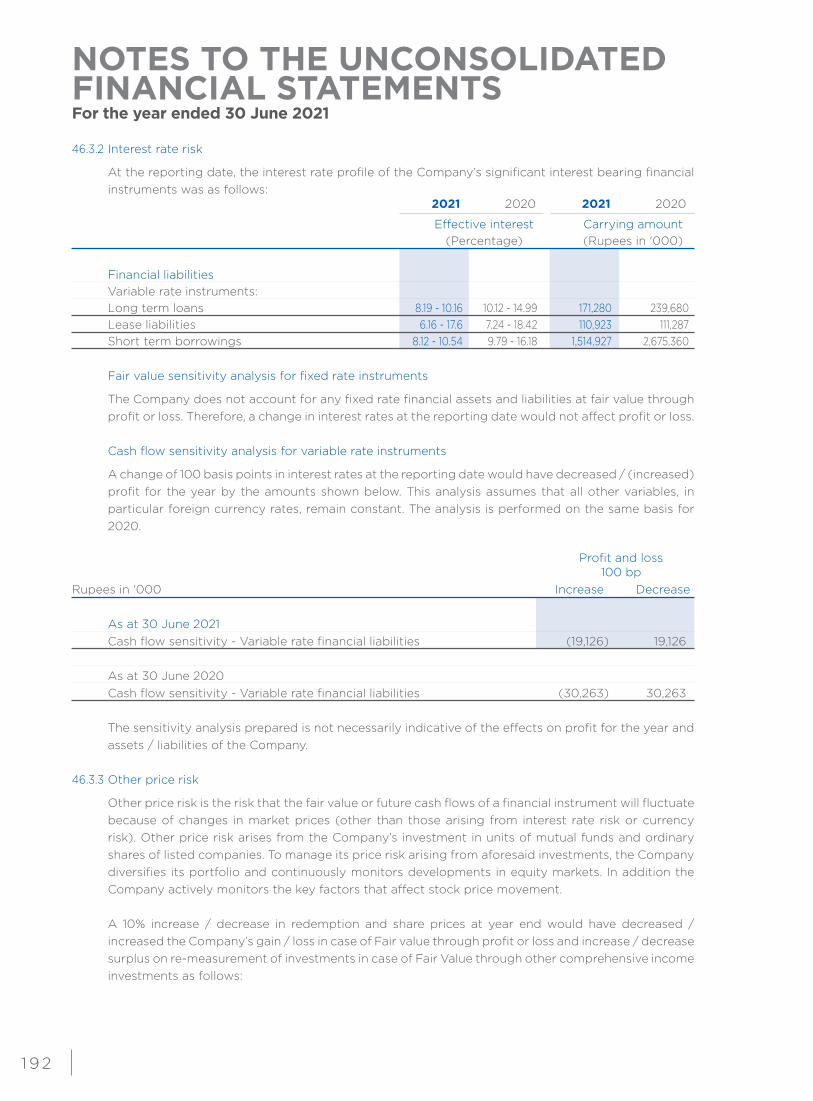
NOTES TO THE UNCONSOLIDATED FINANCIAL STATEMENTSFor the year ended 30 June 2021
1 9 2
46.3.2 Interest rate risk
At the reporting date, the interest rate profile of the Company’s significant interest bearing financial instruments was as follows:
2021 2020 2021 2020
Effective interest Carrying amount (Percentage) (Rupees in '000) Financial liabilities Variable rate instruments: Long term loans 8.19 - 10.16 10.12 - 14.99 171,280 239,680 Lease liabilities 6.16 - 17.6 7.24 - 18.42 110,923 111,287 Short term borrowings 8.12 - 10.54 9.79 - 16.18 1,514,927 2,675,360 Fair value sensitivity analysis for fixed rate instruments
The Company does not account for any fixed rate financial assets and liabilities at fair value through profit or loss. Therefore, a change in interest rates at the reporting date would not affect profit or loss.
Cash flow sensitivity analysis for variable rate instruments
A change of 100 basis points in interest rates at the reporting date would have decreased / (increased) profit for the year by the amounts shown below. This analysis assumes that all other variables, in particular foreign currency rates, remain constant. The analysis is performed on the same basis for 2020.
Profit and loss 100 bpRupees in ‘000 Increase Decrease As at 30 June 2021 Cash flow sensitivity - Variable rate financial liabilities (19,126) 19,126 As at 30 June 2020 Cash flow sensitivity - Variable rate financial liabilities (30,263) 30,263 The sensitivity analysis prepared is not necessarily indicative of the effects on profit for the year and
assets / liabilities of the Company. 46.3.3 Other price risk
Other price risk is the risk that the fair value or future cash flows of a financial instrument will fluctuate because of changes in market prices (other than those arising from interest rate risk or currency risk). Other price risk arises from the Company’s investment in units of mutual funds and ordinary shares of listed companies. To manage its price risk arising from aforesaid investments, the Company diversifies its portfolio and continuously monitors developments in equity markets. In addition the Company actively monitors the key factors that affect stock price movement.
A 10% increase / decrease in redemption and share prices at year end would have decreased / increased the Company’s gain / loss in case of Fair value through profit or loss and increase / decrease surplus on re-measurement of investments in case of Fair Value through other comprehensive income investments as follows:
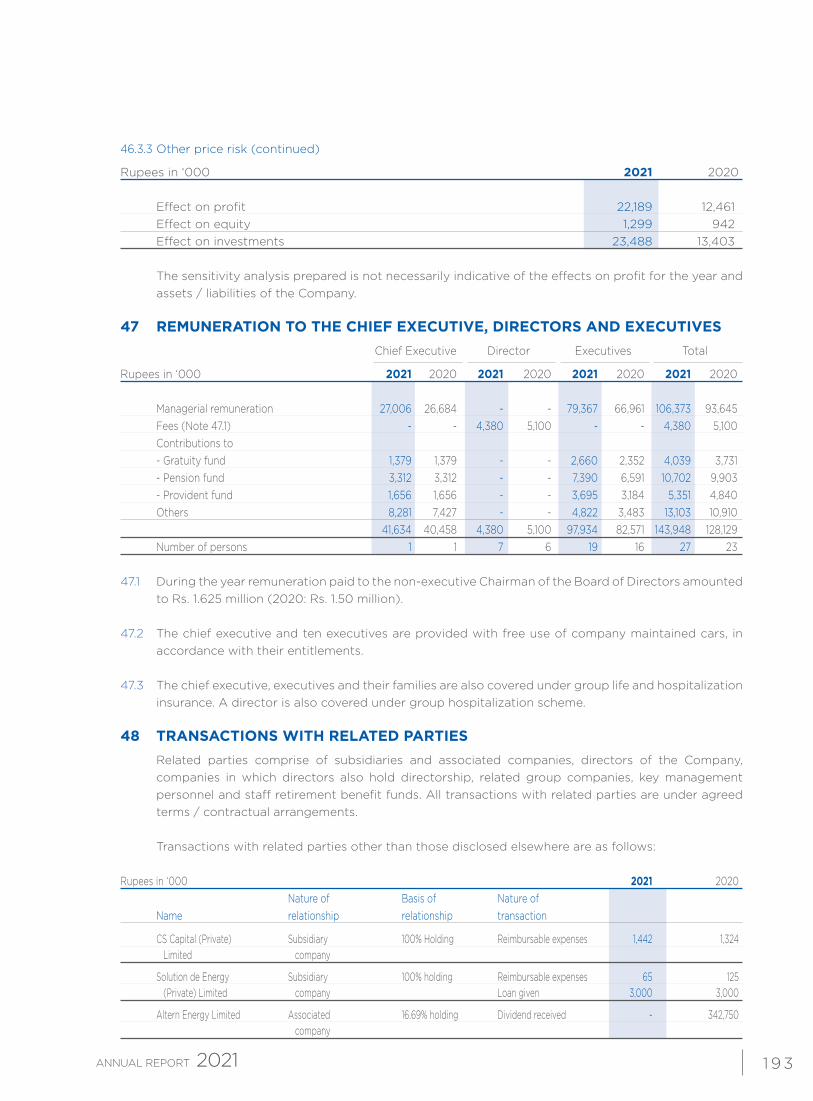
1 9 3
46.3.3 Other price risk (continued)
Rupees in ‘000 2021 2020 Effect on profit 22,189 12,461 Effect on equity 1,299 942 Effect on investments 23,488 13,403 The sensitivity analysis prepared is not necessarily indicative of the effects on profit for the year and
assets / liabilities of the Company.
47 REMUNERATION TO THE CHIEF EXECUTIVE, DIRECTORS AND EXECUTIVES Chief Executive Director Executives Total
Rupees in ‘000 2021 2020 2021 2020 2021 2020 2021 2020 Managerial remuneration 27,006 26,684 - - 79,367 66,961 106,373 93,645 Fees (Note 47.1) - - 4,380 5,100 - - 4,380 5,100 Contributions to - Gratuity fund 1,379 1,379 - - 2,660 2,352 4,039 3,731 - Pension fund 3,312 3,312 - - 7,390 6,591 10,702 9,903 - Provident fund 1,656 1,656 - - 3,695 3,184 5,351 4,840 Others 8,281 7,427 - - 4,822 3,483 13,103 10,910 41,634 40,458 4,380 5,100 97,934 82,571 143,948 128,129 Number of persons 1 1 7 6 19 16 27 23 47.1 During the year remuneration paid to the non-executive Chairman of the Board of Directors amounted
to Rs. 1.625 million (2020: Rs. 1.50 million). 47.2 The chief executive and ten executives are provided with free use of company maintained cars, in
accordance with their entitlements. 47.3 The chief executive, executives and their families are also covered under group life and hospitalization
insurance. A director is also covered under group hospitalization scheme.
48 TRANSACTIONS WITH RELATED PARTIES Related parties comprise of subsidiaries and associated companies, directors of the Company,
companies in which directors also hold directorship, related group companies, key management personnel and staff retirement benefit funds. All transactions with related parties are under agreed terms / contractual arrangements.
Transactions with related parties other than those disclosed elsewhere are as follows: Rupees in ‘000 2021 2020 Nature of Basis of Nature of Name relationship relationship transaction
CS Capital (Private) Subsidiary 100% Holding Reimbursable expenses 1,442 1,324 Limited company
Solution de Energy Subsidiary 100% holding Reimbursable expenses 65 125 (Private) Limited company Loan given 3,000 3,000
Altern Energy Limited Associated 16.69% holding Dividend received - 342,750 company
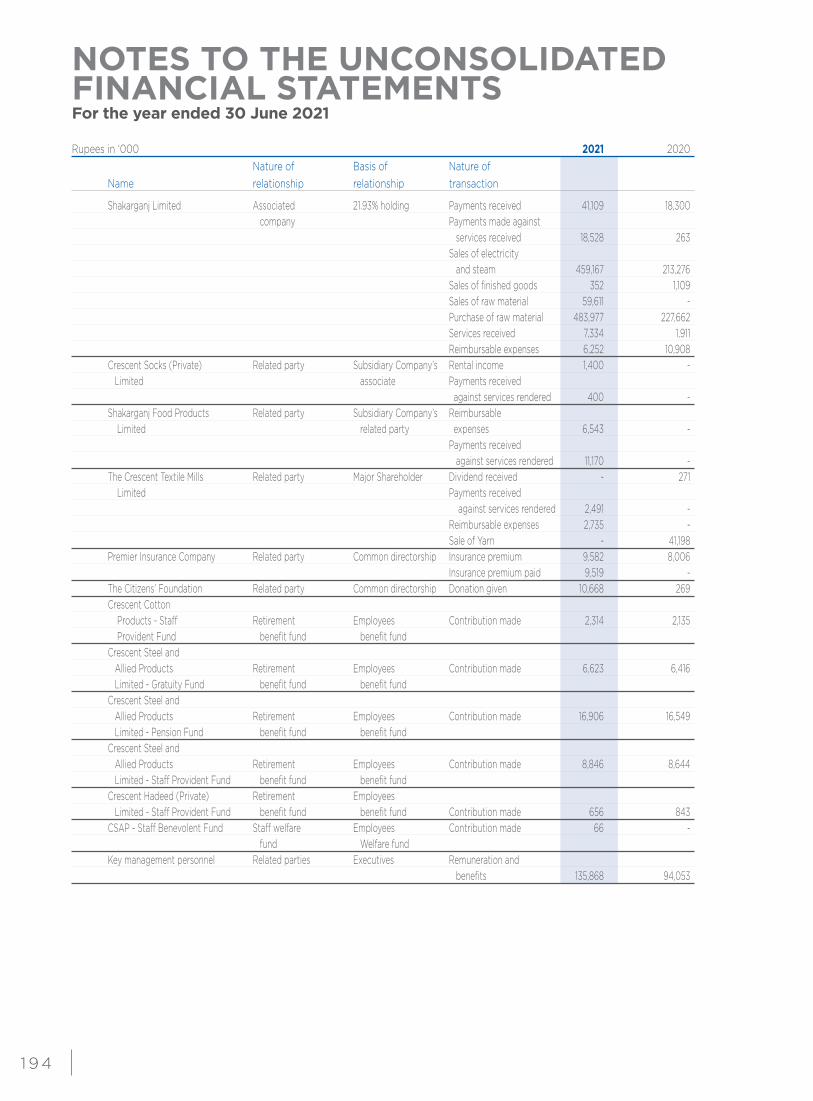
NOTES TO THE UNCONSOLIDATED FINANCIAL STATEMENTSFor the year ended 30 June 2021
1 9 4
Rupees in ‘000 2021 2020 Nature of Basis of Nature of Name relationship relationship transaction
Shakarganj Limited Associated 21.93% holding Payments received 41,109 18,300 company Payments made against services received 18,528 263 Sales of electricity and steam 459,167 213,276 Sales of finished goods 352 1,109 Sales of raw material 59,611 - Purchase of raw material 483,977 227,662 Services received 7,334 1,911 Reimbursable expenses 6,252 10,908 Crescent Socks (Private) Related party Subsidiary Company’s Rental income 1,400 - Limited associate Payments received against services rendered 400 - Shakarganj Food Products Related party Subsidiary Company’s Reimbursable Limited related party expenses 6,543 - Payments received against services rendered 11,170 - The Crescent Textile Mills Related party Major Shareholder Dividend received - 271 Limited Payments received against services rendered 2,491 - Reimbursable expenses 2,735 - Sale of Yarn - 41,198 Premier Insurance Company Related party Common directorship Insurance premium 9,582 8,006 Insurance premium paid 9,519 - The Citizens’ Foundation Related party Common directorship Donation given 10,668 269 Crescent Cotton Products - Staff Retirement Employees Contribution made 2,314 2,135 Provident Fund benefit fund benefit fund Crescent Steel and Allied Products Retirement Employees Contribution made 6,623 6,416 Limited - Gratuity Fund benefit fund benefit fund Crescent Steel and Allied Products Retirement Employees Contribution made 16,906 16,549 Limited - Pension Fund benefit fund benefit fund Crescent Steel and Allied Products Retirement Employees Contribution made 8,846 8,644 Limited - Staff Provident Fund benefit fund benefit fund Crescent Hadeed (Private) Retirement Employees Limited - Staff Provident Fund benefit fund benefit fund Contribution made 656 843 CSAP - Staff Benevolent Fund Staff welfare Employees Contribution made 66 - fund Welfare fund Key management personnel Related parties Executives Remuneration and benefits 135,868 94,053
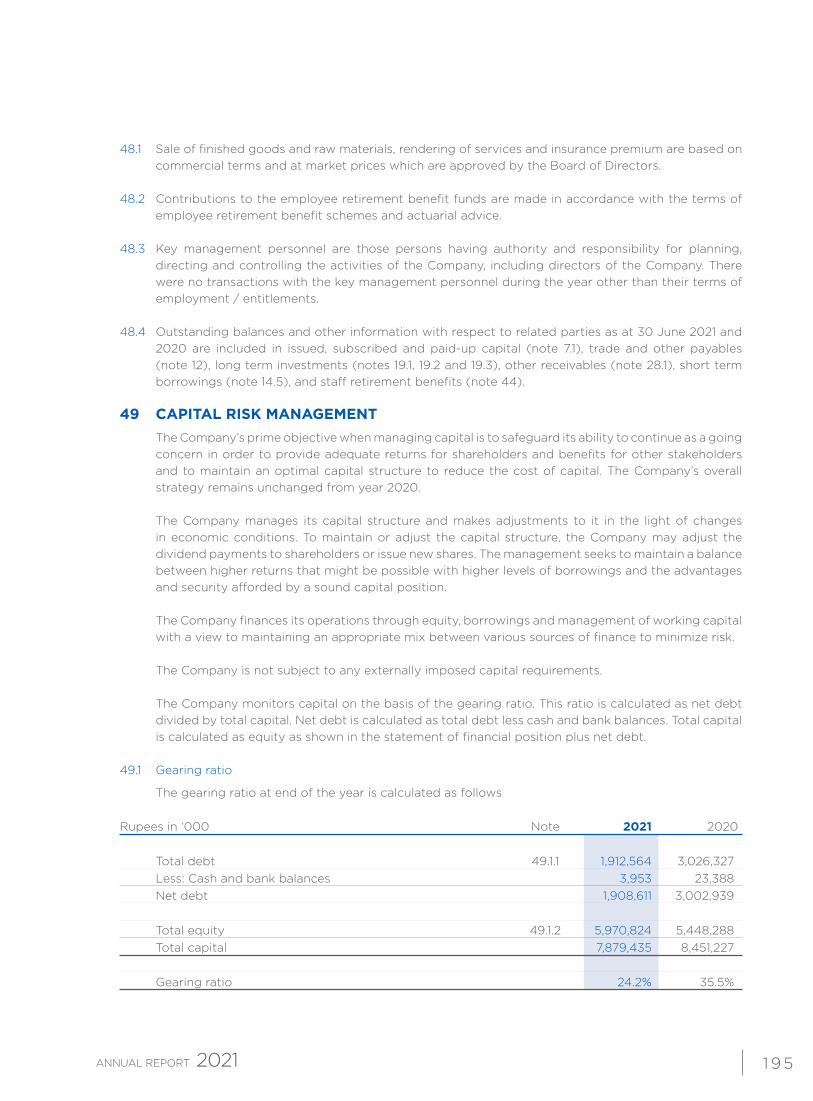
1 9 5
48.1 Sale of finished goods and raw materials, rendering of services and insurance premium are based on commercial terms and at market prices which are approved by the Board of Directors.
48.2 Contributions to the employee retirement benefit funds are made in accordance with the terms of
employee retirement benefit schemes and actuarial advice. 48.3 Key management personnel are those persons having authority and responsibility for planning,
directing and controlling the activities of the Company, including directors of the Company. There were no transactions with the key management personnel during the year other than their terms of employment / entitlements.
48.4 Outstanding balances and other information with respect to related parties as at 30 June 2021 and
2020 are included in issued, subscribed and paid-up capital (note 7.1), trade and other payables (note 12), long term investments (notes 19.1, 19.2 and 19.3), other receivables (note 28.1), short term borrowings (note 14.5), and staff retirement benefits (note 44).
49 CAPITAL RISK MANAGEMENT The Company’s prime objective when managing capital is to safeguard its ability to continue as a going
concern in order to provide adequate returns for shareholders and benefits for other stakeholders and to maintain an optimal capital structure to reduce the cost of capital. The Company’s overall strategy remains unchanged from year 2020.
The Company manages its capital structure and makes adjustments to it in the light of changes
in economic conditions. To maintain or adjust the capital structure, the Company may adjust the dividend payments to shareholders or issue new shares. The management seeks to maintain a balance between higher returns that might be possible with higher levels of borrowings and the advantages and security afforded by a sound capital position.
The Company finances its operations through equity, borrowings and management of working capital
with a view to maintaining an appropriate mix between various sources of finance to minimize risk. The Company is not subject to any externally imposed capital requirements. The Company monitors capital on the basis of the gearing ratio. This ratio is calculated as net debt
divided by total capital. Net debt is calculated as total debt less cash and bank balances. Total capital is calculated as equity as shown in the statement of financial position plus net debt.
49.1 Gearing ratio
The gearing ratio at end of the year is calculated as follows
Rupees in ‘000 Note 2021 2020 Total debt 49.1.1 1,912,564 3,026,327 Less: Cash and bank balances 3,953 23,388 Net debt 1,908,611 3,002,939 Total equity 49.1.2 5,970,824 5,448,288 Total capital 7,879,435 8,451,227 Gearing ratio 24.2% 35.5%
NOTES TO THE UNCONSOLIDATED FINANCIAL STATEMENTSFor the year ended 30 June 2021
1 9 6
49.1.1 Total debt is defined as long term, lease liabilities and short term borrowings (excluding derivatives), as described in notes 9, 10 and 14 to these unconsolidated financial statements.
49.1.2 Total equity includes issued, subscribed and paid-up capital and reserves. 50 PLANT CAPACITY AND PRODUCTION 50.1 Steel segment
Pipe plant
The plant’s installed / rated capacity for production based on single shift is 66,667 tons (2020: 66,667 tons) annually on the basis of notional pipe size (Where as the notional pipe size is taken as 30” dia x ½” thickness for SP1600 and 40”dia x 5/8” thickness for SP 2003). The actual production achieved during the year was 15,400 tons (2020: 7,965 tons) line pipes of varied sizes and thickness. Actual production is equivalent to 52,113 tons (2020: 34,527 tons) when translated to the notional pipe size of 30” diameter. Reason for underutilization was delay in materialization of orders for different projects.
Coating plant
The coating plant has a capacity of shot blasting and coating of line pipes with single layer FBE and multilayer polyolefin coatings on pipe sizes ranging from 114 mm to 1,524 mm outside dia.
The annual capacity of the plant works out to 600,000 square meters outside surface area of line
pipes based on notional size of 14” dia on single shift working. Coating of 30,528 meters (2020: 128,416 meters) of different dia pipes 22,587 square meters surface area was achieved during the year (2020: 88,647 square meters surface area). Reason for underutilization was lack of coating work orders in hand.
Steel melting plant
The designed capacity of Plant is 85,000 mtons (2020: 85,000 mtons) of billets per annum, but the total production during FY20-21 was 20,949.62 mtons (2020: 10,894 mtons) of billets. Unit operated only for about five months on self-generated (Inter division) power supply that was only compatible during crushing season of three months and two months on bagasse (purchased) on off and on basis. Production was suspended for rest eight months period because of no alternative power supply arrangements.
50.2 Cotton segment
Spinning unit
The plant capacity converted to 20s count polyester cotton yarn based on three shifts per day for 1,092 shifts is 9,197,007 kilogram (2020: 9,197,007 kilograms). Actual production converted into 20s count was 8,790,199 kilograms for 1,092 shifts (2020: 7,190,635 kilograms for 921 shifts).
50.3 Energy segment
The plant’s installed production capacity was 118,856 MWh (2020: 118,856 MWh) and the actual production achieved during the year was 26,207 MWh (2020: 16,341 MWh). Reason for underutilization was that no power was supplied to FESCO and power generation was restricted to actual demand of the two customers, Hadeed (Billet) segment (internal customer) and Shakarganj Limited (external customer).
1 97
51 COMPARATIVE INFORMATION The corresponding figures have been rearranged and reclassified, wherever considered necessary for
the purpose of better presentation. 52 GENERAL
52.1 Number of employees
The total number of employees including contractual employees of the Company as at 30 June 2021 were 765 (2020: 778) and weighted average number of employees were 766 (2020: 769).
The number of factory employees including contractual employees of the Company as at 30 June
2021 were 683 (2020: 699) and weighted average number of employees were 685 (2020: 690).
53 DATE OF AUTHORIZATION FOR ISSUE
These financial statements were authorized for issue in the Board of Directors’ meeting held on 12 August 2021.
Chief Executive Director Chief Financial Officer


![IS 10198 (1982): Carbon Steel, Safety Razor Blades · IS 10198 (1982): Carbon Steel, Safety Razor Blades [PGD 14: Consumer Products and Allied Equipments] Title: IS 10198 (1982):](https://static.fdocuments.net/doc/165x107/601d271a38a3f529af08aacc/is-10198-1982-carbon-steel-safety-razor-blades-is-10198-1982-carbon-steel.jpg)