Crescat Capital LLC 1560 Broadway Denver, CO …Denver, CO 80202 (303) 271-9997 [email protected] 2...
21
1 April 14, 2020 Q1 2020 Quarterly Investor Letter Dear Investors: Equity bulls are coming into Q1 earnings reporting season amped up on Fed liquidity after a record $2.3 trillion of monetary stimulus announced last week. The problem is that the US economy just entered a massive asset bubble bursting recession. The fundamental downturn was in motion even before coronavirus blanketed the country. Earnings for the broad Russell 3000 stock index in the US already declined in Q4 2019 at the worst year- over-year rate since the Global Financial Crisis as we show in the chart below. That was just one of many bearish macro timing signals that Crescat had been highlighting prior to COVID-19. Now, earnings are about to get much worse. Crescat Capital LLC 1560 Broadway Denver, CO 80202 (303) 271-9997 [email protected] www.crescat.net
Transcript of Crescat Capital LLC 1560 Broadway Denver, CO …Denver, CO 80202 (303) 271-9997 [email protected] 2...
1
April 14, 2020
Q1 2020 Quarterly Investor Letter
Dear Investors:
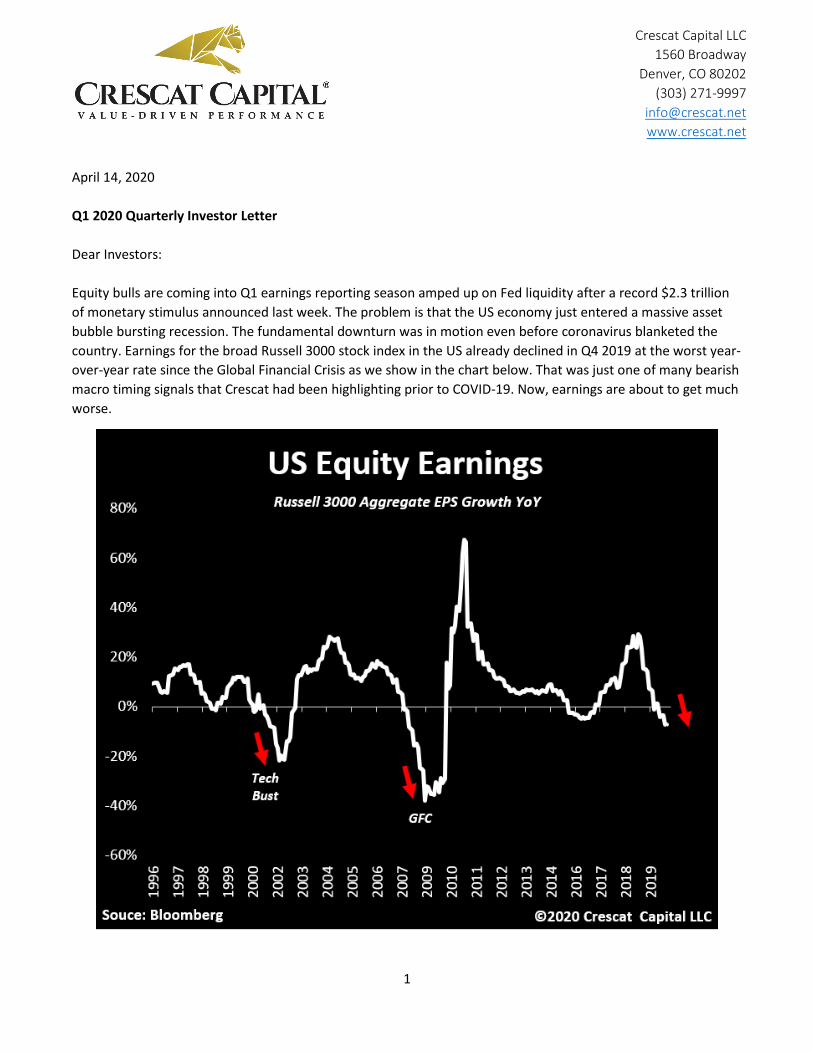
Equity bulls are coming into Q1 earnings reporting season amped up on Fed liquidity after a record $2.3 trillion
of monetary stimulus announced last week. The problem is that the US economy just entered a massive asset
bubble bursting recession. The fundamental downturn was in motion even before coronavirus blanketed the
country. Earnings for the broad Russell 3000 stock index in the US already declined in Q4 2019 at the worst year-
over-year rate since the Global Financial Crisis as we show in the chart below. That was just one of many bearish
macro timing signals that Crescat had been highlighting prior to COVID-19. Now, earnings are about to get much
worse.
Crescat Capital LLC
1560 Broadway
Denver, CO 80202
(303) 271-9997
www.crescat.net

2
Market bulls had been ramping stocks higher when the weak Q4 earnings were reported earlier this year. The
fever pitch in the market at the time was not caused by bats in Wuhan. Then too, market confidence was
focused on the Fed money printing rather than the already mutating economic virus that the central bank
liquidity was trying to alleviate. Crescat’s gene sequencing of the illness at the peak of the economy and top of
the market revealed not only sliding corporate earnings, but historic high equity valuations, record corporate
leverage, shrinking global trade, a repo liquidity crisis, and a recent breach of the critical 70% level for US
Treasury yield curve inversions.
The broad US stock market topped out on February 19, 2020 after the longest bull market and economic
expansion in US history. The downturn started with a bang, a 34% plunge in the S&P 500 Index in 4 ½ weeks. It
was the fastest 30%+ decline in US stock market history. Global markets also reeled with $30 trillion global stock
market wealth marked down in just one month. When we consider global savings invested in real estate, private
equity, and credit, the initial blow could have easily been twice that.
It was a massive hit. Naturally, there has also been a sharp snapback rally. In just 16 trading days, through the
end of last week there has been a roughly 50% upward retracement in the S&P 500 Index.
We strongly believe that investors should be wary of getting sucked into the relief rally. Valuations are still
historically high for the US stock market at large. Our macro model does not forecast an economic recovery any
time soon. We expect the bear market to fully resume as soon as this week with the Q1 earnings season kicking

3
off with a spate of grim reports. Plunging corporate earnings are not likely to be shrugged off this time. Last
quarter, late cycle bulls were still clinging to what they thought was a reasonable price-to-earnings ratio, even
after declining Q4 earnings. But P/Es are a value-trap at the peak of a business cycle. That is why we used a
comprehensive composite of eight valuation indicators to identify all-time high valuations in the market tossing
out conventional P/E. Now, we expect the E in the P/E ratio to be plummeting all year dragging the P down with
it.
Debt Dwarfs Liquidity
The problem with pinning one’s hope on Fed liquidity is that while indeed the money printing is historic, it pales
in comparison to the gargantuan $255 trillion in pre-existing global debt today.
Private equity firms have advised CFOs to fully draw down their revolving loan facilities to prepare for a storm.
Commercial and industrial loans just surged at its highest pace in 73 years. The three prior highest extreme
spikes in lending preceded recessions, just like our outlook today.
It is no coincidence that business cycle downturns are also credit cycle downturns. It’s the drag from the past
credit boom that is the problem. While asset values and incomes plunge in recessions, the debt obligations don’t
go away so easily. During these times, households are forced to cut back spending and deplete their savings as
businesses lay off workers to conserve cash in a vicious cycle that leads normally to a prolonged slump. In
deflationary recessions, the overall debt burden of an economy gets much worse before it gets better. That was
4
the case in the Great Depression and Great Recession. Debt to GDP surges before businesses ultimately fail and
debt is expunged and replaced with equity and new debt in the bankruptcy process.
Governments are called upon to step in with countercyclical fiscal spending in deep recessions to smooth the
overall economy by increasing their own borrowings, easing up on taxes, and pursuing deficit spending in deep
deflationary recessions. But what happens when pre-existing global debt, across all households, corporations,
financial institutions, and governments is already at its highest level ever relative to GDP before the downturn
even begins? We are about to find out.
Global debt to GDP was at a record 355% at the end of 2019 according to data from the IMF and BIS complied by
the Institute of International Finance. The world’s debt problems are about to explode. What seems like an
enormous fiscal and monetary response worldwide to date to counter it is a mere drop in the bucket compared
to the household wealth and economic growth that has already been lost. We are now in only the early stages of
what could easily be the most grueling global bear market and recession since the Great Depression.
Keep in mind that the largest economy in the world, the keeper of the global reserve currency, has already had
increasing deficit spending for the last four years. US deficit spending was already close to 5% of GDP at the peak
of the expansion. That is a level only seen in the middle of recessions historically. It’s about to skyrocket adding a
dimension of ultimate inflationary risk, but not necessarily an imminent one. The first leg of the downturn has
been a sharply deflationary one.
Based on the excessive debt, asset bubbles, and business cycle timing factors all lining up pre-coronavirus, we
were already expecting major global recession, not a quick bear market and push to new highs. But throw in a
global pandemic with almost the entire world population in lockdown, and global GDP could conceivably be
poised to plunge at its highest rate ever. We must conclude that it is highly probable that there is much
downside for the global economy and stock market before this recession is over.
US initial jobless claims data just surged 17 million in only three weeks, an unprecedented level of lost
employment. To put this into perspective, two thirds of the jobs created over the entire expansion just
evaporated. It makes the job losses during the Global Financial Crisis look like a walk in the park. These jobs
aren’t likely coming back any time soon. The unemployment rate is surging. On a year-over-year basis, the
lagging U-3 index through March, has already risen 16% and looks. We expect the unemployment rate to
continue to spike in the coming months to the highest level since the Great Depression. Since 1948, every time
this indicator has spiked as much as it did in March, a recession followed with an average duration of 12 months.
This economic crisis, in our analysis, is only just beginning. There will likely be several quarters of earnings
decline ahead before our models will be forecasting any type of recovery, let alone a V-shaped one.
China
Now, throw into the mix a $42 trillion Ponzi scheme ripe to implode. In our analysis, the Chinese banking system
is the largest financial scam in world history. The conventional worldview falsely believes that China is in a
strong financial position with $3 trillion in foreign reserves. This perspective assumes that these assets are not
already encumbered in the country’s dealings with foreign banks, which they almost certainly are. The FX
reserves of the People’s Bank of China are perhaps the only good collateral the country has in its entire financial
system. The problem is that these reserves are tiny compared to the country’s egregiously overstated bank
receivables that are 14 times higher and in turn secure the deposits of 1.4 billion people.
China was responsible for what it claimed was 60% of world GDP growth since the 2008 recession. But the
growth engine of the world was built on a fraudulent financial system where non-performing loans have been
endlessly covered up and papered over with new credit at impossible growth rates. Chinese economic growth

5
over this period was massively overstated to begin with. We see nothing but crashing decline on the foreseeable
horizon as deglobalization continues and supply chains are yanked from this highly corrupt government run
economy. China is a country that has proven to be a poor global citizen under Chinese Communist Party control,
a country lacking in both human rights and free markets, a political and economic system that is anything but a
beacon of global progress.
As just reported in Barron’s, SpaceKnow, a New York company that measures satellite economic activity around
the world, confirms that there is no economic rebound taking place in China today despite its purported
rebound in manufacturing PMI and supposed recovery from coronavirus. The firm’s Broad Activity Index based
on infrared data from more than 5,000 locations across China’s supply chain shows nothing but deep ongoing
contraction. For all the reasons above, we continue to be positioned for what we believe will be one of the
biggest global bear markets and recessions yet. We remain long dollar call options versus the Chinese yuan and
Hong Kong dollar in our global macro hedge fund.
Unwarranted Confidence
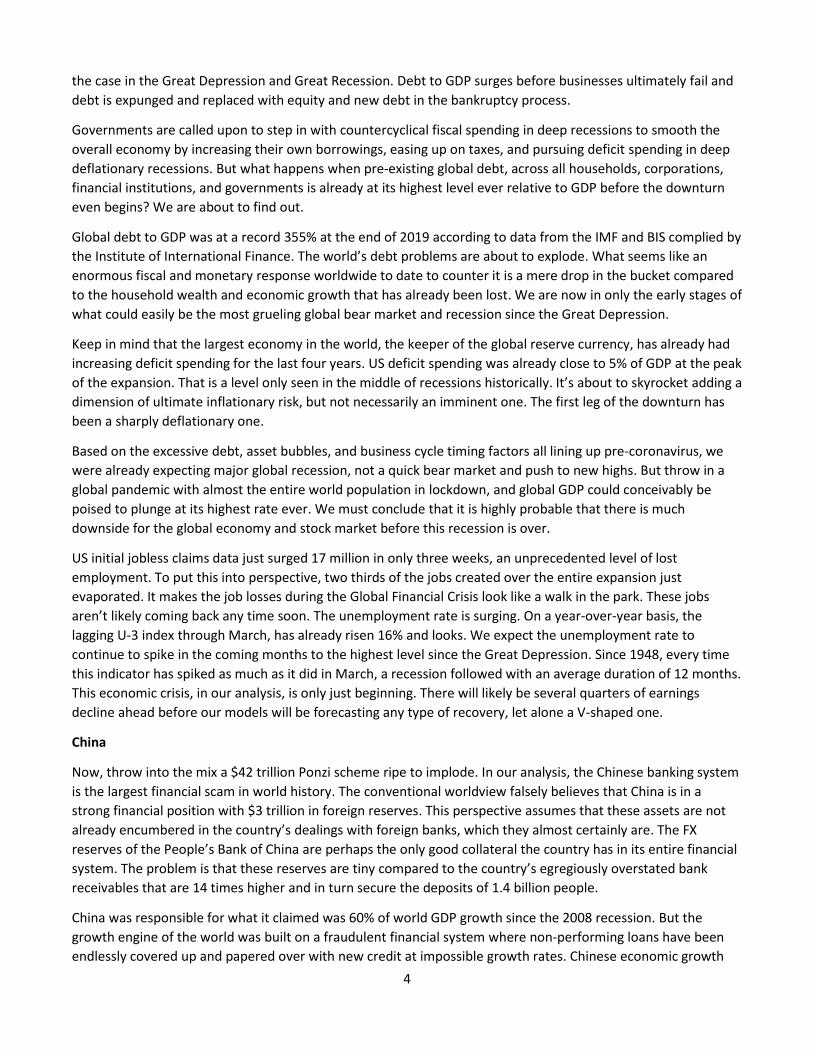
The eagerness of investors to hop on the recent relief rally in US stocks is scary. Bear markets and recessions
have never completed with such high bullish sentiment as we see today. Neither do they end with consumer
confidence having recently been so high as last month’s Conference Board survey revealed in the chart below.
We see much more downside ahead for stocks and the economy at large before decimated asset prices and
investor despondency can set up the preconditions for an enduring recovery.
6
The pandemic was not the cause of the economic imbalances that will make this recession so severe, but it’s an
undeniable contributor to the pain and hardship we all must now endure as the downturn plays out. While it is
great news that the COVID-19 morbidity curve has been flattening, there is still no vaccine or cure for the
disease that will likely take ongoing lockdowns to keep at bay. These measures are crimping in unprecedented
fashion what was already a highly vulnerable economy.
No matter how we look at it, we cannot plausibly conceive a case as to why this bear market and recession will
play out in less time and extent than the average of prior recessions. This one is almost certainly going to be
worse than average. The race to the bottom has only just commenced. It is going to be a marathon not a sprint.
In our view, the rallies in most stocks outside of a select few industries will prove fleeting. Big swoons still lie
ahead.
Outside of pockets of deep value in precious metals and unwanted energy, and decent value and growth
prospects in select pharmaceutical stocks, our valuation and macro timing indicators warn of much further
downside for the market at large until the depths of the current recession have played out.
The lasting effects from the bursting of asset bubbles on the market and economy will almost certainly play over
many months and possibly a few years before the bear market and recession finally hit bottom. The peaking of
the virus of course should happen much, much sooner. We are hopeful that with increased testing, early

7
detection, stay at home orders, and soon to be approved therapies, that the death curve can be turned
decisively down and soon.
This level of fiscal and monetary stimulus to fight the economic downturn is already is in excess of anything in
history. As a result, the fundamental outlook for rising near and intermediate term precious metals prices is
outstanding. The case for gold and silver mining stocks is even better, starting from historically depressed
valuations today as we discuss further below.
Buy Gold; Sell Stocks
The growth in M2 money supply is also insane. The indicator has only surged like this one other time in history.
That was October 2008 during the global financial crisis and after Lehman Brothers declared bankruptcy.
The big question is who is going to bail out whom? Corporate earnings and household consumption are
plunging, government spending is skyrocketing, and economic activity plummeting. The US government deficit is
set to explode in absolute and relative-to-GDP terms. When we look at the US government balance sheet, it is
already bloated. Corporate balance sheets are stretched to record levels already as well. What kept them in the
game was the ongoing economic expansion. That is long gone. The issue is that “liquidity” injections in such
indebted environments don’t act as liquidity that translates into economic growth. Instead, new money goes to
service existing debt and roll existing loans.
8
The large US government balance sheet has worked historically only because we have the largest free market
economy, the most wealth, the largest military, and one of the best systems of democracy on the planet. This all
has given the US the privilege of having the global reserve fiat currency.
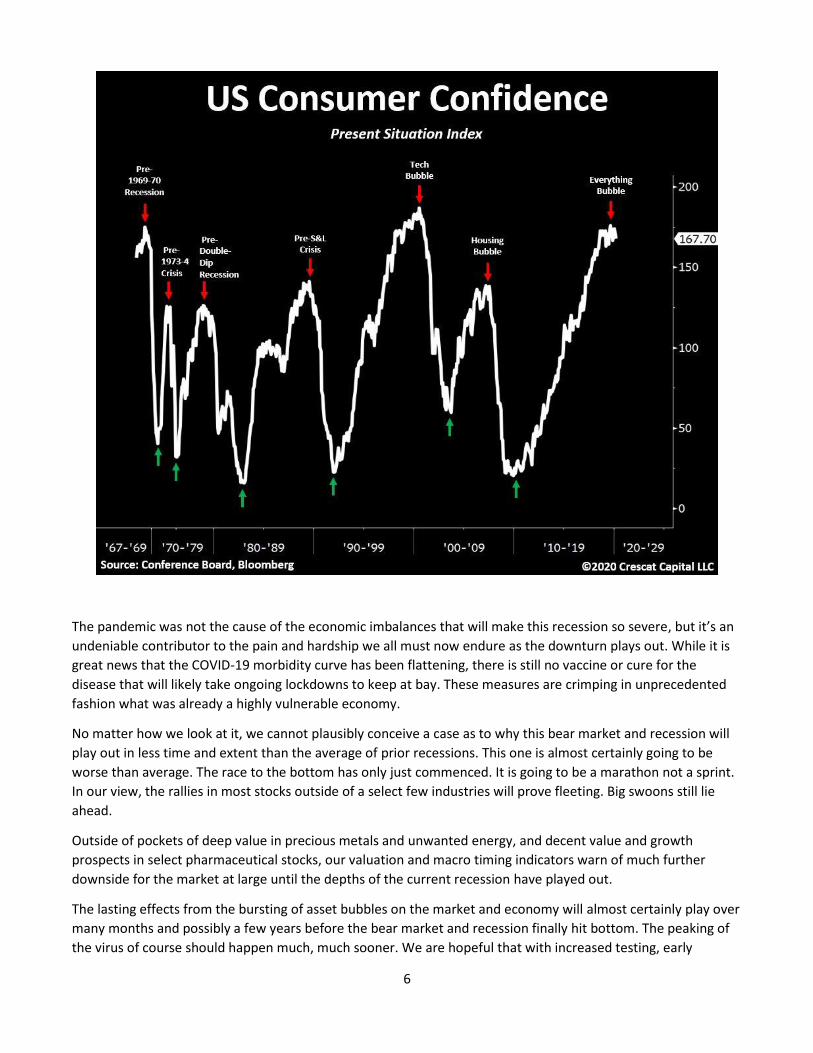
But we can’t forget that most enduring currency and widely held central bank asset on the planet remains gold
which serves to keep all fiat currencies in check. This is why, when we have reached similar inflection points in
the macro economy as we find ourselves in today, our work has shown that it is the best time to be long gold
and short stocks. The long-term chart of the S&P 500-to-gold ratio is now forming a massive head and shoulders.
We challenge anyone to find an industry that still trades below 1980s levels that benefits from the world’s QE to
infinity lunacy. The only one that comes to mind is gold & silver mining industry. After long years of
underperformance relative to the overall market and gold itself, we think precious metals stocks are setting up
to a could be a spectacular run-up in the months, quarters, and years ahead.
9
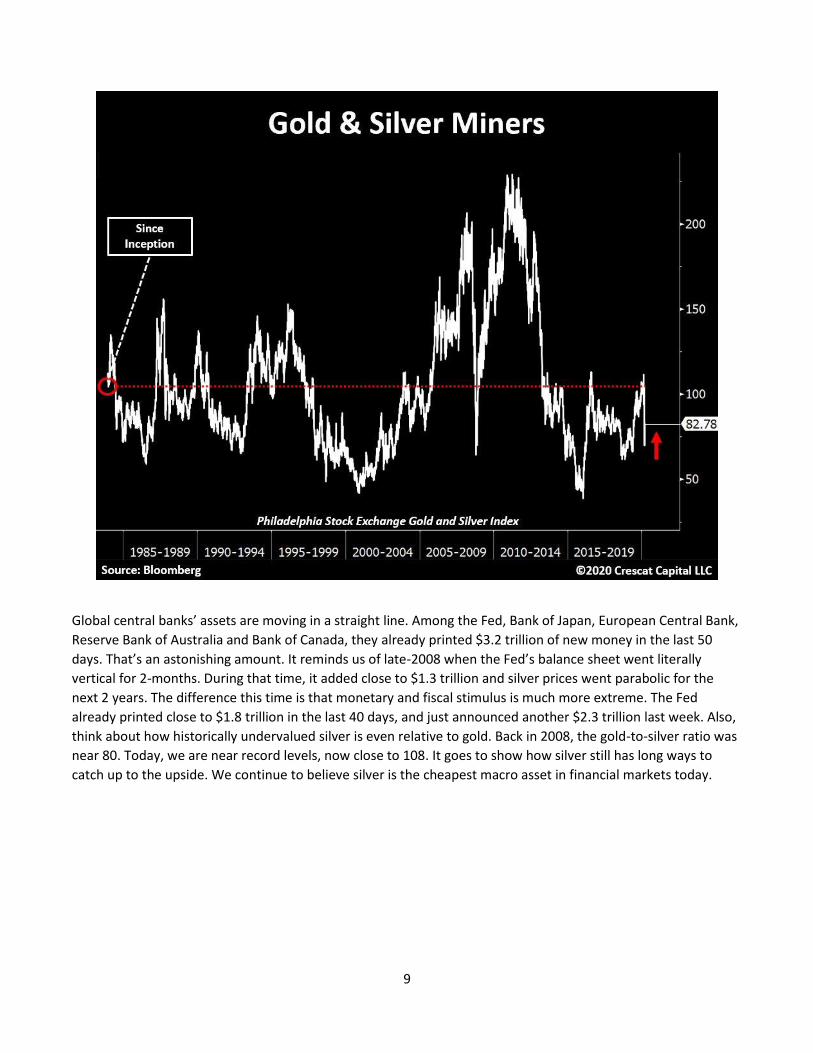
Global central banks’ assets are moving in a straight line. Among the Fed, Bank of Japan, European Central Bank,
Reserve Bank of Australia and Bank of Canada, they already printed $3.2 trillion of new money in the last 50
days. That’s an astonishing amount. It reminds us of late-2008 when the Fed’s balance sheet went literally
vertical for 2-months. During that time, it added close to $1.3 trillion and silver prices went parabolic for the
next 2 years. The difference this time is that monetary and fiscal stimulus is much more extreme. The Fed
already printed close to $1.8 trillion in the last 40 days, and just announced another $2.3 trillion last week. Also,
think about how historically undervalued silver is even relative to gold. Back in 2008, the gold-to-silver ratio was
near 80. Today, we are near record levels, now close to 108. It goes to show how silver still has long ways to
catch up to the upside. We continue to believe silver is the cheapest macro asset in financial markets today.
10
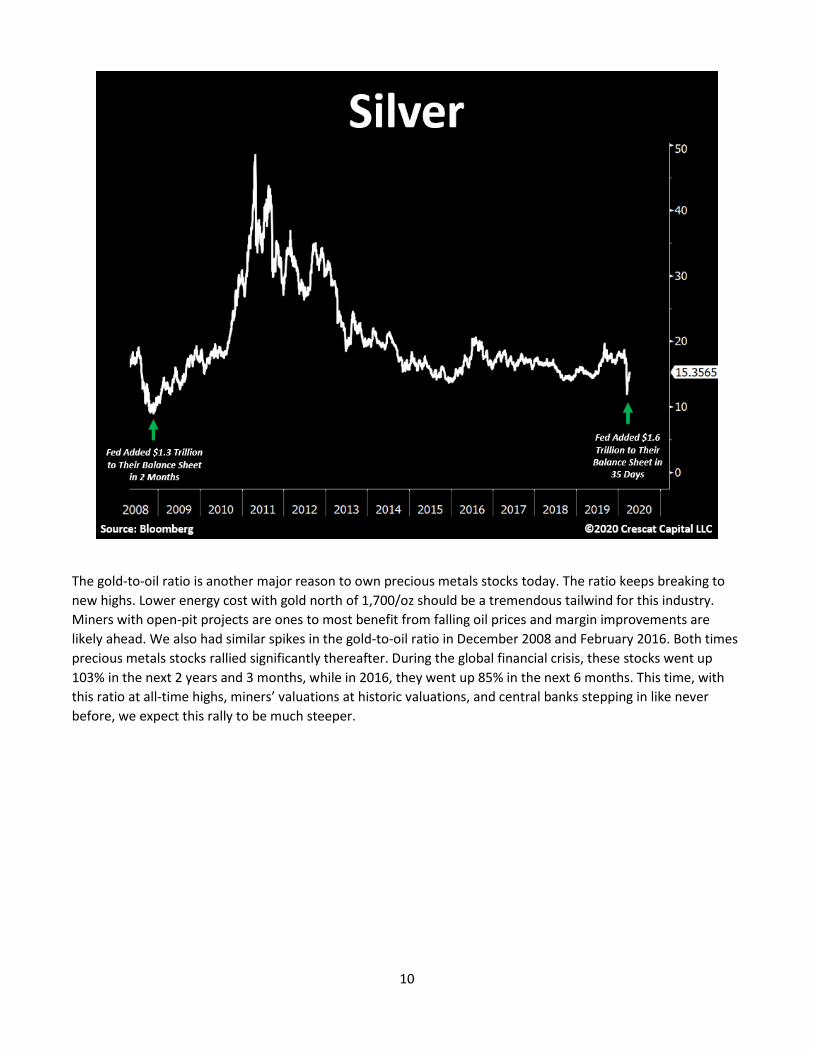
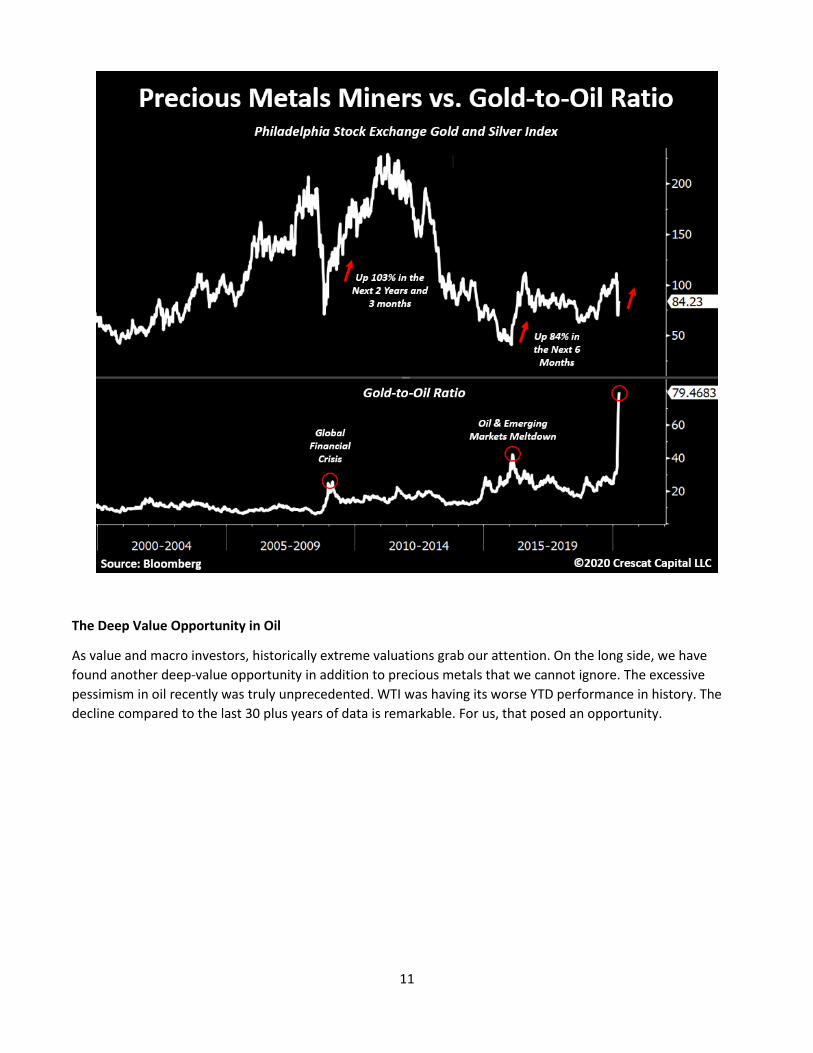
The gold-to-oil ratio is another major reason to own precious metals stocks today. The ratio keeps breaking to
new highs. Lower energy cost with gold north of 1,700/oz should be a tremendous tailwind for this industry.
Miners with open-pit projects are ones to most benefit from falling oil prices and margin improvements are
likely ahead. We also had similar spikes in the gold-to-oil ratio in December 2008 and February 2016. Both times
precious metals stocks rallied significantly thereafter. During the global financial crisis, these stocks went up
103% in the next 2 years and 3 months, while in 2016, they went up 85% in the next 6 months. This time, with
this ratio at all-time highs, miners’ valuations at historic valuations, and central banks stepping in like never
before, we expect this rally to be much steeper.
11
The Deep Value Opportunity in Oil
As value and macro investors, historically extreme valuations grab our attention. On the long side, we have
found another deep-value opportunity in addition to precious metals that we cannot ignore. The excessive
pessimism in oil recently was truly unprecedented. WTI was having its worse YTD performance in history. The
decline compared to the last 30 plus years of data is remarkable. For us, that posed an opportunity.

12
While global producers engage in a price war by flooding an already oversupplied market, oil demand is also
being tremendously suppressed due to the virus outbreak. Brent and WTI prices went to 17 and 18-year lows
respectively. There was a phenomenon we noticed in the WTI market recently that we pointed out in social
media post. The front end of the futures curve had completely plunged while the back end held up significantly
better. It was the largest contango in the history of the data. Similar extreme divergences in out-month futures
prices versus spot have marked every major bottom in oil prices. Why should this time have been any different?

13
To add to that, we considered the imbalance in the oil-to-S&P 500 ratio just a few weeks ago. It was forming a
historic double bottom, putting into perspective of how historically undervalued the commodity is relative to
the overall stock market. Looking back in history, the prior low in this ratio was in December 1998.
Subsequently, oil went up 240% in the next 22 months.
14
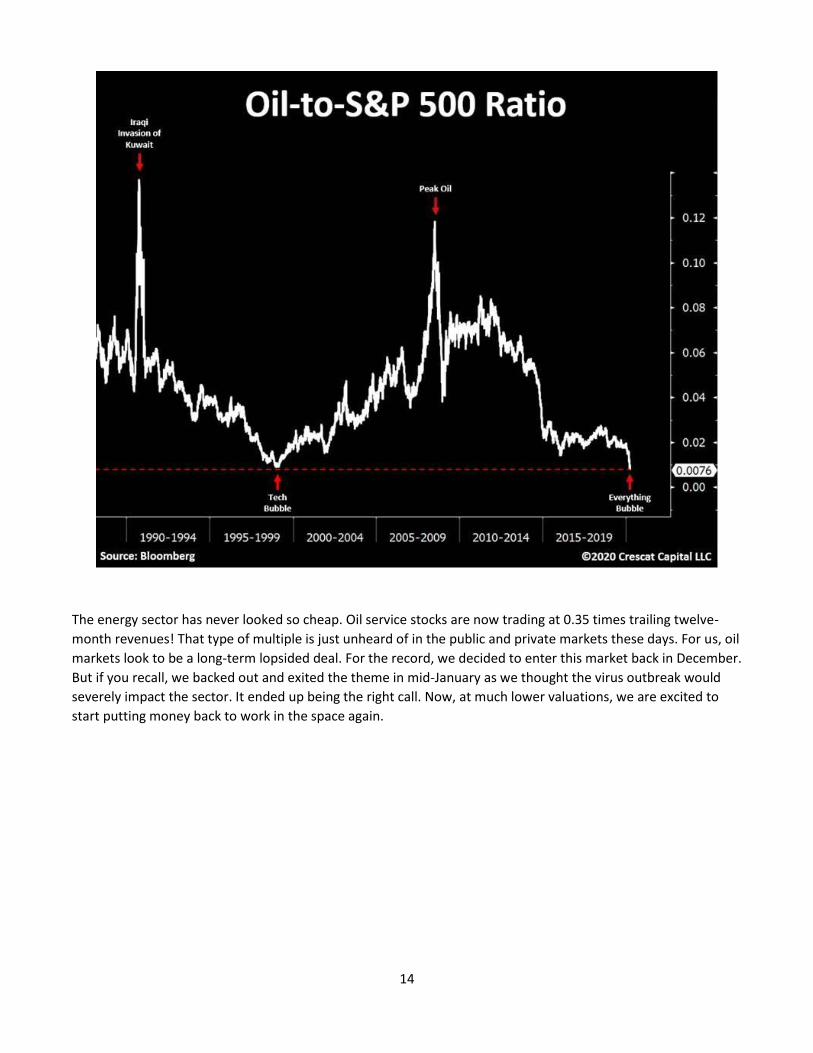
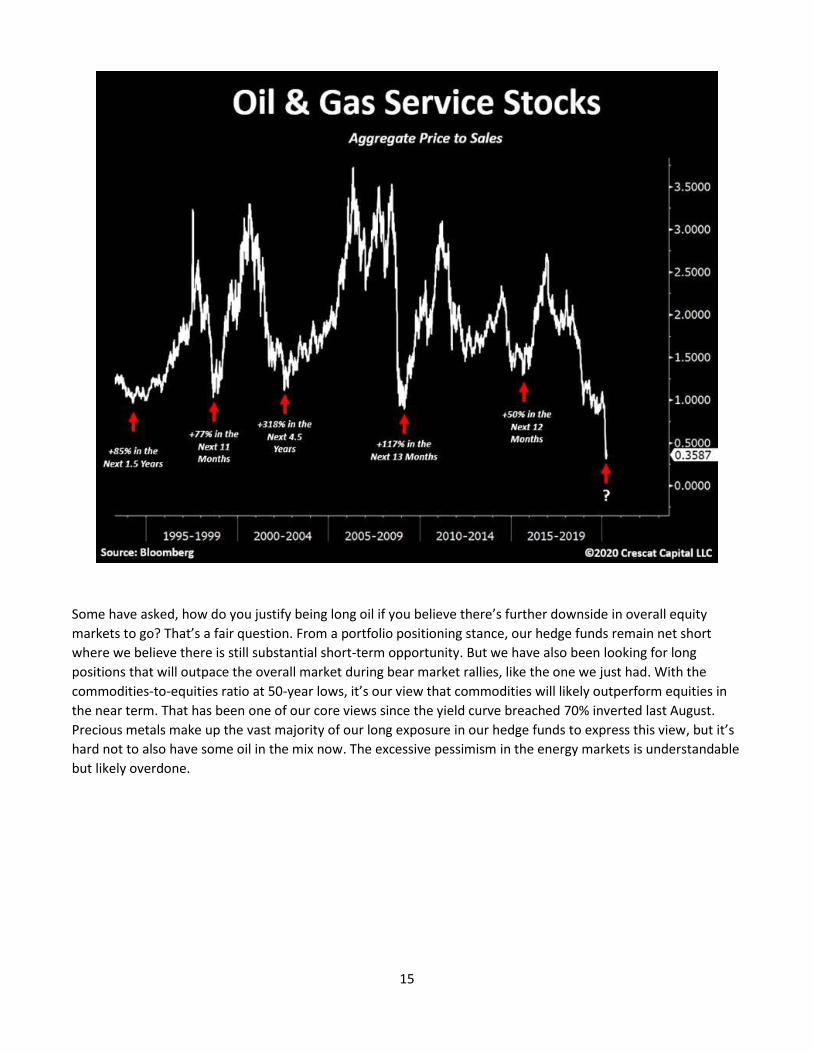
The energy sector has never looked so cheap. Oil service stocks are now trading at 0.35 times trailing twelve-
month revenues! That type of multiple is just unheard of in the public and private markets these days. For us, oil
markets look to be a long-term lopsided deal. For the record, we decided to enter this market back in December.
But if you recall, we backed out and exited the theme in mid-January as we thought the virus outbreak would
severely impact the sector. It ended up being the right call. Now, at much lower valuations, we are excited to
start putting money back to work in the space again.
15
Some have asked, how do you justify being long oil if you believe there’s further downside in overall equity
markets to go? That’s a fair question. From a portfolio positioning stance, our hedge funds remain net short
where we believe there is still substantial short-term opportunity. But we have also been looking for long
positions that will outpace the overall market during bear market rallies, like the one we just had. With the
commodities-to-equities ratio at 50-year lows, it’s our view that commodities will likely outperform equities in
the near term. That has been one of our core views since the yield curve breached 70% inverted last August.
Precious metals make up the vast majority of our long exposure in our hedge funds to express this view, but it’s
hard not to also have some oil in the mix now. The excessive pessimism in the energy markets is understandable
but likely overdone.

16
We have been well prepared for this market downturn, as well as its snapback, as we show in Crescat’s hedge
fund performance since the top chart below.
Crescat’s Hedge Fund Performance Since the Top

17
We took partial profits in short positions in March while adding to beat up precious metals and energy at the
same time. With all the new stimulus, gold should be in firm new uptrend soon enough and separating from the
bear market for stocks at large, just like in Homestake chart below during the Great Depression.

18
Our Near-term Outlook
There is good chance that the relief rally has already played out for stocks at large and we have increased our
short positions again slightly. We should see resumed selling pressure as earnings season ramps up. As it is a
long road to the cure for the coronavirus, the lockdowns are not likely to materially ease anytime soon even
though the curve should flatten and decline. Meanwhile, the everything bubble has finally only just burst from
truly historic debt and valuation levels. The problem is there are far too many bullish investors believing that
business cycles are irrelevant and that markets should not be timed. As a result, we see more financial and
economic pain ahead before the final capitulation that is the ultimate signature of bear market and recessionary
lows.
If anyone is looking for long opportunities in the market, we strongly believe precious metals, and the leading
mining stocks in the industry across all capitalizations, are the place to be. They offer incredible upside leverage
to the metals’ prices, even as their own production is temporarily shut down. Ironically, the latter factor only
makes the precious metals price go higher in the near-term, which in turn makes gold mining stocks all the more
attractive. The gold in the ground is not going anywhere during the shutdown. It is very expensive to get it out of
the ground in the first place. Mining companies have an excuse now to conserve cash until higher prices can
emerge before production resumes. Many outstanding junior mining companies with some of the best gold and
silver deposits in the world, were babies thrown out with the bathwater in March. These companies can still be
picked up at deep discounts to intrinsic value today. We own them in our hedge funds, but we also strongly
encourage investors to consider setting up a Crescat precious metals SMA with us at Interactive Brokers if they
want to more exposure this long investment opportunity of a lifetime.
In addition to owning the leading producers, we also own some of the best junior explorers with the most viable
new deposits on the planet. We own these stocks in our hedge funds too. We are working with experts in the
industry to build the best possible portfolio of gold and silver mining equities to take advantage of the current

19
macro set up in what we believe is the best possible way for our clients. These long holdings should work in both
the likely continuing bear market for stocks at large and recession in the near term as well as the ultimate
economic recovery.
For those wanting to tilt more toward precious metals senior producers in a long-only portfolio, we would point
to you to Crescat Large Cap where they are our largest allocation. In that strategy, we have also been dipping
our toes into deep value energy shares and have added to two more to our portfolio of defensive large cap
growth biotech companies. These drug stocks are exciting growth companies that trade at reasonably low
valuations today as part of our secular growth genomic revolution theme. Some of these companies are the
leading and most adaptable scientific franchises in the biotech industry that will help us combat COVID-19.
These companies are not just coronavirus plays. They have deep pipelines, leading scientific platforms, and
portfolios of existing profitable drugs to meet strong demand and deliver years of future growth ahead.
Profit Attribution
Performance
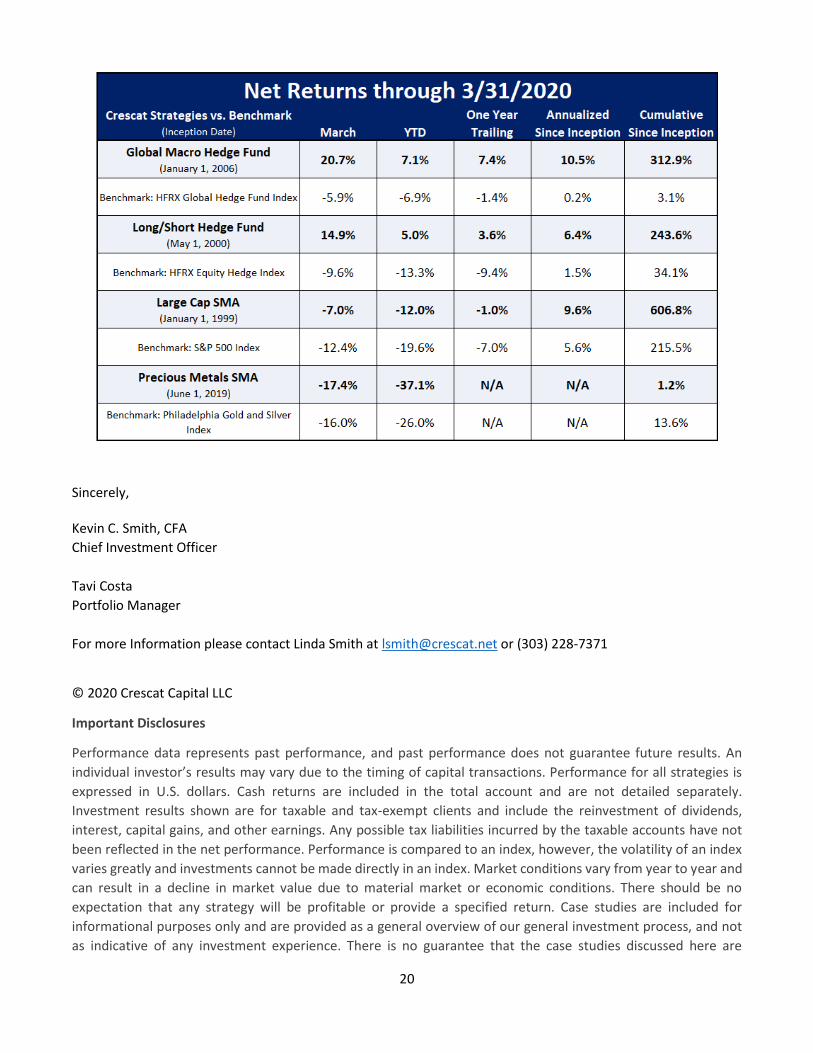
20
Sincerely, Kevin C. Smith, CFA
Chief Investment Officer
Tavi Costa
Portfolio Manager
For more Information please contact Linda Smith at [email protected] or (303) 228-7371
© 2020 Crescat Capital LLC
Important Disclosures
Performance data represents past performance, and past performance does not guarantee future results. An
individual investor’s results may vary due to the timing of capital transactions. Performance for all strategies is
expressed in U.S. dollars. Cash returns are included in the total account and are not detailed separately.
Investment results shown are for taxable and tax-exempt clients and include the reinvestment of dividends,
interest, capital gains, and other earnings. Any possible tax liabilities incurred by the taxable accounts have not
been reflected in the net performance. Performance is compared to an index, however, the volatility of an index
varies greatly and investments cannot be made directly in an index. Market conditions vary from year to year and
can result in a decline in market value due to material market or economic conditions. There should be no
expectation that any strategy will be profitable or provide a specified return. Case studies are included for
informational purposes only and are provided as a general overview of our general investment process, and not
as indicative of any investment experience. There is no guarantee that the case studies discussed here are
21
completely representative of our strategies or of the entirety of our investments, and we reserve the right to use
or modify some or all of the methodologies mentioned herein.
Separately Managed Account (SMA) disclosures: The Crescat Large Cap Composite and Crescat Precious Metals
Composite include all accounts that are managed according to those respective strategies over which the manager
has full discretion. SMA composite performance results are time weighted net of all investment management fees
and trading costs including commissions and non-recoverable withholding taxes. Investment management fees
are described in Crescat’s Form ADV 2A. The manager for the Crescat Large Cap strategy invests predominatly in
equities of the top 1,000 U.S. listed stocks weighted by market capitalization. The manager for the Crescat
Precious Metals strategy invests predominantly in a global all-cap universe of precious metals mining stocks.
Hedge Fund disclosures: Only accredited investors and qualified clients will be admitted as limited partners to a
Crescat hedge fund. For natural persons, investors must meet SEC requirements including minimum annual
income or net worth thresholds. Crescat’s hedge funds are being offered in reliance on an exemption from the
registration requirements of the Securities Act of 1933 and are not required to comply with specific disclosure
requirements that apply to registration under the Securities Act. The SEC has not passed upon the merits of or
given its approval to Crescat’s hedge funds, the terms of the offering, or the accuracy or completeness of any
offering materials. A registration statement has not been filed for any Crescat hedge fund with the SEC. Limited
partner interests in the Crescat hedge funds are subject to legal restrictions on transfer and resale. Investors
should not assume they will be able to resell their securities. Investing in securities involves risk. Investors should
be able to bear the loss of their investment. Investments in Crescat’s hedge funds are not subject to the
protections of the Investment Company Act of 1940. Performance data is subject to revision following each
monthly reconciliation and annual audit. Current performance may be lower or higher than the performance data
presented. The performance of Crescat’s hedge funds may not be directly comparable to the performance of other
private or registered funds. Hedge funds may involve complex tax strategies and there may be delays in
distribution tax information to investors.
Investors may obtain the most current performance data, private offering memoranda for a Crescat’s hedge funds,
and information on Crescat’s SMA strategies, including Form ADV Part II, by contacting Linda Smith at (303) 271-
9997 or by sending a request via email to [email protected]. See the private offering memorandum for each
Crescat hedge fund for complete information and risk factors.