CREIGHTON UNIVERSITY...with Government Auditing Standards 39–40 ... accounting guidance for...
45
CREIGHTON UNIVERSITY Consolidated Financial Statements June 30, 2019 and 2018 and Schedule of Expenditures of Federal Awards June 30, 2019 (With Independent Auditors’ Reports Thereon)
Transcript of CREIGHTON UNIVERSITY...with Government Auditing Standards 39–40 ... accounting guidance for...

CREIGHTON UNIVERSITY
Consolidated Financial Statements
June 30, 2019 and 2018
and
Schedule of Expenditures of Federal Awards
June 30, 2019
(With Independent Auditors’ Reports Thereon)
CREIGHTON UNIVERSITY
Table of Contents
Page(s)
Independent Auditors’ Report 1–2
Consolidated Financial Statements:
Consolidated Statements of Financial Position 3
Consolidated Statements of Activities 4–5
Consolidated Statements of Cash Flows 6
Notes to Consolidated Financial Statements 7–34
Single Audit Information
Schedule of Expenditures of Federal Awards 35–36
Notes to Schedule of Expenditures of Federal Awards 37–38
Independent Auditors’ Report on Internal Control over Financial Reporting and on Compliance
and Other Matters Based on an Audit of Financial Statements Performed in Accordance
with Government Auditing Standards 39–40
Independent Auditors’ Report on Compliance for Each Major Federal Program; Report on
Internal Control over Compliance; and Report on Schedule of Expenditures of Federal
Awards Required by Uniform Guidance 41–42
Schedule of Findings and Questioned Costs 43

Independent Auditors’ Report
The Board of Trustees
Creighton University:
Report on the Consolidated Financial Statements
We have audited the accompanying consolidated financial statements of Creighton University, which comprise
the consolidated statements of financial position as of June 30, 2019 and 2018, and the related consolidated
statements of activities and cash flows for the years then ended, and the related notes to the consolidated
financial statements.
Management’s Responsibility for the Consolidated Financial Statements
Management is responsible for the preparation and fair presentation of these consolidated financial statements
in accordance with U.S. generally accepted accounting principles; this includes the design, implementation, and
maintenance of internal control relevant to the preparation and fair presentation of consolidated financial
statements that are free from material misstatement, whether due to fraud or error.
Auditors’ Responsibility
Our responsibility is to express an opinion on these consolidated financial statements based on our audits. We
conducted our audits in accordance with auditing standards generally accepted in the United States of America
and the standards applicable to financial audits contained in Government Auditing Standards, issued by the
Comptroller General of the United States. Those standards require that we plan and perform the audit to obtain
reasonable assurance about whether the consolidated financial statements are free from material
misstatement.
An audit involves performing procedures to obtain audit evidence about the amounts and disclosures in the
consolidated financial statements. The procedures selected depend on the auditors’ judgment, including the
assessment of the risks of material misstatement of the consolidated financial statements, whether due to fraud
or error. In making those risk assessments, the auditor considers internal control relevant to the entity’s
preparation and fair presentation of the consolidated financial statements in order to design audit procedures
that are appropriate in the circumstances, but not for the purpose of expressing an opinion on the effectiveness
of the entity’s internal control. Accordingly, we express no such opinion. An audit also includes evaluating the
appropriateness of accounting policies used and the reasonableness of significant accounting estimates made
by management, as well as evaluating the overall presentation of the consolidated financial statements.
We believe that the audit evidence we have obtained is sufficient and appropriate to provide a basis for our
audit opinion.
Opinion
In our opinion, the consolidated financial statements referred to above present fairly, in all material respects,
the financial position of Creighton University as of June 30, 2019 and 2018, and the changes in their net assets
and their cash flows for the years then ended, in accordance with U.S. generally accepted accounting
principles.
KPMG LLP is a Delaware limited liability partnership and the U.S. member firm of the KPMG network of independent member firms affiliated with KPMG International Cooperative (“KPMG International”), a Swiss entity.
KPMG LLPSuite 3001212 N. 96th StreetOmaha, NE 68114-2274
Suite 11201248 O StreetLincoln, NE 68508-1493

2
Emphasis of Matters
As discussed in note 1(q) to the consolidated financial statements, Creighton University adopted new
accounting guidance for Accounting Standards Update (ASU) 2014-09, Revenue from Contracts with
Customers (Topic 606); ASU 2016-14, Not-for-Profit Entities (Topic 958): Presentation of Financial Statements
of Not-for-Profit Entities; and ASU 2018-08, Not-for-Profit Entities (Topic 958): Clarifying the Scope and
Accounting Guidance for Contributions Received and Contributions Made. Our opinion is not modified with
respect to these matters.
Other Reporting Required by Government Auditing Standards
In accordance with Government Auditing Standards, we have also issued our report dated October 24, 2019 on
our consideration of Creighton University’s internal control over financial reporting and on our tests of its
compliance with certain provisions of laws, regulations, contracts, and grant agreements and other matters.
The purpose of that report is solely to describe the scope of our testing of internal control over financial
reporting and compliance and the results of that testing, and not to provide an opinion on the effectiveness of
Creighton University’s internal control over financial reporting or on compliance. That report is an integral part
of an audit performed in accordance with Government Auditing Standards in considering Creighton University’s
internal control over financial reporting and compliance.
Omaha, Nebraska
October 24, 2019

3
CREIGHTON UNIVERSITY
Consolidated Statements of Financial Position
June 30, 2019 and 2018
(All amounts in thousands)
Assets 2019 2018
Cash and cash equivalents $ 17,143 12,397
Accounts receivable, net 23,561 21,653
Contributions receivable, net 5,395 1,509
Student loans receivable, net of reserve for doubtful accounts of
$1,055 and $1,019 in 2019 and 2018, respectively 27,091 28,693
Notes receivable, net 15,424 13,876
Prepaid expenses, inventories, and other assets 16,845 15,846
Investments 759,982 748,783
Land, buildings, and equipment, net 492,692 475,476
Total assets $ 1,358,133 1,318,233
Liabilities and Net Assets
Liabilities:
Accounts payable and accrued expenses $ 43,009 46,081
Short-term borrowings — 5,000
Deferred income 21,092 20,171
Other liabilities 27,098 32,276
Interest rate swap liability 24,221 18,225
Refundable government student loan funds 29,390 29,074
Bonds and notes payable 198,419 203,502
Total liabilities 343,229 354,329
Commitments and contingencies
Net assets:
Without donor restrictions 647,680 587,714
With donor restrictions:
Time or purpose 117,915 139,008
Perpetual 249,309 237,182
Total net assets 1,014,904 963,904
Total liabilities and net assets $ 1,358,133 1,318,233
See accompanying notes to consolidated financial statements.

4
CREIGHTON UNIVERSITY
Consolidated Statement of Activities
Year ended June 30, 2019
(All amounts in thousands)
Without donor With donor
restrictions restrictions Total
Net operating revenue:
Tuition and fees, net of tuition discount and
scholarship allowances of $96,370 $ 242,971 — 242,971
Educational support contract revenue 46,458 — 46,458
Healthcare services revenue 12,208 — 12,208
Grants and contracts 20,964 — 20,964
Contributions 10,580 — 10,580
Investment income appropriated for operations 20,139 — 20,139
Auxiliary enterprises 46,313 — 46,313
Other revenue 16,512 — 16,512
Capital gifts appropriated for operations 5,881 — 5,881
Net assets released from restrictions 3,355 — 3,355
Total net operating revenue 425,381 — 425,381
Operating expenses:
Salaries, wages, and benefits 245,418 — 245,418
Contracted services 43,643 — 43,643
Supplies and materials 21,785 — 21,785
Depreciation and amortization 30,560 — 30,560
Interest 8,404 — 8,404
Utilities and communications 10,720 — 10,720
Other operating 44,549 — 44,549
Total operating expenses 405,079 — 405,079
Increase in net assets from operating activities 20,302 — 20,302
Nonoperating changes in net assets:
Investment return over (under) amounts appropriated for
operations (4,143) 16,064 11,921
Equity losses in minority-owned affiliates (690) — (690)
Change in fair value of interest rate swaps (5,996) — (5,996)
Contributions for nonoperating purposes — 32,965 32,965
Other changes in net assets (174) (719) (893)
Capital gifts appropriated to operations (5,881) — (5,881)
Net assets released from restrictions 53,921 (57,276) (3,355)
Net nonoperating changes in net assets 37,037 (8,966) 28,071
Increase (decrease) in net assets 57,339 (8,966) 48,373
Net assets, beginning of year, as previously reported 587,714 376,190 963,904
ASU 2014-09 and 2018-08 implementation 2,627 — 2,627
Net assets, beginning of year, as restated 590,341 376,190 966,531
Net assets, end of year $ 647,680 367,224 1,014,904
See accompanying notes to consolidated financial statements.

5
CREIGHTON UNIVERSITY
Consolidated Statement of Activities
Year ended June 30, 2018
(All amounts in thousands)
Without donor With donor
restrictions restrictions Total
Net operating revenue:
Tuition and fees, net of tuition discount and
scholarship allowances of $91,059 $ 227,899 — 227,899
Educational support contract revenue 38,461 — 38,461
Healthcare services revenue 11,746 — 11,746
Grants and contracts 17,766 — 17,766
Contributions 12,699 — 12,699
Investment income appropriated for operations 17,992 — 17,992
Auxiliary enterprises 41,139 — 41,139
Other revenue 13,288 — 13,288
Capital gifts appropriated for operations 4,759 — 4,759
Net assets released from restrictions 1,495 — 1,495
Total net operating revenue 387,244 — 387,244
Operating expenses:
Salaries, wages, and benefits 233,227 — 233,227
Contracted services 42,025 — 42,025
Supplies and materials 19,781 — 19,781
Depreciation and amortization 25,446 — 25,446
Interest 7,437 — 7,437
Utilities and communications 10,002 — 10,002
Other operating 35,896 — 35,896
Total operating expenses 373,814 — 373,814
Increase in net assets from operating activities 13,430 — 13,430
Nonoperating changes in net assets:
Investment return over amounts appropriated for
operations 8,322 22,361 30,683
Equity losses in minority-owned affiliates (329) — (329)
Loss on extinguishment of debt (2,852) — (2,852)
Change in fair value of interest rate swaps 6,168 — 6,168
Contributions for nonoperating purposes 579 27,375 27,954
Other changes in net assets (488) 584 96
Capital gifts appropriated to operations (4,759) — (4,759)
Net assets released from restrictions 13,765 (15,260) (1,495)
Net nonoperating changes in net assets 20,406 35,060 55,466
Increase in net assets 33,836 35,060 68,896
Net assets, beginning of year, as previously reported 440,915 454,093 895,008
ASU 2016-14 implementation 112,963 (112,963) —
Net assets, beginning of year, as restated 553,878 341,130 895,008
Net assets, end of year $ 587,714 376,190 963,904
See accompanying notes to consolidated financial statements.

6
CREIGHTON UNIVERSITY
Consolidated Statements of Cash Flows
Years ended June 30, 2019 and 2018
(All amounts in thousands)
2019 2018
Cash flows from operating activities:
Increase in net assets $ 48,373 68,896
Adjustments to reconcile increase in net assets to net cash provided by operating activities:
Equity losses in minority-owned affiliates 690 329
Receipt of contributed securities (3,688) (4,388)
Proceeds from sale of contributed securities without donor restrictions 2,681 1,006
Depreciation, amortization, and accretion 30,509 25,404
Net loss from sale of land, buildings, and equipment, net 6,099 1,440
Actuarial loss on annuities payable 997 528
Actuarial adjustment on contributions receivable 2 (489)
Cash contributions for nonoperating purposes (29,104) (23,566)
Change in fair value of interest rate swap agreements 5,996 (6,168)
Net realized and unrealized gains on investments (28,174) (42,814)
Loss on extinguishment of debt — 2,852
Changes in operating assets and liabilities:
Accounts receivable 221 (4,005)
Notes receivable 142 (34)
Contributions receivable (3,888) —
Prepaid expenses, inventories, and other assets (3,670) (3,960)
Accounts payable and accrued expenses 2,676 2,402
Deferred income 4,020 (2,157)
Other liabilities (5,441) (1,134)
Net cash provided by operating activities 28,441 14,142
Cash flows from investing activities:
Repayments on student loans 4,865 5,387
Student loans issued (3,263) (4,342)
Proceeds from the sales of investments 157,154 169,753
Purchases of investments (141,237) (184,483)
Purchases of land, buildings, and equipment, net (61,243) (89,727)
Net cash used in investing activities (43,724) (103,412)
Cash flows from financing activities:
Cash contributions for nonoperating purposes 29,104 23,566
Proceeds from sale of contributed securities with donor restrictions 1,007 3,382
Proceeds from the issuance of long-term debt — 76,574
Payments on long-term debt (4,980) (30,835)
Proceeds from short-term debt — 5,000
Payments on short-term debt (5,000) —
Increase (decrease) in federal student loan funds 316 (592)
Net payments on annuity agreements (418) (815)
Net cash provided by financing activities 20,029 76,280
Net increase (decrease) in cash and cash equivalents 4,746 (12,990)
Cash and cash equivalents, beginning of year 12,397 25,387
Cash and cash equivalents, end of year $ 17,143 12,397
Supplemental cash flow data:
Cash paid for interest $ 8,384 6,487
Capital assets acquired through accounts payable 421 6,099
Contributed securities 3,688 4,388
Capital assets sold recorded as notes receivable 1,689 —
See accompanying notes to consolidated financial statements.

CREIGHTON UNIVERSITY
Notes to Consolidated Financial Statements
June 30, 2019 and 2018
7 (Continued)
(1) Summary of Significant Accounting Policies
(a) Nature of Operations
Creighton University (Creighton or the University) is a private, Catholic, Jesuit, comprehensive
university located in Omaha, Nebraska. Creighton offers degree programs through four colleges,
four professional schools, and a graduate school. Creighton’s students come from nearly every state in
the country, as well as from numerous foreign countries, with the majority of students coming from the
Midwestern region of the United States.
Sources of operating revenue to Creighton predominantly consist of student tuition and fees, and also
include charges for healthcare services, grants and contracts, contributions, investment earnings,
auxiliary services, and others.
(b) Basis of Presentation
The consolidated financial statements have been prepared on the accrual basis of accounting in
accordance with U.S. generally accepted accounting principles (GAAP) and include the accounts of
Creighton University, Creighton Soccer Stadium, Inc. (CSSI), a wholly owned for-profit subsidiary, and
Creighton Dental QALICB, Inc. (Creighton Dental), a nonprofit subsidiary. Creighton University, CSSI,
and Creighton Dental are together referred to as the University. All material transactions between the
parent, CSSI, and Creighton Dental have been eliminated.
Resources are reported in two separate categories of net assets based on the existence or absence of
donor-imposed restrictions. In the accompanying consolidated financial statements, net assets that
have similar characteristics have been combined into categories as follows:
Net assets without donor restrictions – Net assets that are not subject to donor-imposed
stipulations. Net assets without donor restrictions may be designated for specific purposes by
action of the Board of Trustees.
Net assets with donor restrictions – Net assets whose use by the University is subject to
donor-imposed stipulations as follows:
o Net assets with donor restrictions (time or purpose) – Net assets whose use by the University
is subject to donor-imposed stipulations that will be fulfilled by actions of the University
pursuant to those stipulations or that expire by the passage of time.
o Net assets with donor restrictions (perpetual) – Net assets subject to donor-imposed
stipulations that they be maintained in perpetuity by the University. Generally, the donors of
these assets permit the University to use all or part of the income earned on these assets for
purposes consistent with the donor’s intent. Such assets primarily include the University’s
permanent endowment funds and irrevocable trusts held by others.
Expenses are generally reported as decreases in net assets without donor restrictions. Expirations of
donor-imposed stipulations that simultaneously increase one category of net assets and decrease
another are reported as releases between the applicable categories.
Net assets with donor restrictions (time or purpose) for which donor-imposed restrictions are met in
subsequent reporting periods are reclassified to net assets without donor restrictions and reported as

CREIGHTON UNIVERSITY
Notes to Consolidated Financial Statements
June 30, 2019 and 2018
8 (Continued)
net assets released from restrictions. Net assets released from restrictions also include net assets
without donor restrictions or net assets with donor restrictions for which donors have added, changed,
or removed restrictions on contributions. Net assets without donor-imposed restrictions, as well as
contributions for which donors have stipulated restrictions that are met within the same reporting
period, are reported as support without donor restrictions.
Conditional promises to give are not recorded until one or more barriers are overcome for the recipient
to be entitled to the assets transferred and there is either a right of return for the transferred assets or a
right of release of the promisor’s obligation to transfer assets. Unconditional promises to give are
recorded as receivables and revenue at fair value in the period the promise is made. Unconditional
promises to give with payments due in future periods are reported as support without donor restrictions.
Amounts due more than one year from the consolidated statement of financial position date are
recorded at the net realizable discounted cash flow, while amounts due in one year or less are
recorded at undiscounted net realizable value.
Gifts of land, building, equipment, or other assets are reported as support without donor restrictions
unless explicit donor stipulations specify how the donated assets must be used. Gifts of long-lived
assets with explicit restrictions that specify how the assets are to be used are reported as support
without donor restrictions. The University reports expirations of donor restrictions on long-lived assets
as the assets are placed in service. Gifts of land, building, equipment, or other assets are recorded at
estimated fair value.
(c) Use of Estimates
The preparation of the consolidated financial statements in conformity with U.S. GAAP requires
management to make certain estimates and assumptions that affect the reported amounts of assets
and liabilities and disclosure of contingent assets and liabilities at the date of the consolidated financial
statements and the reported amounts of revenue, expenses, and other changes in net assets during
the reporting period. Actual results could differ from those estimates.
(d) Measure of Operations
The increase or decrease in net assets without donor restrictions from operating activities reflected on
the accompanying consolidated financial statements includes primarily activities closely related to the
educational, healthcare, research, auxiliary, and administrative functions of the University. Amounts not
included in the measure of operations consist of contributions for nonoperating or long-term purposes,
equity losses in minority-owned affiliates, losses on extinguishment of debt, investment income on
endowments in excess of the established spending policy, certain amounts released from restrictions,
the change in the fair value of interest rate swaps, and significant items of an unusual or nonrecurring
nature. Operating results also include a reclassification associated with the amortization of capital gifts
placed in service, as described below.
(e) Capital Gifts to Acquire or Construct Long-Lived Assets
Capital gifts to acquire or construct a long-lived asset are recorded as a donor restricted gift until the
related asset is placed in service, at which time the capital gift is released from net assets with donor
restrictions to net assets without donor restrictions within the nonoperating section and subsequently
amortized into operations over the estimated useful life of the acquired or constructed asset. This
amortization, which amounted to $5,881 in fiscal year 2019 and $4,759 in fiscal year 2018, is recorded

CREIGHTON UNIVERSITY
Notes to Consolidated Financial Statements
June 30, 2019 and 2018
9 (Continued)
as a reclassification between the nonoperating and operating sections of the change in net assets
without donor restrictions in the consolidated statements of activities under capital gifts appropriated to
and for operations.
(f) Tuition and Fees
Tuition and fees represent charges for educational programs and services. Tuition discounts and
scholarship allowances represent a reduction of the tuition transaction price. Advance payments for
tuition, room, and board related to the next semester have been deferred and will be reported as
revenue in the year in which the services are rendered.
The following table depicts activities for deferred tuition revenue:
Payments
received for
future
Balance at Revenue performance Balance at
June 30, 2018 recognized obligations June 30, 2019
$ 5,421 (5,421) 9,707 9,707
Payments
received for
future
Balance at Revenue performance Balance at
June 30, 2017 recognized obligations June 30, 2018
$ 5,429 (5,429) 5,421 5,421
The University bills tuition and fees in advanced for each academic term. Tuition and fees revenue is
recognized ratably over time as the services are provided over the academic year, which generally
aligns with our fiscal year.
The composition of student tuition and fees revenue was as follows for the years ended June 30, 2019
and 2018:
2019 2018
Undergraduate $ 165,068 152,241
Graduate/Professional 149,269 143,905
Other tuition and fees 25,004 22,812
Tuition and fees at standard rates 339,341 318,958
Less:
Tuition discount and scholarship allowances (96,370) (91,059)
Tuition and fees $ 242,971 227,899

CREIGHTON UNIVERSITY
Notes to Consolidated Financial Statements
June 30, 2019 and 2018
10 (Continued)
(g) Healthcare Services
Healthcare services revenue represents patient charges for services provided through the University’s
health sciences clinical operations, including the schools of Medicine, Dentistry, and Pharmacy and
Health Professions. Payments for patient charges are generally received through medical insurance
arrangements (including Medicare and Medicaid) and payments from patients. Clinical operations
revenue reflects the consideration the University expects to be entitled in exchange for providing
services. Generally, revenue is recognized over time as patients receive services. The University
measures the performance obligation from the commencement of the services to the point when it is no
longer required to provide services to the patient. The University bills the patients and third-party
payers several days after the services are performed.
Revenue for healthcare services provided to the affiliated regional medical organizations is based upon
the corresponding operating agreements and the amount the University expects to be entitled in
exchange for services provided.
(h) Educational Support
Educational support contract revenue represents contract payments received for services, which
support the University’s educational mission, and is recorded at the amount the University expects to
be entitled in exchange for services provided. These primarily include payments from affiliated health
systems for the services of medical residents, physicians, and other medical staff from the University’s
Health Sciences schools. Educational support is billed on a monthly basis under terms of the specific
contract. Educational support is recognized over time based on costs incurred for services provided.
(i) Grants and Contracts
Grants and contracts consist primarily of contractual agreements with governmental and private entities
for the conduct of research and other sponsored programs. These agreements generally are
considered nonexchange transactions restricted by sponsors for certain purposes, are recognized as
revenue when qualifying expenditures are incurred and conditions under the agreements are met. The
University has elected the simultaneous release policy available under ASU 2018-08, which allows a
not-for-profit organization to recognize a restricted contribution directly in net assets without donor
restrictions if the restriction is met in the same period that the revenue is recognized. Payments
received from sponsors in advance of conditions being met are reported as deferred revenue, which
totaled $4,984 and $8,562 as of June 30, 2019 and 2018, respectively.
(j) Auxiliary Enterprises
Auxiliary enterprises include student housing and dining services, intercollegiate athletics, campus
recreation, the student center, and a child care center. Generally, auxiliary enterprises revenue is
recognized ratably over time as the services are provided over the academic year, which generally
aligns with the University’s fiscal year.

CREIGHTON UNIVERSITY
Notes to Consolidated Financial Statements
June 30, 2019 and 2018
11 (Continued)
The composition of auxiliary enterprises revenue was as follows for the years ended June 30, 2019 and
2018:
2019 2018
Room and board $ 33,661 30,983
Athletic ticket sales 9,348 7,089
Other 3,304 3,067
Auxiliary enterprises $ 46,313 41,139
(k) Cash and Cash Equivalents
Cash and cash equivalents represent cash on hand and highly liquid investments with original
maturities of less than three months from the date of purchase. Cash and cash equivalents
representing assets of endowment and similar funds are included in investments. Financial instruments
that potentially subject the University to a concentration of credit risk consist of cash and cash
equivalents. Cash and cash equivalents are deposited in demand and money market accounts and
deposits held with banks may exceed the amount of insurance provided on such deposits. The
University has not experienced any losses on its deposits of cash and cash equivalents.
(l) Investments
Investments are stated at fair value, except for investments in minority-owned subsidiaries.
Investments are exposed to various risks such as interest rate, market, and credit risks. Due to the
level of risk associated with certain investments, it is at least reasonably possible that changes in
values will occur in the near term and that such changes could materially affect the University’s
consolidated financial statements.
In accordance with the accounting policy of stating investments at fair value, the change in unrealized
appreciation or depreciation of those securities is reflected in investment income within the
accompanying consolidated financial statements. The cost of investments sold is determined by use of
the specific-identification method for all investments except those in the endowment. The cost of the
endowment investments (notes 5 and 6) is determined using individual unit values.
Funds held in trust by others represent amounts held by third-party trustees for the beneficial interest of
the University under perpetual trust agreements created by donors. The University’s interests in the
trusts are recorded at estimated fair value, with increases or decreases in fair value being reported as
investment gains or losses during the year.
The University owns minority interests in two affiliated entities: Children’s Physicians and the Creighton
University Arizona Health Education Alliance. The University’s ownership of Children’s Physicians and
Creighton University Arizona Health Education Alliance is recorded using the equity method.

CREIGHTON UNIVERSITY
Notes to Consolidated Financial Statements
June 30, 2019 and 2018
12 (Continued)
(m) Student Loans Receivable
Student loans receivable consist primarily of loans made to students under U.S. government loan
programs. The loans are stated at net realizable value in the accompanying consolidated financial
statements. These receivables are not saleable and contain federally mandated interest rates and
repayment terms subject to significant restrictions as to their transfer and disposition. The University
reviews receivables on an ongoing basis to assess collectability and records an allowance for potential
uncollectible balances based on historical experience and aging of the account balances. Provision for
bad debt and write-off activity related to the allowance for potential uncollectible balances for student
loans is not material to the consolidated financial statements. At June 30, 2019 and 2018, the amount
of loans past due under the student loan programs was $2,852 and $2,423, respectively.
(n) Refundable Government Student Loan Funds
Refundable government student loan funds consist of amounts advanced by the federal government on
the condition that the University administers various campus-based student loan programs subject to
federal regulations. Under certain conditions, the funds must be returned to the federal government.
The amounts are not saleable and can only be assigned to the U.S. government or its designees.
(o) Land, Buildings, and Equipment
Land, buildings, and equipment are primarily stated at cost of acquisition, less accumulated
depreciation. Generally, equipment purchases and renovations equal to or greater than $5 and $25,
respectively, are capitalized. The library collection is stated at cost or, if acquired by donation, at the
appraised value at the date of acquisition. Land, buildings, and equipment are removed from the
records at the time of disposal. Depreciation is computed on a straight-line basis over the estimated
useful life of buildings (10–40 years), library books and periodicals (25 years), and equipment (3–
15 years). Long-lived assets, such as property and equipment, are reviewed for impairment whenever
events or changes in circumstances indicate that the carrying amount of an asset may not be
recoverable. Gifts of land, building, equipment, or other assets are recorded at estimated fair value
when received.
(p) Income Taxes
The University has been recognized by the Internal Revenue Service as a tax-exempt organization
under Section 501(c)(3) of the Internal Revenue Code. U.S. GAAP requires management to evaluate
tax positions taken and recognize a tax liability (or asset) if the organization has taken an uncertain
position that more likely than not would not be sustained upon examination by the Internal Revenue
Service. The University is subject to routine audits by taxing jurisdictions; however, there are currently
no audits in progress for any tax periods. After evaluating the tax positions for the University and
Creighton Dental, none are considered to be uncertain. CSSI, a taxable subsidiary, had no taxable
income for 2019 and 2018. Accordingly, no federal or state income taxes have been provided. As of
June 30, 2019 and 2018, the University, CSSI, and Creighton Dental had no liability for unrecognized
tax benefits.

CREIGHTON UNIVERSITY
Notes to Consolidated Financial Statements
June 30, 2019 and 2018
13 (Continued)
(q) Accounting Standards Implemented in Current Year
During 2019, the University adopted Accounting Standards Update (ASU) No. 2016-14, Not-for-Profit
Entities (Topic 958): Presentation of Financial Statements of Not-for-Profit Entities. This standard is
intended to improve the net asset classification requirements and the information presented in the
financial statements and notes about a not-for-profit entity’s liquidity, financial performance, and cash
flows. Main provisions of this standard include: presentation of two classes of net assets versus the
previously required three; recognition of capital gifts for construction as a net asset without donor
restrictions when the associated long-lived assets is placed in service; and recognition of underwater
endowment funds as a reduction in net assets with donor restrictions instead of without donor
restrictions as previously presented. The standard also enhances disclosures for board designated
amounts, composition of net assets without donor restrictions, liquidity, and expenses by both their
natural and functional classification. The University adopted ASU 2016-14 retrospectively.
As a result of the adoption of ASU 2016-14, certain accounts on the consolidated statement of activities
were reclassified. In addition, net assets as of July 1, 2017 were reclassified as follows:
ASU 2016-14 Classifications
Without donor With donor Total net
Net assets classifications restrictions restrictions assets
As previously presented:
Unrestricted $ 440,915 — 440,915
Temporarily restricted — 228,906 228,906
Permanently restricted — 225,187 225,187
Net assets as previously reported 440,915 454,093 895,008
Reclassifications to implement ASU 2016-14:
Capital gifts for construction 111,761 (111,761) —
Underwater endowments 1,202 (1,202) —
Net assets, as restated $ 553,878 341,130 895,008
During 2019, the University adopted ASU 2014-09, Revenue from Contracts with Customers (Topic
606), which requires an entity to recognize the amount of revenue to which it expects to be entitled for
the transfer of promised goods or services to customers. This ASU replaced most existing revenue
recognition guidance in U.S. GAAP. The University’s adoption of the ASU did not have a material
impact on the timing or amount of revenue recognized by the University. The University elected to use
the cumulative-effect transition method.
CREIGHTON UNIVERSITY
Notes to Consolidated Financial Statements
June 30, 2019 and 2018
14 (Continued)
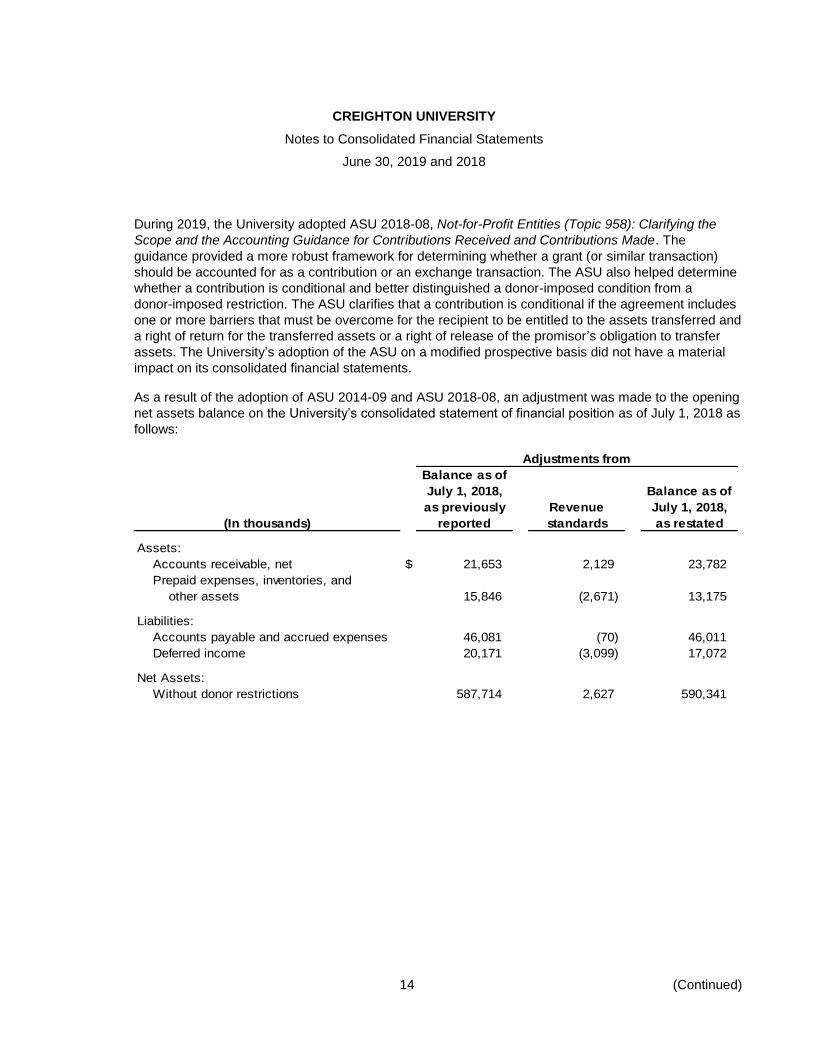
During 2019, the University adopted ASU 2018-08, Not-for-Profit Entities (Topic 958): Clarifying the
Scope and the Accounting Guidance for Contributions Received and Contributions Made. The
guidance provided a more robust framework for determining whether a grant (or similar transaction)
should be accounted for as a contribution or an exchange transaction. The ASU also helped determine
whether a contribution is conditional and better distinguished a donor-imposed condition from a
donor-imposed restriction. The ASU clarifies that a contribution is conditional if the agreement includes
one or more barriers that must be overcome for the recipient to be entitled to the assets transferred and
a right of return for the transferred assets or a right of release of the promisor’s obligation to transfer
assets. The University’s adoption of the ASU on a modified prospective basis did not have a material
impact on its consolidated financial statements.
As a result of the adoption of ASU 2014-09 and ASU 2018-08, an adjustment was made to the opening
net assets balance on the University’s consolidated statement of financial position as of July 1, 2018 as
follows:
Adjustments from
Balance as of
July 1, 2018, Balance as of
as previously Revenue July 1, 2018,
(In thousands) reported standards as restated
Assets:
Accounts receivable, net $ 21,653 2,129 23,782
Prepaid expenses, inventories, and
other assets 15,846 (2,671) 13,175
Liabilities:
Accounts payable and accrued expenses 46,081 (70) 46,011
Deferred income 20,171 (3,099) 17,072
Net Assets:
Without donor restrictions 587,714 2,627 590,341
CREIGHTON UNIVERSITY
Notes to Consolidated Financial Statements
June 30, 2019 and 2018
15 (Continued)
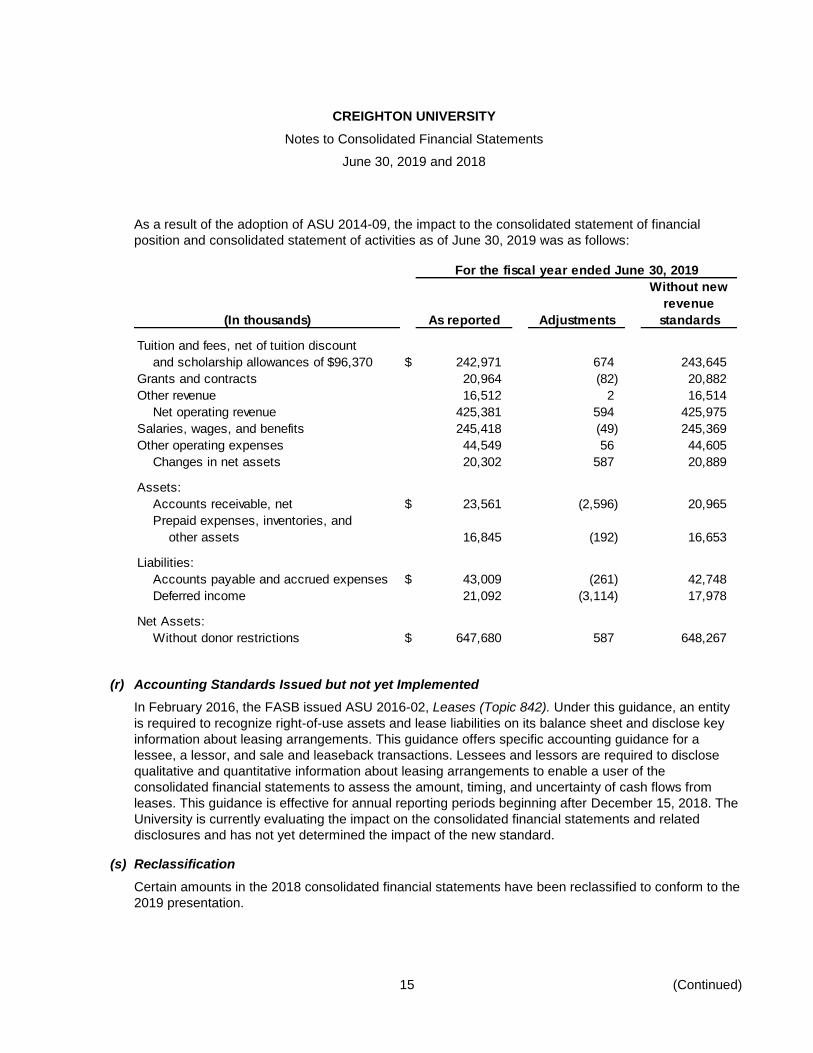
As a result of the adoption of ASU 2014-09, the impact to the consolidated statement of financial
position and consolidated statement of activities as of June 30, 2019 was as follows:
For the fiscal year ended June 30, 2019
Without new
revenue
(In thousands) As reported Adjustments standards
Tuition and fees, net of tuition discount
and scholarship allowances of $96,370 $ 242,971 674 243,645
Grants and contracts 20,964 (82) 20,882
Other revenue 16,512 2 16,514
Net operating revenue 425,381 594 425,975
Salaries, wages, and benefits 245,418 (49) 245,369
Other operating expenses 44,549 56 44,605
Changes in net assets 20,302 587 20,889
Assets:
Accounts receivable, net $ 23,561 (2,596) 20,965
Prepaid expenses, inventories, and
other assets 16,845 (192) 16,653
Liabilities:
Accounts payable and accrued expenses $ 43,009 (261) 42,748
Deferred income 21,092 (3,114) 17,978
Net Assets:
Without donor restrictions $ 647,680 587 648,267
(r) Accounting Standards Issued but not yet Implemented
In February 2016, the FASB issued ASU 2016-02, Leases (Topic 842). Under this guidance, an entity
is required to recognize right-of-use assets and lease liabilities on its balance sheet and disclose key
information about leasing arrangements. This guidance offers specific accounting guidance for a
lessee, a lessor, and sale and leaseback transactions. Lessees and lessors are required to disclose
qualitative and quantitative information about leasing arrangements to enable a user of the
consolidated financial statements to assess the amount, timing, and uncertainty of cash flows from
leases. This guidance is effective for annual reporting periods beginning after December 15, 2018. The
University is currently evaluating the impact on the consolidated financial statements and related
disclosures and has not yet determined the impact of the new standard.
(s) Reclassification
Certain amounts in the 2018 consolidated financial statements have been reclassified to conform to the
2019 presentation.

CREIGHTON UNIVERSITY
Notes to Consolidated Financial Statements
June 30, 2019 and 2018
16 (Continued)
(2) Net Assets
Net assets without donor restrictions consist of the following:
2019 2018
Board-designated endowment funds (note 6) $ 252,761 245,851
Other net assets without donor restrictions 394,919 341,863
Total net assets without donor restrictions $ 647,680 587,714
Net assets with donor restrictions (time or purpose) consist of the following:
2019 2018
Contributions for buildings yet to be placed in service $ 4,175 32,186
Contributions receivable 5,395 1,509
Annuity and life income funds 4,122 3,941
Unexpended income and contributions for restricted purposes 12,079 10,373
Unappropriated donor-restricted endowment earnings (note 6) 92,144 90,999
Total net assets with donor restrictions
(time or purpose) $ 117,915 139,008
Net assets with donor restrictions (perpetual) consist of the following:
2019 2018
Endowment funds (note 6) $ 216,743 207,456
Endowment funds held in trust by others (note 6) 25,376 24,507
Student loan funds 442 435
Annuity and life income funds 6,748 4,784
Total net assets with donor restrictions (perpetual) $ 249,309 237,182

CREIGHTON UNIVERSITY
Notes to Consolidated Financial Statements
June 30, 2019 and 2018
17 (Continued)
(3) Accounts Receivable, Net
Accounts receivable, net consist of the following:
2019 2018
Student accounts receivable, net $ 7,967 5,586
Grant funds receivable 6,055 2,533
Medical affiliate receivables 4,257 5,921
Miscellaneous receivables 5,282 7,613
Total accounts receivable, net $ 23,561 21,653
Student accounts receivable is recorded net of estimated reserves for uncollectible amounts of $3,296 and
$3,054 at June 30, 2019 and 2018, respectively.
(4) Financial Assets and Liquidity Resources
The University regularly monitors liquidity required to meet its operating needs and other contractual
commitments, including capital. Resources available to the University to fund general expenditures, such
as operating expenses, scheduled principal and interest payments on debt, and internally funded capital
costs, have seasonal variations related to the timing of tuition payments, receipts of gifts and pledge
payments, and transfers from the endowment. The University actively manages its resources, utilizing a
combination of short and long-term operating investment strategies to align cash inflows with anticipated
outflows. As of June 30, 2019, existing financial assets available within one year were as follows:
Financial assets:
Cash and cash equivalents $ 17,143
Accounts receivable, net 23,561
Contributions receivable, net, due within one year 76
Notes receivable, net, due within one year 625
Investments not subject to donor restrictions or Board designations,
available within one year 96,150
Fiscal 2020 endowment payout:
Payout on donor-restricted endowments 12,023
Payout on board-designated endowments 9,227
Payout on other endowments without donor restrictions 462
Total financial assets available within one year $ 159,267
Student loans receivable are not considered to be available to meet general expenditures since principal
and interest collected on these loans are used to make new loans.
The University included in this analysis, the amount of funds authorized by the Board of Trustees to be
distributed from the endowment. The University’s Board of Trustees has designated a portion of its

CREIGHTON UNIVERSITY
Notes to Consolidated Financial Statements
June 30, 2019 and 2018
18 (Continued)
resources without donor restrictions for endowment and other purposes. These funds are invested for
long-term appreciation and current income but remain available, as needed. As of June 30, 2019, the
University had $252,761 in funds functioning as endowment, which are available for general expenditure
with Board of Trustees approval.
The University maintains two lines of credit which can be drawn upon as needed to meet short-term needs
(see note 10).
(5) Investments
University investments as of June 30, 2019 and 2018 comprise the following:
2019 2018
Short-term investments $ 132 218
Long-term investments 731,249 720,143
Investment in minority-owned subsidiaries and affiliates 2,418 3,108
Funds held in trust by others 26,183 25,314
Total University investments $ 759,982 748,783
Fair value is defined as the exchange price that would be received for an asset or paid to transfer a liability
in the principal or most advantageous market for the asset or liability in an orderly transaction between
market participants on the measurement date. The University discloses a fair value hierarchy that
prioritizes the inputs to valuation techniques used to measure fair value. The fair value hierarchy gives the
highest priority to quoted prices in active markets (Level 1) and the lowest priority to unobservable data
(Level 3). In some cases, the inputs used to measure fair value might fall in different levels of the fair value
hierarchy. The lowest-level input that is significant to a fair value measurement in its entirety determines the
applicable level in the fair value hierarchy. Assessing the significance of a particular input to the fair value
measurement in its entirety requires judgment, considering factors specific to the asset or liability. Fair
value measurements are categorized as Level 3 when a significant amount of price or other inputs that are
considered to be unobservable are used in their valuations.
The three levels of inputs that may be used to measure fair value are as follows:
Level 1 – Observable inputs such as quoted prices in active markets that the University has the ability to
access at the measurement date.
Level 2 – Inputs other than quoted prices in active markets such as quoted prices for similar assets or
liabilities, quoted prices in markets that are not active, or other inputs that are observable or can be
corroborated by observable market data for substantially the full term of the assets or liabilities.
Level 3 – Unobservable inputs where there is little or no market data and which require the University to
develop its own assumptions about the inputs that market participants would use to price an instrument
based on the best available information.
CREIGHTON UNIVERSITY
Notes to Consolidated Financial Statements
June 30, 2019 and 2018
19 (Continued)
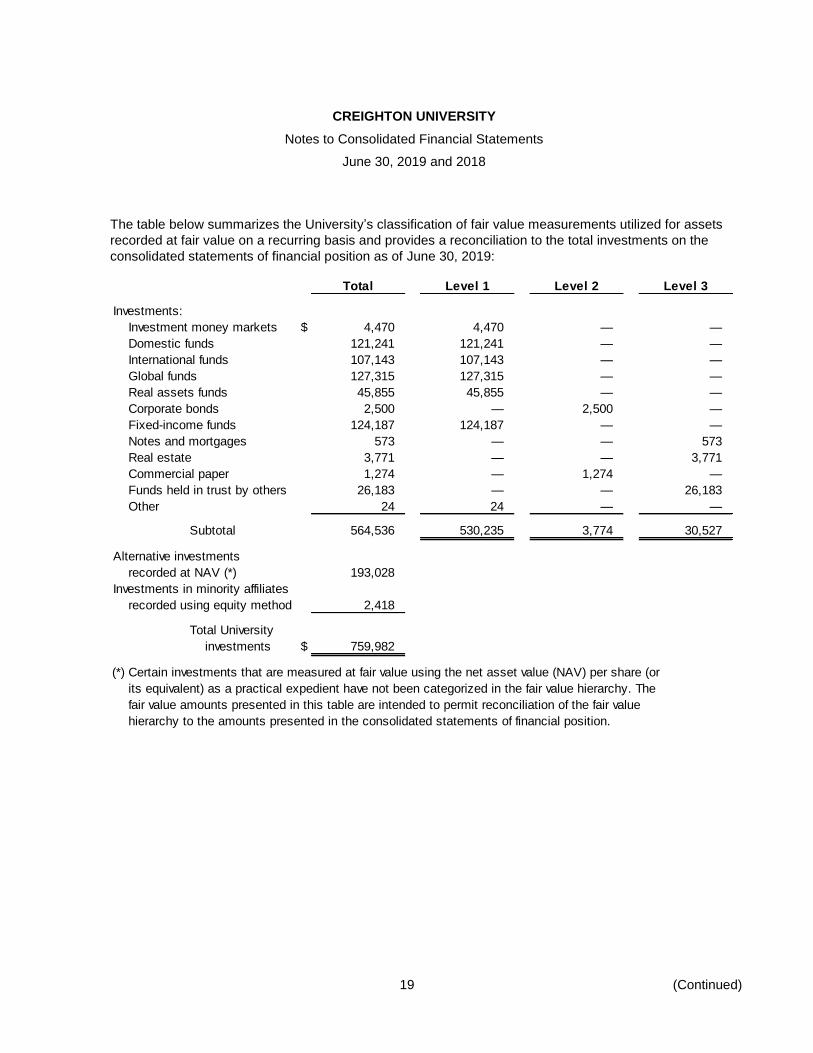
The table below summarizes the University’s classification of fair value measurements utilized for assets
recorded at fair value on a recurring basis and provides a reconciliation to the total investments on the
consolidated statements of financial position as of June 30, 2019:
Total Level 1 Level 2 Level 3
Investments:
Investment money markets $ 4,470 4,470 — —
Domestic funds 121,241 121,241 — —
International funds 107,143 107,143 — —
Global funds 127,315 127,315 — —
Real assets funds 45,855 45,855 — —
Corporate bonds 2,500 — 2,500 —
Fixed-income funds 124,187 124,187 — —
Notes and mortgages 573 — — 573
Real estate 3,771 — — 3,771
Commercial paper 1,274 — 1,274 —
Funds held in trust by others 26,183 — — 26,183
Other 24 24 — —
Subtotal 564,536 530,235 3,774 30,527
Alternative investments
recorded at NAV (*) 193,028
Investments in minority affiliates
recorded using equity method 2,418
Total University
investments $ 759,982
(*) Certain investments that are measured at fair value using the net asset value (NAV) per share (or
its equivalent) as a practical expedient have not been categorized in the fair value hierarchy. The
fair value amounts presented in this table are intended to permit reconciliation of the fair value
hierarchy to the amounts presented in the consolidated statements of financial position.

CREIGHTON UNIVERSITY
Notes to Consolidated Financial Statements
June 30, 2019 and 2018
20 (Continued)
The table below summarizes the University’s classification of fair value measurements utilized for assets
recorded at fair value on a recurring basis and provides a reconciliation to the total investments on the
consolidated statements of financial position as of June 30, 2018:
Total Level 1 Level 2 Level 3
Investments:
Investment money markets $ 10,905 10,905 — —
Domestic funds 119,816 119,816 — —
International funds 127,620 127,620 — —
Global funds 107,167 107,167 — —
Real assets funds 45,352 45,352 — —
Corporate bonds 2,500 — 2,500 —
Fixed-income funds 112,612 112,612 — —
Notes and mortgages 717 — — 717
Real estate 4,546 — — 4,546
Commercial paper 12,749 — 12,749 —
Funds held in trust by others 25,314 — — 25,314
Other 172 172 — —
Subtotal 569,470 523,644 15,249 30,577
Alternative investments
recorded at NAV (*) 176,205
Investments in minority affiliates
recorded using equity method 3,108
Total University
investments $ 748,783
(*) Certain investments that are measured at fair value using the net asset value (NAV) per share (or
its equivalent) as a practical expedient have not been categorized in the fair value hierarchy. The
fair value amounts presented in this table are intended to permit reconciliation of the fair value
hierarchy to the amounts presented in the consolidated statements of financial position.
Fair value of the University’s financial instruments is determined using the methods and assumptions as set
forth below. While the University believes that its valuation methods are appropriate and consistent with
those of other market participants, use of different methodologies or assumptions to determine the fair
value of certain financial instruments could result in a different fair value at the reporting date. There were
no changes in valuation methodology from 2018 to 2019.
Investment money market funds and cash and cash equivalents – Money market funds included with cash
and cash equivalents and investment money market funds are recorded at fair value using quoted market
prices. These are classified as Level 1 as they are traded in an active market for which closing prices are
readily available.
CREIGHTON UNIVERSITY
Notes to Consolidated Financial Statements
June 30, 2019 and 2018
21 (Continued)
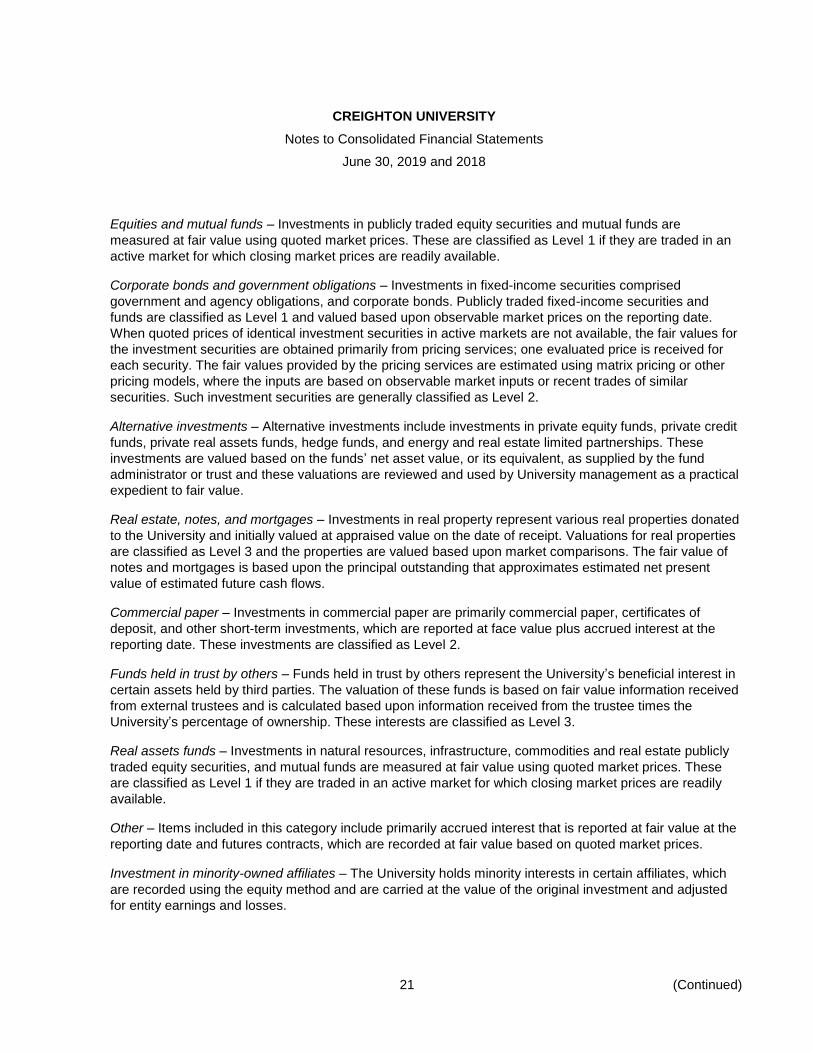
Equities and mutual funds – Investments in publicly traded equity securities and mutual funds are
measured at fair value using quoted market prices. These are classified as Level 1 if they are traded in an
active market for which closing market prices are readily available.
Corporate bonds and government obligations – Investments in fixed-income securities comprised
government and agency obligations, and corporate bonds. Publicly traded fixed-income securities and
funds are classified as Level 1 and valued based upon observable market prices on the reporting date.
When quoted prices of identical investment securities in active markets are not available, the fair values for
the investment securities are obtained primarily from pricing services; one evaluated price is received for
each security. The fair values provided by the pricing services are estimated using matrix pricing or other
pricing models, where the inputs are based on observable market inputs or recent trades of similar
securities. Such investment securities are generally classified as Level 2.
Alternative investments – Alternative investments include investments in private equity funds, private credit
funds, private real assets funds, hedge funds, and energy and real estate limited partnerships. These
investments are valued based on the funds’ net asset value, or its equivalent, as supplied by the fund
administrator or trust and these valuations are reviewed and used by University management as a practical
expedient to fair value.
Real estate, notes, and mortgages – Investments in real property represent various real properties donated
to the University and initially valued at appraised value on the date of receipt. Valuations for real properties
are classified as Level 3 and the properties are valued based upon market comparisons. The fair value of
notes and mortgages is based upon the principal outstanding that approximates estimated net present
value of estimated future cash flows.
Commercial paper – Investments in commercial paper are primarily commercial paper, certificates of
deposit, and other short-term investments, which are reported at face value plus accrued interest at the
reporting date. These investments are classified as Level 2.
Funds held in trust by others – Funds held in trust by others represent the University’s beneficial interest in
certain assets held by third parties. The valuation of these funds is based on fair value information received
from external trustees and is calculated based upon information received from the trustee times the
University’s percentage of ownership. These interests are classified as Level 3.
Real assets funds – Investments in natural resources, infrastructure, commodities and real estate publicly
traded equity securities, and mutual funds are measured at fair value using quoted market prices. These
are classified as Level 1 if they are traded in an active market for which closing market prices are readily
available.
Other – Items included in this category include primarily accrued interest that is reported at fair value at the
reporting date and futures contracts, which are recorded at fair value based on quoted market prices.
Investment in minority-owned affiliates – The University holds minority interests in certain affiliates, which
are recorded using the equity method and are carried at the value of the original investment and adjusted
for entity earnings and losses.

CREIGHTON UNIVERSITY
Notes to Consolidated Financial Statements
June 30, 2019 and 2018
22 (Continued)
The University’s policy is to reflect transfers between levels at the beginning of the year in which a change
in circumstances resulted in the transfer. There were no transfers between Level 1, 2, or 3 investments for
the years ended June 30, 2019 and 2018.
The estimated fair value of certain alternative investments, such as partnerships, hedge funds, and private
equity funds, was provided by the respective companies. For these alternative investments, the University
used the net asset value (or its equivalent) reported by the underlying fund to estimate the fair value of the
investment as a practical expedient to fair value. Below is a summary of investments accounted for at net
asset value as of June 30, 2019 and 2018:
Redemptionfrequency (if
Fiscal year ended Fair Unfunded currently RedemptionJune 30, 2019 value commitment eligible) notice period Investment strategy
Private equity funds (a) $ 91,492 63,722 Illiquid — Multiple strategiesReal assets (b) 38,084 21,437 Illiquid — Multiple strategiesHedge fund 63,452 — 1–180 days 1–95 days Multiple strategies
Total $ 193,028 85,159
(a) These funds are expected to liquidate within 1 to 12 years.(b) These funds are expected to liquidate within 1 to 12 years.
Redemptionfrequency (if
Fiscal year ended Fair Unfunded currently RedemptionJune 30, 2018 value commitment eligible) notice period Investment strategy
Private equity funds (a) $ 73,726 56,629 Illiquid — Multiple strategiesReal assets (b) 54,924 26,226 Illiquid — Multiple strategiesHedge fund 47,555 — 1–180 days 1–95 days Multiple strategies
Total $ 176,205 82,855
(a) These funds are expected to liquidate within 1 to 12 years.(b) These funds are expected to liquidate within 2 to 12 years.
Due to the nature of the investments held by the funds, changes in market conditions and the economic
environment may significantly impact the net asset value of the funds and, consequently, the fair value of
the University’s interests in the funds. Although a secondary market exists for these investments, it is not
active and individual transactions are typically not observable. When transactions do occur in this limited
secondary market, they may occur at discounts to the reported net asset value. It is, therefore, reasonably
possible that if the University were to sell these investments in the secondary market, a buyer may require
a discount to the reported net asset value, and the discount could be significant.

CREIGHTON UNIVERSITY
Notes to Consolidated Financial Statements
June 30, 2019 and 2018
23 (Continued)
(6) Endowment Fund
The University’s endowment consists primarily of funds invested in an externally managed pooled
endowment fund. The composition of the total endowment fund as of June 30, 2019 and 2018 is as follows:
2019 2018
University share of pooled endowment fund $ 708,940 687,533
Operational and other funds invested in the pooled fund (148,859) (148,138)
Endowment funds held in trust by others 25,376 24,507
Nonpooled assets, including cash and cash equivalents,
notes receivable, real estate, and other 1,567 4,911
Total endowment $ 587,024 568,813
Certain assets of the endowment fund are pooled on a market value basis. Each individual pooled
endowment fund subscribes to or disposes of units on the basis of the per-unit market value at the
beginning of the calendar month within which the transaction takes place. The following table illustrates the
relative percentage composition of the investments at June 30, 2019 and 2018 by security type, based
upon the function that the investment serves in the portfolio:
2019 2018
Equities – domestic 16 % 16 %
Equities – international 14 18
Equities – global 18 15
Fixed-income securities 18 17
Hedge funds 9 7
Private capital and real assets funds 24 25
Cash and cash equivalents 1 2
100 % 100 %
The total rate of return on the pooled endowment fund was 4.5% for the year ended June 30, 2019 and
7.0% for the year ended June 30, 2018.
(a) UPMIFA
The University applies the provisions of the Nebraska Uniform Prudent Management of Institutional
Funds Act (the Act) and the related provisions of Accounting Standards Codification (ASC) 958-205-05,
Reporting Endowment Funds, in managing its endowment. ASC 958-205-05 provides guidance on the
net asset classification of donor-restricted endowment funds for a not-for-profit organization that is
subject to an enacted version of the Act and also requires certain disclosures about both
donor-restricted and board-designated endowment funds.

CREIGHTON UNIVERSITY
Notes to Consolidated Financial Statements
June 30, 2019 and 2018
24 (Continued)
The University’s endowment consists of in excess of 1,100 individual funds established for a variety of
purposes including both donor-restricted endowment funds and funds designated by the University’s
Board of Trustees to function as endowments. Net assets associated with the endowment, including
the board-designated funds, are classified and reported based upon the presence or absence of
donor-imposed restrictions.
(b) Interpretation of Relevant Law
The University’s Board of Trustees has interpreted the Act as allowing the University to appropriate for
expenditure or accumulate as much of an endowment fund as the University determines is prudent for
the uses, benefits, purposes, and direction for which the endowment fund is established, subject to the
intent of the donor as expressed in the gift instrument. As a result of this interpretation, the University
classifies as net assets with donor restrictions (perpetual) (a) the original value of the gifts donated to
the perpetual endowment, (b) the original value of subsequent gifts to the perpetual endowment, and
(c) accumulations to the perpetual endowment made in accordance with the direction of the applicable
donor gift instrument at the time the accumulation is added to the fund.
The remaining portion of the donor-restricted endowment fund that is not classified in net assets with
donor restrictions (perpetual) is classified as net assets with donor restrictions (time or purpose) until
those amounts are appropriated for expenditure by the University in a manner consistent with the
standard of prudence prescribed by the Act.
(c) Endowment Net Asset Composition by Fund Type
The endowment composition by type of fund is illustrated in the following tables:
With donor With donor
Without donor restrictions restrictions
restrictions (time or purpose) (perpetual) Total
June 30, 2019:
Donor-restricted endowments $ — 92,144 242,119 334,263
Board-designated endowments 252,761 — — 252,761
Endowment totals $ 252,761 92,144 242,119 587,024
With donor With donor
Without donor restrictions restrictions
restrictions (time or purpose) (perpetual) Total
June 30, 2018:
Donor-restricted endowments $ — 90,999 231,963 322,962
Board-designated endowments 245,851 — — 245,851
Endowment totals $ 245,851 90,999 231,963 568,813
CREIGHTON UNIVERSITY
Notes to Consolidated Financial Statements
June 30, 2019 and 2018
25 (Continued)
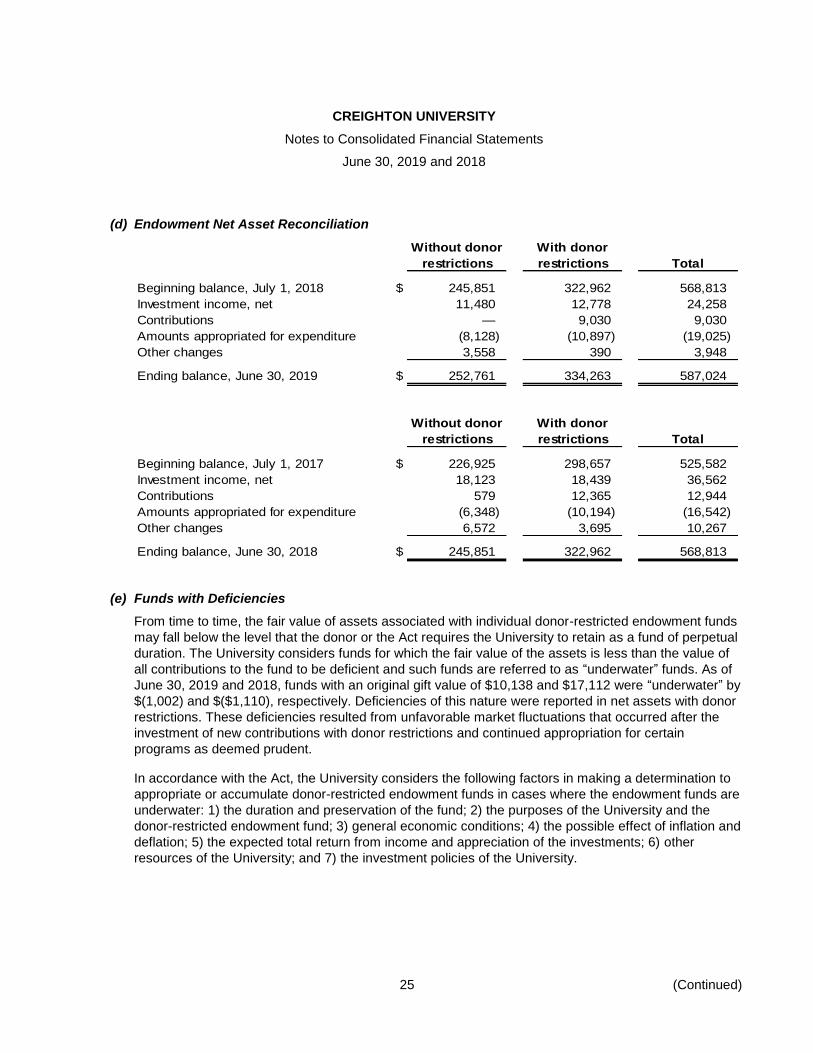
(d) Endowment Net Asset Reconciliation
Without donor With donor
restrictions restrictions Total
Beginning balance, July 1, 2018 $ 245,851 322,962 568,813
Investment income, net 11,480 12,778 24,258
Contributions — 9,030 9,030
Amounts appropriated for expenditure (8,128) (10,897) (19,025)
Other changes 3,558 390 3,948
Ending balance, June 30, 2019 $ 252,761 334,263 587,024
Without donor With donor
restrictions restrictions Total
Beginning balance, July 1, 2017 $ 226,925 298,657 525,582
Investment income, net 18,123 18,439 36,562
Contributions 579 12,365 12,944
Amounts appropriated for expenditure (6,348) (10,194) (16,542)
Other changes 6,572 3,695 10,267
Ending balance, June 30, 2018 $ 245,851 322,962 568,813
(e) Funds with Deficiencies
From time to time, the fair value of assets associated with individual donor-restricted endowment funds
may fall below the level that the donor or the Act requires the University to retain as a fund of perpetual
duration. The University considers funds for which the fair value of the assets is less than the value of
all contributions to the fund to be deficient and such funds are referred to as “underwater” funds. As of
June 30, 2019 and 2018, funds with an original gift value of $10,138 and $17,112 were “underwater” by
$(1,002) and $($1,110), respectively. Deficiencies of this nature were reported in net assets with donor
restrictions. These deficiencies resulted from unfavorable market fluctuations that occurred after the
investment of new contributions with donor restrictions and continued appropriation for certain
programs as deemed prudent.
In accordance with the Act, the University considers the following factors in making a determination to
appropriate or accumulate donor-restricted endowment funds in cases where the endowment funds are
underwater: 1) the duration and preservation of the fund; 2) the purposes of the University and the
donor-restricted endowment fund; 3) general economic conditions; 4) the possible effect of inflation and
deflation; 5) the expected total return from income and appreciation of the investments; 6) other
resources of the University; and 7) the investment policies of the University.
CREIGHTON UNIVERSITY
Notes to Consolidated Financial Statements
June 30, 2019 and 2018
26 (Continued)
(f) Return Objectives and Risk Parameters
The University has adopted investment and spending policies that attempt to provide a predictable
stream of funding to programs supported by the endowment while seeking to maintain the purchasing
power of the endowment assets. Under this policy, as approved by the Board of Trustees, the
endowment assets are invested in a manner that is intended to produce results that exceed the
spending rate and long-term inflation rate while assuming a prudent level of investment risk. The
University expects its endowment funds, over three to five years, to provide an average nominal rate of
return, net of investment fees, of approximately 7.00% annualized. Actual returns in any given year
may vary from this amount.
(g) Strategies Employed for Achieving Objectives
To satisfy its long-term rate-of-return objectives, the University relies on a total return strategy in which
investment returns are achieved through both capital appreciation (realized and unrealized) and current
yield (interest and dividends). The University targets a diversified asset allocation that places emphasis
on investments in equities, fixed income, hedge funds, private markets, and other strategies to achieve
its long-term return objectives within prudent risk constraints.
(h) Endowment Spending Policy
The University endowment spending formula represents a 50/50 weighting between market value and
prior year’s spending. It is designed to provide a measure of stability for budgeting purposes and help
preserve the purchasing power of the endowment over the long term. There is also a spending cap of
5% and a floor of 2% to further ensure that significant fluctuations and “overspending” are avoided.
Specifically, the calculated distribution is the sum of:
Prior year distribution multiplied by inflation multiplied by 50%
Market value (one year prior to start of year being budgeted) multiplied by 4.90% multiplied by 50%
The amounts calculated for distribution are further reviewed for any funds that are underwater. Based
on the review and assessment of the specific factors described above, the distribution may be reduced
or suspended for the applicable year.
In establishing the spending policy, the University considered the expected return on its endowment
and, accordingly, expects the current spending policy to allow the endowment to maintain its
purchasing power by growing at a rate equal to planned distributions over the long term. Additional real
growth will be provided through new gifts and any excess investment return.

CREIGHTON UNIVERSITY
Notes to Consolidated Financial Statements
June 30, 2019 and 2018
27 (Continued)
(7) Land, Buildings, and Equipment, Net
Land, buildings, and equipment consist of the following:
2019 2018
Land $ 45,120 45,193
Land improvements 32,167 39,826
Buildings 590,477 487,896
Equipment 98,015 89,715
Library collection 72,840 71,677
Construction in progress 24,941 93,190
863,560 827,497
Accumulated depreciation (370,868) (352,021)
$ 492,692 475,476
(8) Contributions Receivable
Unconditional promises to give are included in the consolidated financial statements as contributions
receivable and revenue within the appropriate net asset category. Values expected to be received are
discounted to net present value using a risk-adjusted discount rates, ranging from 3.00% to 5.57%.
Unconditional promises to give are expected to be realized in the following periods:
2019 2018
One year or less $ 76 891
Between one and five years 3,455 —
More than five years 2,989 773
Less discount (1,125) (155)
$ 5,395 1,509
In addition, donors to the University have indicated intentions to contribute in future periods approximately
$54,851 and $50,936 at June 30, 2019 and 2018, respectively. These amounts are not included in
contributions receivable because they do not constitute unconditional promises to give. It is not practicable
to estimate the net realizable value of these intentions to contribute or the period over which they will be
collected.

CREIGHTON UNIVERSITY
Notes to Consolidated Financial Statements
June 30, 2019 and 2018
28 (Continued)
(9) Bonds and Notes Payable
Bonds and notes payable, net of premium, discount and issuance costs at June 30, 2019 and 2018 consist
of the following:
2019 2018
$99,675 issuance of bonds (Douglas County Educational
Facilities Revenue Refunding Bonds 2014); annual principal
and interest payments through 2036; interest rates variable,
2.16% to 2.52% for 2019 (collateralized by unrestricted
receipts, revenue, and income of the University) $ 95,826 96,532
$72,250 issuance of loan notes (Douglas County Educational
Facilities Loan Notes 2017); annual principal and interest
payments through 2047; interest rates 3.00%
to 5.00%; (collateralized by unrestricted receipts, revenue,
and income of the University) 75,260 79,122
$13,180 issuance of loan notes (Douglas County Educational
Facilities Loan Notes 2010B); annual principal and interest
payments through 2029; interest rates 6.03% to
7.34%; (collateralized by unrestricted receipts, revenue,
and income of the University) 9,025 9,630
$5,457 issuance of notes payable (URP Subsidiary CDE XXIX,
LLC CDE Loan A); quarterly interest payments
through 2023; interest rate 0.763%; (collateralized
by certain University property) 5,351 5,325
$1,943 issuance of notes payable (URP Subsidiary CDE XXIX,
LLC CDE Loan B); quarterly interest payments
through 2023; interest rate 0.763%; (collateralized
by certain University property) 1,905 1,896
$4,452 issuance of notes payable (UACD Sub CDE 27 LLC CDE
Loan A); quarterly interest payments
through 2023; interest rate 1.269%; (collateralized
by certain University property) 4,366 4,345
$1,918 issuance of notes payable (UACD Sub CDE 27 LLC CDE
Loan B); quarterly interest payments through 2023; interest
rate 1.269%; (collateralized by certain University property) 1,881 1,871
$3,423 issuance of notes payable (UACD Sub CDE 26 LLC CDE
Loan A); quarterly interest payments through 2023; interest
rate 1.239%; (collateralized by certain University property) 3,357 3,340

CREIGHTON UNIVERSITY
Notes to Consolidated Financial Statements
June 30, 2019 and 2018
29 (Continued)
2019 2018
$1,477 issuance of notes payable (UACD Sub CDE 26 LLC CDE
Loan B); quarterly interest payments through 2023; interest
rate 1.239%; (collateralized by certain University property) $ 1,448 1,441
Total bonds and notes payable 198,419 203,502
Less current portion of bonds and notes payable (5,178) (5,083)
Noncurrent portion of bonds and notes payable $ 193,241 198,419
On December 4, 2017, the University issued $72,250 tax-exempt Series 2017 bonds through the County of
Douglas, Nebraska. The proceeds from the Series 2017 bonds were used to fund construction of and
equipment for a new dental school facility and to refinance $29,610 outstanding of the Series 2010A bonds.
The Series 2010A debt service reserve fund was redeemed as part of this transaction and the amount
applied against the outstanding Series 2010A amount. The bonds were issued on a serial basis with
various maturities and will bear interest at a fixed rate paid on a semi-annual basis.
On May 16, 2014, the University issued $99,675 tax-exempt Series 2014 bonds through the County of
Douglas, Nebraska. The proceeds from the Series 2014 bonds were used to refinance $99,675 outstanding
of the Series 2008 bonds. The Series 2014 bonds were purchased by one investor in a direct placement
transaction, but the investor may sell all or a portion of the bonds at any time. Amounts outstanding under
the Series 2014 bonds initially bear interest at a variable rate, but the University has the option to convert to
a fixed rate upon written notice to the trustee. On May 1, 2017, the Series 2014 bond documents were
amended to provide for i) an extension of the direct placement period for three years to May 15, 2020; ii) a
revision to the financial covenants; and iii) a revision to the floating rate index and applicable spread.
Effective January 1, 2018, the floating rate index and applicable spread were increased in accordance with
the Indenture due to a decrease in the corporate tax rate. Effective November 1, 2018, the bond
documents were amended to adjust the applicable spread.
On December 15, 2010, the University issued $13,180 taxable Series 2010B bonds through the County of
Douglas, Nebraska. The proceeds from the Series 2010B bonds were used to refinance $11,800
outstanding of the Nonrevolving Credit Note dated June 11, 2010. Proceeds from the Series 2010B bonds
were used also to fund various debt service reserve accounts and to pay issuance costs. Amounts
outstanding were issued on a serial basis with various maturity dates and will bear interest at a fixed rate
paid on a semiannual basis. The final maturity date is July 1, 2028.
On October 18, 2016, certain entities provided $18,670 in debt financing to Creighton Dental through the
New Markets Tax Credit Financing (note 15). Creighton Dental is required to make interest-only payments
on the six notes payable for a period of seven years. As described more fully below, the notes payable
have put and call options that can be exercised at the end of the new markets tax credit seven-year
compliance period.

CREIGHTON UNIVERSITY
Notes to Consolidated Financial Statements
June 30, 2019 and 2018
30 (Continued)
Repayments of bond and note principal, including amortization of premium, discount, and debt issuance
costs in each of the five fiscal years subsequent to June 30, 2019 are scheduled as follows:
Year ending June 30:
2020 $ 5,178
2021 5,283
2022 4,183
2023 4,368
2024 4,663
Thereafter 174,744
Total payments $ 198,419
Interest expense on long-term debt was $8,187 in 2019 and $7,285 in 2018. Bond discounts, premiums,
and issuance costs are deferred and amortized over the life of the related indebtedness utilizing the
straight-line method.
Debt Covenant Ratios
Covenants of the bonds restrict the University from incurring additional indebtedness if, after giving effect to
the incurrence of the additional debt, the University’s: 1) maximum annual amount payable for debt service
on all funded debt after incurring the additional debt exceeds 15% of “total revenue” (as defined in the Bond
Documents), and 2) the ratio of “ready current assets” to “pro forma funded debt service” (as defined in
the Bond Documents) is less than 1.5 to 1. As of June 30, 2019, the University’s maximum annual amount
payable for funded debt service is 5.0% of total revenue and the ratio of “ready current assets” to “pro
forma funded debt service” is 7.5 to 1. The University is subject to two additional covenants under the
Series 2014 Bond Documents. One covenant specifies that the ratio of the University’s maximum annual
debt service to income available for debt service cannot be less than 1 to 1. As of June 30, 2019, this ratio
was 2.8 to 1. The other specifies that the ratio of the University’s unrestricted cash and investments to
funded debt cannot be less than 0.75 to 1. As of June 30, 2019, this ratio was 2.1 to 1. The University was
in compliance with applicable debt covenants as of June 30, 2019 and 2018.
Interest Rate Swap Agreements
The University uses derivative financial instruments to offset interest rate risk or to otherwise modify the
characteristics of its debt portfolio. The interest rate swap agreements were not entered into for trading or
speculative purposes. All such financial instruments and derivatives are marked to market and recorded at
estimated fair value. These financial instruments necessarily involve counterparty credit exposure. The
counterparties for these swap transactions are major financial institutions that meet the University’s criteria
for financial stability and creditworthiness.
The swap agreements are considered derivative financial instruments and the estimated fair values have
been reported in other liabilities in the consolidated statements of financial position at June 30, 2019 and
2018. The swap agreements do not qualify for hedge accounting. Accordingly, the net changes in the
estimated fair value of the agreements have been reported as a component of nonoperating changes in net
assets in the consolidated statements of activities for the years ended June 30, 2019 and 2018.

CREIGHTON UNIVERSITY
Notes to Consolidated Financial Statements
June 30, 2019 and 2018
31 (Continued)
The swap agreements involve the exchange of floating and fixed-rate interest payments over the life of the
agreements without an exchange of the underlying principal amount. The differential to be paid or received
is recognized as an adjustment to interest expense related to the debt.
The University’s interest rate swaps outstanding had the following changes in fair value for the years ended
at June 30, 2019 and 2018:
2019 2018
Purchase Creighton Creighton Change in Change in
date pays receives fair value fair value
August 2001 4.455 % 68% of 1-month LIBOR $ (1,592) 1,824
March 2003 3.520 70% of 1-month LIBOR (1,156) 1,394
August 2004 3.600 68% of 1-month LIBOR (1,070) 1,129
February 2005 3.642 Greater of 67% of 1-month (737) 437
LIBOR or 63% of 1-month
LIBOR plus 0.20%
February 2005 3.642 Greater of 67% of 1-month (438) 472
LIBOR or 63% of 1-month
LIBOR plus 0.20%
April 2005 3.769 67% of 1-month LIBOR (1,003) 912
Total change in fair value for the years
ended June 30, 2019 and 2018 $ (5,996) 6,168
The following schedule presents the notional principal amounts and estimated fair values of the University’s
interest rate swaps at June 30, 2019 and 2018:
Estimated fair value
Notional amounts Expiration of swaps at June 30
2019 2018 dates 2019 2018
$ 25,000 25,000 August 1, 2030 $ (8,115) (6,523)
23,300 24,050 March 1, 2033 (4,407) (3,251)
17,575 17,575 August 1, 2031 (4,195) (3,125)
8,500 8,500 September 18, 2031 (1,723) (986)
8,500 8,500 September 18, 2031 (1,762) (1,324)
13,000 13,000 August 23, 2035 (4,019) (3,016)
$ 95,875 96,625 $ (24,221) (18,225)
The University’s interest rate swaps are valued at fair value using Level 2 inputs of the fair value hierarchy
by the swap managers using a discounted cash flow analysis.

CREIGHTON UNIVERSITY
Notes to Consolidated Financial Statements
June 30, 2019 and 2018
32 (Continued)
(10) Short-Term Borrowings
The University has two current revolving lines of credit established for daily operating needs as of June 30,
2019. One operating line of credit has a maximum borrowing capacity of $25,000 and expires March 31,
2020. The interest rate payable on this line of credit is established at 1.00% over the one-month LIBOR, or
3.40% at June 30, 2019. The outstanding balances on this line of credit were $0 at June 30, 2019 and
2018.
The second operating line of credit has a maximum borrowing capacity of $25,000 and expires
December 1, 2020. The interest rate payable on this line of credit is established at 1.00% over the
one-month LIBOR. The interest rate was 3.40% at June 30, 2019. The outstanding balances on this line of
credit were $0 at June 30, 2019 and $5,000 at June 30, 2018.
(11) Functional Expenses
Natural expenses allocated by functional category are as follows for the year ended June 30, 2019 with
comparative totals for the year ended June 30, 2018:
Academic, Studentinstructional, services
and Healthcare and Institutionalresearch services auxiliary support Total
Salaries, wages, and benefits $ 170,290 20,490 29,707 24,931 245,418 Contracted services 19,958 1,203 13,553 8,929 43,643 Supplies and materials 10,620 4,929 4,036 2,200 21,785 Depreciation and amortization 13,794 976 14,684 1,106 30,560 Interest 3,277 286 4,425 416 8,404 Utilities and communications 4,116 753 4,606 1,245 10,720 Other operating 18,768 583 22,370 2,828 44,549
2019 Total $ 240,823 29,220 93,381 41,655 405,079
2018 Total $ 221,357 26,653 85,622 40,182 373,814
Included under Academic, Instructional, and Research are instructional, student aid, sponsored research,
libraries, public service, and academic support. Costs related to the operation and maintenance of physical
plant, including depreciation of plant assets and interest expense on external debt, are allocated to
operating programs and supporting activities based upon square footage. Included under Institutional
support in the table above are University fundraising expenses of $7,001 and $4,834 for the fiscal years
ended June 30, 2019 and 2018, respectively.
(12) Retirement Plan
A defined-contribution retirement plan is available to employees who have met certain employment
requirements. Contributions by employees and the University are used to purchase individual annuities or
interests in mutual funds. University contributions during the years ended June 30, 2019 and 2018 were
$9,683 and $9,189, respectively.

CREIGHTON UNIVERSITY
Notes to Consolidated Financial Statements
June 30, 2019 and 2018
33 (Continued)
(13) Self-Insured Benefit Plans
The University has a self-insured health benefit plan covering active employees and their dependents. The
plan also covers medical house staff whose cost of participation is paid by the affiliated organizations for
whom they provide services. Total claims paid under the plan for the fiscal years 2019 and 2018 were
$18,196 and $18,327, respectively. The University carries stop-loss insurance coverage that limits the
University’s claim liability to $225 per individual. The University has also contracted with an insurance
carrier to provide administrative services for the plan. The liability estimated by the University for claims
incurred but not reported was $1,682 and $1,662 at June 30, 2019 and 2018, respectively. The University
is also partially self-insured for workers’ compensation and medical malpractice insurance and accrues an
estimated liability for claims incurred but not paid based on studies performed by an outside actuarial firm.
The liability amounts are included in accounts payable and accrued expenses.
(14) Commitments and Contingencies
The University is involved in various litigation arising in the normal course of operations. On the basis of
information presently available and the advice of legal counsel, management is of the opinion that any
liability, to the extent not provided for through reserves or otherwise, for pending litigation is not likely to be
material in relation to the University’s financial position or activities.
As of June 30, 2019, the University has contractual obligations of approximately $79,278 for completion of
certain construction projects in process at that date.
Of that $79,278, contractual obligations of $69,801 related to the construction of a new health sciences
campus at Park Central in midtown Phoenix, a significant expansion of the University’s current presence in
the state. The project encompasses a new building totaling 200,000 square feet that eventually will house
nearly 800 Creighton health sciences students in Arizona. The expansion will include a four-year medical
school, nursing school, occupational and physical therapy schools, pharmacy school, physician assistant
school, and emergency medical services program. Construction began on the new building in spring 2019
and is expected to be completed in spring 2021. The University expects to fund the project with a
combination of donations, reserves, and debt.
The University has entered into a Parking Easement Agreement to use 500 spaces in a parking garage
which will be adjacent to its new health sciences campus at Park Central in midtown Phoenix. The
University will be able to use the spots 24 hours a day, 7 days a week. Up to 30 parking spaces will be
reserved. The parking fee will be $25 per month for the first five years and then $30 per month thereafter.
The agreement will commence upon completion of construction on the new facilities.
The University executed a 25-year energy services contract. Payments by the University are based upon
volume levels and energy prices.
Research grants and contracts normally provide for the recovery of direct and indirect costs. Recovery of
indirect costs on U.S. government grants is recorded at fixed or predetermined rates negotiated with the
government. Indirect cost recovery rates have been established with the U.S. government through fiscal
year 2021.

CREIGHTON UNIVERSITY
Notes to Consolidated Financial Statements
June 30, 2019 and 2018
34
(15) New Markets Tax Credit Financing
The University and Creighton Dental entered into a financing agreement with various entities for the
purpose of receiving financing for the construction of a new dental school. The new markets tax credit
structure consists of new markets tax credit investors and other lenders that provide qualified equity
investments to community development entities (CDE) who in turn provide debt financing to qualified active
low-income community businesses (QALICB).
The University is the leveraged lender in this process and holds notes with the US Bank Investment Fund
and Capital One Investment Fund (Investment Funds). The Investment Funds made qualified equity
investments to URP Subsidiary CDE XXIX, UACD Sub-CDE 26, and UACD Sub-CDE 27, which qualify as
CDEs. These CDEs provided debt financing to Creighton Dental of $18,670 beginning in October 2016 for
the qualified purpose of constructing a dental school building, as required by the terms of the agreement.
The University and owners of the Investment Funds have put and call options that can be exercised at the
end of the new markets tax credit seven-year compliance period. If either option is exercised, Creighton
Dental will purchase the third-party investor interests in the Investment Funds at an amount as defined in
the agreements. Once the option is exercised and agreed-upon consideration is paid, notes payable
related to the new markets tax credit structure will be considered settled in full, which would result in the
forgiveness of the QLICI B notes payable of $5,182.
The University has not exercised these options as of June 30, 2019.
As a result of the new markets tax credit financing structure, the University is the leveraged lender in this
process and holder of promissory notes with the Investment Funds effective October 18, 2016, for the face
value of $13,332. These notes bear interest at 1.00% per annum and is due in interest-only payments
terminating on October 18, 2023, which coincides with the expiration date of the new markets tax credit
compliance period. If the put or call options described above are not exercised upon expiration of the new
markets tax credit compliance period, the principal balance will amortize over the life of the note maturing
on September 30, 2041. Interest income for the years ended June 30, 2019 and 2018 was $133. It is
included in investment income in the combined statements of activities.
(16) Subsequent Events
The University has evaluated subsequent events through October 24, 2019, the date the consolidated
financial statements were issued, and noted no additional items to disclose.

35 (Continued)
CREIGHTON UNIVERSITY
Schedule of Expenditures of Federal Awards
Year ended June 30, 2019
Expenditures
Federal Pass-through Funds to
Federal grantor/program or cluster title CFDA No. Expenditures Awarding Organization Program Number Subrecipients
Student Financial Assistance Cluster:
Department of Education:
Federal Supplemental Educational Opportunity Grants 84.007 $ 807,366 $ —
Federal Work-Study Program 84.033 919,995 —
Federal Perkins Loan 84.038 20,425,311 —
Federal Pell Grant Program 84.063 2,755,083 —
Federal Direct Loan Program 84.268 142,086,052 —
Health Professions Student Loans, Including Primary Care Loans and Loans —
for Disadvantaged Students 93.342 7,813,409 —
Nursing Student Loans 93.364 2,824,303 —
Total Student Financial Assistance Cluster 177,631,519 —
Research and Development Cluster:
Department of Health and Human Services:
Food & Drug Administration Research 93.103 63,449 Columbia University R01 FD005114 —
Environmental Health 93.113 224,641 44,591
Research Related to Deafness and Communication Disorders 93.173 1,378,466 —
Mental Health Research Grants 93.242 272,072 71,514
Mental Health Research Grants 93.242 60,522 University of Nebraska Medical Center 1R01 MH106425 —
Subtotal CFDA 93.242 332,594 71,514
Drug Abuse and Addiction Research Programs 93.279 49,460 University of Florida R01 DA023924 —
Nursing Research 93.361 81,995 University of Nebraska Medical Center 1R01 NR015029 —
Cancer Cause and Prevention Research 93.393 84 Cornell University 1R01 CA167824 —
Cancer Treatment Research 93.395 45,451
Improving the Health of Americans through Prevention and Management of Diabetes and Heart Disease and Stroke 93.426 35,055 Nebraska Department of Health and Human Services NU58DP006548-01-00 —
Aging Research 93.757 155,127 Nebraska Department of Health and Human Services 5 NU58DP004819-05-00 —
Cardiovascular Diseases Research 93.837 1,314,828 —
Extramural Research Programs in the Neurosciences and Neurological Disorders 93.853 1,164,126 118,458
Extramural Research Programs in the Neurosciences and Neurological Disorders 93.853 51,903 Albert Einstein College of Medicine R21NS100047 —
Subtotal CFDA 93.853 1,216,029 118,458
Allergy and Infectious Diseases Research 93.855 1,111,853 64,593
Allergy and Infectious Diseases Research 93.855 86,184 Colorado State University 1R01 AI116525 —
Allergy and Infectious Diseases Research 93.855 140,985 University of Texas 2P01 A1077774 —
Allergy and Infectious Diseases Research 93.855 49,690 University of Nebraska Medical Center 5R01A12513702 —
Subtotal CFDA 93.855 1,388,712 64,593
Biomedical Research and Research Training 93.859 57,750
Biomedical Research and Research Training 93.859 445,854 University of Nebraska Medical Center 5P20 GM103427 —
Biomedical Research and Research Training 93.859 158,361 University of Nebraska Medical Center 1P30 GM110768 —
Subtotal CFDA 93.859 661,965 —
Child Health and Human Development Extramural Research 93.865 51,198 University of Nebraska at Omaha R01 HD89147 —
Aging Research 93.866 29,969
National Aeronautics and Space Administration:
Education 43.008 42,357 University of Nebraska at Omaha NNX15AI09H —
Education 43.008 2,741 University of Nebraska at Omaha NNX15AK50A —
Subtotal CFDA 43.008 45,098 —
National Science Foundation:
Geosciences 47.050 7,420 University of Georgia OCE1237140 —
Geosciences 47.050 6,286 University of Georgia 1832178 —
Subtotal CFDA 47.050 13,706 —

36
CREIGHTON UNIVERSITY
Schedule of Expenditures of Federal Awards
Year ended June 30, 2019
Expenditures
Federal Pass-through Funds to
Federal grantor/program or cluster title CFDA No. Expenditures Awarding Organization Program Number Subrecipients
Biological Sciences 47.074 $ 176,373 $ 3,617
Social, Behavioral, and Economic Sciences 47.075 41,374 —
Office of Integrative Activities 47.083 26,180 University of Nebraska, Lincoln 1557417 —
Department of Energy:
Office of Science Financial Assistance Program 81.049 235,118 —
Department of Defense:
Military Medical Research and Development 12.420 287,412 —
Military Medical Research and Development 12.420 121,922 University of Florida W81XWH 1510464 —
Subtotal CFDA 12.420 409,334 —
Department of Veterans Affairs:
Intergovernmental Personnel Act (IPA) Mobility Program 27.011 4,524 —
Department of Defense/Office of Naval Research:
Basic and Applied Scientific Research 12.300 131,145 —
Total Research and Development Cluster 8,111,875 302,773
Trio Cluster:
Department of Education:
Student Support Services 84.042 297,217 —
Talent Search 84.044 445,142 —
Upward Bound 84.047 911,024 —
Educational Opportunity Centers 84.066 276,253 —
Total Trio Cluster 1,929,636 —
Other federal assistance:
Department of Health and Human Services:
Public Health Emergency Preparedness 93.069 12,225 University of Nebraska Medical Center NU90TP921891 —
Birth Defects and Developmental Disabilities – Prevention and Surveillance 93.073 6,516 University of Missouri NU01DD001145 —
Racial and Ethnic Approaches to Community Health 93.304 74,361 24,202
Cancer Detection and Diagnosis Research 93.394 16,948 University of Massachusetts Worchester 1R01 CA194787 —
Health Careers Opportunity Program 93.822 286,394 —
Medical Library Assistance 93.879 101,094 University of Utah 1UG4LM01234 —
Grants for Primary Care Training and Enhancement 93.884 23,039 University of Nebraska Medical Center 2D88HP20110600/6D88HP201110602 —
Department of Agriculture:
Child and Adult Care Food Program 10.558 15,548 —
Department of Justice:
Crime Victim Assistance 16.575 34,094 Nebraska Crime Commission 2015 VFGX0041 —
National Science Foundation:
Office of Integrative Activities 47.083 857 University of Nebraska Lincoln 1557417 —
Total Expenditures of Federal Awards $ 188,244,106 $ 326,975
See accompanying independent auditors' report and notes to the Schedule of Expenditures of Federal Awards.

CREIGHTON UNIVERSITY
Notes to Schedule of Expenditures of Federal Awards
Year ended June 30, 2019
37 (Continued)
(1) Summary of Significant Accounting Policies
The accompanying schedule of expenditures of federal awards (the Schedule) presents the activity of
federal financial assistance received from federal agencies and pass-through entities by Creighton
University (the University).
Expenditures for direct costs are recognized as incurred using the accrual method of accounting and the
cost accounting principles contained in 2 C.F.R. § 200, Uniform Administrative Requirements, Cost
Principles, and Audit Requirements for Federal Awards from the Office of Management and Budget
(Uniform Guidance).
Expenses are subject to audit by the U.S. government, and in the opinion of management, disallowed
costs, if any, will not have a material effect on the financial position of the University or its federal programs.
(2) Reconciliation of Federal Awards to Basic Financial Statements
The following schedule is a reconciliation of total expenditures as shown on the Schedule to grants and
contracts revenue presented in the consolidated statement of activities, which is included as part of the
University’s basic financial statements.
Total expenditures per the schedule of expenditures of federal awards $ 188,244,106
Student assistance not considered revenue per consolidated financial statements (173,034,075)
Grants and contracts revenue related to private and nonfederal government grants 5,753,722
Grants and contracts per the consolidated statement of activities $ 20,963,753
(3) Loans Outstanding
Outstanding balances of student loans held by the University at June 30, 2019 and student loans advanced
during the year ended June 30, 2019 were as follows:
Amount Loans
Federal program CFDA No. outstanding advanced
Federal Perkins Loan Program 84.038 $ 17,051,740 —
Health Professions Student Loans 93.342 6,821,542 833,600
Nursing Student Loans 93.364 2,406,224 680,200
$ 26,279,506 1,513,800
The University is a direct lender under the above student loan programs. The University also participated in
the U.S. Department of Education Federal Direct Loan Program (CFDA No. 84.268). During the year ended
June 30, 2019, the University’s students received $142,086,052 in new loans under this program.

CREIGHTON UNIVERSITY
Notes to Schedule of Expenditures of Federal Awards
Year ended June 30, 2019
38
(4) Indirect Cost Rate
The University did not elect to use the 10% de minimis indirect cost rate as discussed in the Uniform
Guidance Section 200.414. For all sponsored programs where indirect costs are allowed to be claimed, the
rates approved by the University’s cognizant agency were used.

Independent Auditors’ Report on Internal Control over Financial Reporting and on
Compliance and Other Matters Based on an Audit of Financial
Statements Performed in Accordance with Government Auditing Standards
The Board of Trustees
Creighton University:
We have audited, in accordance with the auditing standards generally accepted in the United States of America
and the standards applicable to financial audits contained in Government Auditing Standards, issued by the
Comptroller General of the United States, the consolidated financial statements of Creighton University, which
comprise the consolidated statement of financial position as of June 30, 2019, and the related consolidated
statements of activities and cash flows for the year then ended, and the related notes to the consolidated
financial statements, and have issued our report thereon dated October 24, 2019.
Internal Control over Financial Reporting
In planning and performing our audit of the consolidated financial statements, we considered Creighton
University’s internal control over financial reporting (internal control) to determine the audit procedures that are
appropriate in the circumstances for the purpose of expressing our opinion on the consolidated financial
statements, but not for the purpose of expressing an opinion on the effectiveness of Creighton University’s
internal control. Accordingly, we do not express an opinion on the effectiveness of Creighton University’s
internal control.
A deficiency in internal control exists when the design or operation of a control does not allow management or
employees, in the normal course of performing their assigned functions, to prevent, or detect and correct,
misstatements on a timely basis. A material weakness is a deficiency, or combination of deficiencies, in internal
control, such that there is a reasonable possibility that a material misstatement of the entity’s financial
statements will not be prevented, or detected and corrected, on a timely basis. A significant deficiency is a
deficiency, or a combination of deficiencies, in internal control that is less severe than a material weakness, yet
important enough to merit attention by those charged with governance.
Our consideration of internal control was for the limited purpose described in the first paragraph of this section
and was not designed to identify all deficiencies in internal control that might be material weaknesses or
significant deficiencies. Given these limitations, during our audit, we did not identify any deficiencies in internal
control that we consider to be material weaknesses. However, material weaknesses may exist that have not
been identified.
Compliance and Other Matters
As part of obtaining reasonable assurance about whether Creighton University’s consolidated financial
statements are free from material misstatement, we performed tests of its compliance with certain provisions of
laws, regulations, contracts, and grant agreements, noncompliance with which could have a direct and material
effect on the determination of consolidated financial statement amounts. However, providing an opinion on
compliance with those provisions was not an objective of our audit, and accordingly, we do not express such an
opinion. The results of our tests disclosed no instances of noncompliance or other matters that are required to
be reported under Government Auditing Standards.
KPMG LLP is a Delaware limited liability partnership and the U.S. member firm of the KPMG network of independent member firms affiliated with KPMG International Cooperative (“KPMG International”), a Swiss entity.
KPMG LLPSuite 3001212 N. 96th StreetOmaha, NE 68114-2274
Suite 11201248 O StreetLincoln, NE 68508-1493

40
Purpose of this Report
The purpose of this report is solely to describe the scope of our testing of internal control and compliance and
the results of that testing, and not to provide an opinion on the effectiveness of Creighton University’s internal
control or on compliance. This report is an integral part of an audit performed in accordance with Government
Auditing Standards in considering Creighton University’s internal control and compliance. Accordingly, this
communication is not suitable for any other purpose.
Omaha, Nebraska
October 24, 2019

Independent Auditors’ Report on Compliance for Each Major Federal Program;
Report on Internal Control over Compliance; and Report on Schedule of
Expenditures of Federal Awards Required by Uniform Guidance
The Board of Trustees
Creighton University:
Report on Compliance for Each Major Federal Program
We have audited Creighton University’s compliance with the types of compliance requirements described in the
OMB Compliance Supplement that could have a direct and material effect on each of Creighton University’s
major federal programs for the year ended June 30, 2019. Creighton University’s major federal programs are
identified in the summary of auditors’ results section of the accompanying schedule of findings and questioned
costs.
Management’s Responsibility
Management is responsible for compliance with federal statues, regulations, and the terms and conditions of its
federal awards applicable to its federal programs.
Auditors’ Responsibility
Our responsibility is to express an opinion on compliance for each of Creighton University’s major federal
programs based on our audit of the types of compliance requirements referred to above. We conducted our
audit of compliance in accordance with auditing standards generally accepted in the United States of America;
the standards applicable to financial audits contained in Government Auditing Standards, issued by the
Comptroller General of the United States; and the audit requirements of Title 2 U.S. Code of Federal
Regulations Part 200, Uniform Administrative Requirements, Cost Principles, and Audit Requirements for
Federal Awards (Uniform Guidance). Those standards and the Uniform Guidance require that we plan and
perform the audit to obtain reasonable assurance about whether noncompliance with the types of compliance
requirements referred to above that could have a direct and material effect on a major federal program
occurred. An audit includes examining, on a test basis, evidence about Creighton University’s compliance with
those requirements and performing such other procedures as we considered necessary in the circumstances.
We believe that our audit provides a reasonable basis for our opinion on compliance for each major federal
program. However, our audit does not provide a legal determination of Creighton University’s compliance.
Opinion on Each Major Federal Program
In our opinion, Creighton University complied, in all material respects, with the types of compliance
requirements referred to above that could have a direct and material effect on each of its major federal
programs for the year ended June 30, 2019.
Report on Internal Control over Compliance
Management of Creighton University is responsible for establishing and maintaining effective internal control
over compliance with the types of compliance requirements referred to above. In planning and performing our
audit of compliance, we considered Creighton University’s internal control over compliance with the types of
requirements that could have a direct and material effect on each major federal program to determine the
auditing procedures that are appropriate in the circumstances for the purpose of expressing an opinion on
KPMG LLP is a Delaware limited liability partnership and the U.S. member firm of the KPMG network of independent member firms affiliated with KPMG International Cooperative (“KPMG International”), a Swiss entity.
KPMG LLPSuite 3001212 N. 96th StreetOmaha, NE 68114-2274
Suite 11201248 O StreetLincoln, NE 68508-1493

42
compliance for each major federal program and to test and report on internal control over compliance in
accordance with the Uniform Guidance, but not for the purpose of expressing an opinion on the effectiveness of
internal control over compliance. Accordingly, we do not express an opinion on the effectiveness of Creighton
University’s internal control over compliance.
A deficiency in internal control over compliance exists when the design or operation of a control over
compliance does not allow management or employees, in the normal course of performing their assigned
functions, to prevent, or detect and correct noncompliance with a type of compliance requirement of a federal
program on a timely basis. A material weakness in internal control over compliance is a deficiency, or
combination of deficiencies, in internal control over compliance, such that there is a reasonable possibility that
material noncompliance with a type of compliance requirement of a federal program will not be prevented, or
detected and corrected on a timely basis. A significant deficiency in internal control over compliance is a
deficiency, or combination of deficiencies, in internal control over compliance with a type of compliance
requirement of a federal program that is less severe than a material weakness in internal control over
compliance, yet important enough to merit attention by those charged with governance.
Our consideration of internal control over compliance was for the limited purpose described in the first
paragraph of this section and was not designed to identify all deficiencies in internal control over compliance
that might be material weaknesses or significant deficiencies. We did not identify any deficiencies in internal
control over compliance that we consider to be material weaknesses. However, material weaknesses may exist
that have not been identified.
The purpose of this report on internal control over compliance is solely to describe the scope of our testing of
internal control over compliance and the results of that testing based on the requirements of the Uniform
Guidance. Accordingly, this report is not suitable for any other purpose.
Report on Schedule of Expenditures of Federal Awards Required by the Uniform Guidance
We have audited the consolidated financial statements of Creighton University as of and for the year ended
June 30, 2019, and have issued our report thereon dated October 24, 2019, which contained an unmodified
opinion on those consolidated financial statements. Our audit was conducted for the purpose of forming an
opinion on the consolidated financial statements as a whole. The accompanying schedule of expenditures of
federal awards is presented for purposes of additional analysis as required by the Uniform Guidance and is not
a required part of the consolidated financial statements. Such information is the responsibility of management
and was derived from and relates directly to the underlying accounting and other records used to prepare the
consolidated financial statements. The information has been subjected to the auditing procedures applied in the
audit of the consolidated financial statements and certain additional procedures, including comparing and
reconciling such information directly to the underlying accounting and other records used to prepare the
consolidated financial statements or to the consolidated financial statements themselves, and other additional
procedures in accordance with auditing standards generally accepted in the United States of America. In our
opinion, the schedule of expenditure of federal awards is fairly stated in all material respects in relation to the
consolidated financial statements as a whole.
Omaha, Nebraska
October 24, 2019

CREIGHTON UNIVERSITY
Schedule of Findings and Questioned Costs
Year ended June 30, 2019
43
(1) Summary of Auditors’ Results
Consolidated Financial Statements
Type of auditors’ report issued on whether the consolidated financial statements were prepared in
accordance with generally accepted accounting principles: Unmodified opinion
Internal control deficiencies over financial reporting disclosed by the audit of the consolidated financial
statements:
Material weaknesses? yes √ no
Significant deficiencies? yes √ none reported
Noncompliance material to the consolidated financial
statements noted? yes √ no
Federal Awards
Internal control deficiencies over major programs disclosed by the audit:
Material weaknesses? yes √ no
Significant deficiencies? yes √ none reported
Type of auditors’ report issued on compliance
for major programs: Unmodified opinion
Audit findings disclosed that are required to be
reported in accordance with 2 CFR 200.516(a)? yes √ no
Identification of major programs:
CFDA Numbers Name of federal program or cluster
84.007, 84.033, 84.038, 84.063, 84.268, 93.342, and 93.364 Student Financial Assistance Cluster
Various Research and Development Cluster
Dollar threshold used to distinguish between type A and type B programs: $750,000
Auditee qualified as low-risk auditee? √ yes no
(2) Findings Related to the Consolidated Financial Statements Reported in Accordance with
Government Auditing Standards
None
(3) Findings and Questioned Costs Related to Federal Awards
None