Creep Properties of EB Welded Copper Overpack at 125 175 °C · 2012-02-29 · Creep Properties of...
58
POSIVA OY FI-27160 OLKILUOTO, FINLAND Tel +358-2-8372 31 Fax +358-2-8372 3709 Stefan Holmström Jorma Salonen Tuomo Kinnunen January 2012 Working Report 2012-03 Creep Properties of EB Welded Copper Overpack at 125–175 °C
-
Upload
hoangquynh -
Category
Documents
-
view
216 -
download
0
Transcript of Creep Properties of EB Welded Copper Overpack at 125 175 °C · 2012-02-29 · Creep Properties of...
POSIVA OY
FI-27160 OLKILUOTO, FINLAND
Tel +358-2-8372 31
Fax +358-2-8372 3709
Stefan Holmström
Jorma Salonen
Tuomo Kinnunen
January 2012
Working Report 2012-03
Creep Properties of EB WeldedCopper Overpack at 125–175 °C

January 2012
Working Reports contain information on work in progress
or pending completion.
The conclusions and viewpoints presented in the report
are those of author(s) and do not necessarily
coincide with those of Posiva.
Stefan Holmström
Jorma Salonen
Tuomo Kinnunen
VTT
Working Report 2012-03
Creep Properties of EB WeldedCopper Overpack at 125–175 °C

ABSTRACT
Electron Beam welds (EBW) chosen as primary sealing method by Posiva welding the over-pack canister lids of oxygen-free phosphorus micro-alloyed copper (OFP) have been tested for material properties relevant to long term creep life prediction. Creep rupture results are presented for the ruptured 175 °C tests and for the ongoing long term tests at 150 °C and 125 °C. The current status (test time, creep strain and strain rate) of the ongoing tests are reported. The initial (175 °C) results indicate that the EB welds are weaker than the parent material and that both round bar and spark eroded square test specimens produce weld strengths of about 0.75 at tests durations of 5000 h. The downward trend is however expected to continue for the longer test durations. The creep ductility shows decrease for the longer tests. Life estimates for the EB weld have been calculated at 100 °C for both 50 and 80 MPa with the so far lowest measured EB weld strength factor (WSF=0.77). The state-of-the-art model on the available data give estimated lives of 21000 and 3000 years correspondingly. However, simulated to the expected temperature profile of the repository service the life fraction reached after 10000 years of service is 1 % and 7 % for the same stress levels. It is though important to remembered that the 80 MPa assumption is very conservative in nature and that the predictions do not take into account relaxation of stresses, further decline of the WSF or anisotropy of the weld and are therefore still to be considered indicative only. It is also to be remembered that there is only limited data in the long term regime for the weldments and that the estimates are based on the few EB data available in the public domain added with the Posiva data of this project. Improvement of the models and predictions are expected from the ongoing 125 °C and 150 °C long term tests. Keywords: EB-welds, creep, OFP-copper.

ELEKTRONISUIHKUHITSATTUJEN NÄYTTEIDEN VIRUMISOMINAISUUDET LÄMPÖTILOISSA 125–175°C
TIIVISTELMÄ
Elektronisuihkuhitsattujen näytteiden (hapeton, fosforilla mikroseostettu kupari OFP) virumiskestävyyttä testataan pitkäaikaisilla kokeilla eri lämpötiloissa hitsien pitkä-aikaisarviointia varten. Tässä raportissa esitellään koesarjan ensimmäiset tulokset 175 °C:ssa virutetulle murtuneelle näytteelle sekä välitulokset 150 °C ja 125 °C:ssa meneillään oleville kokeille (aika, virumisjännitys ja muodonmuutosnopeus). Alustavat tulokset 175 °C :ssa osoittavat, että elektronisuihkuhitsatut näytteet ovat heikompia kuin perusmateriaalista tehdyt näytteet ja että pyöreiden sauvojen sekä kipinätyöstettyjen neliskanttisten näytteiden hitsauslujuustekijä (WSF = Weld strenght factor) on 0.75 5000 tuntia kestäneessä kokeissa. Tulosten laskevan trendin voidaan olettaa laskevan vielä pidemmillä koeajoilla. Myös virumissitkeys näyttää laskevan ajan funktiona. Elektronisuihkuhitsien elinikäarviot on laskettu 100 °C:ssa, 50 ja 80 MPa:n jännityk-sessä virutetuille näytteille (hitsauslujuustekijä WSF = 0.77). Käytetty malli ennustaa elinikäarvioiksi 50 MPa:n näytteelle 21 000 vuotta ja 80 MPa:n näytteelle 3 000 vuotta. On kuitenkin syytä ottaa huomioon, että 80 MPa:n oletus on erittäin konservatiivinen arvio ja se ei ota huomioon jännitysten laukeamista, mikä laskee hitsauslujuustekijää tai hitsin anisotropiaa ja siten tulokset ovat vain suuntaa-antavia. Käytettävissä olevan pitkäaikaisen datan määrä on kuitenkin tässä vaiheessa hyvin rajallinen ja arviot perustuvat julkisesti saatavaan dataan sekä tässä tutkimuksessa Posivan näytteistä saatuihin tuloksiin. Malleihin ja arvioihin tullaan saamaan parannusta ja varmennusta meneillään olevien pitkäaikaisten kokeiden (125 °C ja 150 °C) edetessä. Avainsanat: Elektronisuihkuhitsit, viruminen, OFP-kupari.
1
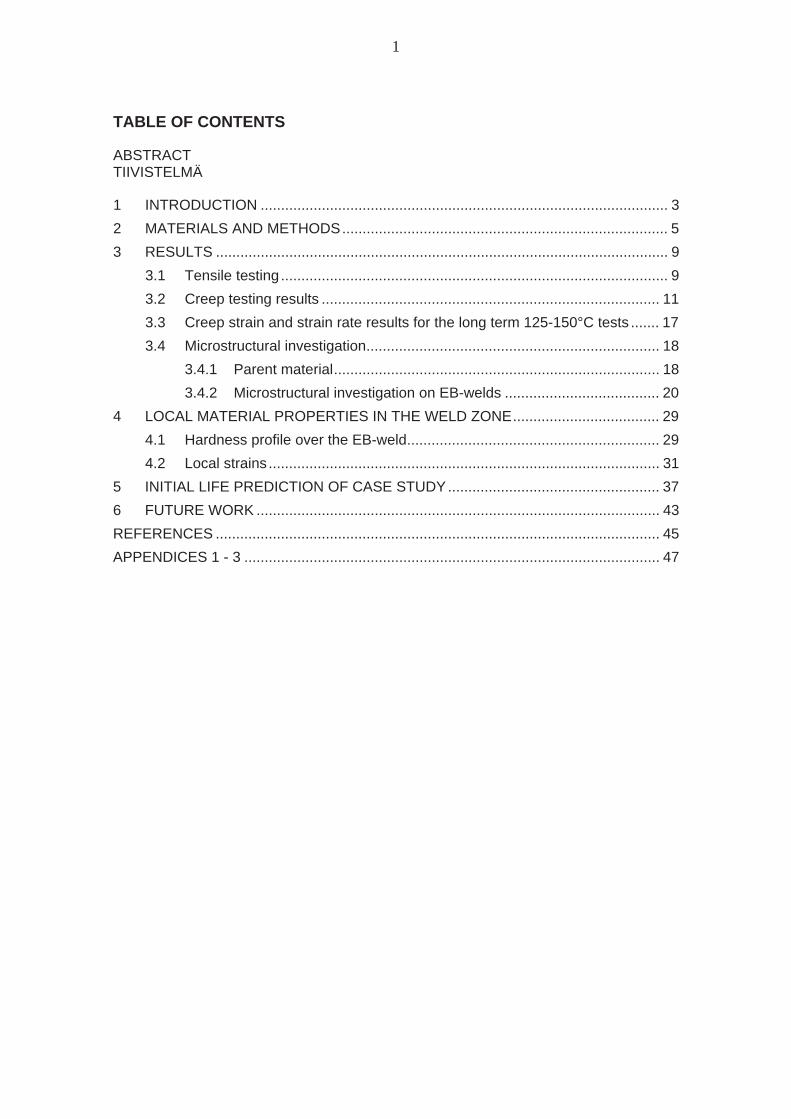
TABLE OF CONTENTS
ABSTRACT TIIVISTELMÄ
1 INTRODUCTION .................................................................................................... 32 MATERIALS AND METHODS ................................................................................ 53 RESULTS ............................................................................................................... 9
3.1 Tensile testing ............................................................................................... 93.2 Creep testing results ................................................................................... 113.3 Creep strain and strain rate results for the long term 125-150°C tests ....... 173.4 Microstructural investigation ........................................................................ 18
3.4.1 Parent material ................................................................................ 183.4.2 Microstructural investigation on EB-welds ...................................... 20
4 LOCAL MATERIAL PROPERTIES IN THE WELD ZONE .................................... 294.1 Hardness profile over the EB-weld .............................................................. 294.2 Local strains ................................................................................................ 31
5 INITIAL LIFE PREDICTION OF CASE STUDY .................................................... 376 FUTURE WORK ................................................................................................... 43REFERENCES ............................................................................................................. 45APPENDICES 1 - 3 ...................................................................................................... 47

2

3
1 INTRODUCTION
The Finnish (and also the Swedish) concept of managing spent fuel from nuclear power plants involves encapsulation of the fuel bundles in metal canisters over-packed with oxygen-free phosphorus micro-alloyed copper [1]. These canisters are to be placed deep into a bedrock repository. Posiva and SKB are jointly carrying out development on manufacturing and sealing and inspection of the copper-iron canisters for spent fuel. Posiva has chosen electron beam welding (EBW) for as primary sealing method. Posiva is also following the friction stir welding (FSW) development chosen by SKB as an alternative sealing method to be implemented if EBW encounters major difficulties. The EBW will be further developed during 2010-2012, especially concentrating on the issue of high residual stresses from a long-term safety point of view (potential early canister failure) [1]. The temperature of the canister is foreseen to reach a maximum of 80-90 C during the first 100 years, with gradual cooling to the level of the bedrock environment. One of the potential damage mechanisms expected in the repository conditions is creep [2,3]. However the estimation to the required service life is a significant challenge due to the extensive extrapolations needed. The extrapolations are one to four orders in magnitude longer than for ordinary engineering structures designed against creep. The objective of this work is to provide a comprehensive understanding of the long term creep properties of the EB-weld. The main tool to achieve this is by mechanical testing of the EB welds at raised temperatures to attain sufficient data for life assessments. Also the local material properties in the weld are sought by optical measurements (at room temperature) and by local displacement measurements during test interruptions (long term creep). The material properties of the different regions within the weld will provide the basis for an advanced finite element analysis at a later stage.

4
5
2 MATERIALS AND METHODS
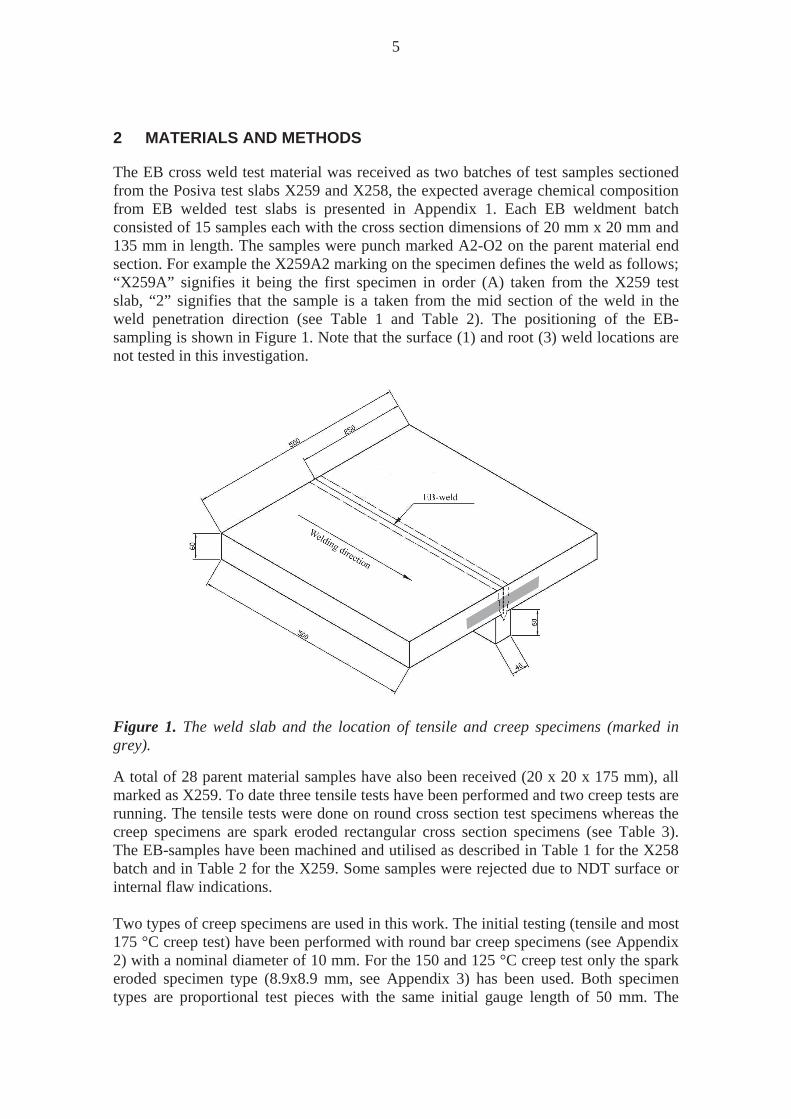
The EB cross weld test material was received as two batches of test samples sectioned from the Posiva test slabs X259 and X258, the expected average chemical composition from EB welded test slabs is presented in Appendix 1. Each EB weldment batch consisted of 15 samples each with the cross section dimensions of 20 mm x 20 mm and 135 mm in length. The samples were punch marked A2-O2 on the parent material end section. For example the X259A2 marking on the specimen defines the weld as follows; “X259A” signifies it being the first specimen in order (A) taken from the X259 test slab, “2” signifies that the sample is a taken from the mid section of the weld in the weld penetration direction (see Table 1 and Table 2). The positioning of the EB-sampling is shown in Figure 1. Note that the surface (1) and root (3) weld locations are not tested in this investigation.
Figure 1. The weld slab and the location of tensile and creep specimens (marked in grey).
A total of 28 parent material samples have also been received (20 x 20 x 175 mm), all marked as X259. To date three tensile tests have been performed and two creep tests are running. The tensile tests were done on round cross section test specimens whereas the creep specimens are spark eroded rectangular cross section specimens (see Table 3). The EB-samples have been machined and utilised as described in Table 1 for the X258 batch and in Table 2 for the X259. Some samples were rejected due to NDT surface or internal flaw indications. Two types of creep specimens are used in this work. The initial testing (tensile and most 175 °C creep test) have been performed with round bar creep specimens (see Appendix 2) with a nominal diameter of 10 mm. For the 150 and 125 °C creep test only the spark eroded specimen type (8.9x8.9 mm, see Appendix 3) has been used. Both specimen types are proportional test pieces with the same initial gauge length of 50 mm. The
6
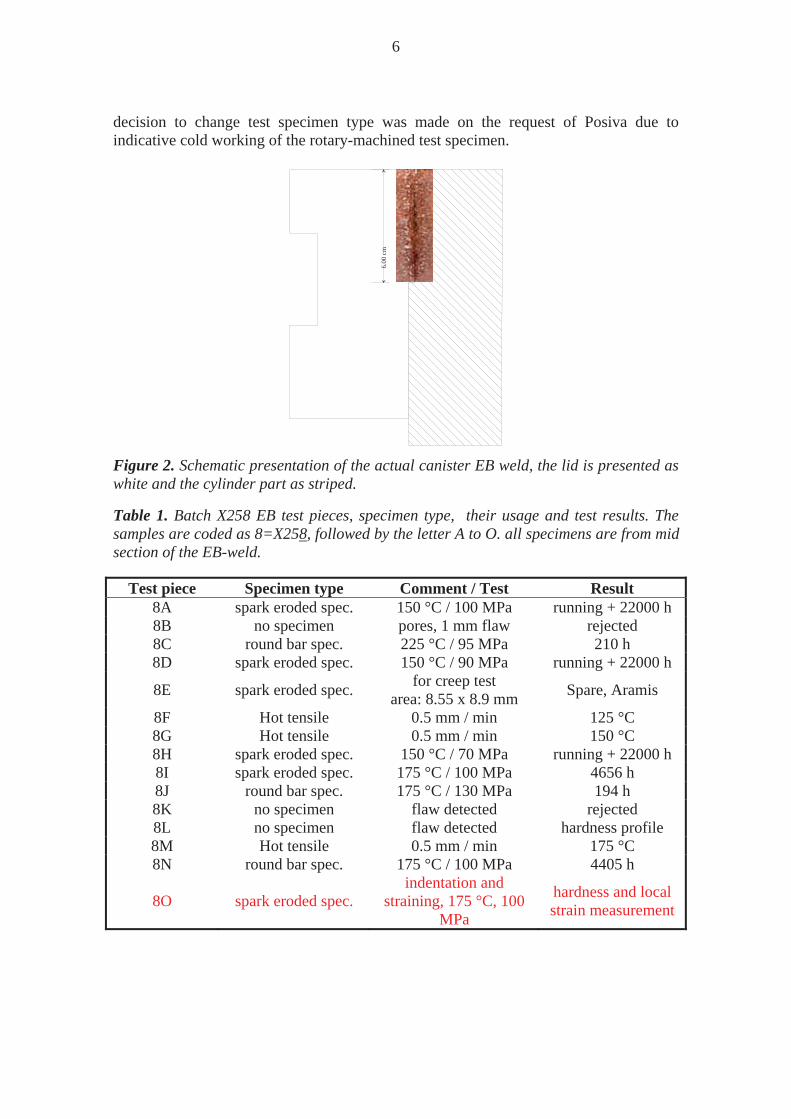
decision to change test specimen type was made on the request of Posiva due to indicative cold working of the rotary-machined test specimen.
6.00
cm
Figure 2. Schematic presentation of the actual canister EB weld, the lid is presented as white and the cylinder part as striped.
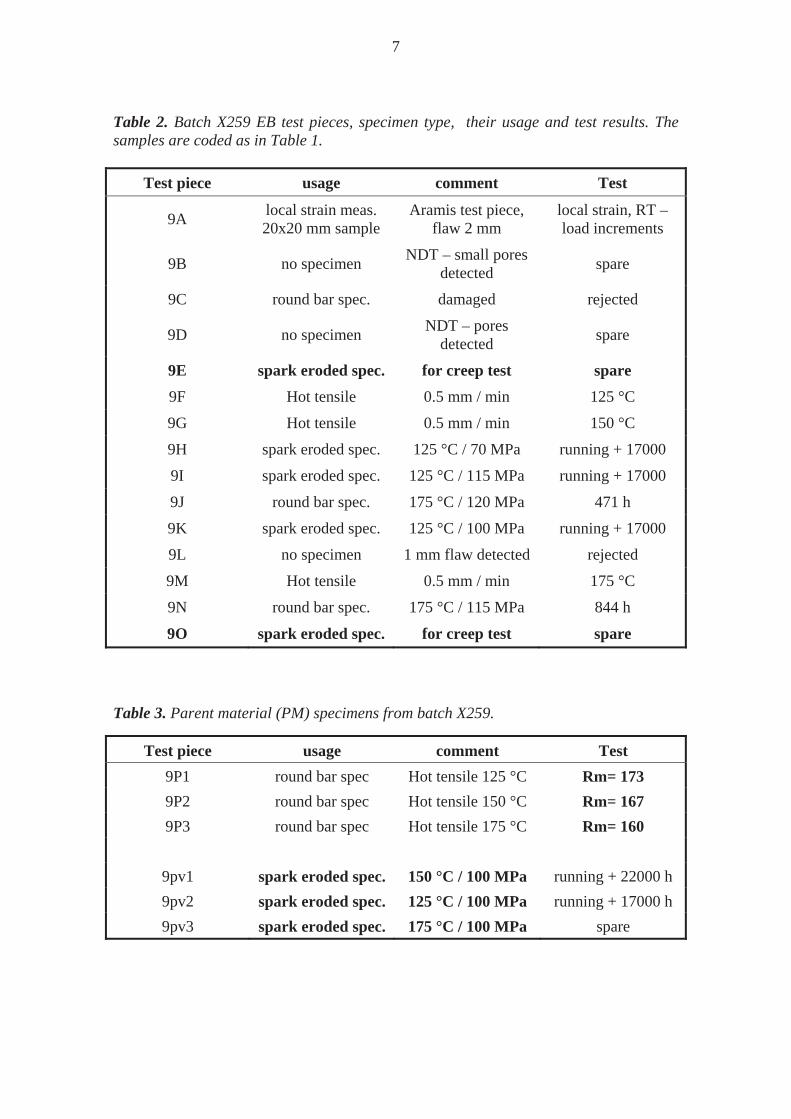
Table 1. Batch X258 EB test pieces, specimen type, their usage and test results. The samples are coded as 8=X258, followed by the letter A to O. all specimens are from mid section of the EB-weld.
Test piece Specimen type Comment / Test Result 8A spark eroded spec. 150 °C / 100 MPa running + 22000 h 8B no specimen pores, 1 mm flaw rejected 8C round bar spec. 225 °C / 95 MPa 210 h 8D spark eroded spec. 150 °C / 90 MPa running + 22000 h
8E spark eroded spec. for creep test area: 8.55 x 8.9 mm Spare, Aramis
8F Hot tensile 0.5 mm / min 125 °C 8G Hot tensile 0.5 mm / min 150 °C 8H spark eroded spec. 150 °C / 70 MPa running + 22000 h 8I spark eroded spec. 175 °C / 100 MPa 4656 h 8J round bar spec. 175 °C / 130 MPa 194 h 8K no specimen flaw detected rejected 8L no specimen flaw detected hardness profile 8M Hot tensile 0.5 mm / min 175 °C 8N round bar spec. 175 °C / 100 MPa 4405 h
8O spark eroded spec. indentation and
straining, 175 °C, 100 MPa
hardness and local strain measurement
7
Table 2. Batch X259 EB test pieces, specimen type, their usage and test results. The samples are coded as in Table 1.
Test piece usage comment Test
9A local strain meas. 20x20 mm sample
Aramis test piece, flaw 2 mm
local strain, RT – load increments
9B no specimen NDT – small pores detected spare
9C round bar spec. damaged rejected
9D no specimen NDT – pores detected spare
9E spark eroded spec. for creep test spare 9F Hot tensile 0.5 mm / min 125 °C
9G Hot tensile 0.5 mm / min 150 °C
9H spark eroded spec. 125 °C / 70 MPa running + 17000
9I spark eroded spec. 125 °C / 115 MPa running + 17000
9J round bar spec. 175 °C / 120 MPa 471 h
9K spark eroded spec. 125 °C / 100 MPa running + 17000
9L no specimen 1 mm flaw detected rejected
9M Hot tensile 0.5 mm / min 175 °C
9N round bar spec. 175 °C / 115 MPa 844 h
9O spark eroded spec. for creep test spare
Table 3. Parent material (PM) specimens from batch X259.
Test piece usage comment Test 9P1 round bar spec Hot tensile 125 °C Rm= 173 9P2 round bar spec Hot tensile 150 °C Rm= 167 9P3 round bar spec Hot tensile 175 °C Rm= 160
9pv1 spark eroded spec. 150 °C / 100 MPa running + 22000 h 9pv2 spark eroded spec. 125 °C / 100 MPa running + 17000 h 9pv3 spark eroded spec. 175 °C / 100 MPa spare

8

9
3 RESULTS
The test results presented in this report is the updated status on tensile, creep and microstructural investigation conducted up to 3.9.2010.
3.1 Tensile testing
The results of the conducted hot tensile tests (round bar test specimens) for parent material (PM) and EB-welds (EBW) are presented in Table 4, Figure 3 and Figure 4. The ruptured parent material tensile specimen 9P3 (175 °C) is shown in Figure 5 and the EB-weld tensile specimen 9G in Figure 6. The reduction of area (Z) for EB-welds (both tensile and creep) is calculated assuming an elliptical surface area by measuring minor (welding direction) and major axes (penetration direction) as shown in Figure 8 for the creep specimen 8N. The rupture strain (A5) is the engineering strain and the yield (Rp0.2) and rupture strengths (Rm) are calculated from tensile test data (see Appendix 4). Note that the yield strength results for the EB-welds can be considered indicative only due to localisation of the strain. The indicative yield strength results however raised the question on cold work in the standard round cross section test specimens (see Figure 11 in creep results section) resulting in changing the specimen type. Table 4. Tensile testing at raised temperature for parent material (PM) and EB-welds (EBW). Note that the yield strength results for the EB-welds can be considered indicative only.
Specimen Type Temp °C Rp0.2 Rm A5 % Z % 8F EBW 125 (84) 159 26 82
9F EBW 125 (64) 158 27 82
9P1 PM 125 56 173 53.5 84
8G EBW 150 (61) 153 28 84
9G EBW 150 (57) 152 29 85
9P2 PM 150 55 167 55 84
8M EBW 175 (59) 147 30 80
9M EBW 175 (57) 147 30 82
9P3 PM 175 47 160 53 83

10
145
150
155
160
165
170
175
120 130 140 150 160 170 180
Temperature, °C
Ulti
mat
e st
reng
th (R
m),
MPa
Rm-X259-PMRm-X258-EBWRm-X259-EBW
Figure 3. Ultimate tensile strength (Rm) as a function of temperature for parent material (PM) and EB-welds (EBW).
40
45
50
55
60
65
70
75
80
85
90
120 130 140 150 160 170 180
Temperature, °C
Yiel
d st
reng
th (R
p0.2
), M
Pa
Rp0.2-X259-PMRp0.2-X258-EBWRp0.2-X259-EBW
Figure 4. Yield strength for parent material (PM) and indicative results for EB-welds (EBW). Note that the local yield can be something entirely different from the value assuming homogenous straining over the full gauge length.

11
Figure 5. Hot tensile test specimen 9P3 (parent material) tested at 175 °C.
Figure 6. Hot tensile specimen 9G (EB-weld) tested at 150 °C.
3.2 Creep testing results
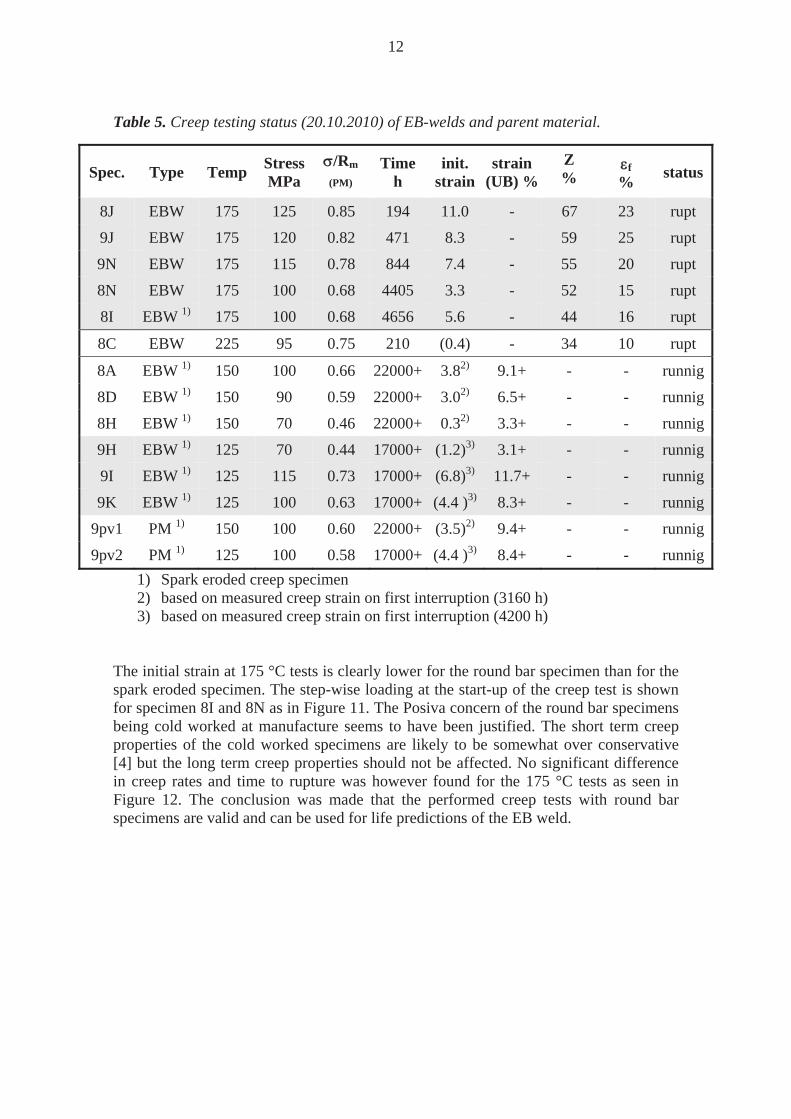
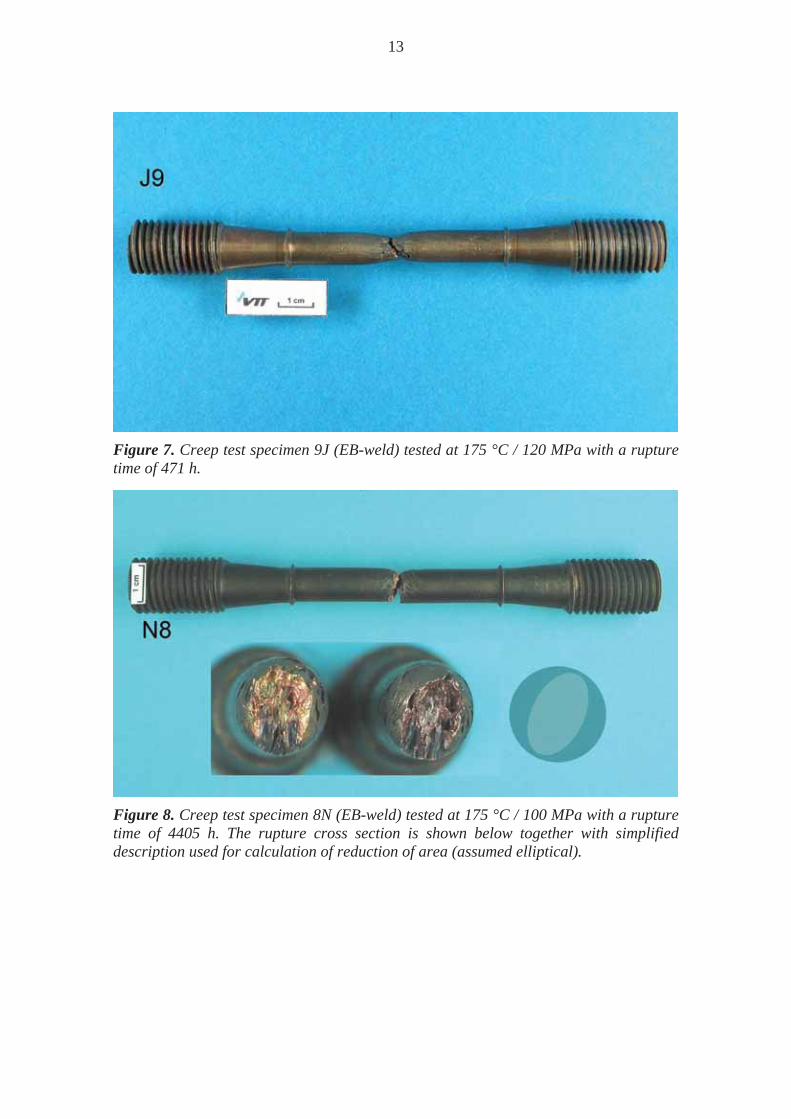
Creep testing results of the EB-welds are shown in Table 5. The test 8I at 175 °C / 100 MPa (Figure 9) is a repetition of the test 8N at the same stress and temperature (Figure 8) with the spark eroded test specimen. The ruptured specimens 9J (175 °C / 120 MPa) is shown in Figure 7. Note also that the measured reductions of area in all creep samples are smaller than for the tensile tests. The trend is as expected in creep testing decreasing for longer test durations as shown in Figure 10.
12
Table 5. Creep testing status (20.10.2010) of EB-welds and parent material.
Spec. Type Temp Stress MPa
/Rm
(PM) Time
h init.
strain strain
(UB) %Z %
f % status
8J EBW 175 125 0.85 194 11.0 - 67 23 rupt
9J EBW 175 120 0.82 471 8.3 - 59 25 rupt
9N EBW 175 115 0.78 844 7.4 - 55 20 rupt
8N EBW 175 100 0.68 4405 3.3 - 52 15 rupt
8I EBW 1) 175 100 0.68 4656 5.6 - 44 16 rupt
8C EBW 225 95 0.75 210 (0.4) - 34 10 rupt
8A EBW 1) 150 100 0.66 22000+ 3.82) 9.1+ - - runnig
8D EBW 1) 150 90 0.59 22000+ 3.02) 6.5+ - - runnig
8H EBW 1) 150 70 0.46 22000+ 0.32) 3.3+ - - runnig
9H EBW 1) 125 70 0.44 17000+ (1.2)3) 3.1+ - - runnig
9I EBW 1) 125 115 0.73 17000+ (6.8)3) 11.7+ - - runnig
9K EBW 1) 125 100 0.63 17000+ (4.4 )3) 8.3+ - - runnig
9pv1 PM 1) 150 100 0.60 22000+ (3.5)2) 9.4+ - - runnig
9pv2 PM 1) 125 100 0.58 17000+ (4.4 )3) 8.4+ - - runnig1) Spark eroded creep specimen 2) based on measured creep strain on first interruption (3160 h) 3) based on measured creep strain on first interruption (4200 h)
The initial strain at 175 °C tests is clearly lower for the round bar specimen than for the spark eroded specimen. The step-wise loading at the start-up of the creep test is shown for specimen 8I and 8N as in Figure 11. The Posiva concern of the round bar specimens being cold worked at manufacture seems to have been justified. The short term creep properties of the cold worked specimens are likely to be somewhat over conservative [4] but the long term creep properties should not be affected. No significant difference in creep rates and time to rupture was however found for the 175 °C tests as seen in Figure 12. The conclusion was made that the performed creep tests with round bar specimens are valid and can be used for life predictions of the EB weld.
13
Figure 7. Creep test specimen 9J (EB-weld) tested at 175 °C / 120 MPa with a rupture time of 471 h.
Figure 8. Creep test specimen 8N (EB-weld) tested at 175 °C / 100 MPa with a rupture time of 4405 h. The rupture cross section is shown below together with simplified description used for calculation of reduction of area (assumed elliptical).

14
Figure 9. Creep test specimen 8I (EB weld) tested at 175 °C / 100 MPa with a rupture time of 4656 h.
40 %
50 %
60 %
70 %
80 %
100 1000 10000
Time to rupture (h)
Red
uctio
n of
are
a (Z
)
level for tensile tests
Figure 10. Reduction of area as a function of rupture time at 175 °C. The creep ductility drops towards longer rupture times. The corresponding values for tensile tests are around 80 %. The longest test shows a lower reduction of area value for the spark eroded test specimen (square) than for the round bar specimen (circles).
15
0
20
40
60
80
100
120
0 % 1 % 2 % 3 % 4 % 5 % 6 %
Strain (%)
Nom
inal
stre
ss (M
Pa)
8N round8I square
Figure 11. Initial strain response at step wise loading in the start of creep tests (nominal over gauge length) for specimens 8N and 8I (175 °C / 100 MPa). The spark eroded specimen (8I) shows yielding at lower stress values.
1.E-06
1.E-05
1.E-04
100 1000 10000
Time (h)
Nom
inal
str
ain
rate
(1/h
)
N8 - round barI8 spark eroded
Figure 12. Calculated strain rate (nominal over gauge length) for specimens 8N and 8I at 175 °C / 100 MPa. The strain rate for the spark eroded test specimen does not differ from the test conducted at the same stress level with the round bar test specimen; also the rupture time is almost identical.
16
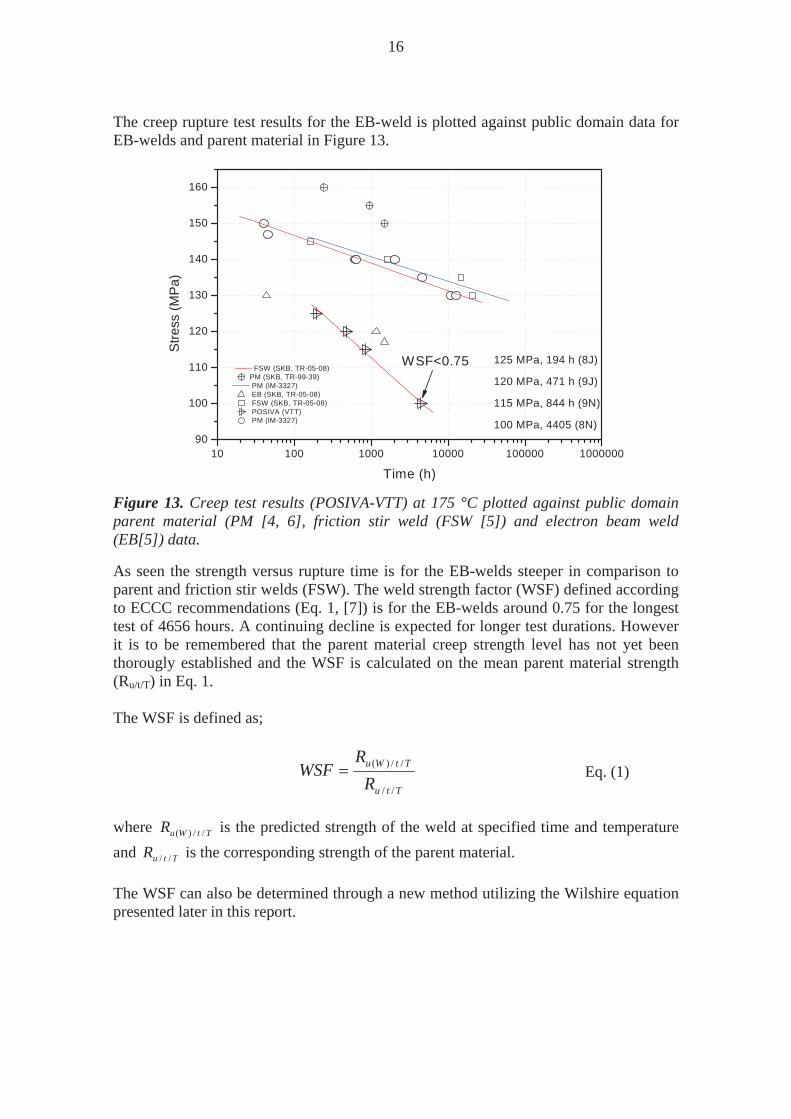
The creep rupture test results for the EB-weld is plotted against public domain data for EB-welds and parent material in Figure 13.
90
100
110
120
130
140
150
160
10 100 1000 10000 100000 1000000
FSW (SKB, TR-05-08)PM (SKB, TR-99-39) PM (IM-3327) EB (SKB, TR-05-08) FSW (SKB, TR-05-08) POSIVA (VTT) PM (IM-3327) 100 MPa, 4405 (8N)
120 MPa, 471 h (9J)
115 MPa, 844 h (9N)
Time (h)
Stre
ss (M
Pa)
125 MPa, 194 h (8J)WSF<0.75
Figure 13. Creep test results (POSIVA-VTT) at 175 °C plotted against public domain parent material (PM [4, 6], friction stir weld (FSW [5]) and electron beam weld (EB[5]) data.
As seen the strength versus rupture time is for the EB-welds steeper in comparison to parent and friction stir welds (FSW). The weld strength factor (WSF) defined according to ECCC recommendations (Eq. 1, [7]) is for the EB-welds around 0.75 for the longest test of 4656 hours. A continuing decline is expected for longer test durations. However it is to be remembered that the parent material creep strength level has not yet been thorougly established and the WSF is calculated on the mean parent material strength (Ru/t/T) in Eq. 1. The WSF is defined as;
Ttu
TtWu
RR
WSF//
//)( Eq. (1)
where TtWuR //)( is the predicted strength of the weld at specified time and temperature and TtuR // is the corresponding strength of the parent material. The WSF can also be determined through a new method utilizing the Wilshire equation presented later in this report.
17
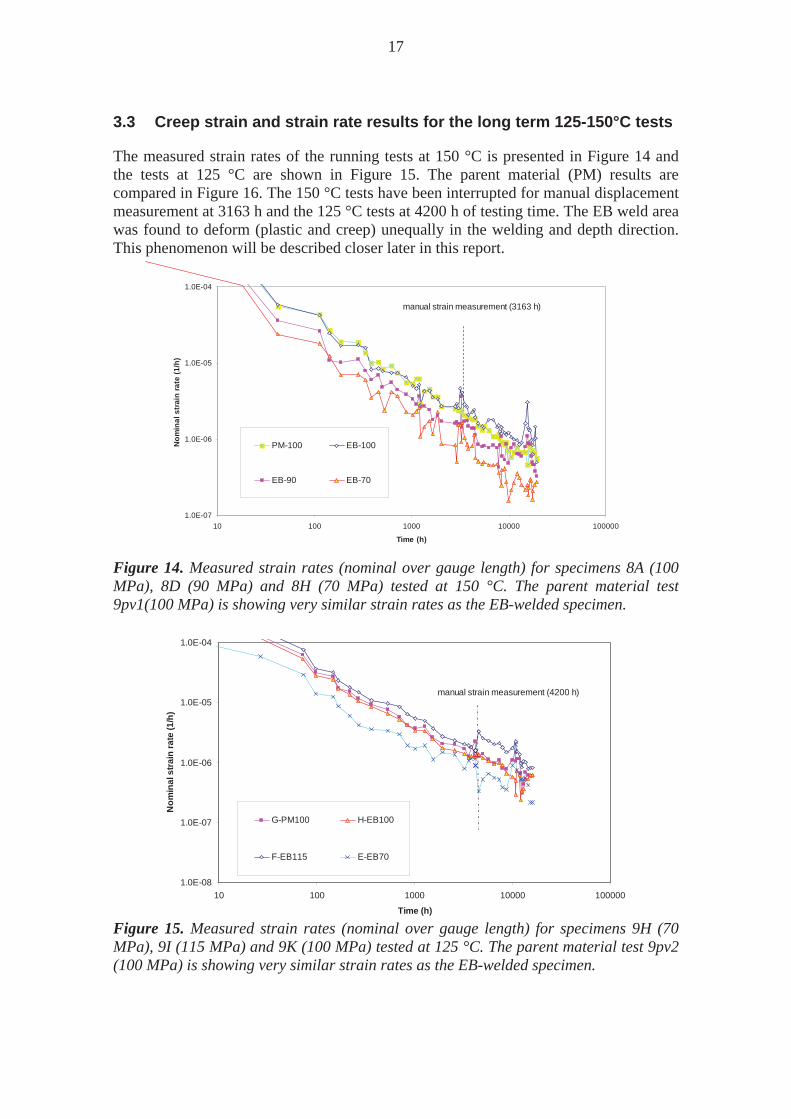
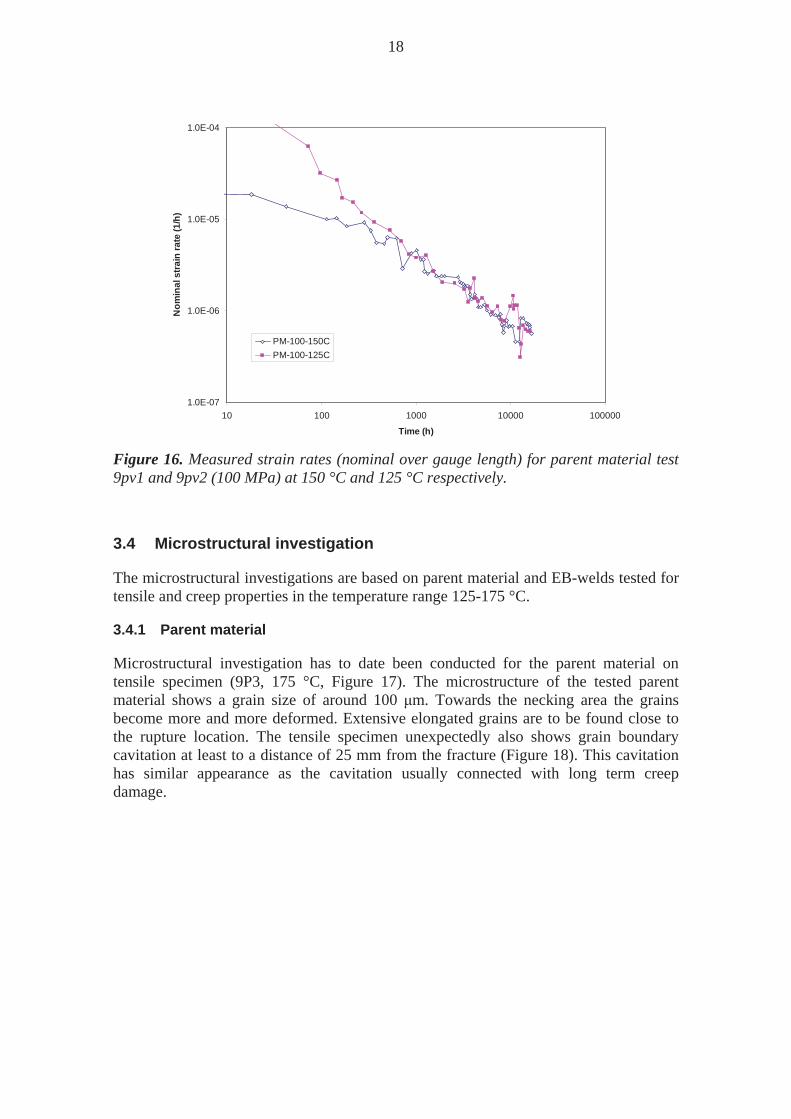
3.3 Creep strain and strain rate results for the long term 125-150°C tests
The measured strain rates of the running tests at 150 °C is presented in Figure 14 and the tests at 125 °C are shown in Figure 15. The parent material (PM) results are compared in Figure 16. The 150 °C tests have been interrupted for manual displacement measurement at 3163 h and the 125 °C tests at 4200 h of testing time. The EB weld area was found to deform (plastic and creep) unequally in the welding and depth direction. This phenomenon will be described closer later in this report.
1.0E-07
1.0E-06
1.0E-05
1.0E-04
10 100 1000 10000 100000
Time (h)
Nom
inal
str
ain
rate
(1/h
)
PM-100 EB-100
EB-90 EB-70
manual strain measurement (3163 h)
Figure 14. Measured strain rates (nominal over gauge length) for specimens 8A (100 MPa), 8D (90 MPa) and 8H (70 MPa) tested at 150 °C. The parent material test 9pv1(100 MPa) is showing very similar strain rates as the EB-welded specimen.
1.0E-08
1.0E-07
1.0E-06
1.0E-05
1.0E-04
10 100 1000 10000 100000
Time (h)
Nom
inal
stra
in ra
te (1
/h)
G-PM100 H-EB100
F-EB115 E-EB70
manual strain measurement (4200 h)
Figure 15. Measured strain rates (nominal over gauge length) for specimens 9H (70 MPa), 9I (115 MPa) and 9K (100 MPa) tested at 125 °C. The parent material test 9pv2 (100 MPa) is showing very similar strain rates as the EB-welded specimen.
18
1.0E-07
1.0E-06
1.0E-05
1.0E-04
10 100 1000 10000 100000
Time (h)
Nom
inal
stra
in ra
te (1
/h)
PM-100-150CPM-100-125C
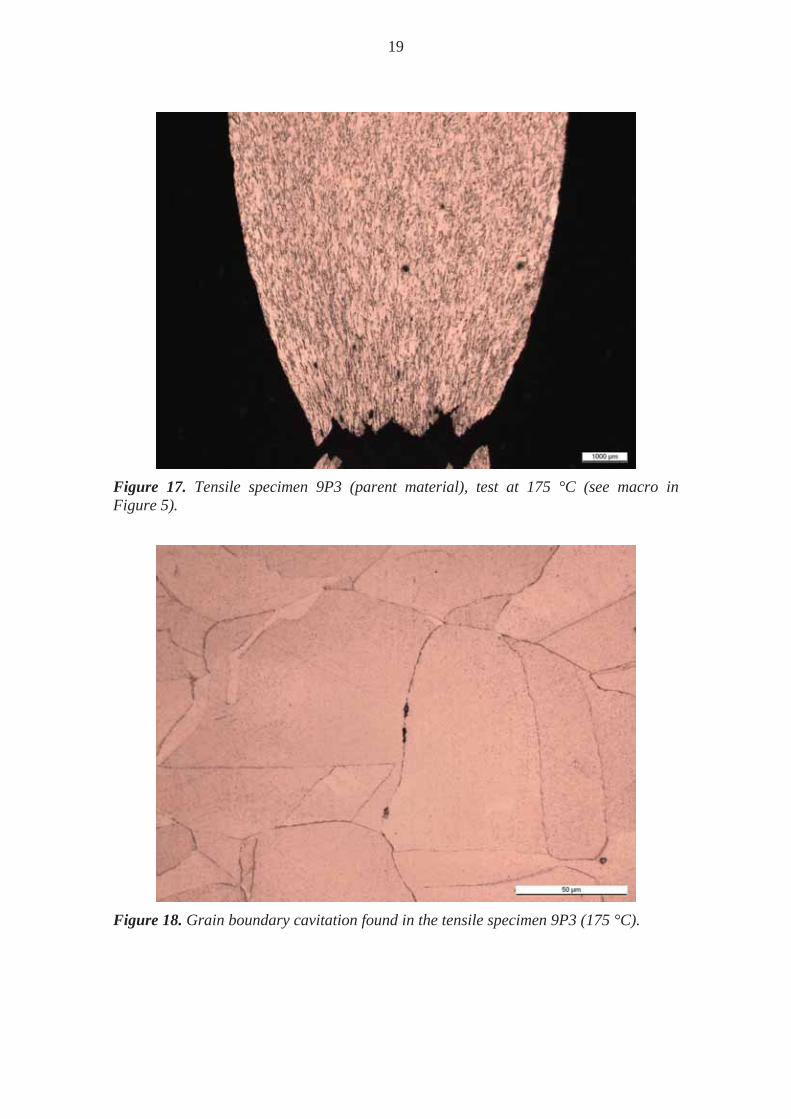
Figure 16. Measured strain rates (nominal over gauge length) for parent material test 9pv1 and 9pv2 (100 MPa) at 150 °C and 125 °C respectively.
3.4 Microstructural investigation
The microstructural investigations are based on parent material and EB-welds tested for tensile and creep properties in the temperature range 125-175 °C.
3.4.1 Parent material
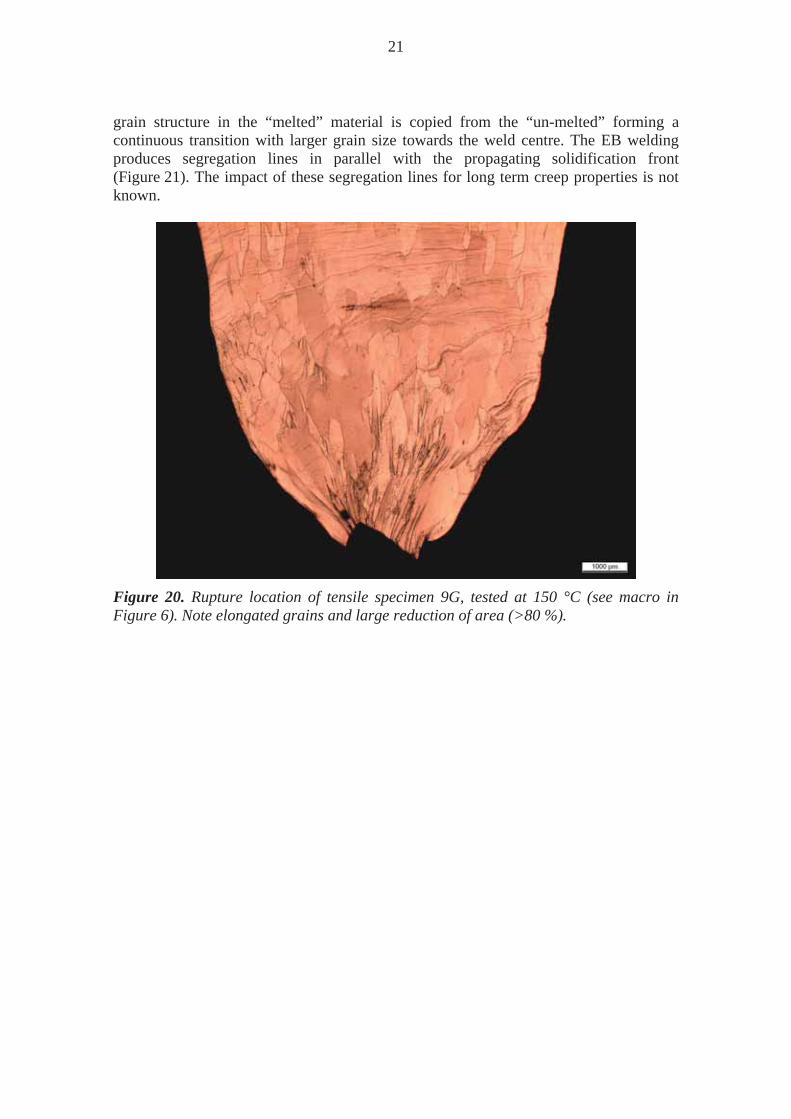
Microstructural investigation has to date been conducted for the parent material on tensile specimen (9P3, 175 °C, Figure 17). The microstructure of the tested parent material shows a grain size of around 100 m. Towards the necking area the grains become more and more deformed. Extensive elongated grains are to be found close to the rupture location. The tensile specimen unexpectedly also shows grain boundary cavitation at least to a distance of 25 mm from the fracture (Figure 18). This cavitation has similar appearance as the cavitation usually connected with long term creep damage.
19
Figure 17. Tensile specimen 9P3 (parent material), test at 175 °C (see macro in Figure 5).
Figure 18. Grain boundary cavitation found in the tensile specimen 9P3 (175 °C).

20
3.4.2 Microstructural investigation on EB-welds
Microstructural investigation has been performed on the tensile specimen 9G and the creep test specimens 9J and 8N. The macro-structure of the EB weld is presented in Figure 19. For the EB-welds the grain size is considerably larger than in the parent material and it is dependent on the direction. The anisotropic material properties becomes evident from the shape of the ruptured round bar specimens, the fracture surface becomes elliptical.
A
B
Figure 19. EB-weld seen as A) in penetration direction and B) perpendicularly in the welding direction (welding proceeding downwards).
EB tensile test specimen The tensile test specimen 9G, tested at 150 °C was sectioned (Figure 6) and the microstructure investigated. The fracture was situated in the weld metal centre line (see Figure 20). The columnar grains and their extensive elongation in the weld metal are indicating heavy localisation of strain and damage in the weld metal. The grain formation at the fusion line seems to be epitaxial (see Figure 21 and Figure 22) i.e. the
21
grain structure in the “melted” material is copied from the “un-melted” forming a continuous transition with larger grain size towards the weld centre. The EB welding produces segregation lines in parallel with the propagating solidification front (Figure 21). The impact of these segregation lines for long term creep properties is not known.
Figure 20. Rupture location of tensile specimen 9G, tested at 150 °C (see macro in Figure 6). Note elongated grains and large reduction of area (>80 %).

22
Figure 21. Weld fusion line section of necked tensile specimen 9G (150 °C, macro in Figure 6). Note epitaxial grain formation at the fusion line and segregation lines (dark curved lines in weld metal) at the propagating solidification front.
Figure 22. Weld fusion line close-up of tensile specimen 9G. Note the grain size increase towards weld metal (right).

23
Creep specimens: The corresponding microstructural study on creep specimens have been conducted on specimens 9J and 8N. The reduction of area in all creep samples is smaller than for the tensile tests as earlier discussed (Figure 10). Specimen 9J (see Figure 23, ruptured at 471 h) shows damage typical to short term tests (large cavitation and local strain, Figure 24) and also cavitation typical to long term creep damage localised in the grain boundary (see Figure 25 and Figure 28).
Figure 23. Creep specimen 9J, tested at 175 °C / 120 MPa with a rupture time of 471 h. Detail of the greyed areas A and B are presented in Figure 24 and Figure 25 respectively (see macro in Figure 7)
Figure 24. Creep specimen 9J, detail magnification of the greyed area A in Figure 23. Note large voids typical of short term (tensile) testing.

24
Figure 25. Creep specimen 9J, detail magnification of the greyed area B in Figure 23. Note grain boundary cavitation typical of long term creep testing.
The longest round bar creep test (specimen 8N, 4405 h) has been sectioned in the penetration direction as shown in Figure 26. The specimen was further sectioned perpendicularly (halved) for investigation of the welding direction as shown in Figure 27. The rupture surface is heavily elliptical as has been the case with all ruptured EB-welds. The largest reduction in radius is in the direction of weld penetration. Extensive cracking can be seen in the weld vicinity of the weld centre line. The damage is concentrated at grain boundaries perpendicular to the load direction (cross weld). The solidification structure is thereby evidently directly linked to the damage localisation and expected creep life.
25
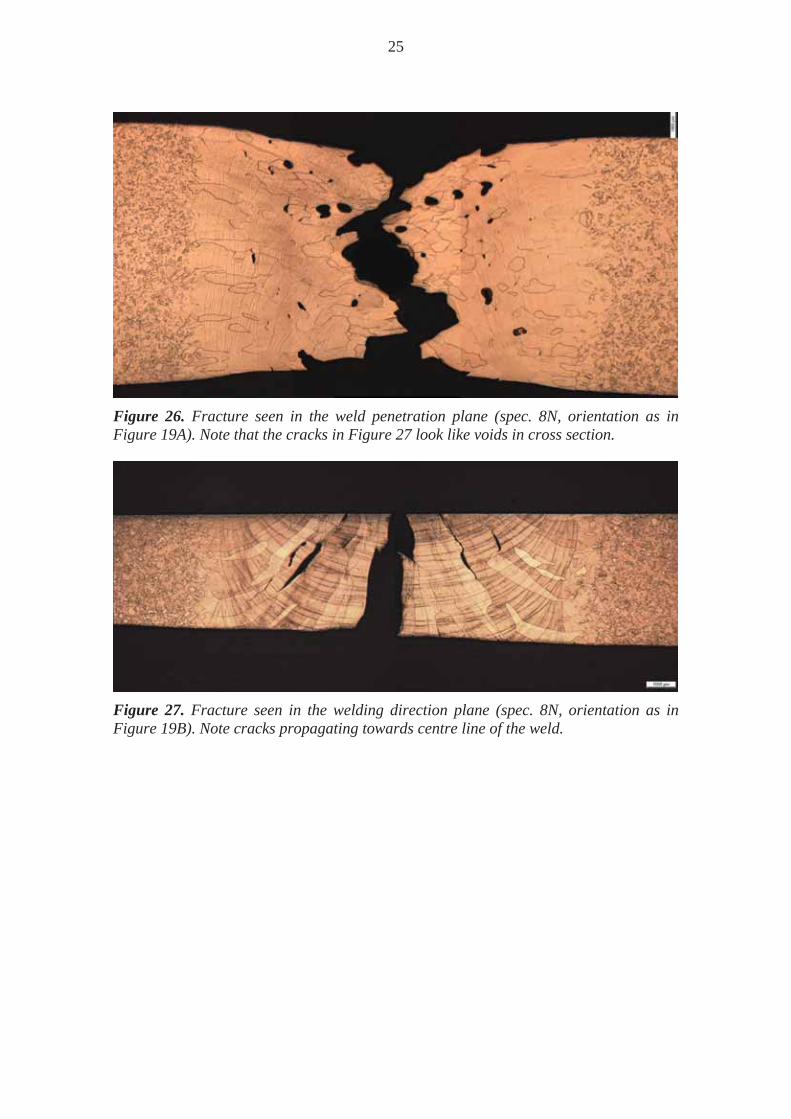
Figure 26. Fracture seen in the weld penetration plane (spec. 8N, orientation as in Figure 19A). Note that the cracks in Figure 27 look like voids in cross section.
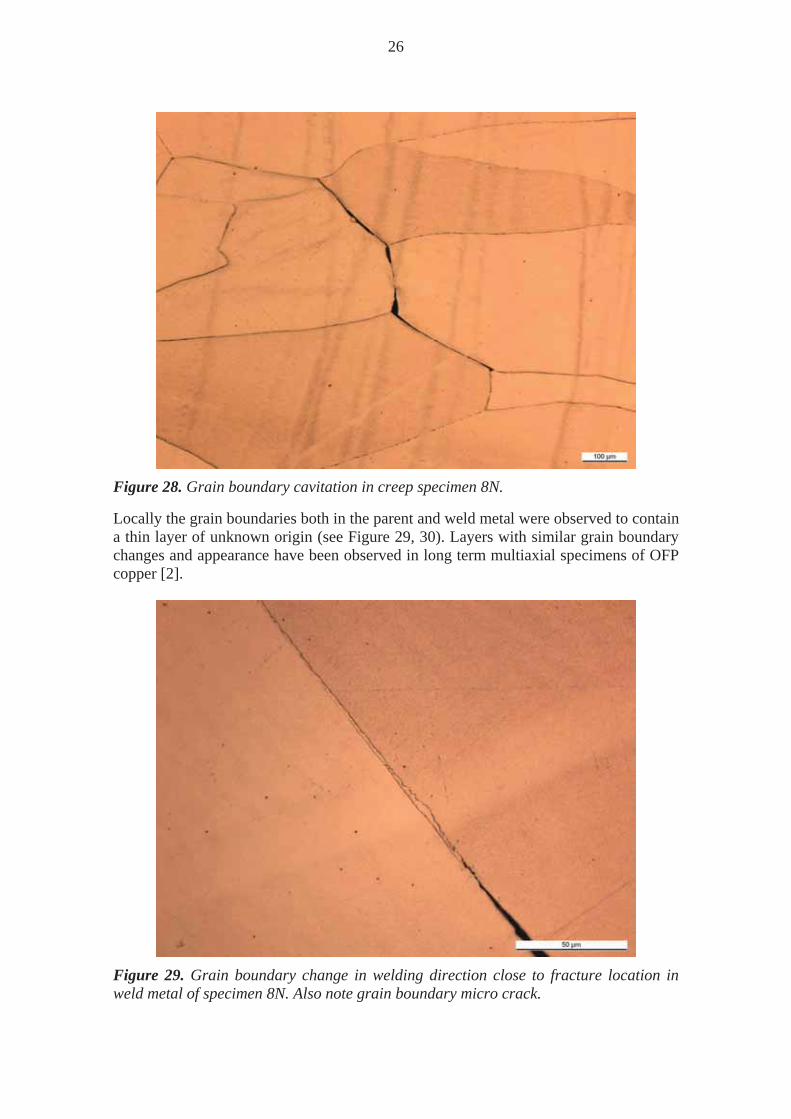
Figure 27. Fracture seen in the welding direction plane (spec. 8N, orientation as in Figure 19B). Note cracks propagating towards centre line of the weld.
26
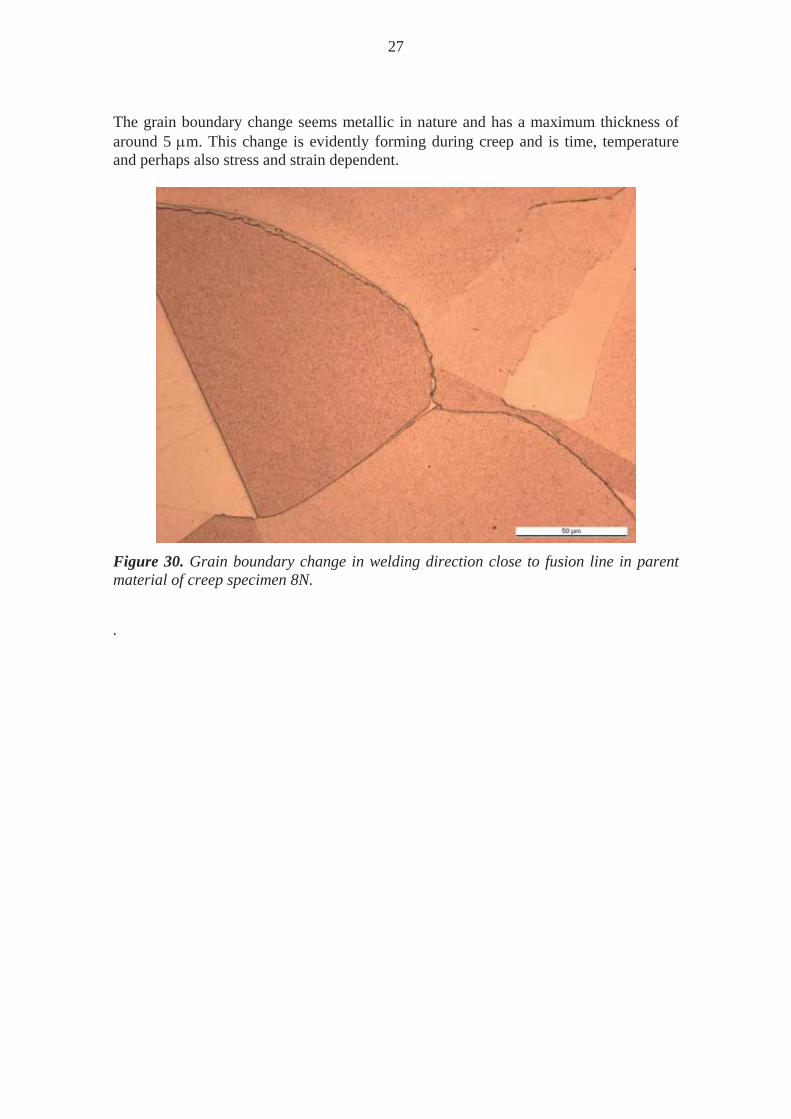
Figure 28. Grain boundary cavitation in creep specimen 8N.
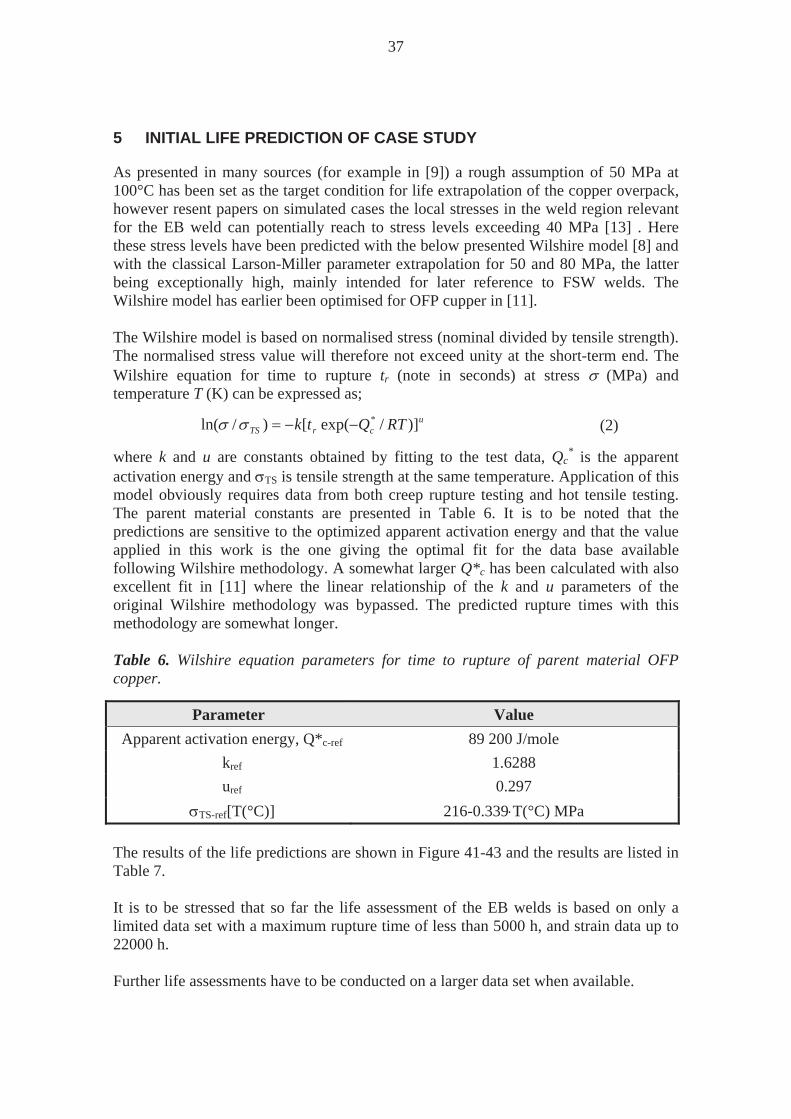
Locally the grain boundaries both in the parent and weld metal were observed to contain a thin layer of unknown origin (see Figure 29, 30). Layers with similar grain boundary changes and appearance have been observed in long term multiaxial specimens of OFP copper [2].
Figure 29. Grain boundary change in welding direction close to fracture location in weld metal of specimen 8N. Also note grain boundary micro crack.
27
The grain boundary change seems metallic in nature and has a maximum thickness of around 5 m. This change is evidently forming during creep and is time, temperature and perhaps also stress and strain dependent.
Figure 30. Grain boundary change in welding direction close to fusion line in parent material of creep specimen 8N.
.

28

29
4 LOCAL MATERIAL PROPERTIES IN THE WELD ZONE
As became evident from the tensile and creep testing results the local material properties of the EB weld region itself will have a significant role in the prediction of long term life. The investigation of the local material parameters has been conducted with hardness testing over the weld and through manual strain measurements between hardness indentations after loading. As an entirely new measurement type the ARAMIS 3D deformation analysis system has been used for measurements of local strains. The high accuracy, three-dimensional deformation and strain measurement system has been used at room temperature to determine the local axial strains of an un-machined EB sample (9A). The interesting feature of the test run is that the ARAMIS analysis system found the 2mm surface flaw that had been reported found in the X-ray (non destructive) testing conducted by Posiva (see Table 2). Posiva has additional test data from ARAMIS testing at room temperature for numerous locations within the EB weld. This data will be utilized in later work on the EB weld material property determination.
4.1 Hardness profile over the EB-weld
The hardness profile (HV 1) was taken across the EB weld of one un-machined sample (8L) and one spark eroded test specimen (8O). The target spark eroded specimen 8O is shown in Figure 31. The hardness profiles of the as-received sample 8L is shown in Figure 32 and for the spark eroded specimen 8O in Figure 33. The hardness values acquired can be compared to parent material values [6] for parent material OFP copper. The corresponding hardness (100 g micro-Vickers hardness) for parent material with varying grain sizes (100-2000 m) and phosphorus contents (1-106 ppm) range between 53 (30 ppm P, 450 m grain size) and 64 (60 ppm P, 2000 m grain size).

30
Figure 31. Hardness measurement and local strain measurement markings of specimen 8O. To be compared with the situation after loading situation in Figure 34.
-15
-10
-5 0 5 10
RelativX
-4-3
-2-10
12
3
RelativY
72
72
73
73
74
74
75
75
76
76
77
77
78
78
79
79
80
80
81
81
82
82
83
83
Har
dnes
s
Har
dnes
s
Figure 32. Hardness measurement distribution (HV 1) taken across the EB-weld (as-rec.) of test piece 8L. Note that the fitted function is indicative only to show the hardness dip in the EB-weld and does not represent the material behaviour outside the measured area.

31
-15
-10
-5 0 5 10
RelativX
-4-3
-2-1
01
23
RelativY
54
54
55
55
56
56
57
57
58
58
59
59
60
60
61
61
62
62
63
63
64
64
Har
dnes
s (H
V1)
Har
dnes
s (H
V1)
Figure 33. Hardness measurement distribution (HV 1) taken across the EB-weld of the spark eroded specimen 8O; Note that the fitted function is indicative only to show the hardness dip in the EB-weld and does not represent the material behaviour outside the measured area.
The surface of the as-received test specimen is about 20 (HV1) higher than for the spark eroded test specimen showing surface cold working related to the plate manufacturing process.
4.2 Local strains
To determine the local strains of the EB-weld the specimen (8O) was loaded stepwise to 100 MPa identically as was done for specimen 9N (at 175 °C). The loading sequence of the interrupted creep test led to local strains in the weld as shown in Figure 34. The local distances between hardness indentations were measured from the image. The localisation of the strain becomes evident from measuring the dimensional changes over and across the centre of the weld. The centre has a compressive strain of 8 % calculated over the centreline of the weld and strains calculated from longitudinal (cross weld) changes in indentation distances vary between 4-9 %. From this test it seems that local strain measurements are difficult to acquire from indentation point movement in a plane. Only a rough estimate can be acquired due to straining also in the depth dimension. From these findings it was concluded that the long term creep deformation could be roughly followed by six thickness measurements over and adjacent to the EB weld (both welding direction and perpendicular to it in mid weld metal and on both sides of the weld on the parent material side).

32
Figure 34. Interrupted creep test; loading to 100 MPa / 175°C (specimen 8O), the measured nominal strain over the gauge length is 6 % whereas the dimensional change (width) in the weld indicates a local strain of 8 % at the centre of the weld in the penetration direction. The weld experiences an additional 3 % stress increase in the weld due to “necking” effect (reduction in weld cross section in relation to corresponding reduction of parent material cross section). Compare with results in Figure 11.
Aramis local strain measurements (3D) were initiated at room temperature. The localisation of strain into the weld zone is described in Figure 35 to Figure 38. Below yield no difference is detected but immediately above yield the localisation is evident.
Figure 35. ARAMIS axial strain distribution across the EB-weld 9A at 65 MPa, The strain measurement was reset below 40 MPa (less than yield).

33
Figure 36. ARAMIS axial strain distribution across EB-weld 9A at 70 MPa. Note red dot (surface flaw) appearing on the left hand side (arrow).
Figure 37. ARAMIS axial strain distribution across EB-weld 9A at 75 MPa.

34
Figure 38. ARAMIS axial strain distribution across EB-weld 9A at 77.5 MPa.
The Aramis system will hopefully be utilised for further studies of strain localisation both in tensile and creep (short term) at a later stage of the EB weldment characterisation work. The local deformation was also found in the weld material zone of the creep specimens. The local constriction seen in Figure 39 was measured by taking replicas and measured with surface displacement measurements. The results show that the measurement was sensitive to the replica bending, but gave results in the expected range of about few tenths of a millimetre (see Figure 39 and Figure 40).
Figure 39. Local deformation in EB weld at interruption (3163 h) for strain correction and replica sampling (150 °C creep tests).

35
Figure 40. Measured ‘necking’ in EB weld measured from replica sample taken from 8A (150 °C, Local deformation in EB weld at interruption (3163 h) for strain correction (150 °C creep tests).

36
37
5 INITIAL LIFE PREDICTION OF CASE STUDY
As presented in many sources (for example in [9]) a rough assumption of 50 MPa at 100°C has been set as the target condition for life extrapolation of the copper overpack, however resent papers on simulated cases the local stresses in the weld region relevant for the EB weld can potentially reach to stress levels exceeding 40 MPa [13] . Here these stress levels have been predicted with the below presented Wilshire model [8] and with the classical Larson-Miller parameter extrapolation for 50 and 80 MPa, the latter being exceptionally high, mainly intended for later reference to FSW welds. The Wilshire model has earlier been optimised for OFP cupper in [11]. The Wilshire model is based on normalised stress (nominal divided by tensile strength). The normalised stress value will therefore not exceed unity at the short-term end. The Wilshire equation for time to rupture tr (note in seconds) at stress (MPa) and temperature T (K) can be expressed as;
ucrTS RTQtk )]/exp([)/ln( * (2)
where k and u are constants obtained by fitting to the test data, Qc* is the apparent
activation energy and TS is tensile strength at the same temperature. Application of this model obviously requires data from both creep rupture testing and hot tensile testing. The parent material constants are presented in Table 6. It is to be noted that the predictions are sensitive to the optimized apparent activation energy and that the value applied in this work is the one giving the optimal fit for the data base available following Wilshire methodology. A somewhat larger Q*c has been calculated with also excellent fit in [11] where the linear relationship of the k and u parameters of the original Wilshire methodology was bypassed. The predicted rupture times with this methodology are somewhat longer. Table 6. Wilshire equation parameters for time to rupture of parent material OFP copper.
Parameter Value Apparent activation energy, Q*c-ref 89 200 J/mole
kref 1.6288 uref 0.297
TS-ref[T(°C)] 216-0.339 T(°C) MPa The results of the life predictions are shown in Figure 41-43 and the results are listed in Table 7. It is to be stressed that so far the life assessment of the EB welds is based on only a limited data set with a maximum rupture time of less than 5000 h, and strain data up to 22000 h. Further life assessments have to be conducted on a larger data set when available.
38
50
60
80
100
120
140
160
4.5 5.0 5.5 6.0 6.5 7.0 7.5 8.0
EB (TR-05-08) EB (IM 3327) EB (Posiva-VTT)
Larson-Miller (C=11)
Stre
ss (M
Pa)
Linearassumed trend
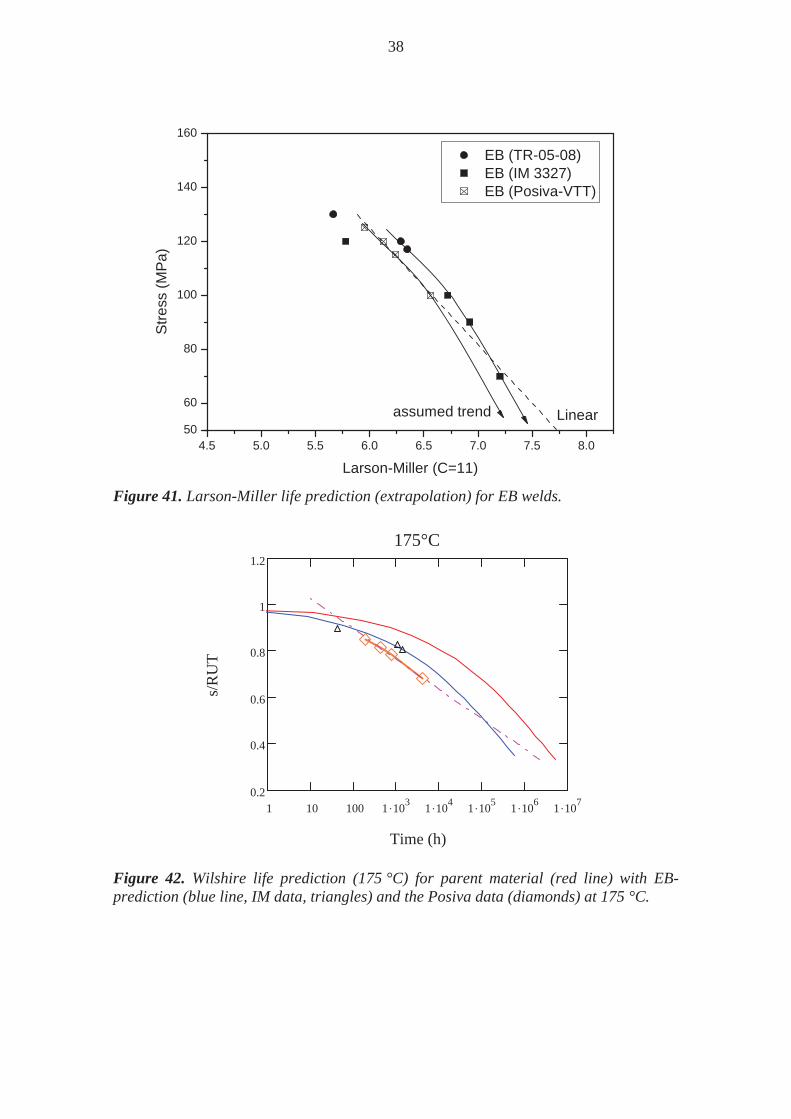
Figure 41. Larson-Miller life prediction (extrapolation) for EB welds.
1 10 100 1 103 1 104 1 105 1 106 1 1070.2
0.4
0.6
0.8
1
1.2175°C
Time (h)
s/R
UT
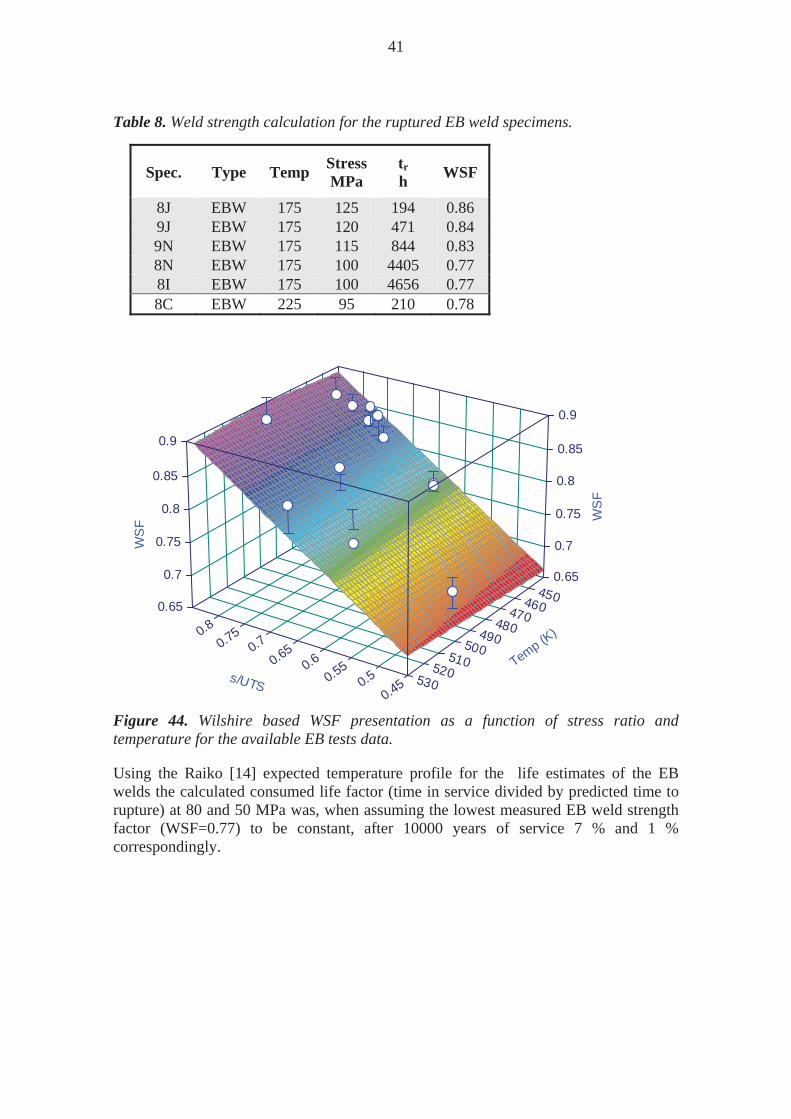
Figure 42. Wilshire life prediction (175 °C) for parent material (red line) with EB-prediction (blue line, IM data, triangles) and the Posiva data (diamonds) at 175 °C.

39
w
w
w
w
ww w
ww
w ww
w
0.000001 0.00001 0.0001 0.001 0.01 0.1 1
tf*exp(Q/RT)
/TS
Wilshire BM modelbatch 400 (PM)batch 500 (PM)SKB (PM)IM (PM)
w EB welds
Figure 43. Wilshire model fit to parent material (PM, circles) and EB-welds (w) from both public domain and Posiva tests.

40
Table 7. Rupture predictions (in years) for running creep tests and the case studies at 50 and 80 MPa / 100 °C.
Spec. Type Temp Stress MPa /Rm(T)
Time h
strain ( c) %
rate at c (1/h)
tr pred(a)
8A EBW 1) 150 100 0.66 22000+ 4.6+ 1.4e-6 3
8D EBW 1) 150 90 0.59 22000+ 2.4+ 8.0e-7 9
8H EBW 1) 150 70 0.46 22000+ 2.4+ 5.0e-7 48
9H EBW 1) 125 70 0.44 17000+ 2.1+ 1.1e-6 398
9I EBW 1) 125 115 0.73 17000+ 4.8+ 3.7e-6 8
9K EBW 1) 125 100 0.63 17000+ 2.3+ 2.5e-6 35
9pv1 PM 1) 150 100 0.60 22000+ 5.2+ 1.5e-6 172
9pv2 PM 1) 125 100 0.58 17000+ 3.6+ 2.7e-6 1 400
Wilshire Parent material
100 50 0.30 - - - 45000
100 80 0.48 - - - 10000
Wilshire EB-weld
WSF=0.77
100 50 0.30 - - - 21000
100 80 0.48 - - - 3000
Larson-Miller Linear, EB-weld,
C=11 (see Figure 42)
100 50 - - - - > 230000
100 80 - - - - > 30000
The WSF values used in the predicted life assessment of the EB welds are done by replacing tr in the parent material Wilshire equation with the rupture time of the EB weld test [12]. This gives an expected / TS for weldment in relation to that of reference (PM) material. Then the weld strength factor WSF, or cross weld strength divided by reference (PM) material strength at the same time and temperature is as shown in (Eq 3), or
refTSrefu
refcEBrref
EB
RTQtkWSF
))]/exp([exp( * (3)
where EB is the test stress, T temperature and trEB the time to rupture for the weld. The tensile strength TS-ref and the constants uref, kref and Q*c-ref are those specified for the reference (parent) material. The calculated WSFs for the 175 °C are given in Table 8 and plotted as a function of stress and temperature in Figure 44.
41
Table 8. Weld strength calculation for the ruptured EB weld specimens.
Spec. Type Temp StressMPa
tr h WSF
8J EBW 175 125 194 0.86 9J EBW 175 120 471 0.84 9N EBW 175 115 844 0.83 8N EBW 175 100 4405 0.77 8I EBW 175 100 4656 0.77 8C EBW 225 95 210 0.78
Figure 44. Wilshire based WSF presentation as a function of stress ratio and temperature for the available EB tests data.
Using the Raiko [14] expected temperature profile for the life estimates of the EB welds the calculated consumed life factor (time in service divided by predicted time to rupture) at 80 and 50 MPa was, when assuming the lowest measured EB weld strength factor (WSF=0.77) to be constant, after 10000 years of service 7 % and 1 % correspondingly.
0.450.50.550.60.650.70.750.8
s/UTS 530520
510500
490480
470460
450
Temp (K)
0.65
0.650.7
0.70.75
0.750.8
0.80.85
0.850.9
0.9
WS
F WS
F

42

43
6 FUTURE WORK
The test programme will be continued for both 125 °C and 150 °C until rupture or specified strain or strain rate. Some additional testing (outside the planned test matrix) might have to be conducted to improve the data base for EB welds. Further work on the impact of localised strain should be done and the low temperature models for life estimation should be improved. The Posiva Aramis tensile data will be a good starting point for this work. Also, further development in measurement tools suitable for long term creep tests, i.e measurement at interruptions should be found and applied. Further work is also required in the identification of grain boundary changes developing under creep conditions. For further insight in the creep ductility and creep cracking issues a testing programme including compact tension specimens (CT testing) should be initiated. The CT- tests would also serve as a good base for creep damage modelling including multiaxial constraint.

44

45
REFERENCES
[1] TKS-2009, Nuclear Waste Management at Olkiluoto and Loviisa Power Plants Review of Current Status and Future Plans for 2010–2012, February 2010.
[2] Auerkari, P., Holmström, S., Salonen, J. & Nenonen, P. Creep performance of OFP copper for the overpack of repository canisters. 29th International Symp. on the Scientific Basis for Nuclear Waste Management (MRS 2005), September 12-16, 2005, Ghent, Belgium. 8 s.
[3] Holmström, S., Salonen, J., Auerkari, P. & Saukkonen, T. Long-term integrity of copper overpack. SKI Report 2007:38, ISSN 1104-1374.
[4] Seitisleam, F., Henderson, P. & Lindblom, J. Creep of copper for nuclear waste containment – results of creep and tensile tests on Cu-OF, Cu-OFP, Cathode copper and welded joints. Swedish Institute for Metals Research, IM-3327, Feb. 1996.
[5] Andersson, H., Seitisleam, F. & Sandström, R. Creep testing of thick-walled copper electron beam and friction stir welds at 75, 125 and 175 °C. SKB Technical Report TR-05-08, Jan 2005.
[6] Andersson, H., Seitisleam, F. & Sandström, R. Influence of phosphorus and sulphur as well as grain size on creep in pure copper. SKB Technical Report TR-99-39, Dec. 1999
[7] ECCC Recommendations, Creep data validation and assessment procedures, S. R Holdsworth et al. (Eds.). ERA Technology Publ., 2001 (a) Vol. 1: Overview, (b) Vol. 2. Terms and terminology, (c) Vol. 3. Data acceptability criteria, Data generation, (d) Vol. 4. Data exchange and collation, (e) Vol. 5. Data assessment.
[8] Wilshire, B., Scharning, P.J. & Hurst, R. A new methodology for long term creep data generation for power plant components. International Conference on Life Management and Maintenance for Power Plants. Helsinki-Stockholm-Helsinki, 12-14 June 2007. Vol. 1. Pp. 196-207.
[9] Petterson, K. Development of a constitutive model for the plastic deformation and creep of copper and its use in the estimate of creep life of the copper canister. SKI Report 2007:12, ISSN 1104-1374, Dec. 2006.
[10] Lindblom, J., Henderson, P. & Seitisleam, F. Creep testing of oxygen-free phosphorus copper and extrapolation of results. Swedish Institute for Metals Research, IM-3197, ISSN 0284-2378, 1995.
[11] Holmström, S. & Auerkari, P. Predicting creep rupture from early strain data. Materials Science and Engineering A., Vol. 510 – 511, 2009, pp. 25-28.

46
[12] Holmström, S. & Auerkari, P. Improved approach for predicting weld creep strength factors of ferritic steels. Energy Materials, Materials Science & Engineering for Energy Systems, Vol. 4, No. 1, 2009, pp. 23-27.
[13] Raiko, R., Sandström, R., Rydén, H. & Johansson, M. Design analysis report for the canister. SKB Technical Report TR-10-28, 2010.
[14] Raiko, R. Disposal canister for spent nuclear fuel – Design report. Posiva Report 2005-02. 61 p.

APP
END
IX 1
– C
HEM
ICA
L C
OM
POSI
TIO
N (i
n pp
m e
xept
for C
u in
%).
Spe
c. E
N 1
976
Cu-
OF
and
OFP
S
pec.
EN
197
6 C
u-O
F1 a
nd O
FP
Ave
rage
Par
ent
mat
eria
l A
vera
ge W
eld
mat
eria
l A
ccur
acy
STD
par
ent m
ater
ial
SD
T w
eld
mat
eria
l
Cu_
cal
99.9
9%
rem
.99
.992
299
.992
2 0.
0009
0.00
015
0.00
014
Ag
25
2514
.514
.6
3.1
0.19
60.
112
Al <
0.
300.
30
0.3
00
As
5 5
1.07
1.09
0.
30.
050
0.03
3 Bi
1
0.
140.
13
0.08
0.00
50.
004
Cd
< 1
0.
000.
00
0.00
40
0 C
o <
0.03
0.03
0.
030
0 C
r <
0.10
0.10
0.
12.
2812
7E-0
92.
2812
7E-0
9 Fe
<
10
100.
800.
80
0.8
1.82
501E
-08
1.82
501E
-08
Mn
< 0.
5
0.50
0.50
0.
50
0 N
i 10
1.00
1.11
0.
40.
050.
03
P 30
-70
30-7
052
.86
53.6
2 7.
31.
030.
61
Pb
5 5
0.27
0.28
0.
130.
003
0.04
4 S
8 8
5.22
5.34
3
0.23
0.21
Sb
4
40.
060.
07
0.05
0.00
50.
003
Se
3 2
0.20
0.20
0.
24.
5625
3E-0
94.
5625
3E-0
9 Si
<
2.67
2.32
2.
11.
090.
44
Sn
2
0.05
0.08
0.
040.
004
0.00
4 Te
2
20.
090.
08
0.04
0.00
50.
005
Zn <
1
0.
300.
30
0.3
00
Zr <
0.
300.
30
0.3
00
Spe
c. E
N 1
976
Cu-
OF1
and
OFP
Ave
rage
Par
ent
mat
eria
lA
vera
ge W
eld
mat
eria
l A
s+C
d+C
r+M
n+S
b15
1.74
1.76
Co+
Fe+N
i+S
i+S
n+Zn
204.
844.
64 B
i+S
e+Te
3
0.42
0.41
Se+
Te
30.
290.
28
47

48

APP
END
IX 2
– S
TAN
DA
RD
(RO
UN
D B
AR
) CR
EEP
AN
D T
ENSI
LE T
EST
SPEC
IMEN
Osa
Nim
itys
Piir
. n:o
Ain
esK
plH
uom
!S
uhde
Piir
.Ta
rk.
Pvm
.N
imi
TIK
941D
VIR
US
AU
VA
M16
28.4
.199
4TH
Pro
jisoi
nti
Kok
.piir
.P
inta
Tole
rans
sit
Pai
no1:
1
130
23,5
12,5
350
40
45°
45°
5,7°
0,8
11
M16
12,510,1
10 ±0,02
12
BA
Yle
isto
lera
nssi
±0,
1
0,05
A-B
3,2
0,8
Kar
tio1:
5
49

50

APP
END
IX 3
- SP
AR
K E
RO
DED
(SQ
UA
RE
CR
OSS
SEC
TIO
N) C
REE
P A
ND
TEN
SILE
TES
T SP
ECIM
EN.
51

52

APPENDIX 3 – Cont. Tensile testing results for EBW and parent material OFP copper
Figure 1. Initial shape of hot tensile tests of EB-welds
Figure 2. Initial shape of hot-tensile tests of parent material X259
53

54