Creep- Mat and Struct-libre
15
ORIGINAL ARTICLE Effect of high temperature creep on the fire response of restrained steel beams V. K. R. Kodur • M. M. S. Dwaikat Rece ived: 22 April 2009 / Acc epte d: 5 Janu ary 2010 RILEM 2010 Abstract At room temp eratur e, and at servic e load levels, creep has little effect on the performance of steel structures. However, under fire conditions, creep be comes a domi nant fa ctor and influ ence s fir e resis tance of steel members . Under fire condit ions, signifi cant forces develop in rest rained steel beams and these forc es induce hi gh st re ss es in the st eel section. The extent of creep deformations is affected by magnitude and rate of development of stress and temperature in steel. In this paper, the effect of high temper at ur e creep on fir e re sponse of restrained beams is investigated. Current high temperature creep models are compared. Finite element model created in ANSYS was validated by comparing the predic- tions with fire tes t dat a. The valida ted mod el was applied to investigate the effect of load level, heating rate, fire scenario and fire induced axial restraint on the ext ent of cre ep def ormati ons . Res ult s fro m the parametric study indicate that the influence of high temperature creep increases with the increase in axial restraint, hea ting rat e, and loa d level. Gen era lly, neglecting high-temperature creep effect stiffens the structural response and leads to reduced deflections but larger restraint forces. Therefore, neglecting high temperature creep in fire resistance analysis of steel structures can lead to unconservative predictions. Keywords Structural steel Creep deformations Creep model Beams Restraint High temperature creep Fire response List of symbols B, n Constants in Dorn’s creep formulation, that depend on the type of steel D H Activa tion energy of creep (Btu/ lb mole) c 1, … ,c 7 Experimental coefficients of ANSYS creep model (see text for units) h Dorn’s temperature-compensated time (h) Q D H/R = Constant of the compensated time formula in Dorn’s model (Rankine) R Gas univer sal consta nt (Btu/ lb mole R) S U(r s ) Temper ature– stress -de pendent function i n Dorn’s formulation of creep strain rate r s Stres s in steel (MPa ) t time (min) T s Steel tempe rature (C) T R Steel temperature (Rankine) Z Z en e r- Ho l lo mon exp er iment al parameter (h -1 ) 1 Introd uction Restrained steel beams, when exposed to fire, expe- rie nce signifi cant int ernal for ces tha t res ult due to V. K. R. Kodur M. M. S. Dwaikat ( &) Department of Civil and Environmental Engineering, Michigan State University, 3546 Engineering Building, East Lansing, MI 48824-1226, USA e-mail: dwaikat1@e gr.msu.edu V. K. R. Kodur e-mail: [email protected] .edu Materials and Structures DOI 10.1617/s11527-010-9583-y
-
Upload
alexandrjobs -
Category
Documents
-
view
216 -
download
0
Transcript of Creep- Mat and Struct-libre

8/12/2019 Creep- Mat and Struct-libre
http://slidepdf.com/reader/full/creep-mat-and-struct-libre 1/15

8/12/2019 Creep- Mat and Struct-libre
http://slidepdf.com/reader/full/creep-mat-and-struct-libre 2/15
high thermal expansion of steel. These re inducedforces vary as a function of re exposure time, thusresulting in stresses that vary with time ( d r s / dt = 0).The rate of development of these re induced stressesdepends on many factors including high temperaturematerial properties, re scenario, and the degree of
restraint. These factors that critically affect reresponse are mutually time-dependent. As the reseverity grows with time, the internal forces developat higher rates, leading to increased stresses that varywith time. Therefore, the re induced stresses in arestrained steel beam are not constant, but vary withre exposure time.
The transient behavior of creep at elevated temper-ature has a signicant inuence on the re response of restrained steel members. However, a review of literature clearly indicates that the effect of creep onthe re response of steel members did not receivemuch attention. Much of the reported creep studieswere mainly focused at the material level [ 1, 2] andvery little information is available on the effect of hightemperature creep on the structural response. Ander-berg investigated the inuence of creep strain on reresponse of steel beams [ 3]. However, the small scalesimply supported beams ( L = 1.15 m) used in thisstudy do not represent any realistic conditions asencountered in practice. Despite that, Anderberg foundthat creep has signicant inuence on the re responseof steel beams. Further, the commonly used creepmodels are primarily based on Dorn’s creep formula-tion [ 4], which basically assumes invariant stress level(d r s / dt = 0). Due to the lack of data, creep modelsused in most previous studies, are derived based onmaterial tests, under constant stress conditions.
This paper investigates the effect of high-temper-ature creep on the re response of restrained steelbeams. Existing creep models based on Dorn’s creepformulation are reviewed. The main drawbacks of notincorporating variant stress rate ( d r s / dt ) in theexisting creep models are discussed. An empiricalcreep model available in ANSYS software is com-pared to the current creep models, and the differencesbetween these models are highlighted. The effect of critical factors, such as load level, heating rate, rescenario and degree of restraint, on high temperaturecreep deformations is investigated. Conclusions aredrawn regarding the importance of accounting forhigh-temperature creep in tracing the re response of structural steel systems.
2 High-temperature creep
Creep is dened as the time-dependent plastic strainunder constant stress and temperature. Creep strainoccurs due to movement of dislocations in the slipplane. Normally, steel (metal) composition contains a
variety of defects, for example solute atoms, that actas obstacles to dislocation motion. At room temper-ature, the amount and distribution of these defectsremain almost uniform; therefore, creep deformationsoccur at very slow time pace. However, at hightemperatures, vacancies in the crystal structure candiffuse to the location of a dislocation and cause thedislocations to move faster to an adjacent slip plane;thus, allowing for more deformation to occur. There-fore, creep deformations accelerate with increase intemperature of steel. The temperature range in which
creep deformation may occur differs in variousmaterials. Generally, in case of steady-state (constantstress) creep deformations become noticeable attemperatures corresponding to 30% of the meltingpoint for metals. For steel, the melting point is around1400 C depending on its material composition;therefore creep strain becomes evident at around400 C at constant stress state. However, experiments[5] indicate that in the case where high stress andtemperature vary with time, creep in steel becomesevident even at 300 C.
Generally, under constant temperature and stresslevel, creep strain passes through three phases, asshown in Fig. 1. In the initial phase, termed ‘‘primarycreep’’, the strain rate is relatively high, but decreaseswith time ( d 2 ecr / dt 2 \ 0). The strain rate eventuallyreaches a minimum and becomes near constant ( d 2 ecr / dt 2 = 0). This is known as secondary or steady-state
Time
C r e e p s t r a
i n (
)
Primary creep
Secondary creep
Tertiary creep
02
2
>dt
d cr ε
02
2
<dt
d cr ε
c r
ε
Fracture points
1T
2T 3T
Increase in temperature
02
2
=
dt
d cr ε
Fig. 1 Effect of temperature on creep strain in structural steel(T 1 \ T 2 \ T 3)
Materials and Structures

8/12/2019 Creep- Mat and Struct-libre
http://slidepdf.com/reader/full/creep-mat-and-struct-libre 3/15
creep. In the nal phase, or tertiary creep, the strainrate increases exponentially with time ( d 2ecr / dt 2 [ 0),as shown in Fig. 1.
However, as the temperature is increased, creepstrain rate becomes very high, leading to verysignicant creep deformations, as shown in Fig. 1.
Further, as the temperature is increased from T 1 to T 3,(see Fig. 1), it becomes very difcult to distinguishbetween secondary and tertiary creep phases. Thus, inhigh temperature creep models, the primary andsecondary phases of high temperature creep strain aregenerally used in the re resistance analyses.
Modeling high temperature creep with its threephases is very complex. Therefore, the rst andsecond phases of creep are usually accounted for inmodels while the third phase is ignored because itgenerally leads to nearly-singular global stiffnessmatrix of the structure due to the accelerated defor-mations prior to failure. In the following sections,well-known models for creep are presented, and theirapplicability to re resistance analysis is discussed.
3 Current creep models
Creep strains are derived from steady-state testsduring which stress is kept constant. Therefore, thereare usually two cases for calculating creep strains[3, 6]. The rst case is when the stress state is close toa steady state (i.e., when the applied stress is almostconstant). The second case is when stress is changingwith time. As for the rst case, a ‘‘ time hardeningrule ’’ is used where creep strain rate _ecr ð Þ is written asa function of time ( t ) and stress in steel ( r s) and isintegrated with respect to time ( t ) as:
ecr ¼Z t
0
_ecr ðt ; r sÞdt ð1ÞFor the second case, a ‘‘ strain hardening rule ’’ is
used where creep strain rate _ecr ð Þ is written as afunction of creep strain ( ecr ) and stress in steel ( r s)and is integrated with respect to time ( t ) as:
ecr ¼Z t
0
_ecr ðecr ; r sÞdt ð2ÞAt present, most re resistance analyses are carried
out using ‘‘ time hardening role ’’ for integration of
creep strains because of its simplicity. Also, currentcreep models that are used in the analysis are mainlybased on Dorn’s theory [ 1, 4]. Dorn’s creep theoryassumes constant stress ( d r s / dt = 0), and states thatthe creep strain is a function of temperature ( T R),stress ( r s), and time ( t ). Creep strain in Dorn based
formulation is derived based on ‘‘ time hardeningrule ’’ using the following creep strain rate equationput forward by Dorn [ 4]:
d ecr
dt ¼ S U ðr sÞ½ e Q=T R ; d r s
dt ¼ 0 ð3Þwhere the compound function S U (r s) is dependent onstress and temperature, and is given as [ 4]:
S U ðr sÞ ¼(S 0 e Br s Br 1:4S 00
r n
s Br \ 1:4
where d r s
dt ¼ 0 ð4Þwhere B, n and Q are constants that depend on the typeof steel. It should be noted that the above equations, asproposed by Dorn, were essentially devised frommaterial tests of metal alloysunder constant stress( d r s / dt = 0) and constant temperature increments ( dT R / dt = 0). Since temperature and stresswere always keptconstant in the metal alloy tests, it was initially thoughtthat the formof Dorn’sequation is separablein terms of
time, with the function S U (r s) being time-independent.The term e Q=T R ; shown in Eq. 3, was used to refer totime-dependence of creep strain. Therefore, Dornproposed the concept of ‘‘compensated time’’ ( h) soas to refer to the time-dependence of creep strain. Thecompensated time was dened as [ 4]:
h ¼Z e Q=T Rdt ð5ÞA review of literature indicate that the effect of
stress and temperature variation with time ( d r s / dt = 0, dT R / dt = 0) on creep were considered inde-pendently, i.e., either under constant stress butvariable temperature, or constant temperature butvariable stress. The interaction between variableheating rate and variable stress rate on high temper-ature creep was not investigated. This is because of the severe difculties associated with experimentingand modeling such complex interaction. Such inter-action signicantly inuences creep effects in thecase of restrained beams under natural re, where the
Materials and Structures
8/12/2019 Creep- Mat and Struct-libre
http://slidepdf.com/reader/full/creep-mat-and-struct-libre 4/15
increase in steel temperature with time induces higherrates of stress development with time.
The traditional way to override the effect of thisinteraction is by taking very small time step andassuming that stress and temperature during this smalltime step as constants. This technique results in very
long computation times, thus rendering nite elementanalysis inefcient. Also, as will be demonstrated inSect. 6, this technique can result in diverged predic-tion of creep deformations when the variation of stressand/or temperature is kept for longer time durations.
Harmathy extended Dorn’s approach and proposeda revised creep model for structural steel [ 1] that canaccount for variable stress using a ‘‘ strain hardeningrule ’’. Dorn–Harmathy modied model is given as:
d ecr
dt ¼ Z
coth 2
ðb H =e
Þ e Q=T R for d r s=dt
¼ 0
ð6Þb H ¼
3 tZ e Q=T R ðtime hardening rule ÞP d ecr =dt j j D t ðstrain hardening rule Þ
ð7Þwhere ( Z ) is the Zener–Hollomon experimentalparameter and is given for A36 steel as:
Z ¼ 0:026 r 4:7
s r s 15000 psi1:23 10 16 e0:0003 r s 15000 \ r s 45000 psi
ð8Þwhere e = 1.7 9 10- 10 r s
1.75 , Q = D H/R, D H is theactivation energy of creep, and R is the universal gasconstant.
A critical review of Eq. 7 indicates that in the caseof strain hardening creep, Harmathy model becomesimplicit [ 7] and requires rigorous solving techniques,which can pose difculties in the convergence.Further, Harmathy model is primarily based onconstant stress ( d r s / dt = 0), and thus, may not beaccurate for simulating the varying stress conditionsthat occur in the case of restrained steel beam underre condition. In fact, Harmathy [ 1] himself expressed doubts on the validity of his creep modelwhen d r s / dt becomes signicant.
4 Modeling creep in ANSYS
ANSYS is a versatile nite element analysis programthat provides wide variety of empirical based creep
models. ANSYS has the capability of modeling theprimary and secondary stages of creep. The tertiarystage is usually not analyzed since it impliesimpending failure due to the gross element distortionat that stage. ANSYS analyzes creep using two timeintegration schemes, namely explicit and implicit
methods. These two integration schemes are rela-tively equivalent to the time and strain hardeningrules, respectively. Both are applicable to static ortransient analyses.
4.1 Explicit creep
Explicit creep in ANSYS employs the forward Eulerintegration scheme for the calculation of creep strainevolution. In explicit creep, ANSYS employs the‘‘time hardening rule ’’ for integrating creep strains.The creep strain rate used at each time stepcorresponds to the rate at the beginning of the timestep and is assumed to be constant throughout thattime step. Because of this, very small time steps arerequired to minimize error. For explicit creep withplasticity, plasticity correction is performed rstfollowed by creep correction. These two correctionsoccur at different stress values; therefore, explicitmethod may be less accurate.
Modeling creep in ANSYS using the explicitmethod is similar to the use of creep models based onDorn’s formulation. Both explicit ANSYS method andDorn’s creep model require very small time steps andassume constant stress and temperature in that timestep. Explicit creep is no longer recommended forcreep analysis. As an alternate, implicit creep analysisin ANSYS is recommended for re resistance analysis.
4.2 Implicit creep
Implicit creep in ANSYS refers to the use of backward Euler integration scheme for creep strains.In this method, ANSYS employs a variation of ‘‘strain hardening rule ’’ for integrating creep strain.This method is numerically unconditionally stable,which means that it does not require as small a time-step as the explicit creep method, so it is much fasteroverall.
For implicit creep plus rate-independent plasticity,the plasticity correction and creep correction are doneat the same time and not independently. Conse-quently, implicit creep is generally more accurate than
Materials and Structures

8/12/2019 Creep- Mat and Struct-libre
http://slidepdf.com/reader/full/creep-mat-and-struct-libre 5/15
explicit creep. In this study, the implicit integrationscheme of ANSYS is always employed for incorpo-ration of creep deformations. This is because thismethod is unconditionally stable and thus can be usedfor tracing the response till failure stage.
4.3 ANSYS creep model
ANSYS provides 13 creep models that can be ttedempirically. ANSYS provides nonlinear regressiontools for tting creep models to experimental creeptest data. Implicit creep model number 11 is selectedbecause it can model both the primary and secondarycreep, and is capable of predicting creep strainregardless of any coupling between time and eitherstress or temperature of steel. This is because ANSYS
employs a variation of ‘‘ strain hardening rule ’’ forintegrating creep strains, as will be explained later inthis section. The fundamental theory for this creepmodel is based on the work of Zienkiewicz andCormeau [ 8] on unied theory on plasticity and creepstrains. The model is presented in simplied format inANSYS theoretical manual.
The selected ANSYS high-temperature creepmodel is given in a simplied format, as:
D ecreepeq ¼ eprimary þ esecondary
¼ c1rc2s t
c3
þ1
ec4=T s
c3 þ 1 þ c5 t r c6s e c7=T s ð9Þ
where c1 through c7 are coefcients that are dependenton type of steel and are obtained through nonlinearregression analysis to high temperature creep test data;with c 1 = 6 9 10
- 6 per min, c 2 = 6.95, c 3 = - 0.4,c4 = 16500 C, c 5 = 6.0 9 10
- 6 per min, c 6 = 6 9
10- 5 , c7 = 5 9 10
- 3 C, t = time at end of sub step(min), r s = steel stress (MPa), T s = steel temperature( C), and Deeq
creep= modied creep strain increment.
ANSYS calculates creep strain in incremental formbased on a variation of ‘‘ strain hardening rule ’’ inwhich creep strain increment is dependent on the creepstrain at a given time step ( t ). First, the modied totalstrain vector at time step ‘‘ t ’’ is computed using thecreep strainvectorof theprevious time step ‘‘ t - 1’’as:
emodt ¼ etotal
t e plastict ethermal
t ecreept 1 ð10Þ
The modied total strain emodt is then used to
compute the equivalent modied total strain as:
emod ;totaleq ¼
1
ffiffiffi2p ð1þmÞemod
t ; x emodt ; y Þ
2
þ emodt ; y emod
t ; z 2
þ emodt ; z emod
t ; x 2
þ32 ðcmod
t ; xy Þ2
þ32 ðcmod
t ; yz Þ2
þ32 ðcmod
t ; zx Þ2 1
2 ð11ÞThe equivalent modied total strain emod ;total
eq isused to compute the equivalent stress ( r eq ) as
r eq ¼ E emod ;totaleq ð12Þ
where E is the temperature-dependent young modu-lus of steel, and m is Poisson’s ratio.
This equivalent stress is used to compute theequivalent creep strain increment ( D eq
creep ) as a scalarquantity using ANSYS model for creep (Eq. 9) andemploying temperature at current time step ‘‘ t ’’. The
scalar equivalent creep strain increment ( D eqcreep
) isthen converted to a full creep strain tensor as follows:
D ecreep x
D ecreep y
D ecreep z
D ecreep xy
D ecreep xz
D ecreep yz
26666664
37777775¼
D ecreepeq
2ð1 þ mÞemod ;totaleq !
2 1 1 0 0 01 2 1 0 0 0
1 1 2 0 0 00 0 0 3 0 00 0 0 0 3 00 0 0 0 0 3
26666664
37777775
emodt ; x
emodt ; y
emod
t ; zcmodt ; xy
cmodt ; xz
cmodt ; yz
266666664
377777775
ð13Þwhere D e x
creep , D e ycreep , D e z
creep , D e xycreep , D e xz
creep , andD e yz
creep are the nal creep strain increments in x, y, z, xy, xz, and yz, respectively.
Next, the elastic strains ( e x, t elastic ) and the total creep
strains ( e x,t creep ) are calculated as follows, using the
example of the x-component:eelastic x;t ¼ emod
x;t D ecreep x ð14Þ
ecreep x;t ¼ ecreep
x;t 1 þD ecreep x ð15Þ
Further comparison between ANSYS creep modeland Dorn-based creep models will be carried out inthe following section. As a representative for Dorn-based models, Dorn–Harmathy modied model willbe used to demonstrate the effect of non-trivial stress
Materials and Structures
8/12/2019 Creep- Mat and Struct-libre
http://slidepdf.com/reader/full/creep-mat-and-struct-libre 6/15
rate development ( d r s / dt = 0) on high temperaturecreep strain of steel.
5 Calibration of creep material model
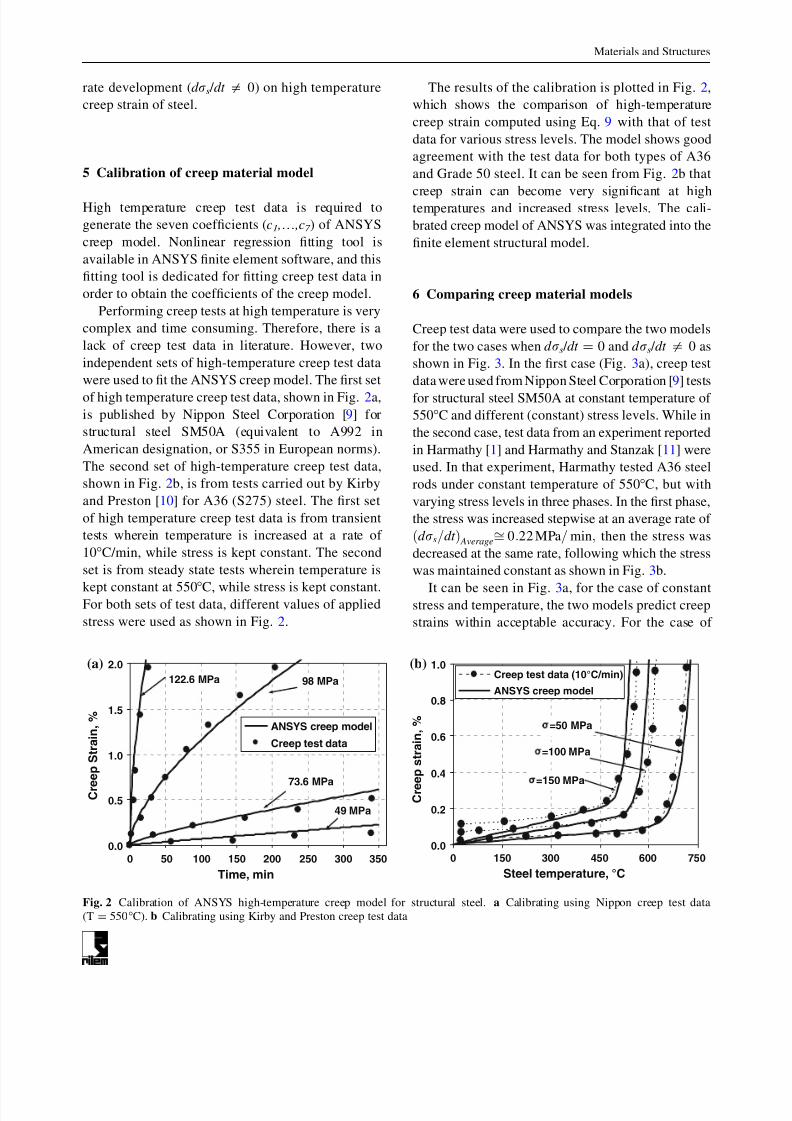
High temperature creep test data is required togenerate the seven coefcients ( c1 ,… ,c7 ) of ANSYScreep model. Nonlinear regression tting tool isavailable in ANSYS nite element software, and thistting tool is dedicated for tting creep test data inorder to obtain the coefcients of the creep model.
Performing creep tests at high temperature is verycomplex and time consuming. Therefore, there is alack of creep test data in literature. However, twoindependent sets of high-temperature creep test data
were used to t the ANSYS creep model. The rst setof high temperature creep test data, shown in Fig. 2a,is published by Nippon Steel Corporation [ 9] forstructural steel SM50A (equivalent to A992 inAmerican designation, or S355 in European norms).The second set of high-temperature creep test data,shown in Fig. 2b, is from tests carried out by Kirbyand Preston [ 10] for A36 (S275) steel. The rst setof high temperature creep test data is from transienttests wherein temperature is increased at a rate of 10 C/min, while stress is kept constant. The second
set is from steady state tests wherein temperature iskept constant at 550 C, while stress is kept constant.For both sets of test data, different values of appliedstress were used as shown in Fig. 2.
The results of the calibration is plotted in Fig. 2,which shows the comparison of high-temperaturecreep strain computed using Eq. 9 with that of testdata for various stress levels. The model shows goodagreement with the test data for both types of A36and Grade 50 steel. It can be seen from Fig. 2b that
creep strain can become very signicant at hightemperatures and increased stress levels. The cali-brated creep model of ANSYS was integrated into thenite element structural model.
6 Comparing creep material models
Creep test data were used to compare the two modelsfor the two cases when d r s / dt = 0 and d r s / dt = 0 asshown in Fig. 3. In the rst case (Fig. 3a), creep testdata were used from Nippon Steel Corporation [ 9] testsfor structural steel SM50A at constant temperature of 550 C and different (constant) stress levels. While inthe second case, test data from an experiment reportedin Harmathy [ 1] and Harmathy and Stanzak [ 11 ] wereused. In that experiment, Harmathy tested A36 steelrods under constant temperature of 550 C, but withvarying stress levels in three phases. In the rst phase,the stress was increased stepwise at an average rate of d r s=dt ð Þ Averageffi
0:22 MPa =min ; then the stress wasdecreased at the same rate, following which the stresswas maintained constant as shown in Fig. 3b.
It can be seen in Fig. 3a, for the case of constantstress and temperature, the two models predict creepstrains within acceptable accuracy. For the case of
98 MPa
73.6 MPa
49 MPa
122.6 MPa
0.0
0.5
1.0
1.5
2.0
150 2500 50 100 200 300 350Time, min
C r e e p S
t r a i n ,
%ANSYS creep model
Creep test data
=150 MPa
=100 MPa
=50 MPa
0.0
0.2
0.4
0.6
0.8
1.0
0 150 300 450 600 750Steel temperature, °C
C r e e p s t r a i n ,
%
Creep test data (10°C/min)
ANSYS creep model
(a) (b)
Fig. 2 Calibration of ANSYS high-temperature creep model for structural steel. a Calibrating using Nippon creep test data(T = 550 C). b Calibrating using Kirby and Preston creep test data
Materials and Structures

8/12/2019 Creep- Mat and Struct-libre
http://slidepdf.com/reader/full/creep-mat-and-struct-libre 7/15
varying stress with time (Fig. 3b), despite using smalltime step ( D t = 1 s.), Harmathy model diverges fromtest data after 140 min into the test. However, ANSYSmodel predictions compare well with the test data(Fig. 3b). As Harmathy himself stated [ 1], the reasonbehind this divergence is that his model is based onDorn’s formulation, which assumes constant stress.
It is worth mentioning that Harmathy model hasbeen used extensively in literature and was mostlyvalidated against unrestrained and/or unprotectedsteel members in re. The rate of variation of stressesin unrestrained steel members is usually small whencompared to that of restrained members. Also,unprotected steel members usually fail much faster(earlier) than protected steel members. Therefore,Harmathy creep model is generally sufcient forreasonably predicting the creep deformations forunprotected steel members. However, when highstress and temperature are maintained in steel mem-bers for long time durations, as in the case of protected steel members, then prediction of creepdeformations based on Harmathy creep modelbecomes inaccurate, as shown in Fig. 3b. Therefore,for the case of protected steel members which mayberequired to resist re for 4 h, high temperature creepshould be modeled with due consideration.
7 Creep effect on structural response
In the previous section, creep models were comparedwith test data obtained from creep tests at material
level. However, structural members, when exposed tore, experience conditions that are entirely differentfrom those seen in material tests. As an illustration,restrained beams, under re exposure, can experiencerapidly increasing stresses with temperature. Thesefactors are to be accounted for realistic performanceassessment.
To investigate the effect of creep on structural reresponse of beams, ANSYS high temperature creepmodel is incorporated into nite element model andanalysis is carried out using ANSYS.
7.1 Finite element model
In this section test data for restrained steel beamexposed to non-standard re is used to compare thecreep models discussed earlier. Li and Guo [ 12]tested an axially-restrained steel beams by exposing itto a random design re from three sides. This re testwas simulated using three dimensional shell-elementmodel in ANSYS nite element software. Thevalidated model is then used to study the inuenceof critical parameters on the extent of creep defor-mations on the re response of restrained beams. Thedetails of the nite element model are explained inthe following sections.
7.1.1 Stress–strain relations
Temperature–stress–strain relations, for structuralsteel, specied in the codes and standards [ 13 , 14]do not properly account for high-temperature creep,
0 50 100 150 200 250 300 3500.0
0.5
1.0
1.0
2.0
Time, min
C r e e p s
t r a i n
, %
ANSYS modelHarmathy modelTest data (Gr50 steel)
s =
s =s = 49 MPa
73.6 MPa
98 MPa
00.5
1
1.5
22.5
3
3.5
4
4.5
5
0 100 200 300 400 500 600
Time, min
C r e e p s t r a
i n ,
%
0
20
40
60
80
100
120
140
160
S t r e s s ,
M P a
Applied variable stress
Harmathy model
ANSYS model
Test data
(d σ / dt ) ≅ ± 0.22 MPa/min Averages
(a) (b)
Fig. 3 Creep strains, predicted using ANSYS and Harmathy models, compared to test data. a dr s /dt = 0, Ts = 550 C. b dr s /dt = 0,Ts = 550 C
Materials and Structures
8/12/2019 Creep- Mat and Struct-libre
http://slidepdf.com/reader/full/creep-mat-and-struct-libre 8/15
which can be signicant under re exposure, espe-cially prior to failure of the member. High temper-ature creep is highly nonlinear transient phenomenonand creep characteristics change with time as stressand temperature vary signicantly with time too.Therefore, it is impossible to fully include the effect
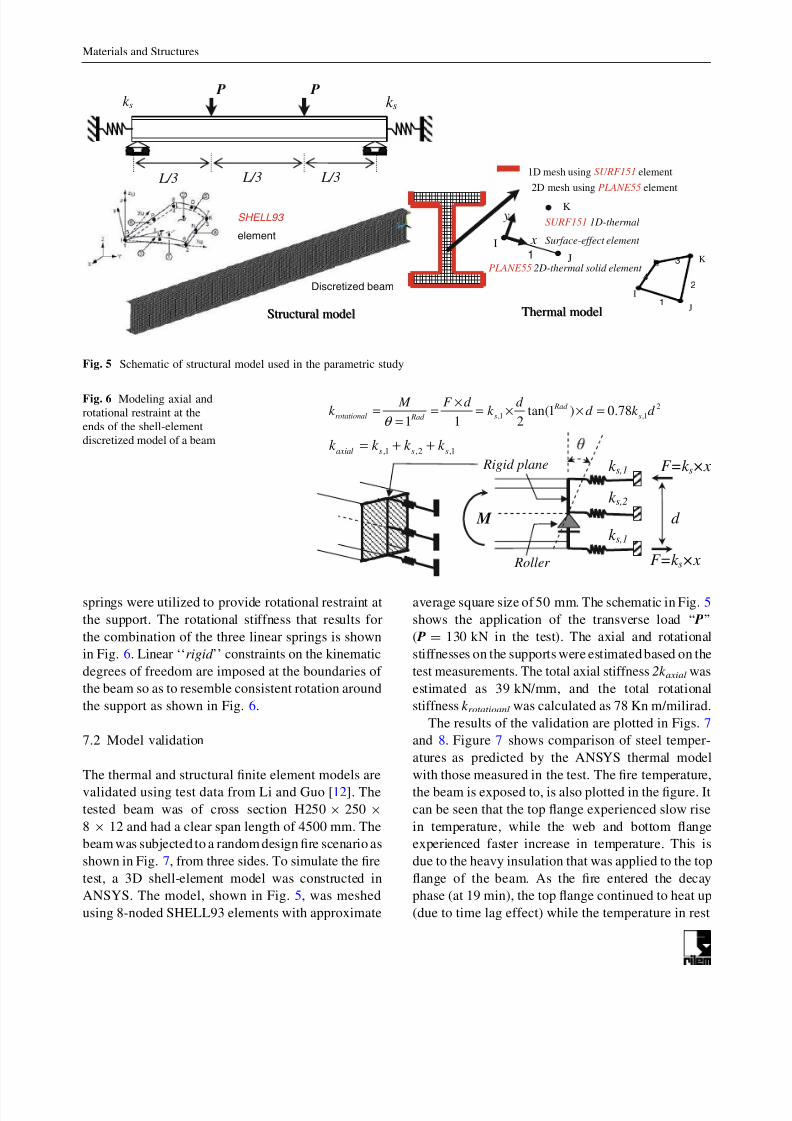
of creep in static stress–strain curves that do notincorporate the time factor (whether rates or absolutetimes). However, Eurocode [ 13] stress strain curveswere developed such that the stress causing plasticstrain is underestimated so as to compensate for thetransient effect of creep [ 3]. Therefore, to eliminatethe confusion regarding this issue (inclusion of creepin stress–strain curves) and to understand the effect of high-temperature creep on the response of restrainedsteel beams, temperature–stress–strain relations rec-ommended by Poh [ 15] were used in the analysis.
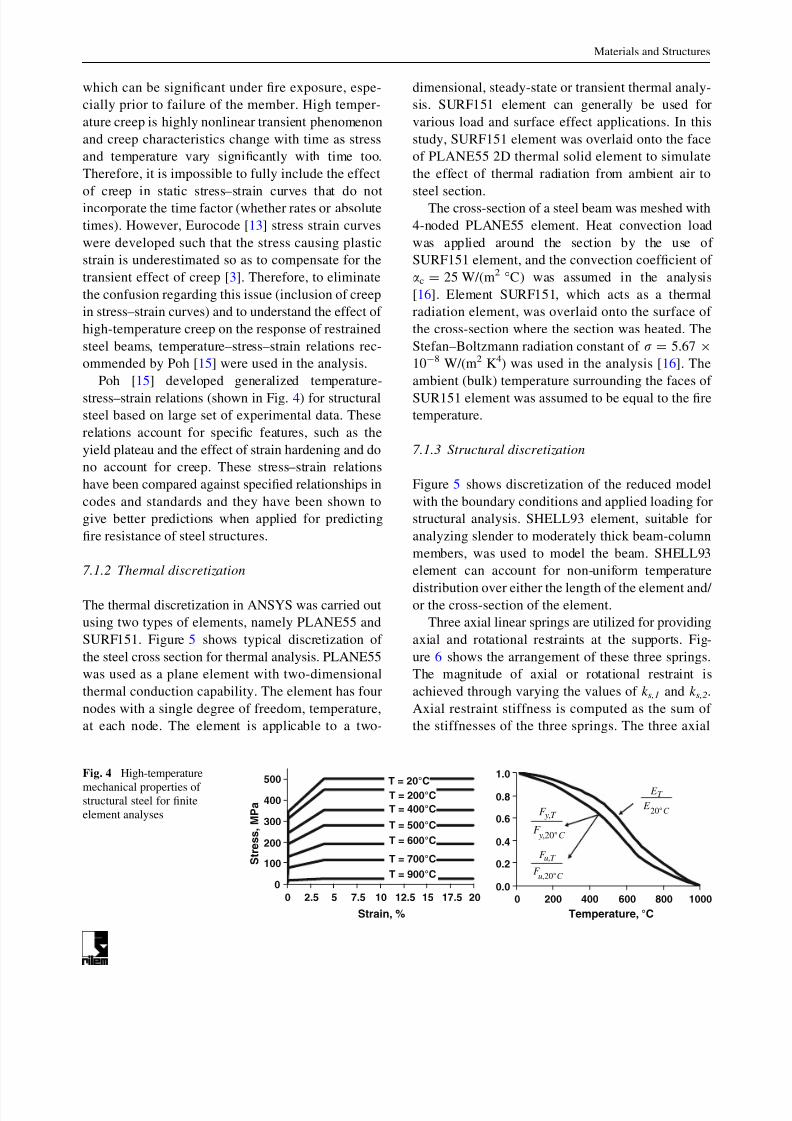
Poh [ 15] developed generalized temperature-stress–strain relations (shown in Fig. 4) for structuralsteel based on large set of experimental data. Theserelations account for specic features, such as theyield plateau and the effect of strain hardening and dono account for creep. These stress–strain relationshave been compared against specied relationships incodes and standards and they have been shown togive better predictions when applied for predictingre resistance of steel structures.
7.1.2 Thermal discretization
The thermal discretization in ANSYS was carried outusing two types of elements, namely PLANE55 andSURF151. Figure 5 shows typical discretization of the steel cross section for thermal analysis. PLANE55was used as a plane element with two-dimensionalthermal conduction capability. The element has fournodes with a single degree of freedom, temperature,at each node. The element is applicable to a two-
dimensional, steady-state or transient thermal analy-sis. SURF151 element can generally be used forvarious load and surface effect applications. In thisstudy, SURF151 element was overlaid onto the faceof PLANE55 2D thermal solid element to simulatethe effect of thermal radiation from ambient air to
steel section.The cross-section of a steel beam was meshed with
4-noded PLANE55 element. Heat convection loadwas applied around the section by the use of SURF151 element, and the convection coefcient of a c = 25 W/(m 2 C) was assumed in the analysis[16]. Element SURF151, which acts as a thermalradiation element, was overlaid onto the surface of the cross-section where the section was heated. TheStefan–Boltzmann radiation constant of r = 5.67 9
10- 8 W/(m 2 K 4 ) was used in the analysis [ 16]. The
ambient (bulk) temperature surrounding the faces of SUR151 element was assumed to be equal to the retemperature.
7.1.3 Structural discretization
Figure 5 shows discretization of the reduced modelwith the boundary conditions and applied loading forstructural analysis. SHELL93 element, suitable foranalyzing slender to moderately thick beam-columnmembers, was used to model the beam. SHELL93element can account for non-uniform temperaturedistribution over either the length of the element and/ or the cross-section of the element.
Three axial linear springs are utilized for providingaxial and rotational restraints at the supports. Fig-ure 6 shows the arrangement of these three springs.The magnitude of axial or rotational restraint isachieved through varying the values of k s,1 and k s,2 .Axial restraint stiffness is computed as the sum of the stiffnesses of the three springs. The three axial
0
100
200
300
400
500
10 12.5 15 17.5 20
Strain, %
S t r e s s ,
M P a
T = 20°CT = 200°CT = 400°C
T = 500°C
T = 700°CT = 900°C
T = 600°C
0.0
0.2
0.4
0.6
0.8
1.0
0 2.5 5 7.5 0 200 400 600 800 1000Temperature, °C
T E
E
20° C
y
T y
F
F
20° C ,
,
u
T u
F
F
20° C ,
,
Fig. 4 High-temperaturemechanical properties of structural steel for niteelement analyses
Materials and Structures
8/12/2019 Creep- Mat and Struct-libre
http://slidepdf.com/reader/full/creep-mat-and-struct-libre 9/15
springs were utilized to provide rotational restraint atthe support. The rotational stiffness that results forthe combination of the three linear springs is shownin Fig. 6. Linear ‘‘ rigid ’’ constraints on the kinematicdegrees of freedom are imposed at the boundaries of the beam so as to resemble consistent rotation aroundthe support as shown in Fig. 6.
7.2 Model validation
The thermal and structural nite element models arevalidated using test data from Li and Guo [ 12]. Thetested beam was of cross section H250 9 250 9
8 9 12 and had a clear span length of 4500 mm. Thebeam was subjected to a random design re scenario asshown in Fig. 7, from three sides. To simulate the retest, a 3D shell-element model was constructed inANSYS. The model, shown in Fig. 5, was meshedusing 8-noded SHELL93 elements with approximate
average square size of 50 mm. The schematic in Fig. 5shows the application of the transverse load ‘‘ P ’’( P = 130 kN in the test). The axial and rotationalstiffnesses on the supports were estimated based on thetest measurements. The total axial stiffness 2k axial wasestimated as 39 kN/mm, and the total rotationalstiffness k rotatioanl was calculated as 78 Kn m/milirad.
The results of the validation are plotted in Figs. 7and 8. Figure 7 shows comparison of steel temper-
atures as predicted by the ANSYS thermal modelwith those measured in the test. The re temperature,the beam is exposed to, is also plotted in the gure. Itcan be seen that the top ange experienced slow risein temperature, while the web and bottom angeexperienced faster increase in temperature. This isdue to the heavy insulation that was applied to the topange of the beam. As the re entered the decayphase (at 19 min), the top ange continued to heat up(due to time lag effect) while the temperature in rest
L/3 L/3 L/3
P Pk sk s
SHELL93
element
Discretized beam
K2D mesh using PLANE55 element
1D mesh using SURF151 element
4
1
2
3
I
J
KL1
IJ
x
y SURF151 1D-thermal
Surface-effect element
PLANE55 2D-thermal solid element
TThheerrmmaall mmooddeellSSttrruuccttuurraall mmooddeell
Fig. 5 Schematic of structural model used in the parametric study
k s,1
k s,2
k s,1
Rigid plane
Roller
d
F=k s×x
F=k s×x
2,1 ,1tan(1 ) 0.78
1 1 2 Rad
rotational s s Rad
M F d d k k d k d
θ
×= = = × × =
=
,1 ,2 ,1axial s s sk k k k = + +
M
Fig. 6 Modeling axial androtational restraint at theends of the shell-elementdiscretized model of a beam
Materials and Structures

8/12/2019 Creep- Mat and Struct-libre
http://slidepdf.com/reader/full/creep-mat-and-struct-libre 10/15
of the section started to decrease. It can be seen in the
gure that the temperature at various points predictedfrom the analysis compare well with measured datafrom test.
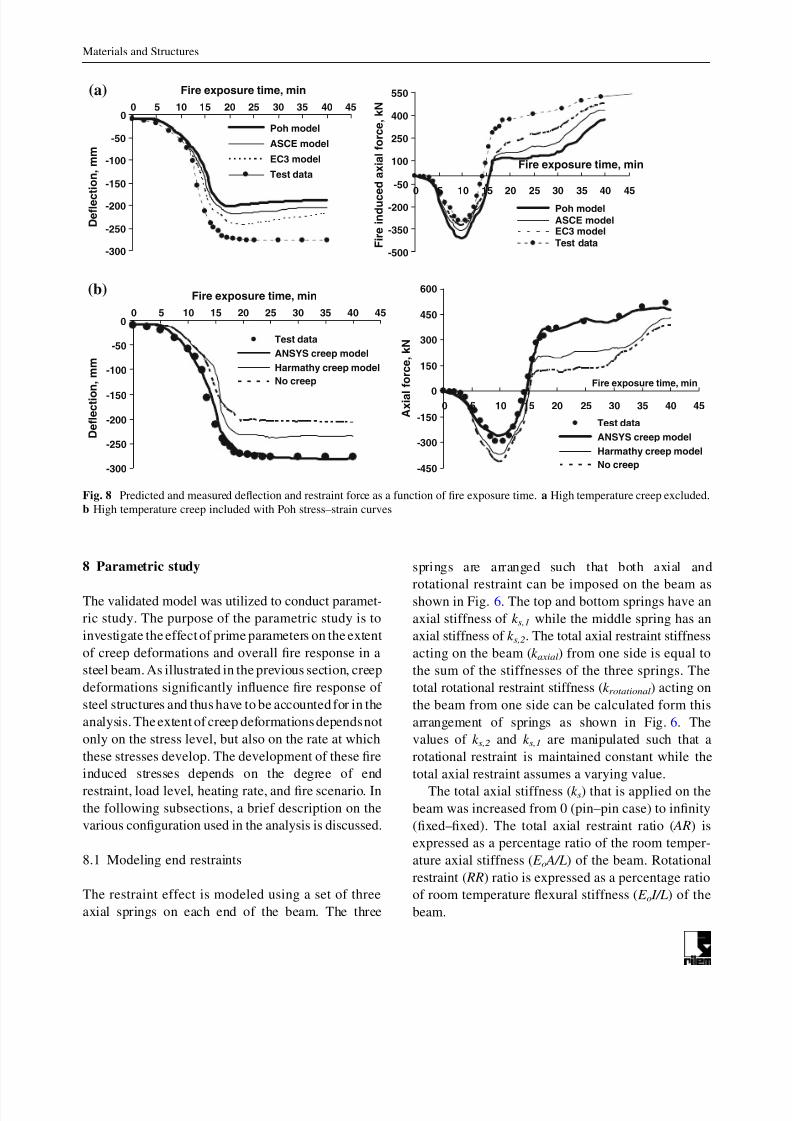
To illustrate the signicance of high-temperaturecreep and stress–strain constitutive models of steel, theanalysis was carried out for two cases, one includingcreep and the other without accounting for creep. Forthe case without creep, the analysis was carried outusing three temperature–stress–strain models, namely;Poh [ 15], ASCE [ 14], and Eurocode [ 13]. Figure 8shows comparison of measured and predicted mid-
span deection and the axial restraint force in the steelbeam. Predicted deection and restraint force arecompared to the measured values from re test inFig. 8a where all three models do not account for thecreep deformations. While Poh and ASCE constitutivemodels explicitly state that creep is excluded fromtheir stress–strain relationships, Eurocode states ‘‘ theeffects of transient thermal creep need not be givenexplicit consideration ’’ (Clause 4.3.3(4) of Eurocode 3[13]). This suggests some consideration to creep hasbeen given in the Eurocode stress–strain constitutive
model. This explains the better predictions obtainedwhen Eurocode model is used, as compared topredictions obtained using other models. However, itis evident from Fig. 8a that the predicted deectionand restraint force do not compare well with measuredvalues form test, especially toward later stages of reexposure. This can be mainly attributed to the fact thatthe stress–strain constitutive models do not properlyaccount for the transient effect of high-temperaturecreep.
In Fig. 8b, Poh stress–strain constitutive model
[15] is used in the analysis with the incorporation of ANSYS high-temperature creep. Two creep modelswere incorporated, namely ANSYS creep model andDorn–Harmathy modied creep model. Harmathycreep model is incorporated in ANSYS as a user-dened subroutine, an option that is readily availablein ANSYS program. It can be seen in Fig. 8b thatcreep has signicant inuence on the resultingdeections and the restraint forces in the beams.As can be seen in Fig. 8b, neglecting high temper-ature creep effect leads to much lower deections,
especially towards the later stages of re exposure.When Harmathy’s creep model is used, the compar-ison is slightly better, as shown in Fig. 8b. However,when ANSYS creep model is included in theanalysis, the resulting deection and restraint forcematch well with measured test data. This is becauseANSYS creep model takes into consideration thehigh stress rate d r s=dt ð Þaverageffi
3:5 MPa/min resulting in the beam from re induced restrainteffect. However, the predictions using Harmathy’screep model did not match with test data and this can
be attributed to the fact that the model is based oninvariant stress state. Overall, predictions from themodel compare well with test data when high-temperature creep is included in the analysis. Whenthe creep effect is not included, the predicted defor-mations and restraint forces are under-estimated in thelater stage of re exposure. Therefore, neglectinghigh-temperature creep in the analysis may not lead torealistic predictions of both deection and re inducedrestraint force.
Furnace (fire)temp.
Temp. inbottom flange
Temp. in web
Temp. in topflange
Decay phase
0
100
200
300
400
500
600
700
800
900
0 4 8 12 20 28 3616 24 32 40Time, min
T e m p e r a
t u r e ,
° C
Test data
Model predictions
Fig. 7 Predicted andmeasured temperatures inthe steel beam
Materials and Structures
8/12/2019 Creep- Mat and Struct-libre
http://slidepdf.com/reader/full/creep-mat-and-struct-libre 11/15
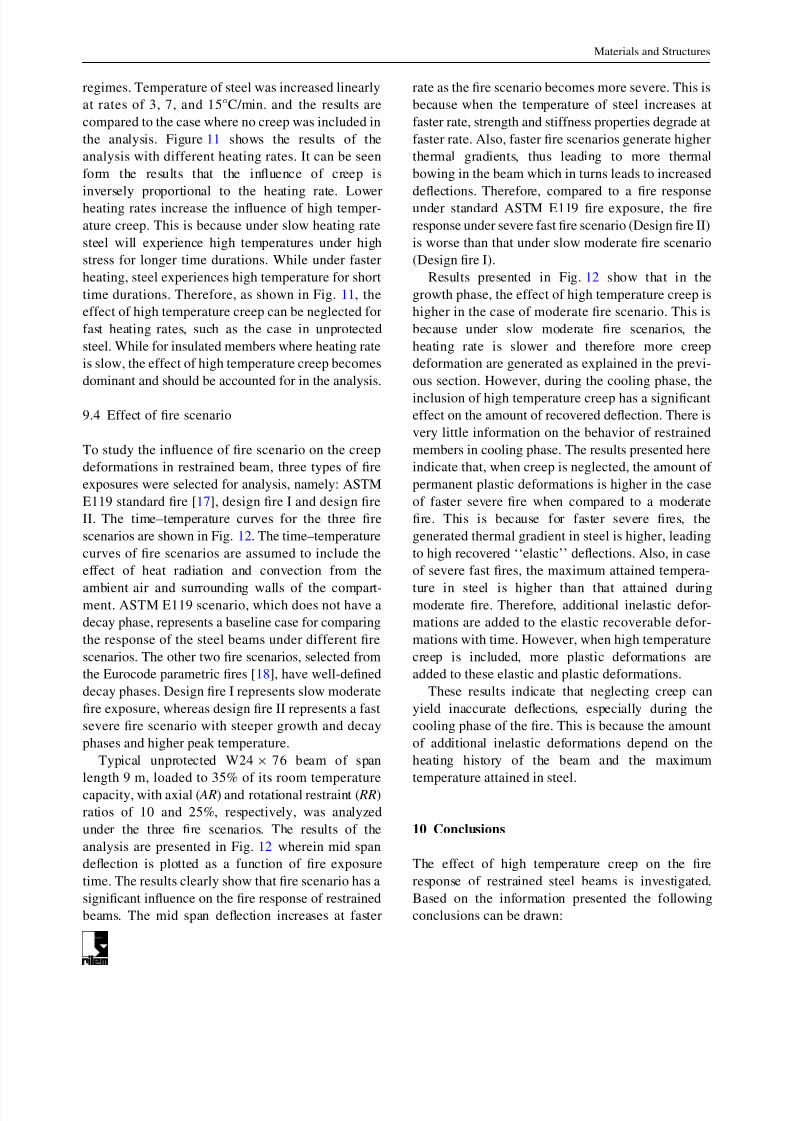
8 Parametric study
The validated model was utilized to conduct paramet-ric study. The purpose of the parametric study is toinvestigate the effect of prime parameters on the extentof creep deformations and overall re response in asteel beam. As illustrated in the previous section, creepdeformations signicantly inuence re response of steel structures and thus have to be accounted for in theanalysis. The extent of creep deformations dependsnotonly on the stress level, but also on the rate at which
these stresses develop. The development of these reinduced stresses depends on the degree of endrestraint, load level, heating rate, and re scenario. Inthe following subsections, a brief description on thevarious conguration used in the analysis is discussed.
8.1 Modeling end restraints
The restraint effect is modeled using a set of threeaxial springs on each end of the beam. The three
springs are arranged such that both axial androtational restraint can be imposed on the beam asshown in Fig. 6. The top and bottom springs have anaxial stiffness of k s,1 while the middle spring has anaxial stiffness of k s,2 . The total axial restraint stiffnessacting on the beam ( k axial ) from one side is equal tothe sum of the stiffnesses of the three springs. Thetotal rotational restraint stiffness ( k rotational ) acting onthe beam from one side can be calculated form thisarrangement of springs as shown in Fig. 6. Thevalues of k s,2 and k s,1 are manipulated such that a
rotational restraint is maintained constant while thetotal axial restraint assumes a varying value.
The total axial stiffness ( k s) that is applied on thebeam was increased from 0 (pin–pin case) to innity(xed–xed). The total axial restraint ratio ( AR) isexpressed as a percentage ratio of the room temper-ature axial stiffness ( E o A/L ) of the beam. Rotationalrestraint ( RR) ratio is expressed as a percentage ratioof room temperature exural stiffness ( E o I/L ) of thebeam.
-300
-250
-200-150
-100
-50
010 15 20 25 30 35 40 45
Fire exposure time, min
D e
f l e c t i o n ,
m m
Poh model
ASCE model
EC3 model
Test data
-500
-350
-200-50
100
250
400
550
10 15 20 25 30 35 40 45
Fire exposure time, min
F i r e i n d u c e
d a x
i a l f o r c e ,
k N
Poh modelASCE modelEC3 modelTest data
(a)
-300
-250
-200
-150
-100
-50
010 15 20 25 30 35 40 45
Fire exposure time, min
D e
f l e c
t i o n , m m
Test dataANSYS creep modelHarmathy creep model No creep
-450
-300
-150
0
150
300
450
600
0 5
0 5
0 5
0 5 10 15 20 25 30 35 40 45
Fire exposure time, min
A x
i a l f o r c e ,
k N
Test dataANSYS creep modelHarmathy creep modelNo creep
(b)
Fig. 8 Predicted and measured deection and restraint force as a function of re exposure time. a High temperature creep excluded.b High temperature creep included with Poh stress–strain curves
Materials and Structures

8/12/2019 Creep- Mat and Struct-libre
http://slidepdf.com/reader/full/creep-mat-and-struct-libre 12/15
8.2 Failure criteria
Since the purpose of this study is to investigate theextent of creep deformation in a restrained steelbeam, it was necessary to continue the analysisbeyond conventional failure criteria that are mostly
based on attaining a critical temperature in steel.Therefore, the failure of the beam is said to occurwhen an overall instability occurs as a result of reexposure and structure loading.
9 Results and discussion
The beam, of cross section W24 9 76 and length9 m, was loaded by the applying two point loads P asshown in Fig. 5. Nonlinear nite element analysis is
carried to obtain the room temperature response.Then, heating rate (or re scenario) is applied on thebeam and re resistance analysis was carried out toobtain re response. The re resistance analysis wasperformed as follows: steel temperature at every nodelocation of the discretized mesh is obtained for everytime step through thermal analysis. Then thesetemperatures were applied on the correspondingnodes of the shell elements at one cross section of the meshed beam, and then these nodal loads werereplicated along the entire length of the beam. Andnally, nonlinear nite element analysis is carried outto obtain the total structural response of the beamunder re exposure.
Results from the parametric studies are shown onFigs. 9, 10, 11 through 12, and are discussed below.
9.1 Effect of restraint
Figure 9 shows the effect of increasing axial restraintratio ‘‘ AR’’ on the re response of steel beams, which
2000
1700
1400
1100
800
500
200
50 100 125 150
Time, min.
M i d s p a n
d e f l e c t i o n , m m
AR=0%AR=10%AR=60%AR=AR=0%AR=10%AR=60%AR=
H.T. creep notincluded
H.T. creepincluded
L=9m, W24X76 AR: Axial Restraint Ratio AR = Spring Stiff./(EA/L)
-10
0
10
20
30
40
5075
0 25 750 25 50 100 125 150
Time, min.
- P: Fire-induced axial force- Py: Room-temp. yield cap.
- LR=35% Room Temp.Cap.- Heating rate = 7˚C/min.- Rotationa l Restr. = 25% EI/L Fy = 355 MPa
Fig. 9 Effect of high temperature creep on re response of steel beams subjected to different axial restraints
2000
1700
1400
1100
800
500
200
0 25 50 75 100 125
Time, min.
D e f l e c t i o n ,
m m
LR=35%LR=55%LR=75%LR=35%LR=55%LR=75%
H.T. creep notincluded
H.T. creepincluded
L= 9m, W24X76 RR = 25% EI/L AR = 10% EA/L Heating rate = 5° C/min.
Fig. 10 Effect of high temperature creep on re response of steel beams subjected to different load ratios
-2100
-1800
-1500
-1200
-900
-600
-300
00 150 300 450 600 750 900
Temperatue, °C
M i d - s p a n
d e f l e c t i o n , m m
No H.T. Creep
HR = 15° C/min.
HR = 7° C/min.HR = 3° C/min.
- L= 9m, W24X76- RR= 25% EI/L- AR= 10% EA/L- LR = 35%
H.T. creepincluded
Fig. 11 Effect of high temperature creep on re response of steel beams subjected to different heating rates
Materials and Structures
8/12/2019 Creep- Mat and Struct-libre
http://slidepdf.com/reader/full/creep-mat-and-struct-libre 13/15
was generated by increasing ‘‘ AR’’ from 0 to innity.
Since axial restraint can not realistically exist withoutrotational restraint, a minimum rotational restraintratio ‘‘ RR’’ of 0.25 E 0 I/L is applied through the threesprings’ arrangement. The results of deections andre induced axial forces for three degrees of axialrestraint are shown in Fig. 9.
Results shown in Fig. 9 indicate that the mid spandeection of restrained beam increases with time asthe temperature increases and steel propertiesdegrade. The expansion of the beam generatescompressive axial force due to the restraint. As the
deection increases and steel properties degrade, thegenerated compressive force in the beam reduces andthen switches to a tensile force due to the effect of restraint. The beam continues to deect at a reducedrate due to the presence of the tensile force until‘‘theoretically’’ failure occurs by rupture of steel.Figure 9 shows that the time to complete failure isincreased by increase in axial restraint stiffness. Also,Fig. 9 shows that the generated axial force increasesby increasing axial restraint stiffness. Figure 9 showsthat the inuence of creep is higher as the axial
restraint stiffness is increased. This is because thebeam with high axial restraint generally developshigher stresses due to the presence of restraintinduced forces.
9.2 Effect of load ratio
Load ratio ‘‘ LR’’ represents the ratio between applied(service) load to the (ultimate) load causing failure atroom temperature. Generally, load ratio is an
indication of the level of stress in the beam at room
temperature. Figure 10 shows the result of analysison typically restrained beam under load ratios ‘‘ LR’’of 35, 55 and 75%, with and without inclusion of creep. The midspan deection of the beam is plottedas a function of re exposure time. It can be seenfrom Fig. 10 that re response of a restrained beamdeteriorates faster under increasing load ratios. Thisis because the higher the load ratio, the higher theinitial stress level in the beam. Therefore, as steelstrength and stiffness degrade with temperature, therestrained beam with higher load ratio attains failure
more quickly.The high temperature creep has an inuence on the
deection prole of restrained beam as can be seen inFig. 10. It is clearly evident that the effect of creep isgreater for beams with higher load ratios. This isbecause higher load ratios produce higher stresses inthe beams which in turns results in higher creepdeformations in the beams.
9.3 Effect of heating rate
The rate of temperature rise in steel beams exposed tore is dependent on insulation characteristics, sectionproperties, and type of re exposure. The temperaturein an unprotected steel beam exposed directly to regenerally increases at a fast rate (20–50 C/min.).However, in the case of protected steel beams withtypical 2 h re rated insulation, the temperature riseis in the order of 3–7 C/min. To investigate the effectof heating rate on steel beams, a typical restrainedbeam was analyzed under different heating rate
0
200
400
600
800
1000
120 140
Time, min
T e m p e r a t u r e ,
° C ASTM E119 Fire Design Fire I Design Fire II
-1300
-1000
-700
-400
-100
100
40 80 120
0 20 40 60 80
0 20 60 100 140
Time, min.
M i d - s p a n d e f l e c t i o n , m m
Design Fire I
Design Fire II
ASTM E119 Fire
H.T. Creep included
H.T. Creep not included
Fig. 12 Effect of high temperature creep on re response of steel beams subjected to different re scenarios
Materials and Structures
8/12/2019 Creep- Mat and Struct-libre
http://slidepdf.com/reader/full/creep-mat-and-struct-libre 14/15
regimes. Temperature of steel was increased linearlyat rates of 3, 7, and 15 C/min. and the results arecompared to the case where no creep was included inthe analysis. Figure 11 shows the results of theanalysis with different heating rates. It can be seenform the results that the inuence of creep is
inversely proportional to the heating rate. Lowerheating rates increase the inuence of high temper-ature creep. This is because under slow heating ratesteel will experience high temperatures under highstress for longer time durations. While under fasterheating, steel experiences high temperature for shorttime durations. Therefore, as shown in Fig. 11, theeffect of high temperature creep can be neglected forfast heating rates, such as the case in unprotectedsteel. While for insulated members where heating rateis slow, the effect of high temperature creep becomesdominant and should be accounted for in the analysis.
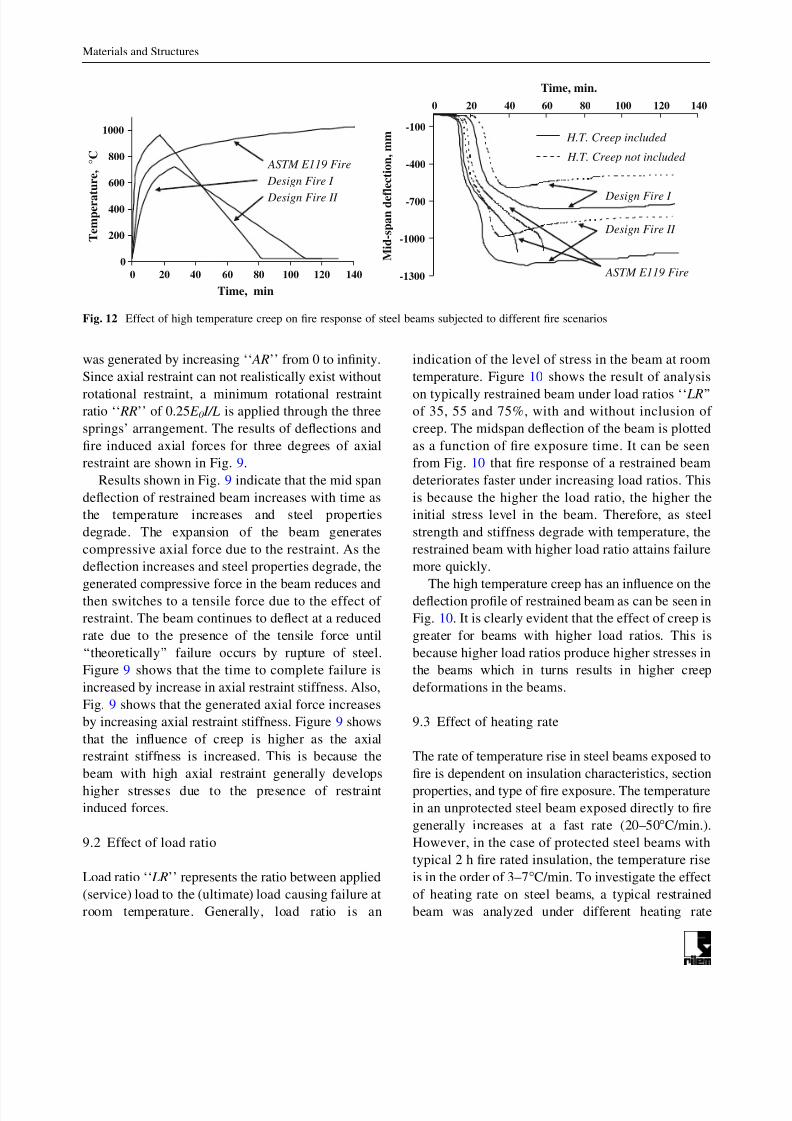
9.4 Effect of re scenario
To study the inuence of re scenario on the creepdeformations in restrained beam, three types of reexposures were selected for analysis, namely: ASTME119 standard re [ 17], design re I and design reII. The time–temperature curves for the three rescenarios are shown in Fig. 12. The time–temperaturecurves of re scenarios are assumed to include theeffect of heat radiation and convection from theambient air and surrounding walls of the compart-ment. ASTM E119 scenario, which does not have adecay phase, represents a baseline case for comparingthe response of the steel beams under different rescenarios. The other two re scenarios, selected fromthe Eurocode parametric res [ 18], have well-deneddecay phases. Design re I represents slow moderatere exposure, whereas design re II represents a fastsevere re scenario with steeper growth and decayphases and higher peak temperature.
Typical unprotected W24 9 76 beam of spanlength 9 m, loaded to 35% of its room temperaturecapacity, with axial ( AR) and rotational restraint ( RR)ratios of 10 and 25%, respectively, was analyzedunder the three re scenarios. The results of theanalysis are presented in Fig. 12 wherein mid spandeection is plotted as a function of re exposuretime. The results clearly show that re scenario has asignicant inuence on the re response of restrainedbeams. The mid span deection increases at faster
rate as the re scenario becomes more severe. This isbecause when the temperature of steel increases atfaster rate, strength and stiffness properties degrade atfaster rate. Also, faster re scenarios generate higherthermal gradients, thus leading to more thermalbowing in the beam which in turns leads to increased
deections. Therefore, compared to a re responseunder standard ASTM E119 re exposure, the reresponse under severe fast re scenario (Design re II)is worse than that under slow moderate re scenario(Design re I).
Results presented in Fig. 12 show that in thegrowth phase, the effect of high temperature creep ishigher in the case of moderate re scenario. This isbecause under slow moderate re scenarios, theheating rate is slower and therefore more creepdeformation are generated as explained in the previ-ous section. However, during the cooling phase, theinclusion of high temperature creep has a signicanteffect on the amount of recovered deection. There isvery little information on the behavior of restrainedmembers in cooling phase. The results presented hereindicate that, when creep is neglected, the amount of permanent plastic deformations is higher in the caseof faster severe re when compared to a moderatere. This is because for faster severe res, thegenerated thermal gradient in steel is higher, leadingto high recovered ‘‘elastic’’ deections. Also, in caseof severe fast res, the maximum attained tempera-ture in steel is higher than that attained duringmoderate re. Therefore, additional inelastic defor-mations are added to the elastic recoverable defor-mations with time. However, when high temperaturecreep is included, more plastic deformations areadded to these elastic and plastic deformations.
These results indicate that neglecting creep canyield inaccurate deections, especially during thecooling phase of the re. This is because the amountof additional inelastic deformations depend on theheating history of the beam and the maximumtemperature attained in steel.
10 Conclusions
The effect of high temperature creep on the reresponse of restrained steel beams is investigated.Based on the information presented the followingconclusions can be drawn:
Materials and Structures

8/12/2019 Creep- Mat and Struct-libre
http://slidepdf.com/reader/full/creep-mat-and-struct-libre 15/15
• Neglecting high temperature creep leads to stiff-ened structural re response, with smaller deec-tions but larger re induced restraint forces.Therefore, neglecting high temperature creep inre resistance analysis might lead to unconserva-tive re resistance predictions in restrained beams.
• Temperature-dependent creep models based onDorn’s creep formulation do not fully account fornon-trivial stress-time variation (i.e., when d r s / dt = 0). Therefore, current creep models shouldbe used with care in case of slow heating rate withvariable stress history as encountered in insulatedrestrained beams under prolonged re exposure.
• In the case of fast heating rates, as encountered inunprotected steel beams, high temperature creepcan be neglected under standard re exposure.
• In the case of realistic (design) re exposures with
decay phase, high temperature creep needs to beincorporated in the re resistance analysis sincecreep inuences response under cooling phase.Generally, creep effect is higher under slowmoderate re exposures.
• Increasing axial restraint enhances the reresponse of beams; however, the extent of creepdeformations is increased with increasing axialrestraint stiffness.
Acknowledgments The research presented in this paper issupported by the National Science Foundation (Grant No.0652292) and Department of Commerce/National Institute of Standards and Technology (Grant No. 60NANB7D6120). Anyopinions, ndings, and conclusions or recommendationsexpressed in this paper are those of the authors and do notnecessarily reect the views of the sponsors.
References
1. Harmathy T (1967) A comprehensive creep model. J BasicEng 89(D-3):496–502
2. Williams-Leir G (1983) Creep of structural steel in re:analytical expressions. Fire and Materials 7(2):73–80
3. Anderberg Y (1988) Modelling steel behaviour. Fire SafetyJ 13(1):17–26
4. Dorn JE (1954) Some fundamental experiments on hightemperature creep. J Mech Phys Solids 3:85
5. Huang ZF, Tan KH (2003) Analytical re resistance of axially restrained steel columns. J Struct Eng 129(11):1531–1537
6. Shames IH, Cozzarelli FA (1992) Elastic and inelasticstress analysis. Prentice Hall, Englewood Cliffs, NJ,pp 221–228
7. Tan KH, Ting SK, Huang ZF (2002) Visco-elasto-plasticanalysis of steel frames in re. J Struct Eng 128(1):105–114
8. Zienkiewicz OC, Cormeau IC (1974) Visco-plasticity—plasticity and creep in elastic solids—a unied numericalsolution approach. Int J Numer Method Eng 8:821–845
9. KK N (1989) Fire-resistant steel for building structural use.Nippon Steel Corporation, Tokyo
10. Kirby BR, Preston RR (1988) High temperature propertiesof hot-rolled, structural steels for use in re engineering
design studies. Fire Safety J 13:27–3711. Harmathy T, Stanzak W (1970) Elevated-temperature
tensile and creep properties of some structural and pre-stressing steels. American Society for Testing and Mate-rial, special publication 186–208
12. Li G-Q, Guo S-X (2007) Experiment on restrained steelbeams subjected to heating and cooling. J Construct SteelRes (in press)
13. EN1993-1-2 (2005) The European standard; Part 1–2:general rules—structural re design. European Committeefor Standardization, Brussels
14. ASCE (1992) Structural re protection. Manual no. 78,American Society of Civil Engineers, Structural Division,ASCE committee on re protection, New York
15. Poh KW (2001) Stress-strain-temperature relationship forstructural steel. J Mater Civil Eng 13(5):371–379
16. Ding J, Li G-Q, Sakumoto Y (2004) Parametric studies onre resistance of re-resistant steel members. J ConstructSteel Res 60:1007–1027
17. ASTM (2001) Standard methods of re test of buildingconstruction and materials: test method E119-01. Ameri-can Society for Testing and Materials, West Conshohoc-ken, PA
18. EN1991-1-5 (2003) The European standard; Part 1–5:general actions—thermal actions. European Committee forStandardization, Brussels
Materials and Structures