Creep and Shrinkage of Concrete Based on Major Variables ... · CREEP AND SHRINKAGE OF CONCRETE...
52
TECHNICAL REPORT STANDARD TITLE PAGE 1. Report No. 2. Government Accession No. 3. Recipient's Catalog No. .. -,:R:-e-po_r_t ;::Da_t_e---------------··· CREEP AND-SHRINKAGE OF CONCRETE BASED ON MAJOR VARIABLES ENCOUNTERED IN THE STATE OF TEXAS 1-:-· August , J 9 7 3 ------- 6. Perfonnirig Organization Code " -·-- ·····• --- ------------------- ------ - -- --· --··· ----------·-- Leonard L. Ingram and Howard L. Furr ?. P .. rforn11nu OrgoniJot1on NomfJ ond_ Texas Transportation Institute Texas A & M University College Station, Texas 77843 8. P,rlorm111g Organization Report No. Research Report 170-lF ·-- ·-- --- r-ro·. Work Unit No. 11. Contract or Gront No. Research Studv No. 2-5-72-170 13. Type of Report and Period Co-vered . ------ ----- ...... --------------------1 12. Sponsoring Agency Nome and Addres. Texas Highway Department 11th & Brazos A us tin, Texas 78701 Final - September 1971 August 1973 14. Sponsoring Agency Code 15. Supplementary Notes Research performed in cooperation with DOT, FHWA. Research Study Encountered in Title: "Creep and Shrinkage of Concrete Based on Major Variables the State of Texas. ir 16. Ab•troct The effects of creep and shrinkage strains in concrete are dependent on variables such as materials, stress level, and environment. In this investigation, creep and shrinkage strains as functions of time were determined for four different concretes from four different geographical areas of Texas (Dallas, San Antonio, Odessa, Lufkin). These four locations were chosen to represent four major areas of Texas for climate and aggregate for producing concrete. The concretes were made of materials commonly used in the respective areas. They were made, cured, and stored in those areas. Standard 6 x 12 in. cylinders were used to determine strength and the stress-strain relationship, and prisms, 3 x 3 x 16 in., were used to detetmine creep and shrinkage strains. Duplicate sets of specimens were made at each place of fabrication. Each set contained 4 non-loaded prisms for shrinkage strains, 4 loaded prisms for compressive creep strains, and 18 cylinders. One set of specimens were stored in a protected area near the place of fabrication and the other set was stored at laboratory conditions, 73°F and 50 percent relative humidity. The specimens were cured alongside pretensioned prestressed bridge beams cast at the same time as the test specimens. The curing time in the molds ranged from approximately 20 hours to 42 hours. (continued on back side) 17. Key Words 18. Distribution Statement concrete, shrinkage, creep, compressive stress, modulus of elastic- ity, concrete strength. 19. Security Classif. (of this report) 20. Security Clossif. (of this page) 21. No. of Pages 22. Price Unclassified Unclassified 49 Form DOT F 1700.7 IB·69l
Transcript of Creep and Shrinkage of Concrete Based on Major Variables ... · CREEP AND SHRINKAGE OF CONCRETE...

TECHNICAL REPORT STANDARD TITLE PAGE
1. Report No. 2. Government Accession No. 3. Recipient's Catalog No.
~-r;;;--.. -a~d-S~-ht-it-lo-----------''------------------+-::-5-. -,:R:-e-po_r_t ;::Da_t_e---------------···
CREEP AND-SHRINKAGE OF CONCRETE BASED ON MAJOR VARIABLES ENCOUNTERED IN THE STATE OF TEXAS
1-:-· August , J 9 7 3 -------6. Perfonnirig Organization Code
" -·-- ·····• --- ------------------- ------ - -- --· --··· ----------·--Leonard L. Ingram and Howard L. Furr
?. P .. rforn11nu OrgoniJot1on NomfJ ond_ Addr~-;.";
Texas Transportation Institute Texas A & M University College Station, Texas 77843
8. P,rlorm111g Organization Report No.
Research Report 170-lF ·-- ·-- --- r-ro·. Work Unit No.
11. Contract or Gront No.
Research Studv No. 2-5-72-170 13. Type of Report and Period Co-vered . ------ -~-------~--~---- -----......--------------------1
12. Sponsoring Agency Nome and Addres.
Texas Highway Department 11th & Brazos A us tin, Texas 78701
Final - September 1971 August 1973
14. Sponsoring Agency Code
--~----·----·----------------------'--------------------1 15. Supplementary Notes
Research performed in cooperation with DOT, FHWA. Research Study Encountered in
Title: "Creep and Shrinkage of Concrete Based on Major Variables the State of Texas. ir
16. Ab•troct
The effects of creep and shrinkage strains in concrete are dependent on variables such as materials, stress level, and environment. In this investigation, creep and shrinkage strains as functions of time were determined for four different concretes from four different geographical areas of Texas (Dallas, San Antonio, Odessa, Lufkin). These four locations were chosen to represent four major areas of Texas for climate and aggregate for producing concrete. The concretes were made of materials commonly used in the respective areas. They were made, cured, and stored in those areas.
Standard 6 x 12 in. cylinders were used to determine strength and the stress-strain relationship, and prisms, 3 x 3 x 16 in., were used to detetmine creep and shrinkage strains. Duplicate sets of specimens were made at each place of fabrication. Each set contained 4 non-loaded prisms for shrinkage strains, 4 loaded prisms for compressive creep strains, and 18 cylinders. One set of specimens were stored in a protected area near the place of fabrication and the other set was stored at laboratory conditions, 73°F and 50 percent relative humidity.
The specimens were cured alongside pretensioned prestressed bridge beams cast at the same time as the test specimens. The curing time in the molds ranged from approximately 20 hours to 42 hours. (continued on back side)
17. Key Words 18. Distribution Statement concrete, shrinkage, creep,
compressive stress, modulus of elastic-ity, concrete strength.
19. Security Classif. (of this report) 20. Security Clossif. (of this page) 21. No. of Pages 22. Price
Unclassified Unclassified 49
Form DOT F 1700.7 IB·69l
Hyperbolic functions of unit creep with time were developed for the concrete tested from each of the four geographical area. Those functions are suitable for design purposes for computing prestress loss and camber in pretensioned prestressed concrete beams.

CREEP AND SHRINKAGE OF CONCRETE BASED ON MAJOR VARIABLES ENCOUNTERED
IN THE STATE OF TEXAS
by
Leonard L. Ingram, P.E. Former Assistant Research Engineer
and Howard L. Furr, P.E.
Research Engineer
Research Report 170-lF
Creep and Shrinkage of Concrete Based on Major Variables Encountered in the State of Texas
Research Study Number 2-5-72-170
Sponsored by the Texas Highway Department in cooperation with the
U. S. Department of Transportation Federal .Highway Administration
August, 1973
TEXAS TRANSPORTATION INSTITUTE Texas A&M University
College Station, Texas
Technical Reports Canter Texas Transportation Institute
-----~-------------~--~----~-~----------------. --- ·-------~-----
DISCLAIMER
The contents of this report reflect the views of the authors
who are responsible for the facts and the accuracy of the data presented
herein. The contents do not necessarily reflect the official views or
policies of the Federal Highway Administration. This report does not
constitute a standard, specification, or regulation.
ii

ACKNOWLEDGEMENTS
The assistance and cooperation of a number of persons of the Texas
Highway Department and commercial concrete fabricators were most helpful
in the development of information contained in this report. Mr. H. D.
Butler, THD D-5, was particularly helpful in planning the tests and in
providing contact with other THD personnel. Personnel of Texas Highway
Districts 6, 11, 15, and 18 provided help in fabrication of specimens
and in making space available for storage of specimens. The concrete
fabricators, Spann, Inc. (Dallas, Texas), Featherlite Structural Concrete
(Odessa, Texas), McDonough Brothers, Inc. (San Antonio, Texas), and Lufkin
Concrete Company (Lufkin, Texas) were helpful in preparing and curing test
specimens. The help of each of these is acknowledged with thanks.
Much of the information developed in this research project was used
by the primary author in his thesis for the Master of Science Degree in
Civil Engineering at Texas A&M University. The thesis, "Creep and
Shrinkage of Concrete Typical of Four Geographical Areas of Texas,n by
Leonard tee Ingram, August 1973 is on file in the library of that University.
That author extends his slncere thanks to the Texas Highway Department,
Federal Highway Administration, and Texas Transportation Institute for
permission to publish the material in his thesis.
iii
-~--- --- ------ --------- -----~----~ -----
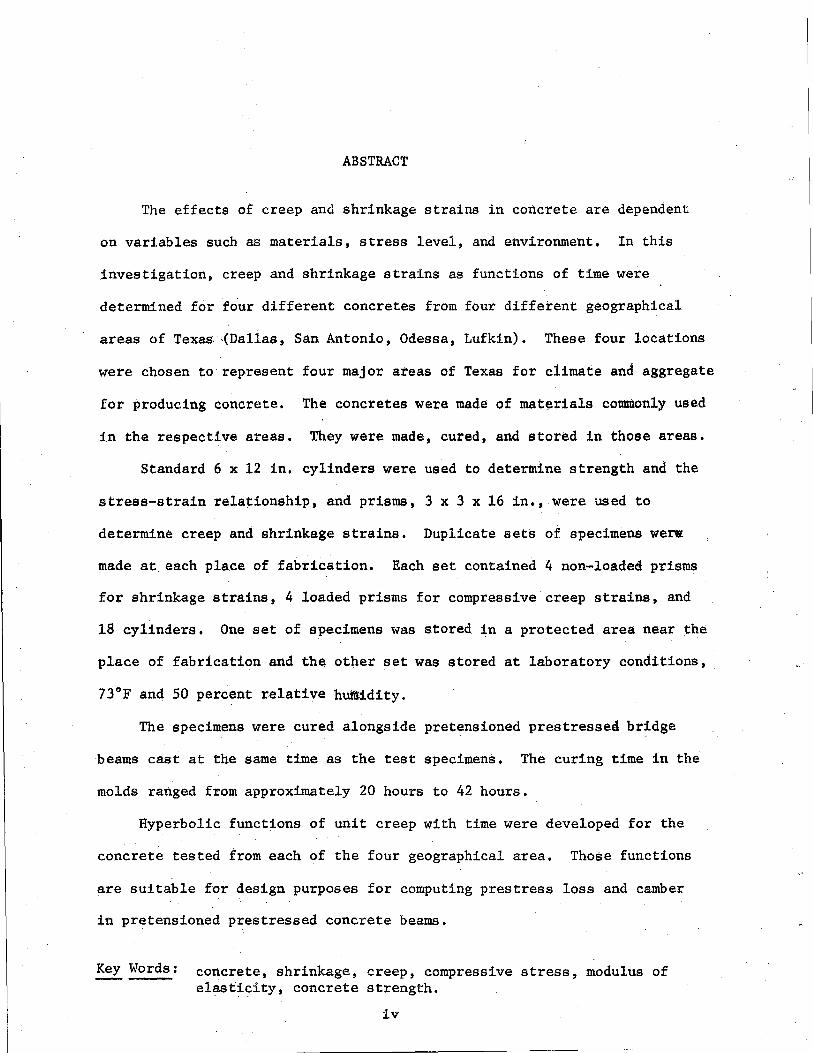
ABSTRACT
The effects of creep and shrinkage strains in concrete are dependent
on variables such as materials, stress level, and environment. In this
investigation, creep and shrinkage strains as functions of time were
determined for four different concretes from four different geographical
areas of Texas .. (Dallas, San Antonio, Odessa, Lufkin). These four locations
were chosen to represent four major areas of Texas for climate and aggregate
for producing concrete. The concretes were made of mat~rials commonly used
in the respective areas. They were made, cured, and stored in those areas.
Standard 6 x 12 in. cylinders were used to determine strength and the
stress-strain relationship, and prisms, 3 x 3 x 16 in., were used to
determine creep and shrinkage strains. Duplicate sets of specimens were
made at. each place of fabrication. Each set contained 4 non-loaded prisms
for shrinkage strains, 4 loaded prisms for compressive creep strains, and
18 cylinders. One set of specimens was stored in a protected area near the
place of fabrication and the other set was stored at laboratory conditions,
73°F and 50 percent relative humidity.
The specimens were cured alongside pretensioned prestressed bridge
beams cast at the same time as the test specimens. The curing time in the
molds ranged from approximately 20 hours to 42 hours.
Hyperbolic functions of unit creep with time were developed for the
concrete tested from each of the four geographical area. Those functions
are suitable for design purposes for computing prestress loss and camber
in pretensioned prestressed concrete beams.
Key Words: concrete, shrinkage, creep, compressive stress, modulus of elasticity, concrete strength.
iv

SUMMARY
Shrinkage and creep of prestressed concrete are major factors in
camber and loss of prestress in prestressed bridge beams. The concrete,
conditions of curing, and climatic conditions to which the member is ex
posed in service influence creep and shrinkage. The State of Texas has
areas that differ in climate, and aggregates for concrete differ through
the state,
In this research studies were made of concretes in four different
geographical areas of the state to determine the creep and shrinkage of
a highway bridge concrete assumed to be typical of the area in which it
was made. T:ests were made on concretes sheltered, but otherwise exposed,
in the four areas, and on companion specimens stored under constant
temperature and relative humidity.
Specimens were 3 in, square in section by 16 in. long. The concretes
were made and stored at, or near, Dallas, Odessa, San Antonio, and Lufkin,
Texas. Strain data were collected from non-loaded specimens and from
specimens under sustained stresses of 1000 psi and 2000 psi over a period
of almost two years.
It was found that shrinkage of laboratory stored specimens was greater
than that of field stores specimens. Field shrinkages at 500 day age were
300, 510, 360; and 280 microinches per inch respectively for Dallas, Odessa,
San Antonio, and Lufkin concretes stored in the field. Corresponding
values for laboratory storage were 480, 620, 480, and 430. Creep from
field stored specimens was generally a little greater than that of laboratory
stored specimens.
v
·~--- -------------·---·----·-

Unit creep curves and unit creep functions were produced for the
four materials. The hyperbolic functions of unit creep and of shrinkage
with respect to time are particularly useful to a designer in computing
prestress loss and camber at any time in the life of a bridge beam.
A prestressed concrete beam, THD Type B, was used as a subject
for comparing camber predictions based on creep and shrinkage functions
developed in an earlier study with those developed in this study (1).
The earlier study was made in Houston, Texas on concrete produced, cured,
and stored in that city. It was found that the camber based on the creep
and shrinkage functions of the Houston tests was approximately one-half as
much as that found by using some of the functions of the present study.
vi

IMPLEMENTATION
Prestress loss and camber of prestressed beams may be computed from
the information developed in the study. The materials should be the
same as those reported and the environment of curing, storage, and service
should be the same as that of the tests. The creep and shrinkage properties
reported here will have to be modified if conditions or materials other than
those of the tests· are used.
In computing prestress loss and camber of prestressed beams the com
puter program developed in Ref. 1. may be used. The modulus of elasticity
and the functions for creep and shrinkage of the particular material and
area of service should be taken from Tables 3 and 6 of this report. The
·computer program referred to will require input data on· the beam and slab,
initial stresses, and materials. It gives information on camber, stresses
and prestress loss at any age specified.
If the comptuer is not used, the creep coefficients of Table 4, or
creep and shrinkage functions of Table 6 may be used in pencil and paper
computations for camber and prestress loss.
vii


INTRODUCTION
The collection and use of creep and shrinkage data for use in the
design of prestressed concrete highway bridges is the subject of the
study reported here. The creep behavior of concrete under sustained
stress, such as that of a prestressed beam, is dependent in a large
measure on the aggregates used in the concrete and the humidity under
which it serves in the structure. The designer must know the properties
of the material used in the design in order to determine the creep and
shrinkage effects in the structure. Loss of prestress is dependent on
both creep and shrinkage, and beam camber is dependent on creep. Elastic
strains and other influences are important, but this study is concerned
primarily with creep and shrinkage.
An earlier study (1) investigated creep and shrinkage of prestressed
concrete bridge beams in Houston, Texas. The study reported here is an
extension of that work in that the behavior of other concretes in other
parts of the state is determined. It seeks to determine creep and shrinkage
of concretes made of natural aggregates typically used in four different
areas of the state under climatic conditions of those four areas. The
areas are chosen to represent different climatic conditions. The data
collected are intended for use in the design of highway concrete structures
in the areas studied when they are made of the aggregates typical of those
ar·eas.
Data from field tests are of primary interest here, but laboratory
tests were made for purposes of comparing field and laboratory creep and
shrinkage. If laboratory data are in good agreement with field data, the
simpler laboratory tests could be used in future studies of this kind.
1

The problem of predicting the short time and long time deformational
behavior of a given concrete structure has been the subject of about 1500
research papers published since the turn of the century. In modern bridge
design, where a smooth riding surface is a necessity, the deformational
behavior of the structure must be taken into account. Such deformation is
due in part to shrinkage and creep of the concrete in the piers, beams,
and deck slab of the bridge.
In prestressed concrete bridge beams, camber (upward deflection)
occurs with the release of the prestressing force. That initial beam
deflection is·. caused by elastic strain of the materials. Creep of the
conc~ete, a time dependent strain which is only partially reversible,
causes this upward deflection to grow with time. Elastic, shrinkage,
and creep strains in the concrete cause, and are accbmpanied by, elastic
strains of the prestressing steel which reduce the prestressing force.
The effects of creep and shrinkage strains in prestressed concrete bridge
structures are dependent on such variables as materials, stress level,
environment and other factors which are generally of lesser importance.
Economy requires that materials used in the fabrication of concrete
bridge beams be taken from sources as near to the use area as is practical.
This is particularly true for sand and gravel which make up the bulk of the
concrete. These materials differ from place to place, but variations within
·relatively small areas are not so great as those found over wider areas. The
differences in the composition of materials as well as differences in
climatic conditions contribute to differences in the behavior of concrete.
All of these are of concern in a study of creep and shrinkage.
2

TEST LOCATIONS
There are Home twelve prestressing plants that produce prestressed
concrete beams for the Texas Highway Department. Of thes1", four plants
were selected to represent four geographical areas of the state. The
locations of those four plants are shown in Fiqure 1, climatological
data for the locations were taken from U. S. Department of Commerce
records (2).
A brief statement about each test follows:
Dallas, located in north central Texas, has hot summers with maximum
temperatures of 100°F or higher and relatively mild winters with minimum
0 temperature of about 20 F. The relative humidity at Dallas varies from
approximately 75 percent at 6:00 a.m. to approximately 50 percent at
6:00 p.m.
San Antonio, located in south central Texas, has relatively hot
summers with maximum temperatures of approximately 95°F. Minimum tern-
0 0 peratures during winter months generally range between 20 F and 30 F.
The relative humidity in the San Antonio area generally varies between
approximately 80 percent at 6:00 a.m. and approximately 55 percent at
6:00 p.m.
Odessa, located on the high plains of Texas, has hot summers with
maximum temperatures in excess of 100°F. Minimum temperatures generally
are in a range of 0°F to 20°F. The relative humidity at Odessa varies
from approximately 70 percent at 6:00 a.m. to approximately 35 percent
at 6:00 p.m.
Lufkin, located in east Texas, has relatively hot summers with
maximum temperatures of approximately 100°F. Minimum temperatures for
3

• Dallas
• Odessa
• Lufkin ~
• San Antonio
Figure 1 Location of Prestressing Plants

. 0 Lufkin generally are on the order of 20 F. The relative humidity in
the Lufkin area is generally high, some 70 percent to 95 percent.
TEST SPECIMENS
Specimens consisted of cylinders and prisms of plain concrete. Table
1 gives the schedule of prismatic specimens. Specimens are described below:
1. Cylinders: Standard cylinders, 6 x 12 in., were cast in steel
molds and compacted by rodding. They were used to determine the
concrete strength and stress-strain relationship.
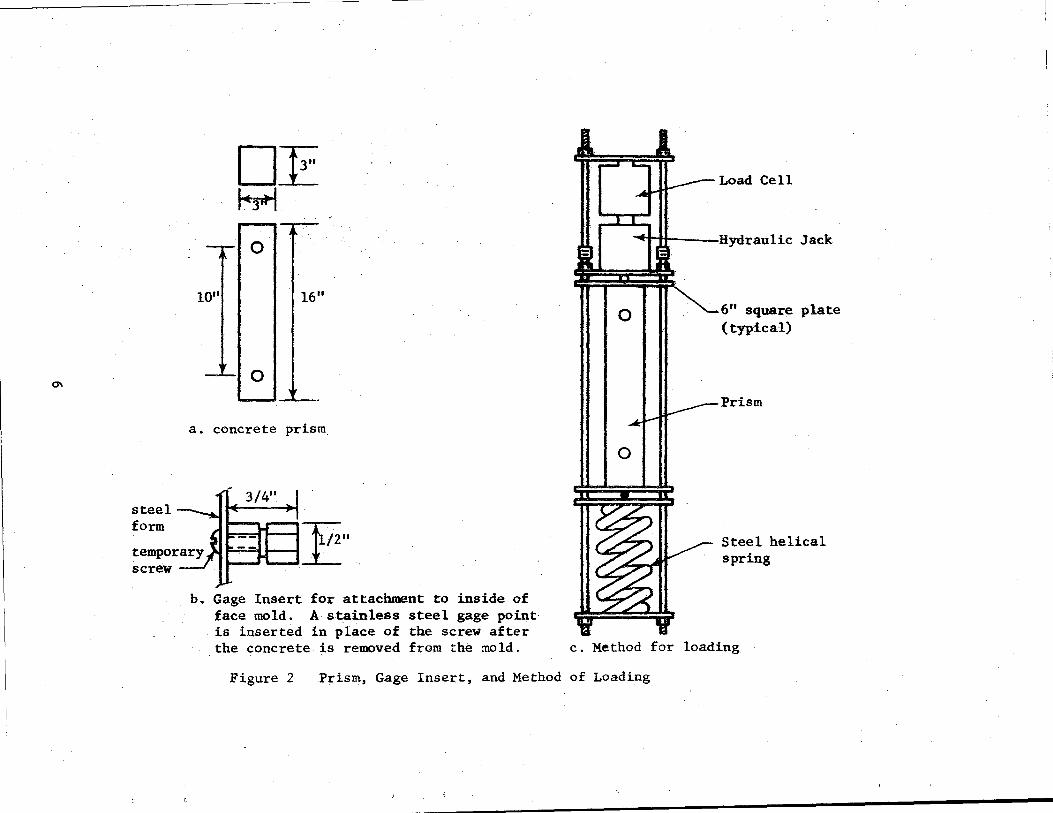
2. Prisms: Plain concrete prisms, 3 x 3 x 16 in., were cast to
determine shrinkage versus time and unit creep versus time. Steel
molds were used with brass inserts 10 in. apart attached to two
opposite 3 x 16 in. faces for later installation of gaging points.
A set of specimens consisted of 4 loaded prisms, 4 non-loaded prisms,
and 18 cylinders. Of the loaded prisms, two were loaded to 1000 psi and
two were loaded to 2000 psi sustained compressive stress. They were axially
loaded parallel to the long axes by a hydraulic jack and the load was
sustained by means of heavy helical springs. During the loading operation,
the load was monitored with a load cell. Figure 2 (a), (b), and (c) show
the concrete prism, gage insert, and steel frame for loading the prisms.
The 4 non-loaded prisms were monitored for shrinkage strains. It was
assumed that the shrinkage of the loaded prisms was the same as the shrinkage
of the non-loaded prisms.
Two sets of specimens were made at each plant location. One set was c ..
stored in open air under protective cover near the place of fabrication and
5
·----~·--~ --~-- --. ··- -
0'\
steel form
screw
DE ~.
I. --r-1 0
10"1 I
I I ~~~
a. concrete prism
E .. b .• Gage Insert for attachment to ins;i.de of
face mold. A stainless steel gage· point· is inserted in place of the screw after the concrete is removed from the mold.
II I I 11 ---- Load Ce 11
fti I ':iM Hydraulic Jack
olll ~6" square plate (typical)
II I I II
II I , LJl---Prism
II I O
Steel helical spring
c. Method for loading
Figure 2 Prism, Gage Insert, and Method of Loading
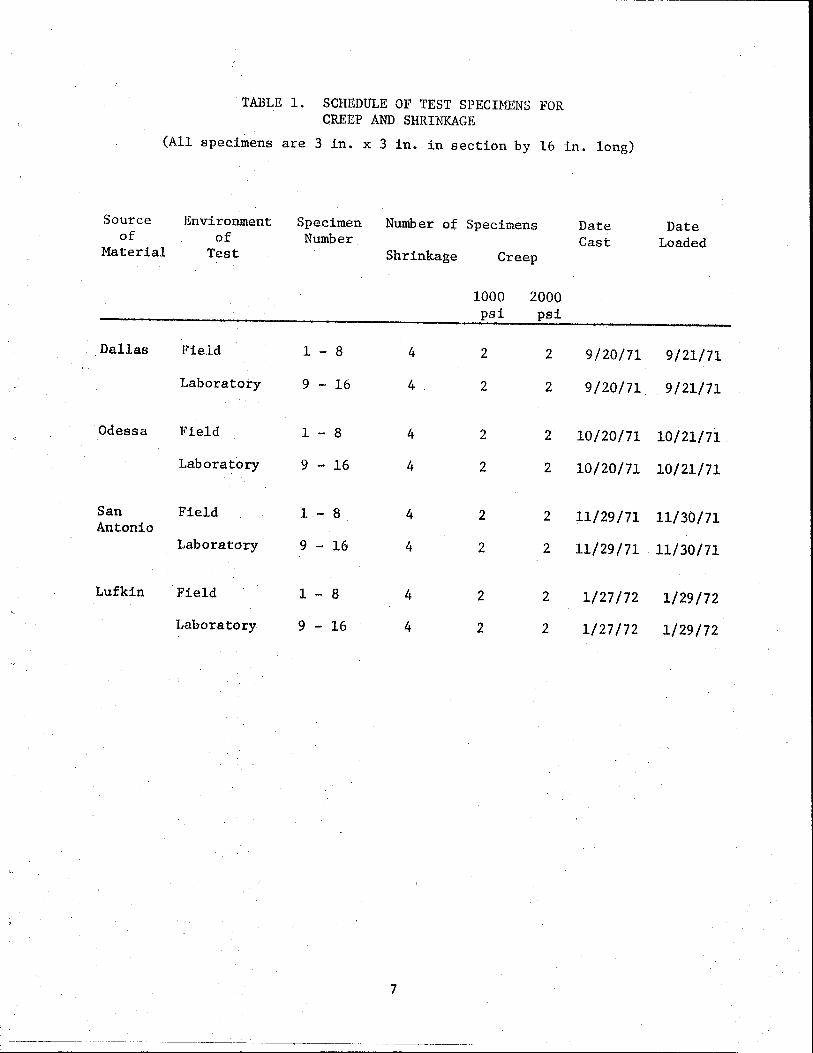
TABLE 1. SCHEDULE OF TEST SPECIMENS FOR CREEP AND SHRINKAGE
(All specimens are 3 in. x 3 in. in section by 16 in. long)
Source Environment Specimen Number of Specimens Date of of Number Cast
Material Test Shrinkage Creep
1000 2000 psi psi
Dallas Field 1 - 8 4 2 2 9/20/71
Laboratory 9 - 16 4 2 2 9/20/71
Odessa Field 1 - 8 4 2 2 10/20/71
Laboratory 9 - 16 4 2 2 10/20/71
San Field 1 - 8 4 2 2 11/29/71 Antonio
Laboratory 9 - 16 4 2 2 11/29/71
Lufkin Field 1 - 8 4 2 2 1/27/72
Laboratory 9 - 16 4 2 2 1/27/72
7
Date Loaded
9/21/71
9/21/71
10/21/71
10/21/71
11/30/71
11/30/71
1/29/72
1/29/72

the companion set was stored in the laboratory at 73°F, 50 percent
relative humidity.
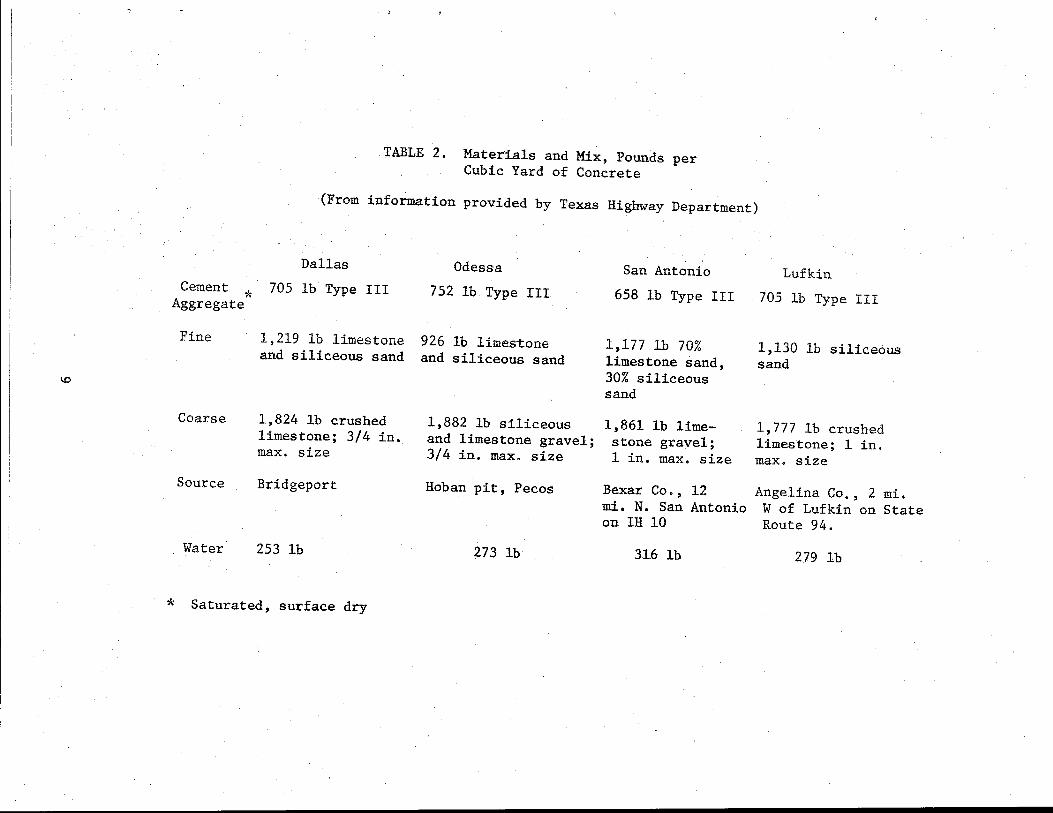
MATERIALS
Materials typical of the area where the specimens were made were
used at each prestressing plant. Only normal weight concretes were
studied. Table 2 gives information on materials and the mix proportions
used at each plartt. The batches were designed by the Texas Highway
Department for material used in prestressed concrete beams for bridges
in the Texas Highway System.
CURING AND STORAGE CONDITIONS
The curing of the test specimens was the same as for pretensioned
prestressed concrete beams fabricated to meet Texas Highway Department
specifications. At San Antonio, the concrete was cured 24 hours under a
wet mat. It was then covered with an impervious mat for an additional
three days. The plants at Odessa and Dallas utilized steam curing for
approximately 15 hours followed by three days under an impervious mat~
The plant at Lufkin utilized steam curing for 42 hours, to gain release
strength, and three days under impervious covering.
Specimens stored in the field at each site were protected from rain
and direct sunlight. The field stored specimens made at San Antonio were
stored at Boerne, Texas approximately twenty miles from the fabricator
because of a lack of suitable storage space near the fabricator. Those
8
\0
TABLE 2. Materials and Mix, Pounds per Cubic Yard of Concrete
(From information provided by Texas Highway Department)
Cement * Aggregate
Fine
Coarse
Source
Water
Dallas
705 lb Type III
1,219 lb limestone and siliceous sand
1,824 lb crushed limestone; 3/4 in. max. size
Bridgeport
253 lb
* Saturated, surface dry
Odessa
7 52 lb Type III
9 2 6 lb limes·tone and siliceous sand
1,882 lb siliceous and limestone gravel; 3/4 in. max. size
Hoban pit, Pecos
273 lb
San Antonio
658 lb Type III
1,177 lb 70% limestone sand, 30% siliceous sand
1,861 lb limestone gravel; 1 in. max. size
Bexar Co., 12 mi. N. San Antonio on IH 10
31.6 lb
Lufkin
705 lb Type III
1,130 lb siliceous sand
1, 777 lb crushed limestone; 1 in. max. size
Angelina Co,, 2 mi. W of Lufkin on State Route 94.
279 lb

specimens stored in the laboratory were subjected to controlled conditions
of essentially 73°F temperature and 50 percent relative humidity.
The creep specimens were loaded at the fabrication site at es
sentially the same time that prestress was transferred to the concrete.
This was at the end of the initial curing period and prior to the second
phase of curing, that under impervious mat.
10

INSTRUMENTATION
The strength and modulus of elasticity were determined from standard
compression tests on 6 x 12 in. cylinders. The ultimate strength of the
cylinder was determined before the creep and shrinkage specimens were de-
molded. At the Lufkin location, the specimens remained in the molds for
42 hours before the required strength was obtained. At the other three
locations the specimens were demolded approximately 20 hours after casting.
Subsequent eompression tests were made in the laboratory. Four Ames dial
-4 gages with read.ings to 1 x 10 in. were mounted 90 degrees apart on the
compressometer from which strains were read during the loading of the
compression cylinders.
Brass inserts were attached to the steel molds by screws before cast-
ing the concrete. After removing the forms, stainless steel heads were
screwed tightly into the inserts. Each gage reading reflected the relative
position of the reference points drilled into these heads. The first
strain reading minus the standard invar bar reading was taken as the datum
to which all other strains were referred. Special precautions were taken
to see that the first reading was verified because that reading served as
the datum to which all subsequent strains were referred.
Strain measurements from the 3 x 3 x 16 in. prisms were made with a
multi-position 10 in. mechanical gage from which readings were taken from
-4 an attached dial gage reading to 1 x 10 in. The standard (reference)
readings were taken from an invar bar at each time a gage reading was recorded.
11
--~------~-------
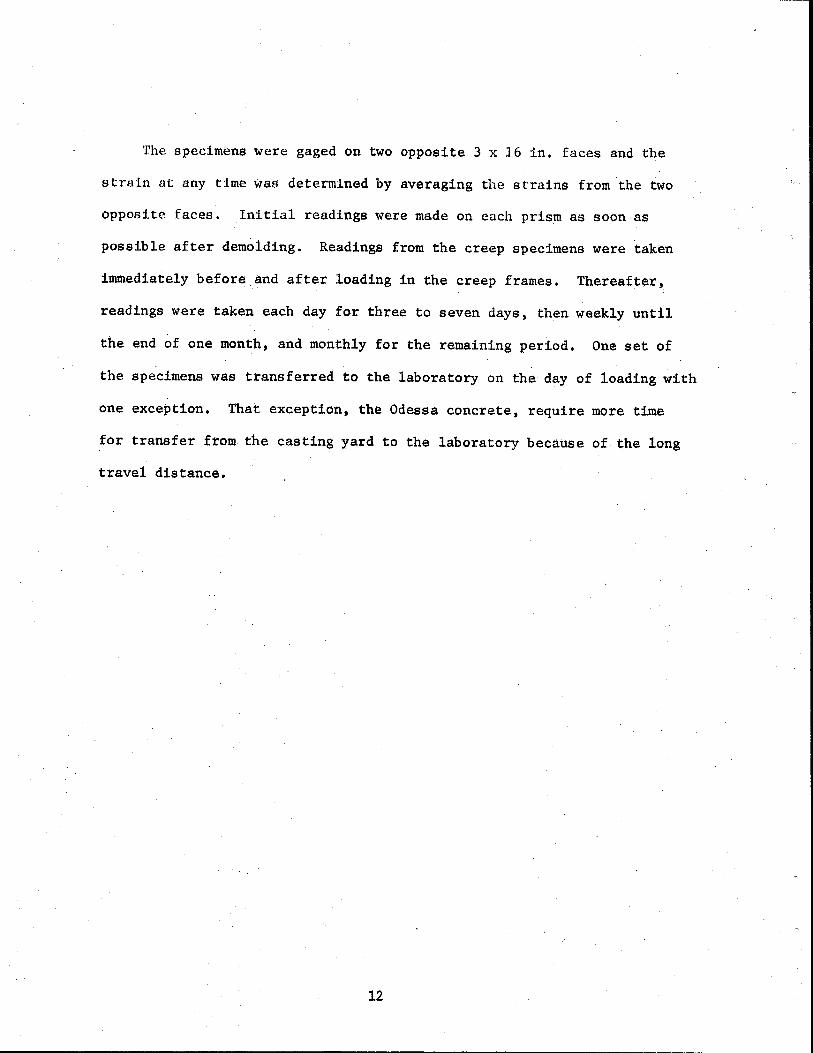
The specimens were gaged on two opposite 3 x 16 in. faces and the
strain at any time was determined by averaging the strains from the two
opposite faces. Initial readings were made on each prism as soon as
possible after demolding. Readings from the creep specimens were taken
immediately before and after loading in the creep frames. Thereafter,
readings were taken each day for three to seven days, then weekly until
the end of one month, and monthly for the remaining period. One set of
the specimens was transferred to the laboratory on the day of loading with
one exception. That exception, the Odessa concrete, require more time
for transfer from the casting yard to the laboratory because of the long
travel distance.
12

RESULTS OF TESTS
This section presents the results of the tests described in the
prevJous section. The measured strains, relative humidity, temperature,
and mechanical properties data are presented in tables and graphs that
follow.
Mechanical Properties
Eighteen standard 6 x 12 in. cylinders were prepared with each set
of shrinkage and creep specimens. Those cylinders were used for deter
mining the concrete strength and modulus of elasticity at release, 7, 28,
90, and 180 day ages. The cylinders were stored with each set of shrinkage
and creep prisms until testing.
The materials for the four concretes included in these tests satisfied
the Texas Highway Department specifications for normal weight prestressed
concrete. The strength and modulus data, average slope of the stress
strain curve between 500 psi and 2500 psi, for the concretes are presented
in Table 3. Within that stress range the slope of any one diagram was al
most constant. The strength and modulus of elasticity for each location
was about the same for field storage as for laboratory storage. It is
interesting to note that the modulus of elasticity of the Odessa concrete
was lower than that of the concrete from the other three areas.
Elastic strains may be found by dividing the stress by the modulus
of the elasticity at release.
13

Concrete ·from
Dallas
Odessa
San Antonio
Lufkin
*Average of 2
TABLE 3. Concrete Compressive Strength and Modulus of Elasticity
Storage Conditi.ons Field* Laboratory*
Age, Strength Modulus Strength Modulus Days f', psi E , ksi f', psi E , ksi c c c ·c
release 7;080 5,200
7 7,400 5, 710 8,230 5,400
28 8,490 5,270 9,015 5,310
90 8,970 5,4~0 8, 710 5,370
180 8,800 5,310 8,650 5,340
release 5,050 3,260
7 8,380 4,180 8,130 4,650
28 8,740 4,020 8,530 4,350
90 8,900 4,320 8;530 4,820
180 8,660 3,660 8,600 4,270
release 5,250 4,220
7 7,560 5,370 8,020 5,650
28 8;710 5,400 8,500 5,680
90 9,270 5,250 8,320 5,430
180 8,710 5,850 8,500 5,480
release 5,760 4,440
7 6, 710 5,320 7,080 5,050
28 6,770 5,130 6,840 5,020
90 7,530 4,740 7,960 4,400
180 7,420 4,520 1,350 4,550
cylinders 14
... ,

SHRINKAGE
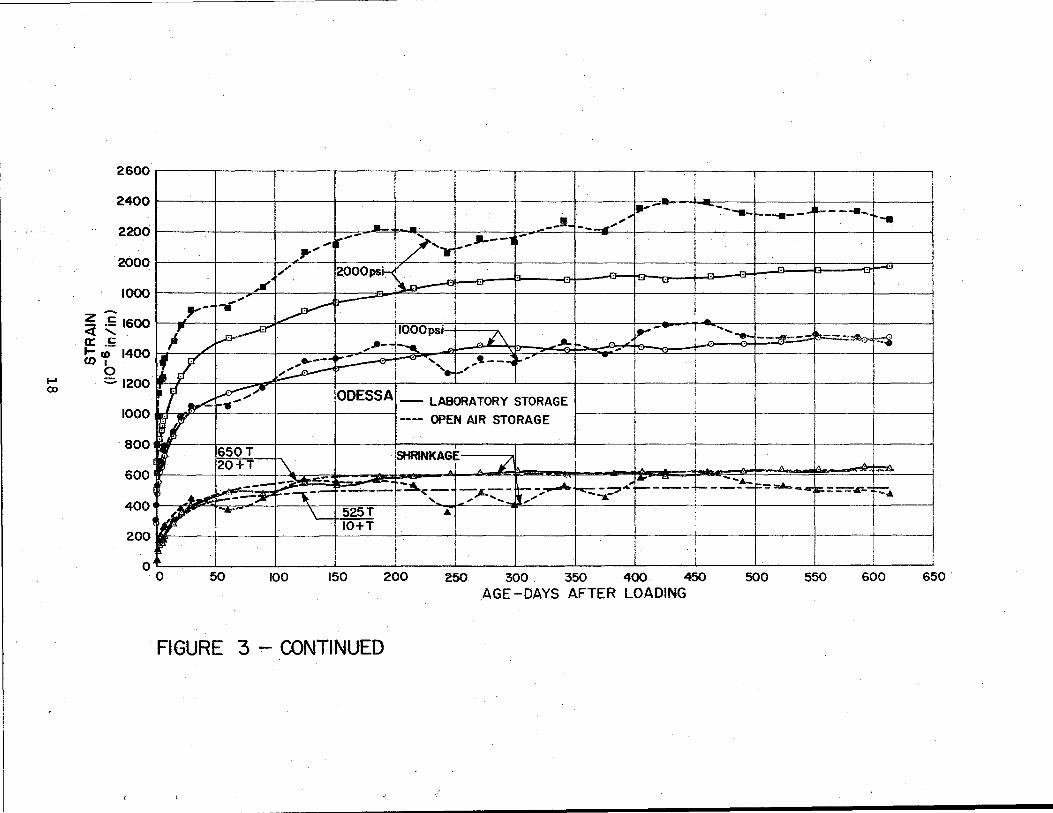
Shrinkage strains are shown graphically in Figure 3 and certain
tabular information is found in Table 4. All of the four concretes. show
considerably more shrinkage in laboratory environment (73°F; 50% RH) than
under field conditions. The Odessa material has much higher shrinka~e in
both field and laboratory than any of the other three. Dallas and San
Antonio material have the same laboratory shrinkage, but the latter shows
more field shrinkage than the· former. Since the laboratory reduces all
materials to the same environmental conditions the difference between the
field shrinkage of the Dallas and San Antonio material would indicate that
the humidity in the vicinity of San Antonio was lower than that at Dallas
during the period of the test. The data presented in Figure 4 at first
sight would not.support that conclusion, 'l'he temperatures and relative
humidities shown in Figure 4 represent the conditions only at the time
that; strain readings were taken from the specimens. Those readings were
taken at one·month intervals and the points plotted in Figure 4 should not
be taken to represent the continuous trend of temperature and relative
humidity. They are, at best, indicators of seasonal variations and cannot
be interpret~d as prevailing conditions at the field storage sites and
should not be used to interpret the effect of climate on shrinkage.
The ratios of field shrinkage to laboratory shrinkage for the four
concretes in the small specimens of these tests indicate that the field
conditions at Odessa combine to produce shrinkage strains more nearly the
same as its laboratory strains than any of the other concretes. The ratios
shown in the table might be used to convert laboratory shrinkage strains of
15
-----------,-----·--------------.

...... 0\
1800
isoo
1400
1200
1000
800
600
400
-~,--I I' I
!· I' i I
1 I;
I
~ I I i j: i. ·I
' 12000psiiA l: ! ' I : I 'i l . I' ! i :
. "' ,, "' .. • i:J _.. _ ... '
~- ~r ~---}-~-l~-.!1--i ·-r--- :· ' ~-I • i ,_ 1- ' I ;
! I I v ! __ ...j .. - i i I I / , ___ .. --.- I I
I i
h' ' i .-, . !IOOOps-8:{ i I ' , ... "1 _____ 1-
" Le.--- . 0 ~ ! _..., _____
-_--- I -_ --r A -1_ .. ___ - ·-_ .. _, _____
' '/' ·-..---~
__ ..... ~LLAS ---LABORAlORY.STORAGE I i . , :· .,)·---.. - ' ' ---OPEN AIR STORAGE I
-~_ .. ..' 150£T . I ! ,. ii~!.!_3L ... ' I
:p -- -- - ---. ' i I r=
i ~-, ...
.:-= !--fD _ ..
' i i
. '!
-~r-; i ;SHRINKA~ ! I • !-_,_,- :-:k= -..;:-: ~ ~-- i 1:!.--..a:: f----- fr --=.-:.-r-=----;: -::r-:~-":..~ !---=9*-----.:: ~-==--:
__ .,. ___ I ; -- -- -- . -7"-.-.-- . --I -- -'!-- -- ... {
200 v- '" '2 00 z:::::
~ 20+T
50. <i c: 0::: ·-t-ID U) b 1800
1600
{
100. 150 200
! !
1400 ..8""-" ~ 2000psi-v / v ---- ------ ..,~-• ---T~J ............. - I !1000 psi-11\
: t l' I 1 .... 1 _,..-o- _...i- __ ,_ --r.--
i/> ------r-· SAN ANTONIO - I . . i '
rt~---\_i500 T t !SHRINKAGE
· · 20+T -- .
1200
1000
800
600
400
r i ' i I i __L_
i ' I - ! I
250 300 350 400 450 500 550 AGE- DAYS AFTER LOADING
f I j i I:J -l:J
I 1 ..-- -----""!---.! I ..It----- ... - ...... --- i .... .....
I I ! I l I ! .
"' "' " ., --- - ---- --F ·t ---·- ---' ... 1-----r--·-
i • I -LABORATORY STORAGE
I I I
i ---OPEN AIR STORAGE i
J -A - -- I - -- - -,--[<!> I
pi~ iP""" ~ir~- ~---~=--= ~=--=~-t-==-]-... -~-r-•- -----f . ..-.- --, ... - -~--. 1-.--- ! •
~ I i ' , r- i I z=_[_380T l I ~ I \ I '25+T i
' f -- _i_ ___
200
0 0 50 100 150 200 250 300 350 400 450 500 550
AGE- DAYS AFTER. LOADING
FIGURE 3- MEASURED STRAINS
I i I I
600 650
: I I I
l i !
1 I i
!
!
600 650

"
1600
1400
1200 -c·
z ~ 1000 <t ·-
~~tsoo - 600
400
200
0
./ ~~~ ....
~.,../.
·rt.r~( r~
~
2000psi
.;..&.-' ~ ... -~ ...... -..............
....-(.:
~ _..o- _ _.
C"' , ... --·- _.,.
450T 25+T ----. gr" .
-----= ~...a,:r:w.:a:: ·--"'\:___ ,_.290T 25+T
___ ...... I 1\ I~
.., 8 r.1 ... ---- ·--... ------~ ..
1 ~----... ---·---.. _ .... ! i
l .f;'>
·- "' '• -I' • ~---.1116- ~-....._
IOOOpsi ----""1:-- --. 1---....a..-l ... ~--~- .... -- ---~· I .... I LUFKIN --LABORATORY STORAGE I
i --- OPEN AIR STORAGE
I .A
~RINK~§..E~ =
! A. ... -r- ~. :-.--.:\ ----+------- ..... -- --- ~---.t.-...J-t.. ..... - ' '
... -- ----- - ---- L__---~-·- ----------- - --- -----j__,
0 50 100 150 200 250 300 ~0 400 450 500
AGE- DAYS AFTER LOADING
· FIGURE 3- CONTINUED
550 600
2600
2400
2200
2000
1000
~ ~ 1600 0::: .5 t- CD 1400 w,
0 ...... ::::;.1200 00
1000
800
600
400
200
T l .i I I ' ~ I 1 • " .... - --- !------.J ------
. ---I ... ~ i -· ·- ... i
__ !_ ---..~~'
.. -- /· T ~--, - l .... .,. .. I ,,_ .. ,"' 2000ps~L I i
I"' "' ~ : ~ !
I .. ~ p-~. ' I ~- .... ~ I I ! I --.· .... -- I ... ..;,_ .... _ ~ ;." ~ 1tooopsi.·1 7\ - ·~· --b.---- -"' --":- ""' : -v -.. / ,,--j_'""'- . .. '
~T -- I f/ ____ ...
' ,t--""4 1-' . i
~ ....... 1-' ; " .
. I
f.v- ~;-· ODESSA i ! ..... - LABORATORY STORAGE I
.-f/ ---- OPEN AIR STORAGE ; I
l J 650~- !SHRINKAGE I \. 7' .,. .A 20+T
__ "'-lloc.":. .:::_ - 1-c:-::: - -::;1...: ~- l --... _ ~:: ............. ~ F-=--:.r---: i------ ~~-_,. --· -- ~ ... - ""fi. -~-~ -+-- -- -· _.
--::~ ' , ...... ,...,..,...' --& i
~r ...... \ 525T i ...
IO+T l ' ,. ! I I i ' I ' -- --- j ___ ____,____f____ __ ----- --0
0 50 100 150 200 250 300 . 350 400 450 500 550 600 650 AGE -DAYS AFTER LOADING
FIGURE 3 - CONTINUED

1'-' \0
e TEMPERATURE
• RELATIVE Hl.NIDITY
I I
' r· 1. 100 J>-----+----1
so~ • . . ·. . . • r • I I I
60 =·i~ l 0 * ~ : ~~ : t ·~ :; ~ :- ~ ~ 4 ! 0 3 cr
0 0
: .. .. 40' • I 8 •
... .. ... 20
0 50 100 150 200 250 300 350 400 450 500 550 600 650 /JGE-OAYS
~0.---,---.---r---.---,---,---~----------------.-----~----,------
!ODESSA I ~ TEMPERATURE 00 ~
... 0 " 80 0
" ...
U : r:. I. ~I · I ·1 : ·I . i ! ~ · i : : . . . -cs o ~~·
200 300 350 500 550 400. 600 650 /JGE-DI!.YS
~~ ~!!;! 120 ! 1 . . ' ~~ I I I ! i il ' ' a <li 100 ... ... . I ~ : t-iil Pl. ... 0 ... ,
a:ao.- o ".. . 0 0 0 - .. '
•e • I • • 60 0 • T i0 . •
00 .a 0 .. e ,
iil
40 l:ioERNE 0 TEMPERATURE I ... 0 I ... ... ... • RELATIVE HUMIDITY
20 0 50 100 150 200 250 300 350 400 450 500 550 600 650
~-DAYS
120
100 0 0
0
_a - 0 I '-'! o "' ' ; . • 80 L ' I I ' ... i 0 "'i .. " p I •
40 ~g• "' I : ! ., '
0 TEMPERATURE 60~~--t·--~+~~---~~·~i-+---11 ___ ... __ ·~·"'~--r----t----r·~=Y~•n_ .. ~~J • RELATIVE HUMIDITY
5o 100 150 200 250 ~ 350 400 450 500 550 600 PGE:-DAYS
FIGURE 4- TEMPERATURES AND RELATIVE HUMIDITIES AT TIME OF READING AT FIELD LOCATIONS
650
specimens of the size used in these tests to what might be expected of
them in the field.
Hansen and Mattock (3) have reported a linear relationship between
shrinkage strain and the ratio of the volume of a specimen to its surface·.
area for specimens of various sizes and shapes stored under laboratory
conditions. This would lead to a greater shrinkage in the small specimens
of these tests than would be realized in a full size prestressed beam of
normal shape and dimensions such as is used in bridge design. The tests
performed on field concrete and reported in Ref. 1, however, showed greater
shrinkage in a short length of a full size beam section than was found in
the 3 in. x 3 in. x 16 in. specimens in storage in open air at Houston,
Texas. The local daily and seasonal climatic changes seem to have con
siderable bearing on shrinkage behavior •. Until more information is developed
on the relationship-between field and laboratory strains, the ratios shown
in Table 4 might be used as indicators, at least, of what might be expected
in the field if laboratory behavior is known. From the experience gained
in the present series of tests and those reported in Ref. 1, it appears that
field strains from the small specimens can be used for design purposes for
full size prestressed concrete bridge beams.
The shrinkage =unctions shown in,Table 4 are intended for use ia
computing camber and prestress losses in prestressed beams. They are
explained later in the section entitled Functions for Creep and Shrinkage.
20

TABLE 4. Shrfnkage and Unit Creep at 500 Day Age and Continuous Shrinkage-Time Functions
Shrinkage
Field Storage Laboratory Storage Ratio: Source Shrinkage Function Shrinkage Function Field to
... 6 -6 Laboratory (10 in./in.) (10 in./in.) Shrinkage
Dallas 300 315 T 480 500 T 0.62 20 + T 1.5 + T
Odessa 510 525 T 620 650 T 0.82 10 + T 20 + T
San Antonio 360 380 T 480 500 T 0.75 25 + T 20 + T
Lufkin 280 290 T 430 450 T 0.65 25 + T 25 + T
Creep (lo-6in./in./ksi) ·
. Ratio: Field to
Source Field Storage Laboratory Storage Laboratory Creep
Dallas 390 340 1.14
Odessa 630 500 1.26
San Arttonio 360 370 .97
Lufkin 430 360 1.20
Creep Coefficients creep strain t elastic strain
Dallas 1.81
Odessa 1.70
San Antonio 1.60
Lufkin 1.89
21
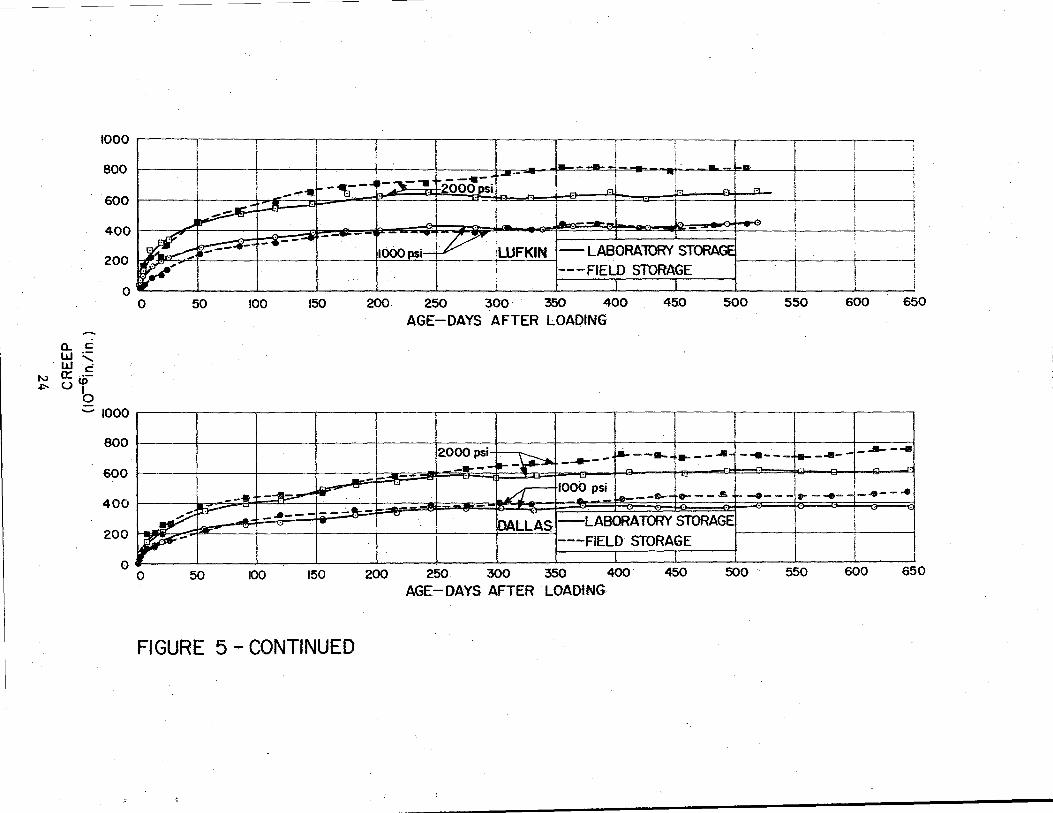
CreeE of SEecimens
Creep curves .shown in Figure 5 are derived from measured strains ·shown
in Figure 3. Elastic strains and shrinkage are subtracted from the total
measured strains of Figure 3 to produce the creep curves. The periodic
variations seen in Figure 3 are primarily seasonal changes, and when they
are taken away, the curves of Figure 5 are smoothed out very much.
The ratio of sustained stress to ultimate strength for all the concretes
ranged from a minimum of about 12 percent to a maximum of about 40 percent.
Various experimental results show substantial evidence of a nearly linear
relationship between creep and applied stress (4). An upper limit for the
stress-strain ratio somewhere in the rather wide range of 30 and 75 percent
has been suggested. The stress-strength ratios in these tests, using the
strengths shown in Table 3, fall within that range.
Among the field tests, the San Antonio material shows a consistent
linear relationship of creep to stress in that the 2000 psi creep is twice
that of the 1000 psi concrete, Figure 5 and Table 5. No other material,
field or laboratory stored, shows such good linearity. The ratios of creep
shown in Table 5 for Dallas, Odessa, and Lufkin concretes would suggest
that the sustained stresses in those materials did not bear the 2 to 1
ratio either from the beginning or that the ratio was reduced during the
test period.
During the test there was never any question about the initial stress
value because of the care that was taken in applying the initial load. When
the specimens had been under load for approximately four months, the loads
on all field specimens were checked. At that time, far more than one-half
22

N w
a.. c: w ·-w ........ 0:: c: u ·-U>
I 0
1400
1200
1000
800
600
400
200
0
-1400
1200
1000
800
600
400
200
0
,;,
1 I ! !. ~ ! : ! J I I! l ! . I ~ ! I
I !I ~ I I ; : ' ' 1 : j ' i j ' I I . I ' I I
i i ' \. I '• t I I' i I . . ' : t I
I \ i :, i I ' i i
! ! I ' '2000psi I I ' ~ ~- , •- - , i 1 l '. /1 , --'--~~;:--=-- "' . -· . LJ I .. , - : . ' I - - ~ I j' j' . . . , "'f-.;.... --,.- . .- -• ' ' . i : _ _, _- ; - I I i I - - I ;: II r: I L ~ - I 1 .
• I . . ' - r---e - 1- I - ·-.--.---~--~ -- .... ~ :A ! ' -~~--'- " .. .:. i
7 ,..,. . -~-~ 1 • • -LA. BORA10RY STORIIGE' I Pal ~- l 1 ·
· 1" -. - ~ ~ • 1000 psi l · SAN ANTONIO -~-oPEN AIR STORAGE ~---- I I . I . .
0 50 100 150 200 250 300 350 400 450 500 550 600 650 AGE- DAYS AFTER LOADING
I
I IL, -• I J ~ I -a - ~- --.---11;- ... I 1 l
-- _.. .I ! _ ... - , ! I I
- • I . J,-B - 2000 PSI j · . 1 ..
... ..r-1. .J:L .. j - i __ ... __ • ""e , ----+-- .... _ _._- r _ _ ... - ~I _. _____ ,-.. -~- -'-. . . . '
,. ~ ! I ! -" _,--r : - : ; l' ~ -=---:::.<~ _\ ' ' l !
I ~r" ' jiOOOpsi ' ' LABORA10RYSTORAGE ' ~ . ! OOESSA ---OPEN AIR STORAGE I -7 !
0 50 100 150 200 250 300 350 400 450 500 550 600 650 AGE- DAYS AFTER LOADING
FIGURE 5- CREEP vs. TIME
a. c w'= w c:
....., 0:: ·
.j::o. u tO
6
1000
800
600
400
200
0
.:::; 1000
800
600
400
200
0
I I
1 1 !
I I '
-- L •. i: _ ...... - i !
-,--. . -~- I 1 ·r ! i
: __ ..... i"' --,;---1 r-.;oo~;ii I t:1 J r-1 ' ~ ~
1r.L . I I I
~ i ~ ! ~ l , ... =---- I
~ --- - ~
~;WFKI~ - - i
r---.. - -·--- I
IOOOpsi- - LABORAlORY STORAGE I
I i
~, J ' ---FIELD STORAGE -~ !
i I l I 0 50 100 150 200. 250 300 350 400 450 500 550 600 650
AGE-DAYS AFTER LOADING
i
2000 psi ~ ------ .IIi------- ____ ... ------ r-- _ .... _- _ _._ ---l
-·-- . ~ ~- - "" . . !
~-'CJ
1000 psi I I --· -~....-"" ~ ..._ - .e-----~4 .... _ ... ·----- ... - -·- -i ... -- ...
·-~ :b- _ _. __ - ...;.-...:-
"' . -
~
~-~ ' , .. DALLAS LABORATORY STORAGE ' -~ I
~- ---FIELD STORAGE ! 0 50 100 150 200 250 300 350 400 450 500 550 600 650
AGE-DAYS AFTER LOADING
FIGURE 5 -CONTINUED
of the creep at termination had developed. The helical springs used in
the loading frames have spring rates of 10,000 and 18,000 pounds per inch,
respectively, for the 1000 psi and 2000 psi specimens. The computed stress
loss in the 1000 psi specimens was about 2 percent of the initial and 2.2
percent in the 2000 psi specimens. The load check indicated losses of ap
proximately 20 psi in both the 1000 psi and the 2000 psi specimens, the
discrepancy being due to imprecise portable measuring equipment. Adjust
ments were made as nearly as possible to meet the theoretical losses.
The load adjustments discussed above fail to account for the low
ratios of 2000 psi creep to 1000 psi creep for Odessa and Lufkin laboratory
stored concretes. The corresponding ratios for the other specimens, both
field and laboratory, approach the expected value of 2, although none reach
it. All data and procedures have been studied in an effort to exPlain the
unusual behavior of the Lufkin and Odessa laboratory materials. The
possibility of friction having developed between the horizontal bearing
plate, that separates the specimen from the spring, and the vertical tension
ties was suggested. Test frames were inspected for that possibility, but
they were not broken down because to do so would have destroyed the test.
No conclusive reason has been found to explain the trouble.
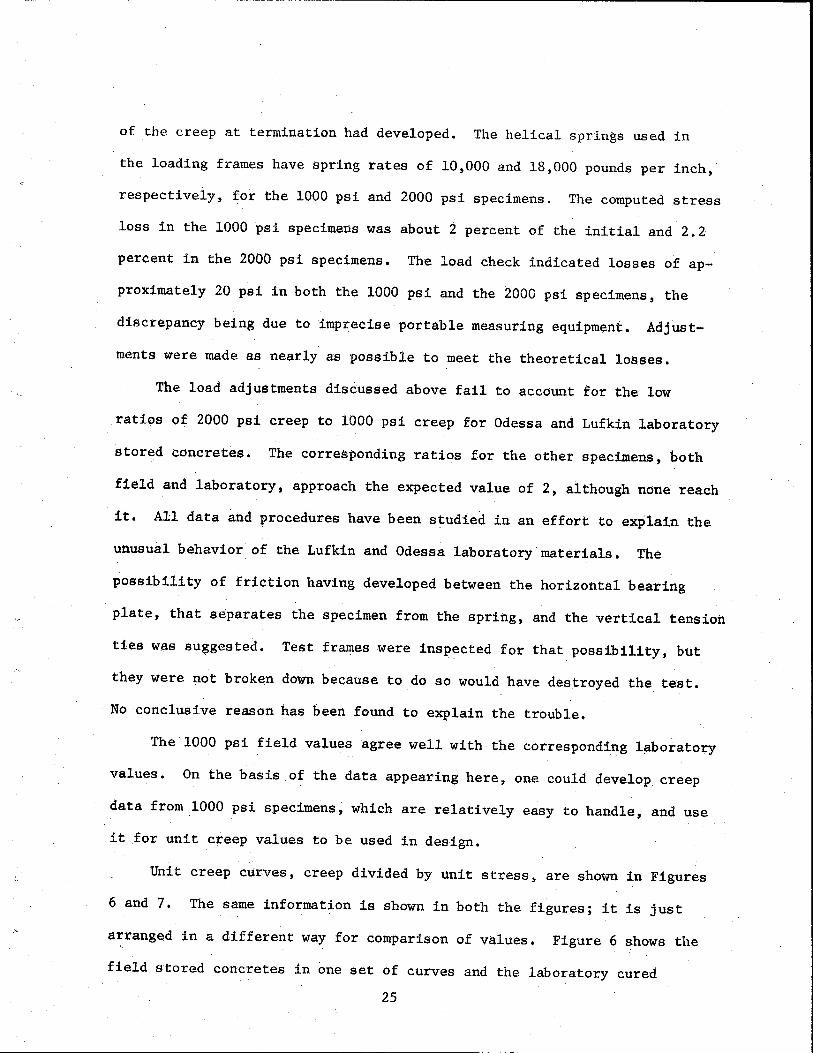
The 1000 psi field values agree well with the corresponding l~boratory
values. On the basis of the data appearing here, one could develop creep
data from 1000 psi specimens, which are relatively easy to handle, and use
it for unit creep values to be used in design.
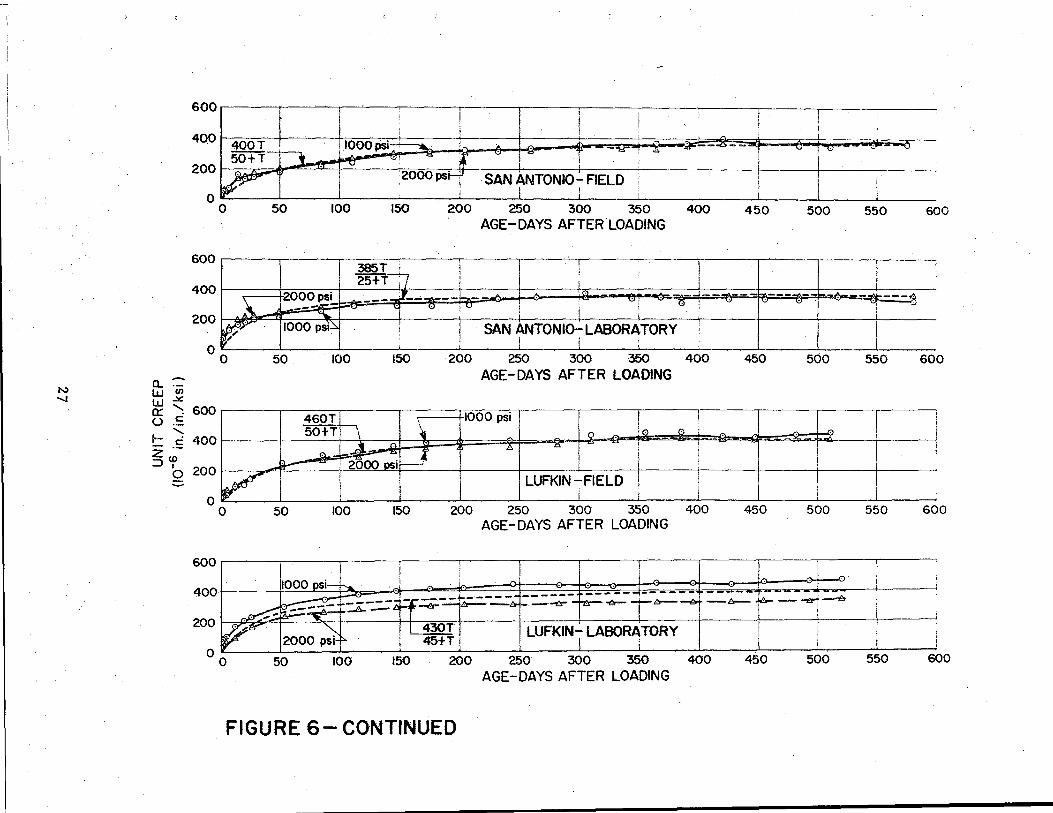
Unit creep curves, creep divided by unit stress, are shown in Figures
6 and 7. The same information is shown in both the figures; it is just
arranged in a different way for comparison of values. Figure 6 shows the
field stored concretes in one set of curves and the laboratory cured
25

N 0\
800 I r I I • J ,, I ! ! I ! I 600 • l ' ' I I'OOOpsin ! r - i i_
400 J .,. . . - -. ___ ;.. __ -:·· -..---- - -- - -...o=--..:.---re- - · : 1
200 ~ =--- . \ ' . i . 1~ r i ; \ I \_____L:4.40 T DALLAS FIELD !t:_ ~ l l2000psi+----:-l i 1 60+ T
0 0 50 100 150 200 250 3>0 350 400
I 450 500 550 600 650
AGE-DAYS AFTER' LOADING
800.-----.---~.-----,------,-----,----~------------.-----.------r-----.------------
n.·;;; w-"' w ....... a:c: u:;:::
] 600 t . 1
. i i . . . . - --- ___ ,;._-±.--.:. -400 OOOpsi! · · -~- -~- -- -- --- - ---- · 1 ~ -- ·, - - ' ! ' 200~..;.. .l \ I' i 365T !DALLAS-LABORATORY
- · · · . ~ · 40 +T · ~ I · . 2000--E..l. I I ' 0 ..________ .
0 50 100 -150 zoo 250 300 350 400 450 !
500 550 600 AGE -DAYS AFTER LOADING
t- .s 800 -w ~g 600
1000 psi-r\ I j 1 -"ll-o
I - --i
400 l . -
I i 675T i
I
--.;i:::::: ~ I
\ 40±1:-:--i
i
==-------' ~ ~ i
I ~ !'""" I l
!
zooo . ' :ODESSA FIELD !?'/ i
' •' 200
00 500 600 250 300 350 400 550 450 150 200 50 100 AGE-DAYS AFTER LOADING
800 1000 psi+--. 1 , , . . _L_ ~ . ! I ! l : I I :
1 . \ . . • I
I 4 . . · :::y - ::1:': __ ._.,. -,._-.::--- ------1------~-------r- - -r- ---- I ~ ~~~:- ,-.. \ ~ I 1 . i ! -- I - --;--· r- p \ 525 T ! ' !
2000 psi- L_ ___ ~_+!___1_ fDESSAjLABORtTORY 1
600
400
200
00 600 250 300 350 400 AGE..:_DAYS AFTER LOADING
450 500 550 50 100 150 200
FIGURE 6- CREEP CURVES FOR THE FOUR CONCRETES
650
~
~
650
650
N "-J
600
400
200
0 0
600
400
~ 200
~ 00
a..:::w UJ w.x 0:: ': 600 u.s .
......... !:::: c. 400 z ~-::::> 0 200 -
0 0
-
i ~-~-L~
50 100 150 200 250 300 350 400 AGE-DAYS AFTER.LOADING
I 385T : i ! ' l 1
I 25+T0 ., i i i
2000psi ..A.--- J_ . ..;. __ ..;._~ -· . '. -I
"', (') i ;,..- . "! 0 :"' I ---~ 1000 psi::::. I I SAN tNTONIOt LABORATORY
i j
50 100 150 200 250 300 ·350 400 AGE-DAYS AFTER LOADING
1000 psi I
i
! !
50 100 150 200 250 300 350 400 AGE-DAYS AFTER LOADING
' I
I
450 500 550 600
-~ - ---~ "' r'-' <:J ~_,
I I ___ L ___
450 500 550 600
I I
450 500 550 600
600.-----.-~----------,---~.------.--~--.-----,------.------.-~~,---~-.--~~
~~ ~ t t i : 400 1 11000 p~ ·~ c · 1::-___ :_.-:j ____ ~-~-!---~- .. :--w-~ 1 '
2ool ~~~ .. I II ·-~~! I I 1 I I I i :
00 150 250 300 350 400 450 500 550 600
AGE -DAYS AFTER LOADING
FIGURE 6- CONTINUED

N 00
8oo .-- I ~ , . 6oo I ' i '
l I , I I . "
400 . -- _-:::i;::::---: ,_ ---r-- . - ---, --'==- -=---=-- ------ 1- _.._ - -
I .-.- ·- - -· -~-- -~- , r 200 =--~ ~--~- ' . I ~ DALLAS FIELD IOOOps~ --LABORATORY 1000 psil if'r ---FIELD 2000psi ----LABORATORY 2000psil 0 . 0 50 100 150 200 250 300 350 400 450
AGE.-DAYS AFTER LOADING
800 i
600 ---- -- -- -\
. 400 - ---- ---- ----
200 ~
a. ~ 0 0 ttl~ 0::: ·-OE !::: <0 800 Zb :;).:=,
600
400
----
50 100 250
I l l
---::
__ _j_
200 250 300 350 400 450 500 550 AGE-DAYS AFTER LOADING
I ! ~ ~ l ! l i I
l I I I i ' I ~- I I -r -- ____ ,_ __
I --~----- i
C_ SAN ANTONIO r FIELD 1000 8 2000psi I I i
L_ __ ___l__ '( ---LABQBATQRY IOQ_QJl2000 osi L__ ___ ~i ____ ---~ --·--
200
0 0 50 100 150 200 250 300 350 400 450 500 550
AGE -DAYS AFTER LOADING
800
600 I T T i ' I
i J l -1 ·--i· - = -----=-:::-~ +' . . T -- ---- ----- -,..... .... ~ ---- ----t----1 --- --v LUFKIN - RELD 1000 6 2000 psi--LABORATORY_ 2000 ~
--LABORATORY 1000 psi -----" ~--- ~~ i
400
200
0 0 50 100 150 . 200 250 300 350 400 450 500 550
AGE-DAYS AFTER LOADING
FIGURE 7- CREEP CURVES FOR 1000 AN 0 2000 psi STRESS
I
600
'
--
600
;
600
650
'
650
!
i
650
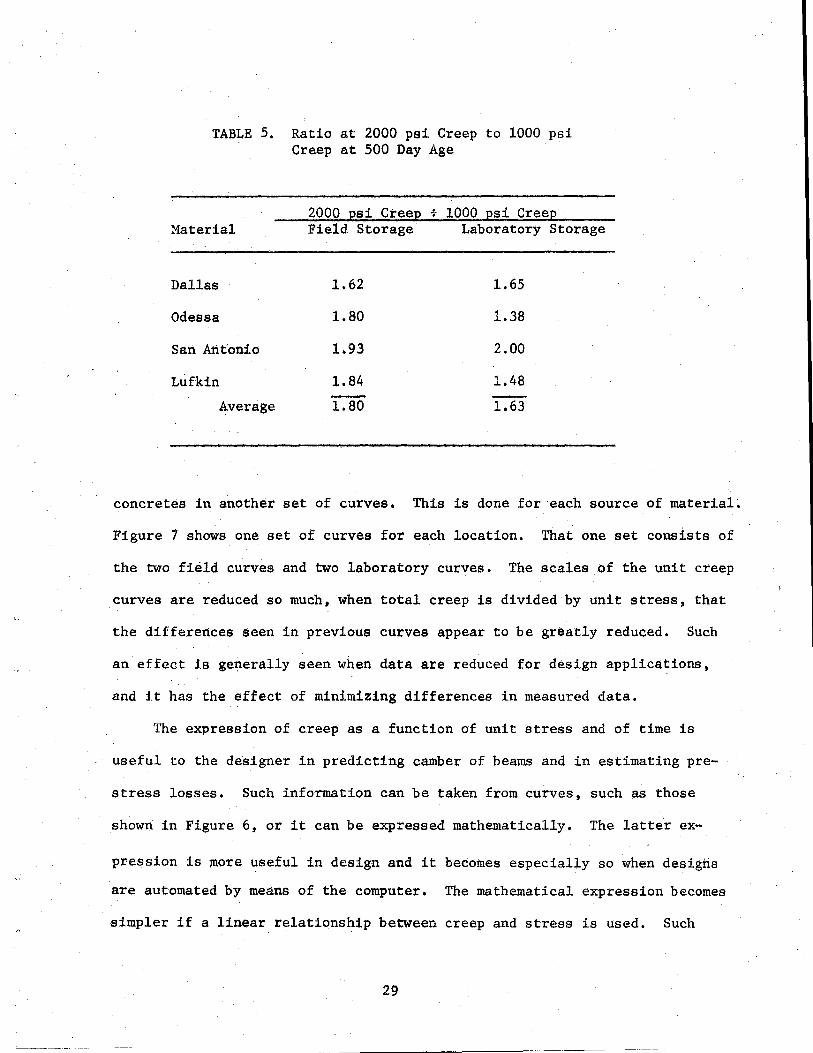
TABLE 5. Ratio at 2000 psi Creep to 1000 psi Creep at 500 Day Age
2000 psi Creep • 1000 psi Creep Material Field Storage Laboratory Storage
Dallas 1.62 1.65
Odessa 1.80 1.38
San Antonio 1.93 2.00
Lufkin 1.84 1.48
Average 1.80 1.63
concretes in another set of curves. This is done for each source of material.
Figure 7 shows one set of curves for each location. That one set consists of
the two field curves and two laboratory curves. 'l'he scales of the unit creep
curves are reduced so much, when total creep is divided by unit stress, that
the differences seen in previous curves appear to be greatly reduced. Such
an effect is generally seen when data are reduced for design applications,
and it has the effect of minimizing differences in measured data.
The expression of creep as a function of unit stress and of time is
useful to the designer in predicting camber of beams and in estimating pre-
stress losses. Such information can be taken from curves, such as those
shown in Figure 6, or it can be expressed mathematically. The latter ex-
pression is mote useful in design and it becomes especially so when designs
are automated by means of the computer. The mathematical expression becomes
simpler if a linear relationship between creep and stress is used. Such
29

a relationship is assured in the San Antonio material of these tests. The
average of the ratios of 2000 psi creep to 1000 psi creep is seen to be 1. 80
for the four field concretes, Table 6, and the corresponding iaboratory
material ratio of 1.63 would be raised considerably if the Lufkin and Odessa
2000 psi laboratory values were discounted.
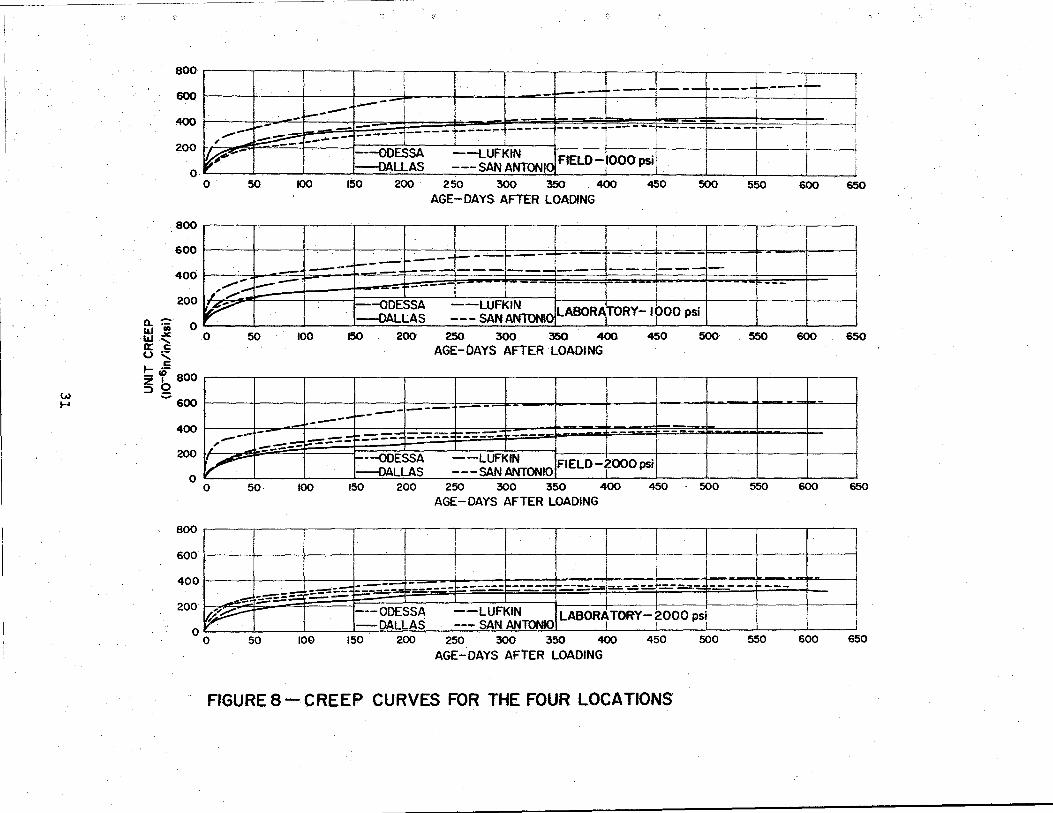
Figure 8 shows three of the four creep curves for laboratory
stored specimens to be about the same, even though the specimens were made
from different materials. It is also interesting to note from these curves
that the creep curves obtained from the field stores specimens is very
nearly the same as for laboratory stored specimens. Mix designs, Table 2,
are similar, as would be expected because of highway specifications, and
differences seen in creep and shrinkage would probably be due primarily to
the different aggregates used in the different locations. The Odessa
concrete contained the highest cement content, however, the paste content
for the four mix designs is very nearly the same, approximately 30 percent.
Consider the average unit creep observed in the laboratoryfor the
four different concretes. At 500 days age, values of approximately 340,
500, 370, and 395 (10-6 in./in./ksi) are noted from Figure 6 average curves
for the respective locations, Dallas, Odessa, San Antonio, and Lufkin. For
these specimens in the laboratory, the temperature and relative humidity
were the same, the stress levelsT·r;rere essentially constant, and the;paste
content of the mixes was approximately the same. From these conditions then,
it could be reasoned that the aggregates in the mixes would be responsible
for the differences in the magnitude of creep. Neville (4) states that of
30
w ......
'i·
800 I I [i.
r ! li !I
li I _.L--+---j -- -·----· ~-:---- I. l J 1: f, - . i ..... ' 60Q
400 . ....--- ...... - -::::=-:- . ......_-:::;::..:::-- __ ..... -- -t --- --- 1-------~:------~---- !-·
' f !: ~ / ---200 ~·
0 0
--oDESSA L~~N , il --DALLAS ---SAN ANTONI FIELD-1000 psi;
- -- . ll ' 50. 100 150 200 2 50 300 350 400 450 500
AGE-DAYS AFTER LOADING
800 I I I !
-~~ -~ - - r--:___.--f---1------r--- t=_ -= - - -- - -- i ......... - - ---- -
I - -' ,' ..... -I"""
600
400
200
Q. = 0 ~ --oDESSA
DALLAS LUFKIN LABORA
1TORY tpoo psi -- SAN ANTONtO
LL1 -= 0 w, 5~ !::: {D- 800 Zb :::::>_
........ 600
400
200
50 100 150 200 250 300 350 400 450 500 AGE-DAYS AFTER LOADING
I -- ----------- 1---- -- ---- -- -::;_.:..-:-. --- =----·= - --- ·==~---F , --------
-+-- l -1-- !' I
r I -l -- ·: I
I I I 550 600 650
---
550 600 650
- -
~ --- r---oDESSA LUFKIN FIELD 2000psi. -DALLAS ---SAN ANTONIO _ I ___ - .___ -- L- - _,__ -- -- ---0
0 50 100 150 200 250 300 350 400 450 . 500 550 600 650
AGE- DAYS AFTER LOADING
800
! I I
; I
600
- - ---- - ------ ------1-----:=l=~-- ------ -- - -·--_..,.:::::'! --::::;::= t=-.::.==:= t:=.--==--=-=------ - I
-=----ODESSA LUFKIN LABORATORY ~000 PSI ~('~ 1-"
i ~ DALLAS --- SAN. ANTONIO . i
400
200
0 0 550 600 650 450 500 150 200 250 300 350 400 50 100
AGE-DAYS AFTER LOADING
FrGURE 8- CREEP CURVES FOR THE FOUR LOCATIONS

all the physical properties of aggregate which influence creep of concrete,
the modulus of elasticity of the aggregate is probably the most important
factor. The higher the modulus the greater restraint offered by the aggregate
to the potential creep of the paste. It is seen in Table 3 that the Odessa
concrete had a lower modulus of elasticity than the other concretes. This
means that more strain, or deformation, occurred per unit of stress for
the Odessa concrete than for the other concretes. It is probable that the
Odessa aggregate had a lower modulus of elasticity than the other aggregates
thus making it an important factor influencing the creep of that concrete.
!t is not possible to distinguish separate effects of temperature or
relative humidity from the limited weather data. It is noted, however, that.
~he total effect is of primary interest. Now,if a comparison of creep values
at ·sao days is made between specimens from the same concrete, but different
storage environments, it should be possible to see the effect of the environ-
ment on the creep of that concrete. It is seen from Table 4 that the creep
values from a varying environment of the field are greater than the creep
values at a constant environment of the laboratory. Storage location had
little effect on creep values of the San Antonio concrete which indicates
that the environment of the field storage location was about the same as the
laboratory. In contrast, it is seen that the creeps from field stored concrete
at Dallas, Lufkin, and Odessa locations were increased approximately 15, 19,
and 26 percent respectively, over companion laboratory stored specimens.
Hansen and Mattock (3) recognized that a changing humidity, as encountered
in the field, will cause greater creep than will a constant condition of
humidity.
32

The creep coefficient of a concrete, ratio of creep to elastic strain,
gives the designer useful information about long term behavior of the material
under load when its elastic behavior is known. The coefficients shown in
Table 4 were found from data in Tables 3 and 6. The modulus of elasticity
of the materials at release were used to determine elastic strains, and these
strains are relatively high because of the low moduli at the very early age
of release.
Functions for Creep ~ Shrinkage
Several methods have been proposed for the prediction of creep and
shrinkage for design. Reference 5 contains an excellent discussion on
prediction of creep and shrinkage.
Hyperbolic functions are easily developed to represent measured creep
and shrinka~e data and they readily lend themselves to computer applications.
Such functions have been selected to represent the data collected for this
report. The functions have the following form:
where
e:oo sh
T
A
e: cr
e: = sh
= shrinkage strain,
= maximum shrinkage strain to which e:sh
approaches asymptotically,
= time in days since measurements began,
= constant, approximately the time required for
e:sh to reach one half e:~h ,
= e:oo T cr
B + T
33
(1)
(2)

where
e = unit creep strain, cr
goo = maximum unit creep strain to which e cr cr approaches asymptotically,
T • time in days since application of load,
B • constant, approximately the time required
for e to reach one half e cr · cr
The functions have been developed for both shrinkage and creep curves
in the form of equations (1) and (2) and are summarized in Table 6. The
hyperbolic functions show the similarity in creeps of the Dallas, San Antonio,
and Lufkin concretes and that similarity can be seen in the curves. However,
there is enough difference in the curves as to affect the results of computed
camber based on these functions for shrinkage and creep. Sinno (6) stated
that unit creep strains influence camber growth directly and need to be
estimated within± 35 x 10-6 in./in. to have an accuracy of± 0.1 in. of
maximum computed camber.
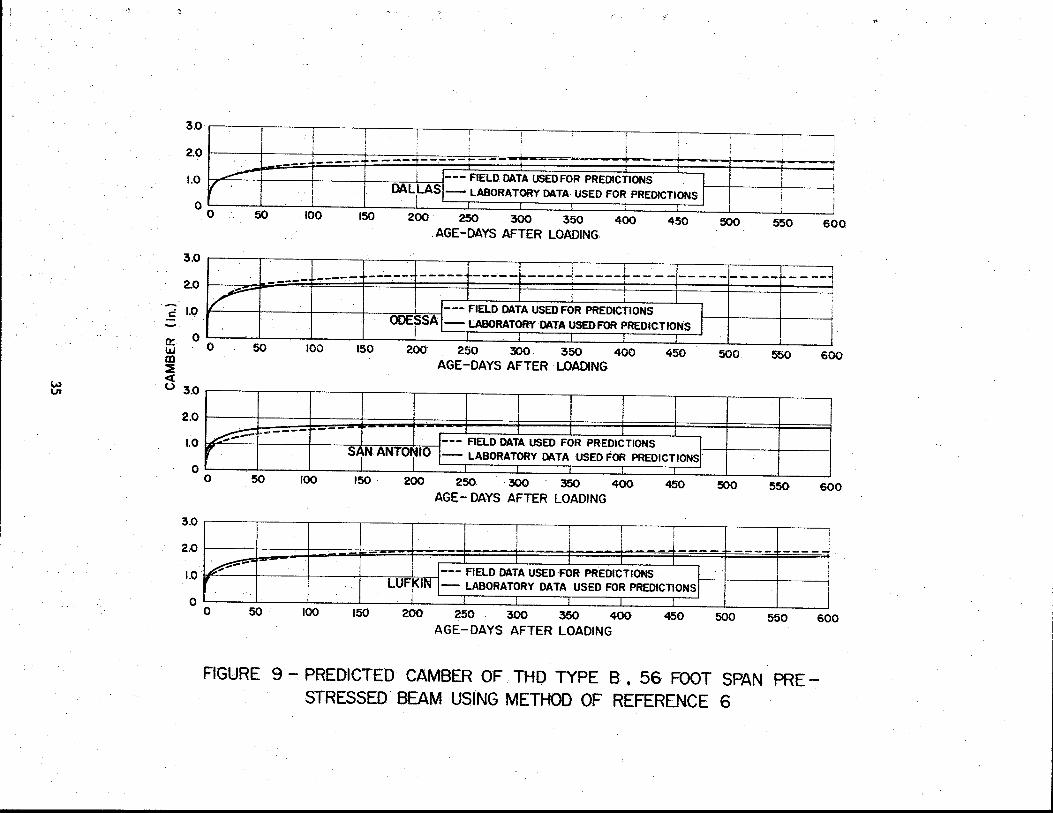
The step-by-step method used in References 1 and 6 has been
used with creep and shrinkage functions of Table 6 to make predictions of
maximum camber. The beam used for the predictions is a 56 ft long simply
supported Texas Highway Department Type B beam with thirty-two 7/16 in•
diameter prestressing strands tensioned to 18.9 kips per strand. No ex-
ternal load is applied to the beam. Those predicted maximum cambers are
shown in Figure 9. It is seen from that figure that the camber predictions
34
~
3.0 ! I I
' I I [ I ' I i I I i l I ' I ___ ..j. _____ - __ ...., - - ·r- -2.0
1.0 ~ l l J--- FIELD. DATA USED FOR PREDICTIONS I f ' v I DALILASI- LABORATORY DATA USED FOR PREDICTIONS J I i l
50 100 150 200 250 300 350 400 .AGE-DAYS AFTER LOADING
450 500 550 600 00
3.0 I
~--~- -----. ----- ·----- -----l-----+--- --1----- ----- ----..f
~ 2.0
c I.Q
0: 0 0 LLI m ::E <(
u 3.0
2.0
-----
50 100
~ ----- ---1.0 -r
0 0 50 100
3.0
2 . .0
1.0 ~-...
0 0 50 100
I
I : 1--- FIELD DATA USED FOR PREDICTIONS l i
oo~rsA 1·- LABORATORY DATA USED FOR PREDICTIONS I I 150 200' 250 300 . 350 400
AGE -DAYS AFTER LOADING 450 500 55.0 GOO
!--~ FIELD DATA USED FOR PREDICTIONS )r-S~N ANT,IO l- LABORATORY DATA USED FOR PREDICTIONS.
150 . 200 250 300 350 400 450 500 550 600 AGE- DAYS AFTER LOADING
I 1 ! - --- _ _. - -I r--- FIELD DATA USED FOR PREDICTIONS l
LUFiKIN 1- LABORATORY DATA USED FOR PREDICTIONS! l 150 200 250 300 350 400 450 500 550 600
AGE-DAYS AFTER LOADING
FIGURE 9 - PREDICTED CAMBER OF. THO TYPE B • 56 FOOT SPAN PRESTRESSED. BEAM USING METHOD OF REFERENCE 6

will vary depending upon the creep and shrinkage functions used. Camber
predictions based on laboratory data were practically the same as those
based on field storage for the San Antonio concrete. Similar comparisons
of predicted cambers at Odessa, Dallas, and Lufkin show that the cambers
based on functions from field data are approximately 13, 12, and 10 per-
cent respectively greater than cambers based on functions from laboratory
data.
TABLE 6. Summary of Functions for Shrinkage and Creep
Concrete Producer FIELD DATA LABORATORY DATA
Location shrinkage Creep Shrinkage Creep
Dallas 315 T* 440 T 500 T 365 T 20 + T 60 + T 15 + T 40 + T
Odessa 525 T 675 T 650 T 525 T 10 + T 40 + T 20 + T 25 + T
San Antonio 380 T 400 T 500 T 385 T 25 + T 50 + T 20 + T 25 + T
Lufkin 290 T 460 T 450 T 430 T 25 + T 50 + T 25 + T 45 + T
** Houston 350.T 225 T
6 + T 15 + T
* T - Time in days
** Data from Reference 1. Beam L3-5
36
;\
~

('·
The difference in material and cyclic differences of relative humidity
and temperature at the various locations determine values of parameters in
the parabolic functions which appear in the creep and shrinkage functions
used in making the camber predictions. The range, minimum to maximum values
from Figure 9, of the mid-span camber presented in Figure 10 reflects those
differences. Also shown in Figure 10 is the predicted and measured camber
for beam L3-5 of Reference 1; · a 56 ft long Texas Highway Department Type
B beam. It can be seen from Figure 10 that the use of creep and shrinkage
data developed in Houston, Texas to predict camber for a similar beam made
artd stored at any of the locations reported here could underestimate the
camber by as much as lOOpercent. Thus it is seen that materials and
environment can have a great influence on camber prediction of prestressed
concrete. bridge beams. The designer should have information on the particular
materials used in the design as well as the behavior of concretes in the area
of installation in order to make close predictions of the service behavior
of the structure.
37

-c 3.0
-2.0
a::: w
.w m 1.0 QO ~
<:( (.) 0
0 50
MID-SPAN CAMBER FOR BEAM l3-5, REFERENCE 6, IN HOUSTON,TEXAS ENVIRONMENT ......... BOTH MEASURED AND PREDICTED
100 150. 500 200 250 300 350 400 450 550 600
AGE DAYS
FIGURE 10 - RANGE OF CAMBERS FROM FIGURE 9
'.>

CONCLUSIONS
This research was undertaken to determine the influence of materials
and environment, typical of four geographical areas of Texas, on creep and
shrinkage of plain concrete. Tests on specimens designed for collection of
time dependent Strains of loaded and non-loaded concretes were collected to
reach the objective of this research. The shrinkage strains were measured
for non-loaded 3 x 3 x 16 in. prisms. The total strains,· measured from.
prisms loaded parallel to their axis, were used to determine the creep
strains by subtracting the elastic and shrinkage strains and dividing by
the applied stress.
Duplicate sets of specimens cast at Dallas, Odessa, San Antonio, and
Lufkin were made and cured alongside pretensioned prestressed beams fab
ricated for the Texas Highway Department. One set was stored near the
place of fabrication and the other set stored in the laboratory at 73°F,
SO percent relative humidity for the duration of the test.
Conclusions
On the basis of test conditions and results reported herein, the
following conclusions may be made:
1. Climatic conditions under which concrete is stored influences
both creep and shrinkage.
a. Shrinkage of specimens stored in open air at (or near) place
of fabrication was not as great as that of companion specimens
stored in the laboratory under conditions of constant tem
perature and relative humidity according to these ratios:
39

Place
Dallas
Odessa
·San Antonio
Lufkin
Ratio: Field shrinkage/Laboratory shrinkage (at 500 day age)
0.62
0.82
0.75
0.65
b. Creep of specimens stored in open air at (or near) place of
fabrication was greater in three out of four cases, than that
of companion specimens stored in the laboratory under conditions
of constant temperature and relative humidity according to these
ratios:
Place Ratio: Field creep/Laboratory (at 500 day age)
creep
Dallas 1.14
Odessa 1.26
San Antonio 0.97
Lufkin 1.20
2. Computations for camber of prestressed beams, using the method
discussed in this report, should be based on creep and shrinkage
data from concrete made from the same materials and stored in the
same area as the structure of which the beams are to be an integral
part.
3. Shrinkage and unit creep may be expressed as hyperbolic functions
of time.
40

Recommendations
In computations for prestress loss and camber of prestressed beams,
creep and shrinkage should bedetermined as nearly as practicable for the
concrete and location of the structure. Information on the materials used
in the concretes of this study is contained in Tables 2 and 3 of the report,
and the locations are given 'for sources of the materials. For those
locations and materials the final (old age) shrinkage and creep values
should be those found in the study, namely: -~-
Dallas Odessa San Lufkin . -6 Antonio
Shrinkage (10 in. /in.) 315 525 380 290 -6
440 675 400 460 Unit creep (10 in./ in. /ksi)
The functions developed for shrinkage and creep of the materials in
the locations of the field tests may be used with the prestress loss and
camber computer program repotted in Reference 1. Those functions are:
San Dallas Odessa Antonio Lu_fkin
' -6 315 T 380 T 290 'l' Shrinkage (10 in./in.) 525 T 20 + T 10 + T 25 + T 25 + T
-6 440_T 675 T 400 T 460 T Unit creep (10 in./in./ksi) 60 + T 40 + T 50 + T 50 + T
In all cases, T is the time in days of age, assuming that measurements
began at one day age at time of prestressing.
c
41

REFERENCES
1. Furr, Howard L•, Sinno, Raouf, and Ingram, Leonard L., "Prestress Loss and Creep Camber in a Highway Bridge with Reinforced Concrete Slab on Pretensioned Concrete Beams," Research Report 69-3 (Final) Texas Transportation Institute, Texas A&M University, Coliege Station, Texas, October 1968.
2. u.s. Department of Connnerce, Climatological Data, National Oceanic and Atmospheric Administration, Environmental Data Service, National Climatic Center, Federal Building, Asheville, North Carolina 28801
3. Hansen, Torben C. and Mattock, Alan H., "Influence of Size and Shape of Member·ort the Shrinkage and Creep of Concrete," J. ACI February, 19~6 Proc. Vol. 63, pp. 267-290.
4. Neville, A. M., "Hardened Concrete: Physical and Mechanical Aspects," American Concrete Institute, Monograph No. 6, 1971.
5. Designing for Effects of Creep, Shrinkage, Temperature in Concrete Structures, American Concrete Institute, Special Publication No. 27, 1971, 430 pp.
6. Sinno, Raouf, "The Time;..Dependent Deflections of Prestressed Concrete Bridge Girders,'i Dissertation, Texas A&M University, 1968.
42
--'