Credit Scoring and Loan Default · lenders to accurately measure credit risk. In some scenarios,...
30
Research Division Federal Reserve Bank of St. Louis Working Paper Series Credit Scoring and Loan Default Geetesh Bhardwaj and Rajdeep Sengupta Working Paper 2011-040A http://research.stlouisfed.org/wp/2011/2011-040.pdf October 2011 FEDERAL RESERVE BANK OF ST. LOUIS Research Division P.O. Box 442 St. Louis, MO 63166 ______________________________________________________________________________________ The views expressed are those of the individual authors and do not necessarily reflect official positions of the Federal Reserve Bank of St. Louis, the Federal Reserve System, or the Board of Governors. Federal Reserve Bank of St. Louis Working Papers are preliminary materials circulated to stimulate discussion and critical comment. References in publications to Federal Reserve Bank of St. Louis Working Papers (other than an acknowledgment that the writer has had access to unpublished material) should be cleared with the author or authors.
Transcript of Credit Scoring and Loan Default · lenders to accurately measure credit risk. In some scenarios,...

Research Division Federal Reserve Bank of St. Louis Working Paper Series
Credit Scoring and Loan Default
Geetesh Bhardwaj and
Rajdeep Sengupta
Working Paper 2011-040A http://research.stlouisfed.org/wp/2011/2011-040.pdf
October 2011
FEDERAL RESERVE BANK OF ST. LOUIS Research Division
P.O. Box 442 St. Louis, MO 63166
______________________________________________________________________________________
The views expressed are those of the individual authors and do not necessarily reflect official positions of the Federal Reserve Bank of St. Louis, the Federal Reserve System, or the Board of Governors.
Federal Reserve Bank of St. Louis Working Papers are preliminary materials circulated to stimulate discussion and critical comment. References in publications to Federal Reserve Bank of St. Louis Working Papers (other than an acknowledgment that the writer has had access to unpublished material) should be cleared with the author or authors.
Credit Scoring and Loan Default
Geetesh Bhardwaj� Rajdeep Senguptayz
August 2011
Abstract
This paper introduces a measure of credit score performance that abstracts from thein�uence of �situational factors.�Using this measure, we study the role and e¤ectiveness ofcredit scoring that underlied subprime securities during the mortgage boom of 2000-2006.Parametric and nonparametric measures of credit score performance reveal di¤erent trends,especially on originations with low credit scores. The paper demonstrates an increasingtrend of reliance on credit scoring not only as a measure of credit risk but also as a meansto o¤set other riskier attributes of the origination. This reliance led to deterioration in loanperformance even though average credit quality� as measured in terms of credit scores�actually improved over the years.JEL Codes: G21, D82, D86.Keywords: credit score, information sharing, subprime, performance
�Geetesh Bhardwaj, Director - Research, SummerHaven Investment Management. The views expressed hereinare those of the individual author and and do not necessarily re�ect the o¢ cial positions of SummerHavenInvestment Management.
yEconomist, Federal Reserve Bank of St. Louis. The views expressed are those of the individual author anddo not necessarily re�ect o¢ cial positions of the Federal Reserve Bank of St. Louis, the Federal Reserve System,or the Board of Governors.
zCorrespondence: Research Division, Federal Reserve Bank of St. Louis, P.O. Box 442, St. Louis, MO63166-0442. Phone: (314) 444-8819, Fax: (314) 444-8731, Email: [email protected].
1

1 Introduction
Over the last couple of decades, technological advances and private arrangements of information
sharing have increased the use of credit scoring in almost all forms of loan origination (Altman
and Saunders, 1998). However, the use of credit scoring is not without its limitations (Mester,
1997; Avery et al. 2000). For example, origination credit scores cannot account for �situational
factors� such as local economic conditions or business cycle peaks and troughs (Avery et al.
2004). However, despite such limitations, most approval processes continue to use credit scores
as a measure of borrower creditworthiness at the time of loan origination (Avery et al., 2003;
Brown et al, 2010). Therefore, it is important for both academics and policymakers alike
to evaluate the usage and performance of credit scoring as a measure of credit risk on the
origination.
In this paper, we introduce a simple metric of credit score performance that abstracts from
situational factors described in Avery et al. (2004). This metric helps us determine the impact
of credit scoring and its usage in terms of observed loan performance data. To this end, we
study the role and e¤ectiveness of credit scoring that underlies subprime securities during the
mortgage boom of 2000-2006. Studying the sample of subprime borrowers is important for
two reasons.1 First, the securitized subprime market has rapidly evolved since the turn of this
century. Hence, a study of the loans from this time period allows us to understand the role of
credit scoring for a full credit cycle� that is, from the early years of this market, through its
�boom years,�until its ultimate collapse.
Second, it helps us understand the role played by credit scoring in the structure and per-
formance of the some of the riskiest securities to trade in global �nancial markets. While there
are historical examples of lending to the riskiest segments of the population, the use of credit
scoring to quantify credit risk in such segments is a fairly recent phenomenon and this study
allows us to derive important policy lessons on the usage of credit scoring in subprime mar-
kets. Such policy questions are increasingly relevant given the recent re-emergence of subprime
mortgages even after the collapse of this market in 2008.2
This paper presents evidence demonstrating an increased reliance on credit scoring over the
cohorts from 2000 through 2006 in the securitized subprime universe. This reliance in turn led
to an increase in credit scores on subprime originations over the years� not only in absolute
terms, but also after adjusting for other attributes on the origination. The increase in credit
scores was largely restricted to subprime originations and cannot be explained by changes in
the credit scores for the overall (credit-eligible) U.S. population.3 In addition, we �nd strong
1 In an earlier study, Pennington-Cross (2003) examined the contrasting performance of credit scoring for theprime versus subprime mortgage market. For a survey of recent work on subprime mortgages and the recenthousing crisis during this period, see Levitin and Wachter (2010) and Agarwal et al. (2010).
2Androitis (2011) provides anecdotal evidence of the re-emergence of subprime loans in the U.S.3Anecdotal evidence has been provided showing that credit scoring itself is subject to manipulation (Foust
2

evidence to suggest that higher credit scores on originations were used not only as a measure
of determining ex ante credit risk, but also as a means to adjust for other riskier attributes of
the origination� such as lack of full documentation and higher loan-to-value (LTV) ratios.
In order to determine how this adjustment a¤ects credit quality, we introduce a simple
metric for credit score performance in terms of ex post loan performance. Our metric the
di¤erence between the survival probabilities for originations in a higher credit score group and
that for originations in its immediately lower credit score group within the same cohort. This
measure, calculated for both high and low levels of credit scores, is tracked over the cohorts from
2000 through 2006.4 Signi�cantly, our metric has two advantages. First, it helps abstract from
situational factors that are known to vary with each cohort: for example, key macroeconomic
indicators, local unemployment rate, and house price trends. Second, we can obtain both
nonparametric and parametric estimates of this metric. The nonparametric estimates use the
Kaplan and Meier (1958) product limit estimator, whereas the equivalent parametric estimates
are extracted from the Cox (1972) relative risk hazard model.
As we demonstrate below, nonparametric and parametric measures reveal di¤erent trends in
credit score performance depending on the level of credit scores. At low levels of credit scores,
nonparametric estimates show deterioration in credit score performance over the cohorts. In
contrast, this trend of deterioration is reversed when we control for other attributes on the
origination: Our parametric estimates at low credit score levels reveal an improvement in credit
score performance. On the other hand, credit score performance for high credit scores levels
shows improvement over the same years� in terms of both our non-parametric and parametric
measures.
These results can be explained in terms of the patterns of credit score usage described above.
Signi�cantly, the usage patterns also vary with the credit score level. For low credit-score levels,
there is strong evidence of increase in credit scores over the cohorts with increased riskiness in
other origination attributes. As a result, credit score performance at low levels of the credit
score shows deterioration over the cohorts in terms of our non-parametric measure. For the
same reason, this declining trend is reversed if we control other origination attributes: We
record an improvement in credit score performance in terms of our parametric measure.
The pattern is somewhat di¤erent at high credit score levels� the pattern of adjustment of
riskier attributes with higher credit scores is not signi�cantly large to begin with and remains
roughly unchanged over the years. Therefore, in terms of both parametric and nonparamet-
ric measures, credit score performance at high credit score levels shows improvement over the
cohorts. In summary, although our results provide little evidence of deterioration in the perfor-
and Pressman, 2008). In such cases, increases in a borrower�s credit score occur without any increase in theircreditworthiness. We discuss this issue in greater detail in Section 6.
4Needless to say, the exact numerical estimates vary with the grouping of credit scores. However, as shownbelow, all results in the paper are robust to di¤erent groupings of credit scores (see Appendix).
3

mance of credit scores per se, they question the pattern of credit score usage over the cohorts.
The results in this paper �nd broader support in the literature on credit scoring and infor-
mation sharing. Lenders evaluating an application for credit either collect information from the
applicant �rst-hand or receive this information from agencies and credit bureaus. Such infor-
mation primarily includes the prior credit history of the borrower. Credit scoring is described
as a summary measure of this information set on the borrower in terms of a single metric or
score that is viewed as a measure of future credit risk. Theoretical studies have demonstrated
the importance of information sharing in mitigating the problems of adverse selection (Jappelli
and Pagano, 1993), moral hazard (Vercammen, 1995; Padilla and Pagano, 2000) and overlend-
ing (Bennardo et al., 2009) that plague credit markets. Most of these studies predict that
information sharing lowers default rates for the individual borrower. Several empirical papers
and experimental studies have con�rmed these predictions (see Brown et al., 2009, Brown and
Zehnder, 2010 and references therein).
However, information sharing and can also a¤ect credit market outcomes adversely. This
can happen in several ways. First, information sharing potentially enhances the ability of
lenders to accurately measure credit risk. In some scenarios, this may increase lending volumes,
especially to borrowers of low credit quality. Therefore, while information sharing is likely to
reduce default rates for a given credit grade, aggregate default rates may increase because of
an increase in the proportion of lower-grade borrowers in the credit-eligible pool (Brown et al.,
2009). Second, information sharing has been shown to increase default rates by reducing the
incentives for screening. Keys et al. (2010) demonstrate how securitization distorts incentives
with lax screening on higher credit grades in comparison with those with lower grades. Using a
regression discontinuity design, they �nd paradoxically higher default rates on borrowers with
marginally higher credit grades around an ad hoc screening cuto¤.
This study points to a third way in which information sharing has led to adverse credit
market outcomes. In the case of subprime mortgages, there was an attempt over the years to
increase origination credit scores as a means of compensating for the increased risk in other
originations attributes. As demonstrated below, this pattern of loan origination led to higher
default rates on originations of later cohorts especially those with low credit scores. In con-
clusion, we observe that over-reliance on credit scoring to the extent of including other riskier
attributes on the origination can become common practice and can have deleterious e¤ects on
market outcomes. Notably, the deterioration in loan performance occurs even though average
credit quality (as measured in terms of credit scores) actually improved over the cohorts.
The data and trends on credit scores in the securitized subprime universe are described in
Section 2. Section 3 discusses the patterns of credit scoring use over the various cohorts. The
parametric and nonparametric measures are explained in Section 4 and their estimates of credit
score performance are provided in Section 5. Section 6 concludes.
4

2 Data and Trends in Credit Scoring
We use loan-level data on over nine million �rst-lien mortgage originations from the CoreLogic
Loan Performance data repository on B&C securities (subprime mortgages) during 2000-2006.5
Among other elements of the mortgage contract, the data include a measure of ex ante credit
risk� namely, the borrower�s FICO score at origination.6 Figure 1 shows the cumulative distri-
bution function (cdf) of the FICO scores on subprime originations of earlier cohorts (2000-02,
in red) along with those of later cohorts (2004-06, in black). The �gures show that the proba-
bility that a subprime borrower has a lower credit score is signi�cantly higher on originations
during earlier cohorts than on originations of later cohorts. Clearly, origination FICO of sub-
prime mortgages improved signi�cantly over time. Using more formal methods below, we verify
that the distribution of credit scores on later cohorts �rst-order stochastically dominates the
distribution of credit scores on earlier cohorts (Rothschild and Stiglitz, 1970).
An important concern here is whether the observed improvement is due to a shift in the
underlying distribution of FICO scores for the entire U.S. We con�rm that changes in the bor-
rower density for the credit-eligible population for the U.S. cannot explain the full improvement
in the credit quality on subprime originations. In order to show this, we obtain the population
credit scores for the U.S. from the FRBNY-Equifax Consumer Credit Panel, which comprises a
5 percent random sample of U.S. individuals (aged 19 and over) with credit reports from 1999
to 2009 (Lee and Van der Klaauw, 2010).7 The results are plotted in dotted lines in Figure 1.
At higher credit scores, the cdf of credit scores on subprime originations is above those for the
population. This is expected, since borrowers with higher credit scores are less likely to opt for
a subprime mortgage (Pennington-Cross, 2003). Next, for the lowest credit scores, the cdf on
originations is below those for the population. Again, there is likely to be a greater proportion
of borrowers with lower credit scores in the population than among those with subprime mort-
gages. Finally, the data reveal a marginal improvement in the credit score distribution from
2000-2002 to 2004-2006 for the population as well.
However, while we �nd that the improvement in credit scores on subprime originations
is statistically signi�cant across these cohorts, this is not the case for borrowers in the entire
population. For example, Figure 2 compares the credit scores on subprime originations (cohorts)
5 It is widely regarded as a comprehensive database for subprime originations and captures over 90 percent ofthe mortgages that have been securitized as subprime. Details on this database; including its evolution, coverage,and comparison with other mortgage databases, are available in GAO (2010).
6The FICO score is the best-known and most widely used credit score model in the United States. It isstatistical summary measure of information from a consumer�s credit �les and ranges between 300 and 850. FairIsaac (2007) claims, "A credit score is a number that summarizes your credit risk, based on a snapshot of yourcredit report at a particular point in time. A credit score helps lenders evaluate your credit report and estimateyour credit risk."
7Strictly speaking, the credit scores obtained from this longitudinal panel are derived from the methodologyused by Equifax to mimic the proprietary algorithm used by Fair Isaac Corporation. Therefore, while they area close match, the credit scores for each individual may not be identical under the two algorithms.
5
of 2000 and 2006 with those in the population for the same years. As before, the cdf of credit
scores on subprime originations of 2006 �rst-order stochastically dominates that on subprime
originations of 2000. However, with the population credit scores for the same years, we fail to
establish the case for �rst-order stochastic dominance.
2.1 Test for Stochastic Dominance: Subprime Originations and U.S. Popu-lation
The hypotheses stated above are best veri�ed in terms of the statistical tests for stochastic
dominance developed in Anderson (1996). Following Anderson (1996), the hypothesis of �rst-
order stochastic dominance of distribution A over B is tested by comparing the two cdfs at
various points in the distribution.
Let xA and xB be the empirical frequency vectors based on samples of size nA and nB,
drawn respectively from the population distributions A and B. The Anderson test of stochastic
dominance is based on a comparison of the cumulative distributions FA(�) and FB(�) at thedeciles of the pooled sample. Anderson also shows that under the null of common population
distribution (no dominance), and the assumption of independence of the two samples,
� =xAnA
� xBnB
is asymptotically normally distributed with mean zero. The hypothesis of �rst-order dominance
of A over B requires that no element of � be signi�cantly greater than zero while at least one
element is signi�cantly less.
Panel A of Table 1 presents the results of the test for credit scores during 2004-2006 over
those during 2000-2002. The numbers in the second column show, for each decile of credit scores,
the di¤erence in the cumulative probabilities across the distributions (cohorts) for subprime
originations. We also report the 95% con�dence intervals for the di¤erences in parentheses
below. The third column reports t-statistics for the test of signi�cance. The same results for
the population are then presented in the fourth and �fth columns.
For both subprime originations and the general population, the distribution of credit scores
on later cohorts is seen to stochastically dominate those on earlier cohorts. However, at all
deciles (save the last, with highest credit scores) the di¤erence in probabilities for the subprime
originations are signi�cantly greater than that for the population. For example, the probability
of having a FICO score greater than 600 (the fourth decile) is 11.63 percent higher for later
cohorts in subprime originations, but it is only 0.46 percent higher in the general population.
Panel B of Table 1 presents the results of the Anderson (1996) test for �rst-order stochastic
dominance of the credit score distribution of 2006 over that of 2000. For the credit score distrib-
ution on subprime originations, the null of no dominance is rejected in favor of the alternative of
6

�rst-order stochastic dominance. However, we fail to establish �rst-order stochastic dominance
for the same years in the population credit distributions. In particular, one �nds that for the
�fth decile, the di¤erence � is signi�cantly greater than zero. In summary, our results indicate
that the distribution of credit scores on later cohorts is seen to stochastically dominate those
on earlier cohorts. For credit score distributions on subprime originations, this di¤erence is
both economically and statistically signi�cant. However, the improvement in credit risk for the
population is at best marginal and not always signi�cantly di¤erent across the di¤erent cohorts.
3 Use of Credit Scoring on Originations
Why were credit scores higher for subprime originations in later years? This feature of the data
is best understood when one considers that there was an increase in credit risk in terms of other
characteristics on the origination. As has been well documented, there has been an increase
in the proportion of originations with higher LTV and originations lacking full documentation
over the years in our sample (see Mayer et al., 2009). Below, we present evidence to show
that lenders� sought to temper overall risk on the origination by increasing FICO scores on
originations with other riskier attributes such as higher LTV and the lack of full documentation
on the mortgage.
Table 2 reports the percentage of loans that provide full documentation and those without
full documentation under various FICO score groups (panel A). Panel B shows the percentage of
loans under various FICO score groups for di¤erent intervals of LTV. In all FICO score groups
shown in Table 2, there is a decline in the percentage of borrowers in the lowest FICO group
(<620) with an increase in the percentage of borrowers in the next two categories, namely,
620-659 and 660-719. The percentage of borrowers in the highest category (�720) throughoutthe years remains roughly the same. This result suggests an overall increase in credit score on
both high- and low-risk originations.
Panel A of Table 3 reports the coe¢ cients of a least-squares regression of FICO scores on
other origination attributes by cohort. While we do not intend to attribute any causal inter-
pretation, the results demonstrate the equilibrium relationship between credit scores and other
origination characteristics. Not surprisingly, most of the coe¢ cients have the expected sign� for
example, origination credit scores increase with the LTV and the lack of full documentation on
the origination. Moreover, an increase in the magnitude (absolute values) of these coe¢ cients
over the cohorts appears to suggest that the strength of adjustment of increased FICO for riskier
attributes increased over this period. The evidence suggests that the increase in credit scores
over the cohorts can be explained in large measure as adjustment for the increased riskiness in
other attributes on the originations. Panel B of Table 3 reports the estimates for the full sample
(all cohorts) of the regression presented in Panel A. In addition to the regressors in Panel A,
Columns (1) and (2) include dummy variables that take the value 1 for cohorts 2003-2006 and
7
2004-2006 respectively; and zero otherwise. The results show that even after adjusting for other
attributes on the originations there is an overall increase in FICO scores from the earlier cohorts
to the later cohorts. Accompanying the increase in credit risk exposure on certain origination
attributes (such as lack of full documentation and high LTV) was a trend that attempted to
o¤set this higher credit risk by increasing the average quality of borrowers (as measured by
their credit scores) to whom such loans were made. Taken together the evidence suggests that
not only did FICO scores increase over the cohorts for high-risk and low-risk originations, but
also that these credit scores were increasingly used to adjust for other riskier attributes on the
origination.
The evidence of an overall increase in credit scores prompted assertions that creditworthy
prime borrowers may have been misled by originators into subprime products (Brooks and
Simon, 2007). However, consistent with the evidence presented above, Foote et al., (2008)
argue that originations to borrowers with such high credit scores were marked as subprime
because of other attributes on the origination. In order for borrowers with such high credit
scores to originate prime mortgages, the risk on other attributes of the origination would have
to be lower as well. In summary, originations of later cohorts include a signi�cantly large
proportion of borrowers with higher credit scores. However, as noted previously, these high
credit scores were used to o¤set other riskier attributes on the origination.
As mentioned earlier, we are not the �rst to observe this trend over the subprime cohorts
towards higher FICO scores. Practitioners have often referred this phenomenon as a movement
in the subprime segment towards the Alt-A market segment (Bhattacharya et al., 2006). Some
observers have even described this as a creation of �the Alt-B�market segment (Zimmerman,
2006).8 This leads to some obvious queries: Could high origination credit scores o¤set other
riskier attributes on the origination? Did the performance of FICO scores withstand the sit-
uational factors, such as the reversal in home price increases around 2005-2006? We attempt
to answer these questions in the next two sections, where we �rst devise a metric for FICO
score performance and then examine how such scores performed over the cohorts of subprime
mortgages.
4 A Performance Metric for Credit Scoring
In this section, we study the performance of ex ante credit scoring as measures of credit risk in
terms of ex post default. Any accurate measure of credit score performance needs to distinguish
between information available at the time of origination and events that occur subsequent to
the origination of the loan. Otherwise, the metric of origination credit score performance is
8For example, Zimmerman (2006, p. 106) observes, �... FICOs in subprime at 624 in 2004 are at a recordhigh level. In part, the increase in subprime FICOs re�ects the rapid move by subprime issuers into the lowerend of the Alt-A market, sometimes referred to as the Alt-B or the �gap�part of the non-agency market.�
8
biased by situational factors that in�uence default. Keeping this in mind, we opt for a metric
for credit score performance that is independent of the year of origination.
Our metric for credit score performance is the di¤erence in survival probabilities for an
origination with a higher FICO in comparison to one with a lower FICO in the same cohort.
We derive nonparametric and parametric estimates of this di¤erence in probabilities. For ease
of exposition, we split our sample into originations belonging to di¤erent FICO score groups.
Next, we calculate, as a �rst pass, the nonparametric estimates of the (unconditional) survival
probabilities for originations within each FICO score group. As a result, our measure of origina-
tion credit score performance is the di¤erence in the survival probabilities of a given origination
FICO score group to that of its immediately lower FICO score group of the same cohort. Since,
both credit score groups are of the same cohort they are each subject to the same underwriting
trends and macro shocks (events), allowing us to net out the e¤ects of these factors in our
measure of credit score performance. We formalize our measure below.
4.1 Nonparametric Estimates
Formally, the survival probability of a 90-day delinquency event beyond loan age t is given by
S(t) � P (T > t), where T denotes the duration in months from the month of origination. Let
t1 < t2 < ::: < tm denote the observed age in months at the time of event in a sample size of N
originations, N � m. Also, let nj be the number of surviving mortgages just prior to month tj .A surviving mortgage is de�ned as one that has neither defaulted nor been paid-o¤ prior to age
tj . If we de�ne dj as the number of mortgages that default at age tj , then the Kaplan-Meier
estimator of the survivor function is
SNP (t) � P (T > t) =Yjjtj�t
(1� djnj) =
Yjjtj�t
(1� �j) (1)
where �j =djnjis the nonparametric hazard estimate.
For ease of exposition, we split our sample into originations belonging to mutually exclusive
and exhaustive FICO score groups, F1; :::;Fn. To do this we de�ne n FICO group dummies,
f1; :::; fn such that fk = 1 if FICO score the origination lies in the interval Fk, k = 1; :::; n andzero otherwise.
Our measure of origination credit score performance Qck;k�1 is the di¤erence in the survival
probabilities of a given origination FICO score group to that of its immediately lower FICO score
group of the same cohort, c, where c = 2001; 2002::::; 2006. For the nonparametric measure, we
use the following
Qc;NPk;k�1(t) = ScNP (t; fk = 1)� ScNP (t; fk�1 = 1), (2)
where ScNP (t; fk = 1) is the nonparametric estimate of the survivor function, SNP (t), for cohort
9

c and FICO score group Fk.
4.2 Parametric Estimates
We turn to parametric measures of the metric wherein we derive the measure of credit score
performance after controlling for other origination characteristics. For parametric estimates,
the object of interest in a relative risk model is the hazard ratio (Cox, 1972), which has the
interpretation of a multiplicative change in the instantaneous probability of delinquency for a
marginal change in a particular risk characteristic:
h(t;x; �) = h0(t) exp(x�). (3)
The estimated hazard ratio (HR) for marginal change in risk characteristic xi is dHR(t; xi =xi+�xi) = exp(�xib�i), whereas the estimated hazard ratio for a given FICO score group, sayFk, is given by dHR(t; fk = 1) = exp(�fk=1), (4)
where �fk=1 is the coe¢ cient of the regression for the FICO score group Fk (or the FICO scoredummy, fk = 1). Combining (3) and (4) for FICO score group k, the instantaneous probability
of delinquency at age t is
h(t; fk = 1) = h(t; f1 = 1)�dHR(t; fk = 1), (5)
where h(t; fk = 1) is a parametric estimate of the hazard rate at age t for the FICO group Fk.We replace h(t; f1 = 1) with its nonparametric equivalent, �j(t; f1 = 1), given as
�j(t; f1 = 1) =d(t; f1 = 1)
n(t; f1 = 1),
where d(t; f1 = 1) is the number of delinquencies at age t with FICO scores in the interval F1and n(t; f1 = 1) is the number of number of surviving mortgages (not in default or prepaid)
at age t with FICO scores in the interval F1. Finally, we obtain an estimate of h(t; fk = 1).
Accordingly, the parametric estimates of the survivor function is calculated as
ScP (t; fk = 1) =Yjjtj�t
(1� hj(t; fk = 1)). (6)
Using (2), we obtain the parametric estimates of the performance metric as Qc;Pk;k�1(t).
10

5 Results
Table 4 reports the di¤erence (increase) in probability of surviving a 90-day delinquency event
two calendar years after origination.9 For the purposes of this analysis, we split the sample
into various FICO score groups. The results for two such groupings starting at a FICO of
540 are recorded here: the �rst at intervals of 40 points (Panel A) and the second at intervals
of 20 points (Panel B). The rows in Table 4 show the percentage-point increases in survival
probabilities for originations in a higher FICO score group relative to those in its immediately
lower FICO score group.10
Three features of the nonparametric estimates of di¤erences in survival probabilities as
shown in Table 4 are noteworthy. First, there is a deterioration of credit score performance
over the cohorts at low levels of FICO score (top rows in both panels). Second, the panels show
an improvement in credit score performance at high FICO score levels (bottom rows in both
panels). Third, these trends are robust if one considers bigger FICO score groups, and therefore,
bigger transitions as shown in Panel A. In contrast, the trends are signi�cantly noisier for smaller
FICO groups and therefore smaller jumps in FICO scores as shown in Panel B. These results
appear to suggest a degree of �lumpiness�to FICO scores. Having derived the nonparametric
(unconditional) measures of credit score performance on loan default, we turn to parametric
measures wherein we derive the measure of credit score performance after controlling for other
origination characteristics. In a web appendix to this paper, we demonstrate that the results
are robust if one uses di¤erent origination FICO score groups.
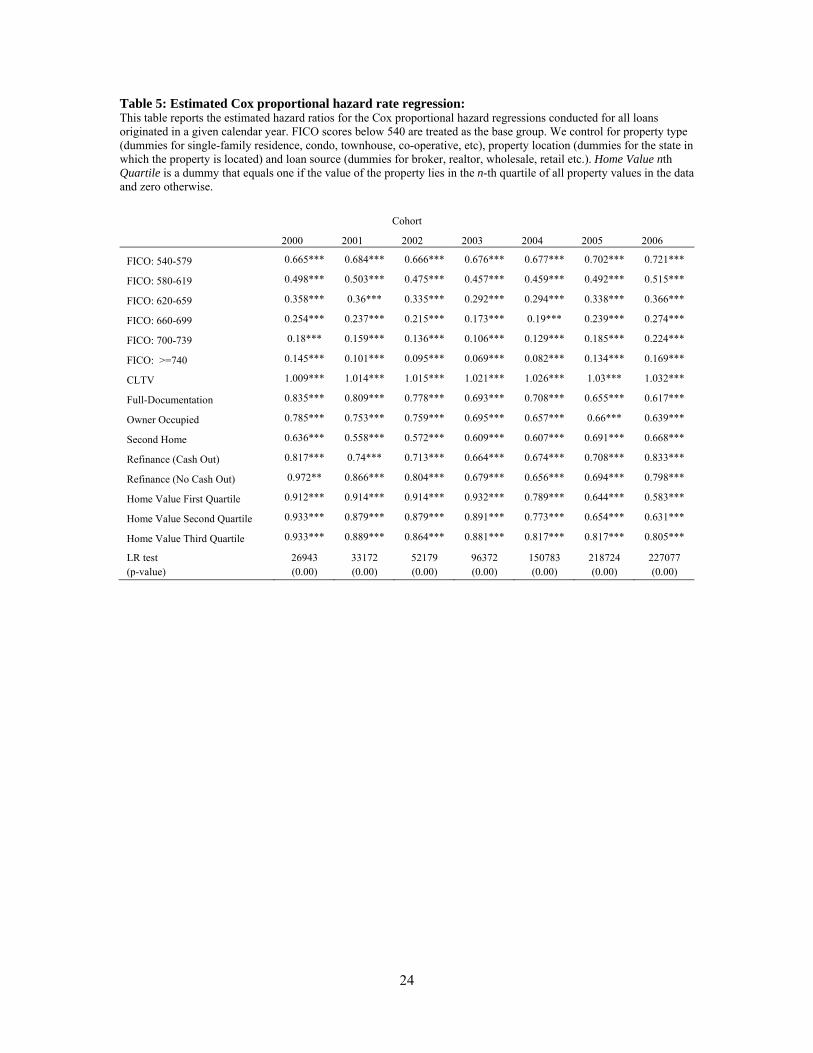
5.1 Parametric Measure of Credit Score Performance
We estimate the default regression (3) by using dummy variables for individual FICO score
groups. The groups selected for this regression are the same as those given in Panel A of Table
4. The estimated hazard ratios are provided in Table 5 with the dummy for the lowest FICO
score group (less than 540) chosen as the omitted dummy variable.
Table 6 reports the increases in probability of surviving a 90-day delinquency for originations
in a higher FICO score group relative to those in its immediate lower FICO score group, after
controlling for other attributes on the origination. For example, panel A of Table 6 shows
parametric estimates for the di¤erence in survival probabilities of adjacent FICO score groups
9The use of two calendar years as the size of the interval is motivated by the fact that most originations weredesigned in theory to ensure a re�nance in two years (Gorton, 2008). Also, we follow the standard conventionin using a serious delinquency (90-day delinquency) event as an indicator of default on the loan. Alternativede�nitions of default yield qualitatively similar results.10Clearly a valid comparison of two FICO groups that are in the 40- or 20-point interval requires that the two
groups have the same relative distribution of the sample. An alternative way of implementing this measure wouldinvolve measuring the increase in survival probabilities for a given increase in credit score and then averagingacross all credit scores in the FICO score group. This second method yields materially similar results and theresults are available on request.
11

such as those given in panel A of Table 4.11 Clearly, after controlling for other attributes on
the origination (as given by the regressions in Table 5), the increases in survival probabilities
show a signi�cant improvement over the cohorts. Notably, this result holds true for both high
and low FICO score levels. At low levels of FICO scores, the deterioration in performance as
seen in the nonparametric estimates (top rows in Table 4) above is now reversed (top rows in
Table 6). Controlling for other attributes on the origination shows an improvement in FICO
performance over the cohorts. Again this result holds at high levels of FICO, which means that
evidence from the nonparametric estimates continues to hold in the parametric case (top rows
of both panels in Table 6). In addition, once we control for other attributes on the origination,
the noise in the trends of nonparametric estimates in Table 4 is signi�cantly reduced in the
trends obtained from the parametric estimates in Table 6.
5.2 Low FICO scores versus High FICO scores
Comparing the survival probabilities in Table 4 with those in Table 6 reveals an interesting
trend. In the nonparametric case, we documented deterioration in FICO performance over the
cohorts for originations at low FICO levels (top rows in both panels of Table 4). However,
after controlling for other attributes, parametric estimates in Table 6 show that this trend is
reversed. In contrast, the nonparametric case recorded an improvement in FICO performance
at high FICO levels (bottom rows in both panels of Table 4). Notably, this trend continues to
hold even after controlling for other attributes on the origination.
To explain these trends, we study the pattern of other riskier attributes on the origination.
For the sake of exposition, we focus our attention on one such attribute, namely, LTV. Using
the adjacent FICO score groups listed in Panel A of Table 4, we plot the (kernel) density
functions for LTV for each adjacent group-pair in Figure 3. The plots in the left column show
the distribution of LTV for the 2000-2002 cohorts, whereas plots in the right column show the
distribution of LTV for the 2004-2006 cohorts, respectively. The top, middle, and bottom rows
show the LTV distribution for adjacent FICO score group-pairs of less than 540 and 540-579,
580-619 and 620-659, and 660-699 and 700-739, respectively. Almost always, the LTV kernel
density plot for the higher FICO score group (in red) lies to the right of the kernel density plot
of its immediately lower FICO score group (in black). At high FICO score groups this di¤erence
is marginal but increases progressively as one moves to lower FICO score groups. Moreover,
for the lower FICO score groups this di¤erence appears to have increased signi�cantly over
the cohorts from 2000-2002 (top row, left column) to 2004-2006 (top row, right column). In
contrast, the di¤erence is marginal at high FICO score levels to begin with. In addition, there
is hardly any change in these di¤erences from the 2000-2002 cohorts (bottom row, left column)
11Panel B of Table 6 shows the same for the groups in Panel B of Table 4. In the interest of brevity, we do notprovide the corresponding regression estimates for the groups in Panel B of Table 5. The results are available onrequest.
12

to the 2004-2006 cohorts (bottom row, right column) at high FICO levels.
Formally, we conduct Anderson�s (1996) test for stochastic dominance described above for
each of the six plots in Figure 6. The results are not stated here but are available on request.
We are able to establish that in three of the six plots, the LTV distribution of the higher FICO
score group stochastically dominates that in its immediately lower FICO group. In particular,
the LTV distribution for the FICO group �540-579�stochastically dominates that for the �less
than 540 FICO�score group for both 2000-2002 and 2004-2006 cohorts. Signi�cantly, the value
of � (see Section 2.1) recorded at every decile for the 2004-2006 cohorts is greater than the
corresponding � recorded for the 2000-2002 cohorts. In addition, the LTV distribution for the
FICO group �620-659� stochastically dominates that for the �580-619� score group for 2004-
2006 cohorts but not for the 2000-2002 cohorts. Lastly, we fail to establish stochastic dominance
of the LTV distribution for the FICO group �700-739�over that for the �660-699�FICO score
group for both 2000-2002 and 2004-2006 cohorts. In summary, these results formalize what
was described above� the di¤erence between LTV on higher FICO score and lower FICO score
originations increased from earlier cohorts to later cohorts. Signi�cantly, these di¤erences are
more discernable at low levels of FICO scores than at high FICO score levels.
The contrast in the LTV distribution between high and low FICO score originations can
help explain the anomalous trends in our performance metric over the cohorts. At low FICO
score levels, the higher of the two adjacent FICO score groups is more likely to have riskier at-
tributes on later cohorts than its immediately lower group. First, this lowers the unconditional
performance of FICO improvement over the cohorts as shown by our nonparametric estimates
in Table 4. Once we control for these riskier attributes, the trend is reversed� we witness an
improvement in FICO performance over the cohorts. In contrast, there is a marginal di¤erence
in LTV between adjacent FICO score groups at high FICO score levels. Moreover, this di¤er-
ence does not show any discernible change over the cohorts in our sample. Our performance
metric shows improvement over the years for the nonparametric case; and, even after control-
ling for other origination attributes, FICO performance at high score levels continues to show
improvement over the cohorts.
While our results do not show deterioration in performance of credit scores, the methods by
which these scores have been implemented remain questionable. As demonstrated above, higher
credit score groups were more likely to include other riskier attributes on the origination than
their immediately lower one. This trade-o¤ grew stronger for later cohorts especially among low
levels of FICO. Naturally, we witness deterioration over cohorts in terms of the unconditional
metric of FICO performance for originations at low levels of FICO. However, controlling for
such riskier attributes implies that FICO performance actually improved over the years even
for originations with low FICO scores. In contrast, the trade-o¤ between riskier attributes and
higher credit scores was less pronounced at high FICO score levels. Consequently, we record
an improvement in FICO performance in terms of our nonparametric as well as parametric
13

measures.
6 Conclusion
Anecdotal evidence on credit scoring has pointed to possible manipulation that may increase
the credit scores of borrowers without any real improvements in their creditworthiness (see
Foust and Pressman, 2008 for details). In theory, score manipulation has minimum impact in
terms of our metric if its occurrence were to be uniformly distributed. However, this is unlikely:
A more probable scenario is one in which manipulation is more likely to occur at low levels of
credit scores. Moreover, most anecdotal accounts argue that such manipulation increased over
the years in our sample period. Therefore, if credit score manipulation a¤ects default rates, it
is most likely to be re�ected in our results at low levels of FICO and for later cohorts.
More important, evidence of manipulation of credit scores should be re�ected in anomalous
behavior in terms of our parametric measure� a measure that controls for other characteristics
on the origination. However, the evidence shows the opposite: parametric measures of FICO
performance show improvement at all levels of FICO. This result is fairly robust and holds true
for multiple variations of credit score groupings (see Appendix). In light of this, we conclude
that evidence from our data does not re�ect any anomalous behavior that would suggest that
such manipulation was widespread. That is not to say that such instances of manipulation did
not occur, but simply that given our large sample size, score manipulation would have to be
fairly widespread to a¤ect our results.
This paper has introduced a simple yet e¤ective measure for evaluating the performance of
credit scoring. As mentioned earlier, the advantage of using such a measure is twofold. First,
it lends itself to both non-parametric and parametric estimation. Second, it minimizes the
impact of situational factors on this measure of credit score performance. Using this measure,
we �nd that credit score performance is robust to both high and low default environments.
However, evidence suggests that some of the increase in credit scores over the cohorts can
be explained as adjustment for the increased riskiness in other attributes on the originations.
This was particularly true for low levels of credit scores� resulting in a sharp deterioration of
credit score performance in terms of our nonparametric measure. Signi�cantly, once we control
for other (riskier) attributes in the origination, our parametric credit score performance shows
improvement over the cohorts. This would suggest an over-reliance on credit scoring� not only
as a measure of credit risk but also as a means to o¤set risk on other origination attributes. In
part, this reliance led to deterioration in loan performance even though average credit quality�
as measured in terms of credit scores� actually improved over the years.
14

References
Agarwal, Sumit; Yan Chang; and Abdullah Yavas (2010). �Adverse Selection in Mortgage Securitiza-
tion�, Paolo Ba¢ Centre Research Paper. No. 2010-67.
Altman, Edward I. and Anthony Saunders (1997). �Credit Risk Measurement: Developments over
the last 20 Years.�Journal of Banking & Finance, 21(11-12), pp. 1721-1742
Anderson, Gordon (1996). �Nonparametric Tests of Stochastic Dominance in Income Distributions.�
Econometrica, 64(5), pp. 1183-93.
Andriotis A., (2011) Riskier Loans Make a Comeback, as Private Firms Take the Field, Wall Street
Journal, Homes, July 12.
Avery, Robert B.; Raphael W. Bostic; Paul S. Calem; and Glenn B. Canner (2000). �Credit Scoring:
Statistical Issues and Evidence from Credit-Bureau Files.�Real Estate Economics, 28(3), pp. 523-547.
Avery, Robert B.; Paul S. Calem; and Glenn B. Canner (2003). �An Overview of Consumer Data
and Credit Reporting,�Board of Governors Federal Reserve Bulletin, February, pp. 47-73.
Avery, Robert B.; Paul S. Calem; and Glenn B. Canner (2004). �Consumer Credit Scoring: Do
Situational Circumstances Matter?�Journal of Banking & Finance, 28(4), pp. 835-856.
Bennardo, Alberto; Marco Pagano; and Salvatore Piccolo, (2009). �Multiple-Bank Lending, Creditor
Rights and Information Sharing.�CEPR Discussion Papers DP7186.
Bhattacharya; Anand, William Berliner; and Jonathan Lieber, (2006) "Alt-A Mortgages and MBS."
In: Frank Fabozzi, Ed. The Handbook of Mortgage-Backed Securities. McGraw-Hill: New York. pp.
187-206.
Brooks, Rick and Ruth Simon �Subprime Debacle Traps Even Very Credit-Worthy. As Housing
Boomed, Industry Pushed Loans to a Broader Market�. Wall Street Journal, Leader, December 3, 2007.
Brown, Martin and Christian Zehnder (2007). �Credit Reporting, Relationship Banking, and Loan
Repayment.�Journal of Money, Credit and Banking, 39(8), pp. 1883-1918.
Brown, Martin; Tullio Jappelli; and Marco Pagano (2009). �Information Sharing and Credit: Firm-
Level Evidence from Transition Countries.�Journal of Financial Intermediation, 18(2), pp. 151-172.
Brown, Meta; Andrew F. Haughwout; Donghoon Lee; and Wilbert Van der Klaauw (2010). �The
Financial Crisis at the Kitchen Table: Trends in Household Debt and Credit.�FRB of New York Sta¤
Report No. 480..
Cox D. R. (1972) �Regression Models and Life-Tables.�Journal of the Royal Statistical Society (B),
4, pp. 187-202
Fair Isaac Corporation (2007). �Understanding your FICO Score.�UYFS Booklet 100807.
15
Foote, Christopher L.; Kristopher Gerardi; Lorenz Goette; and Paul S. Willen (2008). �Just the
Facts: An Initial Analysis of Subprime�s Role in the Housing Crisis.� Journal of Housing Economics,
17(4), pp. 291-305.
Foust, Dean and Aaron Pressman �Credit Scores: Not-So-Magic Numbers.�BusinessWeek, February
7, 2008.
Government Accountability O¢ ce (2010) �Nonprime Mortgages: Data on Loan Performance by Co-
hort Year, Product Type, and Location�GAO-10-805, August 24, 2010. http://www.gao.gov/products/GAO-
10-805
Jappelli, Tullio and Marco Pagano. (1993). �Information Sharing in Credit Markets.� Journal of
Finance, 48(5), pp. 1693-1718.
Kaplan, E. L. and Paul Meier (1958). �Nonparametric Estimation From Incomplete Observations.�
Journal of the American Statistical Association, 53, pp. 457-481.
Keys, Benjamin J.; Tanmoy Mukherjee; Amit Seru; and Vikrant Vig (2010). �Did Securitization
Lead to Lax Screening? Evidence from Subprime Loans.�The Quarterly Journal of Economics, 125(1),
pp. 307-362.
Lee, Donghoon and Wilbert Van der Klaauw (2010). �An Introduction to the FRBNY Consumer
Credit Panel�FRB of New York Sta¤ Report No. 479.
Levitin, Adam J. and Susan M. Watcher (2010). �Explaining the Housing Bubble.� Georgetown
University Law Center Working Paper No. 1669401.
Mayer, Christopher; Karen Pence; and Shane M. Sherlund (2009). �The Rise in Mortgage Defaults.�
Journal of Economic Perspectives, 23(1), pp.27-50.
Mester, Loretta J. (1997). �What�s the Point of Credit Scoring?�Federal Reserve Bank of Philadel-
phia Business Review, pp. 3-16.
Padilla, A. Jorge and Marco Pagano, (2000). �Sharing Default Information as a Borrower Discipline
Device.�European Economic Review, 44, pp. 1951-1980.
Pennington-Cross, Anthony (2003). �Credit History and the Performance of Prime and Nonprime
Mortgages.�The Journal of Real Estate Finance and Economics, 27(3), pp. 279-301.
Rothschild, Michael and Joseph E. Stiglitz (1970). �Increasing Risk: I. A De�nition.� Journal of
Economic Theory, 2(3), pp. 225-243.
Vercammen, James A (1995). �Credit Bureau Policy and Sustainable Reputation E¤ects in Credit
Markets.�Economica, 62(248), pp. 461-78.
Zimmerman, T. (2006) "De�ning Nonagency MBS." In: Fabozzi, F. (Ed.), The Handbook of
Mortgage-Backed Securities. McGraw-Hill: New York.
16

Figure1:Plotsshowingthecumulativedistributionfunctionofcreditscoresduring2000-2002andthenduring2004-2006.Thebold
linesshow
thedistributionofFICOscoresonsubprimeoriginations.Thedottedlinesshow
thedistributionofcreditscoresforU.S.
individualswithcreditreports.
17

Figure2:Plotsshowingthecumulativedistribution
function
ofcreditscoresfor2000andthenfor2006.Theboldlinesshow
the
distributionofFICOscoresonsubprimeoriginations.Thedottedlinesshow
thedistributionofcreditscoresforU.S.individualswith
creditreports.
18

5060
7080
9010
011
0
[0, 5
39]
[540
, 579
]
5060
7080
9010
011
0
[0, 5
39]
[540
, 579
]
5060
7080
9010
011
0
[580
, 619
][6
20, 6
59]
5060
7080
9010
011
0
[580
, 619
][6
20, 6
59]
5060
7080
9010
011
0
[660
, 699
][7
00, 7
39]
5060
7080
9010
011
0
[660
, 699
][7
00, 7
39]
Year
s 20
002
002
Yea
rs 2
004
2006
Figure3:KerneldensityplotsoftheLTVdistributionfororiginationsinadjacentFICOscoregroups.Foreachplot,theLTVdistributionforthe
higherFICOscoregroup(inred)isshownalongsidetheLTVdistributionforthelowerFICOscoregroup(inblack).Ineachcase,thedistribution
ofLTVistruncatedtolieintheinterval[50,110]foreaseofexposition.
19

20
Table 1. Anderson (1996) Test for First Order Stochastic Dominance Under the null of common population distribution (no dominance), and the assumption of independence of the two samples,
⁄ ⁄ is asymptotically normally distributed with mean zero. The hypothesis of first-order dominance of A over B requires that no element of be significantly greater than zero while at least one element is significantly less. The numbers in parentheses below report the 95% confidence interval.
Panel A: Dominance of 2004-2006 over 2000-2002
FICO Subprime
( ) Subprime
(t-stat) Population
( Population
(t-stat) 1st Decile -0.0485 -185.5142 -0.0137 -26.2394
(-0.049; -0.048) (-0.0148; -0.0126)2nd Decile -0.0855 -236.4047 -0.0123 -20.1941
(-0.0862; -0.0848) (-0.0134; -0.0112)3rd Decile -0.1167 -269.4439 -0.0078 -11.1864
(-0.1175; -0.1159) (-0.0092; -0.0064)4th Decile -0.1163 -251.3688 -0.0046 -6.304
(-0.1171; -0.1155) (-0.006; -0.0032)5th Decile -0.1055 -220.7806 -0.0022 -2.8359
(-0.1065; -0.1045) (-0.0037; -0.0007)6th Decile -0.091 -195.1928 -0.0022 -2.748
(-0.0919; -0.0901) (-0.0038; -0.0006)7th Decile -0.0677 -160.1472 -0.0048 -5.655
(-0.0685; -0.0669) (-0.0065; -0.0031)8th Decile -0.0401 -116.3653 -0.0088 -10.1431
(-0.0408; -0.0394) (-0.0105; -0.0071)9th Decile -0.0114 -57.2645 -0.0186 -21.2404
(-0.0118; -0.011) (-0.0203; -0.0169)
Panel B: Stochastic Dominance of 2006 over 2000
FICO Subprime
( ) Subprime
(t-stat) Population
( ) Population
(t-stat) 1st Decile -0.0818 -150.3504 -0.0038 -4.2225 (-0.0829; -0.0807) (-0.0055; -0.0021)2nd Decile -0.1402 -187.5339 -0.0023 -2.193 (-0.1416; -0.1388) (-0.0044; -0.0002)3rd Decile -0.189 -210.3891 -0.0003 -0.2237 (-0.1908; -0.1872) (-0.0027; 0.0021)4th Decile -0.1891 -196.2621 0.0018 1.4277 (-0.191; -0.1872) (-0.0007; 0.0043)5th Decile -0.1725 -174.0648 0.0031 2.2935 (-0.1744; -0.1706) (0.0005; 0.0057)6th Decile -0.1333 -139.3142 0.0026 1.8627 (-0.1352; -0.1314) (-0.0002; 0.0054)7th Decile -0.0906 -106.6017 -0.001 -0.6988 (-0.0923; -0.0889) (-0.0039; 0.0019)8th Decile -0.0477 -71.2206 -0.0074 -4.9046 (-0.049; -0.0464) (-0.0104; -0.0044)9th Decile -0.0126 -35.869 -0.0224 -14.7166 (-0.0133; -0.0119) (-0.0254; -0.0194)

21
Table 2: FICO distributions Borrower credit score at the time of loan origination is denoted by FICO (an industry standard developed by the Fair Isaac Corporation) with a number in the range 300-850. Loans coded by the source as with a non-blank documentation code are classified as Full-doc whereas all other originations are classified as Low doc. CLTV denotes the combined loan-to-value ratio on the origination. Panel A: FICO distribution conditional on Documentation level on loan by cohort
Full doc loans Low-doc
Cohort < 620 620-659 660-719 ≥ 720 < 620 620-659 660-719 ≥ 720
1998 65.6 18.9 11.5 4.0 56.7 21.7 16.2 5.4
1999 67.4 18.4 10.9 3.3 53.3 22.1 18.2 6.4
2000 72.1 16.9 8.6 3.3 59.1 21.3 15.0 4.6
2001 67.8 18.8 10.0 3.3 50.2 25.2 18.7 5.8
2002 64.4 20.2 11.4 4.0 42.1 27.2 23.2 7.5
2003 58.4 22.2 13.9 5.4 37.3 27.4 26.2 9.1
2004 58.8 22.5 13.7 5.0 38.0 27.8 26.1 8.1
2005 58.8 23.2 13.6 4.5 34.5 30.1 26.9 8.6
2006 61.3 23.7 11.5 3.4 35.7 32.3 24.9 7.1 Panel B: Distribution of FICO scores conditional on CLTV by cohort
CLTV 80 80 < CLTV 90 90 < CLTV 100
Cohort < 620 620-659 660-719 ≥ 720 < 620 620-659 660-719 ≥720 < 620 620-659 660-719 ≥720
1998 63.2 18.4 12.5 5.9 61.9 21.1 12.5 4.4 52.2 22.2 17.2 8.4
1999 65.1 18.0 12.1 4.8 63.9 20.6 11.8 3.7 44.2 23.5 23.1 9.2
2000 70.4 16.5 9.9 3.2 71.1 18.1 8.6 2.2 48.1 29.3 17.1 5.5
2001 66.0 18.1 11.7 4.2 65.8 21.0 10.6 2.6 44.0 30.8 18.9 6.3
2002 62.0 19.3 13.6 5.2 61.8 21.9 12.9 3.4 30.2 36.1 25.2 8.5
2003 59.2 19.4 15.1 6.3 55.8 23.7 15.7 4.7 30.2 33.6 26.5 9.7
2004 61.9 19.2 13.7 5.2 57.5 23.2 15.0 4.3 31.0 32.9 27.0 9.0
2005 60.7 20.6 13.8 5.0 55.9 23.6 15.8 4.7 32.7 33.2 25.9 8.2
2006 65.1 19.7 11.4 3.9 60.4 23.3 12.9 3.4 34.8 35.4 23.3 6.4

22
Table 3: Credit Score (FICO) Regression OLS estimates with borrower FICO score as the left-hand side variable and other borrower characteristics as regressors. In addition to the variables shown here, we control for property type (dummies for single-family residence, condo, townhouse, co-operative, etc), property location (dummies for the state in which the property is located) and loan source (dummies for broker, realtor, wholesale, retail etc.) and number of units in the property. Home Value nth Quartile is a dummy that equals one if the value of the property lies in the n-th quartile of all property values in the data and zero otherwise. Panel A: By Cohort Cohort
2000 2001 2002 2003 2004 2005 2006
Intercept 648.44*** 635.03*** 608.49*** 622.87*** 645.62*** 648.62*** 609.94***
CLTV 0.21*** 0.27*** 0.47*** 0.57*** 0.82*** 0.93*** 1.09***
Full-Doc -10.78*** -18.55*** -18.07*** -19.93*** -24.4*** -21.22*** -19.58***
Owner Occupied -26.21*** -27.62*** -27.68*** -27.22*** -31.61*** -36.13*** -36.7***
Second Home -12.5*** -9.93*** -3.01*** -3.97*** -10.09*** -12.83*** -11.84***
Refinance (Cash Out) -5.9*** -10.02*** -14.56*** -13.17*** -23.61*** -26.35*** -25.31***
Refinance (No Cash Out) -6.31*** -14.88*** -18.86*** -16.27*** -19.69*** -18.53*** -15.13***
Home Value First Quartile -7.97*** -5.93*** -6.56*** -12.48*** -12.51*** -15.69*** -16.22***
Home Value Second Quartile -5.17*** -4.63*** -5.23*** -8.94*** -9.15*** -10.98*** -10.9***
Home Value Third Quartile -3.44*** -2.86*** -3.6*** -5.47*** -7.35*** -8.76*** -8.26***
Adjusted R-Squared 0.0393 0.0642 0.0870 0.0959 0.1646 0.1932 0.2268
Panel B: For all Cohorts (full sample)
(1) (2) Intercept 616.09*** 617.07*** Dummy for 2003-2006 cohorts 9.39*** Dummy for 2004-2006 cohorts 3.79***
CLTV 0.82*** 0.85*** Full-Doc -19.92*** -20.33*** Owner Occupied -34.45*** -34.44*** Second Home -8.88*** -9*** Refinance (Cash Out) -20.86*** -20.55*** Refinance (No Cash Out) -13.07*** -13.19*** Home Value First Quartile -14.17*** -13.47*** Home Value Second Quartile -9.39*** -8.91*** Home Value Third Quartile -7.3*** -7.09*** Adjusted R-Squared 0.1829 0.1779

23
Table 4: Increase in Survival Probabilities for Improvements in FICO score (groups) The numbers show a percentage point increase in the Kaplan-Meier survival probabilities (for the first two years after origination) of originations in the higher FICO score group relative to those in the lower FICO score group. Panel A. The FICO score groups used below are “less than 540", “540-579", “580-619" … “700-739" and “greater than or equal to 740".
Cohort
Improvement in FICO score 2000 2001 2002 2003 2004 2005 2006
[< 540] to [540 – 579] 8.17 7.46 5.75 4.17 4.73 4.95 5.52
[540 – 579] to [580 – 619] 4.45 4.24 3.57 3.38 3.88 3.04 1.68
[580 – 619] to [620 – 659] 3.35 2.87 2.91 3.24 4.48 4.33 2.10
[620 – 659] to [660 – 699] 1.95 2.37 2.54 2.43 2.79 4.59 4.64
[660 – 699] to [700 – 739] 1.41 1.44 1.96 1.52 1.50 2.56 4.14
[700 – 739] to [≥740] 0.91 1.10 0.81 0.84 1.30 2.57 7.84
Average All 3.37 3.25 2.92 2.60 3.11 3.68 4.32 Panel B. The FICO score groups used below are "less than 541", "541-560", "561-580" … "721-740" and "greater than or equal to 741".
Cohort
Improvement in FICO score 2000 2001 2002 2003 2004 2005 2006
[< 541] to [541 – 560] 6.68 6.16 4.53 3.10 3.47 3.70 3.90
[541 – 560] to [561 – 580] 2.82 2.50 2.36 1.97 2.30 2.02 2.76
[561 – 580] to [581 – 600] 2.16 2.31 1.80 1.55 1.55 0.80 -0.27
[581 – 600] to [611 – 620] 1.78 1.22 1.10 1.56 2.29 2.73 1.40
[611 – 620] to [621 – 640] 1.94 1.67 1.69 1.73 2.62 1.83 0.84
[621 – 640] to [641 – 660] 1.16 1.52 1.62 1.83 1.78 2.78 1.53
[641 – 640] to [661 – 680] 1.07 1.16 1.30 1.10 1.38 2.23 3.01
[661 – 640] to [681 – 700] 0.58 0.78 0.90 0.84 1.05 1.94 1.99
[681 – 640] to [711 – 720] 0.94 0.89 1.19 0.67 0.62 0.94 2.17
[711 – 640] to [721 – 740] 0.00 0.25 0.41 0.71 0.60 1.19 1.91
[721 – 740] to [≥741] 1.06 0.90 0.56 0.47 0.93 1.79 6.71
Average All 1.83 1.76 1.59 1.41 1.69 2.00 2.36
24
Table 5: Estimated Cox proportional hazard rate regression: This table reports the estimated hazard ratios for the Cox proportional hazard regressions conducted for all loans originated in a given calendar year. FICO scores below 540 are treated as the base group. We control for property type (dummies for single-family residence, condo, townhouse, co-operative, etc), property location (dummies for the state in which the property is located) and loan source (dummies for broker, realtor, wholesale, retail etc.). Home Value nth Quartile is a dummy that equals one if the value of the property lies in the n-th quartile of all property values in the data and zero otherwise.
Cohort
2000 2001 2002 2003 2004 2005 2006
FICO: 540-579 0.665*** 0.684*** 0.666*** 0.676*** 0.677*** 0.702*** 0.721***
FICO: 580-619 0.498*** 0.503*** 0.475*** 0.457*** 0.459*** 0.492*** 0.515***
FICO: 620-659 0.358*** 0.36*** 0.335*** 0.292*** 0.294*** 0.338*** 0.366***
FICO: 660-699 0.254*** 0.237*** 0.215*** 0.173*** 0.19*** 0.239*** 0.274***
FICO: 700-739 0.18*** 0.159*** 0.136*** 0.106*** 0.129*** 0.185*** 0.224***
FICO: >=740 0.145*** 0.101*** 0.095*** 0.069*** 0.082*** 0.134*** 0.169***
CLTV 1.009*** 1.014*** 1.015*** 1.021*** 1.026*** 1.03*** 1.032***
Full-Documentation 0.835*** 0.809*** 0.778*** 0.693*** 0.708*** 0.655*** 0.617***
Owner Occupied 0.785*** 0.753*** 0.759*** 0.695*** 0.657*** 0.66*** 0.639***
Second Home 0.636*** 0.558*** 0.572*** 0.609*** 0.607*** 0.691*** 0.668***
Refinance (Cash Out) 0.817*** 0.74*** 0.713*** 0.664*** 0.674*** 0.708*** 0.833***
Refinance (No Cash Out) 0.972** 0.866*** 0.804*** 0.679*** 0.656*** 0.694*** 0.798***
Home Value First Quartile 0.912*** 0.914*** 0.914*** 0.932*** 0.789*** 0.644*** 0.583***
Home Value Second Quartile 0.933*** 0.879*** 0.879*** 0.891*** 0.773*** 0.654*** 0.631***
Home Value Third Quartile 0.933*** 0.889*** 0.864*** 0.881*** 0.817*** 0.817*** 0.805***
LR test 26943 33172 52179 96372 150783 218724 227077 (p-value) (0.00) (0.00) (0.00) (0.00) (0.00) (0.00) (0.00)

25
Table 6: Parametric Estimates of Increase in Survival Probabilities for transitions between different FICO score groups The numbers show parametric estimates of percentage point increases in estimated survival probabilities (for the first two years after origination) of originations in the higher FICO score group relative to those in the lower FICO score group. The estimated probabilities are calculated using the Cox proportional hazard model such as the one shown in Table 3. Panel A. The FICO score groups used below are “less than 540", “540-579", “580-619" … “700-739" and “greater than or equal to 740".
Cohort
Improvement in FICO score 2000 2001 2002 2003 2004 2005 2006
[< 540] to [540 – 579] 7.00 6.28 6.22 5.33 6.46 7.53 10.19
[540 – 579] to [580 – 619] 3.71 3.80 3.76 3.77 4.62 5.77 8.68
[580 – 619] to [620 – 659] 3.21 3.13 2.87 2.96 3.66 4.45 6.92
[620 – 659] to [660 – 699] 2.48 2.77 2.51 2.19 2.38 2.97 4.62
[660 – 699] to [700 – 739] 1.80 1.81 1.70 1.25 1.42 1.68 2.58
[700 – 739] to [≥740] 0.84 1.34 0.89 0.69 1.12 1.60 2.95
Average All 3.17 3.19 2.99 2.70 3.28 4.00 5.99 Panel B. The FICO score groups used below are "less than 541", "541-560", "561-580" … "721-740" and "greater than or equal to 741".
Cohort
Improvement in FICO score 2000 2001 2002 2003 2004 2005 2006
[< 541] to [541 – 560] 5.75 5.12 4.85 4.08 5.04 5.72 7.52
[541 – 560] to [561 – 580] 2.52 2.30 2.62 2.37 2.72 3.24 5.10
[561 – 580] to [581 – 600] 1.84 1.85 1.69 1.71 2.15 2.85 4.15
[581 – 600] to [611 – 620] 1.26 1.60 1.63 1.78 2.28 2.86 4.17
[611 – 620] to [621 – 640] 2.12 1.77 1.41 1.52 1.92 2.20 3.72
[621 – 640] to [641 – 660] 1.13 1.48 1.62 1.41 1.49 2.04 2.94
[641 – 640] to [661 – 680] 1.59 1.50 1.26 1.08 1.18 1.42 2.40
[661 – 640] to [681 – 700] 0.55 1.00 0.88 0.81 0.98 1.12 1.58
[681 – 640] to [711 – 720] 1.21 0.92 0.92 0.55 0.62 0.74 1.25
[711 – 640] to [721 – 740] 0.59 0.74 0.56 0.50 0.51 0.68 0.95
[721 – 740] to [≥741] 0.57 0.83 0.55 0.39 0.80 1.19 2.31
Average All 1.74 1.74 1.63 1.47 1.79 2.19 3.28

26
APPENDIX This appendix shows that results in Table 4 and Table 6 are robust to different groupings of credit scores. Table A.4: Increase in Survival Probabilities for Improvements in FICO score (groups) The numbers show a percentage point increase in the Kaplan-Meier survival probabilities (for the first two years after origination) of originations in the higher FICO score group relative to those in the lower FICO score group. Panel A: The FICO score groups used below are “less than 520”, “520-559", “560-599" … “680-719" and “greater than or equal to 720".
Cohort
Improvement in FICO score 2000 2001 2002 2003 2004 2005 2006
[< 520] to [520 – 559] 8.54 7.88 6.60 3.96 4.40 4.46 4.67
[520 – 559] to [560 – 599] 5.36 5.11 4.17 3.56 4.12 3.58 3.80
[560 – 599] to [600 – 639] 3.80 3.30 2.86 3.26 4.36 3.89 1.59
[600 – 639] to [640 – 679] 2.67 2.78 3.02 3.12 3.66 4.67 3.11
[640 – 679] to [680 – 719] 1.62 1.83 2.15 1.79 2.14 3.63 4.72
[680 – 719] to [≥720] 1.16 1.42 1.51 1.37 1.51 2.84 7.16
Average All 3.86 3.72 3.38 2.84 3.36 3.85 4.17 Panel B: The FICO score groups used below are "less than 521", "521-560", "561-600" … "681-720" and "greater than or equal to 721".
Cohort
Improvement in FICO score 2000 2001 2002 2003 2004 2005 2006
[< 521] to [521 – 560] 8.45 7.90 6.54 3.83 4.38 4.49 4.62
[521 – 560] to [561 – 600] 5.34 5.10 4.16 3.62 4.11 3.49 3.67
[561 – 600] to [601 – 640] 3.71 3.13 2.77 3.15 4.28 3.88 1.63
[601 – 640] to [641 – 680] 2.66 2.88 3.06 3.19 3.71 4.74 3.24
[641 – 680] to [681 – 720] 1.59 1.82 2.14 1.75 2.08 3.60 4.63
[681 – 720] to [≥721] 1.17 1.32 1.45 1.38 1.53 2.82 7.21
Average All 3.82 3.69 3.35 2.82 3.35 3.83 4.17 Panel C: The FICO score groups used below are "less than 540", "540-579", "580-619" … "700-739" and "greater than or equal to 740".
Cohort
Improvement in FICO score 2000 2001 2002 2003 2004 2005 2006
[< 540] to [540 – 579] 8.17 7.46 5.75 4.17 4.73 4.95 5.52
[540 – 579] to [580 – 619] 4.45 4.24 3.57 3.38 3.88 3.04 1.68
[580 – 619] to [620 – 659] 3.35 2.87 2.91 3.24 4.48 4.33 2.10
[620 – 659] to [660 – 699] 1.95 2.37 2.54 2.43 2.79 4.59 4.64
[660 – 699] to [700 – 739] 1.41 1.44 1.96 1.52 1.50 2.56 4.14
[700 – 739] to [≥740] 0.91 1.10 0.81 0.84 1.30 2.57 7.84
Average All 3.37 3.25 2.92 2.60 3.11 3.68 4.32

27
Panel D: The FICO score groups used below are "less than 541", "541-580", "581-620" … "711-740" and "greater than or equal to 741".
Cohort
Improvement in FICO score 2000 2001 2002 2003 2004 2005 2006
[< 541] to [541 – 580] 8.13 7.47 5.77 4.15 4.71 4.82 5.45
[541 – 580] to [581 – 620] 4.42 4.19 3.54 3.40 3.97 3.18 1.70
[581 – 620] to [621 – 660] 3.33 2.87 2.89 3.21 4.41 4.38 2.20
[621 – 660] to [661 – 700] 1.94 2.31 2.55 2.42 2.75 4.51 4.60
[661 – 700] to [711 – 740] 1.29 1.47 1.89 1.45 1.48 2.56 4.14
[711 – 740] to [≥741] 1.06 1.05 0.81 0.88 1.29 2.50 7.89
Average All 3.36 3.22 2.91 2.59 3.10 3.66 4.33 Panel E: The FICO score groups used below are "less than 540", "540-559", "560-579" … "720-739" and "greater than or equal to 740".
Cohort
Improvement in FICO score 2000 2001 2002 2003 2004 2005 2006
[< 540] to [540 – 559] 6.77 6.17 4.50 3.16 3.46 3.71 3.88 [540 – 559] to [560 – 579] 2.72 2.47 2.37 1.87 2.38 2.24 2.94 [560 – 579] to [580 – 599] 2.26 2.34 1.83 1.59 1.42 0.51 -0.35 [580 – 599] to [600 – 619] 1.78 1.40 1.16 1.66 2.45 2.83 1.33 [600 – 619] to [620 – 639] 1.90 1.56 1.60 1.64 2.52 1.67 0.82 [620 – 639] to [640 – 659] 1.26 1.46 1.71 1.84 1.80 2.91 1.46 [640 – 639] to [660 – 679] 1.01 1.25 1.22 1.09 1.40 2.22 3.06 [660 – 639] to [680 – 699] 1.01 1.08 1.43 1.17 1.33 2.36 2.89 [680 – 639] to [700 – 719] 0.63 0.47 0.72 0.43 0.40 0.57 1.30 [700 – 639] to [720 – 739] 0.00 0.45 0.48 0.66 0.53 1.17 1.94 [720 – 739] to [≥740] 0.91 0.83 0.52 0.46 0.99 1.87 6.66
Average All 1.84 1.77 1.60 1.42 1.70 2.00 2.36 Panel F: The FICO score groups used below are "less than 541", "541-560", "561-580" … "721-740" and "greater than or equal to 741".
Cohort
Improvement in FICO score 2000 2001 2002 2003 2004 2005 2006
[< 541] to [541 – 560] 6.68 6.16 4.53 3.10 3.47 3.70 3.90 [541 – 560] to [561 – 580] 2.82 2.50 2.36 1.97 2.30 2.02 2.76 [561 – 580] to [581 – 600] 2.16 2.31 1.80 1.55 1.55 0.80 -0.27 [581 – 600] to [611 – 620] 1.78 1.22 1.10 1.56 2.29 2.73 1.40 [611 – 620] to [621 – 640] 1.94 1.67 1.69 1.73 2.62 1.83 0.84 [621 – 640] to [641 – 660] 1.16 1.52 1.62 1.83 1.78 2.78 1.53 [641 – 640] to [661 – 680] 1.07 1.16 1.30 1.10 1.38 2.23 3.01 [661 – 640] to [681 – 700] 0.58 0.78 0.90 0.84 1.05 1.94 1.99 [681 – 640] to [711 – 720] 0.94 0.89 1.19 0.67 0.62 0.94 2.17 [711 – 640] to [721 – 740] 0.00 0.25 0.41 0.71 0.60 1.19 1.91 [721 – 740] to [≥741] 1.06 0.90 0.56 0.47 0.93 1.79 6.71
Average All 1.83 1.76 1.59 1.41 1.69 2.00 2.36

28
Table A.6: Increase in Survival Probabilities for Improvements in FICO score (groups) The numbers show parametric estimates of percentage point in the Kaplan-Meier survival probabilities (for the first two years after origination) of originations in the higher FICO score group relative to those in the lower FICO score group. The estimated probabilities are calculated after controlling for other attributes on the origination. Panel A: The FICO score groups used below are “less than 520”, “520-559", “560-599" … “680-719" and “greater than or equal to 720".
Cohort
Improvement in FICO score 2000 2001 2002 2003 2004 2005 2006
[< 520] to [520 – 559] 6.47 5.36 5.50 4.27 5.61 6.17 8.05
[520 – 559] to [560 – 599] 4.22 4.26 4.18 4.03 4.77 6.03 9.19
[560 – 599] to [600 – 639] 2.82 2.98 2.78 3.05 3.71 4.65 7.13
[600 – 639] to [640 – 679] 2.64 2.74 2.51 2.36 2.63 3.40 5.35
[640 – 679] to [680 – 719] 1.69 2.05 1.77 1.52 1.70 2.03 3.27
[680 – 719] to [≥720] 1.49 1.66 1.29 0.94 1.20 1.67 2.86
Average All 3.22 3.18 3.01 2.70 3.27 3.99 5.98 Panel B: The FICO score groups used below are "less than 521", "521-560", "561-600" … "681-720" and "greater than or equal to 721".
Cohort
Improvement in FICO score 2000 2001 2002 2003 2004 2005 2006
[< 521] to [521 – 560] 6.45 5.52 5.57 4.30 5.63 6.25 8.16
[521 – 560] to [561 – 600] 4.26 4.16 4.14 4.03 4.76 6.03 9.18
[561 – 600] to [601 – 640] 2.83 3.02 2.78 3.03 3.71 4.63 7.09
[601 – 640] to [641 – 680] 2.56 2.71 2.51 2.37 2.61 3.36 5.29
[641 – 680] to [681 – 720] 1.77 2.03 1.76 1.49 1.68 2.01 3.23
[681 – 720] to [≥721] 1.45 1.61 1.26 0.95 1.20 1.66 2.85
Average All 3.22 3.18 3.00 2.70 3.27 3.99 5.97 Panel C: The FICO score groups used below are "less than 540", "540-579", "580-619" … "700-739" and "greater than or equal to 740".
Cohort
Improvement in FICO score 2000 2001 2002 2003 2004 2005 2006
[< 540] to [540 – 579] 7.00 6.28 6.22 5.33 6.46 7.53 10.19
[540 – 579] to [580 – 619] 3.71 3.80 3.76 3.77 4.62 5.77 8.68
[580 – 619] to [620 – 659] 3.21 3.13 2.87 2.96 3.66 4.45 6.92
[620 – 659] to [660 – 699] 2.48 2.77 2.51 2.19 2.38 2.97 4.62
[660 – 699] to [700 – 739] 1.80 1.81 1.70 1.25 1.42 1.68 2.58
[700 – 739] to [≥740] 0.84 1.34 0.89 0.69 1.12 1.60 2.95
Average All 3.17 3.19 2.99 2.70 3.28 4.00 5.99

29
Panel D: The FICO score groups used below are "less than 541", "541-580", "581-620" … "711-740" and "greater than or equal to 741".
Cohort
Improvement in FICO score 2000 2001 2002 2003 2004 2005 2006
[< 541] to [541 – 580] 7.05 6.33 6.24 5.37 6.51 7.56 10.38
[541 – 580] to [581 – 620] 3.66 3.76 3.76 3.76 4.63 5.79 8.62
[581 – 620] to [621 – 660] 3.25 3.17 2.88 2.95 3.63 4.42 6.86
[621 – 660] to [661 – 700] 2.45 2.72 2.51 2.18 2.38 2.95 4.53
[661 – 700] to [711 – 740] 1.78 1.84 1.67 1.23 1.40 1.66 2.59
[711 – 740] to [≥741] 0.94 1.27 0.89 0.69 1.11 1.62 2.95
Average All 3.19 3.18 2.99 2.70 3.28 4.00 5.99 Panel E: The FICO score groups used below are "less than 540", "540-559", "560-579" … "720-739" and "greater than or equal to 740".
Cohort
Improvement in FICO score 2000 2001 2002 2003 2004 2005 2006
[< 540] to [540 – 559] 5.76 5.06 4.82 4.02 4.96 5.70 7.29
[540 – 559] to [560 – 579] 2.39 2.32 2.63 2.40 2.77 3.22 5.16
[560 – 579] to [580 – 599] 1.97 1.93 1.71 1.71 2.11 2.80 4.13
[580 – 599] to [600 – 619] 1.21 1.50 1.59 1.79 2.29 2.90 4.22
[600 – 619] to [620 – 639] 2.06 1.78 1.43 1.53 1.95 2.21 3.74
[620 – 639] to [640 – 659] 1.25 1.47 1.60 1.40 1.51 2.08 2.99
[640 – 639] to [660 – 679] 1.60 1.55 1.27 1.07 1.16 1.42 2.45
[660 – 639] to [680 – 699] 0.45 1.00 0.88 0.84 1.01 1.14 1.63
[680 – 639] to [700 – 719] 1.25 0.88 0.93 0.55 0.62 0.74 1.18
[700 – 639] to [720 – 739] 0.72 0.78 0.59 0.49 0.51 0.69 1.04
[720 – 739] to [≥740] 0.40 0.88 0.53 0.40 0.80 1.17 2.27
Average All 1.73 1.74 1.64 1.47 1.79 2.19 3.28 Panel F: The FICO score groups used below are "less than 541", "541-560", "561-580" … "721-740" and "greater than or equal to 741".
Cohort
Improvement in FICO score 2000 2001 2002 2003 2004 2005 2006
[< 541] to [541 – 560] 5.75 5.12 4.85 4.08 5.04 5.72 7.52
[541 – 560] to [561 – 580] 2.52 2.30 2.62 2.37 2.72 3.24 5.10
[561 – 580] to [581 – 600] 1.84 1.85 1.69 1.71 2.15 2.85 4.15
[581 – 600] to [611 – 620] 1.26 1.60 1.63 1.78 2.28 2.86 4.17
[611 – 620] to [621 – 640] 2.12 1.77 1.41 1.52 1.92 2.20 3.72
[621 – 640] to [641 – 660] 1.13 1.48 1.62 1.41 1.49 2.04 2.94
[641 – 640] to [661 – 680] 1.59 1.50 1.26 1.08 1.18 1.42 2.40
[661 – 640] to [681 – 700] 0.55 1.00 0.88 0.81 0.98 1.12 1.58
[681 – 640] to [711 – 720] 1.21 0.92 0.92 0.55 0.62 0.74 1.25
[711 – 640] to [721 – 740] 0.59 0.74 0.56 0.50 0.51 0.68 0.95
[721 – 740] to [≥741] 0.57 0.83 0.55 0.39 0.80 1.19 2.31
Average All 1.74 1.74 1.63 1.47 1.79 2.19 3.28