
Credit Risk Stress Testing for the Mexican Banking System · Using the model for Credit Stress...
27
Credit Risk Stress Testing for the Credit Risk Stress Testing for the Mexican Banking System Mexican Banking System Javier M Javier M á á rquez rquez May 2006 May 2006 Paper presented at the Expert Forum on Advanced Techniques on Stress Testing: Applications for Supervisors Hosted by International Monetary Fund Washington, D.C., May 2-3, 2006 The views expressed in this paper are those of the author(s) only, and the presence of them, or of links to them, on the IMF website does not imply that the IMF, its Executive Board, or its management endorses or shares the views expressed in the paper.
Transcript of Credit Risk Stress Testing for the Mexican Banking System · Using the model for Credit Stress...

Credit Risk Stress Testing for theCredit Risk Stress Testing for theMexican Banking SystemMexican Banking System
Javier MJavier MáárquezrquezMay 2006May 2006
Paper presented at the Expert Forum on Advanced Techniques on Stress Testing: Applications for Supervisors Hosted by International Monetary FundWashington, D.C., May 2-3, 2006
The views expressed in this paper are those of the author(s) only, and the presence of them, or of links to them, on the IMF website does not imply that the IMF, its Executive Board, or its management endorses or shares the views expressed in the paper.
I.I. CyRCECyRCE
II.II. Stress TestingStress Testing
OutlineOutline

CyRCE: PropertiesCyRCE: Properties
AA closedclosed formform default default modelmodel assuming that the loan portfolio loss assuming that the loan portfolio loss distribution can be characterized by its mean and its variancedistribution can be characterized by its mean and its variance::
Closed form expression for Value at Risk (VaR)Closed form expression for Value at Risk (VaR)::
•• ExplicitExplicit management management controlscontrols: : Capital Capital adequacyadequacy, single , single obligorobligorlimitslimits, etc, etc..
•• PortfolioPortfolio AnalysisAnalysis:: RiskRisk concentrationconcentration, , allocationallocation, , pricingpricing, , optimizationoptimization..
•• GreatGreat computationalcomputational efficiencyefficiency: : LargeLarge portfoliosportfolios, , fastfast feedback.feedback.
•• LimitedLimited portfolioportfolio informationinformation..
Explicit parametrization of all relevant credit risk elementsExplicit parametrization of all relevant credit risk elements::
•• DealDeal withwith informationinformation gapsgaps throughthrough assumptionsassumptions..
EasyEasy stress stress testingtesting.

CyRCE: CyRCE: A General ModelA General Model
2. 2. All loans have different default probabilities:All loans have different default probabilities:
ππ = (= (pp1 1 , ..., , ..., ppNN ))..
3. 3. LoanLoan defaultsdefaults can be correlated can be correlated :: covariance matrix.covariance matrix.
ρρi , ji , j: : defaultdefault correlation correlation betweenbetween loanloan ii and loan and loan jj
= σiσj ρi,j== σσiiσσj j ρρi,ji,jDefault Covariance
between loan i and loan jDefaultDefault Covariance Covariance
between loan between loan ii and loan and loan jjσi,j =σσi,j i,j == = Mi,j = = MMi,j i,j
1.1. LetLet ffii denote denote thethe i i thth loan amount in the portfolio;loan amount in the portfolio; ii = = 1,2,....,1,2,....,NN
FF = (= (ff1 1 , ..., , ..., ffNN ))..
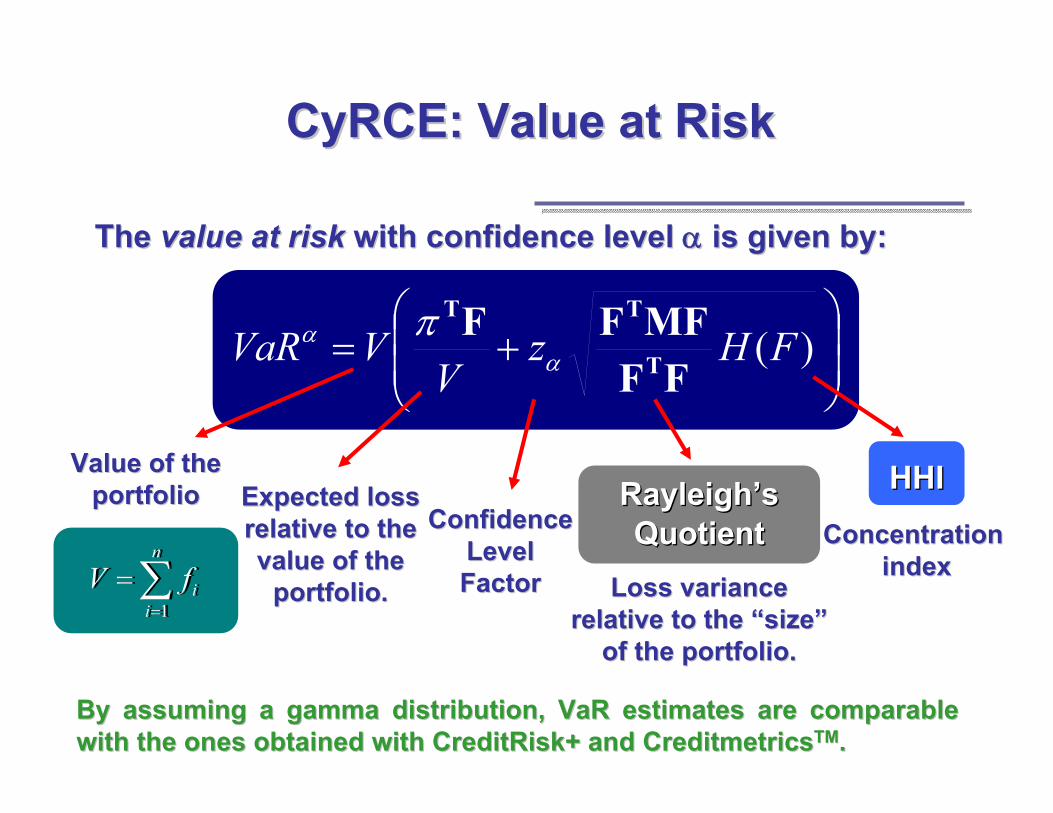
TheThe valuevalue atat riskrisk withwith confidenceconfidence levellevel αα is given byis given by::
⎟⎟⎠
⎞⎜⎜⎝
⎛+= )(FHz
VVVaR
FFMFFFT
TT
αα π
CyRCECyRCE: : ValueValue atat RiskRisk
ValueValue ofof thetheportfolioportfolio
∑=
=n
iifV
1∑=
=n
iifV
1
ConfidenceConfidenceLevelLevelFactorFactor
ExpectedExpected losslossrelativerelative toto thethevaluevalue ofof thethe
portfolioportfolio.. LossLoss variancevariancerelativerelative toto thethe ““sizesize””
of the portfolio.of the portfolio.
RayleighRayleigh’’ssQuotientQuotient
HHIHHI
ConcentrationConcentrationindexindex
By By assumingassuming a gamma a gamma distributiondistribution, , VaRVaR estimatesestimates are comparable are comparable withwith thethe onesones obtainedobtained withwith CreditRiskCreditRisk+ + andand CreditmetricsCreditmetricsTMTM..

⎟⎟
⎠
⎞
⎜⎜
⎝
⎛++= ∑
≠ ji j
ii,jTj
jjjαj
jT
jj VFCF
))H(F,MR(FzVFπ
VVaR 2φα
CyCyRCERCE: Value at Risk per segment: Value at Risk per segment
The portfolio can be The portfolio can be segmentedsegmented arbitrarilyarbitrarily and a and a valuevalue atatriskrisk expressionexpression for each segment for each segment jj per segment per segment isis givengiven by:by:
φφ isis anan adjustmentadjustment factor factor suchsuch thatthat: : == VaRVaRαα∑∑jj
jjVaRVaRαα
Rayleigh’squotient
for segment j
RayleighRayleigh’’ssquotientquotient
forfor segmentsegment jj
Weightedaverage defaultprobability ofthe loans in segment j
Weightedaverage defaultprobability ofthe loans in segment j
Adjustment forExtra group Covariance
Adjustment Adjustment forforExtra group Extra group CovarianceCovariance
HHIHHIjjValue of the
loans in segment j
ValueValue ofof thetheloansloans in in
segmentsegment jj
I.I. CyRCECyRCE
II.II. Stress TestingStress Testing
OutlineOutline

UsingUsing thethe modelmodel forfor CreditCredit Stress Stress testingtesting
•• There is a There is a laglag between Credit and Market risk shocks.between Credit and Market risk shocks.
•• In our experience, it takes a very severe crisis (time and In our experience, it takes a very severe crisis (time and depth) before the impact reflects on credit.depth) before the impact reflects on credit.
•• The economyThe economy’’s imbalance may span several years, so s imbalance may span several years, so that stress tests are done over that stress tests are done over long time horizonslong time horizons..
•• There is no consensus* whether default volatilities and There is no consensus* whether default volatilities and correlations are larger in a stress period.correlations are larger in a stress period.
*A survey of stress tests and current practice at major financia*A survey of stress tests and current practice at major financial institutions. BIS CGFS 2001l institutions. BIS CGFS 2001

UnderstandingUnderstanding thethe losseslosses in in MarketMarket and and CreditCredit shocksshocks
There is a difference in how Market and Credit losses are There is a difference in how Market and Credit losses are realized:realized:
•• A credit loss is realized when A credit loss is realized when a default occursa default occurs, rather , rather than by being forced to sell than by being forced to sell underpricedunderpriced assets.assets.
•• In market risk, the loss can be In market risk, the loss can be avoidedavoided if a position can if a position can be held until the market disturbance disappears.be held until the market disturbance disappears.
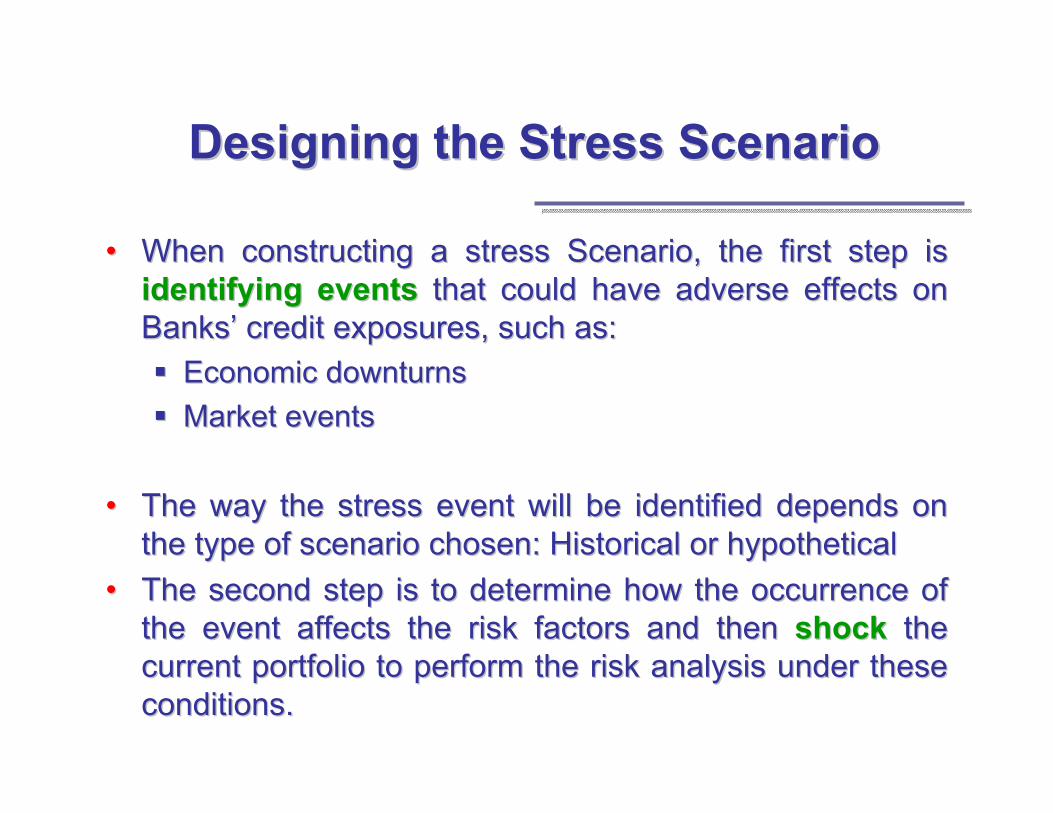
DesigningDesigning thethe Stress Stress ScenarioScenario
•• When constructing a stress Scenario, the first step is When constructing a stress Scenario, the first step is identifying eventsidentifying events that could have adverse effects on that could have adverse effects on BanksBanks’’ credit exposures, such as:credit exposures, such as:
Economic downturnsEconomic downturnsMarket eventsMarket events
•• The way the stress event will be identified depends on The way the stress event will be identified depends on the type of scenario chosen: Historical or hypotheticalthe type of scenario chosen: Historical or hypothetical
•• The second step is to determine how the occurrence of The second step is to determine how the occurrence of the event affects the risk factors and then the event affects the risk factors and then shockshock the the current portfolio to perform the risk analysis under these current portfolio to perform the risk analysis under these conditions.conditions.

I.I. CyRCECyRCE
II.II. Stress TestingStress Testing
1.1. HistoricalHistorical scenarioscenario2.2. MainMain resultsresults
OutlineOutline

TheThe Stress Stress ScenarioScenario usedused: : 1994 1994 MexicanMexican CrisisCrisis
•• Along with the political turmoil, there was an Along with the political turmoil, there was an unsustainable current account deficit and a substantially unsustainable current account deficit and a substantially overvalued currency.overvalued currency.
•• On December 19th, the Government devalued its On December 19th, the Government devalued its currency. Eight days later, the exchange rate had risen currency. Eight days later, the exchange rate had risen 66% from $3.47 to $5.76 MXP per USD.66% from $3.47 to $5.76 MXP per USD.
•• Simultaneously, the interbank shortSimultaneously, the interbank short--term interest rate term interest rate rose 60% from 20.17% to 32.38% by December 22nd.rose 60% from 20.17% to 32.38% by December 22nd.

TheThe EconomyEconomy enteredentered anan inflationaryinflationary periodperiod andand thethe Central Central BankBankswitchedswitched toto a freea free--floatingfloating currencycurrency..Exchange Exchange RateRate
$0.00$0.00
$3.00$3.00
$6.00$6.00
$9.00$9.00
Jul
Jul -- 9
494
Oct
Oct
-- 9494
EneEne
-- 9595
AbrAbr
-- 9595
Jul
Jul -- 9
595
Oct
Oct
-- 9595
EneEne
-- 9696
AbrAbr
-- 9696
Jul
Jul -- 9
696
Oct
Oct
-- 9696
28d 28d CetesCetes InterestInterest raterate
0%0%
20%20%
40%40%
60%60%
80%80%
Jul
Jul -- 9
494
Oct
Oct
-- 9494
EneEne
-- 9595
AbrAbr
-- 9595
Jul
Jul -- 9
595
Oct
Oct
-- 9595
EneEne
-- 9696
AbrAbr
-- 9696
Jul
Jul -- 9
696
Oct
Oct
-- 9696
InflationInflation RateRate
0%0%
20%20%
40%40%
60%60%
80%80%
Jul
Jul -- 9
494
Oct
Oct
-- 9494
EneEne
-- 9595
AbrAbr
-- 9595
Jul
Jul -- 9
595
Oct
Oct
-- 9595
EneEne
-- 9696
AbrAbr
-- 9696
Jul
Jul -- 9
696
Oct
Oct
-- 9696

PerformingPerforming CreditCredit portfolioportfolio ValueValue
•• InflationInflation, , risingrising interestinterest ratesrates and a and a devalueddevalued currencycurrency werewere thethepreamblepreamble forfor defaulteddefaulted loansloans and and anan abruptabrupt halthalt in in creditcredit activityactivity..
00
100100
200200
300300
400400
500500
600600
1990
1990
1991
1991
1992
1992
1993
1993
1994
1994
1995
1995
1996
1996
1997
1997
1998
1998
1999
1999
2000
2000
2001
2001
2002
2002
2003
2003
2004
2004
2005
2005
Bili
lons
Bili
lons
MXP
MXP
MortgagesMortgagesConsumerConsumer loansloansCorporatesCorporates
Figures in Dec1994 MXPFigures in Dec1994 MXP

NonNon--performing loans Value performing loans Value
•• NonNon--performing loans increased 60% in 1995, even after the performing loans increased 60% in 1995, even after the government acquired the distressed debt of the most troubled government acquired the distressed debt of the most troubled banks.banks.
00101020203030404050506060707080809090
1990
1990
1991
1991
1992
1992
1993
1993
1994
1994
1995
1995
1996
1996
1997
1997
1998
1998
1999
1999
2000
2000
2001
2001
2002
2002
2003
2003
2004
2004
2005
2005
Bill
ions
MXP
Bill
ions
MXP MortgagesMortgages
Consumer loansConsumer loansCorporatesCorporates
Figures in Dec1994 MXPFigures in Dec1994 MXP
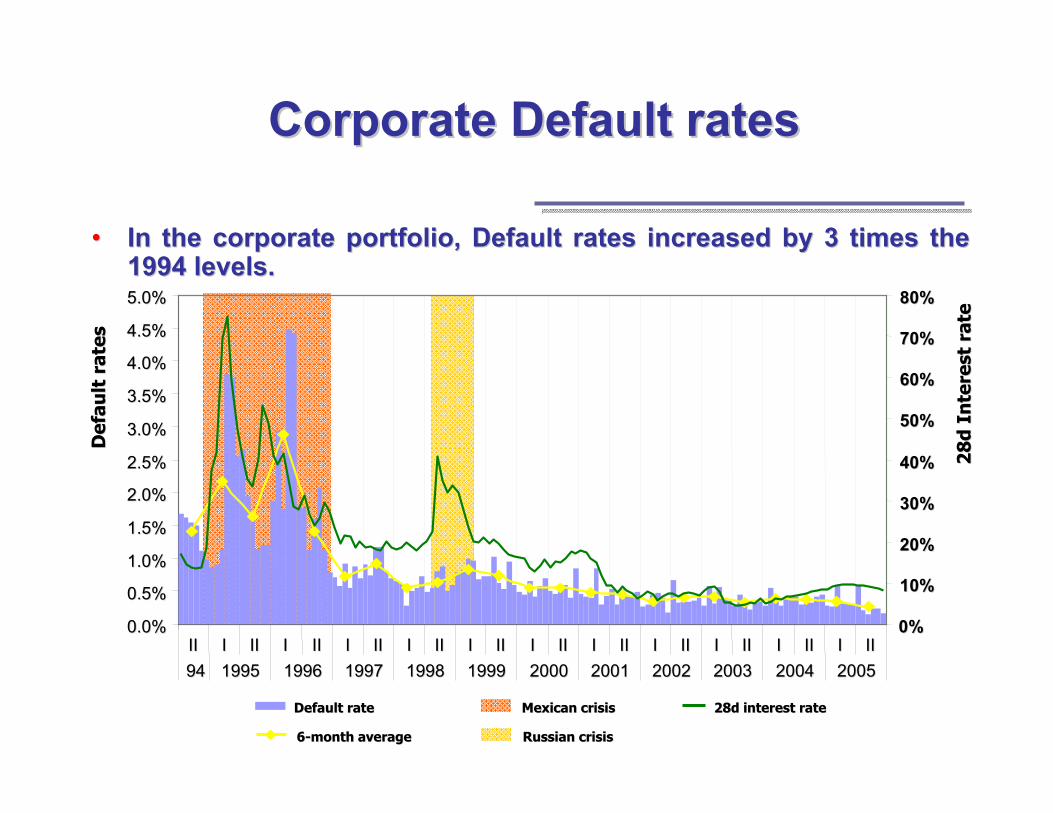
CorporateCorporate DefaultDefault ratesrates
•• In In thethe corporatecorporate portfolioportfolio, , DefaultDefault ratesrates increasedincreased by 3 times by 3 times thethe1994 1994 levelslevels..
Def
ault
Def
ault
rate
sra
tes
28
d 2
8d
Inte
rest
Inte
rest
rate
rate
0.0%0.0%
0.5%0.5%
1.0%1.0%
1.5%1.5%
2.0%2.0%
2.5%2.5%
3.0%3.0%
3.5%3.5%
4.0%4.0%
4.5%4.5%
5.0%5.0%
IIII II IIII II IIII II IIII II IIII II IIII II IIII II IIII II IIII II IIII II IIII II IIII9494 19951995 19961996 19971997 19981998 19991999 20002000 20012001 20022002 20032003 20042004 20052005
0%0%
10%10%
20%20%
30%30%
40%40%
50%50%
60%60%
70%70%
80%80%
DefaultDefault raterate
66--monthmonth averageaverage
MexicanMexican crisiscrisis
RussianRussian crisiscrisis
28d 28d interestinterest raterate

DefaultDefault ratesrates by by economiceconomic sectorsector
•• The first economic sectors to exhibit a rise in default rates weThe first economic sectors to exhibit a rise in default rates were re the the AgriculturalAgricultural,, Transportation and CommunicationsTransportation and Communications and and IndustrialIndustrial sectors. sectors. Construction and CommercialsConstruction and Commercials were the last were the last to react. to react. ServicesServices exhibited high default rates over the 18 exhibited high default rates over the 18 month stress period.month stress period.
0%0%
1%1%
2%2%
3%3%
4%4%
5%5%
6%6%
7%7%
IIII II IIII II IIII II
19941994 19951995 19961996 19971997
AgricultureAgriculture
CommerceCommerce
ConstructionConstruction
TransportTransport &&CommunicationsCommunications
IndustryIndustry
ServicesServices

Capital Capital AdequacyAdequacy Ratio (CAR)Ratio (CAR)
•• The economic and financial situation is different from The economic and financial situation is different from that of previous crisis periods: banks are better that of previous crisis periods: banks are better capitalized and most loans are fixed rate.capitalized and most loans are fixed rate.
1994199410.21%10.21%
2005200515.16%15.16%
0%0%
5%5%
10%10%
15%15%
20%20%
25%25%
30%30%
35%35%
40%40%
88 1010 1212 1414 1616 1818 2020 20+20+0%0%
5%5%
10%10%
15%15%
20%20%
25%25%
30%30%
35%35%
40%40%
88 1010 1212 1414 1616 1818 2020 20+20+
20052005
19941994

StressingStressing CreditCredit RiskRisk
•• Schematically, the design of the stress test is given as Schematically, the design of the stress test is given as follows:follows:
Stress Defaultrates
EstimateProbabilities &Correlationsof default
StressedCredit VaR
BankingSystemStability
Assessment
CumulativeExpectedLosses
CapitalAdequacy
Ratios

I.I. IntroducIntroductiotionn
II.II. CyRCECyRCE
III.III. Stress TestingStress Testing1.1. HistoricalHistorical scenarioscenario2.2. MainMain resultsresults
OutlineOutline

ValueValue atat RiskRisk overover a Stress a Stress periodperiod
•• TheThe ValueValue--atat--riskrisk withwith a 97.5% a 97.5% confidenceconfidence levellevel underunder thethe stress stress scenarioscenario wouldwould be:be:
00
5,0005,000
10,00010,000
15,00015,000
20,00020,000
25,00025,000
30,00030,000
35,00035,000
II IIII II IIII
0505 20062006 20072007
0.0%0.0%
0.5%
1.0%1.0%
1.5%1.5%
2.0%2.0%
2.5%2.5%
3.0%3.0%
ExpectedExpected LossLoss
UnexpectedUnexpected LossLossProbabilityProbability of of DefaultDefault
DefaultDefault correlationcorrelation

RiskRisk contributioncontribution
•• AtAt thethe peakpeak of of thethe stress stress scenarioscenario, , thethe riskrisk contributioncontributionwouldwould be:be:
0%0%
5%5%
10%10%
15%15%
20%20%
25%25%
30%30%
0%0%10%10%20%20%30%30%40%40%50%50%60%60%70%70%80%80%90%90%100%100%
84%84% 99%99%
Dec05 Dec05 VaR97VaR97.5/Capital.5/Capital WorstWorst StressedStressed VaR97VaR97.5/Capital.5/Capital
Dec05 Dec05 RiskRisk ContributionContribution WorstWorst StressedStressed RiskRisk ContributionContribution

ExpectedExpected cumulativecumulative losseslosses
0%0%
5%5%
10%10%
15%15%
20%20%
25%25%
30%30%
10%10% 20%20% 30%30% 40%40% 50%50% 60%60% 70%70% 80%80% 90%90% > 90%> 90%
ExpectedExpected cumulativecumulative losseslosses / Net Capital: / Net Capital: HistogramHistogram

LossLoss DistributionDistribution AnalysisAnalysis
•• The loss distribution for the first six months changes The loss distribution for the first six months changes dramatically with respect to the loss distribution fitted dramatically with respect to the loss distribution fitted before stress.before stress.
LossesLosses in in billionbillion MXPMXP
0.000.00
0.010.01
0.020.02
0.030.03
0.040.04
0.050.05
0.060.06
0.070.07
00 1010 2020 3030 4040 5050 6060 7070 8080 9090
Den
sity
Den
sity
Fun
ctio
nFu
nct
ion
AfterAfter stressstress
Normal Normal marketmarket conditionsconditions
VaRVaR 97.597.517.217.2
VaRVaR 97.597.582.582.5

0%0%
5%5%
10%10%
15%15%
20%20%
25%25%
30%30%
< 7%
< 7% 8%8% 9%9% 10%
10%
11%
11%
12%
12%
13%
13%
14%
14%
15%
15%
16%
16%
17%
17%
18%
18%
19%
19%
20%
20%
> 20
%>
20%
Dec05Dec05Dec05 + 18MDec05 + 18M
CAR CAR comparisoncomparison: : histogramhistogram
MeanMean StdStd devdev18%18%12%12% 8%8%
7%7%TimeTime
•• At the end of the scenario (18 months after its beginning), At the end of the scenario (18 months after its beginning), 20% of the banks show a CAR below 7%, while 8% of the 20% of the banks show a CAR below 7%, while 8% of the banks show a CAR between 7 and 8%.banks show a CAR between 7 and 8%.

AnalysisAnalysis of of troubledtroubled banksbanks
•• Banks showing a CAR below the 8% threshold, were lending Banks showing a CAR below the 8% threshold, were lending mainly in the services sector.mainly in the services sector.
•• Loans in the agriculture sector are backed by the government.Loans in the agriculture sector are backed by the government.
0%0%
10%10%
20%20%
30%30%
40%40%
50%50%
60%60%
70%70%
80%80%
90%90%
0%0% 1%1% 2%2% 3%3% 4%4% 5%5% 6%6% 7%7% 8%8%
AGRAGR
INDIND
SRVSRV
SRVSRV
SRVSRVSRVSRV
CAR CAR onon stress stress scenarioscenario
Ris
kies
tR
iski
est s
ecto
r se
ctor
loss
eslo
sses
Rel
ativ
eR
elat
ive
totoov
eral
lov
eral
l los
ses
loss
es
ScatterScatter plotplot: CAR : CAR vsvsRiskiestRiskiest sector sector losseslosses
SRVSRV

ENDEND


