1964-vasrd-ratings - · PDF file1964-vasrd-ratings - WordPress.com

Credit Ratings across Asset Classes: A ≡ A?
Jess Cornaggia, Kimberly J. Cornaggia, and John E. Hund
*
August 10, 2012
Abstract
We test whether credit ratings contain the same information across asset classes. A variety of
metrics indicate that relative to traditional corporate bonds, municipal and sovereign bonds
receive harsher ratings and structured products receive more generous ratings. These findings
have persisted to varying degrees over the past three decades. Consistent with a conflict of
interest in an issuer-pays compensation structure, ratings standards are inversely correlated with
revenue generation among the asset classes. Our results are less consistent with the more benign
explanation that ratings inflation is a result of issuer opacity. Whatever their cause, these
inconsistent rating standards have consequences for the allocation of regulated capital.
JEL classification: G14, G24, G28, G32
Keywords: Credit Ratings, NRSRO, Municipal Bonds, Sovereign Bonds, CDOs, Capital Markets
Regulation
* J. Cornaggia ([email protected]) and K. Cornaggia ([email protected]) are at the Kelley School of
Business at Indiana University and Hund ([email protected]) is at the Jones Graduate School of Business at Rice
University. The authors are grateful to Mark Adelson, Bo Becker, Adam Kolasinski, Alex Edmans, Jerome Fons,
William Fuchs, Chris Hrdlicka, John Griffin, Ayla Kayhan, Peter Iliev, Walt Pohl, Denis Sosyura, and an
anonymous reviewer for helpful comments, as well as audience members at Indiana University, Pennsylvania State
University, Texas A&M University, the 2012 SFS Finance Cavalcade at Darden University, and the 2012 University
of Washington Summer Finance Conference. The authors thank Toby Kearn for research assistance. J. Cornaggia is
grateful for financial support from the Kelley School of Business Research Database Committee. Any errors belong
to the authors.

Credit Ratings across Asset Classes: A ≡ A?
August 10, 2012
Abstract
We test whether credit ratings contain the same information across asset classes. A variety of
metrics indicate that relative to traditional corporate bonds, municipal and sovereign bonds
receive harsher ratings and structured products receive more generous ratings. These findings
have persisted to varying degrees over the past three decades. Consistent with a conflict of
interest in an issuer-pays compensation structure, ratings standards are inversely correlated with
revenue generation among the asset classes. Our results are less consistent with the more benign
explanation that ratings inflation is a result of issuer opacity. Whatever their cause, these
inconsistent rating standards have consequences for the allocation of regulated capital.
JEL classification: G14, G24, G28, G32
Keywords: Credit Ratings, NRSRO, Municipal Bonds, Sovereign Bonds, CDOs, Capital Markets
Regulation

1
"We have always had one scale, a consistent scale that we have tried to adopt across all
our asset classes."
-- Deven Sharma, President, Standard & Poor’s, July 27, 20111
Credit ratings produced by Nationally Recognized Statistical Ratings Organizations (NRSROs)
play an essential role in the economy. Credit ratings that are publicly observable and easy to
interpret reduce contracting costs for creditors and other counterparties and provide information
to a host of market participants. Credit ratings are also important to debt issuers. Issuers who do
not receive ‘investment grade’ credit ratings face liquidity premiums (in addition to higher credit
risk premiums) because regulations prohibit banks, pension funds, and insurance companies
from holding ‘speculative grade’ debt or require these parties to hold higher reserves when doing
so. Corporations that are unable to secure investment grade credit ratings face higher borrowing
costs and therefore may forgo marginal investments. Likewise, municipalities or sovereign
nations will forgo marginal investments or will raise taxes to cover the higher borrowing costs.
Credit ratings, therefore, have important implications for capital allocation and economic growth.
Underpinning all of these functions is the assumption that credit ratings contain the same
information irrespective of the asset class to which they are assigned. For example, regulations
drawing hard lines at the investment grade cutoff make no distinction between Baa3-rated
municipal bonds, Baa3-rated corporate bonds, or Baa3-rated structured products. But this
assumption ignores variation in risk profiles of the underlying assets and credit-quality shocks
common to a particular sector. The expanding economy of 1990-2007, for example, kept tax
receipts (and thus municipal bond ratings) high. Corporations similarly benefited from the
expansion, but they borrowed more money to repurchase shares in order to maintain financial
leverage. More recently, the financial crisis began with deterioration in Residential Mortgage
Backed Securities (RMBS), was then compounded in the Collateralized Debt Obligations
(CDOs) formed from the poorly–performing RMBS, and ultimately affected corporation
1 Testimony before the U.S. House of Representatives, Committee on Financial Services, Oversight and
Investigations Subcommittee, 2129 Rayburn Office Building, Washington DC, July 27, 2011.

2
financing through the distressed financial institutions. Because these sectors respond differently
(in time and magnitude) to changes in underlying state variables, it is not obvious that similarly-
rated obligations can be viewed equally across asset classes at any point in time.
The fact that credit ratings reflect expected losses, rather than unconditional default
probabilities, further complicates such comparison. Taxing authority and implied support from
higher-level government may reduce the probability of a municipal default, relative to
corporations, but conditional on default the illiquidity of assets funded by municipal bonds
(sewage systems, transportation, public schools, athletic arenas, etc.) result in lower expected
recovery; see Trzcinka (1982). Add the conflict of interest in the issuer-pays rater compensation
model, where certain asset classes represent more influential (i.e., higher rating revenue) issuers,
and one must question the assumption of ratings comparability across asset classes.
To be fair, financial regulators relying on credit ratings appear to have been misinformed
rather than uninformed. The rating agencies have persistently maintained that their ratings are
indeed comparable across sectors and asset classes. Appendix A.1 exhibits such assertions by
Moody’s Investor Service (Moody’s), Standard & Poor’s (S&P), and Fitch Ratings (Fitch),
collectively referred to as the Big 3 credit rating agencies (CRAs). Despite these assertions, we
demonstrate that credit ratings contain different information across asset classes.
For each asset class, we report default frequencies by initial rating, we construct
transition matrices and transition metrics for annual cohorts of issues, we investigate the
distribution of times to upgrade and downgrade via hazard rate models, and we estimate rating
change regression models. Our sample runs from 1980 through 2010. The evidence reveals that
while ratings of structured products are significantly more generous (optimistic) than those of
corporate bonds, those of municipal and sovereign bonds are significantly less generous (more
pessimistic). Further, we document significant differences within the broad category of
structured products. Tranches of collateralized debt obligations (CDOs) and residential mortgage

3
backed securities (RMBS) receive the most generous ratings at issuance, whereas public finance
(PF) tranches receive the least generous ratings of all structured products.
Financial regulation assuming comparability across asset classes thus results in
misallocation of capital, either due to asset mispricing, or to regulatory arbitrage. To the extent
that investors relied on rating agencies as information intermediaries (Grossman and Stiglitz,
1980) they were unknowingly over-exposed to structured products. To the extent that investors
relied on more sophisticated internal bond pricing models to price risk, any misallocation of
regulated capital follows from regulatory arbitrage. For example, consider NAIC guidelines for
insurance company reserves over our sample period:
An insurance company holding only single A rated RMBS (45.7% default in our 1980-2010
sample) faced the same capital requirements as an insurance company holding only single A
rated municipal bonds (0.5% default) or only single A rated corporate bonds (1.8% default).
Assuming securities are priced using information beyond credit ratings, the first insurance
company circumvents the spirit of the regulatory constraints and earns higher yields on its
RMBS. Similar yield chasing on the part of banks and pension funds, backed implicitly by the
federal government, and the misallocation of regulated capital is economy wide.2
Moody’s (2002, 2007) analysts discuss the municipal rating dichotomy, although they
assert that Moody’s assesses sovereign and structured issues according to the same scale as
corporate issues. To our knowledge, we are the first to document comprehensively the apparent
differences in rating standards across all major asset classes. This is the primary contribution of
2 Institutional investors hold approximately 40% of corporate bonds and asset-backed securities; SIFMA (2007).
Credit ratings Capital charge
AAA, AA, A 0.30% BBB 0.96% (3.2 x Category 1) BB 3.39% (11.3 x Category 1) B 7.38% (24.6 x Category 1)
CCC 16.96% (56.5 x Category 1) CC or lower 19.50% (65.0 x Category 1)

4
the paper. We hope it will aid investors, debt issuers, and regulators as they reconsider
appropriate risk metrics for establishing bank capital requirements and prudent investments by
pension funds and insurance companies.
Our evidence that rating performance varies by asset class is consistent with existing
literature addressing inflated credit ratings (particularly among structured finance products) and
their contribution to the recent financial crisis (e.g., Coval, Jurek, and Stafford, 2009). Indeed,
our evidence of rating inflation among structured products is strongest in the crisis years.
However, our sample reveals robust differences in credit ratings across asset classes outside of
the crisis years. For bonds issued in all but one year of the sample (1992), transition metrics
demonstrate that corporate issues exhibit ratings inflation relative to sovereign issues. Similarly,
for bonds issued in every year of the sample but 1986, corporate issues exhibit ratings inflation
relative to municipal issues. Based on these results, we conclude that the difference in ratings
behavior reflects differences in ratings standards at the CRAs as well as differential reactions to
unexpected economic shocks. Potential shocks resulting in upgrades of municipal and sovereign
issues and simultaneous downgrades of corporations and structured products are possible, but
unlikely observed in 24 of 25 draws.
Differences in rating standards across asset classes may result for multiple reasons. The
first is the regulatory reliance itself; see Opp, Opp and Harris (2012). Asset opacity is another
potential factor. For example, synthetic CDOs are more opaque than corporations with audited
financial statements. This opacity could result in greater dispersion among credit assessment by
competing CRAs. This dispersion could result in a greater opportunity for ratings shopping by
the issuers of the CDOs which, in turn, could result in CDOs having higher credit ratings than
corporate bonds with the same risk.3 In the model of Skreta and Veldkamp (2009), ratings
inflation results from issuer opacity even if all CRAs endeavor to produce accurate ratings.
3 Sangiorgi, Sokobin, and Spatt (2009) provide a detailed discussion of rating shopping. Becker and Milbourn
(2010) and Bongaerts, Cremers, and Goetzman (2012) provide evidence that is consistent with the notion that
increased ratings shopping is an unintended consequence of increased competition in the credit ratings industry.

5
Further, Mathis, McAndrews, and Rochert (2009) suggest that CRAs’ concerns over reputation
capital diminish in issuer opacity.
We submit that issuer opacity is a more compelling explanation for ratings inflation
among synthetic CDOs backed by credit default swaps than for traditional RMBS or ABS.
Indeed, one could argue that a pool of mortgages or credit card receivables should be less opaque
than corporate issuers with synthetic leases and other exotic off-balance-sheet liabilities.4
However, we find even these more transparent structured products exhibit significant ratings
inflation relative to corporate bonds.
Moreover, to the extent that issuer opacity is a compelling explanation for ratings
inflation, it should also apply to municipal and sovereign issuers. Dispersion in the qualitative
credit assessment of sovereign nations should, like complex structured products, be greater than
the dispersion in the qualitative assessment of corporations with audited financial statements.5
Regarding local governments, Ingram, Brooks, and Copeland (1983) conclude that, “financial
accounting information about municipalities is generally less reliable, less comparable cross-
sectionally, and less timely than information about corporations” (page 997). However, we find
that ratings among municipal and sovereign bonds do not reflect the same inflation exhibited by
the ratings of structured products. To the contrary, our battery of tests indicates municipal and
sovereign bonds’ ratings are deflated at issuance relative to ratings of corporate bonds.
The body of evidence appears more consistent with a conflict of interest in the issuer-
pays compensation structure. In the model of Fulghieri, Strobl, and Xia (2010), raters enhance
both their revenues and their reputations by issuing lower (pessimistic) unsolicited ratings to
non-paying issuers. We posit that such a phenomenon need not be binary. If pessimistic ratings
4 See Beatty et al. (2010) and Zechman (2010) regarding financial reporting quality and off-balance-sheet financing.
5 Moody’s (2008) Sovereign Analytics Report describes the wide variety of risks associated with sovereign debt that
corporate bonds do not share. The report reviews extensive case studies of sovereign crises, discusses deposit
freezes and debt moratoria, transfer and convertibility risk, country debt ceilings, the distinction between sovereign
and country risk, changing legal provisions in various countries, correlation of sovereign defaults and banking
crises, and Moody’s qualitative approach to sovereign bond ratings.

6
enhance rater reputation, and the lowest ratings are awarded to non-paying issuers, raters should
rationally apply more stringent standards to issuers paying the least. Consistent with this
hypothesis, we find ratings optimism (leniency or inflation) increases in the revenues generated
by asset classes. Revenues generated from structured products are significantly higher than those
generated from corporate issuers which are, in turn, higher than those generated from sovereign
issuers and municipalities. We lack sufficient data to document variation in profit margin by
asset class, which would be more compelling than correlations with revenues (i.e., deal volume).
Still, we note that unlike corporations and municipalities that commonly issue debt at lower
ratings, the market for structured products would not exist without sufficient Aaa tranches.6
Thus, rater revenues are contingent on ratings for these structured products. All things
considered, we conclude that our results are more consistent with a conflict of interest than the
more benign interpretation of CRAs’ best efforts to rate opaque issuers.
Our results are important and timely given the current U.S. Securities and Exchange
Commission (SEC) mandate to consider the feasibility and desirability of standardizing credit
ratings. Our results do not imply that ratings should be (or even could be) standardized across
asset classes.7 Rather, our results imply that reliance on ratings irrespective of asset class results
in over-allocation of regulated funds in higher risk structured products (particularly in recent
years) and under-allocation to less risky sovereign and municipal bonds.
The paper proceeds as follows. Section II provides institutional details, Section III
describes the sample, Section IV discusses the empirical results pertaining to credit rating
performance across asset classes, and Section V concludes.
II. Institutional Detail
6 “‘The rating is what gives birth to the structure in the first place,’ explains Sylvain Raynes, a financial modeling
expert who was with Moody’s in the 1990s. Ratings are often known before the bonds have even been inked. ‘You
start with a rating and build a deal around a rating,’ Brian Clarkson (head of Moody’s mortgage bond division).”
See When Junk Was Gold by Sam Jones, FT.com 10/17/08.
7 The CRAs argue that it is not feasible and some market participants suggest that it is not desirable;
www.sec.gov/comments/4-622/4-622.shtml.

7
A. Dichotomous municipal rating scales
In contrast to Moody’s public assertion of comparable ratings (Appendix A.1), their
analysts report a lower default rate among all municipals when compared to Aaa-rated corporate
issues; Moody’s (2002).8 This 2002 report explains that their municipal bond rating scale is
distinct from the corporate bond rating scale, though the report attests that the corporate scale is
applicable to non-U.S. sovereign issuers and all structured products. As of 2007, Moody’s refers
to this latter scale “used to rate all bonds outside of the U.S. public finance market” as the Global
Rating Scale; Moody’s (2007). Moody’s attributes the duality in part to the tax-exempt nature of
municipal bonds to U.S. investors and in part to a finer gradation in the more stringent municipal
rating scale. Unlike the global rating scale which measures “expected loss” among corporate and
other non-municipal issuers, the municipal rating scale reflects the probability that the
municipality will need support from higher levels of government. Historically, state governments
cover bond payments for distressed municipalities resulting in trivial expected losses among
municipal bonds. Trivial expected losses suggest Aaa ratings according to the corporate rating
scale.
New rules imposed by the SEC (2011) in response to the Dodd-Frank Wall Street Reform
and Consumer Protection Act (hereafter, Dodd-Frank) now explicitly require “consistent
application of ratings symbols and definitions”. Moody’s reports that in moving away from the
dichotomous municipal rating scales, General Obligation (GO) bond ratings would rise by two
notches on average, with a range of zero to three notches, most among those rated below Aa3 on
the municipal scale.9 Likewise, S&P (2009) discusses changes in their rating criteria for CDOs
and RMBS intended to improve the comparability of ratings going forward. But the extent to
which these reported new ratings criteria will improve rating comparability and performance
8 Moody’s reports five- and ten-year cumulative default rates for all rated municipal bond issuers of 0.0233% and
0.0420%, respectively, over the 1970-2000 period. These default rates compare to 0.1237% and 0.6750% for Aaa
rated corporate bonds over the same period.
9 Source: www.bondbuyer.com/issues/119_300/moodys-moving-to-global-muni-scale-1009615-1.html

8
remains to be seen. In December 2010, S&P announced it had “incorrectly analyzed” 1,196 ABS
due to a methodological error and in September 2011 S&P received a formal warning from the
SEC regarding civil fraud charges over ABS ratings (Wall Street Journal, 2011). Also in
September 2011, federal regulators identified and reported continual failures to adhere to stated
methodologies among the NRSROs (SEC, 2011). Most recently, the collapse of MF Global
while it had investment grade ratings from the Big 3 demonstrates reluctance on the part of the
Big 3 to downgrade large, influential issuers.10
B. Implications for regulatory compliance and capital allocation
We assume that large institutional investors rely on more sophisticated risk metrics than
credit ratings to price assets; see Cornaggia and Cornaggia (2012). However, credit ratings
influence their asset allocation as financial regulators have long relied on ratings to establish
reserve requirements.11
Because regulated financial institutions dominate fixed income markets
(SIFMA, 2007) such regulations have important implications for capital allocation in the U.S.
economy.12
Dodd-Frank calls for the removal of NRSRO ratings in SEC rules and other federal
regulations; see Appendix A.2. However, state (i.e., insurance) and international (i.e., Basel)
regulators are not subject to Dodd-Frank mandates.13
Efficient capital allocation requires risk metrics that reflect cardinal (absolute) credit risk
– at least contemporaneously and preferably consistently through time. Prior literature explores
10
MF Global filed a bankruptcy petition October 31, 2011. Former Goldman Sachs CEO, U.S. Senator, and New
Jersey Governor, MF Global CEO Jon Corzine resigned November 4, 2011 as the Department of Justice began its
investigation of the firm. The Big 3 began downgrading the firm after the peak of the financial crises in January
2009, but sustained the firm’s investment grade rating until days prior to the bankruptcy. Moody’s Baa3 rating on
October 24 is the lowest investment grade rating. Of the Big 3, Fitch Ratings was first to downgrade to speculative
grade on October 27.
11 See Cantor and Packer (1997) and Cornaggia and Cornaggia (2012) regarding the pervasive reliance on credit
ratings in regulation of banks, money market and pension funds, and insurance companies.
12 For example, Ellul, Jotikasthira, and Lundblad (2010) document fire sales of downgraded bonds induced by
regulatory constraints imposed on insurance companies. Regarding the dominance by institutional investors, see the
Securities Industry and Financial Markets Association at SIFMA.org.
13 See for example, Dodd-Frank Ban on Ratings Delays U.S. Implementing Basel Rule by Yalman Onaran,
Bloomberg.com September 24, 2010.

9
the consequence of regulatory reliance on ratings that are ordinal (relative), based on qualitative
analysis, paid for by issuers, and intentionally slow to update.14
Another strand of literature
considers variation in credit standards for corporate bonds over time; Blume, Lim, and
MacKinlay (1998), Jorion, Si, and Zhang (2009), and Baghai, Servaes, and Tamayo (2012). We
consider here the potential misallocation of capital resulting from reliance (regulatory or
otherwise) on ratings with standards that vary by asset class.15
The investment- versus speculative-grade cutoff (drawn at Baa3 on the Moody’s rating
scale) is the most prominent rating threshold, but some regulations draw lines elsewhere along
the rating scale. For example, the SEC has historically required money market funds to hold
Aaa-rated commercial paper, and the Basel accords have required that bank reserves vary with
borrower ratings. However, to date none of the ratings-based regulations differentiate thresholds
according to asset class. Given variation in absolute credit risk, regulated institutional investors
can to some extent circumvent regulatory constraints by directing funds to the higher risk asset
classes with lower (risk-adjusted) capital requirements.
III. Sample Description
We employ Moody’s Default and Recovery Database (DRD) and Moody’s Structured
Finance Default Risk Service Database (SFD).16
The DRD contains Moody’s credit ratings
histories for debt obligations issued by corporations (industrials and transportation companies),
financial institutions (U.S. banks, U.S. bank holding companies, securities companies, and
insurance companies), sovereign nations, and local and regional governments. We only include
14
See Partnoy (1999), Griffin and Tang (2012), Kraft (2010), Xia (2010), Bruno et al. (2012), and Cornaggia and
Cornaggia (2012).
15 A U.S. District Court recently denied Moody’s and S&P dismissal of a claim brought by investors alleging
fraudulent ratings resulted in misallocated capital; No. 08 Civ. 7508, 2009 U.S. Dist. LEXIS 79607 (S.D.N.Y. Sept.
2, 2009).
16 Ideally, we would like to examine the difference across asset classes for each NRSRO. However, previous work
indicates that ratings by the Big 3 are highly correlated suggesting that results for S&P or Fitch would likely be
similar to those reported here (Bongaerts, Cremers, and Goetzman, 2012). Thus, the cost of purchasing a complete
ratings history from each CRA likely outweighs the potential benefit of any cross-CRA analysis.

10
regular bonds from the DRD in order to make comparisons across asset classes straightforward
(e.g., we exclude convertible or callable bonds). The SFD includes Moody’s ratings histories for
structured finance products including Asset Backed Securities (ABS are backed by various
receivables including credit cards, auto loans, student loans, equipment leases, etc.),
Collateralized Debt Obligations (CDOs), Commercial Mortgage Backed Securities (CMBS),
structured Public Finance (PF) deals, and Residential Mortgage Backed Securities (RMBS).
While the SFD should contain a comprehensive universe of Moody’s rated structured products
and the DRD a comprehensive universe of corporations, financial institutions, and sovereign
nations, the DRD contains only a sample (N= 6,410) of municipal issues. This sample contains
the only municipal issues Moody’s was willing to make commercially available to us. We
contemplate potential sample selection biases and conclude that if issues contained in the DRD
were in any way ‘cherry picked’ such a selection bias should work against our primary results.
We examine Moody’s credit ratings from both databases that fall along a 21-point
alphanumeric scale. The scale ranges from most creditworthy to least creditworthy: Aaa, Aa1,
Aa2 Aa3, A1, A2, A3, Baa1, Baa2, Baa3, Ba1, Ba2, Ba3, B1, B2, B3, Caa1, Caa2, Caa3, Ca, and
C. We map alphanumeric ratings Aaa, …, C to numeric ratings 21, …, 1 such that ratings are
increasing in credit quality and decreasing in credit risk. Obligations with credit ratings equal to
Baa3 or higher (12 through 21) are “investment grade” and obligations with credit ratings equal
to Ba1 or lower (1 – 11) are “speculative grade.” Our analysis focuses on ratings issued between
1980 and 2010.
A. Sample description
We describe the sample, by asset class, in Table I. The median face value of corporate
bonds ($132M) is more than twice the size of the median municipal issue ($64M). Sovereign
issues are the largest by a wide margin; $769M at the median. Financial issues and structured
tranches are considerably smaller; $25M and $19M at the median, respectively. However, as
noted above, the broad “structured finance” category includes securities backed by a variety of

11
underlying assets. The face values of ABS tranches are the largest sub category ($36M median)
followed by CDOs ($30M), CMBS ($24M), RMBS ($13M). Public finance (PF) tranches are the
smallest ($3M median). The asset classes exhibit large differences in maturity length. Tranches
of structured products have an average maturity of 24.3 years with a median of 29 years. The
other asset classes have means and medians in the range of 5 to 9 years.
[Insert Table I here.]
Initial ratings vary by asset class, as do frequencies of ratings changes. The median
corporate issue is initially rated A3 (15), which is investment grade. Further, these bonds are
more likely to be downgraded (36% probability over the life of the bond) than upgraded (15%
probability over the life of the bond). Conversely, the sample of municipal bonds are almost
three times more likely to be upgraded than downgraded (30% versus 12%), and are more likely
to be upgraded than corporate bonds even though the median is issued at a higher rating (Aa1)
than the median corporate bond. Sovereign issues are similar to the municipals in this regard.
They are almost twice as likely to be upgraded than downgraded even though the median bond
has a higher rating at issuance (Aa3) than the median corporate bond. Conversely, structured
tranches behave more like corporates, but with an even greater frequency of downgrades and an
even lower frequency of upgrades. The median structured tranche was issued with an Aaa rating.
Finally, the financial issues are similar to the corporate bonds in that they exhibit a greater
probability to downgrade instead of upgrade (41% versus 23%).
Frequency of default also varies by asset class. Four percent of our benchmark corporate
bonds default over the sample period. Only 2% of municipal, sovereign, and financial bonds
default, but an astonishing 14% of structured tranches default. This percentage varies
considerably by the underlying asset type: 20% of ABS, 29% of CDOs, 15% RMBS and only
4% of CMBS default. No tranches of the PF deals default over our sample period. We provide
greater detail on defaults by asset class over time in Figure 4.

12
[Insert Table II here.]
The correlation matrix in Table II suggests multicolinearity among the descriptive
variables and asset classes. Table I indicates that sovereign issues have the highest face values;
indeed there is little intersection between sovereign and non-sovereign bonds along this
dimension. Likewise, there is little intersection between structured and non-structured issues in
terms of maturity length. As expected, structured products are strongly positively correlated with
initial ratings, downgrades, and defaults. Although they are also significantly positively
correlated with initial ratings, municipals are negatively correlated with downgrades and
defaults. This effect leads to the somewhat counterintuitive negative correlation between initial
rating and downgrades. Ratings migration matrices presented in Table IV below help explain this
finding. We observe upward ratings momentum among municipals, sovereigns, and PF tranches
that are issued with higher ratings than the average corporate bond.
[Insert Figure 1 here.]
We plot annual issuance volume in our sample by asset class in Figure 1. Because the
sample of municipal issues is incomplete, this figure represents our sample, not the overall fixed
income market. However, we believe our structured products sample is complete and Figure 1
clearly indicates the growth in this sector. Figure 2 provides greater detail of initial ratings for
each asset class and how these evolved over time. In each panel, the proportions are cumulative
with the issues rated Aaa appearing at the top, Aa second from top, and so on.
[Insert Figure 2 here.]
Several interesting patterns emerge from Figure 2. Sovereign issues (Panel C) were
generally investment grade (Baa or higher) prior to the wave of sovereign crises beginning in the

13
mid-1990’s.17
Panel E contains tranches of all structured issues and provides detail regarding the
change in initial ratings of these products over time. Proportionally, the greatest increase is in the
Baa tranches, which are the lowest investment grade ratings. As explained above, the investment
grade threshold has important implications for regulatory compliance for financial institutions
and other institutional investors. Virtually nonexistent prior to 1990, the Baa tranches represent
10.2% of structured issues in 1999, grow to 15% in 2000 and peak at 26% in 2006 before
declining back to 5 and 7% in 2009 and 2010. Conversely, 95% to 100% of tranches in the
earliest years of the sample received Aaa ratings. This proportion declined to 52% in 1995,
ranging from 50% to 65% thereafter.18
We break down the broad structured finance category in
Panels E.1 through E.5. These individual figures display similar qualitative patterns to the pooled
figure in Panel E. The one clear departure from typical is Panel E.4 containing Public Finance
issues which are consistently rated Aaa or Aa.
B. Moody’s revenue by asset class
In Figure 3, we plot annual revenue by asset class as reported in Moody’s 10-K filings.19
By 2005, revenues generated by rating structured products ($709M) are 2.5 times revenues
generated by rating corporate bonds ($277M). By 2008, the difference became smaller ($405M
and $307M, respectively). By 2009 revenues from corporate bonds once again surpassed those
17
See Bartram, Brown, and Hund, (2007) for details on the Mexican crisis (December 1994), Asian crisis (July
1997), Russian crisis (August 1998), LTCM crisis (September 1998), the Brazilian crisis (January 1999) and the
disruption to the financial system following the appalling attacks on the U.S. in September 2001.
18 Although the proportion of Aaa decreased over our sample period, the total volume of Aaa rated structured
products increased (combine Figure 1 and Figure 2) consistent with the predictions of Opp, Opp, and Harris (2012).
19 Prior to 2007, Moody’s combined revenue from financial and sovereign issuers into one asset class, “Financials
and Sovereigns”. In 2007, Moody’s began including revenue from sovereign issuers in “Public Finance” along with
revenues from local governments. In an effort to display consistent revenue classifications through time, we estimate
the revenues attributable to sovereign issuers in 2007-2010 and add it to financial institutions to estimate “Financials
and Sovereigns” as reported by Moody’s prior to 2007. Specifically, we note that in 2006, the last year before the
switch, revenue from sovereign (financial) issuers constituted 10.5 (89.5) percent of “Financials and Sovereigns”.
Assuming a constant proportion going forward, we reconstitute “Financials and Sovereigns” for the years 2007
through 2010 by dividing “Financial Institutions” by 0.895. For the same years, we subtract from “Public Finance”
an amount of revenue equal to the difference between our estimate of “Financials and Sovereigns” and “Financial
Institutions” as reported by Moody’s. Ignoring the reclassification does not alter relative rankings throughout the
entire 2000-2010 period; public finance remains the lowest source of revenues with or without the sovereign
segment and corporate issues and structured products remain the top-two revenue generating asset classes.

14
of structured products. Taken together, Figures 1, 2, and 3 suggest that Moody’s greatest reliance
on structured products occurred between 2000 and 2007. Following the collapse of the structured
finance market in 2008 (Figure 2), corporate issuers are again the primary source of revenue
generation (Figure 3). Public Finance is always the least relevant source of Moody’s revenue.
Motivated by the model of Fulghieri, Strobl, and Xia (2010), we hypothesize that raters enhance
revenue and reputation through more stringent rating standards of lower-paying clients. Figure 3
is consistent with this hypothesis.
[Insert Figure 3 here.]
C. Defaults by asset class through time
We provide more detail regarding default frequency over time in Figure 4. Prior to the
year 2000, the graph depicts low default frequency in general, with corporates higher than
financial services and a trivial incidence among municipals. Corporate defaults correspond
generally with NBER business cycles.20
In the year 2001, we observe a spike in the sovereign
default frequency (approaching 3%) followed by an uptick (1%) among municipals in 2002. The
most recent financial crisis is apparent in the default frequency of tranches of structured
products, although corporate issues and financial institutions also reach in-sample peaks.
[Insert Figure 4 here.]
IV Ratings Performance and Comparability across Asset Classes
In this section, we compare asset classes according to various rating performance metrics.
In order to ease interpretation, we employ bonds issued by corporations (industrials and
transportation firms) as our benchmark. Although we find that they perform similarly in general,
we consider financial institutions’ issues separately from corporate issues because Moody’s
reports them as a separate category (see Figure 3). We analyze structured finance deals at the
20
NBER reports an 8 month contraction July 1990-March 1991, an 8 month contraction March-November 2001,
and an 18 month contraction December 2007 – June 2009. Complete cycle data are available at the NBER’s website:
www.nber.org/cycles.html

15
tranche level because it is possible for tranches to perform differently; i.e., Moody’s could
downgrade a B1-rated tranche without downgrading the Aaa-rated tranches in the same deal.
Distinct types of underlying assets may vary in terms of deal complexity and the various issuer
types also contribute differently to CRA revenue. We thus break structured products into various
deal types in most analyses. Further, we recognize that the tranches of any particular deal are not
entirely independent of one another. Thus, in regression models, we cluster standard errors at the
issuer level (for corporate, municipal, sovereign, and financial issues) and deal level (for tranches
of structured products).
A. Default percentages by asset class and initial credit ratings
We document the frequency of default by initial ratings across asset classes in Table III.
That is, we report the percentage of bonds issued Aaa (or Aa, etc.) that later default within our
sample period separately for each class. To avoid small sample biases, we required at least 100
issues per asset class-initial rating for admission to this analysis. Moody’s intends its ratings to
be ordinal in nature; Moody’s (2002b). If properly ordinal, we should find the default frequency
strictly decreasing in credit ratings. This pattern appears to be the case for the corporate issues
and, to a general extent, the other asset classes. The 4.13% default rate among A-rated financial
bonds is striking, as are the high default rates among investment grade tranches of the structured
products, including Aaa.
[Insert Table III here.]
Table III clearly indicates a material difference in the absolute credit risk implied by any
given rating across asset classes. For example, consider the default frequencies in the A range:
corporations 0.51%, municipals 0.00%, sovereigns 0.00%, financials 4.13%, and structured
tranches 26.97%. The decomposed structured products better indicate the problematic issue
types. The pervasive defaults of investment grade tranches are primarily among ABS, RMBS
and CDO tranches. The defaulting CMBS tranches were largely issued with speculative grade
ratings. There are no defaults among any of the Public Finance tranches.

16
B. Transition matrices
In order to better understand the path from investment grade to default, and to better
appreciate the variation in ratings migration by asset class, we report ratings transition matrices
in Table IV. Transition probability matrices sometimes report ratings migration frequencies as
percentages of the initial rating total. We choose instead to report ratings migration using the
number of issues in each ratings bin five years after the original date of issue. Reporting the
number of issues rather than percentages allows the reader to better visualize the relative mass
across asset classes and across ratings bins within each class. The sum column conveys the
relative likelihood of each initial rating and allows for comparisons across asset classes. We also
summarize the percentages of upgrades and downgrades by initial rating in the rightmost
columns.
[Insert Table IV here.]
We begin by reporting migration of ratings among corporate issues (Panel A) as they
serve as our benchmark for comparison. First, we note the disparity between upgrade (6.63%)
and downgrade (19.06%) frequencies which is consistent with a bias at the time of issuance in
favor of issuing corporations from whom Moody’s receives compensation. This bias is consistent
with the conclusions that Moody’s caters to issuing firms (Kraft, 2010 and Bruno et al., 2012)
and that Moody’s favors Type I classification errors (Cornaggia and Cornaggia (2012)). We also
note a higher downgrade frequency among the higher ratings and higher upgrade frequency
among the lower ratings. This apparently “contrarian” rating migration is not surprising as both
ends of the rating distribution (Aaa and C) can only change in one direction.
The migration of municipal bond ratings in Panel B is remarkably different from that of
corporate bonds. First, we note that although municipal issues have a higher percentage of initial
ratings in the upper echelon (33.65% Aaa and 50.80% Aa), they are far less likely to downgrade
(2.64%) than corporates and more likely to upgrade (9.14%) than corporates. Moreover, unlike
the “contrarian” ratings changes among corporate issues (higher downgrade frequency among

17
the higher ratings and higher upgrade frequency among the lower ratings) the municipal bonds
exhibit ratings changes better characterized as “momentum” (higher downgrade frequency
among the lower ratings and higher upgrade frequency among the higher ratings). Nearly one
half of municipal bonds initially rated A are subsequently upgraded to Aa. It is important to note
that our sample precedes Moody’s advertised recalibration following the introduction of Dodd-
Frank legislation. The upgrades we document between 1980-2010 are on the original, more
granular, municipal scale.
The migration of sovereign issues in Panel C more closely resembles that of municipal
bonds than corporates with a 8.40% (11.08%) frequency of downgrades (upgrades) and a
relatively high incidence of upgrades among the upper echelons (13.90% of Aa-rated issues and
19.90% of A-rated issues are upgraded). Financial issues in Panel D behave similarly to
corporates (23.11% downgrade with a “contrarian” migration pattern), although the frequency of
upgrades is higher (12.00%). The ratings migration in Panel E suggests that the structured
finance products enjoyed the most inflated initial ratings of the broad asset classes. We break
these down into subcategories in panels E.1 through E.5. The rating inflation appears most
severe among the CDOs (62.39% downgraded versus 2.20% upgraded) followed by RMBS
(45.61% downgraded versus 3.45% upgraded) and ABS (36.30% downgraded versus 2.53%
upgraded). The inflation among CMBS at issuance (32.23% downgraded versus 8.78%
upgraded) appears slightly less egregious than the aforementioned structured product types, and
the Public Finance tranches appear more evenly split (15.04% downgraded versus 6.03%
upgraded).
C. Transition metrics
A drawback of the transition matrices in the previous section is they combine the
performance of credit ratings over the entire sample period. This analysis clearly demonstrates
that ratings of asset classes have behaved differently over the last three decades, but it does not
allow us to specify the periods of time in which the individual asset classes experienced the

18
greatest and least amounts of transition, nor whether the differences in transitions across asset
classes are statistically significant. This section extends the analysis in the previous section by
calculating annual transition metrics – scalars that summarize the amount of transition exhibited
by the ratings of each asset class and each year of issuance – and standard errors to assess
statistical significance.
We begin by creating five-year transition matrices similar to those in Table IV, but for
each asset class and each year of issuance. For example, instead of creating one five-year
transition matrix for all corporate issues as in Panel A of Table IV, we separately create 26 five-
year transition matrices for corporate issues. That is, we construct matrices that reveal how the
credit ratings of each cohort of corporate bonds issued each year from 1980 to 2005 transition
over the course of five years after issuance. Next, we convert these matrices into probability
matrices according to the proportions of credit ratings that migrate off the diagonal for each
initial credit rating. As a hypothetical example, assume there were 100 corporate bonds issued
with Aa ratings in 1999. After five years, assume 10 migrated up to Aaa, 60 maintained their Aa
ratings, 10 migrated to A, 10 migrated to Baa, and 10 defaulted. The second row (corresponding
to an initial credit rating of Aa) of the probability transition matrix would contain: 0.10, 0.60,
0.10, 0.10, 0.00 (corresponding to a final rating of Ba), 0.00 (B), 0.00 (Caa), 0.00 (Ca), 0.00 (C),
and 0.10. We construct similar probabilities for all rows (initial credit ratings).
The next step implements a weighting procedure similar to that in Trück and Rachev
(2005). We multiply each probability by the difference between its corresponding row and
column in the matrix. Continuing the hypothetical example, the 10 bonds that migrated up to Aaa
reside in the second row and first column. Therefore, we multiply 0.10 corresponding to these
bonds by 1. The 60 bonds that maintained their Aa ratings reside in the second row and second
column. Therefore, we multiply 0.60 corresponding to these bonds by zero. We multiply 0.10
corresponding to the 10 bonds that were issued with Aa ratings, the second row, and migrated to
A, the third column, by -1. We multiply 0.10 corresponding to the 10 bonds that migrated to Baa,

19
the fourth column, by -2. Finally, we multiply 0.10 corresponding to the 10 bonds that defaulted,
that is, migrated into the tenth column, by -8.
This procedure accomplishes two things. First, it attaches a positive sign to upward
transitions and a negative sign to downward transitions. The 10 bonds that migrated up to Aaa
receive a weight of 1, and the ten bonds that migrated down to A receive a weight of -1. Second,
distant migrations receive more weight than proximal migrations. In our example, 10 bonds
migrated downward one notch to A, and 10 bonds migrated downward eight notches into the
default column. The 10 bonds that default receive a weight (-8) much larger in magnitude than
the bonds that only migrated down one notch (-1).
Next, we sum the weighted probabilities for each row of the matrix. Continuing the
hypothetical example, the sum for the Aa row would be: 0.10 × 1 + 0.60 × 0 + 0.10 × -1 + 0.10 ×
-2 + 0.10 × -8 = -1.00. Finally, we multiply these sums by weights according to the number of
bonds in the row and add them together for the final metric. Continuing the example, if there
were 100 bonds issued with Aa ratings, 300 bonds issued with Baa ratings, and no other bonds,
the example sum of -1.00 would receive a weight of 0.25 and the sum of the Baa-row would
receive a weight of 0.75. Hypothetically, if the Baa row had a sum of -0.40, the final metric for
this example would be: -1.00 × 0.25 + -0.40 × 0.75 = -0.55. This metric succinctly conveys that
Moody’s generally downgraded the 400 corporate bonds issued in 1999. If the metric had been
positive, this would indicate Moody’s generally upgraded the bonds. The domain of this metric is
[-9,8]. A metric of -9 requires all bonds to be issued with Aaa ratings, and all of them must
default within five years (i.e., they must migrate down nine notches). A metric of 8 requires all
bonds to be issued with C ratings, and Moody’s must upgrade all of them to Aaa within five
years (i.e., they must migrate up eight notches).
We calculate these metrics for each asset class and each year of issuance and plot them in
Figure 5. To avoid clutter, we separately plot each asset class’ time series of transition metrics in
separate panels along with the transition metrics for corporate issues for comparison. We

20
calculate bootstrapped standard errors for each transition metric. We perform 1,000 bootstrap
replications for each transition metric, each with a sample size equal to the number of bonds
issued in a given year for a given asset class. Continuing the hypothetical example, we would
calculate 1,000 transition metrics for corporate bonds issued in 1999. Each metric would be
based on 400 random draws (with replacement) from the original sample of corporate bonds
issued in 1999.
[Insert Figure 5 here.]
Panel A plots the transition metrics for municipal and corporate issues. The results
indicate Moody’s tends to downgrade corporate issues more than it downgrades municipal issues
over the entire sample period. Indeed, for 24 of the 25 years of issuance, corporate issues exhibit
greater downward transitions. In 18 of those years, the difference between the municipal and
corporate transition metrics is statistically significant. Only for the 1986 vintage do municipal
issues experience greater downgrades than corporate issues, and the difference is not statistically
significant. Panel B plots the transition metrics for sovereign and corporate issues. Similar to the
results for municipal issues, the results indicate Moody’s tends to downgrade corporate issues
more than it downgrades sovereign issues. For 23 of 24 years of issuance activity, corporate
issues exhibit greater downward transitions. In ten of those years, the difference between
sovereign and corporate transition metrics is statistically significant. Taken together, the results
indicate corporate issues receive more generous ratings at issuance than municipal or sovereign
issues, and this pattern is pervasive throughout our sample period. Panel C does not suggest
systematic ratings inflation of corporate issues relative to financial issues over the sample
period—in some years corporate bonds tend to downgrade more, in other years they tend to
downgrade less. Panel D suggests little ratings surveillance (or few changes in credit quality)
among the early vintages of structured products. However, structured products issued in the later
years of the sample experienced massive downgrades.
D. Hazard rate models

21
This section formally tests differences in probabilities of ratings changes across asset
classes by comparing hazard rates for downgrades and upgrades. Specifically, we denote the
instantaneous downgrade (or upgrade) rate for bond j as hj(t) and estimate:
(1)
for a vector of covariates X. This approach is a single-failure Cox proportional hazard
model with “failure” denoting a downgrade (upgrade), the unit of observation being the time
until a downgrade (upgrade) for each rating change, and allowing observations to exit or censor
upon upgrade (downgrade), maturity, default, or the end of the sample period. For the vector of
covariates X representing dummy variables corresponding to membership in various asset
classes, the coefficient β represents the proportional shift in the instantaneous baseline
downgrade/upgrade intensity, which we set to correspond to corporate bonds. For example, β i =
2 would indicate asset class i has a downgrade rate which is twice that of corporate bonds; β i =
.5 would indicate that asset class i has a downgrade rate half that of corporate bonds.21
Coefficients for all asset classes statistically insignificant from 1 imply strict ratings
comparability in the sense that the distributions of ratings changes are indistinguishable from
those of corporate issues.
Table V presents the results of Cox regressions on ratings changes over the full sample
period for all ratings changes and for subsamples of ratings changes originating from investment
and speculative grades. We recognize that ratings changes are not independent within or across
asset classes. We cluster standard errors separately by year, by issue, by issuer, and report the
most conservative (largest standard errors are obtained by clustering at the issue-level) in Table
V. We observe that ratings change intensities differ across asset classes. All but two coefficients
in the table are significant, most are different from the baseline at the 1% level. Insignificant
coefficients are reported only for the 1.4% of municipal bonds and the 15.7% of sovereign issues
that are issued with speculative grade ratings.
21
This specification implies that significance testing is versus the null of i = 1.
h j t h0 t exp X

22
[Insert Table V here]
Note the pattern across the full sample of low relative downgrade intensities and high
relative upgrade intensities for municipal and sovereign bonds and exactly the opposite pattern
for structured products, with ABS and CDOs exhibiting especially high downgrade intensities.
The full sample results clearly reflect the 98.6% of municipals and 84.3% of sovereign issues
that are issued with investment grade ratings.
Instances where upgrade and downgrade intensities are both greater than the baseline
corporate issues point to highly volatile yet unbiased (relative to corporate issues) ratings
changes, which is the case for the financial asset class. Such a pattern might emerge if these
bonds were more opaque than corporate issues; it is much harder to reconcile the pattern of
higher downgrade and lower upgrade intensities exhibited by all the other asset classes with
theories of asymmetric information. Overall, this table suggests that initial ratings for municipal
and sovereign bonds are too low relative to corporate bonds, ratings for structured products,
especially CDOs, are too high, and financial institutions are more volatile.
A potential drawback of using all ratings changes as observations is that the estimation
could be skewed by differences in ratings momentum across asset classes.22
In Table VI we limit
the sample to the first rating change after issuance to more directly measure the potential implied
bias in the initial rating. The results are broadly similar to the results in Table V. The first ratings
changes of municipal and sovereign bonds are significantly lower for downgrades and higher for
upgrades relative to corporate issues. The evidence also strongly suggesting initial ratings were
biased in favor of at least the CDO class of structured products. Other structured products fare
much better, although ABS and RMBS securities have skewed upgrade and downgrade relative
intensities. Financial bonds continue to have much higher upgrade and downgrade relative
intensities, again consistent with higher issuer opacity in this asset class. Overall, the results
22
Lando and Skodeberg (2002) document significant ratings momentum using a method similar to our Cox
regressions.

23
strongly reject the idea that ratings changes are comparable across asset classes, and also support
the notion that initial ratings on municipal and sovereign classes were too low, and those on
CDOs were too high relative to corporate issues.
[Insert Table VI here.]
Differential ratings changes are obviously dominated by changes during the financial
crisis period of 2007-2010 where large numbers of downgrades clearly affect the downgrade
intensity rate. Table VII confirms this effect by presenting results for ratings changes for full
samples by time period. Nearly half of the ratings changes occur after 2006, reflecting both the
massive waves of issuance in the 2000-2006 period and the rush to downgrade during the
financial crisis. During the crisis, all structured products and financial institutions face far higher
downgrade intensities than the baseline corporate intensity. Municipal and sovereign bonds
maintain significantly lower downgrade intensities than corporate bonds across all periods.
Sovereigns face higher upgrade intensities in all periods. Municipals’ relative upgrade intensity
varies across periods.23
The high-revenue-generating CDOs appear over-rated even in the pre-
crisis period with their downgrade intensity only decreasing to that of corporates during the
“boom” period of 2000-2006 and their upgrade intensity significantly lower than that of
corporate issues throughout the entire sample period.
[Insert Table VII here.]
Results from the Cox proportional regression framework overwhelmingly reject the
hypothesis of ratings comparability, and are highly suggestive of bias in initial ratings for
municipal, sovereign, and structured products relative to the corporate benchmark. These biases
correspond directly to the fees associated with rating each asset class, with municipal and
sovereign bonds persistently underrated and structured products (especially CDOs) persistently
23
The upgrade probabilities would be dramatically higher if our sample included the re-calibration of Moody’s bond
scale for municipals and the concomitant upgrade of virtually all municipal bonds.

24
overrated. In addition, asset classes differ not only in levels of ratings and default behavior, but
also in their distributions of ratings changes and their volatility. Credit risk models (such as
CreditMetrics) that use ratings transition matrices as an input yet ignore asset classes will not
only under- or over-estimate ratings volatility, they will also have biased distributions of rating
change intensities.
E. Rating change regressions
Table IV demonstrates migration from initial rating by asset class and summarizes
upgrades and downgrades in a binary sense. We further explore the extent of these ratings
changes by asset class using discrete (but not binary) ratings changes as the dependent variable
in the regression models found in Table VIII. For ease of interpretation, corporate issues are
again employed as the benchmark class. The dependent variable in Panel A is a discrete variable
capturing the magnitude and direction of ratings changes (measured in ratings notches) for each
issue from the time of issuance until the bond matures, defaults, or until the end of available data.
Our numeric conversions of ratings are increasing in credit quality; i.e. Aaa = 21 and C = 1.
Therefore, if a bond was issued with a rating of Aaa (21) and matured with a rating of Aa2 (19),
its rating change would be -2. This specification means positive coefficients correspond to
upgrades over the life of the bond and negative coefficients correspond to downgrades over the
life of the bond.
Results from the full sample indicate that, relative to corporate issues, municipal and
sovereign bonds are significantly more likely to be upgraded. The corporate bond coefficient is
negative and significant (-1.935) suggesting an average downgrade of nearly 2 notches over the
life of the bonds. The municipal coefficient is positive and significant (1.484) suggesting an
average upgrade of about a notch and a half over the life of the bonds. We confirm that the 3.419
notch difference between the two asset classes is significant. Sovereign issues are also
significantly more likely to be upgraded than corporate bonds, and, like municipals, the
difference is significant across all time periods.

25
Although these results hold throughout the sample period for the municipal and sovereign
issuers, there is a marked change in the year 2000 for the structured products. In fact, the
negative coefficient in the full sample is driven by bonds issued after Moody’s went public in the
year 2000. Tranches of structured products issued between 2000 and 2006 downgrade an average
of 3.219 notches; tranches issued after 2006 downgrade 5.226 notches over the life of the issue.
Prior to 2000, structured products generally experienced upgrades (0.763 notches). Each of these
ratings changes differs significantly from the corporate bonds issued in the same time periods. In
the full sample, ratings of financial institutions appear similar to those of the corporate issues but
again with variation over time. Given the financial crisis of the era, it is not surprising that bonds
issued by financial institutions after 2006 were more likely downgraded.
[Insert Table VIII here.]
The independent variable in Panel B is a binary variable indicating a downgrade from
investment to speculative grade. Therefore, only bonds issued with investment grade ratings
participate in the tests that follow. (One can get a sense for the large fraction of the sample that
has investment grade ratings by comparing the sample sizes in Panels A and B of Table VII.)
Panel A suggested significant downgrade activity among corporate issues, but here we see that
corporate issues are less likely to be downgraded to speculative grade than sovereign, financial,
and structured issues in the full sample. Crossing the investment grade threshold has important
consequences for regulated institutional investors (Ellul, et al., 2010). Only municipal bonds
were less likely downgraded into speculative territory than were corporate bonds. While the
differences in coefficients suggest that corporate bonds are less likely downgraded into
speculative territory in each time period than structured products, we again observe a marked
difference in structured products issued after the year 2000.
[Insert Table IX here.]

26
The dependent variable in Table IX is the same as in Panel A of Table VIII. However, in
Table IX, we decompose structured products based on their underlying assets. We again employ
corporations as the benchmark asset class. This table indicates that the higher downgrade
intensity of structured products relative to corporate issues is driven by CDOs, RMBS, and to a
lesser extent ABS. Conversely, ratings of CMBS and Public Finance tranches are more likely to
be upgraded than corporate issues. Overall, the regression results reported in Tables VIII and IX
generally are consistent with more stringent ratings of the municipal and sovereign issues at
issuance and more generous rating of structured products, those issued after 2000 in particular.
F. Cumulative distributions of default prediction ability and accuracy ratios
Perhaps the most common metrics of ratings performance are empirical cumulative
distributions of default prediction and accuracy ratios (see Cantor and Mann (2003)). Figure 6
displays cumulative distributions of default and the corresponding accuracy ratios for the five
main asset classes in our sample (Panel A), as well as individual structured product types (Panel
B). For each asset class and type of structured product we count the number of bonds with a
given credit rating as of January 1 of any year of the sample and the number of those bonds that
default over the following year. For each credit rating, we divide the full sample count of
defaulted bonds by the full sample count of bonds. This approach calculates a default percentage
associated with each rating. Panels A and B plot the cumulative distribution of these percentages
for each asset class and type of structured product, moving from the lowest credit rating to the
highest. The solid black line in both panels represents the cumulative distribution of ratings that
have no predictive content. In other words, if Moody’s randomly assigned credit ratings, then we
would expect equal percentages of defaults among the ratings, and the solid black line
representing a uniform cumulative distribution function would emerge.
[Insert Figure 6 here. ]

27
In Panel A, the cumulative distribution for municipal bonds lies higher and further to the
left than the other four asset classes. Table I indicates that the default rate among our municipal
bonds is only 2%. Figure 6 suggests that Moody’s does a good job identifying them. Closest to
the cumulative distribution for municipal bonds is that of corporate bonds. The cumulative
distribution for tranches of structured products lies closest to the “randomly assigned”
cumulative distribution. This pattern obtains because more of the highest-rated tranches of
structured products default than similarly highly-rated bonds of other asset classes. Moody’s
ratings for municipal bonds outperform Moody’s ratings of other asset classes in terms of ordinal
performance, with ratings of corporate bonds performing second best and ratings of structured
products performing the worst. We compute accuracy ratios in order to formally express the
difference between these cumulative distributions. Accuracy ratios measure the area between the
cumulative distribution and the dashed line. The larger the ratio, the more accurate the ratings are
in an ordinal sense. To be concrete, we calculate the accuracy ratios as follows:
Accuracy ratio = ∑ [∑ [
u ber o ssues t at de ault over t e ne t year
u ber o ssues
∑ u ber o ssues t at de ault over t e ne t year
u ber o ssues
-
]
] (2)
N = the number of credit rating classifications (we combine ratings of Caa1, Caa2, Caa3, Ca, and
C since so few bonds have these ratings) and i, j, and k are numerical translations of issues’
credit ratings. The accuracy ratios for the five asset classes are as follows: municipal bonds =
0.44, corporate bonds = 0.40, sovereign bonds = 0.36, financial bonds = 0.30, and tranches of
structured products = 0.16. The accuracy ratios of the individual structured products are as
follows: CMBS = 0.33, ABS = 0.17, RMBS = 0.14, and CDO = 0.09. We cannot calculate an
accuracy ratio for PF tranches because none defaulted in our sample.
Taken together, the accuracy ratios provide additional evidence that credit ratings across
asset classes behave differently. The credit ratings of municipal bonds perform best in terms of
ordinal performance, with those of corporate bonds performing second best. The credit ratings of

28
structured products perform worst in an ordinal sense, with those of CDOs exhibiting the worst
performance of the asset class.
V Conclusion
We examine the differential performance of credit ratings across asset classes. We find
that rating standards are inversely correlated with revenue generation. Relative to traditional
corporate issues, structured finance products generate higher revenues for credit rating agencies
and receive significantly higher (more optimistic) ratings. Conversely, municipalities and
sovereign issuers generate the least revenue for credit rating agencies and receive significantly
lower (more stringent) ratings relative to their corporate counterparts.
Our results contribute to the debate surrounding regulatory reliance on credit ratings that
do not reflect absolute credit risk and the associated misallocation of capital. Failure of
regulators to distinguish the credit risk associated with A-rated Collateralized Debt Obligations
(31.26% default frequency) compared to A-rated corporate issues (0.51% default frequency) and
A-rated municipals (none defaulted in our sample) allowed banks, money market and pension
funds, and insurance companies to circumvent regulatory safeguards.
Prior research documents the inflated ratings of structured products and their contribution
to the financial crisis. Our results and conclusions are robust outside of the crisis period. For
bonds issued in all but one year of our 30-year sample, corporate issues exhibit ratings inflation
relative to both municipal and sovereign issues. Overall, we conclude that the difference in
ratings behavior reflects differences in ratings standards as well as differential reactions to
unexpected economic shocks.

29
References
Baghai, Ramin, Henri Servaes, and Ane Tamayo, 2012, Have rating agencies become more
conservative? Implications for capital structure and debt pricing, working paper.
Bartram, Sohnke, Greg Brown, and John E. Hund, 2007 Estimating systemic risk in the
international financial system, Journal of Financial Economics 86, 835-869.
Beatty, A., Liao, S., and Weber, J., 2010, Financial reporting quality, private information,
monitoring, and the lease-versus-buy decision. The Accounting Review 85, 1215-1238.
Becker, Bo and Todd Milbourn, 2010, Reputation and competition: evidence from the credit
rating industry, Journal of Financial Economics 101(3), 493-514.
Blume, Marshall E., Felix Lim, and A. Craig MacKinlay, 1998, The declining credit quality of
U.S. corporate debt: Myth or reality?, Journal of Finance 53(4), 1389-1413.
Bongaerts, Dion, Martijn Cremers, and William Goetzman, 2012, Tiebreaker: certification and
multiple credit ratings, Journal of Finance 67, 113-152.
Bruno, Valentina, Jess Cornaggia, and Kimberly J. Cornaggia, 2012, Does certification affect the
information content of credit ratings?, Working paper.
Cantor, Richard, and Frank Packer, 1997, Differences of opinion and selection bias in the credit
rating industry, Journal of Banking & Finance 21(10), 1395-1417.
Cornaggia, Jess, and Kimberly J. Cornaggia, 2012, Estimating the costs of issuer-paid credit
ratings, Working paper.
Coval, Joshua, Jakub Jurek, and Erik Stafford, 2009, The economics of structured finance,
Journal of Economic Perspectives 23(1), 3–25.
Ellul, Andrew, Chotibhak Jotikasthira, and Christian Lundblad, 2010, Regulatory pressure and
fire sales in the corporate bond markets, Journal of Financial Economics, forthcoming.
Fulghieri, Paolo, Gunter Strobl, and Han Xia, 2010, The economics of solicited and unsolicited
credit ratings, Working paper.
Griffin, John M. and Dragon Tang, 2012, Did subjectivity play a role in CDO credit ratings?
Journal of Finance, forthcoming. .
Ingram, Robert W., Leroy D. Brooks, and Ronald M. Copeland, 1983, The information content
of municipal bond rating changes: A note, Journal of Finance 38(3), 997-1003.
Ingram, Robert W. and Ronald M. Copeland, 1982, Municipal market measures and reporting
practices: An extension, Journal of Accounting Research 20(2), 766-772.
Jafry, Yusuf, and Til Schuermann, 2004, Measurement, estimation and comparison of credit
migration matrices, Journal of Banking and Finance 28(11), 2603-2639.
Jorion, Philippe, Charles Shi, and Sanjian Zhang, 2009, Tightening credit standards: the role of
accounting quality, Review of Accounting Studies 14, 123-160.

30
Kraft, Pepa, 2010, Do rating agencies cater? Evidence from rating-based contracts, Working
paper.
Lando, David, and Torben M. Skødeberg, 2002, Analyzing rating transitions and rating drift with
continuous observations, Journal of Banking and Finance 26(2), 423-444
Mathis, Jerome, James McAndrews, and Jean-Charles Rochet, 2009, Rating the raters: Are
reputation concerns powerful enough to discipline rating agencies?, Journal of Monetary
Economics 56, 657-674.
McDonald, Michael and Christine Richard, 2008, Insurance drops for municipal debt,
undermines MBIA (Update 3), Bloomberg News, March 13.
Moody’s (2002) Special Comment: Moody’s US municipal bond rating scale, November.
Moody’s (2002b) Special Comment: Understanding Moody’s corporate bond ratings and rating
process, May.
Moody’s (2006) Special Comment: Analyzing the tradeoff between ratings accuracy and
stability, September.
Moody’s (2007) Rating Methodology: The U.S. Municipal Bond Rating Scale: Mapping to the
Global Rating Scale and assigning Global Ratings to municipal obligations, March.
Moody’s (2008) Sovereign Analytics: Sovereign defaults and interference: Perspectives on
government risks, August.
Morse, Dale, and Cathy Deely, 1983, Regional differences in municipal bond ratings, Financial
Analysts Journal 39 (6), 54-59.
Opp, Christian C., Marcus M. Opp, and Milton Harris, 2012, Rating agencies in the face of
regulation, Journal of Financial Economics, forthcoming.
Partnoy, Frank, 1999, The Siskel and Ebert of financial markets: two thumbs down for the credit
rating agencies, Washington University Law Quarterly 77, 619-712.
Peng, Jun, 2002, Do investors look beyond insured triple-A rating? An analysis of Standard &
Poor’s underlying ratings, Public Budgeting and Finance 22, 115-131.
Sangiorgi, Francesco, Jonathan Sokobin, and Chester Spatt, 2009, Credit-rating shopping,
selection and the equilibrium structure of ratings, working paper.
SIFMA, 2007, SIFMA/EPDA/EHYA response to CESR call for evidence on non-equity markets
transparency, March 6.
Skreta, Vasiliki, and Laura Veldkamp, 2009, Ratings shopping and asset complexity: A theory of
ratings inflation, Journal of Monetary Economics 56, 678-695.
Standard & Poor’s, 2009, Big changes in Standard & Poor’s Rating Criteria, November 3.
Trück, Stefan, and Svetlozar T. Rachev, 2005, Changes in migration matrices and credit VaR – a
new class of difference indices, Working paper.

31
Trzcinka, Charles, 1982, The pricing of tax-exempt bonds and the miller hypothesis, Journal of
Finance 37 (4), 907-923.
U.S. Securities and Exchange Commission, 2011, Summary report of commission staff’s
examinations of each NRSRO: As required by Section 15E(p)(3)(c) of the Securities
Exchange Act of 1934.
Wall Street Journal, 2011, SEC Criticizes Credit Raters; by Jean Eaglesham and Jeannette
Neumann, October 1.
Xia, Han, 2010, The issuer-pay rating model and rating inflation: Evidence from corporate credit
ratings, Working paper.
Zechman, S., 2010. The relation between voluntary disclosure and financial reporting:
evidence from synthetic leases. Journal of Accounting Research 48, 725-765.

32
Appendix
A.1. CRA assertion of comparable rating standards across asset classes24
"Standard & Poor’s strives to make its rating symbols reflect a broadly comparable view of
creditworthiness wherever they appear. Standard & Poor’s believes that maximizing
comparability makes Standard & Poor’s’ ratings more useful to investors. Thus, when Standard
& Poor’s assigns a given rating symbol to multiple issuers, it intends to connote roughly the
same opinion of creditworthiness, irrespective of whether the issuers are a Canadian mining
company, a Japanese financial institution, an Illinois school district, a British mortgage-backed
security, or a sovereign nation."
- Deven Sharma, President, Standard & Poor’s, February 7, 2011
"To meet needs over time, credit ratings have developed important attributes including
insightful, robust and independent analysis, symbols that succinctly communicate opinions, and
broad coverage across markets, industries and asset classes. These attributes have enabled credit
ratings to serve as a point of reference and common language of credit that is used by financial
market professionals worldwide to compare risk across jurisdictions, industries and asset classes,
thereby facilitating the efficient flow of capital worldwide."
- Farisa Zarin, Managing Director, Moody’s Investors Service, February 18, 2011.
"Fitch’s first and primary goal is that over the longer term, default rates will be broadly similar
for like-rated securities across all asset classes. As a secondary goal, Fitch aspires to greater
comparability of ratings transition/volatility across asset classes, especially at the highest end of
the rating scale."
- John S. Olert, Chief Credit Officer, Fitch Ratings, March 7, 2011. (Reference is taken
from appended “Ratings Comparability” Special Report dated June 21, 2010, and co-
authored by Mr. Olert.)
24
We collect these quotes from comment letters written in response to the SEC’s proposed Credit Rating
Standardization: www.sec.gov/comments/4-622/4-622.shtml

33
A.2. Relevant Sections of Dodd-Frank Wall Street Reform and Consumer Protection Act
SEC. 939A. REVIEW OF RELIANCE ON RATINGS.
(a) AGENCY REVIEW.—Not later than 1 year after the date of the enactment of this subtitle,
each Federal agency shall, to the extent applicable, review—
(1) any regulation issued by such agency that requires the use of an assessment of the credit-
worthiness of a security or money market instrument; and
(2) any references to or requirements in such regulations regarding credit ratings.
(b) MODIFICATIONS REQUIRED.—Each such agency shall modify any such regulations
identified by the review conducted under subsection (a) to remove any reference to or
requirement of reliance on credit ratings and to substitute in such regulations such standard of
credit-worthiness as each respective agency shall determine as appropriate for such regulations.
In making such determination, such agencies shall seek to establish, to the extent feasible,
uniform standards of credit-worthiness for use by each such agency, taking into account the
entities regulated by each such agency and the purposes for which such entities would rely on
such standards of credit-worthiness.
(c) REPORT.—Upon conclusion of the review required under subsection (a), each Federal
agency shall transmit a report to Congress containing a description of any modification of any
regulation such agency made pursuant to subsection (b).
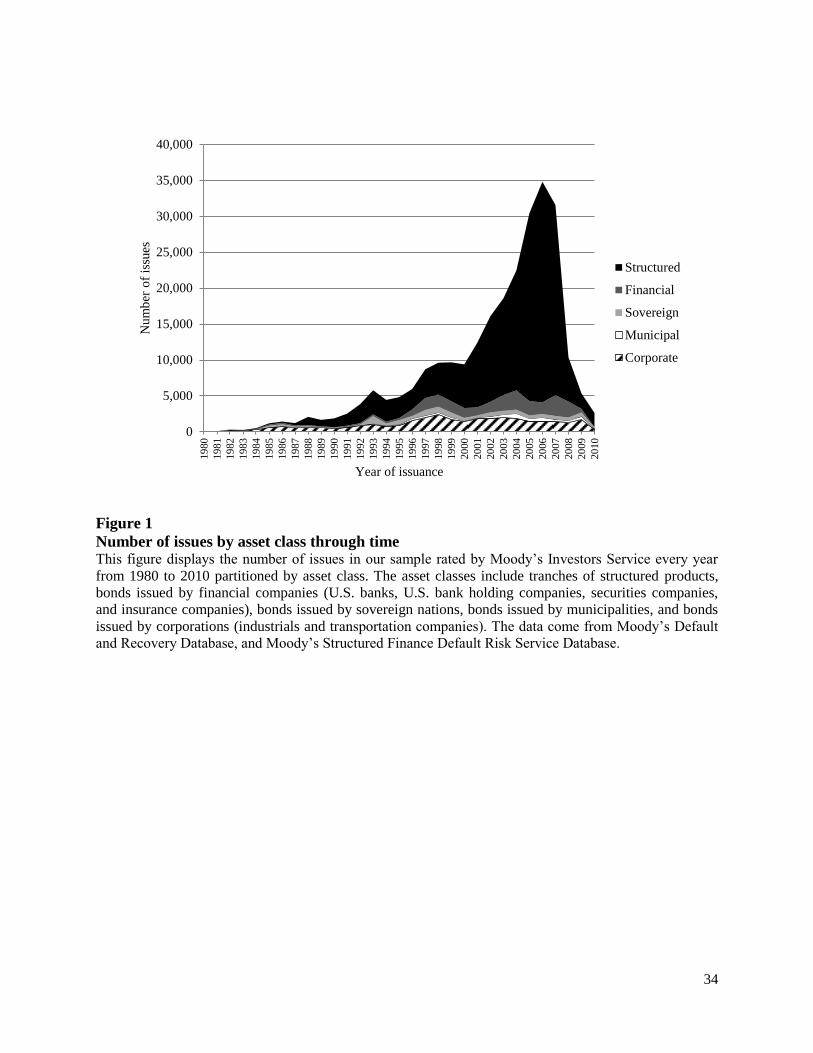
34
Figure 1
Number of issues by asset class through time This figure displays the number of issues in our sample rated by Moody’s Investors Service every year
from 1980 to 2010 partitioned by asset class. The asset classes include tranches of structured products,
bonds issued by financial companies (U.S. banks, U.S. bank holding companies, securities companies,
and insurance companies), bonds issued by sovereign nations, bonds issued by municipalities, and bonds
issued by corporations (industrials and transportation companies). The data come from Moody’s Default
and Recovery Database, and Moody’s Structured Finance Default Risk Service Database.
0
5,000
10,000
15,000
20,000
25,000
30,000
35,000
40,000
19
80
19
81
19
82
19
83
19
84
19
85
19
86
19
87
19
88
19
89
19
90
19
91
19
92
19
93
19
94
19
95
19
96
19
97
19
98
19
99
20
00
20
01
20
02
20
03
20
04
20
05
20
06
20
07
20
08
20
09
20
10
Num
ber
of
issu
es
Year of issuance
Structured
Financial
Sovereign
Municipal
Corporate

35
Panel A. Corporate issues
Panel B. Municipal issues
0
500
1,000
1,500
2,000
2,500
3,000
19
80
19
81
19
82
19
83
19
84
19
85
19
86
19
87
19
88
19
89
19
90
19
91
19
92
19
93
19
94
19
95
19
96
19
97
19
98
19
99
20
00
20
01
20
02
20
03
20
04
20
05
20
06
20
07
20
08
20
09
20
10
Num
ber
of
issu
es
Year of issuance
Aaa
Aa
A
Baa
Speculative
0
100
200
300
400
500
600
700
19
80
19
81
19
82
19
83
19
84
19
85
19
86
19
87
19
88
19
89
19
90
19
91
19
92
19
93
19
94
19
95
19
96
19
97
19
98
19
99
20
00
20
01
20
02
20
03
20
04
20
05
20
06
20
07
20
08
20
09
20
10
Num
ber
of
issu
es
Year of issuance
Aaa
Aa
A
Baa
Speculative

36
Panel C. Sovereign issues
Panel D. Financial issues
0
200
400
600
800
1,000
1,200
19
80
19
81
19
82
19
83
19
84
19
85
19
86
19
87
19
88
19
89
19
90
19
91
19
92
19
93
19
94
19
95
19
96
19
97
19
98
19
99
20
00
20
01
20
02
20
03
20
04
20
05
20
06
20
07
20
08
20
09
20
10
Num
ber
of
issu
es
Year of issuance
Aaa
Aa
A
Baa
Speculative
0
500
1,000
1,500
2,000
2,500
3,000
3,500
19
80
19
81
19
82
19
83
19
84
19
85
19
86
19
87
19
88
19
89
19
90
19
91
19
92
19
93
19
94
19
95
19
96
19
97
19
98
19
99
20
00
20
01
20
02
20
03
20
04
20
05
20
06
20
07
20
08
20
09
20
10
Num
ber
of
issu
es
Year of issuance
Aaa
Aa
A
Baa
Speculative

37
Panel E. Structured issues
Panel E.1. Structured issues – Asset Backed Securities
0
5,000
10,000
15,000
20,000
25,000
30,000
35,000
19
80
19
81
19
82
19
83
19
84
19
85
19
86
19
87
19
88
19
89
19
90
19
91
19
92
19
93
19
94
19
95
19
96
19
97
19
98
19
99
20
00
20
01
20
02
20
03
20
04
20
05
20
06
20
07
20
08
20
09
20
10
Num
ber
of
issu
es
Year of issuance
Aaa
Aa
A
Baa
Speculative
0
2,000
4,000
6,000
8,000
10,000
12,000
19
80
19
81
19
82
19
83
19
84
19
85
19
86
19
87
19
88
19
89
19
90
19
91
19
92
19
93
19
94
19
95
19
96
19
97
19
98
19
99
20
00
20
01
20
02
20
03
20
04
20
05
20
06
20
07
20
08
20
09
20
10
Num
ber
of
issu
es
Year of issuance
Aaa
Aa
A
Baa
Speculative

38
Panel E.2. Structured issues – Collateralized Debt Obligations
Panel E.3. Structured issues – Commercial Mortgage Backed Securities
0
1,000
2,000
3,000
4,000
5,000
6,000
19
80
19
81
19
82
19
83
19
84
19
85
19
86
19
87
19
88
19
89
19
90
19
91
19
92
19
93
19
94
19
95
19
96
19
97
19
98
19
99
20
00
20
01
20
02
20
03
20
04
20
05
20
06
20
07
20
08
20
09
20
10
Num
ber
of
issu
es
Year of issuance
Aaa
Aa
A
Baa
Speculative
0
500
1,000
1,500
2,000
2,500
3,000
19
80
19
81
19
82
19
83
19
84
19
85
19
86
19
87
19
88
19
89
19
90
19
91
19
92
19
93
19
94
19
95
19
96
19
97
19
98
19
99
20
00
20
01
20
02
20
03
20
04
20
05
20
06
20
07
20
08
20
09
20
10
Num
ber
of
issu
es
Year of issuance
Aaa
Aa
A
Baa
Speculative
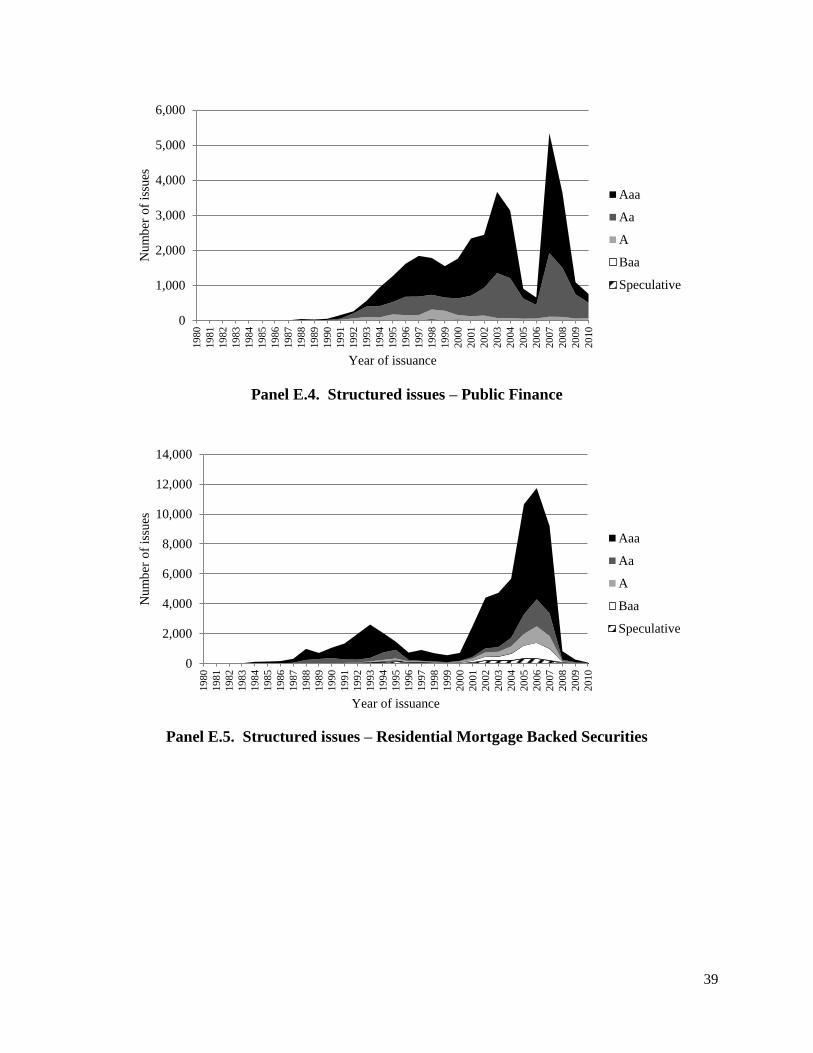
39
Panel E.4. Structured issues – Public Finance
Panel E.5. Structured issues – Residential Mortgage Backed Securities
0
1,000
2,000
3,000
4,000
5,000
6,000
19
80
19
81
19
82
19
83
19
84
19
85
19
86
19
87
19
88
19
89
19
90
19
91
19
92
19
93
19
94
19
95
19
96
19
97
19
98
19
99
20
00
20
01
20
02
20
03
20
04
20
05
20
06
20
07
20
08
20
09
20
10
Num
ber
of
issu
es
Year of issuance
Aaa
Aa
A
Baa
Speculative
0
2,000
4,000
6,000
8,000
10,000
12,000
14,000
19
80
19
81
19
82
19
83
19
84
19
85
19
86
19
87
19
88
19
89
19
90
19
91
19
92
19
93
19
94
19
95
19
96
19
97
19
98
19
99
20
00
20
01
20
02
20
03
20
04
20
05
20
06
20
07
20
08
20
09
20
10
Num
ber
of
issu
es
Year of issuance
Aaa
Aa
A
Baa
Speculative

40
Figure 2
Number of issues by initial credit rating through time Panels A through E display the number of new issues rated by Moody’s Investors Service every year from
1980 to 2010 for each asset class and initial credit rating. The asset classes include tranches of structured
products, bonds issued by financial companies (U.S. banks, U.S. bank holding companies, securities
companies, and insurance companies), bonds issued by sovereign nations, bonds issued by municipalities,
and bonds issued by corporations (industrials and transportation companies). Panels E.1. through E.5.
display the tranches of structured products decomposed into their respective product types: Asset Backed
Securities, Collateralized Debt Obligations, Commercial Mortgage Backed Securities, Public Finance,
and Residential Mortgage Backed Securities. The data come from Moody’s Default and Recovery
Database, and Moody’s Structured Finance Default Risk Service Database. The rating scale in this figure
is a simplified version of Moody’s traditional 21-point alphanumeric scale. For example, we combine
initial issues with credit ratings of Aa1, Aa2, and Aa3 into one bin, Aa.
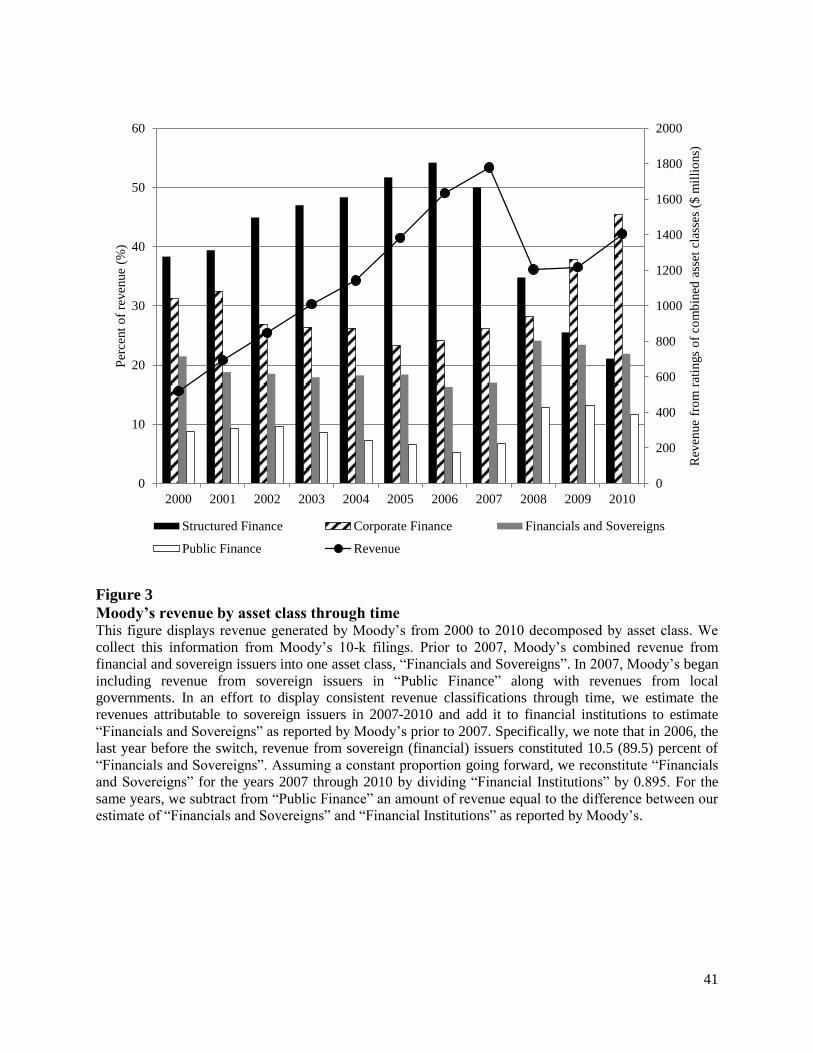
41
Figure 3
Moody’s revenue by asset class through time This figure displays revenue generated by Moody’s from 2000 to 2010 decomposed by asset class. We
collect this information from Moody’s 10-k filings. Prior to 2007, Moody’s combined revenue from
financial and sovereign issuers into one asset class, “Financials and Sovereigns”. In 2007, Moody’s began
including revenue from sovereign issuers in “Public Finance” along with revenues from local
governments. In an effort to display consistent revenue classifications through time, we estimate the
revenues attributable to sovereign issuers in 2007-2010 and add it to financial institutions to estimate
“Financials and Sovereigns” as reported by Moody’s prior to 2007. Specifically, we note that in 2006, the
last year before the switch, revenue from sovereign (financial) issuers constituted 10.5 (89.5) percent of
“Financials and Sovereigns”. Assuming a constant proportion going forward, we reconstitute “Financials
and Sovereigns” for the years 2007 through 2010 by dividing “Financial Institutions” by 0.895. For the
same years, we subtract from “Public Finance” an amount of revenue equal to the difference between our
estimate of “Financials and Sovereigns” and “Financial Institutions” as reported by Moody’s.
0
200
400
600
800
1000
1200
1400
1600
1800
2000
0
10
20
30
40
50
60
2000 2001 2002 2003 2004 2005 2006 2007 2008 2009 2010
Rev
enue
fro
m r
atin
gs
of
com
bin
ed a
sset
cla
sses
($
mil
lio
ns)
Per
cent
of
reven
ue
(%)
Structured Finance Corporate Finance Financials and Sovereigns
Public Finance Revenue

42
Figure 4
Percent of outstanding issues that default by asset class through time This figure displays the percentage of outstanding issues of each asset class that default within calendar
years 1980 to 2010. The asset classes include tranches of structured products, bonds issued by financial
companies (U.S. banks, U.S. bank holding companies, securities companies, and insurance companies),
bonds issued by sovereign nations, bonds issued by municipalities, and bonds issued by corporations
(industrials and transportation companies). The data come from Moody’s Default and Recovery Database,
and Moody’s Structured Finance Default Risk Service Database.
0
2
4
6
8
10
12
19
80
19
81
19
82
19
83
19
84
19
85
19
86
19
87
19
88
19
89
19
90
19
91
19
92
19
93
19
94
19
95
19
96
19
97
19
98
19
99
20
00
20
01
20
02
20
03
20
04
20
05
20
06
20
07
20
08
20
09
20
10
Per
cent
of
outs
tand
ing i
ssues
that
def
ault
(%
)
Corporate Municipal Sovereign Financial Structured
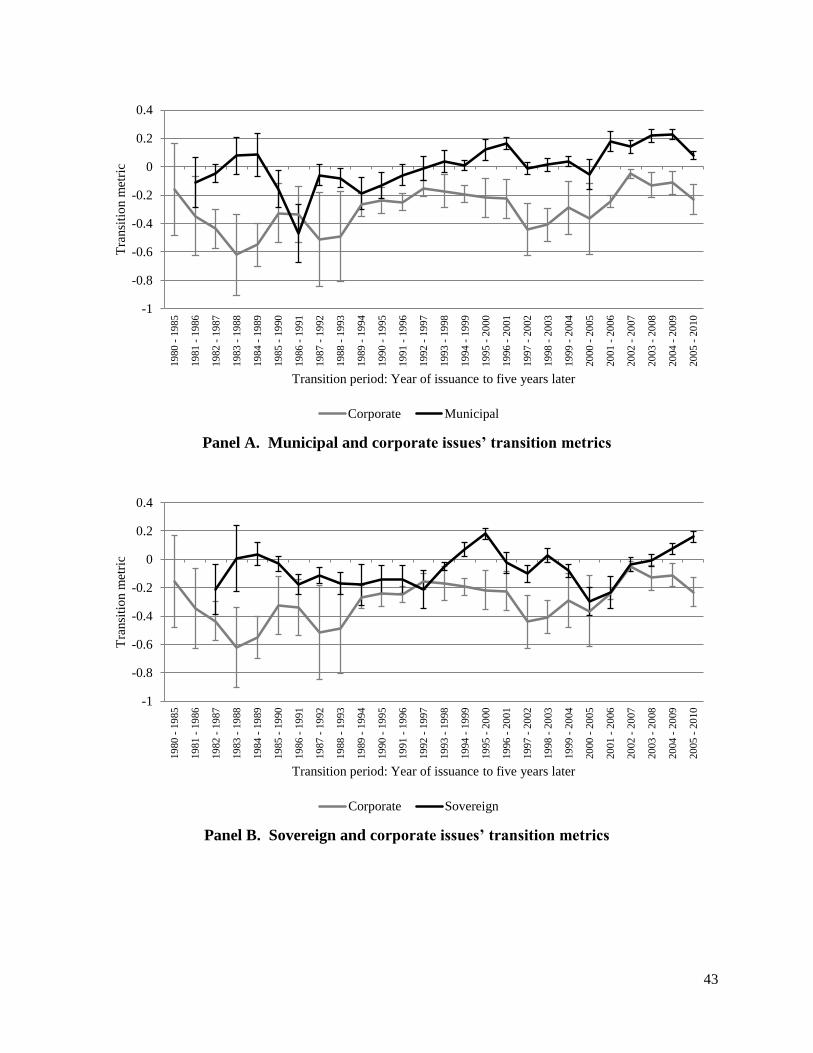
43
Panel A. Municipal and corporate issues’ transition metrics
Panel B. Sovereign and corporate issues’ transition metrics
-1
-0.8
-0.6
-0.4
-0.2
0
0.2
0.4
19
80 -
19
85
19
81 -
19
86
19
82 -
19
87
19
83 -
19
88
19
84 -
19
89
19
85 -
19
90
19
86 -
19
91
19
87 -
19
92
19
88 -
19
93
19
89 -
19
94
19
90 -
19
95
19
91 -
19
96
19
92 -
19
97
19
93 -
19
98
19
94 -
19
99
19
95 -
20
00
19
96 -
20
01
19
97 -
20
02
19
98 -
20
03
19
99 -
20
04
20
00 -
20
05
20
01 -
20
06
20
02 -
20
07
20
03 -
20
08
20
04 -
20
09
20
05 -
20
10
Tra
nsi
tio
n m
etri
c
Transition period: Year of issuance to five years later
Corporate Municipal
-1
-0.8
-0.6
-0.4
-0.2
0
0.2
0.4
19
80 -
19
85
19
81 -
19
86
19
82 -
19
87
19
83 -
19
88
19
84 -
19
89
19
85 -
19
90
19
86 -
19
91
19
87 -
19
92
19
88 -
19
93
19
89 -
19
94
19
90 -
19
95
19
91 -
19
96
19
92 -
19
97
19
93 -
19
98
19
94 -
19
99
19
95 -
20
00
19
96 -
20
01
19
97 -
20
02
19
98 -
20
03
19
99 -
20
04
20
00 -
20
05
20
01 -
20
06
20
02 -
20
07
20
03 -
20
08
20
04 -
20
09
20
05 -
20
10
Tra
nsi
tio
n m
etri
c
Transition period: Year of issuance to five years later
Corporate Sovereign

44
Panel C. Financial and corporate issues’ transition metrics
Panel D. Structured and corporate issues’ transition metrics
Figure 5
Transition metrics by asset class and year of issuance This figure displays transition metrics based on five-year transition matrices for each asset class and year
of issuance. Each panel includes the transition metrics for corporate issues for comparison purposes. The
vertical bars represent 95 percent confidence intervals. We provide a complete description of how we
compute the transition metrics and their standard errors in the text.
-1.5
-1
-0.5
0
0.5
1
19
80 -
19
85
19
81 -
19
86
19
82 -
19
87
19
83 -
19
88
19
84 -
19
89
19
85 -
19
90
19
86 -
19
91
19
87 -
19
92
19
88 -
19
93
19
89 -
19
94
19
90 -
19
95
19
91 -
19
96
19
92 -
19
97
19
93 -
19
98
19
94 -
19
99
19
95 -
20
00
19
96 -
20
01
19
97 -
20
02
19
98 -
20
03
19
99 -
20
04
20
00 -
20
05
20
01 -
20
06
20
02 -
20
07
20
03 -
20
08
20
04 -
20
09
20
05 -
20
10
Tra
nsi
tio
n m
etri
c
Transition period: Year of issuance to five years later
Corporate Financial
-3.5
-3
-2.5
-2
-1.5
-1
-0.5
0
0.5
19
80 -
19
85
19
81 -
19
86
19
82 -
19
87
19
83 -
19
88
19
84 -
19
89
19
85 -
19
90
19
86 -
19
91
19
87 -
19
92
19
88 -
19
93
19
89 -
19
94
19
90 -
19
95
19
91 -
19
96
19
92 -
19
97
19
93 -
19
98
19
94 -
19
99
19
95 -
20
00
19
96 -
20
01
19
97 -
20
02
19
98 -
20
03
19
99 -
20
04
20
00 -
20
05
20
01 -
20
06
20
02 -
20
07
20
03 -
20
08
20
04 -
20
09
20
05 -
20
10
Tra
nsi
tio
n m
etri
c
Transition period: Year of issuance to five years later
Corporate Structured

45
Panel A. Cumulative distributions of default prediction ability by asset class
Panel B. Cumulative distributions of default prediction ability for structured issues
decomposed by product type
Figure 6
Cumulative distributions of default prediction ability Panel A of this figure plots empirical cumulative distributions of default prediction ability for each asset
class (corporate bonds; bonds issued by local and regional governments; sovereign bonds; bonds issued
by U.S. banks, U.S. bank holding companies, insurance companies, and securities firms; and tranches of
structured products). For each asset class we count the number of bonds with a given credit rating as of
January 1 of any year of the sample and the number of those bonds that default over the following year.
For each credit rating classification, we then divide the full sample count of defaulted bonds by the full
sample count of bonds. The figure plots the cumulative sum of these values, moving from the lowest
credit rating to the highest. Panel B plots the same for different types of structured products (Asset
Backed Securities, Collateralized Debt Obligations, Commercial Mortgage Backed Securities, and
Residential Mortgage Backed Securities).
0
0.1
0.2
0.3
0.4
0.5
0.6
0.7
0.8
0.9
1
C -
Caa
1
B3
B2
B1
Ba3
Ba2
Ba1
Baa
3
Baa
2
Baa
1
A3
A2
A1
Aa3
Aa2
Aa1
Aaa
Cum
ula
tive
dis
trib
uti
on
Moody's credit rating
Corporate
Municipal
Sovereign
Financial
Structured
Randomly assigned
credit ratings
0
0.1
0.2
0.3
0.4
0.5
0.6
0.7
0.8
0.9
1
C -
Caa
1
B3
B2
B1
Ba3
Ba2
Ba1
Baa
3
Baa
2
Baa
1
A3
A2
A1
Aa3
Aa2
Aa1
Aaa
Cum
ula
tive
dis
trib
uti
on
Moody's credit rating
ABS
CDO
CMBS
RMBS
Randomly assigned
credit ratings

46
Table I
Summary Statistics Panels A through E display summary statistics for debt issues by asset class. The asset classes include
bonds issued by corporations (industrials and transportation companies), bonds issued by municipalities,
bonds issued by sovereign nations, bonds issued by financial companies (U.S. banks, U.S. bank holding
companies, securities companies, and insurance companies), and tranches of structured products. Panels
E.1. through E.5. decompose the issues in Panel E by deal type: Asset Backed Securities, Commercial
Mortgage Backed Securities, Collateralized Debt Obligations, Public Finance, or Residential Mortgage
Backed Securities. Face represents the face value of debt obligations measured in millions of dollars.
Maturity represents the number of years between when the debt obligation was issued and when it
matures, assuming it does not default. Coupon represents the coupon rate expressed as a percentage.
Initial rating is a numerical translation of an obligation’s first Moody’s credit rating. The highest credit
rating, Aaa, equals 21 and the lowest credit rating, C, equals 1. Downgrade (Upgrade) is a dummy
variable taking a value of one if Moody’s downgrades (upgrades) the issue between the date of issuance
and the earlier of the issue’s maturity date, default date, or the end of the sample, and zero otherwise.
Rating change represents the difference between the numerical translation of an issue’s credit rating when
the issue matures, defaults, or the sample ends and the initial rating. Default is a dummy variable taking a
value of one if the issue defaults, and zero if it matures or has not defaulted by the end of the sample
period. The data come from Moody’s Default and Recovery Database, and Moody’s Structured Finance
Default Risk Service Database.
Panel A. Corporate issues N Mean SD 25% Median 75%
Face 32,440 282.8 717.1 46 132 300
Maturity 31,588 9.0 8.7 4 7 10
Coupon 27,235 6.7 3.2 4.9 6.5 8.8
Initial rating 32,440 14.2 4.2 12 15 17
Downgrade 32,440 0.36 0.48 0 0 1
Upgrade 32,440 0.15 0.36 0 0 0
Rating change 32,440 -0.7 2.3 -1 0 0
Default 32,440 0.04 0.20 0 0 0
Panel B. Municipal issues N Mean SD 25% Median 75%
Face 5,534 221.0 684.3 9 64 191
Maturity 5,494 9.1 7.6 4 7 10
Coupon 4,788 5.5 2.6 4 5.3 7
Initial rating 5,534 19.2 2.2 18 20 21
Downgrade 5,534 0.12 0.33 0 0 0
Upgrade 5,534 0.30 0.46 0 0 1
Rating change 5,534 0.4 1.3 0 0 1
Default 5,534 0.02 0.12 0 0 0

47
Panel C. Sovereign issues N Mean SD 25% Median 75%
Face 10,493 3,137.4 4,186.5 146 769 5,292
Maturity 10,422 9.3 7.8 4 7 11
Coupon 9,302 5.7 3.8 3 5.6 8.3
Initial rating 10,493 16.9 4.4 14 18 21
Downgrade 10,493 0.14 0.35 0 0 0
Upgrade 10,493 0.26 0.44 0 0 1
Rating change 10,493 0.1 1.6 0 0 1
Default 10,493 0.02 0.12 0 0 0
Panel D. Financial issues N Mean SD 25% Median 75%
Face 26,224 156.2 466.3 5 25 110
Maturity 26,080 7.1 7.3 2 5 10
Coupon 15,368 5.1 3.0 3.6 5.6 6.8
Initial rating 26,224 17.1 1.8 16 17 18
Downgrade 26,224 0.41 0.49 0 0 1
Upgrade 26,224 0.23 0.42 0 0 0
Rating change 26,224 -1.1 3.3 -2 0 0
Default 26,224 0.02 0.16 0 0 0
Panel E. Structured issues N Mean SD 25% Median 75%
Deal characteristics
N tranches 38,523 4.8 6.7 1 2 6
% N tranches rated Aaa 38,523 53.2 41.9 0.0 50.0 100.0
Face 38,523 929.6 3,732.9 15 151 556
% Face rated Aaa 38,523 61.8 44.4 0.0 87.8 100.0
Tranche characteristics
Face 185,340 193.2 981.8 4 19 69
Maturity 184,379 24.3 11.1 14 29 30
Coupon 0 -- -- -- -- --
Initial rating 185,340 18.6 3.5 17 21 21
Downgrade 185,340 0.40 0.49 0 0 1
Upgrade 185,340 0.06 0.23 0 0 0
Rating change 185,340 -3.5 5.8 -6 0 0
Default 185,340 0.15 0.36 0 0 0

48
Panel E.1. Structured issues – Asset Backed Securities N Mean SD 25% Median 75%
Deal characteristics
N tranches 10,621 5.5 7.2 1 3 8
% N tranches rated Aaa 10,621 57.9 35.9 33.3 50.0 100.0
Face 10,621 1,488.2 4,915.1 195 489 970
% Face rated Aaa 10,621 78.2 33.3 80.1 91.8 100.0
Tranche characteristics
Face 58,888 268.4 1,091.7 12 36 133
Maturity 58,174 21.7 11.2 9 29 30
Coupon 0 -- -- -- -- --
Initial rating 58,888 18.3 3.5 16 21 21
Downgrade 58,888 0.36 0.48 0 0 1
Upgrade 58,888 0.03 0.18 0 0 0
Rating change 58,888 -3.2 5.2 -7 0 0
Default 58,888 0.20 0.40 0 0 0
Panel E.2. Structured issues – Collateralized Debt Obligations N Mean SD 25% Median 75%
Deal characteristics
N tranches 5,487 3.6 3.6 1 2 6
% N tranches rated Aaa 5,487 35.6 35.7 0.0 28.6 50.0
Face 5,487 993.6 3,128.5 50 277 518
% Face rated Aaa 5,487 53.8 41.3 0.0 73.4 90.0
Tranche characteristics
Face 19,810 275.2 1,262.9 13 30 90
Maturity 19,735 19.2 14.5 9 13 34
Coupon 0 -- -- -- -- --
Initial rating 19,810 17.1 3.9 13 19 21
Downgrade 19,810 0.56 0.50 0 1 1
Upgrade 19,810 0.04 0.19 0 0 0
Rating change 19,810 -5.5 6.6 -11 -3 0
Default 19,810 0.29 0.45 0 0 1
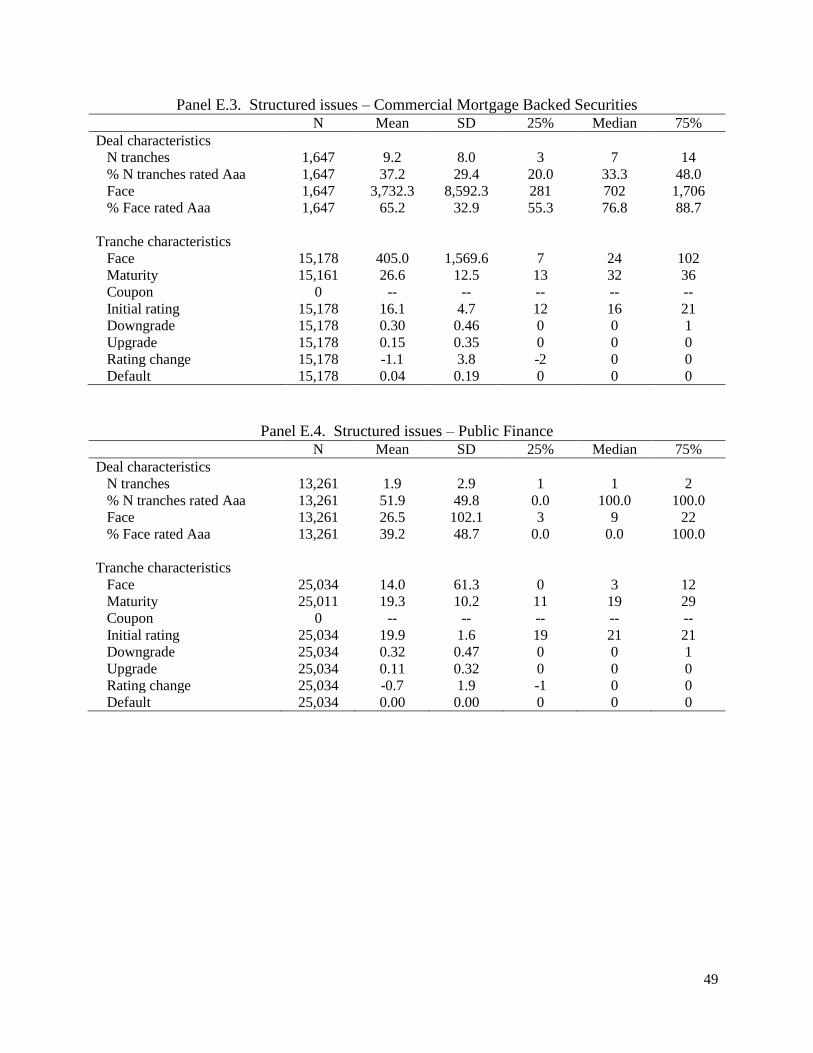
49
Panel E.3. Structured issues – Commercial Mortgage Backed Securities N Mean SD 25% Median 75%
Deal characteristics
N tranches 1,647 9.2 8.0 3 7 14
% N tranches rated Aaa 1,647 37.2 29.4 20.0 33.3 48.0
Face 1,647 3,732.3 8,592.3 281 702 1,706
% Face rated Aaa 1,647 65.2 32.9 55.3 76.8 88.7
Tranche characteristics
Face 15,178 405.0 1,569.6 7 24 102
Maturity 15,161 26.6 12.5 13 32 36
Coupon 0 -- -- -- -- --
Initial rating 15,178 16.1 4.7 12 16 21
Downgrade 15,178 0.30 0.46 0 0 1
Upgrade 15,178 0.15 0.35 0 0 0
Rating change 15,178 -1.1 3.8 -2 0 0
Default 15,178 0.04 0.19 0 0 0
Panel E.4. Structured issues – Public Finance N Mean SD 25% Median 75%
Deal characteristics
N tranches 13,261 1.9 2.9 1 1 2
% N tranches rated Aaa 13,261 51.9 49.8 0.0 100.0 100.0
Face 13,261 26.5 102.1 3 9 22
% Face rated Aaa 13,261 39.2 48.7 0.0 0.0 100.0
Tranche characteristics
Face 25,034 14.0 61.3 0 3 12
Maturity 25,011 19.3 10.2 11 19 29
Coupon 0 -- -- -- -- --
Initial rating 25,034 19.9 1.6 19 21 21
Downgrade 25,034 0.32 0.47 0 0 1
Upgrade 25,034 0.11 0.32 0 0 0
Rating change 25,034 -0.7 1.9 -1 0 0
Default 25,034 0.00 0.00 0 0 0

50
Panel E.5. Structured issues – Residential Mortgage Backed Securities N Mean SD 25% Median 75%
Deal characteristics
N tranches 7,507 8.8 9.0 2 6 13
% N tranches rated Aaa 7,507 65.2 34.8 40.0 71.4 100.0
Face 7,507 1,073.3 3,216.1 166 379 786
% Face rated Aaa 7,507 83.6 32.7 92.0 97.0 100.0
Tranche characteristics
Face 66,430 121.3 747.2 2 13 51
Maturity 66,298 29.4 7.0 29 30 30
Coupon 0 -- -- -- -- --
Initial rating 66,430 19.5 3.0 20 21 21
Downgrade 66,430 0.44 0.49 0 0 1
Upgrade 66,430 0.04 0.20 0 0 0
Rating change 66,430 -4.7 6.6 -10 0 0
Default 66,430 0.15 0.35 0 0 0

51
Table II
Correlation Matrix This table displays correlation coefficients for issue characteristics and dummy variables representing asset class. Face represents the face value of
debt issues measured in millions of dollars. Maturity represents the number of years between the date of issuance and when the debt it matures,
assuming it does not default. Coupon represents the coupon rate expressed as a percentage. Initial rating is a numerical translation of an issue’s
first Moody’s credit rating. The highest credit rating, Aaa, equals 21 and the lowest credit rating, C, equals 1. Downgrade (Upgrade) is a dummy
variable taking a value of one if Moody’s downgrades (upgrades) the issue between the date of issuance and the earlier of the issue’s maturity date,
default date, or the end of the sample, and zero otherwise. Rating change represents the difference between the numerical translation of an issue’s
credit rating when the issue matures, defaults, or the sample ends and the initial rating. Default is a dummy variable taking a value of one if the
issue defaults, and zero if it matures or has not defaulted by the end of the sample period. Corporate is a dummy variable taking a value of one if
an industrial or transportation firm issued the bond, and zero otherwise. Municipal is a dummy variable taking a value of one if a municipality
issued the bond, and zero otherwise. Sovereign is a dummy variable taking a value of one if a sovereign nation issued the bond, and zero
otherwise. Financial is a dummy variable taking a value of one if a U.S. bank, U.S. bank holding company, securities company, or insurance
company issued the bond, and zero otherwise. Structured is a dummy variable taking a value of one if the bond is a tranche of a structured product,
and zero otherwise. *, **, and *** indicate statistical significance at the 10%, 5%, and 1% levels, respectively. The data come from Moody’s
Default and Recovery Database, and Moody’s Structured Finance Default Risk Service Database.
Face Maturity Coupon Initial rating Downgrade Upgrade Rating change Default
Maturity -0.02***
Coupon 0.03*** 0.17***
Initial rating 0.00 0.15*** -0.40***
Downgrade -0.01*** 0.22*** 0.03*** -0.10***
Upgrade 0.01*** -0.15*** 0.02*** -0.21*** -0.26***
Rating change 0.01*** -0.36*** -0.03*** -0.07*** -0.74*** 0.30***
Default -0.01*** 0.28*** 0.17*** -0.24*** 0.41*** -0.12*** -0.54***
Corporate -0.01*** -0.32*** 0.21*** -0.36*** -0.02*** 0.06*** 0.14*** -0.09***
Municipal -0.00 -0.12*** -0.04*** 0.05*** -0.08*** 0.10*** 0.09*** -0.05***
Sovereign 0.09*** -0.17*** -0.04*** -0.05*** -0.10*** 0.11*** 0.11*** -0.06***
Financial -0.01*** -0.34*** -0.17*** -0.07*** 0.02*** 0.14*** 0.10*** -0.10***
Structured -0.03*** 0.57*** -- 0.32*** 0.07*** -0.22*** -0.24*** 0.17***

52
Table III
Default Percentages by Asset Class and Initial Credit Rating The table displays default percentages for issues by asset class and initial Moody’s credit rating. The asset classes include bonds issued by
corporations (industrials and transportation companies), bonds issued by municipalities, bonds issued by sovereign nations, bonds issued by
financial companies (U.S. banks, U.S. bank holding companies, securities companies, and insurance companies), and tranches of structured
products. The types of structured products include Asset Backed Securities, Collateralized Debt Obligations, Commercial Mortgage Backed
Securities, Public Finance, and Residential Mortgage Backed Securities. We require at least 100 issues per asset class-initial rating for admission
to this table. The rating scale in this table is a simplified version of Moody’s traditional 21-point scale. For example, we combine initial credit
ratings of A1, A2, and A3 into one bin, A. The data come from Moody’s Default and Recovery Database, and Moody’s Structured Finance
Default Risk Service Database.
Panel A. Major asset classes Corporate Municipal Sovereign Financial Structured
Initial rating N Dflt % N Dflt % N Dflt % N Dflt % N Dflt %
Aaa 1,867 0.16 1,862 0.05 3,541 0.00 395 0.25 102,680 3.64
Aa 3,480 0.34 2,811 0.00 2,251 0.00 11,113 0.56 30,063 20.21
A 13,635 0.51 715 0.00 1,965 0.00 12,750 4.13 21,682 26.97
Baa 6,875 1.69 1,092 2.29 1,562 2.18 19,578 39.52
Ba 2,140 7.52 941 5.74 322 5.59 7,013 40.98
B 3,798 21.30 612 10.95 2,629 38.00
Caa 560 26.79 661 50.53
Ca 408 48.28
C 626 36.58
Panel B. Tranches of structured products decomposed by product type ABS CDO CMBS PF RMBS
Initial rating N Dflt % N Dflt % N Dflt % N Dflt % N Dflt %
Aaa 30,815 2.02 6,651 20.52 5,197 0.12 13,621 0.00 46,396 3.75
Aa 7,311 28.71 3,759 26.76 2,043 0.34 8,074 0.00 8,876 33.38
A 9,203 29.02 3,484 31.26 2,145 2.70 2,315 0.00 4,535 44.76
Baa 8,204 51.46 3,554 34.86 2,981 3.22 363 0.00 4,476 48.73
Ba 2,171 71.58 1,765 36.43 1,589 8.56 113 0.00 1,375 39.35
B 516 71.32 262 62.21 1,152 22.40 92 0.00 607 34.60
Caa 231 67.53 179 81.01 143 0.00
Ca 132 66.67 115 90.43 114 0.00
C 305 69.51 199 0.00

53
Table IV
Transition Matrices This table displays five-year transition matrices for issues by asset class. The asset classes include bonds issued by corporations (industrials and
transportation companies), bonds issued by municipalities, bonds issued by sovereign nations, bonds issued by financial companies (U.S. banks,
U.S. bank holding companies, securities companies, and insurance companies), and tranches of structured products. The types of structured
products include Asset Backed Securities, Collateralized Debt Obligations, Commercial Mortgage Backed Securities, Public Finance, and
Residential Mortgage Backed Securities. The rating scale in this table is a simplified version of Moody’s traditional 21-point scale. For example,
we combine credit ratings of A1, A2, and A3 into one bin, A. The vertical access represents the issues’ initial credit ratings and the horizontal
access represents the issues’ credit ratings five years later. The data come from Moody’s Default and Recovery Database, and Moody’s Structured
Finance Default Risk Service Database.
Panel A. Corporate issues
Rating five years after issuance
Aaa Aa A Baa Ba B Caa Ca C Default Sum % Down % Up
Initial
rating
Aaa 1,162 508 55 120 18 1 1 2 1,867 37.76
Aa 123 2,440 799 77 16 15 6 4 3,480 26.35 3.53
A 47 377 11,097 1,741 237 81 29 4 22 13,635 15.50 3.11
Baa 1 27 630 5,368 592 151 38 21 4 43 6,875 12.35 9.57
Ba 1 3 28 421 1,238 254 70 25 12 88 2,140 20.98 21.17
B 2 13 76 321 2,407 318 106 11 544 3,798 25.78 10.85
Caa 8 3 62 342 22 6 117 560 25.89 13.04
Ca 3 3 1 47 2 23 79 31.65 8.86
C 5 1 6 16.67 0.00
Sum 32,440 19.06 6.63

54
Panel B. Municipal issues
Rating five years after issuance
Aaa Aa A Baa Ba B Caa Ca C Default Sum % Down % Up
Initial
rating
Aaa 1,781 81 1,862 4.35
Aa 141 2,633 37 2,811 1.32 5.02
A 346 367 2 715 0.28 48.39
Baa 1 14 51 66 0.00 22.73
Ba 3 11 6 2 22 36.36 13.64
B 24 1 17 42 42.86 0.00
Caa 1 7 8 0.00 12.50
Ca 6 6 0.00 0.00
C 2 2 0.00 0.00
Sum 5,534 2.64 9.14
Panel C. Sovereign issues
Rating five years after issuance
Aaa Aa A Baa Ba B Caa Ca C Default Sum % Down % Up
Initial
rating
Aaa 3,247 269 21 4 3,541 8.30
Aa 313 1,774 164 2,251 7.29 13.90
A 391 1,531 42 1 1,965 2.19 19.90
Baa 131 773 65 117 6 1,092 17.22 12.00
Ba 10 78 730 82 1 26 14 941 13.07 9.35
B 18 164 366 7 24 33 612 10.46 29.74
Caa 53 21 1 75 1.33 70.67
Ca 3 1 1 7 4 16 25.00 31.25
C 0
Sum 10,493 8.40 11.08

55
Panel D. Financial issues
Rating five years after issuance
Aaa Aa A Baa Ba B Caa Ca C Default Sum % Down % Up
Initial
rating
Aaa 303 56 7 28 1 395 23.29
Aa 15 7,944 3,043 92 14 2 2 1 11,113 28.38 0.13
A 1 2,565 7,904 1,362 410 13 1 102 392 12,750 17.88 20.13
Baa 7 140 357 641 189 12 2 156 51 7 1,562 26.70 32.27
Ba 1 16 18 176 77 3 13 13 5 322 34.47 10.87
B 1 1 5 41 1 1 4 54 11.11 12.96
Caa 3 4 7 0.00 42.86
Ca 17 2 19 0.00 89.47
C 2 2 0.00 0.00
Sum 26,224 23.11 12.00
Panel E. Structured issues
Rating five years after issuance
Aaa Aa A Baa Ba B Caa Ca C Default Sum % Down % Up
Initial
rating
Aaa 70,893 5,691 2,477 1,652 1,436 3,002 9,699 3,011 1,220 3,599 102,680 30.96
Aa 2,452 14,798 2,500 1,136 599 490 617 387 1,199 5,885 30,063 42.62 8.16
A 667 1,739 8,980 1,391 1,093 547 616 309 819 5,521 21,682 47.49 11.10
Baa 248 304 821 6,782 1,191 1,155 997 464 742 6,874 19,578 58.35 7.01
Ba 24 55 98 235 2,280 354 656 221 505 2,585 7,013 61.61 5.87
B 2 38 12 21 86 1,065 213 81 313 798 2,629 53.44 6.05
Caa 9 45 19 2 3 4 245 6 13 315 661 50.53 12.41
Ca 3 38 20 1 1 2 137 13 193 408 50.49 15.93
C 8 71 28 415 104 626 16.61 17.09
Sum 185,340 39.22 3.81
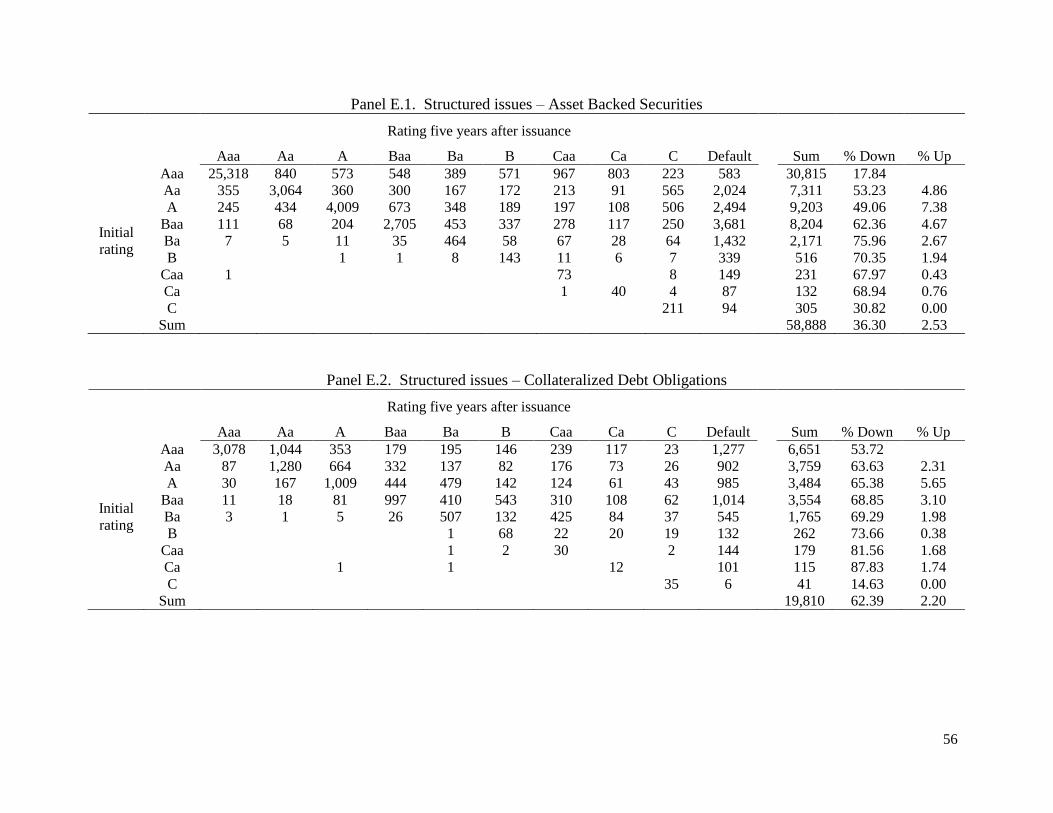
56
Panel E.1. Structured issues – Asset Backed Securities
Rating five years after issuance
Aaa Aa A Baa Ba B Caa Ca C Default Sum % Down % Up
Initial
rating
Aaa 25,318 840 573 548 389 571 967 803 223 583 30,815 17.84
Aa 355 3,064 360 300 167 172 213 91 565 2,024 7,311 53.23 4.86
A 245 434 4,009 673 348 189 197 108 506 2,494 9,203 49.06 7.38
Baa 111 68 204 2,705 453 337 278 117 250 3,681 8,204 62.36 4.67
Ba 7 5 11 35 464 58 67 28 64 1,432 2,171 75.96 2.67
B 1 1 8 143 11 6 7 339 516 70.35 1.94
Caa 1 73 8 149 231 67.97 0.43
Ca 1 40 4 87 132 68.94 0.76
C 211 94 305 30.82 0.00
Sum 58,888 36.30 2.53
Panel E.2. Structured issues – Collateralized Debt Obligations
Rating five years after issuance
Aaa Aa A Baa Ba B Caa Ca C Default Sum % Down % Up
Initial
rating
Aaa 3,078 1,044 353 179 195 146 239 117 23 1,277 6,651 53.72
Aa 87 1,280 664 332 137 82 176 73 26 902 3,759 63.63 2.31
A 30 167 1,009 444 479 142 124 61 43 985 3,484 65.38 5.65
Baa 11 18 81 997 410 543 310 108 62 1,014 3,554 68.85 3.10
Ba 3 1 5 26 507 132 425 84 37 545 1,765 69.29 1.98
B 1 68 22 20 19 132 262 73.66 0.38
Caa 1 2 30 2 144 179 81.56 1.68
Ca 1 1 12 101 115 87.83 1.74
C 35 6 41 14.63 0.00
Sum 19,810 62.39 2.20

57
Panel E.3. Structured issues – Commercial Mortgage Backed Securities
Rating five years after issuance
Aaa Aa A Baa Ba B Caa Ca C Default Sum % Down % Up
Initial
rating
Aaa 4,349 308 167 130 68 40 63 23 43 6 5,197 16.32
Aa 444 894 122 155 114 104 91 31 81 7 2,043 34.51 21.73
A 173 244 904 125 133 126 179 70 140 51 2,145 38.41 19.44
Baa 75 63 234 1,460 193 168 267 100 337 84 2,981 38.54 12.48
Ba 4 8 13 52 761 129 119 35 351 117 1,589 47.26 4.85
B 2 1 5 13 529 163 19 259 161 1,152 52.26 1.82
Caa 2 30 5 8 45 28.89 4.44
Ca 8 8 0.00 0.00
C 18 18 0.00 0.00
Sum 15,178 32.23 8.78
Panel E.4. Structured issues – Public Finance
Rating five years after issuance
Aaa Aa A Baa Ba B Caa Ca C Default Sum % Down % Up
Initial
rating
Aaa 11,099 2,077 369 65 5 6 13,621 18.52
Aa 361 6,533 995 118 67 8,074 14.61 4.47
A 79 583 1,627 15 11 2,315 1.12 28.60
Baa 18 79 43 186 35 1 1 363 10.19 38.57
Ba 7 37 15 53 1 113 0.88 52.21
B 37 7 2 46 92 0.00 50.00
Caa 7 45 19 1 2 69 143 0.00 51.75
Ca 3 38 19 1 53 114 0.00 53.51
C 8 71 28 92 199 0.00 53.77
Sum 25,034 15.04 6.03

58
Panel E.5. Structured issues – Residential Mortgage Backed Securities
Rating five years after issuance
Aaa Aa A Baa Ba B Caa Ca C Default Sum % Down % Up
Initial
rating
Aaa 27,049 1,422 1,015 730 779 2,245 8,424 2,068 931 1,733 46,396 41.70
Aa 1,205 3,027 359 231 114 132 137 192 527 2,952 8,876 52.32 13.58
A 140 311 1,431 134 122 90 116 70 130 1,991 4,535 58.50 9.94
Baa 33 76 259 1,434 100 106 142 138 93 2,095 4,476 59.74 8.22
Ba 3 4 54 122 495 34 45 74 53 491 1,375 50.69 13.31
B 1 3 13 64 279 17 36 28 166 607 40.69 13.34
Caa 1 1 43 1 3 14 63 28.57 3.17
Ca 1 24 9 5 39 35.90 2.56
C 59 4 63 6.35 0.00
Sum 66,430 45.61 3.45

59
Table V
Cox Proportional Hazard Regressions on Credit Rating Adjustments This table presents regression results from Cox proportional hazards regressions to estimate the relative
downgrade and upgrade intensities of bonds by asset class. The asset classes include bonds issued by
corporations (industrials and transportation companies), bonds issued by municipalities, bonds issued by
sovereign nations, bonds issued by financial companies (U.S. banks, U.S. bank holding companies,
securities companies, and insurance companies), and tranches of structured products. The types of
structured products include Asset Backed Securities, Collateralized Debt Obligations, Commercial
Mortgage Backed Securities, Public Finance, and Residential Mortgage Backed Securities. The
coefficients represent the hazard rate of each asset class relative to the baseline hazard of the corporate
asset class, and the unit of observation is a rating change. Standard errors appear below coefficient
estimates in parentheses. *, **, and *** indicate statistical significance at the 10%, 5%, and 1% levels,
respectively. The data come from Moody’s Default and Recovery Database, and Moody’s Structured
Finance Default Risk Service Database.
Downgrades Upgrades
Full
sample
Investment
grade
Speculative
grade
Full
sample
Investment
grade
Speculative
grade
Corporate 1 1 1 1 1 1
Municipal 0.324*** 0.272*** 3.115*** 1.570*** 1.989*** 1.057
(0.010) (0.009) (0.231) (0.033) (0.044) (0.157)
Sovereign 0.472*** 0.341*** 1.024 1.410*** 1.609*** 1.175***
(0.008) (0.008) (0.030) (0.023) (0.032) (0.037)
Financial 1.789*** 1.660*** 5.001*** 1.691*** 2.049*** 1.981***
(0.015) (0.016) (0.093) (0.021) (0.030) (0.062)
ABS 1.265*** 0.842*** 3.783*** 0.230*** 0.277*** 0.198***
(0.010) (0.008) (0.054) (0.004) (0.005) (0.008)
CDO 1.915*** 1.494*** 3.162*** 0.592*** 0.600*** 0.579***
(0.016) (0.016) (0.049) (0.011) (0.014) (0.017)
CMBS 1.081*** 0.752*** 1.817*** 0.961** 1.523*** 0.208***
(0.012) (0.011) (0.033) (0.016) (0.029) (0.009)
PF 1.144*** 1.150*** 3.283*** 0.918*** 1.169*** 0.345***
(0.011) (0.012) (0.300) (0.014) (0.020) (0.115)
RMBS 1.091*** 0.692*** 3.360*** 0.191*** 0.228*** 0.160***
(0.008) (0.006) (0.048) (0.003) (0.004) (0.006)
N 483,520 369,405 114,115 483,520 369,405 114,115

60
Table VI
Cox Proportional Hazard Regressions on First Credit Rating Adjustments This table presents regression results from Cox proportional hazards regressions to estimate the relative
downgrade and upgrade intensities of bonds by asset class. The asset classes include bonds issued by
corporations (industrials and transportation companies), bonds issued by municipalities, bonds issued by
sovereign nations, bonds issued by financial companies (U.S. banks, U.S. bank holding companies,
securities companies, and insurance companies), and tranches of structured products. The types of
structured products include Asset Backed Securities, Collateralized Debt Obligations, Commercial
Mortgage Backed Securities, Public Finance, and Residential Mortgage Backed Securities. The
coefficients represent the hazard rate of each asset class relative to the baseline hazard of the corporate
asset class, and the unit of observation is the first rating change after issuance Standard errors appear
below coefficient estimates in parentheses. *, **, and *** indicate statistical significance at the 10%, 5%,
and 1% levels, respectively. -- indicates insufficient observations to estimate a coefficient. The data come
from Moody’s Default and Recovery Database, and Moody’s Structured Finance Default Risk Service
Database.
Downgrades Upgrades
Full
sample
Investment
grade
Speculative
grade
Full
sample
Investment
grade
Speculative
grade
Corporate 1 1 1 1 1 1
Municipal 0.311*** 0.294*** 3.684*** 1.816*** 2.083*** 1.104
(0.013) (0.012) (0.646) (0.054) (0.065) (0.321)
Sovereign 0.381*** 0.295*** 1.115* 1.499*** 1.483*** 1.308***
(0.011) (0.010) (0.066) (0.039) (0.044) (0.071)
Financial 1.290*** 1.282*** 1.912*** 2.045*** 2.353*** 1.997***
(0.019) (0.020) (0.291) (0.042) (0.053) (0.276)
ABS 0.710*** 0.666*** 2.341*** 0.182*** 0.207*** 0.098***
(0.009) (0.009) (0.104) (0.005) (0.006) (0.012)
CDO 1.399*** 1.383*** 1.553*** 0.200*** 0.232*** 0.080***
(0.020) (0.020) (0.073) (0.008) (0.010) (0.010)
CMBS 0.639*** 0.574*** 0.972 0.985 1.094** 0.480***
(0.019) (0.020) (0.065) (0.037) (0.047) (0.040)
PF 0.846*** 0.839*** -- 0.828*** 0.953 --
(0.013) (0.013) (--) (0.020) (0.024) (--)
RMBS 0.585*** 0.571*** 0.932 0.218*** 0.227*** 0.361***
(0.007) (0.007) (0.046) (0.005) (0.006) (0.023)
N 230,614 213,841 16,773 230,614 213,841 16,773
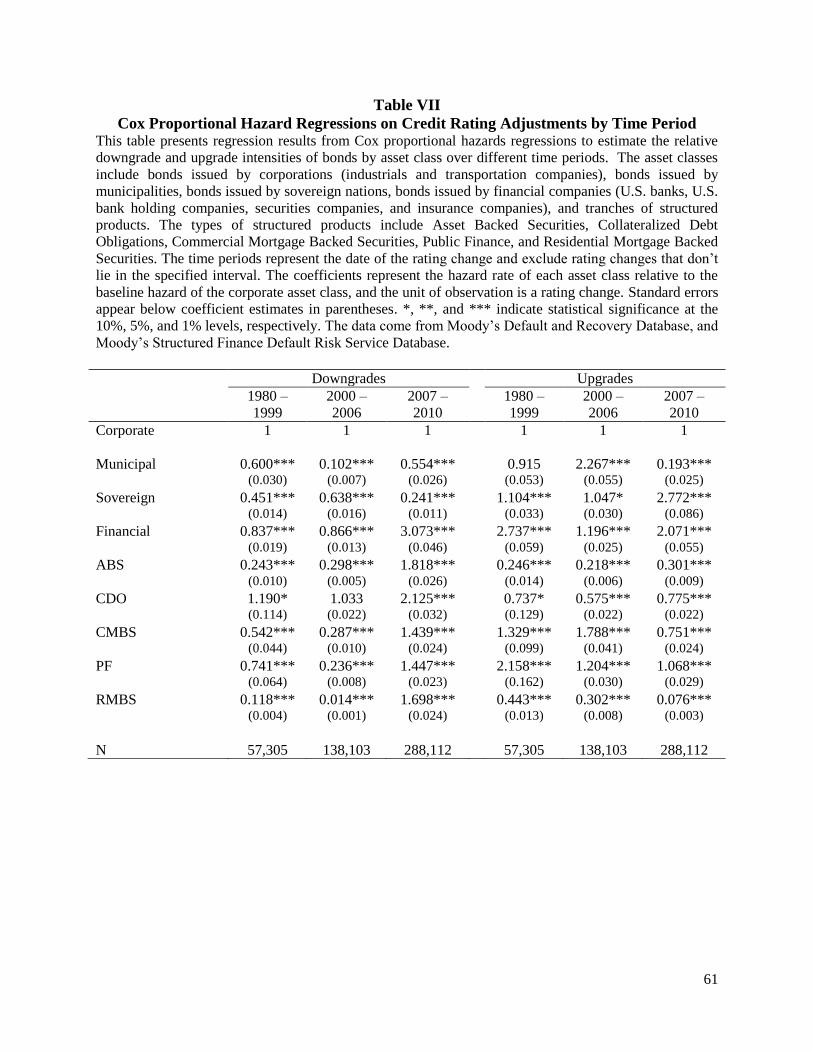
61
Table VII
Cox Proportional Hazard Regressions on Credit Rating Adjustments by Time Period This table presents regression results from Cox proportional hazards regressions to estimate the relative
downgrade and upgrade intensities of bonds by asset class over different time periods. The asset classes
include bonds issued by corporations (industrials and transportation companies), bonds issued by
municipalities, bonds issued by sovereign nations, bonds issued by financial companies (U.S. banks, U.S.
bank holding companies, securities companies, and insurance companies), and tranches of structured
products. The types of structured products include Asset Backed Securities, Collateralized Debt
Obligations, Commercial Mortgage Backed Securities, Public Finance, and Residential Mortgage Backed
Securities. The time periods represent the date of the rating change and exclude rating changes that don’t
lie in the specified interval. The coefficients represent the hazard rate of each asset class relative to the
baseline hazard of the corporate asset class, and the unit of observation is a rating change. Standard errors
appear below coefficient estimates in parentheses. *, **, and *** indicate statistical significance at the
10%, 5%, and 1% levels, respectively. The data come from Moody’s Default and Recovery Database, and
Moody’s Structured Finance Default Risk Service Database.
Downgrades Upgrades
1980 –
1999
2000 –
2006
2007 –
2010
1980 –
1999
2000 –
2006
2007 –
2010
Corporate 1 1 1 1 1 1
Municipal 0.600*** 0.102*** 0.554*** 0.915 2.267*** 0.193***
(0.030) (0.007) (0.026) (0.053) (0.055) (0.025)
Sovereign 0.451*** 0.638*** 0.241*** 1.104*** 1.047* 2.772***
(0.014) (0.016) (0.011) (0.033) (0.030) (0.086)
Financial 0.837*** 0.866*** 3.073*** 2.737*** 1.196*** 2.071***
(0.019) (0.013) (0.046) (0.059) (0.025) (0.055)
ABS 0.243*** 0.298*** 1.818*** 0.246*** 0.218*** 0.301***
(0.010) (0.005) (0.026) (0.014) (0.006) (0.009)
CDO 1.190* 1.033 2.125*** 0.737* 0.575*** 0.775***
(0.114) (0.022) (0.032) (0.129) (0.022) (0.022)
CMBS 0.542*** 0.287*** 1.439*** 1.329*** 1.788*** 0.751***
(0.044) (0.010) (0.024) (0.099) (0.041) (0.024)
PF 0.741*** 0.236*** 1.447*** 2.158*** 1.204*** 1.068***
(0.064) (0.008) (0.023) (0.162) (0.030) (0.029)
RMBS 0.118*** 0.014*** 1.698*** 0.443*** 0.302*** 0.076***
(0.004) (0.001) (0.024) (0.013) (0.008) (0.003)
N 57,305 138,103 288,112 57,305 138,103 288,112

62
Table VIII
Credit Rating Adjustment Regressions This table displays results from measures of credit rating adjustment regressed on asset class dummy variables and results from tests of
coefficients’ equality. The asset classes include bonds issued by corporations (industrials and transportation companies), bonds issued by
municipalities, bonds issued by sovereign nations, bonds issued by financial companies (U.S. banks, U.S. bank holding companies, securities
companies, and insurance companies), and tranches of structured products. Panel A displays results from OLS regressions. The dependent variable
in Panel A is Rating change, the difference between the numerical translation of an issue’s credit rating when the issue matures, defaults, or the
sample ends and the initial rating. The highest credit rating, Aaa, equals 21 and the lowest credit rating, C, equals 1. Panel B displays results from
probit regressions. The dependent variable in Panel B is a dummy variable taking a value of one if the issue’s first credit rating was investment
grade but Moody’s downgraded the issue to speculative grade by the earlier of the issue’s maturity date, default date, or the end of the sample, and
zero otherwise All of the issues in Panel B had initial credit ratings of investment grade. We cluster the standard errors at the issuer level. Standard
errors appear below coefficient estimates in parentheses. *, **, and *** indicate statistical significance at the 10%, 5%, and 1% levels,
respectively. -- indicates insufficient observations to estimate a coefficient. The data come from Moody’s Default and Recovery Database, and
Moody’s Structured Finance Default Risk Service Database.

63
Panel A. Dependent variable is Rating change Full sample Issued 1980 – 1999 Issued 2000 – 2006 Issued 2007 – 2010
Corporate -1.935*** -0.969*** -0.537*** -0.499***
(0.419) (0.062) (0.078) (0.076)
Municipal 1.484*** 1.232*** 1.299*** 0.309***
(0.280) (0.163) (0.169) (0.098)
Sovereign 0.807*** 0.976*** 0.731*** 0.832***
(0.189) (0.173) (0.201) (0.216)
Financial 0.327 0.856*** -0.773*** -1.432
(0.611) (0.288) (0.635) (0.874)
Structured -1.173*** 0.763*** -3.219*** -5.226**
(0.306) (0.071) (0.780) (2.271)
Issue year FE? Yes No No No
Adjusted R2 0.281 0.022 0.057 0.116
N 260,031 65,957 144,159 49,915
Comparison of coefficient estimates:
βCorporate – βMunicipal = -3.419*** -2.200*** -1.837*** -0.808***
(0.637) (0.195) (0.216) (0.164)
βCorporate – βSovereign = -2.742*** -1.945*** -1.268*** -1.331***
(0.481) (0.204) (0.243) (0.253)
βCorporate – βFinancial = -2.262*** -1.825*** 0.236 0.933
(0.868) (0.308) (0.649) (0.884)
βCorporate – βStructured = -0.762 -1.732*** 2.682*** 4.723**
(0.463) (0.129) (0.791) (2.275)

64
Panel B. Dependent variable is a dummy variable taking a value of one if Moody’s downgrades the issue to speculative grade Full sample Issued 1980 – 1999 Issued 2000 – 2006 Issued 2007 – 2010
Corporate -1.496*** -1.273*** -1.655*** -2.208***
(0.057) (0.0479) (0.091) (0.116)
Municipal -2.067*** -2.007*** -- --
(0.273) (0.295) (--) (--)
Sovereign -0.480* -0.775*** -0.065 --
(0.273) (0.219) (0.424) (--)
Financial 0.083 -0.467* 0.432 0.667
(0.330) (0.271) (0.478) (0.491)
Structured 0.826*** -0.642*** 1.058*** 1.934***
(0.209) (0.082) (0.208) (0.480)
Pseudo R2 0.059 0.055 0.038 0.102
N 242,437 59,873 133,102 44,619
Comparison of coefficient estimates:
βCorporate – βMunicipal = 0.572** 0.733**
(0.290) (0.307)
βCorporate – βSovereign = -1.016*** -0.498** -1.590***
(0.291) (0.234) (0.452)
βCorporate – βFinancial = -1.579*** -0.806*** -2.087*** -2.875***
(0.345) (0.283) (0.446) (0.531)
βCorporate – βStructured = -2.322*** -0.632*** -2.712*** -4.141***
(0.232) (0.117) (0.261) (0.521)

65
Table IX
Credit Rating Adjustment Regressions with Structured Issues by Product Type This table displays results from OLS regressions with Rating change regressed on asset class dummy variables and results from tests of
coefficients’ equality. Rating change is the difference between the numerical translation of an issue’s credit rating when the issue matures,
defaults, or the sample ends and the initial rating. The highest credit rating, Aaa, equals 21 and the lowest credit rating, C, equals 1. The asset
classes include bonds issued by corporations (industrials and transportation companies), bonds issued by municipalities, bonds issued by sovereign
nations, bonds issued by financial companies (U.S. banks, U.S. bank holding companies, securities companies, and insurance companies), and
tranches of structured products. The types of structured products include Asset Backed Securities, Collateralized Debt Obligations, Commercial
Mortgage Backed Securities, Public Finance, and Residential Mortgage Backed Securities. We cluster the standard errors at the issuer level.
Standard errors appear below coefficient estimates in parentheses. *, **, and *** indicate statistical significance at the 10%, 5%, and 1% levels,
respectively. The data come from Moody’s Default and Recovery Database, and Moody’s Structured Finance Default Risk Service Database.
Full sample Issued 1980 – 1999 Issued 2000 – 2006 Issued 2007 – 2010
Corporate -1.912*** -0.969*** -0.537*** -0.499***
(0.433) (0.062) (0.078) (0.076)
Municipal 1.525*** 1.232*** 1.299*** 0.309***
(0.294) (0.163) (0.169) (0.098)
Sovereign 0.798*** 0.976*** 0.731*** 0.832***
(0.199) (0.173) (0.201) (0.216)
Financial 0.400 0.856*** -0.773 -1.432
(0.620) (0.288) (0.635) (0.874)
ABS -1.061*** 0.262*** -2.944*** -4.790***
(0.285) (0.079) (0.407) (1.374)
CDO -2.342*** -0.864** -4.736*** -6.323***
(0.409) (0.396) (0.462) (1.261)
CMBS 1.316*** 2.370*** -0.270* -2.964***
(0.465) (0.139) (0.160) (0.905)
PF 1.261** 0.960*** -0.119 -0.648***
(0.491) (0.062) (0.078) (0.076)
RMBS -2.530*** 1.072*** -4.778*** -9.367***
(0.396) (0.063) (0.685) (2.041)
Issue year FE? Yes No No No
Adjusted R2 0.333 0.055 0.139 0.309
N 260,031 65,957 144,159 49,915
Continued below
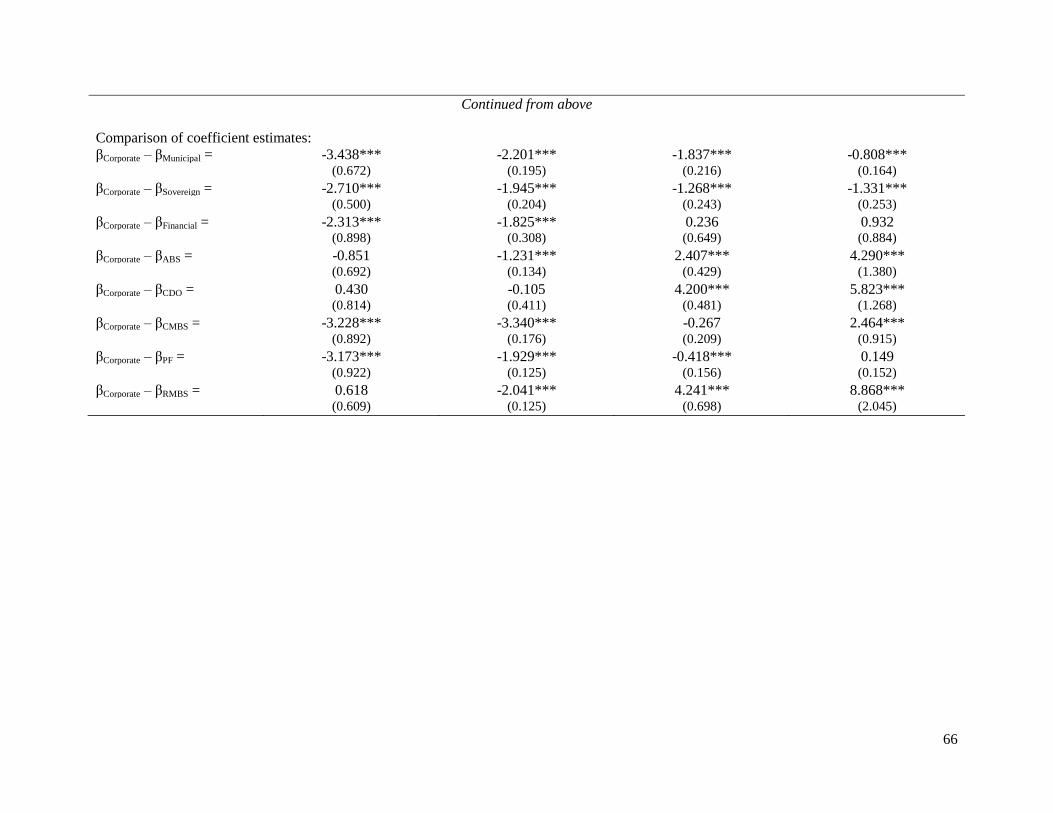
66
Continued from above
Comparison of coefficient estimates:
βCorporate – βMunicipal = -3.438*** -2.201*** -1.837*** -0.808***
(0.672) (0.195) (0.216) (0.164)
βCorporate – βSovereign = -2.710*** -1.945*** -1.268*** -1.331***
(0.500) (0.204) (0.243) (0.253)
βCorporate – βFinancial = -2.313*** -1.825*** 0.236 0.932
(0.898) (0.308) (0.649) (0.884)
βCorporate – βABS = -0.851 -1.231*** 2.407*** 4.290***
(0.692) (0.134) (0.429) (1.380)
βCorporate – βCDO = 0.430 -0.105 4.200*** 5.823***
(0.814) (0.411) (0.481) (1.268)
βCorporate – βCMBS = -3.228*** -3.340*** -0.267 2.464***
(0.892) (0.176) (0.209) (0.915)
βCorporate – βPF = -3.173*** -1.929*** -0.418*** 0.149
(0.922) (0.125) (0.156) (0.152)
βCorporate – βRMBS = 0.618 -2.041*** 4.241*** 8.868***
(0.609) (0.125) (0.698) (2.045)