· PDF fileJCR-VIS Credit Rating Company Limited Entity Rating A- (Single A Minus) for Medium...
86
Transcript of · PDF fileJCR-VIS Credit Rating Company Limited Entity Rating A- (Single A Minus) for Medium...


CONTENTS
Company Information
Mission Statement
Notice of Annual General Meeting
Chairman�s Review Report to the Shareholders
Chairman�s Review Report to the Shareholders (Urdu)
Directors� Report to the Shareholders
Directors� Report to the Shareholders (Urdu)
Statement of compliance with the Code of Corporate Governance
Auditors� review report to members on the Statement of Compliance
with the Code of Corporate Governance
Shariah Advisory Report
Auditors� Report to the members
Balance Sheet
Profit and Loss Account
Statement of Comprehensive Income
Cash Flow Statement
Statement of Changes in Equity
Notes to the Accounts
Pattern of Shareholding
Categories of Shareholders
Proxy Form
Proxy Form (Urdu)
.......................................................................... 1
2
3
6
7
8
30
31
33
34
35
36
37
38
39
40
41
79
80
...............................................................................
........................................................
...................................
.......................................
.......
.........................................
.....................................................................
.........................................................
....................................................................................
.....................................................................
..................................................
..........................................................................
..........................................................
........................................................................
.....................................................................
................................................................
..................................................
.........................
1
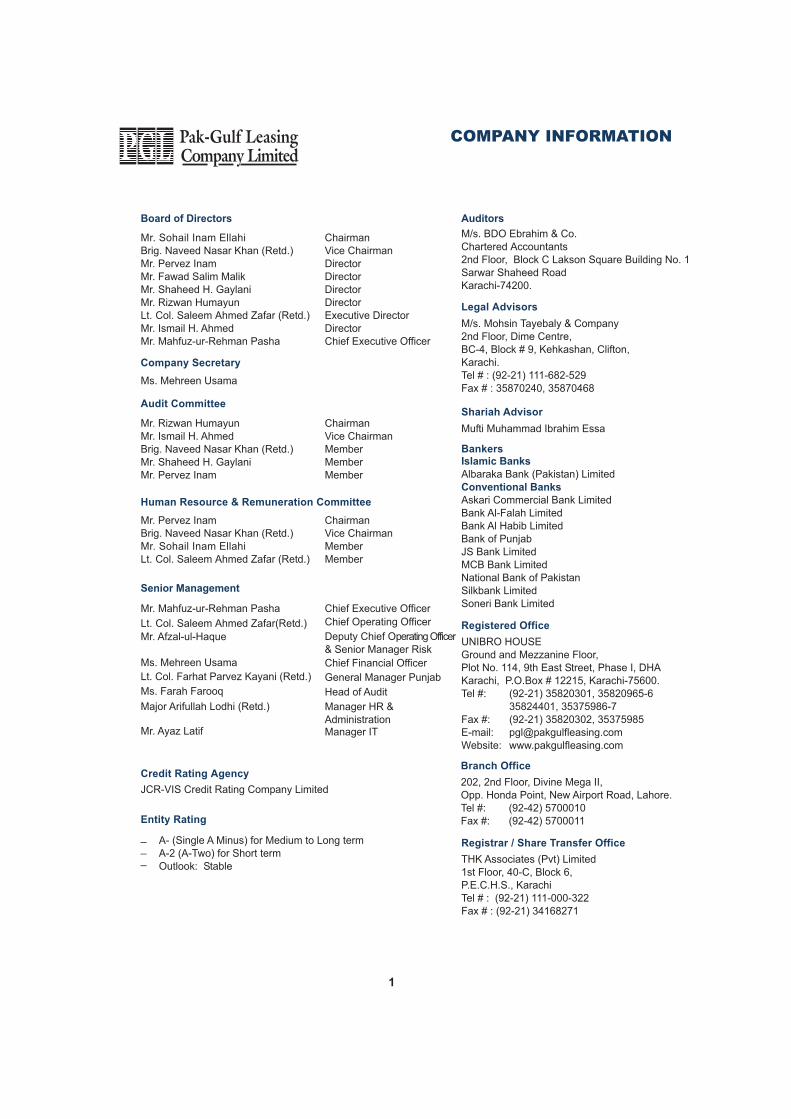
Board of Directors
Mr. Sohail Inam EllahiBrig. Naveed Nasar Khan (Retd.)Mr. Pervez InamMr. Fawad Salim MalikMr. Shaheed H. GaylaniMr. Rizwan HumayunLt. Col. Saleem Ahmed Zafar (Retd.)Mr. Ismail H. AhmedMr. Mahfuz-ur-Rehman Pasha
ChairmanVice ChairmanDirectorDirectorDirectorDirectorExecutive DirectorDirectorChief Executive Officer
COMPANY INFORMATION
BankersIslamic Banks
Albaraka Bank (Pakistan) LimitedConventional Banks
Askari Commercial Bank LimitedBank Al-Falah LimitedBank Al Habib LimitedBank of PunjabJS Bank LimitedMCB Bank LimitedNational Bank of PakistanSilkbank LimitedSoneri Bank Limited
Company Secretary
Ms. Mehreen Usama
Audit Committee
Mr. Rizwan HumayunMr. Ismail H. AhmedBrig. Naveed Nasar Khan (Retd.)Mr. Shaheed H. GaylaniMr. Pervez Inam
ChairmanVice ChairmanMemberMemberMember
Senior Management
Mr. Mahfuz-ur-Rehman Pasha Chief Executive Officer
Ms. Farah Farooq Head of Audit
Major Arifullah Lodhi (Retd.) Manager HR &Administration
Credit Rating Agency
JCR-VIS Credit Rating Company Limited
Entity Rating
A- (Single A Minus) for Medium to Long termA-2 (A-Two) for Short termOutlook: Stable
___
Mr. Afzal-ul-Haque Deputy Chief Operating Officer& Senior Manager Risk
Lt. Col. Saleem Ahmed Zafar(Retd.) Chief Operating Officer
Human Resource & Remuneration Committee
Mr. Pervez InamBrig. Naveed Nasar Khan (Retd.)Mr. Sohail Inam EllahiLt. Col. Saleem Ahmed Zafar (Retd.)
ChairmanVice ChairmanMemberMember
Legal Advisors
M/s. Mohsin Tayebaly & Company2nd Floor, Dime Centre,BC-4, Block # 9, Kehkashan, Clifton,Karachi.Tel # : (92-21) 111-682-529Fax # : 35870240, 35870468
Shariah Advisor
Mufti Muhammad Ibrahim Essa
Ms. Mehreen Usama Chief Financial Officer
Mr. Ayaz Latif Manager IT
Registrar / Share Transfer Office
THK Associates (Pvt) Limited1st Floor, 40-C, Block 6,P.E.C.H.S., KarachiTel # : (92-21) 111-000-322Fax # : (92-21) 34168271
Registered Office
UNIBRO HOUSEGround and Mezzanine Floor,Plot No. 114, 9th East Street, Phase I, DHAKarachi, P.O.Box # 12215, Karachi-75600.Tel #: (92-21) 35820301, 35820965-6
35824401, 35375986-7Fax #: (92-21) 35820302, 35375985E-mail: [email protected]: www.pakgulfleasing.com
Branch Office
202, 2nd Floor, Divine Mega II,Opp. Honda Point, New Airport Road, Lahore.Tel #: (92-42) 5700010Fax #: (92-42) 5700011
Auditors
M/s. BDO Ebrahim & Co.Chartered Accountants2nd Floor, Block C Lakson Square Building No. 1Sarwar Shaheed RoadKarachi-74200.
Lt. Col. Farhat Parvez Kayani (Retd.) General Manager Punjab
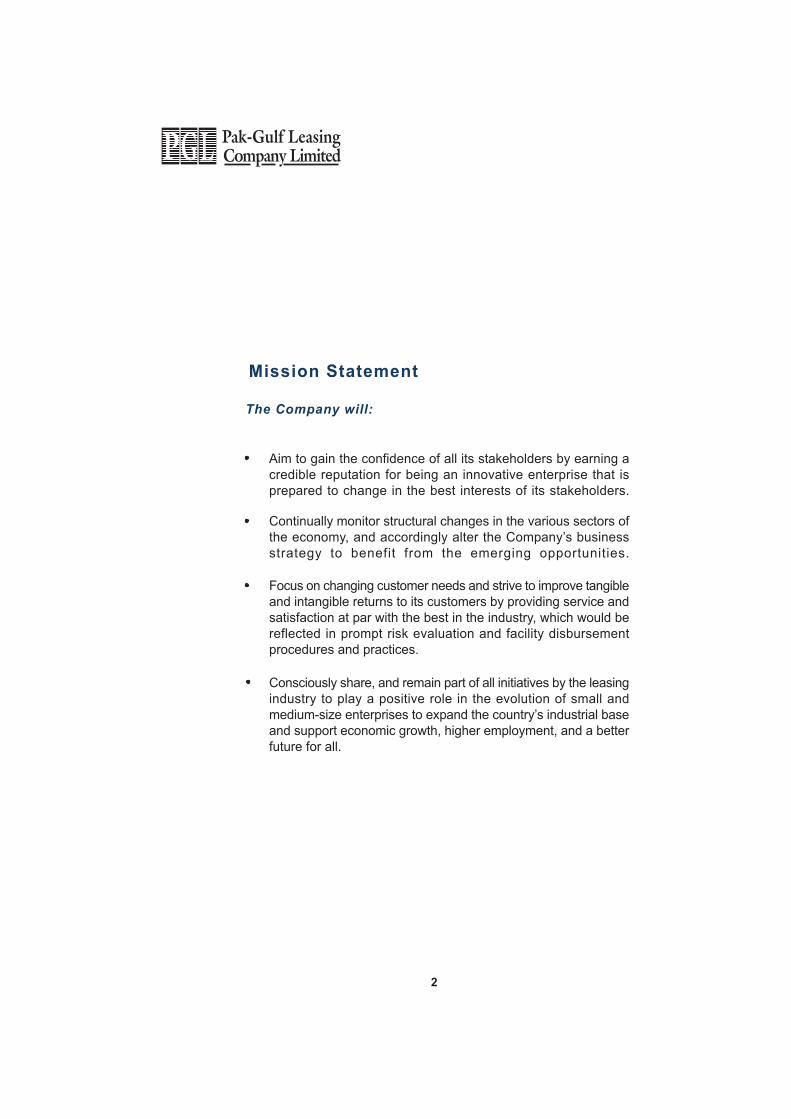
Mission Statement
The Company will:
Aim to gain the confidence of all its stakeholders by earning acredible reputation for being an innovative enterprise that isprepared to change in the best interests of its stakeholders.
Continually monitor structural changes in the various sectors ofthe economy, and accordingly alter the Company�s businessstrategy to benefit from the emerging opportunities.
Focus on changing customer needs and strive to improve tangibleand intangible returns to its customers by providing service andsatisfaction at par with the best in the industry, which would bereflected in prompt risk evaluation and facility disbursementprocedures and practices.
Consciously share, and remain part of all initiatives by the leasingindustry to play a positive role in the evolution of small andmedium-size enterprises to expand the country�s industrial baseand support economic growth, higher employment, and a betterfuture for all.
2
3
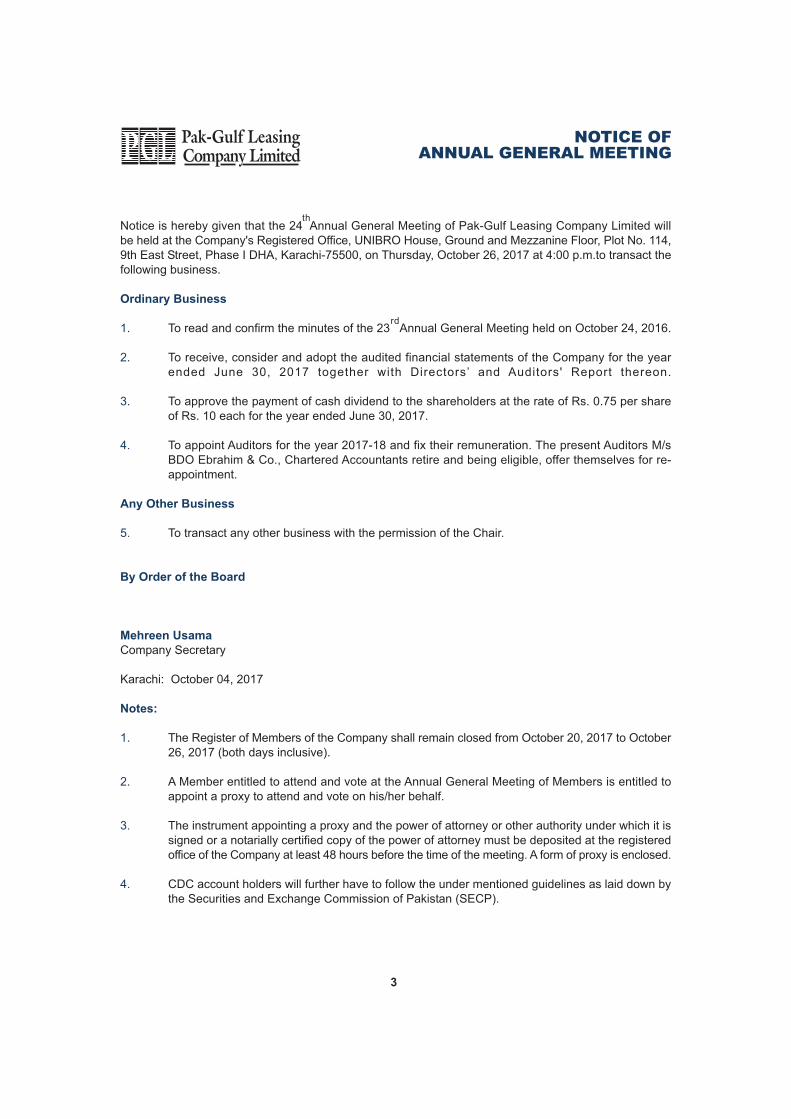
NOTICE OFANNUAL GENERAL MEETING
Notice is hereby given that the 24 Annual General Meeting of Pak-Gulf Leasing Company Limited willbe held at the Company's Registered Office, UNIBRO House, Ground and Mezzanine Floor, Plot No. 114,9th East Street, Phase I DHA, Karachi-75500, on Thursday, October 26, 2017 at 4:00 p.m.to transact thefollowing business.
Ordinary Business
1. To read and confirm the minutes of the 23 Annual General Meeting held on October 24, 2016.
2. To receive, consider and adopt the audited financial statements of the Company for the yearended June 30, 2017 together with Directors� and Auditors' Report thereon.
3. To approve the payment of cash dividend to the shareholders at the rate of Rs. 0.75 per shareof Rs. 10 each for the year ended June 30, 2017.
4. To appoint Auditors for the year 2017-18 and fix their remuneration. The present Auditors M/sBDO Ebrahim & Co., Chartered Accountants retire and being eligible, offer themselves for re-appointment.
Any Other Business
5. To transact any other business with the permission of the Chair.
By Order of the Board
Mehreen Usama
Company Secretary
Karachi: October 04, 2017
Notes:
1. The Register of Members of the Company shall remain closed from October 20, 2017 to October26, 2017 (both days inclusive).
2. A Member entitled to attend and vote at the Annual General Meeting of Members is entitled toappoint a proxy to attend and vote on his/her behalf.
3. The instrument appointing a proxy and the power of attorney or other authority under which it issigned or a notarially certified copy of the power of attorney must be deposited at the registeredoffice of the Company at least 48 hours before the time of the meeting. A form of proxy is enclosed.
4. CDC account holders will further have to follow the under mentioned guidelines as laid down bythe Securities and Exchange Commission of Pakistan (SECP).
th
rd
4
NOTICE OFANNUAL GENERAL MEETING
A. For attending the meeting:
(i) In case of individuals, the account holder or sub-account holder and / or the person whosesecurities are in group account and their registration details are uploaded as per the regulations,shall authenticate his/her identity by showing his/her original CNIC or original passport at thetime of attending the meeting.
(ii) In case of corporate entity, the Board of Directors resolution / power of attorney with specimensignature of the nominees shall be produced (unless it has been provided earlier) at the time ofthe Meeting.
B. For appointing proxies:
(i) In case of individuals, the account holder or sub-account holder and/or the person whose securitiesare in group account and their registration details are uploaded as per the Regulations, shallsubmit the proxy form accordingly.
(ii) The proxy form shall be witnessed by two persons whose names, addresses and CNIC numbersshall be mentioned on the form.
(iii) Attested copies of CNIC or the passport of the beneficial owners and the proxy shall be furnishedwith the proxy form.
(iv) The proxy shall produce his/her original CNIC or original passport at the time of meeting.
(v) In case of corporate entity, the Board of Directors� resolution/power of attorney with specimensignature shall be submitted (unless it has been provided earlier) along with proxy form to theCompany.
CNIC / NTN
5. The Securities and Exchange Commission of Pakistan (SECP) vide its notification SRO 831(1)/2012dated 5 July 2012 require that the dividend warrant(s) should bear CNIC number of the registeredmember or the authorised person, except in case of minor(s) and corporate members. Accordingly,members who have not yet submitted copy of their valid CNIC or NTN in case of corporate entitiesare requested to submit the same to the Company�s Share Registrar. In case of non-compliance,the Company may withhold dispatch of dividend warrants under intimation to regulator till suchtime they provide the valid copy of their CNIC as per law.
E-Mandate
6. After the promulgation of the Companies Act, 2017 the listed companies are obliged to pay cashdividend through electronic mode only by directly crediting the dividend amount in the designatedbank accounts of the entitled shareholders. Accordingly the shareholders who hold shares inphysical form are requested to submit the e-dividend mandate to the Company�s registered officewhile the shareholders who hold shares in Central Depository Company Limited are requestedto submit the e-dividend mandate to the participants/investor account services department of theCentral Depository Company Limited. In case of non-compliance, the Company in line with thedirections given by the regulator will not be able to make payment of dividend.
Filer and Non-Filer Status
7. Pursuant to the provisions of Finance Act, 2017 effective 1 July 2017, deduction of income taxfrom dividend payments shall be made on the basis of filers and non-filers as follows:
For filers of income tax returns 15%For non-filers of income tax returns 20%
Income Tax will be deducted on the basis of Active Tax Payers List posted on the Federal Boardof Revenue website. Members seeking exemption from deduction of income tax or are eligiblefor deduction at a reduced rate are requested to submit a valid tax certificate or necessarydocumentary evidence, as the case may be.
The shareholders who have joint shareholdings held by Filers and Non-Filers shall be dealt withseparately and in such particular situation, each account holder is to be treated as either a Fileror a Non-Filer and tax will be deducted according to his shareholding. If the share is notascertainable then each account holder will be assumed to hold equal proportion of shares andthe deduction will be made accordingly. Therefore, in order to avoid deduction of tax at a higherrate, the joint account holders are requested to provide the details of their shareholding to theShare Registrar of the Company latest by the AGM date.
8. Shareholders are requested to notify change of their addresses, if any immediately.
5
NOTICE OFANNUAL GENERAL MEETING

Dear Shareholders,
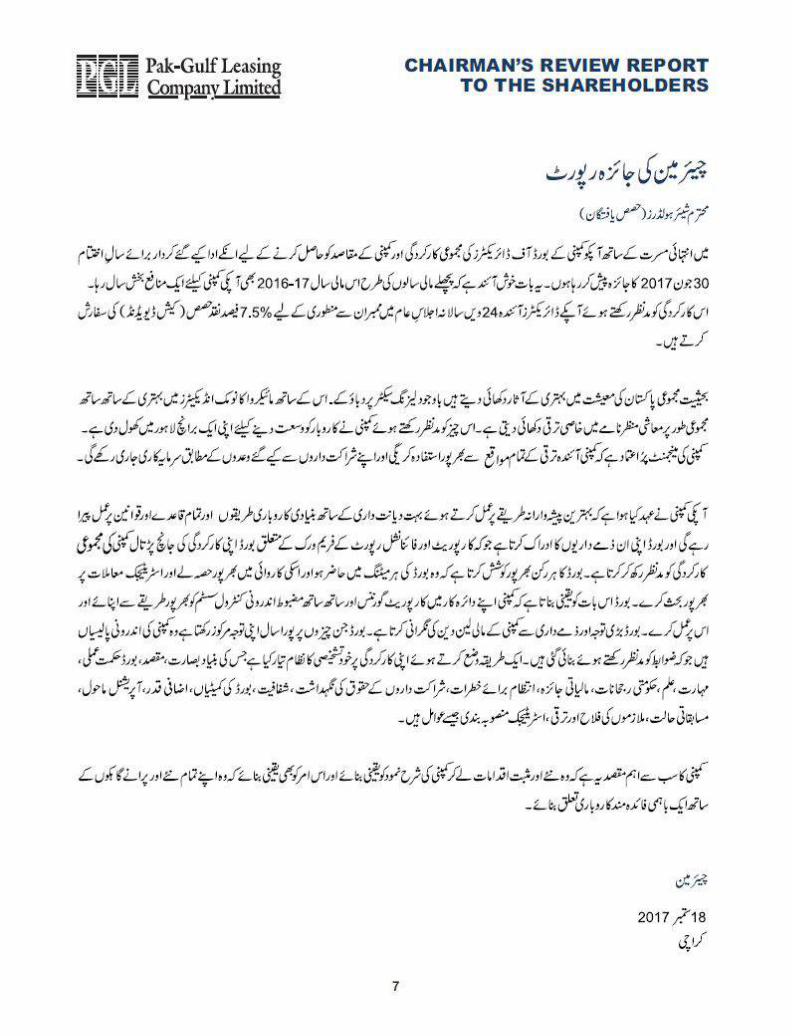
I am pleased to present to you a review of the overall performance of the Board of the Company andeffectiveness of the role played by it in achieving the Company�s objectives for the year ended June30, 2017. It is heartening to know that like previous years FY 2016-17 remained a year of increasedprofitable performance for the Company. Resultantly, the Board has recommended to pass on thebenefit to shareholders by proposing a final cash dividend of 7.5% i.e. Rs. 0.75/- per share for approvalfrom members at the forthcoming 24 Annual General Meeting of the Company.
Pakistan�s overall economy indicates signs of promise despite hiccups and constraints for leasingsector, with improvements in the macroeconomic indicators and the overall economic scenario isforeseen to be conducive for growth. To this end the Company has started its branch based operationsby starting its first branch at Lahore to good effect. The management of the Company is confidentthat the Company will continue to capitalize on growth opportunities through its commitment towardsstakeholders.
Your Company is committed to follow the best business practices and religiously adheres to theregulatory framework and all applicable rules and regulations and the Board acknowledges itsresponsibility towards Corporate & Financial Reporting Framework. The Board evaluates its performanceby considering the overall performance of the Company. Every member of the Board makes an all-out effort to attend the Board meetings and to actively participate in these proceedings, wherein indepth and detailed discussions are held on various strategic issues. The Board ensures that theCompany adopts and follows the best practices of corporate governance in all areas of its operations,as well as having a robust internal control system in place. The Board closely monitors the financingtransactions being undertaken by the Company. Compliance with the internal policies developed inaccordance with regulatory requirements is one area on which the Board remains focused throughoutthe year. In line with the requirements of Code of Corporate Governance we have developed andsuccessfully implemented a methodology for self-evaluation of the Board�s performance as an entitybased on: vision, mission, strategy, skills, knowledge, governance trends, financial overview, riskmanagement, protection of shareholders� right, transparency, board committees, value addition,operational environment, competitive position, employee development and strategic planning.
The Company aims to achieve sustainable growth by undertaking strategic and forward lookinginitiatives and ensuring mutually beneficial business relationship with all its clients existing as wellas new.
Chairman
September 18, 2017
Karachi
th
6
CHAIRMAN�S REVIEW REPORTTO THE SHAREHOLDERS
8
Dear Shareholders,
Your directors are pleased to present the 24 Annual Report of Pak-Gulf Leasing Company Limited(PGL), including financial statements and the Auditors� Report, for the year ended June 30, 2017.
OPERATIONAL OVERVIEW
Keeping in view the restrictive operational environment, under which your Company was required toperform, the growth in PGL�s business during the financial year under review appears to be fairlyimpressive.
During the year under review in line with your Company�s well tested policy of the past Companyundertook, repeat business with some of PGL�s most consistently performing and well establishedlessees, adding at the same time fresh client relationships with good market standing. Wherever thequantum of exposure to a lessee necessitated mitigation of risk, additional collateral securities wereobtained from the lessees, other than the leased assets. This approach to beef up the security forassets based financing is unique to your Company as most leasing companies in the market restrictthe security for leasing finance only to the relative assets being leased.
As far as new business relationships are concerned same were considered by PGL, by taking intoaccount the related financials of the prospective lessee, its market reputation and historical trackrecord, in addition to other risk evaluation factors justifying the viability of the financing propositionoffered to the Company. All approvals are subject to an independent survey and valuation of the assetsto be leased.
It has been a cornerstone of PGL�s fund management policy to rely for a greater part on internallygenerated financial resource for funding the Company�s business. Consequently, your Company laysgreat emphasis on timely and regular repayments from the lessees under all leasing commitments.It is a matter of pride to state that your Company for the past couple of years has been reporting anextraordinary Recovery Rate. For the year under review this Rate was 96.62%.
The exceptionally high growth in business, during FY-2016-17, despite the outstanding performancewith respect to lease rental payments, required your Company to finance its increased businessthrough Short Term Borrowings from commercial banks, and fresh investment from the Sponsors ofPGL in the Company�s CoI Scheme. The Sponsors of your Company need to be thanked, for theircontribution in hour of need to meet the Company�s funding requirements and for the trust andconf idence reposed by them in the management o f your Company �s a f fa i rs .
ANALYSIS OF PGL�s OPERATIONAL AND FINANCIAL PERFORMANCE IN FY-2016-17
Leases Written and Disbursed
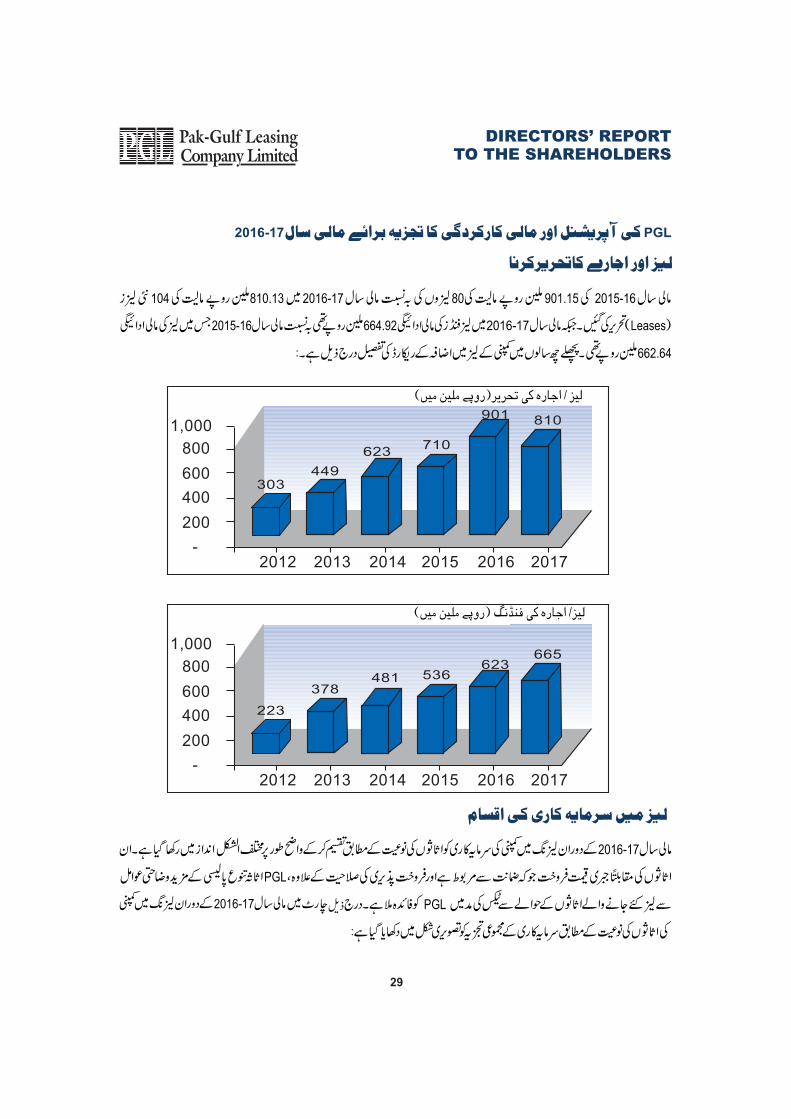
104 new leases of Rs. 810.13 million were written, during FY-2016-17, as compared to 80 numberof leases of Rs. 901.15 million written in the FY-2015-16 while lease disbursement amount during FY-2016-17 was Rs. 664.92 million as compared to Rs. 622.64 million for FY-2015-16. The growth inLeases written and amount disbursed by your Company, over the past 6 years, is illustrated in thefollowing Chart:
DIRECTORS� REPORTTO THE SHAREHOLDERS
th

800
600
400
200
2012 2013 2014 2015 2016 2017
Lease / Ijarah Written (Rs. in million)
1,000
-
449
623710
901
303
810
Categories of Investment in Lease
The Company as per its past practices and in order to cater for unexpected ups and downs in variousbusiness has kept the assets-wise distribution of its Company�s Investment in Leasing, during FY-2016-17 well diversified. Major factors of assets diversification policy of PGL have been the tax advantagesavailable to PGL with respect to the assets being leased; and the security associated with the relativeforced sale values of those assets and marketability thereof, in the unlikely event of any foreclosure. TheChart below gives a visual picture of the breakdown of PGL�s Assets-wise Investment in Leasing, duringFY-2016-17:
DIRECTORS� REPORTTO THE SHAREHOLDERS
9
Vehicle 14.55% Machinery & Equipment 79.21% Others 6.24%
Main catergories of Invesment In Lease
800
600
400
200
2012 2013 2014 2015 2016 2017
Lease / Ijarah Disbursement (Rs. in million)
1,000
-
378481 536
623
223
665
10
DIRECTORS� REPORTTO THE SHAREHOLDERS
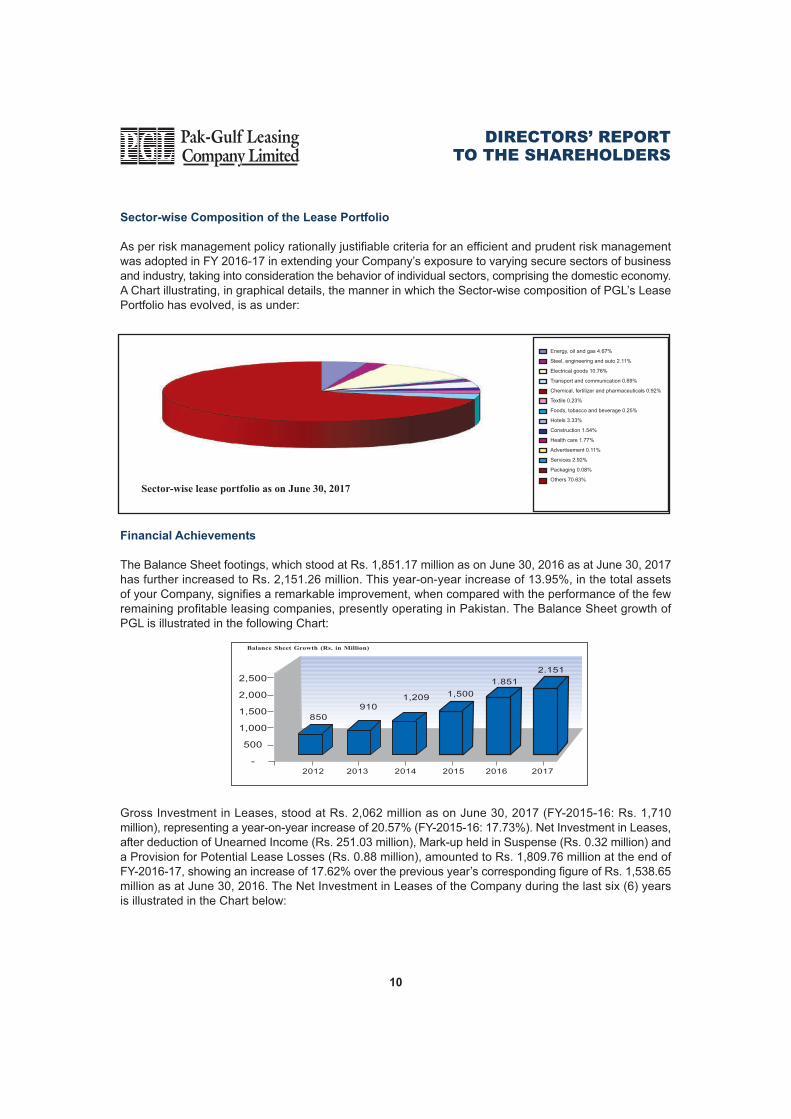
Sector-wise Composition of the Lease Portfolio
As per risk management policy rationally justifiable criteria for an efficient and prudent risk managementwas adopted in FY 2016-17 in extending your Company�s exposure to varying secure sectors of businessand industry, taking into consideration the behavior of individual sectors, comprising the domestic economy.A Chart illustrating, in graphical details, the manner in which the Sector-wise composition of PGL�s LeasePortfolio has evolved, is as under:
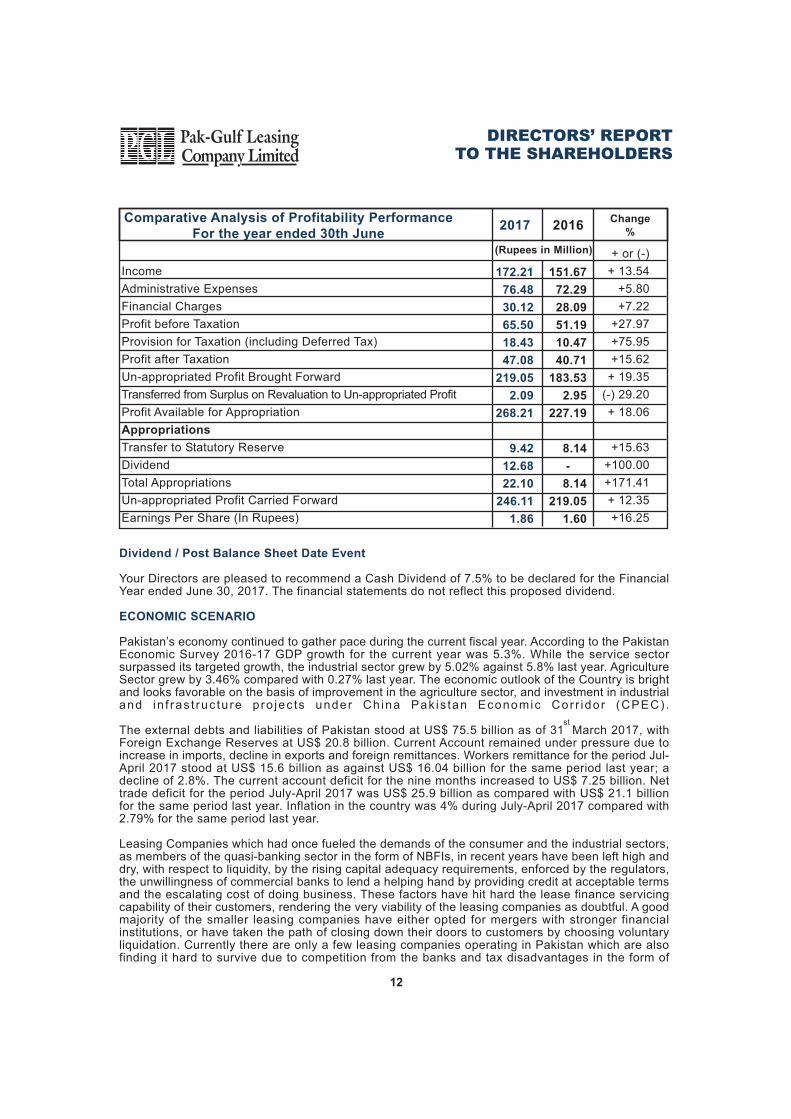
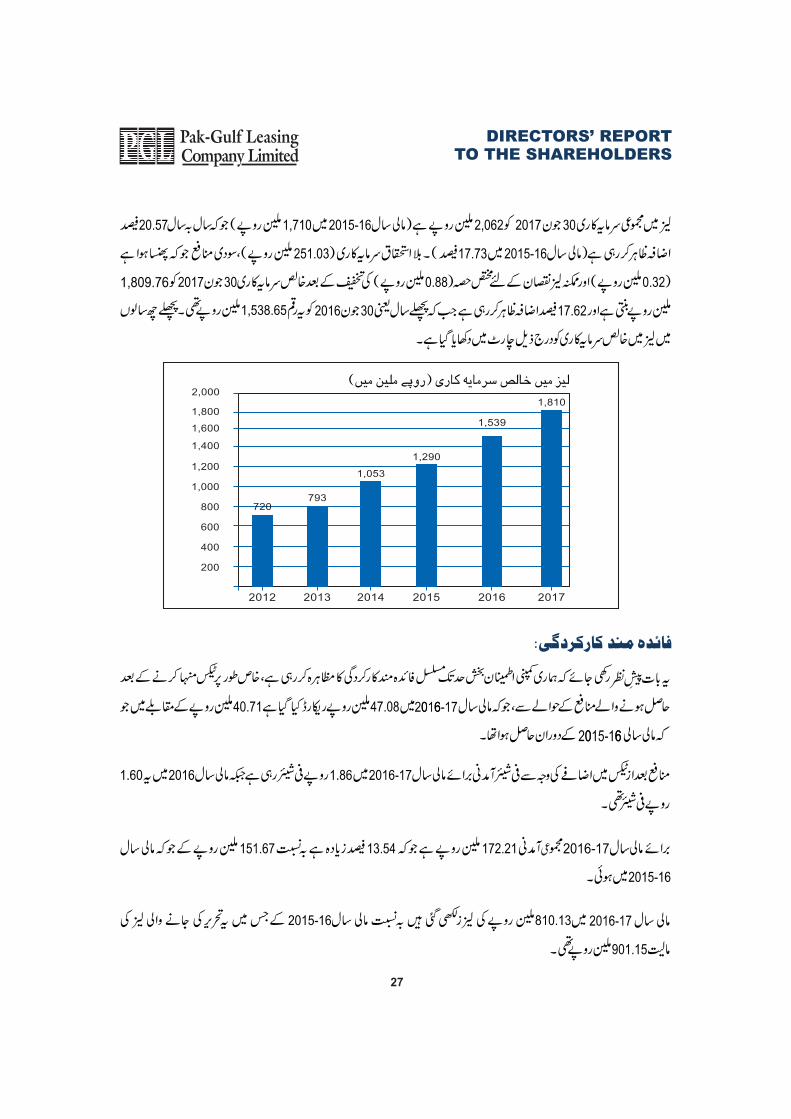
Gross Investment in Leases, stood at Rs. 2,062 million as on June 30, 2017 (FY-2015-16: Rs. 1,710million), representing a year-on-year increase of 20.57% (FY-2015-16: 17.73%). Net Investment in Leases,after deduction of Unearned Income (Rs. 251.03 million), Mark-up held in Suspense (Rs. 0.32 million) anda Provision for Potential Lease Losses (Rs. 0.88 million), amounted to Rs. 1,809.76 million at the end ofFY-2016-17, showing an increase of 17.62% over the previous year�s corresponding figure of Rs. 1,538.65million as at June 30, 2016. The Net Investment in Leases of the Company during the last six (6) yearsis illustrated in the Chart below:
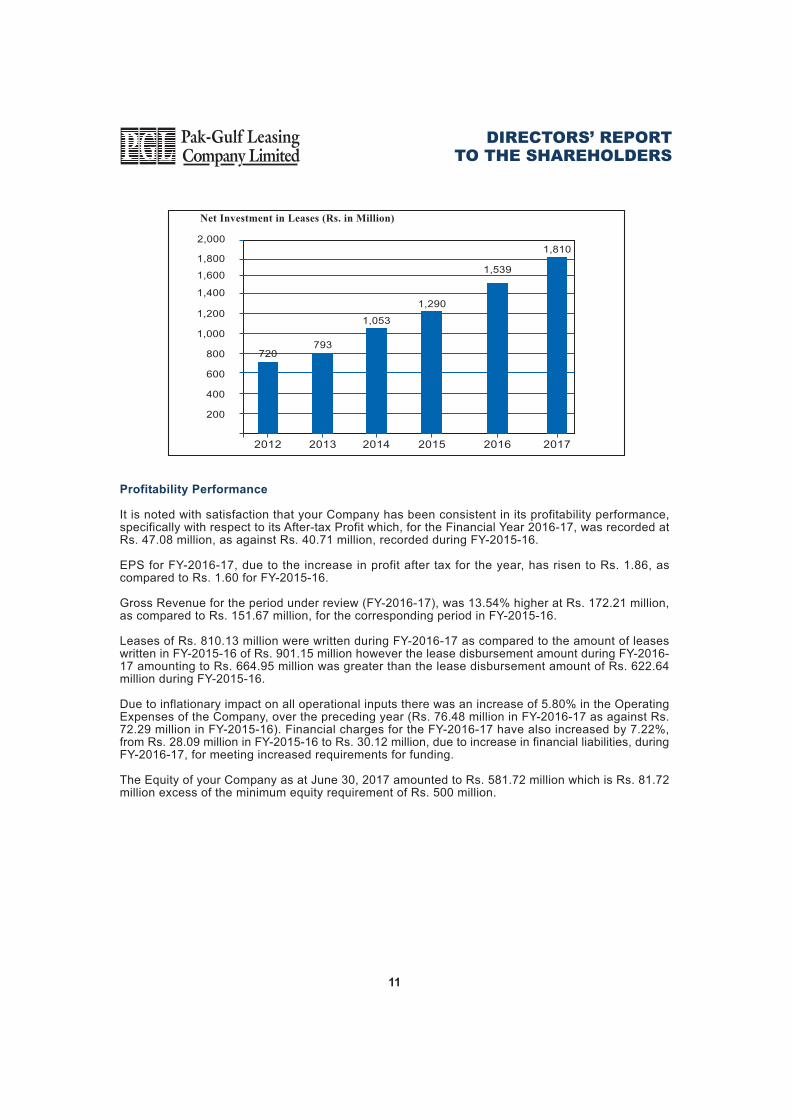
Financial Achievements
The Balance Sheet footings, which stood at Rs. 1,851.17 million as on June 30, 2016 as at June 30, 2017has further increased to Rs. 2,151.26 million. This year-on-year increase of 13.95%, in the total assetsof your Company, signifies a remarkable improvement, when compared with the performance of the fewremaining profitable leasing companies, presently operating in Pakistan. The Balance Sheet growth ofPGL is illustrated in the following Chart:
2,500
2,000
1,500
1,000
500
-
Balance Sheet Growth (Rs. in Million)
2012 2013 2014 2015 2016 2017
850
9101,209 1,500
1.851
2.151
Sector-wise lease portfolio as on June 30, 2017
Energy, oil and gas 4.67%
Steel, engineering and auto 2.11%
Electrical goods 10.76%
Transport and communication 0.69%
Chemical, fertilizer and pharmaceuticals 0.92%
Textile 0.23%
Foods, tobacco and beverage 0.25%
Hotels 3.33%
Construction 1.54%
Health care 1.77%
Advertisement 0.11%
Services 2.92%
Packaging 0.08%
Others 70.63%
11
DIRECTORS� REPORTTO THE SHAREHOLDERS
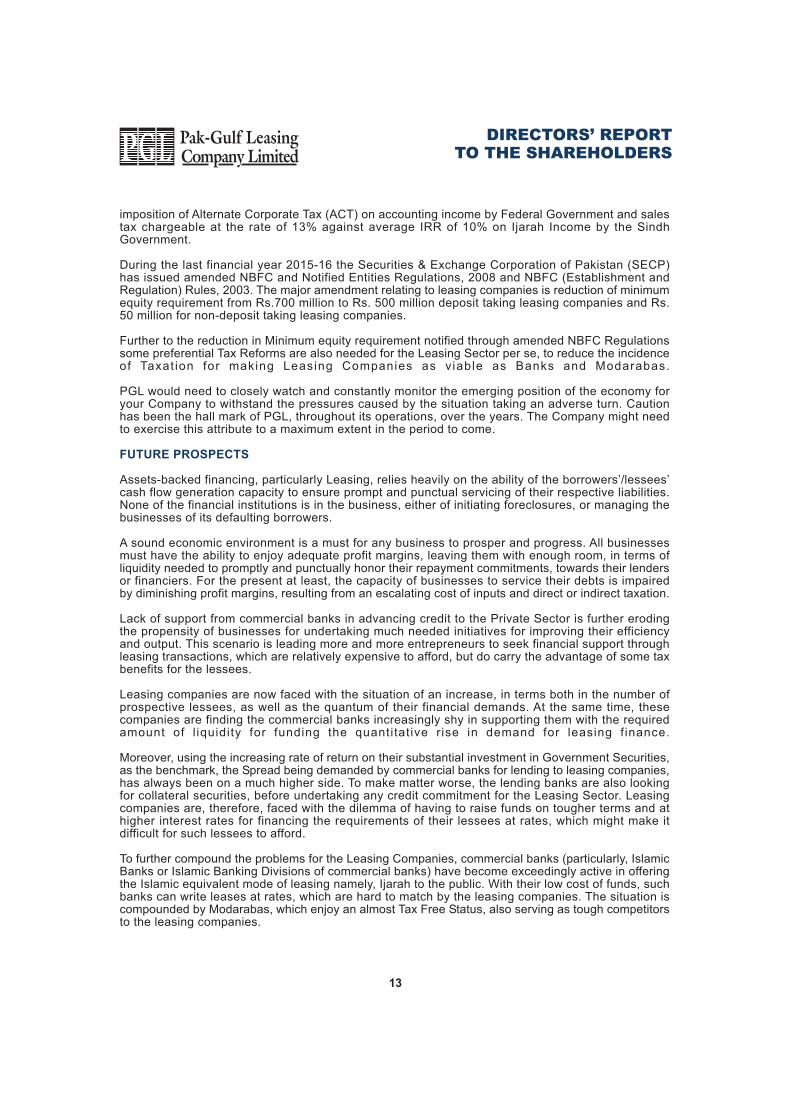
Profitability Performance
It is noted with satisfaction that your Company has been consistent in its profitability performance,specifically with respect to its After-tax Profit which, for the Financial Year 2016-17, was recorded atRs. 47.08 million, as against Rs. 40.71 million, recorded during FY-2015-16.
EPS for FY-2016-17, due to the increase in profit after tax for the year, has risen to Rs. 1.86, ascompared to Rs. 1.60 for FY-2015-16.
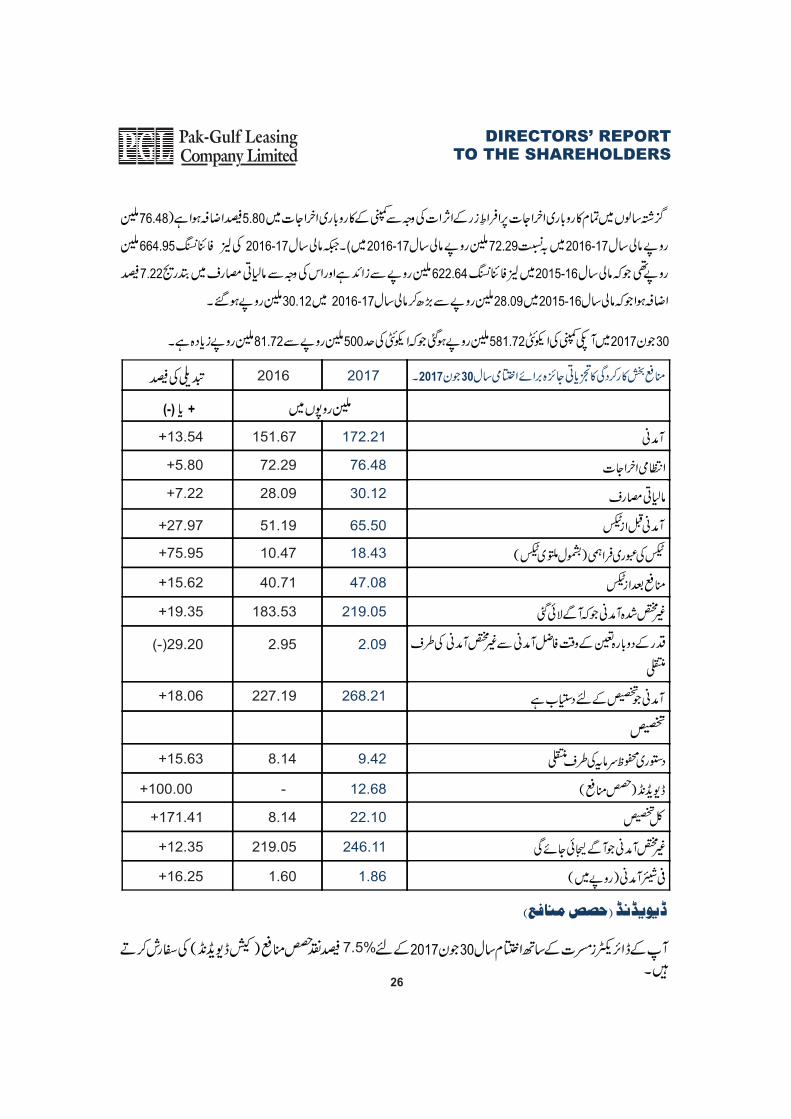
Gross Revenue for the period under review (FY-2016-17), was 13.54% higher at Rs. 172.21 million,as compared to Rs. 151.67 million, for the corresponding period in FY-2015-16.
Leases of Rs. 810.13 million were written during FY-2016-17 as compared to the amount of leaseswritten in FY-2015-16 of Rs. 901.15 million however the lease disbursement amount during FY-2016-17 amounting to Rs. 664.95 million was greater than the lease disbursement amount of Rs. 622.64million during FY-2015-16.
Due to inflationary impact on all operational inputs there was an increase of 5.80% in the OperatingExpenses of the Company, over the preceding year (Rs. 76.48 million in FY-2016-17 as against Rs.72.29 million in FY-2015-16). Financial charges for the FY-2016-17 have also increased by 7.22%,from Rs. 28.09 million in FY-2015-16 to Rs. 30.12 million, due to increase in financial liabilities, duringFY-2016-17, for meeting increased requirements for funding.
The Equity of your Company as at June 30, 2017 amounted to Rs. 581.72 million which is Rs. 81.72million excess of the minimum equity requirement of Rs. 500 million.
2012 2013 2014 2015 2016
1,200
1,000
800
600
400
200
1,400
Net Investment in Leases (Rs. in Million)
1,600
1,800
2,000
2017
1,810
1,290
1,053
793720
1,539
12
DIRECTORS� REPORTTO THE SHAREHOLDERS
2016
151.67
72.29
28.09
51.19
10.47
40.71
183.53
2.95
227.19
8.14
-
8.14
219.05
1.60
(Rupees in Million)
Income
Administrative Expenses
Financial Charges
Profit before Taxation
Provision for Taxation (including Deferred Tax)
Profit after Taxation
Un-appropriated Profit Brought Forward
Transferred from Surplus on Revaluation to Un-appropriated Profit
Profit Available for Appropriation
Appropriations
Transfer to Statutory Reserve
Dividend
Total Appropriations
Un-appropriated Profit Carried Forward
Earnings Per Share (In Rupees)
2017
172.21
76.48
30.12
65.50
18.43
47.08
219.05
2.09
268.21
9.42
12.68
22.10
246.11
1.86
Comparative Analysis of Profitability Performance
For the year ended 30th June
Change
%
+ or (-)
+ 13.54
+5.80
+7.22
+27.97
+75.95
+15.62
+ 19.35
(-) 29.20
+ 18.06
+15.63
+100.00
+171.41
+ 12.35
+16.25
Dividend / Post Balance Sheet Date Event
Your Directors are pleased to recommend a Cash Dividend of 7.5% to be declared for the FinancialYear ended June 30, 2017. The financial statements do not reflect this proposed dividend.
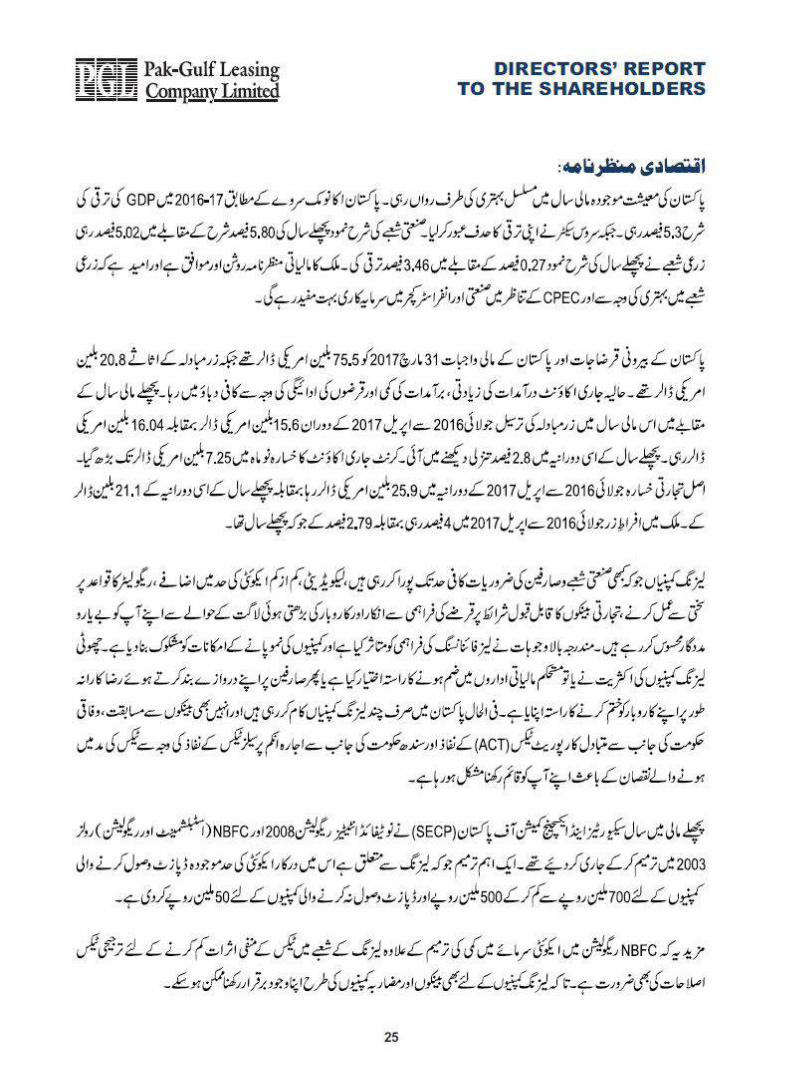
ECONOMIC SCENARIO
Pakistan�s economy continued to gather pace during the current fiscal year. According to the PakistanEconomic Survey 2016-17 GDP growth for the current year was 5.3%. While the service sectorsurpassed its targeted growth, the industrial sector grew by 5.02% against 5.8% last year. AgricultureSector grew by 3.46% compared with 0.27% last year. The economic outlook of the Country is brightand looks favorable on the basis of improvement in the agriculture sector, and investment in industrialand in f ras t ruc tu re p ro jec ts under Ch ina Pak is tan Economic Cor r idor (CPEC) .
The external debts and liabilities of Pakistan stood at US$ 75.5 billion as of 31 March 2017, withForeign Exchange Reserves at US$ 20.8 billion. Current Account remained under pressure due toincrease in imports, decline in exports and foreign remittances. Workers remittance for the period Jul-April 2017 stood at US$ 15.6 billion as against US$ 16.04 billion for the same period last year; adecline of 2.8%. The current account deficit for the nine months increased to US$ 7.25 billion. Nettrade deficit for the period July-April 2017 was US$ 25.9 billion as compared with US$ 21.1 billionfor the same period last year. Inflation in the country was 4% during July-April 2017 compared with2.79% for the same period last year.
Leasing Companies which had once fueled the demands of the consumer and the industrial sectors,as members of the quasi-banking sector in the form of NBFIs, in recent years have been left high anddry, with respect to liquidity, by the rising capital adequacy requirements, enforced by the regulators,the unwillingness of commercial banks to lend a helping hand by providing credit at acceptable termsand the escalating cost of doing business. These factors have hit hard the lease finance servicingcapability of their customers, rendering the very viability of the leasing companies as doubtful. A goodmajority of the smaller leasing companies have either opted for mergers with stronger financialinstitutions, or have taken the path of closing down their doors to customers by choosing voluntaryliquidation. Currently there are only a few leasing companies operating in Pakistan which are alsofinding it hard to survive due to competition from the banks and tax disadvantages in the form of
st
13
DIRECTORS� REPORTTO THE SHAREHOLDERS
imposition of Alternate Corporate Tax (ACT) on accounting income by Federal Government and salestax chargeable at the rate of 13% against average IRR of 10% on Ijarah Income by the SindhGovernment.
During the last financial year 2015-16 the Securities & Exchange Corporation of Pakistan (SECP)has issued amended NBFC and Notified Entities Regulations, 2008 and NBFC (Establishment andRegulation) Rules, 2003. The major amendment relating to leasing companies is reduction of minimumequity requirement from Rs.700 million to Rs. 500 million deposit taking leasing companies and Rs.50 million for non-deposit taking leasing companies.
Further to the reduction in Minimum equity requirement notified through amended NBFC Regulationssome preferential Tax Reforms are also needed for the Leasing Sector per se, to reduce the incidenceof Taxat ion for making Leasing Companies as v iable as Banks and Modarabas.
PGL would need to closely watch and constantly monitor the emerging position of the economy foryour Company to withstand the pressures caused by the situation taking an adverse turn. Cautionhas been the hall mark of PGL, throughout its operations, over the years. The Company might needto exercise this attribute to a maximum extent in the period to come.
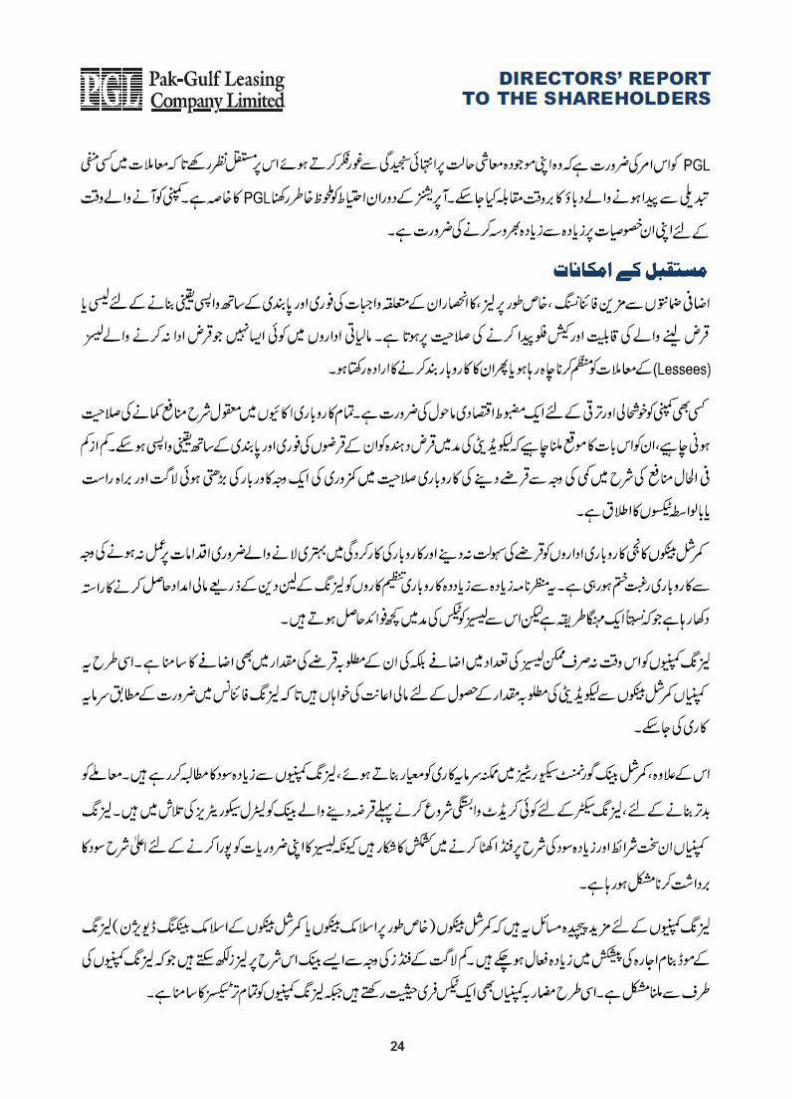
FUTURE PROSPECTS
Assets-backed financing, particularly Leasing, relies heavily on the ability of the borrowers�/lessees�cash flow generation capacity to ensure prompt and punctual servicing of their respective liabilities.None of the financial institutions is in the business, either of initiating foreclosures, or managing thebusinesses of its defaulting borrowers.
A sound economic environment is a must for any business to prosper and progress. All businessesmust have the ability to enjoy adequate profit margins, leaving them with enough room, in terms ofliquidity needed to promptly and punctually honor their repayment commitments, towards their lendersor financiers. For the present at least, the capacity of businesses to service their debts is impairedby diminishing profit margins, resulting from an escalating cost of inputs and direct or indirect taxation.
Lack of support from commercial banks in advancing credit to the Private Sector is further erodingthe propensity of businesses for undertaking much needed initiatives for improving their efficiencyand output. This scenario is leading more and more entrepreneurs to seek financial support throughleasing transactions, which are relatively expensive to afford, but do carry the advantage of some taxbenefits for the lessees.
Leasing companies are now faced with the situation of an increase, in terms both in the number ofprospective lessees, as well as the quantum of their financial demands. At the same time, thesecompanies are finding the commercial banks increasingly shy in supporting them with the requiredamount of l iquidity for funding the quantitat ive rise in demand for leasing f inance.
Moreover, using the increasing rate of return on their substantial investment in Government Securities,as the benchmark, the Spread being demanded by commercial banks for lending to leasing companies,has always been on a much higher side. To make matter worse, the lending banks are also lookingfor collateral securities, before undertaking any credit commitment for the Leasing Sector. Leasingcompanies are, therefore, faced with the dilemma of having to raise funds on tougher terms and athigher interest rates for financing the requirements of their lessees at rates, which might make itdifficult for such lessees to afford.
To further compound the problems for the Leasing Companies, commercial banks (particularly, IslamicBanks or Islamic Banking Divisions of commercial banks) have become exceedingly active in offeringthe Islamic equivalent mode of leasing namely, Ijarah to the public. With their low cost of funds, suchbanks can write leases at rates, which are hard to match by the leasing companies. The situation iscompounded by Modarabas, which enjoy an almost Tax Free Status, also serving as tough competitorsto the leasing companies.
14
DIRECTORS� REPORTTO THE SHAREHOLDERS
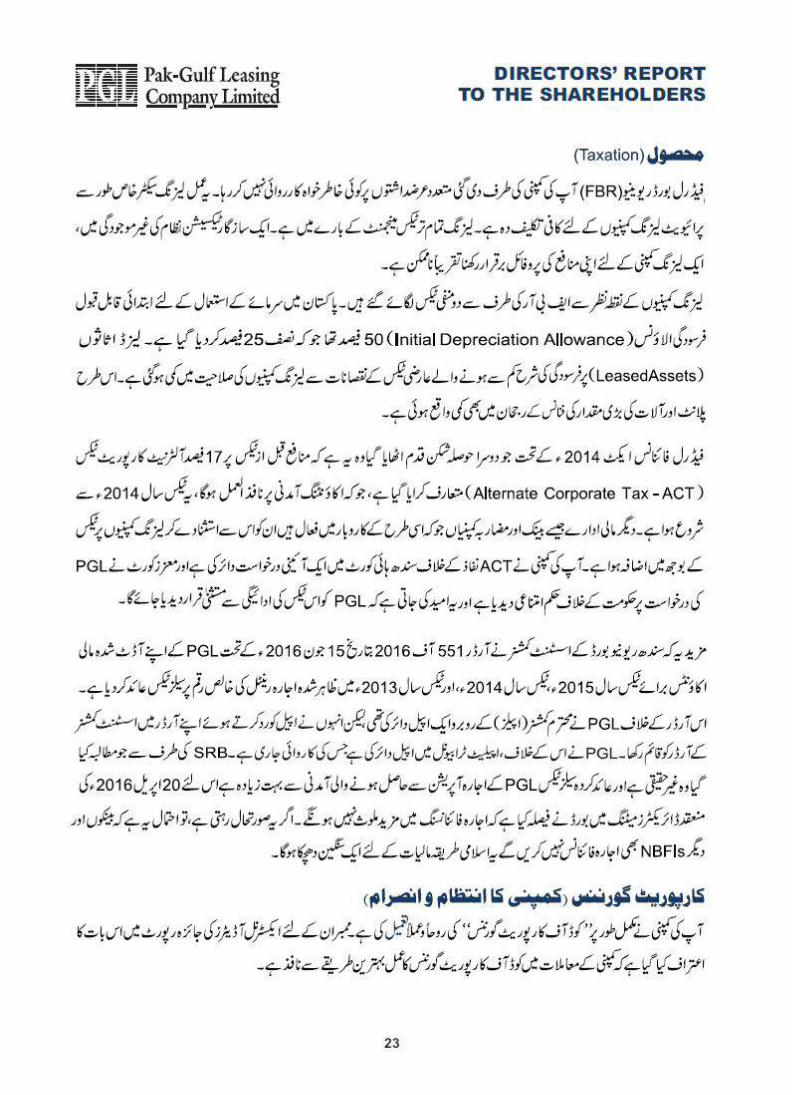
Taxation
The Federal Board of Revenue (FBR), despite a number of representations made by your Company,even at the level of the Finance Minister, has remained oblivious to the predicaments of the LeasingSector, as a whole, with respect particularly to privately-owned leasing companies. Leasing is allabout Tax Management. In the absence of an enabling and conducive taxation regime, it is almostimpossible for a leasing company to maintain its profitability profile.
Two adverse tax measures have been undertaken by the FBR from the standpoint of leasing companies.To begin with Initial Depreciation Allowance admissible for a first time use of assets in Pakistan hasbeen halved to 25% from the originally available rate of 50%. This has, in one sharp blow, curtailedthe ability of leasing companies to enjoy temporary Tax Losses arising from Depreciation on leasedassets, thereby reducing their appetite for financing larger amounts of Plant & Equipment.
The second discouraging step taken under The Federal Finance Act 2014 was the introduction of anAlternate Corporate Tax (ACT) at 17%, which has been retrospectively applied on Accounting Income,starting from current Tax Year 2014. This has increased the tax burden on leasing companies, ascompared to other financial institutions engaged in a similar business activity, such as banks andmodarabas. Your Company has filed a Constitutional Petition in Sindh High Court against the impositionof ACT, and the Honorable Court has granted an injunction against application of ACT on PGL. It ishoped, that PGL would be exempted from a levying of this Tax, as a result of the Company�s Petition.
Further, the Assistant Commissioner of the Sindh Revenue Board vide Order 551 of 2016 dated 15June 2016 under certain provisions of the Sindh Sales Tax Act, 2011 and Sindh Sales Tax Rules,2011 has charged Sales Tax on gross amount of Ijarah Rental declared by PGL, in accordance withthe requirements of IFAS 2 Ijarah, in its audited financial statements for Tax Year 2015, Tax Year 2014and Tax Year 2013 as Income from Ijarah operations. The Company had filed an appeal against theOrder under Section 57 of the Sindh Sales Tax on Services Act, 2011 before the Commissioner(Appeals) of the SRB, however Commissioner (Appeals) has not allowed the appeal and instead videOrder-in-Appeal No. 20 of 2017 dated March 01, 2017 has upheld the Order-in-original. The Companyhas further filed an appeal against the Order(s) under Section 61 of the Sindh Sales Tax on ServicesAct, 2011 before the Appellate Tribunal of the SRB which is currently in process. As demand createdby the SRB is unrealistic and much more than the profit earned by PGL on Ijarah operations thereforethe Board of Directors in their meeting held on 20 April 2015 has decided not to further engage inIjarah financing. If this state of affairs persists sooner or later, banks and other NBFIs would alsodisengage from Ijarah financing and this would be a serious setback for the Islamic finance.
CORPORATE GOVERNANCE
Your Company has fully implemented the "The Code of Corporate Governance" (the 'Code') in bothletter and spirit. The Review Report of the External Auditors to the Members on the Statement ofCompliance with the Code of Corporate Governance, is appended to this Report.
Board of Directors
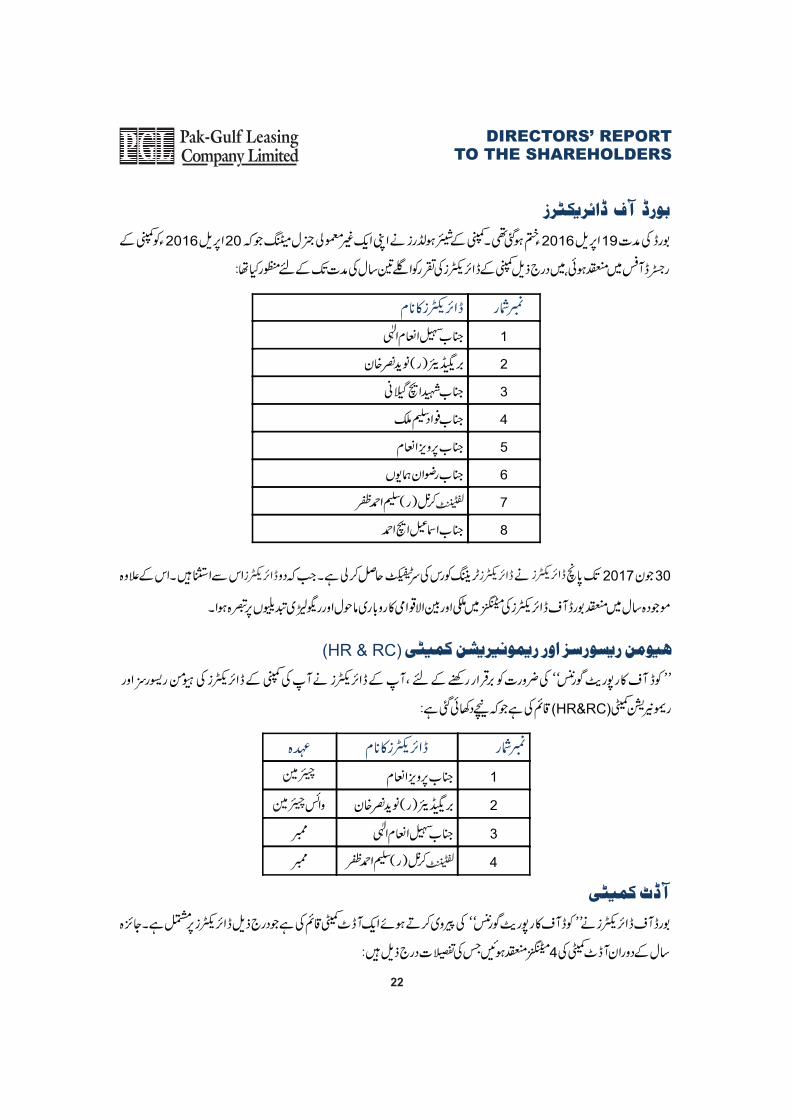
The Board of your Company comprises of the following appointed at the Extra-Ordinary GeneralMeeting held on April 20, 2016 for the next tenure of three (3) years.
S.No. Name of Member
1 Mr. Sohail Inam Ellahi 2 Brigadier (R) Naveed Nasar Khan 3 Mr. Shaheed H Gaylani 4 Mr. Fawad S. Mailk 5 Mr. Pervez Inam 6 Mr. Rizwan Humayun 7 Mr. Ismail H. Ahmed 8 Lt. Col (R) Saleem Ahmed Zafar
15
DIRECTORS� REPORTTO THE SHAREHOLDERS
As at June 30, 2017 five (5) directors of the Company have acquired the required Certificate of DirectorsTraining course while two (2) are exempt from this requirement. Further, the domestic and internationalbusiness environment and regulatory changes were discussed with the directors in the Baord meetingsheld during the year.
Human Resource and Remuneration Committee (HR & RC)
In keeping with the requirements of The Code of Corporate Governance, your directors have constitutedthe Human Resource and Remuneration Committee of the Board of Directors of your Company as shownbelow:
S.No. Name of Member Designation
1. Mr. Pervez Inam Chairman2. Brigadier (R) Naveed Nasar Khan Vice Chairman3. Mr. Sohail Inam Ellahi Member4. Mr. Saleem Ahmed Zafar Member
Audit Committee
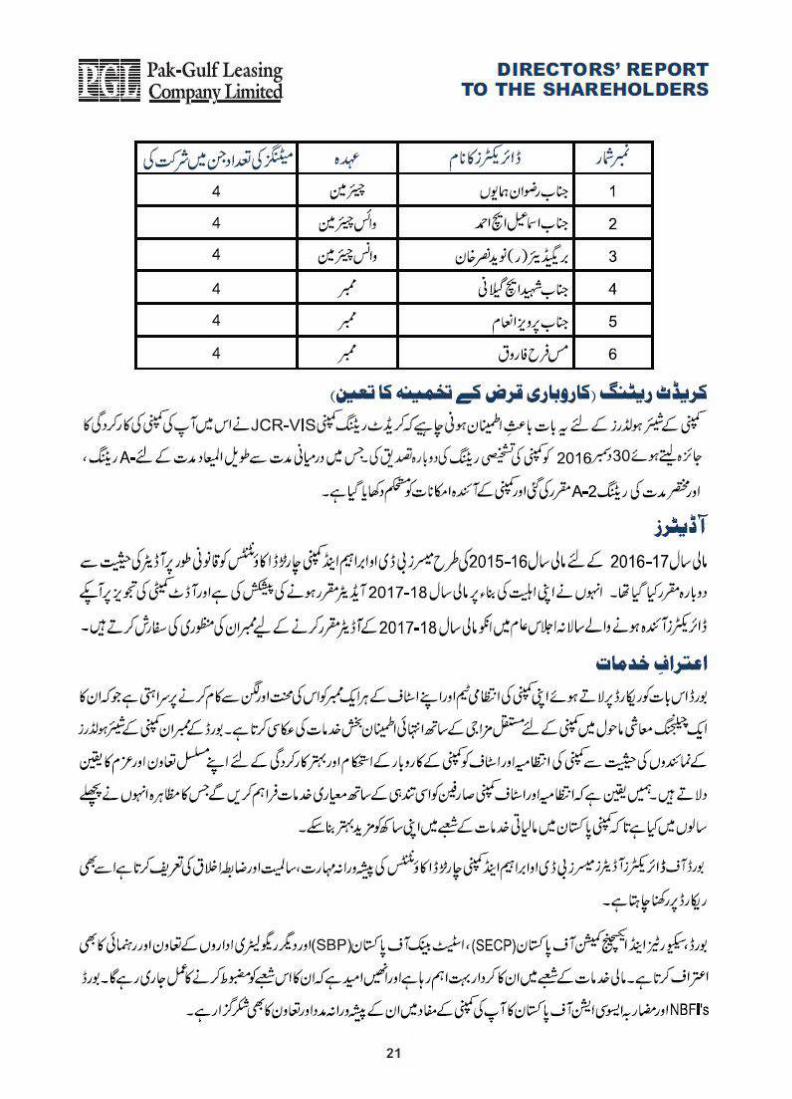
The Board of Directors, in compliance with the Code of Corporate Governance, has established an AuditCommittee consisting of the following directors. During the year under review four (4) meetings of theAudit Committee were held the meeting wise attendance details of which are given below:
S.No. Name of Member Designation No. of Meetings Attended
1. Mr. Rizwan Humayun Chairman 42. Mr. Ismail H. Ahmed Vice Chairman 43. Brigadier (R) Naveed Nasar Khan Member 44. Mr. Shaheed H Gaylani Member 45. Mr. Pervez Inam Member 46. Ms. Farah Farooq Secretary 4
Credit Rating
It should be a matter of great satisfaction for the Company�s Shareholders to note, that JCR-VIS, followinga detailed analysis and evaluation of your Company�s performance, on December 30, 2016, re-affirmedthe Company�s Entity Rating; Medium to Long-term Rating at A-, and the Short-term Rating at A-2. TheOutlook for the Company has been marked as Stable.
Auditors
For the FY-2016-17 Messers BDO Ebrahim & Co., Chartered Accountants were re-appointed as statutoryauditors after audit of FY-2015-16. The auditors have retired, and being eligible, have offered themselvesfor re-appointment for the next financial year FY 2017-18. As recommended by the Audit Committee, theBoard has approved the proposal to appoint M/s Messers BDO Ebrahim & Co., Chartered Accountantsas the statutory auditors of the Company for FY 2017-18, subject to the approval of shareholders at theforthcoming Annual General Meeting of the Company.
Acknowledgements
The Board would like to place on record its appreciation for the management team of your Company andeach and every member of its staff for their hard work and dedication, which has been reflected in aconsistently maintained and highly satisfactory performance of your Company, in the challenging economicenvironment. We, the Members of the Board, as representatives of the Shareholders of the Company,assure the management and staff of the Company of our continued support and commitment towardsstrengthening the Company and leading it to maintain its growth and performance. We are confident, thatthe management and the staff will continue to serve the customers of the Company with the same zeal,as demonstrated by them in all the previous years, enabling your Company to further improve its reputationin the financial services sector of Pakistan.
16
DIRECTORS� REPORTTO THE SHAREHOLDERS
The Board of Directors also wishes to place, on record, the appreciation of external auditors for the highstandards of professionalism, integrity.
The Board also acknowledges the cooperation and guidance extended to the Company by the Securitiesand Exchange Commission of Pakistan (SECP), the State Bank of Pakistan and other regulatory authorities.Their role is critical in developing the Financial Services Sector and we hope that their actions will continueto strengthen this sector. The Board would also like to praise the NBFI�s & Modaraba Association ofPakistan for its assistance and support in professionally safe-guarding your Company�s interest.
At the end, we would like to thank our valued Shareholders, Customers, Bankers, Investors and otherStakeholders for their valuable support during the year. We look forward to reinforcing and building thisrelationship further in the years to come.
Statements in Compliance with the Code of Corporate Governance
The Board of Directors has reviewed the Code of Corporate Governance and confirms the correctnessof the following statements to the best of their knowledge and belief:
� Financial statements prepared by the management of the Pak-Gulf Leasing CompanyLimited, present fairly its state of affairs, the result of its operations, cash flows andchanges in equity.
� Proper books of account of the Company have been maintained.
� Appropriate accounting policies have been consistently applied in preparation of thefinancial statements and the accounting estimates presented in the report are basedon reasonable and prudent judgment.
� International Financial Reporting Standards, as applicable in Pakistan, have beenfollowed in preparation of financial statements and any departures there from has beenadequately disclosed and explained.
� The system of internal control is sound in design, and has been effectively implementedand monitored.
� There is no significant doubt upon the Company's ability to continue as a going concern.
� There was no trade in shares of the Company, carried out by its directors, CEO, COO,CFO, Company Secretary, Head of Internal Audit and their spouses and minor children.
� There has been no material departure from best practices of corporate governance, asdetailed in the listing regulations.
Pattern of Shareholding
Pattern of Shareholdings, as required by the Code of Corporate Governance, as at June 30, 2017, isappended at the end of this Report.
Significant deviations from the last year, in the operating results, have been highlighted at the beginningof this Report, along with reasons thereof.
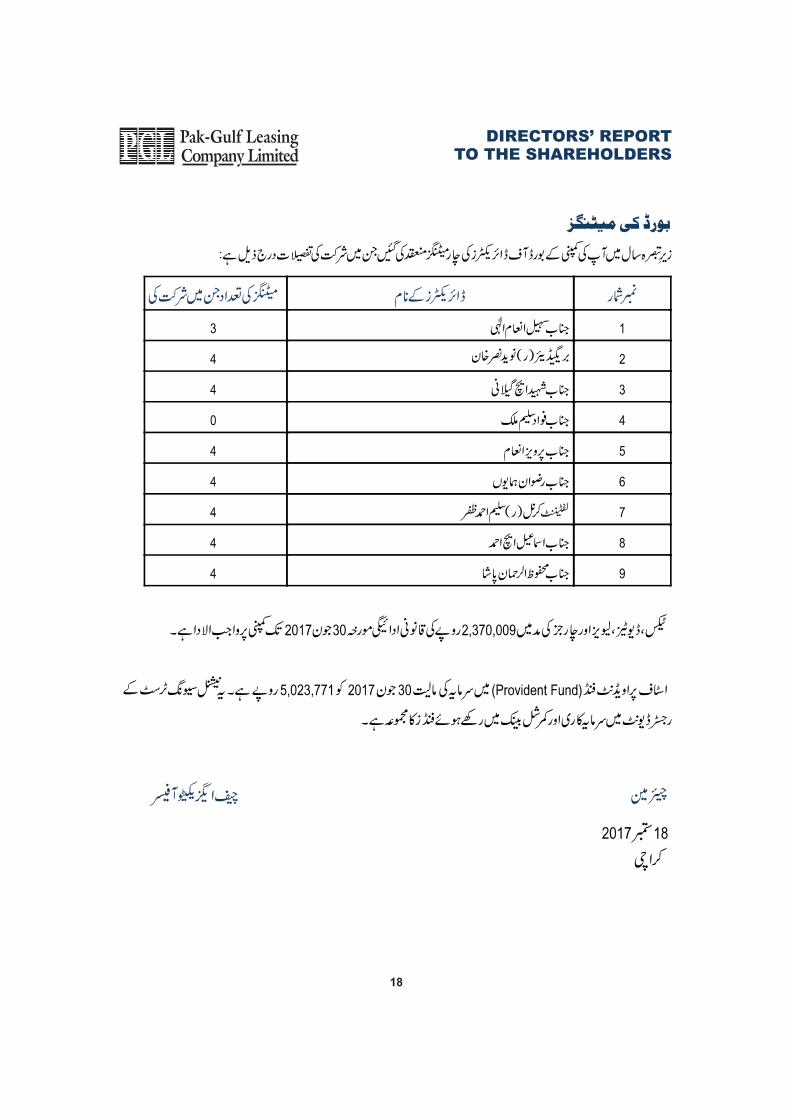
Statutory Payment of Rs. 2,370,009 on account of taxes, duties, levies and/or charges was outstandingagainst the Company as on June 30, 2017.
Value of investments of the Staff Provident Fund stood at Rs. 5,023,771 as at June 30, 2017. Thisrepresents funds placed with a rated commercial bank and investment in the registered units of the NationalInvestment Trust.
Chairman Chief Executive Officer
September 18, 2017Karachi
Board Mettings
Four (04) Board Meetings were held during the year under review. Details of attendance are as follows:
3
4
4
0
4
4
4
4
4
1.
2.
3.
4.
5.
6.
7.
8.
9.
S. No. Name of Director No. of Meetings Attended
Mr. Sohail Inam Ellahi
Brigadier Naveed Nasar Khan (Retd)
Mr. Shaheed H Gaylani
Mr. Fawad Salim Malik
Mr. Pervez Inam
Mr. Rizwan Humayun
Lt. Col. Saleem Ahmed Zafar (Retd)
Mr. Ismail H. Ahmed
Mr. Mahfuz-ur-Rehman Pasha
120,800,853
117,152,534
54,260,991
50,284,982
20,306,096
(52,620)
-
505,500,727
41,949,605
249,535,302
31,071,397
486,656,368
-
28,206,036
1.82
1.98
NIL
1.07
94,648,511
89,270,252
47,678,901
29,220,611
8,372,942
1,420,902
-
452,496,423
42,326,603
196,919,786
83,786,321
334,515,596
-
23,935,647
2.08
1.15
NIL
1.22
77,029,731
70,897,873
46,699,898
27,280,001
5,479,981
(6,883,301)
-
420,278,122
44,554,319
165,471,459
172,425,843
287,278,921
-
5,273,569
2.07
1.08
NIL
2.09
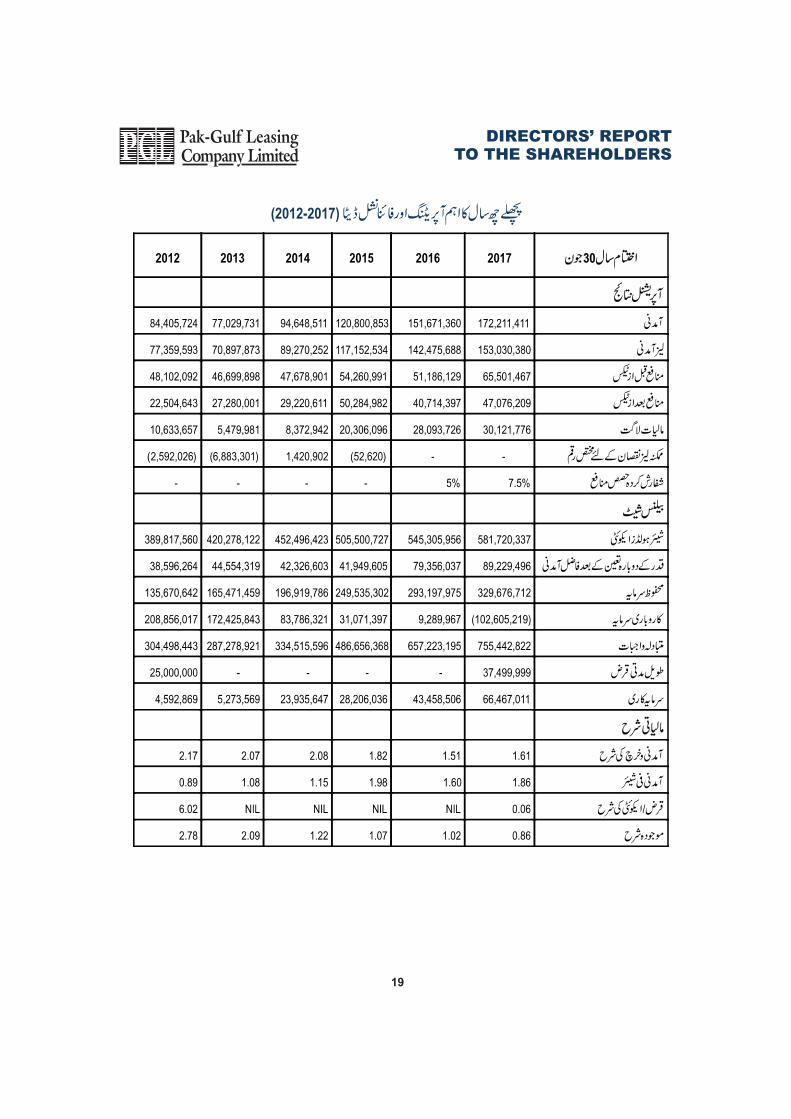
Key Operating and Financial Data for the last six (6) years 2012 � 2017
Year ended 30th June
Operational Results:
Revenues
Lease Revenue
Profit before Taxation
Profit after Taxation
Finance Cost
Provision for Potential Lease Losses
Dividend/(proposed) %
Balance Sheet:
Shareholders Equity
Surplus on Revaluation of Assets
Reserves
Working Capital
Non-current Liabilities
Long-term Loans
Investments
Financial Ratios:
Income / Expense Ratio
Earning per Share (in Rs)
Debt / Equity Ratio
Current Ratio
20142015 20122013
Rupees
151,671,360
142,475,688
51,186,129
40,714,397
28,093,726
-
5%
545,305,956
79,356,037
293,197,975
9,289,967
657,223,195
-
43,458,506
1.51
1.60
NIL
1.02
2016
84,405,724
77,359,593
48,102,092
22,504,643
10,633,657
(2,592,026)
-
389,817,560
38,596,264
135,670,642
208,856,017
304,498,443
25,000,000
4,592,869
2.17
0.89
6.02
2.78
17
DIRECTORS� REPORTTO THE SHAREHOLDERS
172,211,411
153,030,380
65,501,467
47,076,209
30,121,776
-
7.5%
581,720,337
89,229,496
329,676,712
(102,605,219)
755,442,822
37,499,999
66,467,011
1.61
1.86
0.06
0.86
2017
18
DIRECTORS� REPORTTO THE SHAREHOLDERS
DIRECTORS� REPORTTO THE SHAREHOLDERS
19
DIRECTORS� REPORTTO THE SHAREHOLDERS
20
DIRECTORS� REPORTTO THE SHAREHOLDERS
22
DIRECTORS� REPORTTO THE SHAREHOLDERS
26
172.21
76.48
30.12
65.50
18.43
47.08
219.05
2.09
268.21
9.42
12.68
22.10
246.11
1.86
20172016
151.67
72.29
28.09
51.19
10.47
40.71
183.53
2.95
227.19
8.14
-
8.14
219.05
1.60
+13.54
+5.80
+7.22
+27.97
+75.95
+15.62
+19.35
(-)29.20
+18.06
+15.63
+100.00
+171.41
+12.35
+16.25
7.5%
DIRECTORS� REPORTTO THE SHAREHOLDERS
27
2012 2013 2014 2015 2016
1,200
1,000
800
600
400
200
1,400
1,600
1,800
2,000
2017
1,810
1,290
1,053
793720
1,539

DIRECTORS� REPORTTO THE SHAREHOLDERS
28
2,500
2,000
1,500
1,000
500
-2012 2013 2014 2015 2016 2017
850910
1,2091,500
1.851
2.151
14.55% 79.21% 6.24%
4.67%
2.11%
10.76%
0.69%
0.92%
0.23%
0.25%
3.33%
1.54%
1.77%
0.11%
2.92%
0.08%
70.63%
DIRECTORS� REPORTTO THE SHAREHOLDERS
29
800
600
400
200
2012 2013 2014 2015 2016 2017
1,000
-
449
623710
901
303
810
800
600
400
200
2012 2013 2014 2015 2016 2017
1,000
-
378481 536
623
223
665
This statement is being presented to comply with the Code of Corporate Governance contained inRegulation No. 5.19 of Pakistan Stock Exchange Regulations for the purpose of establishing aframework of good governance, whereby a listed company is managed in compliance with the bestpractices of corporate governance.
The Company has applied the principles contained in the CCG in the following manner:
1. The Company encourages representation of independent non-executive directors and directorsrepresenting minority interests on its Board of Directors. At present the Board includes:
*The independent directors meet the criteria of independence under RegulationNo. 5.19.1 (b) of thePakistan Stock Exchange Regulations.
2. The Directors have confirmed that none of them is serving as a Director on more than sevenlisted companies, including this Company.
3. All the resident Directors of the Company are registered as taxpayers and none of them hasdefaulted in payment of any loan to a banking company, a DFI or NBFI or, being a broker of astock exchange, has been declared as a defaulter by that stock exchange.
4. No casual vacancy occurred on the Board of the Company during the year.
5. The Company has prepared a �Code of Conduct�and has ensured that appropriate stepshave been taken to disseminate it throughout the Company along with its supporting policiesand procedures.
6. The Board has developed a vision / mission statement, overall corporate strategy andsignificant policies of the company. A complete record of particulars of significant policiesalong with the dates on which they were approved or amended has been maintained.
7. All the powers of the Board have been duly exercised and decisions on material transactions,including appointment and determination of remuneration and terms and conditions ofemployment of the CEO, other executive and non-executive directors have been taken bythe board/shareholders.
8. The meetings of the Board were presided over by the Chairman and, in his absence, by adirector elected by the board for this purpose and the board met at least once in every quarter.Written notices of the board meetings, along with agenda and working papers, were circulatedat least seven days before the meetings. The minutes of the meetings were appropriatelyrecorded and circulated.
9. As at June 30, 2017 five (5) directors of the Company have acquired the required certificateof Directors Training course while two (2) are exempt from this requirement. Further,thedomestic and international business environment and regulatory changes were discussedwith the directors in the BOD meetings held during the year.
Category Names
Brig. Naveed Nasar Khan (Retd)
Mr. Ismail H. Ahmed
Lt. Col. Saleem Ahmed Zafar (Retd)
Mr. Mahfuz-ur-Rehman Pasha
Mr. Sohail Inam Ellahi
Mr. Fawad Salim Malik
Mr. Pervez Inam
Mr. Shaheed H. Gaylani
Mr. Rizwan Humayun
Independent Directors *
Executive Director
Non-Executive Directors
31
STATEMENT OF COMPLIANCE WITH
THE CODE OF CORPORATE GOVERNANCE
FOR THE YEAR ENDED JUNE 30, 2017
32
FOR THE YEAR ENDED JUNE 30, 2017
STATEMENT OF COMPLIANCE WITH
THE CODE OF CORPORTE GOVERNANCE
10. The appointment, remuneration and terms and conditions of employment of the CFO, CompanySecretary and Head of Internal Audit are approved by the Board of Directors, however therewere no new appointment of CFO, Company Secretary and the Head of Internal Audit duringthe year.
11. The Directors� report for this year has been prepared in compliance with the requirementsof the CCG and fully describes the salient matters required to be disclosed.
12. The financial statements of the Company were duly endorsed by CEO and CFO beforeapproval of the Board.
13. The Directors, CEO and executives do not hold any interest in the shares of the Companyother than that disclosed in the pattern of shareholding.
14. The Company has complied with all the corporate and financial reporting requirements ofthe CCG.
15. The Board has formed an Audit Committee. It comprises of five members, of whom three arenon-executive Directors, two are independent director and the chairman of the committeeis a non-executive director.
16. The meetings of the audit committee were held at least once every quarter prior to approvalof interim and final results of the company and as required by the CCG. The terms of referenceof the committee have been formed and advised to the committee for compliance.
17. The Board has formed an HR and Remuneration Committee. It comprises of four membersof whom two are non-executive Directors, one is executive Director and one is independentDirector. The chairman of the committee is a non-executive director.
18. The Board has set up an effective internal audit function and the internal auditor is consideredsuitably qualified and experienced for the purpose and is conversant with the policies andprocedures of the Company.
19. The statutory auditors of the Company have confirmed that they have been given a satisfactoryrating under the quality control review program of the ICAP, that they or any of the partnersof the firm, their spouses and minor children do not hold shares of the Company and thatthe firm and all its partners are in compliance with International Federation of Accountants(IFAC) guidelines on code of ethics as adopted by the ICAP.
20. The statutory auditors or the persons associated with them have not been appointed toprovide other services except in accordance with the listing regulations and the auditors haveconfirmed that they have observed IFAC guidelines in this regard.
21. The �closed period�, prior to the announcement of interim/final results, and business decisions,which may materially affect the market price of company�s securities, was determined andintimated to directors, employees and stock exchange.
22. Material/price sensitive information has been disseminated among all the market participantsat once through stock exchange.
23. The Company has complied with the requirements relating to maintenance of register ofpersons having access to inside information by designated senior management officer in atimely manner and maintained proper record including basis for inclusion or exclusion ofnames of persons from the said list.
24. We confirm that all other material principles enshrined in the CCG have been duly compliedwith.
Chief Executive Officer Director
September 18, 2017Karachi
33
34
Shariah Advisor�s Report
35
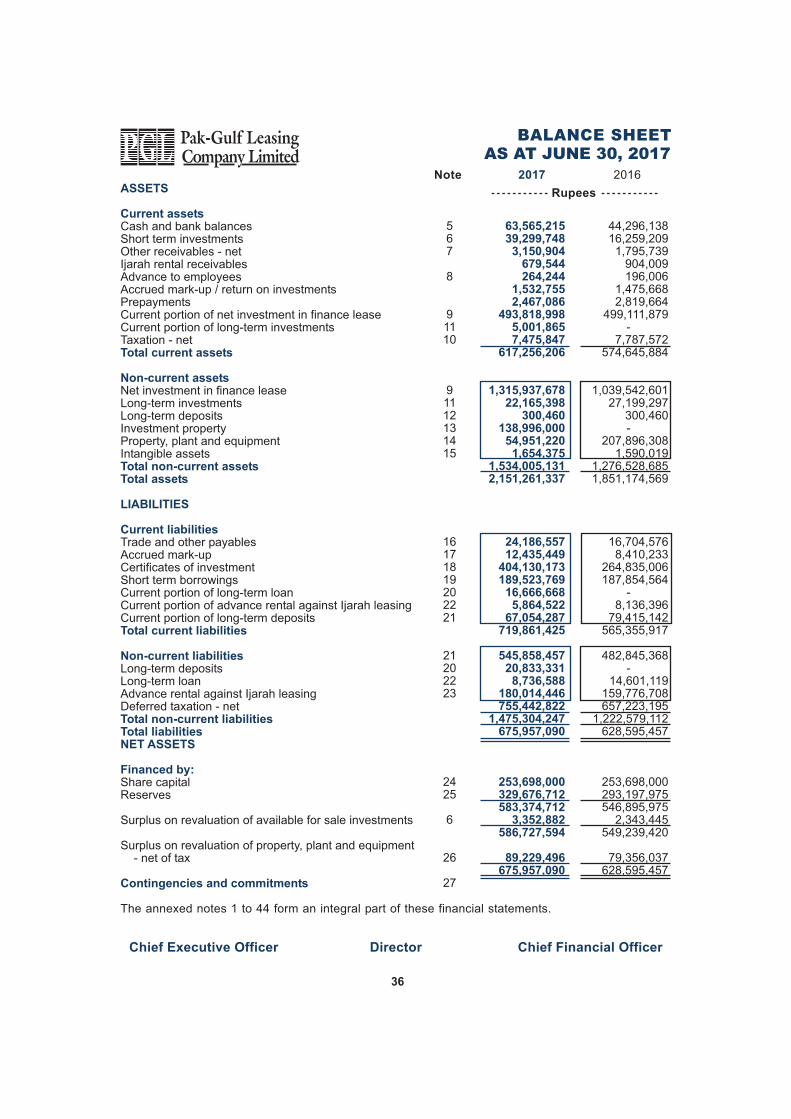
ASSETS
Current assetsCash and bank balancesShort term investmentsOther receivables - netIjarah rental receivablesAdvance to employeesAccrued mark-up / return on investmentsPrepaymentsCurrent portion of net investment in finance leaseCurrent portion of long-term investmentsTaxation - netTotal current assets
Non-current assetsNet investment in finance leaseLong-term investmentsLong-term depositsInvestment propertyProperty, plant and equipmentIntangible assetsTotal non-current assetsTotal assets
LIABILITIES
Current liabilitiesTrade and other payablesAccrued mark-upCertificates of investmentShort term borrowingsCurrent portion of long-term loanCurrent portion of advance rental against Ijarah leasingCurrent portion of long-term depositsTotal current liabilities
Non-current liabilitiesLong-term depositsLong-term loanAdvance rental against Ijarah leasingDeferred taxation - netTotal non-current liabilitiesTotal liabilitiesNET ASSETS
Financed by:Share capitalReserves
Surplus on revaluation of available for sale investments
Surplus on revaluation of property, plant and equipment - net of tax
Contingencies and commitments
The annexed notes 1 to 44 form an integral part of these financial statements.
36
AS AT JUNE 30, 2017
2016Note 2017
Rupees
567
8
91110
91112131415
16171819202221
21202223
2425
6
26
27
63,565,215 39,299,748
3,150,904 679,544 264,244
1,532,755 2,467,086
493,818,998 5,001,865 7,475,847
617,256,206
1,315,937,678 22,165,398
300,460 138,996,000
54,951,220 1,654,375
1,534,005,131 2,151,261,337
24,186,557 12,435,449
404,130,173 189,523,769
16,666,668 5,864,522
67,054,287 719,861,425
545,858,457 20,833,331
8,736,588 180,014,446 755,442,822
1,475,304,247 675,957,090
253,698,000 329,676,712 583,374,712
3,352,882 586,727,594
89,229,496 675,957,090
44,296,138 16,259,209
1,795,739 904,009 196,006
1,475,668 2,819,664
499,111,879 -
7,787,572 574,645,884
1,039,542,601 27,199,297
300,460 -
207,896,308 1,590,019
1,276,528,685 1,851,174,569
16,704,576 8,410,233
264,835,006 187,854,564
- 8,136,396
79,415,142 565,355,917
482,845,368 -
14,601,119 159,776,708 657,223,195
1,222,579,112 628,595,457
253,698,000 293,197,975 546,895,975
2,343,445 549,239,420
79,356,037 628,595,457
Chief Executive Officer Chief Financial OfficerDirector
153,030,380
5,522,176 13,658,855 19,181,031
172,211,411
76,481,000 30,121,776
107,168 106,709,944
65,501,467
- 65,501,467
18,425,258 47,076,209
1.86
FOR THE YEAR ENDED JUNE 30, 2017
37
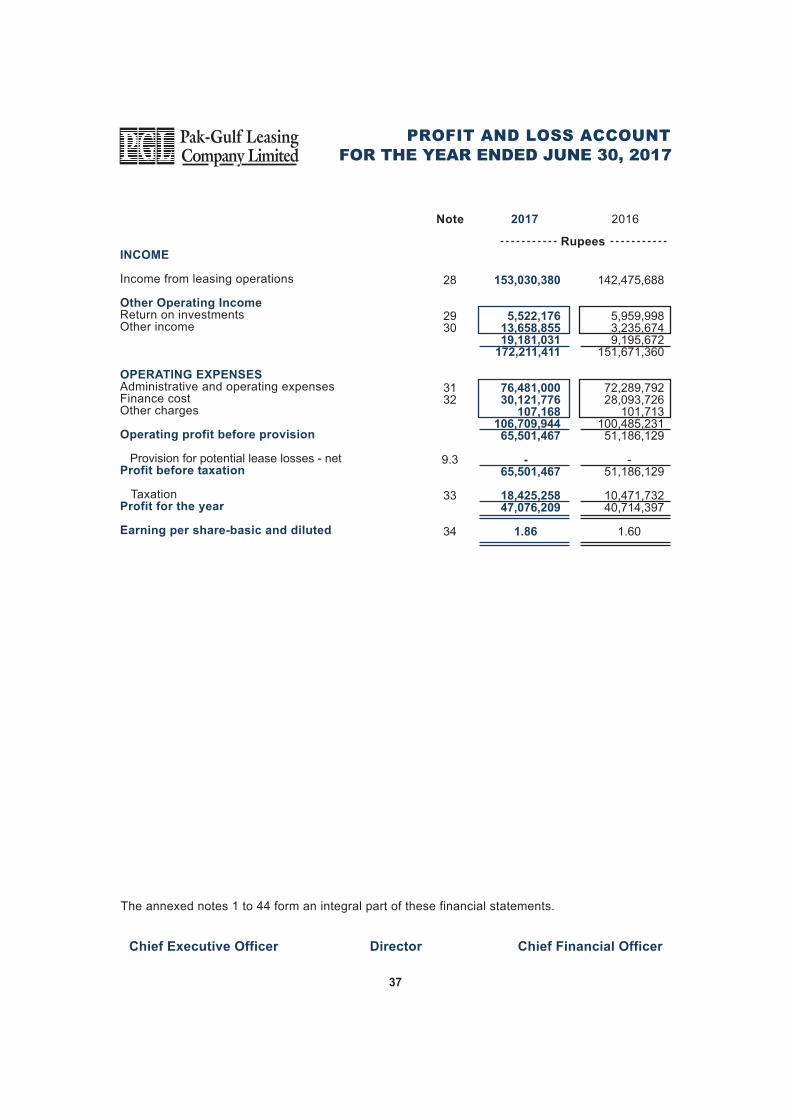
INCOME
Income from leasing operations
Other Operating IncomeReturn on investmentsOther income
OPERATING EXPENSESAdministrative and operating expensesFinance costOther charges
Operating profit before provision
Provision for potential lease losses - netProfit before taxation
TaxationProfit for the year
Earning per share-basic and diluted
28
2930
3132
9.3
33
34
2016Note 2017
Rupees
The annexed notes 1 to 44 form an integral part of these financial statements.
142,475,688
5,959,998 3,235,674 9,195,672
151,671,360
72,289,792 28,093,726
101,713 100,485,231
51,186,129
- 51,186,129
10,471,732 40,714,397
1.60
Chief Executive Officer Chief Financial OfficerDirector
Chief Executive Officer Chief Financial OfficerDirector
FOR THE YEAR ENDED JUNE 30, 2017
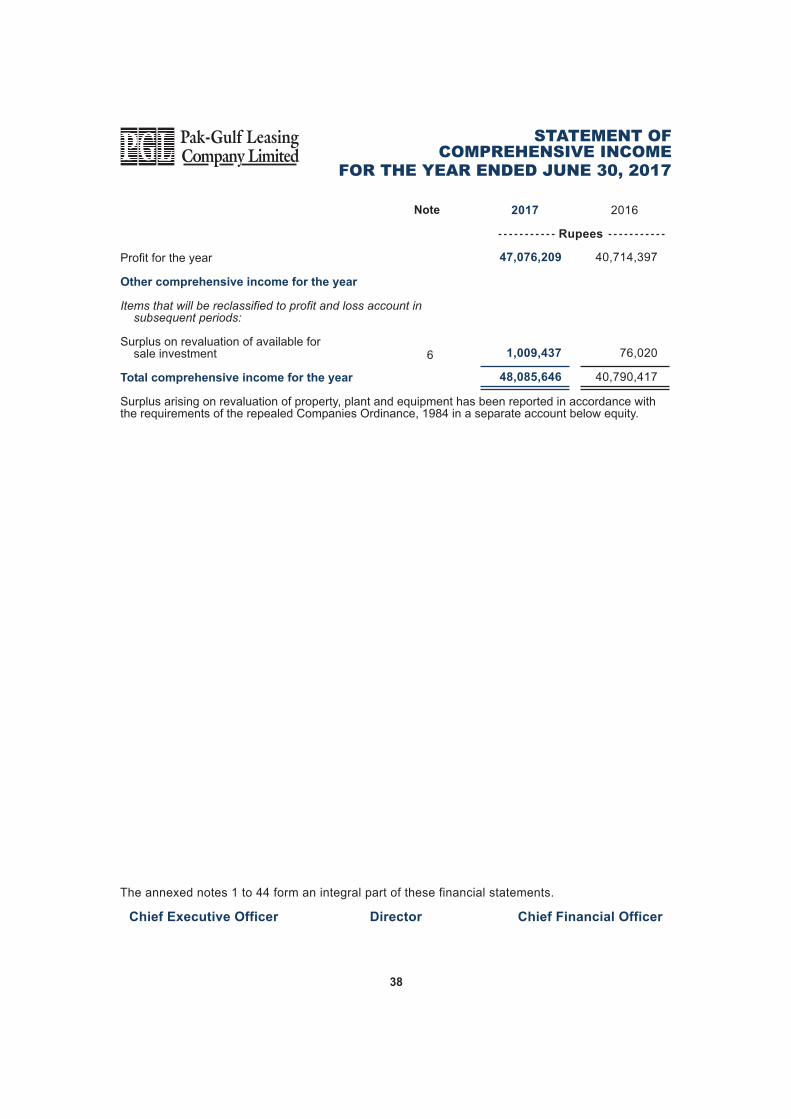
STATEMENT OFCOMPREHENSIVE INCOME
Profit for the year
Other comprehensive income for the year
Items that will be reclassified to profit and loss account in subsequent periods:
Surplus on revaluation of available for sale investment
Total comprehensive income for the year
Surplus arising on revaluation of property, plant and equipment has been reported in accordance withthe requirements of the repealed Companies Ordinance, 1984 in a separate account below equity.
38
2016Note 2017
Rupees
40,714,397
76,020
40,790,417
47,076,209
1,009,437
48,085,646
6
The annexed notes 1 to 44 form an integral part of these financial statements.
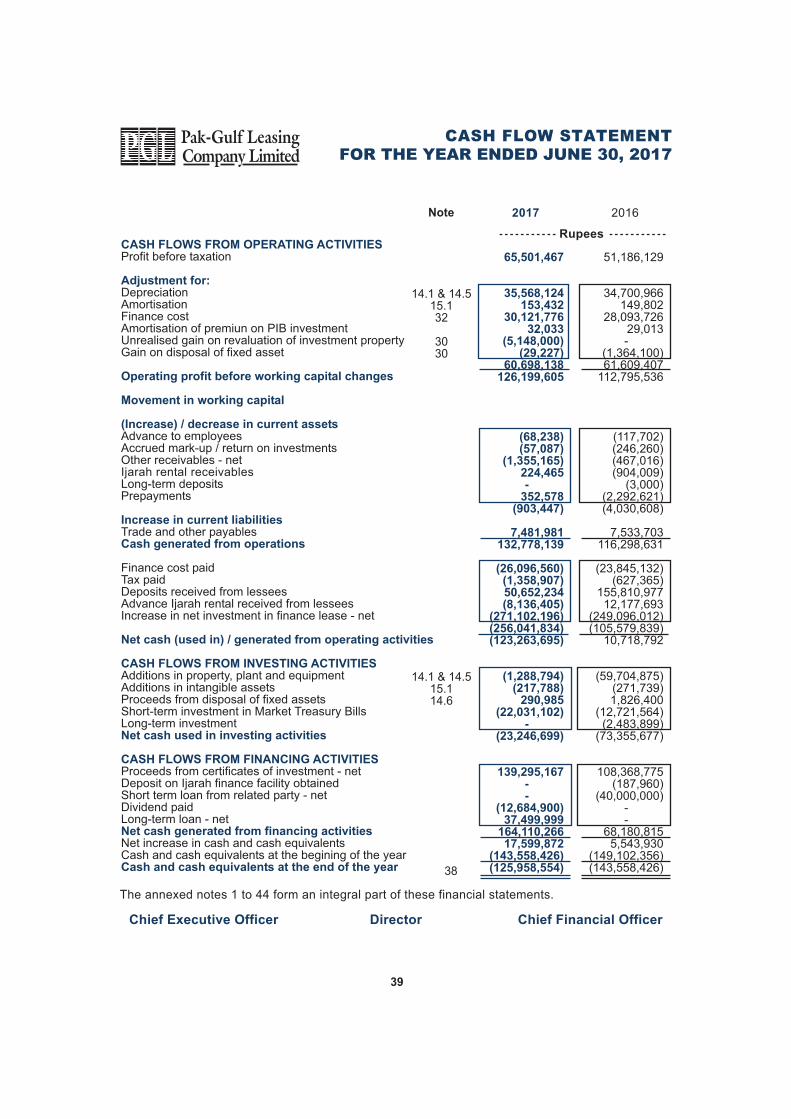
CASH FLOWS FROM OPERATING ACTIVITIESProfit before taxation
Adjustment for:DepreciationAmortisationFinance costAmortisation of premiun on PIB investmentUnrealised gain on revaluation of investment propertyGain on disposal of fixed asset Operating profit before working capital changes
Movement in working capital
(Increase) / decrease in current assetsAdvance to employeesAccrued mark-up / return on investmentsOther receivables - netIjarah rental receivablesLong-term depositsPrepayments
Increase in current liabilitiesTrade and other payablesCash generated from operations
Finance cost paidTax paidDeposits received from lesseesAdvance Ijarah rental received from lesseesIncrease in net investment in finance lease - net
Net cash (used in) / generated from operating activities
CASH FLOWS FROM INVESTING ACTIVITIESAdditions in property, plant and equipmentAdditions in intangible assetsProceeds from disposal of fixed assetsShort-term investment in Market Treasury BillsLong-term investmentNet cash used in investing activities
CASH FLOWS FROM FINANCING ACTIVITIESProceeds from certificates of investment - netDeposit on Ijarah finance facility obtainedShort term loan from related party - netDividend paidLong-term loan - netNet cash generated from financing activitiesNet increase in cash and cash equivalentsCash and cash equivalents at the begining of the yearCash and cash equivalents at the end of the year
39
FOR THE YEAR ENDED JUNE 30, 2017
2016Note 2017
Rupees
65,501,467
35,568,124 153,432
30,121,776 32,033
(5,148,000) (29,227)
60,698,138 126,199,605
(68,238) (57,087)
(1,355,165) 224,465 -
352,578 (903,447)
7,481,981 132,778,139
(26,096,560) (1,358,907) 50,652,234 (8,136,405)
(271,102,196) (256,041,834) (123,263,695)
(1,288,794) (217,788)
290,985 (22,031,102)
- (23,246,699)
139,295,167 - -
(12,684,900) 37,499,999
164,110,266 17,599,872
(143,558,426) (125,958,554)
51,186,129
34,700,966 149,802
28,093,726 29,013 -
(1,364,100) 61,609,407
112,795,536
(117,702) (246,260) (467,016) (904,009)
(3,000) (2,292,621) (4,030,608)
7,533,703 116,298,631
(23,845,132) (627,365)
155,810,977 12,177,693
(249,096,012) (105,579,839)
10,718,792
(59,704,875) (271,739) 1,826,400
(12,721,564) (2,483,899)
(73,355,677)
108,368,775 (187,960)
(40,000,000) - -
68,180,815 5,543,930
(149,102,356) (143,558,426)
The annexed notes 1 to 44 form an integral part of these financial statements.
38
14.1 & 14.515.132
3030
14.1 & 14.515.114.6
Chief Executive Officer Chief Financial OfficerDirector

Balance as at July 01, 2015
Total comprehensive income for the year ended June 30, 2016
Profit for the year
Other comprehensive income
Surplus on revaluation of available for sale investments
Transfer from surplus on revaluation of property, plant and equipment to unappropriated profit - net of deferred tax
Transfer to statutory reserve(note 25.1)
Balance as at June 30, 2016
Final dividend for the year ended June 30, 2016 @ Rs.0.5 per share
Total comprehensive income for the year ended June 30, 2017 Profit for the year
Other comprehensive income Surplus on revaluation of available for sale investments
Transfer from surplus on revaluation of property, plant and equipment to unappropriated profit - net of deferred tax
Transfer to statutory reserve(note 25.1)
Balance as at June 30, 2017
40
Rupees
249,535,302
40,714,397
- 40,714,397
2,948,276
-
293,197,975
(12,684,900)
47,076,209
-
47,076,209
2,087,428
-
329,676,712
505,500,727
40,714,397
76,02040,790,417
2,948,276
-
549,239,420
(12,684,900)
47,076,209
1,009,437
48,085,646
2,087,428
-
586,727,594
253,698,000
-
--
-
-
253,698,000
-
-
-
-
-
-
253,698,000
Surplus on
revaluation
of available
for sale
investments
Sharecapital
Sub TotalStatutoryreserve
Capital
Reserve forissue of
bonus shares
Unappropriatedprofit
Revenue
Reserves
Totalequity
FOR THE YEAR ENDED JUNE 30, 2017
4,402,000
-
--
-
-
4,402,000
-
-
-
-
-
-
4,402,000
183,530,210
40,714,397
- 40,714,397
2,948,276
(8,142,880)
219,050,003
(12,684,900)
47,076,209
-
47,076,209
2,087,428
(9,415,242)
246,113,498
The annexed notes 1 to 44 form an integral part of these financial statements.
2,267,425
-
76,02076,020
-
-
2,343,445
-
-
1,009,437
1,009,437
-
-
3,352,882
61,603,092
-
--
-
8,142,880
69,745,972
-
-
-
-
-
9,415,242
79,161,214
Chief Executive Officer Chief Financial OfficerDirector

1. STATUS AND NATURE OF BUSINESS
1.1 Pak-Gulf Leasing Company Limited ("the Company") was incorporated in Pakistan on December27, 1994 as a public limited company under the repealed Companies Ordinance, 1984 andcommenced its operations on September 16, 1996. The Company is principally engaged in thebusiness of leasing and is listed on Pakistan Stock Exchange Limited. The registered office ofthe Company is located at UNIBRO House, Ground and Mezzanine Floor, Plot No. 114, 9th EastStreet, Phase-1, Defence Housing Authority, Karachi.
1.2 Regulation 4 of Non-Banking Finance Companies and Notified Entities Regulations, 2008 videSRO 1002(I)/2015 dated October 15, 2015, requires an existing deposit taking leasing companyto maintain, at all times, minimum equity of Rs. 500 million by November 25, 2016. The equityof the Company as at June 30, 2017 is Rs. 581.72 million which is Rs. 81.72 million in excessof the minimum equity requirement.
1.3 JCR-VIS Credit Rating Company Limited (JCR-VIS) has re-affirmed A- and A-2 ratings to theCompany for medium to long term and short term, respectively on December 30, 2016.
2. BASIS OF PREPARATION
2.1 Statement of compliance
These financial statements have been prepared in accordance with the approved accountingstandards as applicable in Pakistan. Approved accounting standards comprise of such InternationalFinancial Reporting Standards (IFRSs) issued by International Accounting Standards Board(IASB) as are notified under the repealed Companies Ordinance 1984, Islamic Financial AccountingStandard - 2 Ijarah (IFAS-2) issued by Institute of Chartered Accountants of Pakistan (ICAP), theNon-Banking Finance Companies (Establishment and Regulations) Rules, 2003 (the NBFCRules), the Non-Banking Finance Companies and Notified Entities Regulations, 2008 (the NBFCRegulations), provisions of and directives issued under the repealed Companies Ordinance, 1984and the directives issued by the Securities and Exchange Commission of Pakistan (SECP). Incase the requirements differ, the provisions of and directives issued under the NBFC Rules, theNBFC Regulations, the repealed Companies Ordinance, 1984 and the directives issued by SECPshall prevail.
The financial statements of the Company have been prepared in accordance with the provisionsof the repealed Companies Ordinance, 1984 as per the directive of Securities and ExchangeCommission of Pakistan issued vide Circular No. 17 dated July 20, 2017.
The Securities and Exchange Commission of Pakistan (SECP) vide its Circular No. 29 datedSeptember 5, 2016, had prescribed certain additional disclosures to facilitate shariah screeningof listed companies for Islamic Equity Index and encouraged all listed companies to voluntarilydisclose the information. Accordingly, the Company has opted to present these disclosures inthese financial statements.
2.2 Basis of measurement
These financial statements have been prepared under the historical cost convention, except thatinvestment property is stated at fair value and certain investments which have been classifiedas 'available for sale' are marked to market and carried at fair value.
These financial statements have been prepared following accrual basis of accounting except forcash flow information.
2.3 Functional and presentation currency
These financial statements are presented in Pak Rupees which is the functional and presentationcurrency of the Company. All financial information presented in Pakistani Rupees has beenrounded off to the nearest rupee unless otherwise stated.
FOR THE YEAR ENDED JUNE 30, 2017
41
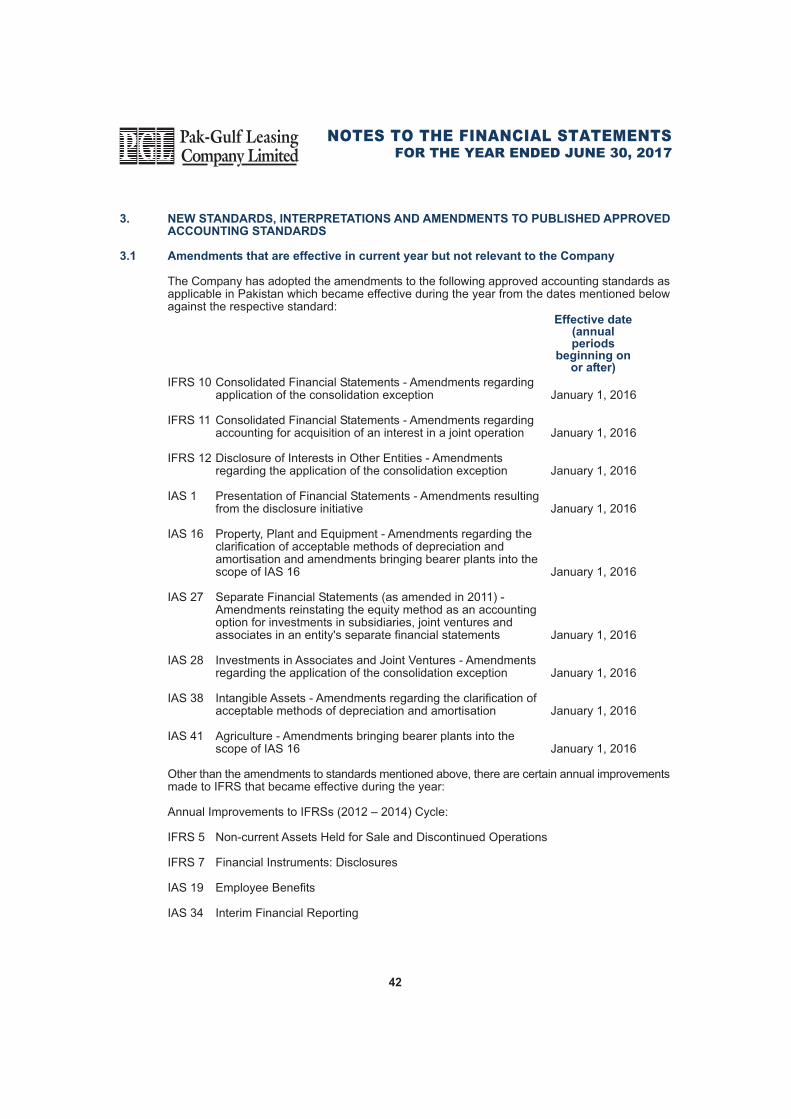
3. NEW STANDARDS, INTERPRETATIONS AND AMENDMENTS TO PUBLISHED APPROVEDACCOUNTING STANDARDS
3.1 Amendments that are effective in current year but not relevant to the Company
The Company has adopted the amendments to the following approved accounting standards asapplicable in Pakistan which became effective during the year from the dates mentioned belowagainst the respective standard:
IFRS 10 Consolidated Financial Statements - Amendments regarding application of the consolidation exception January 1, 2016
IFRS 11 Consolidated Financial Statements - Amendments regardingaccounting for acquisition of an interest in a joint operation January 1, 2016
IFRS 12 Disclosure of Interests in Other Entities - Amendmentsregarding the application of the consolidation exception January 1, 2016
IAS 1 Presentation of Financial Statements - Amendments resultingfrom the disclosure initiative January 1, 2016
IAS 16 Property, Plant and Equipment - Amendments regarding theclarification of acceptable methods of depreciation andamortisation and amendments bringing bearer plants into thescope of IAS 16 January 1, 2016
IAS 27 Separate Financial Statements (as amended in 2011) -Amendments reinstating the equity method as an accountingoption for investments in subsidiaries, joint ventures andassociates in an entity's separate financial statements January 1, 2016
IAS 28 Investments in Associates and Joint Ventures - Amendmentsregarding the application of the consolidation exception January 1, 2016
IAS 38 Intangible Assets - Amendments regarding the clarification ofacceptable methods of depreciation and amortisation January 1, 2016
IAS 41 Agriculture - Amendments bringing bearer plants into thescope of IAS 16 January 1, 2016
Other than the amendments to standards mentioned above, there are certain annual improvementsmade to IFRS that became effective during the year:
Annual Improvements to IFRSs (2012 � 2014) Cycle:
IFRS 5 Non-current Assets Held for Sale and Discontinued Operations
IFRS 7 Financial Instruments: Disclosures
IAS 19 Employee Benefits
IAS 34 Interim Financial Reporting
FOR THE YEAR ENDED JUNE 30, 2017
42
Effective date(annualperiods
beginning onor after)
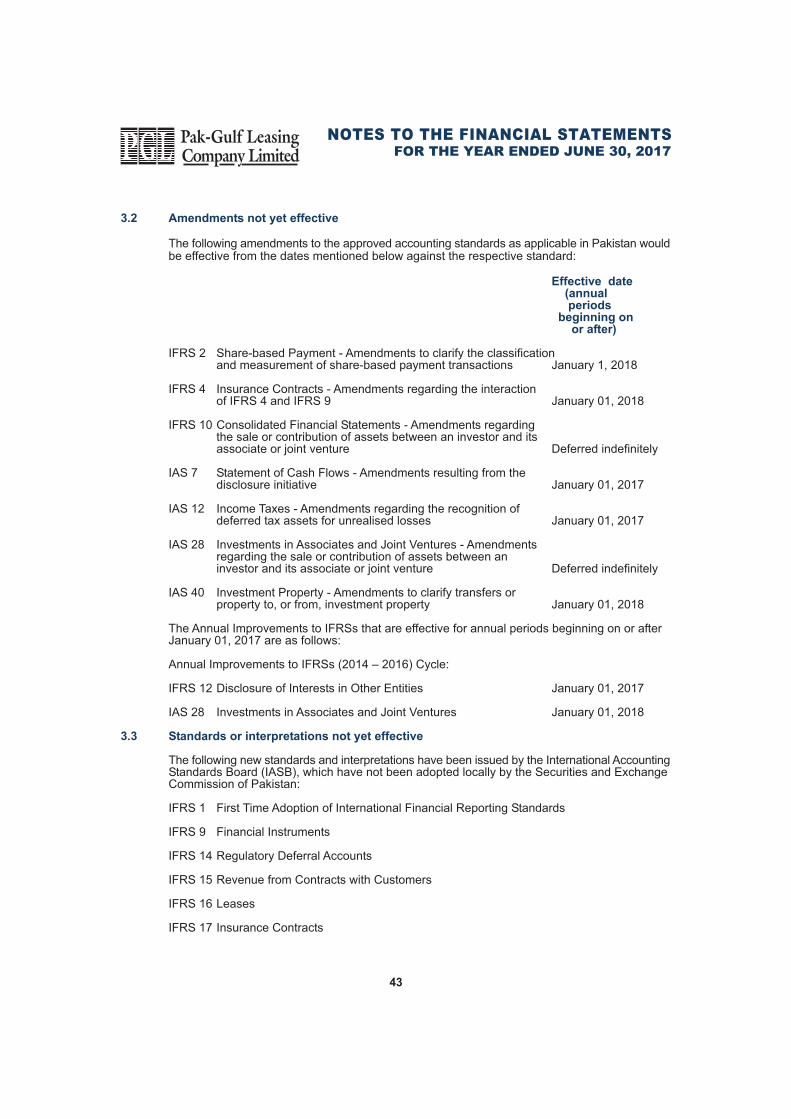
3.2 Amendments not yet effective
The following amendments to the approved accounting standards as applicable in Pakistan wouldbe effective from the dates mentioned below against the respective standard:
Effective date (annual
periods beginning on
or after)
IFRS 2 Share-based Payment - Amendments to clarify the classificationand measurement of share-based payment transactions January 1, 2018
IFRS 4 Insurance Contracts - Amendments regarding the interactionof IFRS 4 and IFRS 9 January 01, 2018
IFRS 10 Consolidated Financial Statements - Amendments regardingthe sale or contribution of assets between an investor and itsassociate or joint venture Deferred indefinitely
IAS 7 Statement of Cash Flows - Amendments resulting from thedisclosure initiative January 01, 2017
IAS 12 Income Taxes - Amendments regarding the recognition ofdeferred tax assets for unrealised losses January 01, 2017
IAS 28 Investments in Associates and Joint Ventures - Amendmentsregarding the sale or contribution of assets between aninvestor and its associate or joint venture Deferred indefinitely
IAS 40 Investment Property - Amendments to clarify transfers orproperty to, or from, investment property January 01, 2018
The Annual Improvements to IFRSs that are effective for annual periods beginning on or afterJanuary 01, 2017 are as follows:
Annual Improvements to IFRSs (2014 � 2016) Cycle:
IFRS 12 Disclosure of Interests in Other Entities January 01, 2017
IAS 28 Investments in Associates and Joint Ventures January 01, 2018
3.3 Standards or interpretations not yet effective
The following new standards and interpretations have been issued by the International AccountingStandards Board (IASB), which have not been adopted locally by the Securities and ExchangeCommission of Pakistan:
IFRS 1 First Time Adoption of International Financial Reporting Standards
IFRS 9 Financial Instruments
IFRS 14 Regulatory Deferral Accounts
IFRS 15 Revenue from Contracts with Customers
IFRS 16 Leases
IFRS 17 Insurance Contracts
FOR THE YEAR ENDED JUNE 30, 2017
43
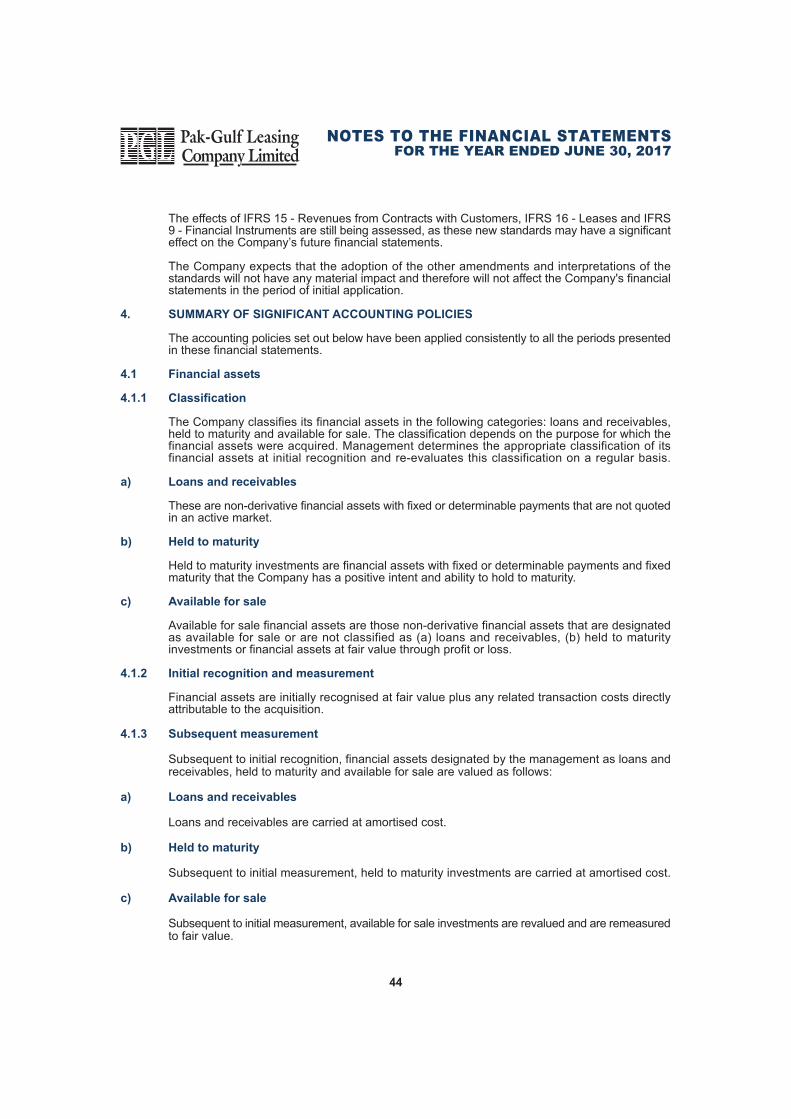
The effects of IFRS 15 - Revenues from Contracts with Customers, IFRS 16 - Leases and IFRS9 - Financial Instruments are still being assessed, as these new standards may have a significanteffect on the Company�s future financial statements.
The Company expects that the adoption of the other amendments and interpretations of thestandards will not have any material impact and therefore will not affect the Company's financialstatements in the period of initial application.
4. SUMMARY OF SIGNIFICANT ACCOUNTING POLICIES
The accounting policies set out below have been applied consistently to all the periods presentedin these financial statements.
4.1 Financial assets
4.1.1 Classification
The Company classifies its financial assets in the following categories: loans and receivables,held to maturity and available for sale. The classification depends on the purpose for which thefinancial assets were acquired. Management determines the appropriate classification of itsfinancial assets at initial recognition and re-evaluates this classification on a regular basis.
a) Loans and receivables
These are non-derivative financial assets with fixed or determinable payments that are not quotedin an active market.
b) Held to maturity
Held to maturity investments are financial assets with fixed or determinable payments and fixedmaturity that the Company has a positive intent and ability to hold to maturity.
c) Available for sale
Available for sale financial assets are those non-derivative financial assets that are designatedas available for sale or are not classified as (a) loans and receivables, (b) held to maturityinvestments or financial assets at fair value through profit or loss.
4.1.2 Initial recognition and measurement
Financial assets are initially recognised at fair value plus any related transaction costs directlyattributable to the acquisition.
4.1.3 Subsequent measurement
Subsequent to initial recognition, financial assets designated by the management as loans andreceivables, held to maturity and available for sale are valued as follows:
a) Loans and receivables
Loans and receivables are carried at amortised cost.
b) Held to maturity
Subsequent to initial measurement, held to maturity investments are carried at amortised cost.
c) Available for sale
Subsequent to initial measurement, available for sale investments are revalued and are remeasuredto fair value.
44
FOR THE YEAR ENDED JUNE 30, 2017
to equity through statement of comprehensive income until these are derecognised or impairedat which time, the cumulative surplus or deficit previously recognised in equity is transferred tothe profit and loss account.
4.1.4 Impairment
The carrying value of the Company's assets are reviewed at each balance sheet date to determinewhether there is any indication of impairment. If such an indication exists, the recoverable amountof such asset is estimated. An impairment loss is recognised whenever the carrying amount ofan asset exceeds its recoverable amount. Impairment losses are recognised in the profit andloss account.
4.1.5 Derecognition
Financial assets are derecognised when the rights to receive cash flows from the financial assetshave expired or have been transferred and the Company has transferred substantially all risksand rewards of ownership attached to such financial assets. Gains and losses on disposal aredetermined by comparing the proceeds with the carrying amount and are recognised in the profitand loss account.
4.2 Financial liabilities
All financial liabilities are recognised at the time when the Company becomes a party to thecontractual provisions of the instrument. These are initially recognised at fair value and subsequentlystated at amortised cost.
A financial liability is derecognised when the obligation under the liability is discharged or cancelledor expired. Gain or loss on derecognition is recognised in profit and loss account.
4.3 Offsetting of financial assets and liabilities
Financial assets and financial liabilities are offset and the net amount is reported in the balancesheet when there is a legally enforceable right to set off the recognised amounts and there isan intention to settle on a net basis, or realise the assets and settle the liabilities simultaneously.
4.4 Cash and bank balances
Cash in hand and at banks are carried at nominal amount.
4.5 Cash and cash equivalents
Cash and cash equivalents comprise of cash balances and bank deposit, and other short-termhighly liquid investments with original maturities of three months or less, short-term runningfinance facilities that are repayable on demand and form an integral part of the Company�s cashmanagement are included as a component of cash and cash equivalents for the purpose of thecash flow statement.
4.6 Net investment in finance lease
Leases where the Company transfers substantially all the risks and rewards incidental to ownershipof the leased assets to the lessees, are classified as finance leases.
The leased asset is derecognised and the present value of the lease receivable (net of initialdirect costs for negotiating and arranging the lease) is recognised on the balance sheet. Thedifference between the gross lease receivables and the present value of the lease receivablesis recognised as unearned finance income.
A receivable is recognised at an amount equal to the present value of the minimum leasepayments under the lease agreements, including guaranteed residual value, if any.
45
FOR THE YEAR ENDED JUNE 30, 2017

Each lease payment received is applied against the gross investment in the finance leasereceivable to reduce both the principal and the unearned finance income. The finance incomeis recognised in the profit and loss account on a basis that reflects a constant periodic rate ofreturn on the net investment in the finance lease receivables.
Initial direct costs incurred by the Company in negotiating and arranging finance leases areadded to finance lease receivables and are recognised as an expense in the profit and lossaccount over the lease term on the same basis as the finance lease income.
4.7 Provision for potential lease losses and provision for terminated leases
Calculating the provision for net investment in finance lease losses and provision for terminatedleases is subject to numerous judgments and estimates. In evaluating the adequacy of provision,management considers various factors, including the requirements of the NBFC Regulationsissued by Securities and Exchange Commission of Pakistan, the nature and characteristics ofthe obligor, current economic conditions, credit concentrations, historical loss experience anddelinquencies. Lease receivables are charged off, when in the opinion of management, thelikelihood of any future collection is believed to be minimal.
4.8 Property, plant and equipment
These are stated at cost less accumulated depreciation and impairment losses, if any, exceptfor leasehold premises which was stated at revalued amount less accumulated depreciation andimpairment losses.
Subsequent costs are included in the assets' carrying amounts or recognised as a separateasset, as appropriate, only when it is probable that future benefits associated with the item willflow to the Company and the cost of the item can be measured reliably. All other subsequentcosts including repairs and maintenance are charged to the profit and loss account as and whenincurred.
Depreciation is charged using the straight line method, whereby the depreciable amount of anasset is written off over its estimated useful life at the rates specified in note 14.1 after takinginto account residual value, if any. The residual values, useful lives and depreciation methodsare reviewed and adjusted, if appropriate, at each balance sheet date.
Depreciation on additions is charged from the month the assets are put to use while no depreciationis charged in the month in which the assets are disposed off.
Any surplus arising on revaluation of property, plant and equipment is credited to the surplus onrevaluation account. Revaluation is carried out with sufficient regularity to ensure that the carryingamounts of assets do not differ materially from the fair value of such assets. To the extent of theincremental depreciation charged on the revalued assets, the surplus on revaluation of operatingfixed assets (net of deferred taxation) is transferred directly to unappropriated profit.
Gains or losses on sale of assets are charged to the profit and loss account in the period in whichthey arise, except that the related surplus on revaluation of assets (net of deferred taxation) istransferred directly to unappropriated profit.
Ijarah assets
Ijarah assets are stated at cost less accumulated depreciation less accumulated impairment ifany. Rental from Ijarah arrangements are recognised in profit and loss account on accrual basisas and when rentals become due. Costs including depreciation, incurred in earning the Ijarahincome are recognised as expense. Initial direct costs incurred specifically to earn revenues fromIjarah are recognised as an expense in the period in which they are incurred. Assets leased outare depreciated over the period of ijarah term on a straight line basis and at the end of the Ijarahterm the leased assets are transferred to the lessee.
46
FOR THE YEAR ENDED JUNE 30, 2017
4.9 Intangible assets
Intangible assets are stated at cost less accumulated amortisation and accumulated impairmentlosses, if any. These are amortised using the straight line method reflecting the pattern in whichthe economic benefits of the asset are consumed by the Company as mentioned in note 15.
4.10 Investment property
Property, comprising land or a building or part thereof, held to earn rentals or for capital appreciationor both are classified as investment property. These are not held for use in the production orsupply of goods or services or for administrative purposes. The Company's business model i.e.the Company�s intentions regarding the use of a property is the primary criterion for classificationas an investment property.
Investment property is initially measured at cost (including the transaction costs). However whenan owner occupied property carried at fair value becomes an investment property because itsuse has changed, the transfer to the investment property is at fair value on the date of transferand any balance of surplus on the revaluation of the related assets, on the date of such a transfercontinues to be maintained in the surplus account on revaluation of property, plant and equipments.Upon disposal, any surplus previously recorded in the revaluation surplus account is directlytransferred to retained earnings/accumulated losses and the transfer is not made through theprofit and loss account. However any gain or loss on disposal of investment property (calculatedas the difference between the net proceeds from disposal and the carrying amount of the item)is recognised in the profit and loss account.
The transfer to investment property is made when, and only when, there is a change in use,evidenced by the end of owner occupation. In case of a dual purpose properties, the same isclassified as investment property, only if the portion could be sold or leased out separately underfinance lease.
Subsequent to initial recognition, the Company measures the investment property at fair valueat each reporting date and any subsequent changes in fair value is recognised in the profit andloss account (i.e. in cases where the owner occupied property carried at fair value becomes aninvestment property, the fair value gain to be recognised in the profit and loss account would bethe difference between the fair value at the time of initial classification as investment propertyand fair value at the time of subsequent remeasurement). The revaluations of investment propertiesare carried out by independent professionally qualified valuers on the basis of active marketprice.
4.11 Other receivables
Other receivables are carried at original invoice amount less an estimate made for doubtfulreceivables based on a review of all outstanding amounts at the year end. Balances consideredbad and irrecoverable are written off when considered irrecoverable.
4.12 Provisions
Provisions are recognised when the company has a legal or constructive obligation as a resultof past events and it is probable that an outflow of resources will be required to settle the obligationand a reliable estimate of the amount can be made. Provisions are reviewed at each balancesheet date and are adjusted to reflect the current best estimate.
4.13 Taxation
4.13.1 Current
Provision for current taxation is based on taxable income at the current rates of taxation aftertaking into account tax credits and rebates available, if any. The charge for current taxation alsoincludes adjustments where necessary, relating to prior years which arise from assessmentsframed / finalised during the year.
47
FOR THE YEAR ENDED JUNE 30, 2017
Taxable income for the purpose of computing current taxation is determined under the provisionsof the tax laws, whereby, lease rentals received and receivable are deemed to be the incomeof the Company.
Provision for taxation is thus based on taxable income determined in accordance with therequirements of such laws, and is made at the current rates of taxation in the Income TaxOrdinance, 2001.
4.13.2 Deferred
Deferred tax is recognised, using the balance sheet liability method, on all temporary differencesarising between the tax base of assets and liabilities and their carrying amount. Deferred tax iscalculated using the rates that are expected to apply to the period when the differences reversebased on the tax rates that have been enacted at the balance sheet date.
Deferred tax liabilities are recognised for all taxable temporary differences, whereas deferred taxassets are recognised for all deductible temporary differences. A deferred tax asset is recognisedonly to the extent that it is probable that future taxable profits or taxable temporary differenceswill be available against which the asset can be utilised. Deferred tax assets are reduced to theextent that it is no longer probable that the related tax benefit will be realised. In addition, theCompany also recognises deferred tax liability on the surplus on revaluation of tangible fixedassets which is adjusted against the related surplus in accordance with the requirements ofInternational Accounting Standard 12 (IAS 12), 'Income Taxes'.
4.14 Trade and other payables
Liabilities for trade and other payables are recognised initially at fair value and subsequentlycarried at amortised cost.
4.15 Borrowings
Loans and borrowings are recorded at the proceeds received. Finance cost are accounted foron accrual basis and are shown as interest and mark-up accrued to the extent of the amountremaining unpaid.
Short term borrowings are classified as current liabilities unless the Company has unconditionalright to defer settlement of the liability for at least twelve months after the balance sheet date.
4.16 Staff retirement benefits
Defined contribution plan
The Company operates an approved defined contributory provident fund for all its permanentemployees. Monthly contributions are made to the fund equally by the Company and the employeesin accordance with the rules of the Fund. The contributions are recognised as employee benefitexpense when they become due.
Staff retirement benefits are payable to employees on completion of the prescribed qualifyingperiod of service under the scheme.
4.17 Employees' compensated absences
The Company accounts for the liability in respect of employees' compensated absences in theyear in which these are earned. Provision to cover the obligations under the scheme is madebased on the current leave entitlements of the employees and by using the current salary levelof the employees.
48
FOR THE YEAR ENDED JUNE 30, 2017
49
FOR THE YEAR ENDED JUNE 30, 2017
4.18 Currency translation
Foreign currency transactions
Items included in financial statements are measured using the currency of the primary economicenvironment in which the Company operates.
Transactions in foreign currencies are translated to Pakistani Rupees at the foreign exchangerates prevailing on the date of the transaction. Monetary assets and liabilities in foreign currenciesare translated into Pakistani Rupees at the rates of exchange approximating those prevailing onthe balance sheet date. Exchange differences are taken to the profit and loss account.
4.19 Revenue recognition
Finance lease income
The Company follows the finance lease method in accounting for the recognition of lease income.Under this method, the unearned lease income i.e. the excess of gross lease rentals and theestimated residual value over the cost of the leased assets is deferred and taken to income overthe term of the lease contract, so as to produce a systematic return on the net investment infinance lease. Unrealised lease income is held in suspense account, where necessary, inaccordance with the requirements of the NBFC Regulations.
Documentation charges, late payment charges and processing fee are taken to income whenrealised.
Rental income from Ijarah
In accordance with the requirements of IFAS 2 - Ijarah, rental from Ijarah arrangements arerecognised in profit and loss account on accrual basis as and when rentals become due.
Return on investments
Mark-up income on debt securities is recognised on time proportion basis using the effectiveyield on instruments and return on equity securities is accounted for on accrual basis.
Dividend income
Dividend income from investment is recognised when the Company`s right to receive dividendis established.
Interest income
Interest income on bank deposits is recognised on time proportion basis using the effectiveinterest method.
Gain or losses on sale of investments
Capital gain or losses arising on sale of investments are taken to income in the period in whichthey arise.
4.20 Earnings per share
The Company presents basic and diluted earnings per share (EPS) for its shareholders. BasicEPS is calculated by dividing the profit or loss attributable to ordinary shareholders of the Companyby the weighted average number of ordinary shares outstanding during the year. Diluted EPSis determined by adjusting the profit or loss attributable to ordinary shareholders and the weightedaverage number of ordinary shares outstanding for the effect of all dilutive potential ordinaryshares, if any.
50
FOR THE YEAR ENDED JUNE 30, 2017
4.21 Dividend distribution and transfer between reserves
Dividend distribution (including stock dividend) to the Company's shareholders and transferbetween reserves, except appropriations which are required under law, are recognised in thefinancial statements in the period in which such dividends are declared or such transfers betweenreserves are made.
4.22 Segment reporting
An operating segment is a component of the Company that engages in business activities fromwhich it may earn revenues and incur expenses including revenues and expenses that relateto transactions with any of the Company�s other components. All operating segments� resultsare reviewed regularly by the Company�s chief operating decision maker to make decisionsabout resources to be allocated to the segment and assess its performance, and for whichdiscrete financial information is available.
The Company has two primary business segments, namely, leasing and Ijarah operations.
Financing, investment, revenue, expenses and income taxes are managed on an overall basisand are therefore, not allocated to any segment.
Assets, liabilities and capital expenditures that are directly attributable to segments have beenassigned to them. Those assets and liabilities, which cannot be allocated to a particular segmenton a reasonable basis, are reported as unallocated corporate assets and liabilities.
4.23 Critical accounting estimates and judgments
The preparation of financial statements in conformity with approved accounting standards requiresmanagement to make estimates and assumptions that affect the reported amounts of assetsand liabilities, income and expenses. It also requires management to exercise judgment inapplication of the Company's accounting policies. The estimates and associated assumptionsare based on historical experience and various other factors that are believed to be reasonableunder the circumstances, the results of which form the basis of making judgment about thecarrying value of assets and liabilities that are not readily apparent from other sources, actualresults may differ from those estimates. These estimates and assumptions are reviewed on anongoing basis. Revisions to accounting estimates are recognised in the period in which theestimate is revised if the revision affects only that period, or in the period of revision and futureperiods if the revision affects both current and future periods.
The areas where various assumptions and estimates are significant to the Company's financialstatements or where judgment was exercised in application of accounting policies are as follows:
i) Classification and valuation of investments (notes 4.1, 6 and 11).ii) Provision for current and deferred taxation (notes 4.13, 23 and 33).iii) Recognition and measurement of deferred tax assets and liabilities (note 4.13.2, 23
and 33).iv) Classification and provision of net investment in finance lease (notes 4.6, 4.7 and 9).v) Determination and measurement of useful life and residual value of property, plant and
equipment (note 4.8 and 14).vi) Determination and measurement of useful life and residual value of intangible assets
(note 4.9 and 15).vii) Measurement of lease hold premises carried at revalued amount. (note 4.8, 14.2 and 26).viii) Measurement of investment property carried at revalued amount. (note 4.10 and 13).
51
FOR THE YEAR ENDED JUNE 30, 2017
Cash in hand
Balance with banks: - in current accounts - in saving accounts
5.15.2
Note5. CASH AND BANK BALANCES
179
56,176,890
7,388,146
63,565,215
2017
Rupees
1,425
15,245,692 29,049,021 44,296,138
2016
5.1 This amount includes Rs. 15.475 million (2016: Rs. 3.22 million) which represents balance ofbank account(s) maintained with Islamic bank(s) by the Company. The balance in current accountsdoes not carry any mark-up or interest.
5.2 These carry mark-up rates ranging from 4% to 5.7% (2016: 4% to 5.7%) per annum.
SHORT TERM INVESTMENTS
Available for sale
Cost
54,300 units of National Investment (Unit) Trust (2016: 54,300)Revaluation surplus
As at July 01Surplus for the yearAs at June 30Held to maturity
Government Securities - Market Treasury Bills
6.
1,194,200
2,343,445
1,009,437
3,352,882
4,547,082
34,752,666
39,299,748
1,194,200
2,267,425 76,020
2,343,445 3,537,645
12,721,564 16,259,209
6.1
OTHER RECEIVABLES - NET
Lease receivable held under litigationInsurance premium and other receivable
Provision against lease receivable held under litigationMark-up held in suspense against lease receivable held under litigationProvision against insurance premium and other receivable
7.
28,581,952
4,328,741
32,910,693
(25,600,250)
(2,728,847)
(1,430,692)
3,150,904
28,581,952 2,973,576
31,555,528
(25,600,250)
(2,728,847)
(1,430,692) 1,795,739
7.17.2
7.3
7.4
6.1 Market Treasury Bills (MTB) carry interest rate ranging from 5.7% to 5.95% (2016: 5.95% to 6.35%per annum) and have maturity date ranging from July 20, 2017 to February 1, 2018. The marketvalue of investment in MTB as at June 30, 2017 amounted to Rs. 35.491 million (2016: Rs. 13.008million).
7.1 This includes net investment in finance lease terminated by the Company and where litigation hascommenced.
7.2 This includes insurance premium receivable from lessees for leased assets insured on their behalfby the Company. These amounts are recovered either during the lease period or on termination/ maturity of the lease contracts.
52
FOR THE YEAR ENDED JUNE 30, 2017
Balance as at July 01Charge for the yearBalance as at June 30
25,600,250 -
25,600,250
25,600,250
-
25,600,250
7.3 Movement of provision against lease
receivable held under litigation
Movement of provision against insurance
premium and other receivable
1,430,692 -
1,430,692
Balance as at July 01Charge for the yearBalance as at June 30
7.4
1,430,692
-
1,430,692
196,006Advance to employees
8. ADVANCE TO EMPLOYEES
264,2448.1
1,538,654,480 (499,111,879)
1,039,542,601
Net investment in finance leaseCurrent portion shown under current assets
9. NET INVESTMENT IN FINANCE LEASE
1,809,756,676
(493,818,998)
1,315,937,678
9.19.1
This amount represents advance given by the Company to its employees against their salaryin accordance with the Company's Human Resource policy.
8.1
Later than
five
years
204,945
250,000
454,945
(6,701)
-
(6,701)
448,244
-
448,244
Total
1,147,992,469
562,260,510
1,710,252,979
(170,604,417)
(116,033)
(170,720,450)
1,539,532,529
(878,049)
1,538,654,480
Not later than
one year
513,377,901
79,415,142
592,793,043
(92,687,082)
(116,033)
(92,803,115)
499,989,928
(878,049)
499,111,879
Later than
one year and
less than five
years
634,409,623
482,595,368
1,117,004,991
(77,910,634)
-
(77,910,634)
1,039,094,357
-
1,039,094,357
9.1 Net investment in finance lease
2016
Rupees
Minimum lease payments
Add: Residual value of leased
assets (note 9.2)
Gross investment in finance
lease
Unearned lease income
Mark-up held in suspense
Provision for potential lease
losses (note 9.3)
Net investment in finance lease
2017
Later than
five
years
35,142,837
107,282,305
142,425,142
(3,858,628)
-
(3,858,628)
138,566,514
-
138,566,514
Total
1,449,070,417
612,912,744
2,061,983,161
(251,025,900)
(322,536)
(251,348,436)
1,810,634,725
(878,049)
1,809,756,676
Not later than
one year
541,452,185
67,054,287
608,506,472
(113,486,889)
(322,536)
(113,809,425)
494,697,047
(878,049)
493,818,998
Later than
one year and
less than five
years
872,475,395
438,576,152
1,311,051,547
(133,680,383)
-
(133,680,383)
1,177,371,164
-
1,177,371,164
Note 2017
Rupees
2016

53
FOR THE YEAR ENDED JUNE 30, 2017
In certain leases, the Company has security, in addition to leased assets, in the form ofmortgages / corporate / personal guarantees of associated companies / directors.
9.2 These represent interest free security deposits received against lease contracts and arerefundable / adjustable at the expiry / termination of the respective leases. The amount isnet of security deposit held against matured leases amounting to Rs. 120.832 million (2016:Rs. 85.742 million).
878,049 10,755,329
(10,755,329) 878,049
Balance as at July 01Charge for the yearReversal for the yearBalance as at June 30
9.3 Provision for potential lease losses
878,049
14,743,140
(14,743,140)
878,049
Note 2017
Rupees
2016
9.4 The net investment in finance lease portfolio includes Rs. 0.88 million (2016: Rs. 0.88 million)which has been placed under non-performing status.
9.5 The Company has entered into various lease agreements for periods ranging from one to sevenyears (2016: one to seven years). Security deposits ranging from 2% to 63% (2016: 5% to 64.5%)are obtained at the time of entering into the lease arrangement. The rate of return implicit in theleases ranges from 8.08% to 21.62% (2016: 8.08% to 17.92%) per annum.
12. LONG-TERM DEPOSITS
300,460Long-term deposits 300,46012.1
As per the requirements of Regulations14(4)(i) of the NBFC Regulations, the Company is requiredto invest at least 15% of its outstanding funds raised through issue of Certificates of Investmentsin the Government Securities. As at June 30, 2017, the Company had 15.32% of its funds raisedthrough Certificates of Investments invested in Pakistan Investment Bonds (PIBs) and MarketTreasury Bills (Refer Note 6).
PIBs carry interest rates ranging from 9.25% to 11.50% per annum (2016: 9.25% to 11.50% perannum) and have maturity dates ranging from July 19, 2017 to March 26, 2020. The market valueof investment in PIBs as at June 30, 2017 amounted to Rs. 28.417 million (2016: Rs. 29.687million).
11.1
11.2
(5,001,865)
11. LONG-TERM INVESTMENT
27,199,297 -
27,199,297
Held to maturity
27,167,263
22,165,398
Government Securities Pakistan Investment Bonds Current portion shown under current assets
(1,670,633) (1,574,547)
10. TAXATION - NET
Balance as at July 01Advance tax paidCharge for the yearBalance as at June 30
8,734,754 627,365
7,787,572
7,787,572
1,358,908
7,475,847
33
54
FOR THE YEAR ENDED JUNE 30, 2017
13. INVESTMENT PROPERTY
-
133,848,000
5,148,000
138,996,000
Opening balanceTransferred from operating fixed assets - own useFair value adjustment
----
20162017Rupees
Note
This amount includes Rs. 0.188 million (2016: Rs. 0.188 million) given by the Company as securitydeposit to First Habib Modaraba under Ijarah arrangement to obtain the Ijarah asset. Thesedeposits do not carry any markup or interest.
12.1
The Company has rented out its office premises and decided to classify its owner occupiedproperty as investment property as of December 31, 2016 that will be carried at fair value modelin accordance with IAS 40 "Investment Property".
The carrying value of investment property is the fair value of the property as determined byapproved independent valuer M/s. Akbani and Javed Associates as on June 30, 2017 on thebasis of market value. Fair value was determined having regard to recent market transactionsfor similar properties in the same location and condition as the Company's investment property.
Fair value measurement
Fair value measurement of lease hold premises is based on the valuations carried out by anindependent valuer M/s. Akbani and Javed Associates as on June 30, 2017 on the basis of marketvalue.
13.1
13.2
13.3
Fair value measurement of revalued land is based on assumptions considered to be level 2 inputs.
Valuation techniques used to derive level 2 fair values - Investment property
Fair value of lease hold premises has been derived using a sales comparison approach. Thevaluation is considered on the basis of location, needs of the buyer, the overall prevailing marketsituation and other consideration associated with such type of property. The most significant inputin this valuation approach is price / rate per square foot in particular locality. This valuation isconsidered to be level 2 in fair value hierarchy due to significant observable inputs used in thevaluation.
13.4
14. PROPERTY, PLANT AND EQUIPMENT
Fixed assets - own useFixed assets - Ijarah finance
128,196,04679,700,262
207,896,308
5,586,904
49,364,316
54,951,220
14.114.5
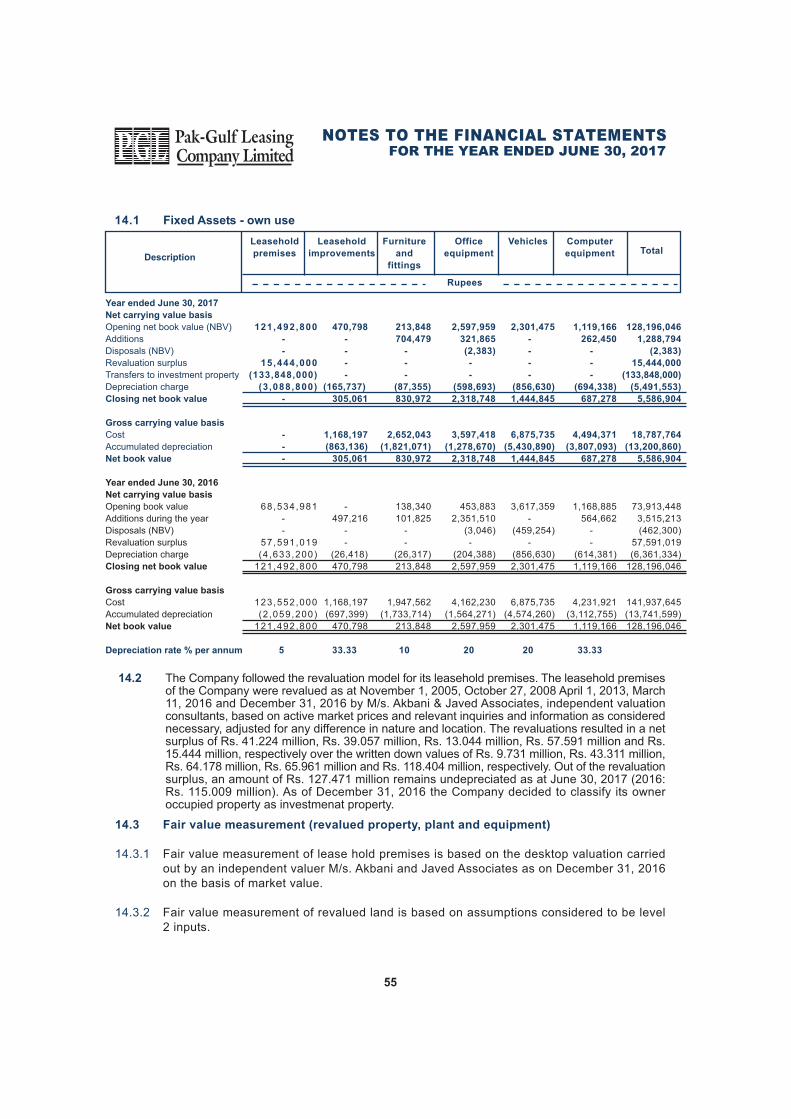
FOR THE YEAR ENDED JUNE 30, 2017
55
14.2 The Company followed the revaluation model for its leasehold premises. The leasehold premisesof the Company were revalued as at November 1, 2005, October 27, 2008 April 1, 2013, March11, 2016 and December 31, 2016 by M/s. Akbani & Javed Associates, independent valuationconsultants, based on active market prices and relevant inquiries and information as considerednecessary, adjusted for any difference in nature and location. The revaluations resulted in a netsurplus of Rs. 41.224 million, Rs. 39.057 million, Rs. 13.044 million, Rs. 57.591 million and Rs.15.444 million, respectively over the written down values of Rs. 9.731 million, Rs. 43.311 million,Rs. 64.178 million, Rs. 65.961 million and Rs. 118.404 million, respectively. Out of the revaluationsurplus, an amount of Rs. 127.471 million remains undepreciated as at June 30, 2017 (2016:Rs. 115.009 million). As of December 31, 2016 the Company decided to classify its owneroccupied property as investmenat property.
14.1 Fixed Assets - own use
128,196,046
1,288,794
(2,383)
15,444,000
(133,848,000)
(5,491,553)
5,586,904
18,787,764
(13,200,860)
5,586,904
73,913,448
3,515,213
(462,300)
57,591,019
(6,361,334)
128,196,046
141,937,645
(13,741,599)
128,196,046
1,119,166
262,450
-
-
-
(694,338)
687,278
4,494,371
(3,807,093)
687,278
1,168,885
564,662
-
-
(614,381)
1,119,166
4,231,921
(3,112,755)
1,119,166
33.33
2,301,475
-
-
-
-
(856,630)
1,444,845
6,875,735
(5,430,890)
1,444,845
3,617,359
-
(459,254)
-
(856,630)
2,301,475
6,875,735
(4,574,260)
2,301,475
20
2,597,959
321,865
(2,383)
-
-
(598,693)
2,318,748
3,597,418
(1,278,670)
2,318,748
453,883
2,351,510
(3,046)
-
(204,388)
2,597,959
4,162,230
(1,564,271)
2,597,959
20
213,848
704,479
-
-
-
(87,355)
830,972
2,652,043
(1,821,071)
830,972
138,340
101,825
-
-
(26,317)
213,848
1,947,562
(1,733,714)
213,848
10
470,798
-
-
-
-
(165,737)
305,061
1,168,197
(863,136)
305,061
-
497,216
-
-
(26,418)
470,798
1,168,197
(697,399)
470,798
33.33
121,492,800
-
-
15 ,444,000
(133,848,000)
(3 ,088,800)
-
-
-
-
68 ,534,981
-
-
57 ,591,019
(4 ,633,200)
121,492,800
123,552,000
(2 ,059,200)
121,492,800
5
Year ended June 30, 2017
Net carrying value basis
Opening net book value (NBV)
Additions
Disposals (NBV)
Revaluation surplus
Transfers to investment property
Depreciation charge
Closing net book value
Gross carrying value basis
Cost
Accumulated depreciation
Net book value
Year ended June 30, 2016
Net carrying value basis
Opening book value
Additions during the year
Disposals (NBV)
Revaluation surplus
Depreciation charge
Closing net book value
Gross carrying value basis
Cost
Accumulated depreciation
Net book value
Depreciation rate % per annum
TotalComputer
equipment
VehiclesOffice
equipment
Furniture
and
fittings
Leasehold
improvements
Leasehold
premisesDescription
Rupees
14.3 Fair value measurement (revalued property, plant and equipment)
14.3.1 Fair value measurement of lease hold premises is based on the desktop valuation carriedout by an independent valuer M/s. Akbani and Javed Associates as on December 31, 2016on the basis of market value.
14.3.2 Fair value measurement of revalued land is based on assumptions considered to be level2 inputs.

56
FOR THE YEAR ENDED JUNE 30, 2017
Description
(Rupees)
MachineryVehicles Total
14.5 Fixed assets - Ijarah finance
14.4 Valuation techniques used to derive level 2 fair values - Lease hold premises
Fair value of lease hold premises has been derived using a sales comparison approach. Thevaluation is considered on the basis of location, needs of the buyer, the overall prevailingmarket situation and other consideration associated with such type of property. The mostsignificant input in this valuation approach is price / rate per square foot in particular locality.This valuation is considered to be level 2 in fair value hierarchy due to significant observableinputs used in the valuation.
Year ended June 30, 2017
Net carrying value basis
Opening book valueAdditions during the yearDisposal during the year (NBV)Depreciation chargeClosing net book value
Gross carrying value basis
CostAccumulated depreciationNet book value
Year ended June 30, 2016
Net carrying value basis
Opening book valueAdditions during the yearDisposal during the year (NBV)Depreciation chargeClosing net book value
Gross carrying value basis
CostAccumulated depreciationNet book value
Depreciation rate % per annum
77,798,794
-
-
(29,272,454)
48,526,340
115,663,662
(67,137,322)
48,526,340
48,873,984 56,189,662
- (27,264,852)
77,798,794
115,663,662 (37,864,868)
77,798,794
20 to 50
1,901,468
-
(259,375)
(804,117)
837,976
2,186,000
(1,348,024)
837,976
2,976,248 - -
(1,074,780) 1,901,468
4,098,740 (2,197,272)
1,901,468
20 to 33.33
79,700,262
-
(259,375)
(30,076,571)
49,364,316
117,849,662
(68,485,346)
49,364,316
51,850,232 56,189,662
-(28,339,632) 79,700,262
119,762,402(40,062,140) 79,700,262

57
FOR THE YEAR ENDED JUNE 30, 2017
1,590,019Intangible assets
15. INTANGIBLE ASSETS
1,654,37515.1
2016Note 2017Rupees
Description
15.1 Intangible assets
(Rupees)
Software
under
development
Computer
SoftwareTotal
14.6 The details of property, plant and equipment - own use / ijarah disposted off during the year isas follow:
14.7 As at June 30, 2017 cost of asset acquired under Ijarah arrangements amounts to Rs. 1.88million (2016: Rs. 1.88 million) which do not form part of the assets of the Company inaccordance with the requirements to IFAS 2.
Year ended June 30, 2017
Net carrying value basis
Opening book valueAdditions during the yearDisposal (NBV)Amortisation chargeClosing net book value
Gross carrying value basis
CostAccumulated amortisationNet book value
Year ended June 30, 2016
Net carrying value basis
Opening book valueAdditions during the yearDisposal (NBV)Amortisation chargeClosing net book value
Gross carrying value basis
CostAccumulated amortisationNet book value
Amortisation rate % per annum
1,440,217
-
-
-
1,440,217
1,440,217
-
1,440,217
1,168,478 271,739
- -
1,440,217
1,440,217 -
1,440,217
-
149,802
217,788
-
(153,432)
214,158
966,798
(752,640)
214,158
299,604 - -
(149,802) 149,802
749,010 (599,208)
149,802
20
1,590,019
271,788
-
(153,432)
1,654,375
2,407,015
(752,640)
1,654,375
1,468,082 271,739
- (149,802) 1,590,019
2,189,227 (599,208) 1,590,019
886,677
1,912,740
2,799,417
3,460,196
2,383
259,375
261,758
462,300
15,000
275,985
290,985
1,826,400
12,617
16,610
29,227
1,364,100
Scrap sale
End ofIjarah term
Bid/Scrapsale
Various buyers
Lessee
Various buyers
2017
Own Use
OfficeequipmentIjarah
finance
Vehicle
Total - 2017
Total - 2016
884,294
1,653,365
2,537,659
2,997,896
Original
Cost
Accumulated
depriciation
Written
down value
Sale
proceeds
Gain
on disposal
Mode of
disposal
Particulars
of buyer
Rupees
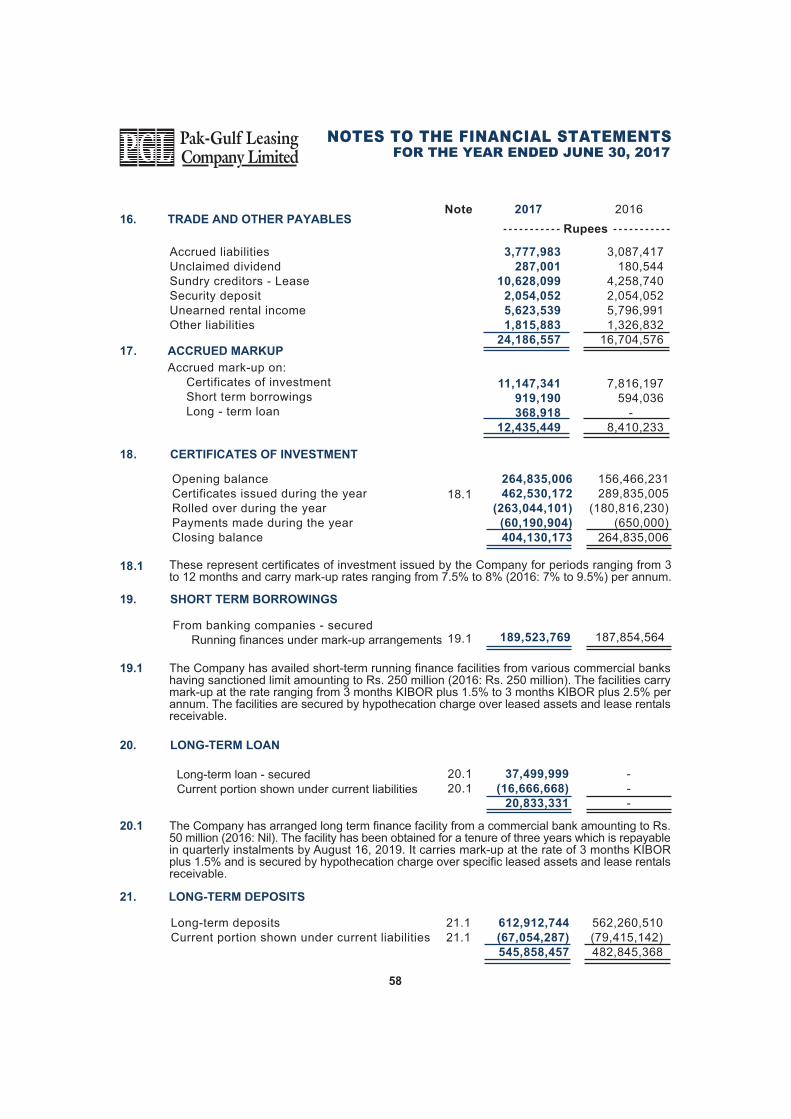
3,087,417 180,544
4,258,740 2,054,052 5,796,991 1,326,832
16,704,576
7,816,197 594,036
- 8,410,233
2016
Accrued liabilitiesUnclaimed dividendSundry creditors - LeaseSecurity depositUnearned rental incomeOther liabilities
16. TRADE AND OTHER PAYABLES
3,777,983
287,001
10,628,099
2,054,052
5,623,539
1,815,883
24,186,557
11,147,341
919,190
368,918
12,435,449
2017
Rupees
Accrued mark-up on: Certificates of investment Short term borrowings Long - term loan
17. ACCRUED MARKUP
Note
18.1 These represent certificates of investment issued by the Company for periods ranging from 3to 12 months and carry mark-up rates ranging from 7.5% to 8% (2016: 7% to 9.5%) per annum.
187,854,564From banking companies - secured Running finances under mark-up arrangements
19. SHORT TERM BORROWINGS
189,523,76919.1
156,466,231 289,835,005
(180,816,230) (650,000)
264,835,006
Opening balanceCertificates issued during the yearRolled over during the yearPayments made during the yearClosing balance
18. CERTIFICATES OF INVESTMENT
264,835,006
462,530,172
(263,044,101)
(60,190,904)
404,130,173
18.1
The Company has availed short-term running finance facilities from various commercial bankshaving sanctioned limit amounting to Rs. 250 million (2016: Rs. 250 million). The facilities carrymark-up at the rate ranging from 3 months KIBOR plus 1.5% to 3 months KIBOR plus 2.5% perannum. The facilities are secured by hypothecation charge over leased assets and lease rentalsreceivable.
19.1
20.1 The Company has arranged long term finance facility from a commercial bank amounting to Rs.50 million (2016: Nil). The facility has been obtained for a tenure of three years which is repayablein quarterly instalments by August 16, 2019. It carries mark-up at the rate of 3 months KIBORplus 1.5% and is secured by hypothecation charge over specific leased assets and lease rentalsreceivable.
---
20. LONG-TERM LOAN
Long-term loan - secured Current portion shown under current liabilities
37,499,999
(16,666,668)
20,833,331
20.120.1
Long-term depositsCurrent portion shown under current liabilities
21. LONG-TERM DEPOSITS
612,912,744
(67,054,287)
545,858,457
21.121.1
562,260,510 (79,415,142) 482,845,368
FOR THE YEAR ENDED JUNE 30, 2017
58
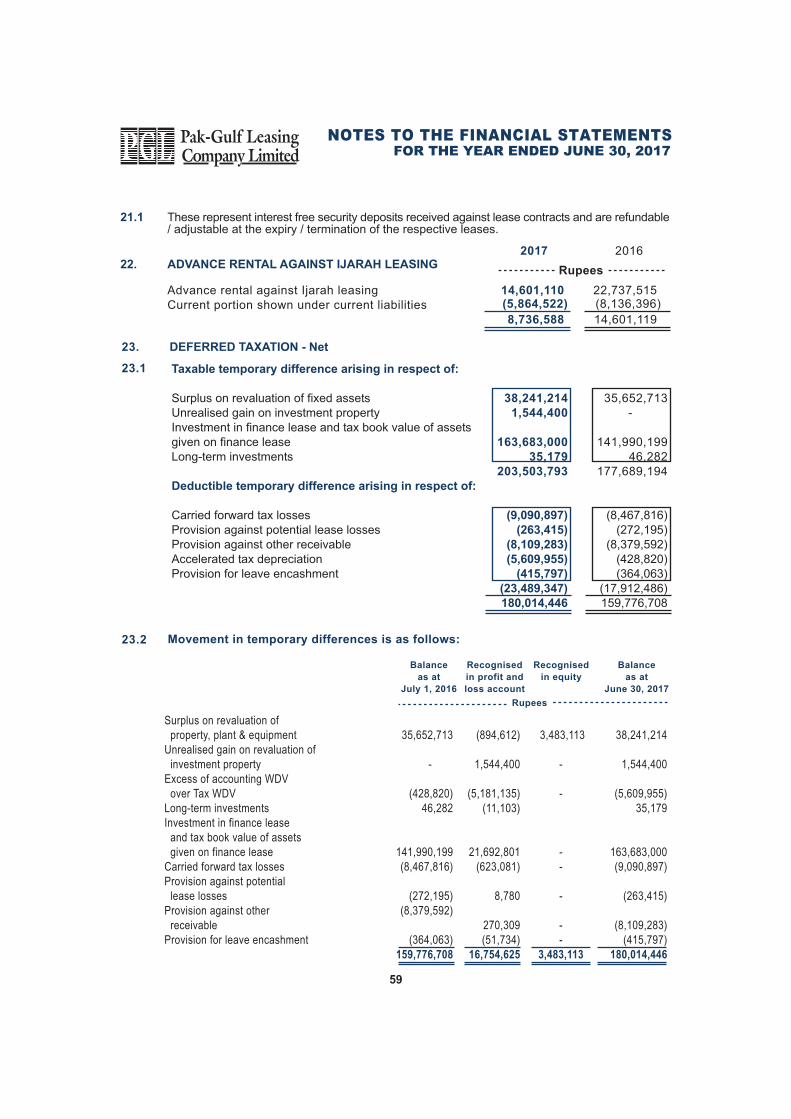
FOR THE YEAR ENDED JUNE 30, 2017
59
35,652,713 -
141,990,199 46,282
177,689,194
(8,467,816) (272,195)
(8,379,592) (428,820) (364,063)
(17,912,486) 159,776,708
Taxable temporary difference arising in respect of:
Surplus on revaluation of fixed assetsUnrealised gain on investment propertyInvestment in finance lease and tax book value of assetsgiven on finance leaseLong-term investments
Deductible temporary difference arising in respect of:
Carried forward tax lossesProvision against potential lease lossesProvision against other receivableAccelerated tax depreciationProvision for leave encashment
23. DEFERRED TAXATION - Net
38,241,214
1,544,400
163,683,000
35,179
203,503,793
(9,090,897)
(263,415)
(8,109,283)
(5,609,955)
(415,797)
(23,489,347)
180,014,446
23.1
20162017
Rupees
21.1 These represent interest free security deposits received against lease contracts and are refundable/ adjustable at the expiry / termination of the respective leases.
Advance rental against Ijarah leasingCurrent portion shown under current liabilities
22. ADVANCE RENTAL AGAINST IJARAH LEASING
14,601,110
8,736,588
(5,864,522)
23.2 Movement in temporary differences is as follows:
38,241,214
1,544,400
(5,609,955)
35,179
163,683,000
(9,090,897)
(263,415)
(8,109,283)
(415,797)
180,014,446
Surplus on revaluation of
property, plant & equipment
Unrealised gain on revaluation of
investment property
Excess of accounting WDV
over Tax WDV
Long-term investments
Investment in finance lease
and tax book value of assets
given on finance lease
Carried forward tax losses
Provision against potential
lease losses
Provision against other
receivable
Provision for leave encashment
3,483,113
-
-
-
-
-
-
-
3,483,113
35,652,713
-
(428,820)
46,282
141,990,199
(8,467,816)
(272,195)
(8,379,592)
(364,063)
159,776,708
(894,612)
1,544,400
(5,181,135)
(11,103)
21,692,801
(623,081)
8,780
270,309
(51,734)
16,754,625
Balance
as at
July 1, 2016
Balance
as at
June 30, 2017
Rupees
Recognised
in profit and
loss account
Recognised
in equity
22,737,515
14,601,119
(8,136,396)
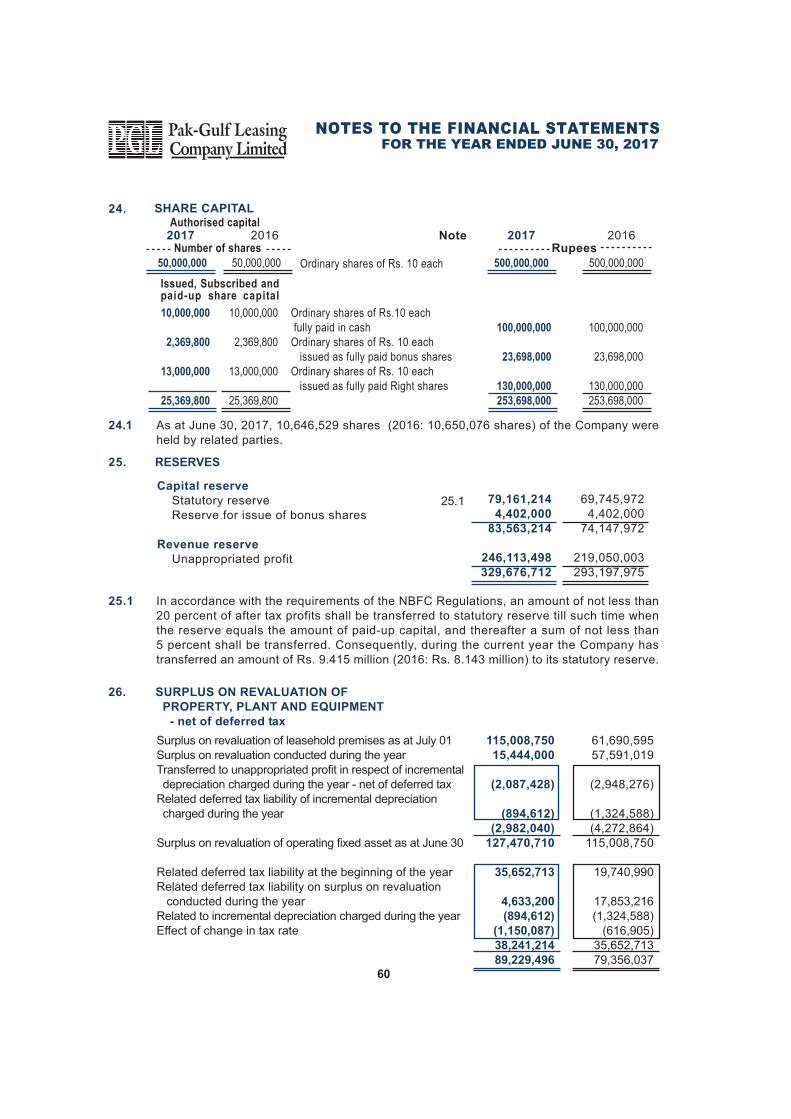
60
FOR THE YEAR ENDED JUNE 30, 2017
Surplus on revaluation of leasehold premises as at July 01Surplus on revaluation conducted during the yearTransferred to unappropriated profit in respect of incremental depreciation charged during the year - net of deferred taxRelated deferred tax liability of incremental depreciation charged during the year
Surplus on revaluation of operating fixed asset as at June 30
Related deferred tax liability at the beginning of the yearRelated deferred tax liability on surplus on revaluation conducted during the yearRelated to incremental depreciation charged during the yearEffect of change in tax rate
61,690,595 57,591,019
(2,948,276)
(1,324,588) (4,272,864)
115,008,750
19,740,990
17,853,216 (1,324,588)
(616,905)35,652,71379,356,037
26. SURPLUS ON REVALUATION OF
PROPERTY, PLANT AND EQUIPMENT
- net of deferred tax
115,008,750
15,444,000
(2,087,428)
(894,612)
(2,982,040)
127,470,710
35,652,713
4,633,200
(894,612)
(1,150,087)
38,241,214
89,229,496
25.1 In accordance with the requirements of the NBFC Regulations, an amount of not less than20 percent of after tax profits shall be transferred to statutory reserve till such time whenthe reserve equals the amount of paid-up capital, and thereafter a sum of not less than5 percent shall be transferred. Consequently, during the current year the Company hastransferred an amount of Rs. 9.415 million (2016: Rs. 8.143 million) to its statutory reserve.
69,745,972 4,402,000
74,147,972
219,050,003 293,197,975
RESERVES
Capital reserve
Statutory reserve Reserve for issue of bonus shares
Revenue reserve
Unappropriated profit
25.
25.1 79,161,214
4,402,000
83,563,214
246,113,498
329,676,712
24.1 As at June 30, 2017, 10,646,529 shares (2016: 10,650,076 shares) of the Company wereheld by related parties.
Authorised capital
Ordinary shares of Rs. 10 each50,000,00050,000,000
Number of shares
Issued, Subscribed andpaid-up share capital
100,000,000
23,698,000
130,000,000
253,698,000
Ordinary shares of Rs.10 each
fully paid in cash
Ordinary shares of Rs. 10 each
issued as fully paid bonus shares
Ordinary shares of Rs. 10 each
issued as fully paid Right shares
10,000,000
2,369,800
13,000,000
25,369,800
10,000,000
2,369,800
13,000,000
25,369,800
100,000,000
23,698,000
130,000,000
253,698,000
24. SHARE CAPITAL
500,000,000
2017 2016Rupees
500,000,000
2017 2016 Note
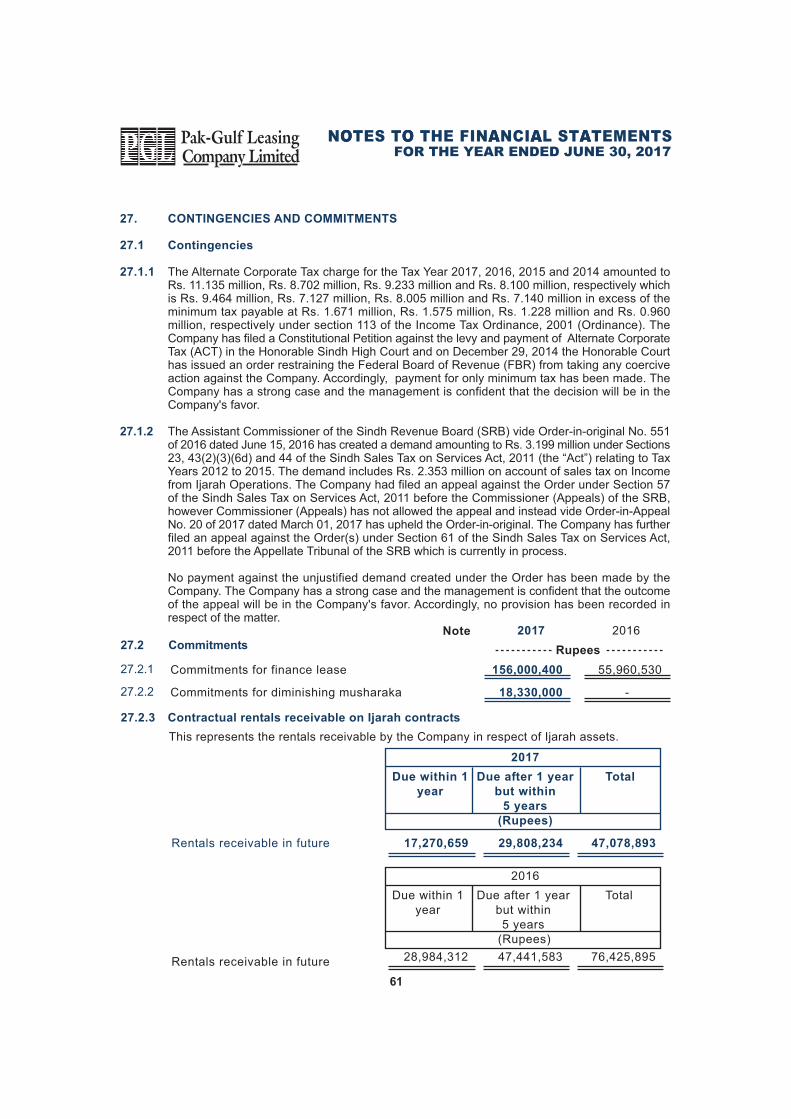
FOR THE YEAR ENDED JUNE 30, 2017
61
27. CONTINGENCIES AND COMMITMENTS
27.1 Contingencies
27.1.1 The Alternate Corporate Tax charge for the Tax Year 2017, 2016, 2015 and 2014 amounted toRs. 11.135 million, Rs. 8.702 million, Rs. 9.233 million and Rs. 8.100 million, respectively whichis Rs. 9.464 million, Rs. 7.127 million, Rs. 8.005 million and Rs. 7.140 million in excess of theminimum tax payable at Rs. 1.671 million, Rs. 1.575 million, Rs. 1.228 million and Rs. 0.960million, respectively under section 113 of the Income Tax Ordinance, 2001 (Ordinance). TheCompany has filed a Constitutional Petition against the levy and payment of Alternate CorporateTax (ACT) in the Honorable Sindh High Court and on December 29, 2014 the Honorable Courthas issued an order restraining the Federal Board of Revenue (FBR) from taking any coerciveaction against the Company. Accordingly, payment for only minimum tax has been made. TheCompany has a strong case and the management is confident that the decision will be in theCompany's favor.
27.1.2 The Assistant Commissioner of the Sindh Revenue Board (SRB) vide Order-in-original No. 551of 2016 dated June 15, 2016 has created a demand amounting to Rs. 3.199 million under Sections23, 43(2)(3)(6d) and 44 of the Sindh Sales Tax on Services Act, 2011 (the �Act�) relating to TaxYears 2012 to 2015. The demand includes Rs. 2.353 million on account of sales tax on Incomefrom Ijarah Operations. The Company had filed an appeal against the Order under Section 57of the Sindh Sales Tax on Services Act, 2011 before the Commissioner (Appeals) of the SRB,however Commissioner (Appeals) has not allowed the appeal and instead vide Order-in-AppealNo. 20 of 2017 dated March 01, 2017 has upheld the Order-in-original. The Company has furtherfiled an appeal against the Order(s) under Section 61 of the Sindh Sales Tax on Services Act,2011 before the Appellate Tribunal of the SRB which is currently in process.
No payment against the unjustified demand created under the Order has been made by theCompany. The Company has a strong case and the management is confident that the outcomeof the appeal will be in the Company's favor. Accordingly, no provision has been recorded inrespect of the matter.
This represents the rentals receivable by the Company in respect of Ijarah assets.
27.2.3 Contractual rentals receivable on Ijarah contracts
47,078,89329,808,23417,270,659
TotalDue after 1 year
but within
5 years
Due within 1
year
2017
(Rupees)
Rentals receivable in future
TotalDue after 1 yearbut within5 years
Due within 1year
2016
(Rupees)
Rentals receivable in future
20162017
Rupees27.2 Commitments
Note
55,960,530Commitments for finance lease 156,000,40027.2.1
Commitments for diminishing musharaka 18,330,00027.2.2 -
76,425,89547,441,58328,984,312
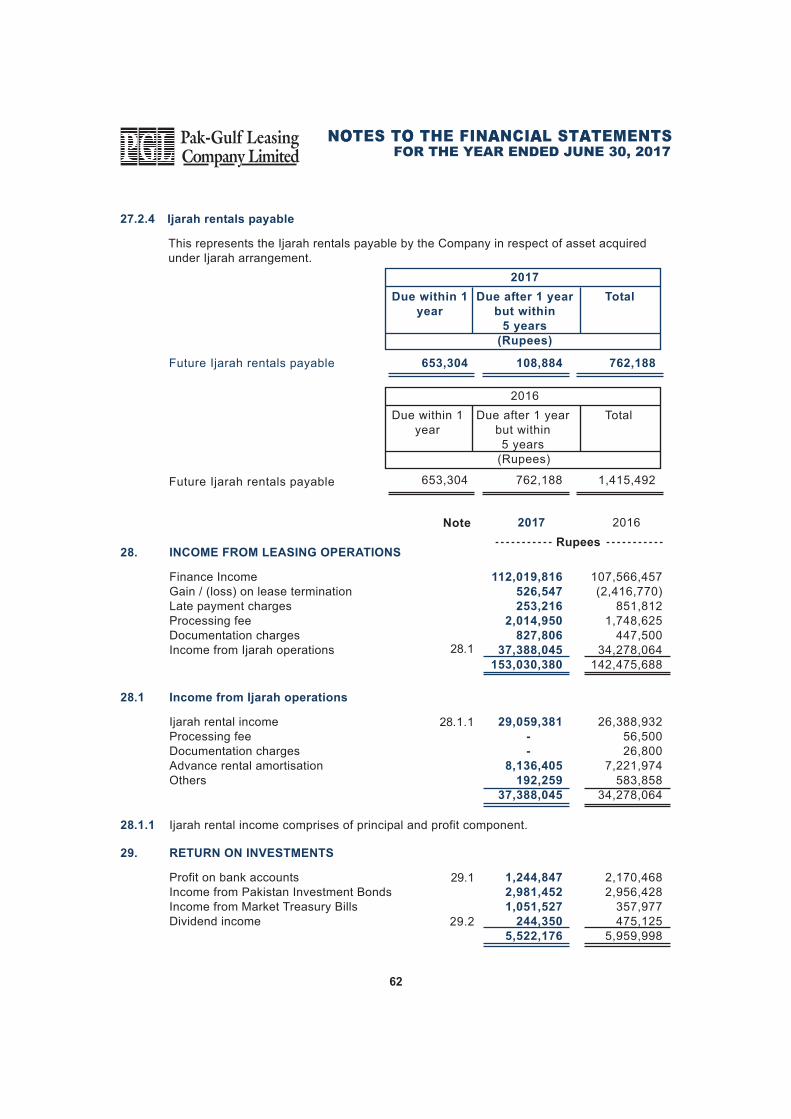
FOR THE YEAR ENDED JUNE 30, 2017
62
20162017
Rupees
Note
107,566,457 (2,416,770)
851,812 1,748,625
447,500 34,278,064
142,475,688
Finance IncomeGain / (loss) on lease terminationLate payment chargesProcessing feeDocumentation chargesIncome from Ijarah operations
112,019,816
526,547
253,216
2,014,950
827,806
37,388,045
153,030,380
28. INCOME FROM LEASING OPERATIONS
28.1
26,388,932 56,500 26,800
7,221,974 583,858
34,278,064
Ijarah rental incomeProcessing feeDocumentation chargesAdvance rental amortisationOthers
29,059,381
-
-
8,136,405
192,259
37,388,045
28.1 Income from Ijarah operations
28.1.1
28.1.1 Ijarah rental income comprises of principal and profit component.
2,170,468 2,956,428
357,977 475,125
5,959,998
Profit on bank accountsIncome from Pakistan Investment BondsIncome from Market Treasury BillsDividend income
1,244,847
2,981,452
1,051,527
244,350
5,522,176
29. RETURN ON INVESTMENTS
29.1
29.2
This represents the Ijarah rentals payable by the Company in respect of asset acquiredunder Ijarah arrangement.
27.2.4 Ijarah rentals payable
762,188108,884653,304
TotalDue after 1 year
but within
5 years
Due within 1
year
2017
(Rupees)
Future Ijarah rentals payable
TotalDue after 1 yearbut within5 years
Due within 1year
2016
(Rupees)
Future Ijarah rentals payable 1,415,492762,188653,304
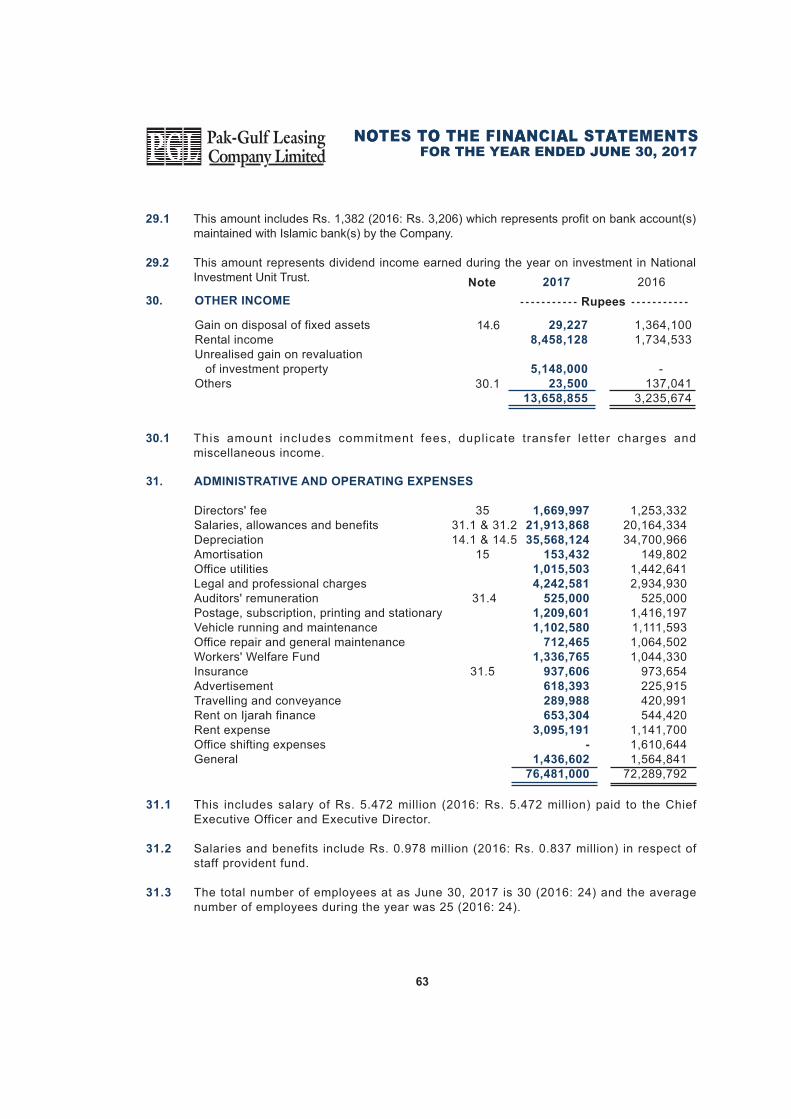
FOR THE YEAR ENDED JUNE 30, 2017
63
20162017
Rupees
Note
29.1 This amount includes Rs. 1,382 (2016: Rs. 3,206) which represents profit on bank account(s)maintained with Islamic bank(s) by the Company.
29.2 This amount represents dividend income earned during the year on investment in NationalInvestment Unit Trust.
1,364,100 1,734,533
- 137,041
3,235,674
Gain on disposal of fixed assetsRental incomeUnrealised gain on revaluation of investment propertyOthers
29,227
8,458,128
5,148,000
23,500
13,658,855
30. OTHER INCOME
14.6
30.1
30.1 This amount includes commitment fees, duplicate transfer letter charges andmiscellaneous income.
1,253,332 20,164,334 34,700,966
149,802 1,442,641 2,934,930
525,000 1,416,197 1,111,593 1,064,502 1,044,330
973,654 225,915 420,991 544,420
1,141,700 1,610,644 1,564,841
72,289,792
1,669,997
21,913,868
35,568,124
153,432
1,015,503
4,242,581
525,000
1,209,601
1,102,580
712,465
1,336,765
937,606
618,393
289,988
653,304
3,095,191
-
1,436,602
76,481,000
ADMINISTRATIVE AND OPERATING EXPENSES
Directors' feeSalaries, allowances and benefitsDepreciationAmortisationOffice utilitiesLegal and professional chargesAuditors' remunerationPostage, subscription, printing and stationaryVehicle running and maintenanceOffice repair and general maintenanceWorkers' Welfare FundInsuranceAdvertisementTravelling and conveyanceRent on Ijarah financeRent expenseOffice shifting expensesGeneral
31.
35 31.1 & 31.2 14.1 & 14.5
15
31.4
31.5
31.1 This includes salary of Rs. 5.472 million (2016: Rs. 5.472 million) paid to the ChiefExecutive Officer and Executive Director.
31.2 Salaries and benefits include Rs. 0.978 million (2016: Rs. 0.837 million) in respect ofstaff provident fund.
31.3 The total number of employees at as June 30, 2017 is 30 (2016: 24) and the averagenumber of employees during the year was 25 (2016: 24).
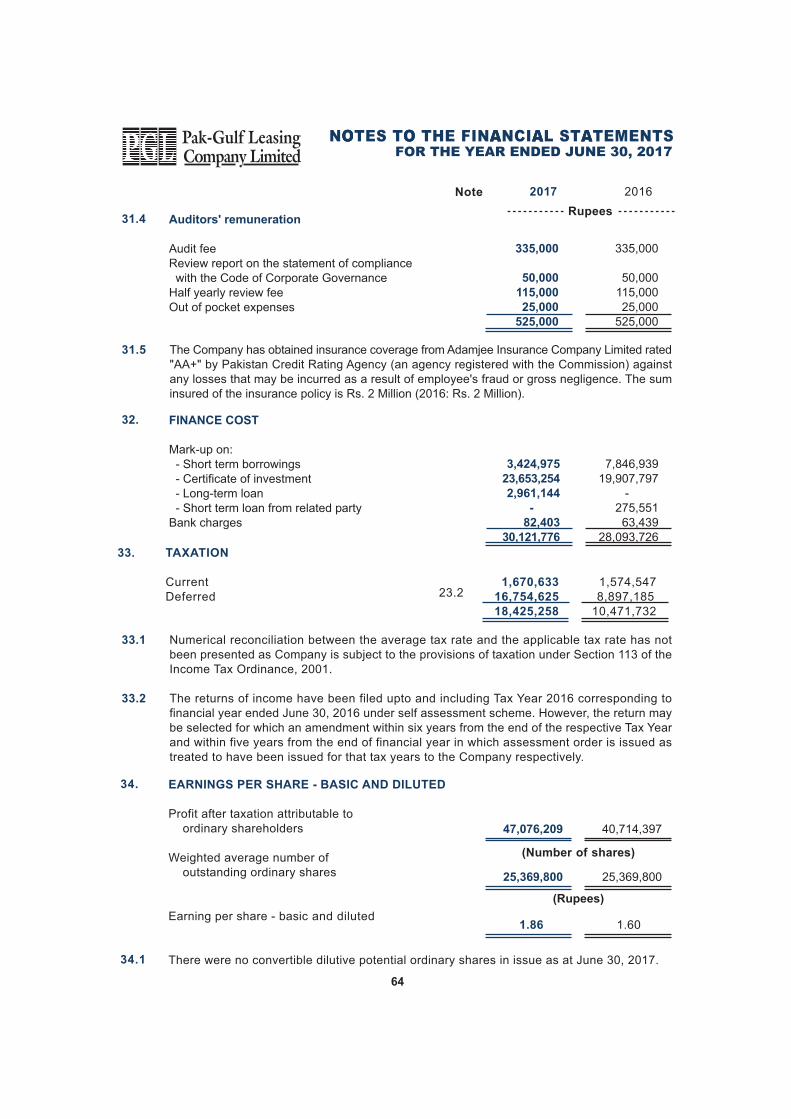
FOR THE YEAR ENDED JUNE 30, 2017
64
33.1 Numerical reconciliation between the average tax rate and the applicable tax rate has notbeen presented as Company is subject to the provisions of taxation under Section 113 of theIncome Tax Ordinance, 2001.
33.2 The returns of income have been filed upto and including Tax Year 2016 corresponding tofinancial year ended June 30, 2016 under self assessment scheme. However, the return maybe selected for which an amendment within six years from the end of the respective Tax Yearand within five years from the end of financial year in which assessment order is issued astreated to have been issued for that tax years to the Company respectively.
1,574,547 8,897,185 10,471,732
33. TAXATION
CurrentDeferred
1,670,633
16,754,625
18,425,258
23.2
Auditors' remuneration
Audit feeReview report on the statement of compliance with the Code of Corporate GovernanceHalf yearly review feeOut of pocket expenses
31.4
335,000
50,000 115,000 25,000
525,000
335,000
50,000
115,000
25,000
525,000
FINANCE COST
Mark-up on: - Short term borrowings - Certificate of investment - Long-term loan - Short term loan from related partyBank charges
32.
7,846,939 19,907,797
- 275,551
63,439 28,093,726
3,424,975
23,653,254
2,961,144
-
82,403
30,121,776
20162017
Rupees
Note
31.5 The Company has obtained insurance coverage from Adamjee Insurance Company Limited rated"AA+" by Pakistan Credit Rating Agency (an agency registered with the Commission) againstany losses that may be incurred as a result of employee's fraud or gross negligence. The suminsured of the insurance policy is Rs. 2 Million (2016: Rs. 2 Million).
EARNINGS PER SHARE - BASIC AND DILUTED
Profit after taxation attributable to ordinary shareholders
Weighted average number of outstanding ordinary shares
Earning per share - basic and diluted
There were no convertible dilutive potential ordinary shares in issue as at June 30, 2017.
40,714,397
25,369,800
1.60
47,076,209
25,369,800
1.86
34.1
34.
(Rupees)
(Number of shares)
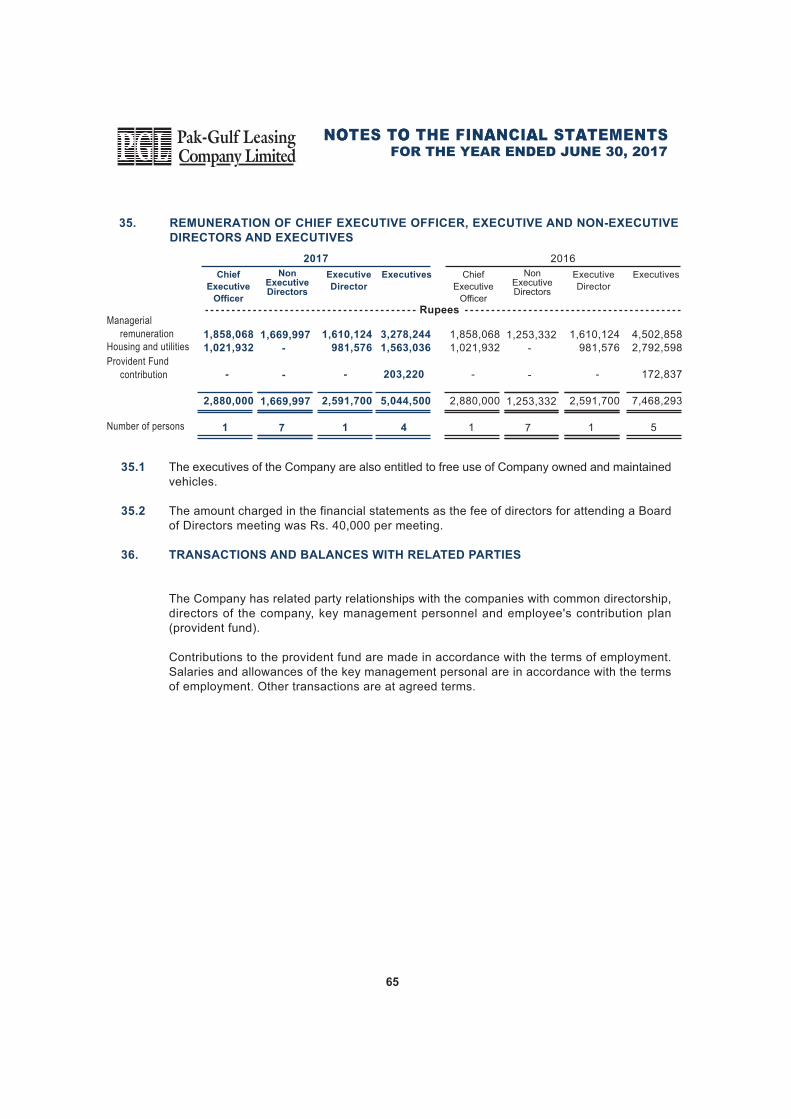
35. REMUNERATION OF CHIEF EXECUTIVE OFFICER, EXECUTIVE AND NON-EXECUTIVE
DIRECTORS AND EXECUTIVES
FOR THE YEAR ENDED JUNE 30, 2017
65
35.1 The executives of the Company are also entitled to free use of Company owned and maintainedvehicles.
35.2 The amount charged in the financial statements as the fee of directors for attending a Boardof Directors meeting was Rs. 40,000 per meeting.
36. TRANSACTIONS AND BALANCES WITH RELATED PARTIES
The Company has related party relationships with the companies with common directorship,directors of the company, key management personnel and employee's contribution plan(provident fund).
Contributions to the provident fund are made in accordance with the terms of employment.Salaries and allowances of the key management personal are in accordance with the termsof employment. Other transactions are at agreed terms.
Managerial
remuneration
Housing and utilities
Provident Fund
contribution
Number of persons
Rupees
2017
1,858,068
1,021,932
-
2,880,000
1
Chief
Executive
Officer
1,669,997
-
-
1,669,997
7
NonExecutiveDirectors
1,610,124
981,576
-
2,591,700
1
Executive
Director
3,278,244
1,563,036
203,220
5,044,500
4
Executives
2016
Chief
Executive
Officer
NonExecutiveDirectors
1,858,068
1,021,932
-
2,880,000
1
1,253,332
-
-
1,253,332
7
1,610,124
981,576
-
2,591,700
1
Executive
Director
4,502,858
2,792,598
172,837
7,468,293
5
Executives
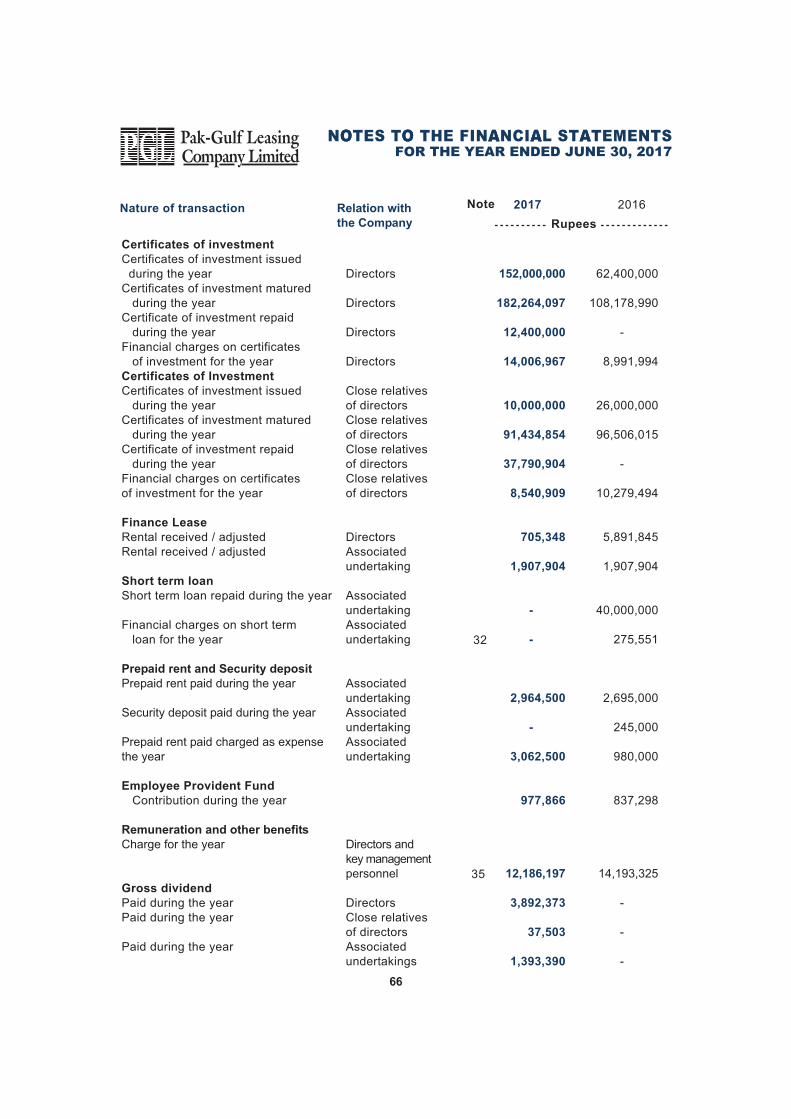
FOR THE YEAR ENDED JUNE 30, 2017
66
2017 2016
Rupees
32
35
Note
Certificates of investment
Certificates of investment issued during the yearCertificates of investment matured during the yearCertificate of investment repaid during the yearFinancial charges on certificates of investment for the yearCertificates of Investment
Certificates of investment issued during the yearCertificates of investment matured during the yearCertificate of investment repaid during the yearFinancial charges on certificatesof investment for the year
Finance Lease
Rental received / adjustedRental received / adjusted
Short term loan
Short term loan repaid during the year
Financial charges on short term loan for the year
Prepaid rent and Security deposit
Prepaid rent paid during the year
Security deposit paid during the year
Prepaid rent paid charged as expensethe year
Employee Provident Fund
Contribution during the year
Remuneration and other benefits
Charge for the year
Gross dividend
Paid during the yearPaid during the year
Paid during the year
62,400,000
108,178,990
-
8,991,994
26,000,000
96,506,015
-
10,279,494
5,891,845
1,907,904
40,000,000
275,551
2,695,000
245,000
980,000
837,298
14,193,325
-
-
-
152,000,000
182,264,097
12,400,000
14,006,967
10,000,000
91,434,854
37,790,904
8,540,909
705,348
1,907,904
-
-
2,964,500
-
3,062,500
977,866
12,186,197
3,892,373
37,503
1,393,390
Directors
Directors
Directors
Directors
Close relativesof directorsClose relativesof directorsClose relativesof directorsClose relativesof directors
DirectorsAssociatedundertaking
AssociatedundertakingAssociatedundertaking
AssociatedundertakingAssociatedundertakingAssociatedundertaking
Directors andkey managementpersonnel
DirectorsClose relativesof directorsAssociatedundertakings
Relation with
the Company
Nature of transaction
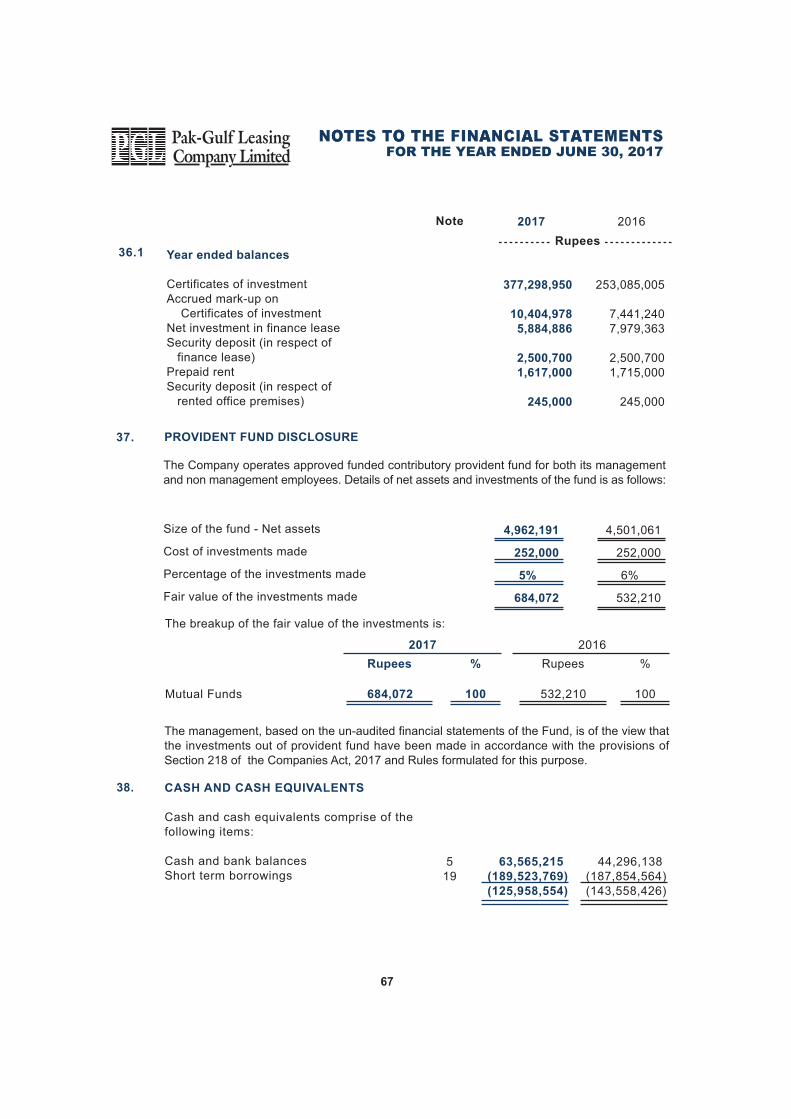
FOR THE YEAR ENDED JUNE 30, 2017
67
The management, based on the un-audited financial statements of the Fund, is of the view thatthe investments out of provident fund have been made in accordance with the provisions ofSection 218 of the Companies Act, 2017 and Rules formulated for this purpose.
The breakup of the fair value of the investments is:
Mutual Funds 100532,210100684,072
2017
Rupees %
2016
Rupees %
Size of the fund - Net assets
Cost of investments made
Percentage of the investments made
Fair value of the investments made
4,501,061
252,000
6%
532,210
4,962,191
252,000
5%
684,072
The Company operates approved funded contributory provident fund for both its managementand non management employees. Details of net assets and investments of the fund is as follows:
PROVIDENT FUND DISCLOSURE37.
2017 2016
Rupees36.1 Year ended balances
Certificates of investmentAccrued mark-up on Certificates of investmentNet investment in finance leaseSecurity deposit (in respect of finance lease)Prepaid rentSecurity deposit (in respect of rented office premises)
253,085,005
7,441,240 7,979,363
2,500,700 1,715,000
245,000
377,298,950
10,404,978
5,884,886
2,500,700
1,617,000
245,000
Note
(187,854,564) (143,558,426)
63,565,215 44,296,138
38. CASH AND CASH EQUIVALENTS
Cash and cash equivalents comprise of thefollowing items:
Cash and bank balancesShort term borrowings (189,523,769)
(125,958,554)
519
FOR THE YEAR ENDED JUNE 30, 2017
68
39. FINANCIAL RISK MANAGEMENT
Introduction and overview
The Company has exposure to the following risks from its use of financial instruments:
- Credit risk- Liquidity risk- Market risk
39.1 Risk management framework
The Board of Directors has overall responsibility for the establishment and oversight ofthe Company�s risk management framework. The Board is also responsible for developingand monitoring the Company's risk management policies.
The Company�s risk management policies are established to identify and analyse the risks facedby the Company, to set appropriate risk limits and controls, and to monitor risks and adherenceto limits. Risk management policies and systems are reviewed regularly to reflect changes inmarket conditions and the Company�s activities. The Company, through its training and managementstandards and procedures, aims to develop a disciplined and constructive control environmentin which all employees understand their roles and obligations.
39.2 Credit risk
Credit risk is the risk that a counterparty to a financial instrument will fail to discharge an obligationor commitment that it has entered into with the Company, resulting in a financial loss to theCompany. The risk is generally limited to principal amounts and accrued interest thereon, if any,and arises principally from the Company's receivables from customers and balances with thebanks.
39.2.1 Management of credit risk
The Company's policy is to enter into financial contracts in accordance with the internal riskmanagement policies and the requirements of the NBFC Rules and Regulations. The Companyattempts to control credit risk by monitoring credit exposures, limiting transactions with specificcounter parties, and continually assessing the credit worthiness of counter parties.
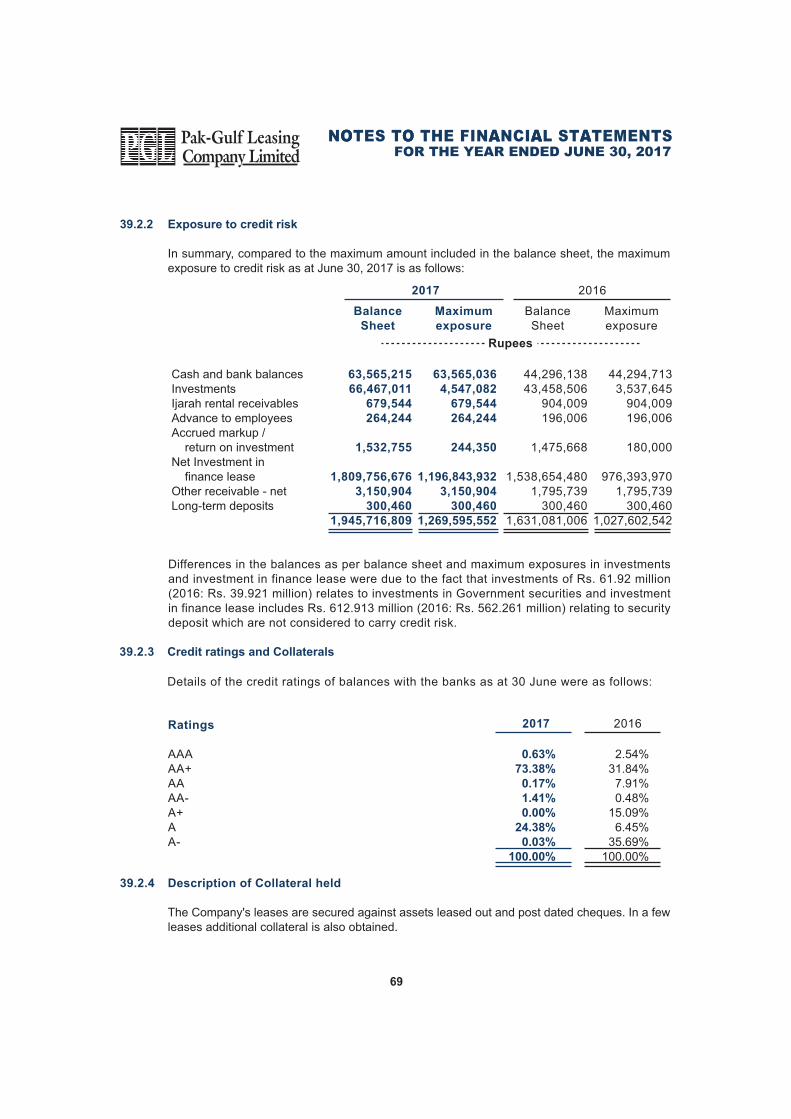
FOR THE YEAR ENDED JUNE 30, 2017
69
39.2.4 Description of Collateral held
The Company's leases are secured against assets leased out and post dated cheques. In a fewleases additional collateral is also obtained.
Differences in the balances as per balance sheet and maximum exposures in investmentsand investment in finance lease were due to the fact that investments of Rs. 61.92 million(2016: Rs. 39.921 million) relates to investments in Government securities and investmentin finance lease includes Rs. 612.913 million (2016: Rs. 562.261 million) relating to securitydeposit which are not considered to carry credit risk.
39.2.3 Credit ratings and Collaterals
Details of the credit ratings of balances with the banks as at 30 June were as follows:
2.54%31.84%
7.91%0.48%
15.09%6.45%
35.69%100.00%
2016Ratings
AAAAA+AAAA-A+AA-
0.63%
73.38%
0.17%
1.41%
0.00%
24.38%
0.03%
100.00%
2017
39.2.2 Exposure to credit risk
In summary, compared to the maximum amount included in the balance sheet, the maximumexposure to credit risk as at June 30, 2017 is as follows:
Cash and bank balancesInvestmentsIjarah rental receivablesAdvance to employeesAccrued markup / return on investmentNet Investment in finance leaseOther receivable - netLong-term deposits
63,565,036
4,547,082
679,544
264,244
244,350
1,196,843,932
3,150,904
300,460
1,269,595,552
63,565,215
66,467,011
679,544
264,244
1,532,755
1,809,756,676
3,150,904
300,460
1,945,716,809
2017
Rupees
2016
Balance
Sheet
Maximum
exposure
BalanceSheet
Maximumexposure
44,294,713 3,537,645
904,009 196,006
180,000
976,393,970 1,795,739
300,4601,027,602,542
44,296,138 43,458,506
904,009 196,006
1,475,668
1,538,654,480 1,795,739
300,460 1,631,081,006
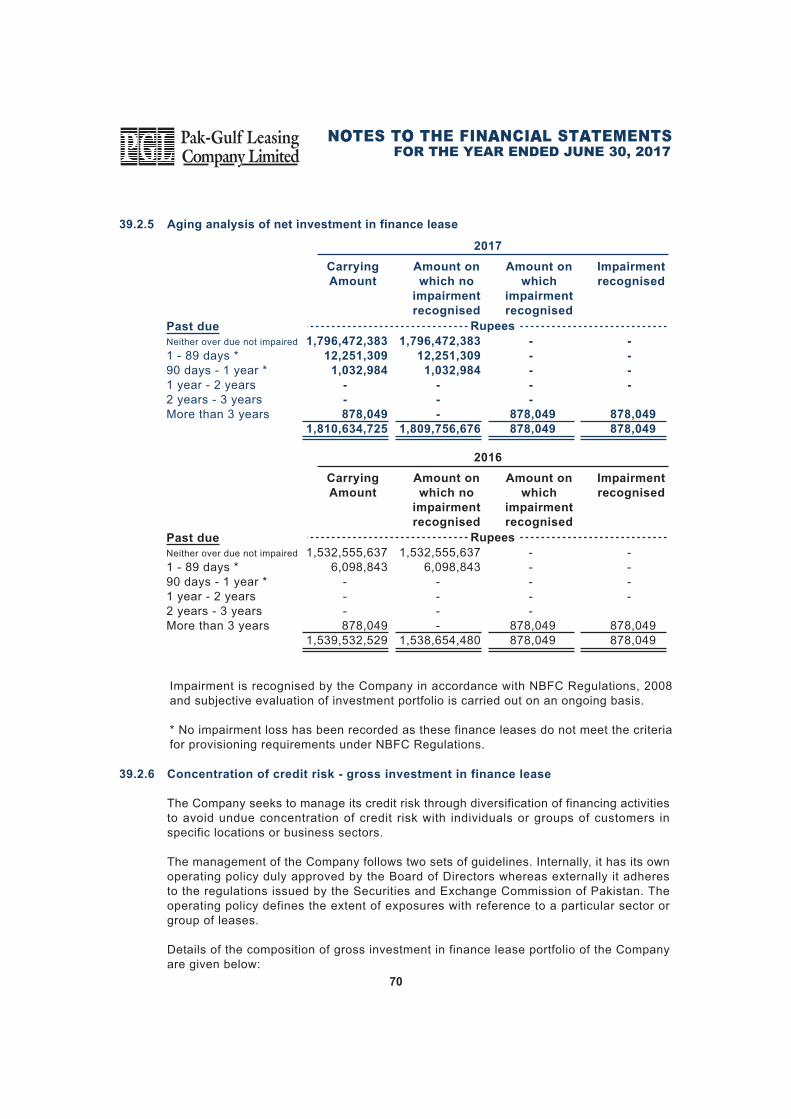
FOR THE YEAR ENDED JUNE 30, 2017
70
Impairment is recognised by the Company in accordance with NBFC Regulations, 2008and subjective evaluation of investment portfolio is carried out on an ongoing basis.
* No impairment loss has been recorded as these finance leases do not meet the criteriafor provisioning requirements under NBFC Regulations.
39.2.5 Aging analysis of net investment in finance lease
39.2.6 Concentration of credit risk - gross investment in finance lease
The Company seeks to manage its credit risk through diversification of financing activitiesto avoid undue concentration of credit risk with individuals or groups of customers inspecific locations or business sectors.
The management of the Company follows two sets of guidelines. Internally, it has its ownoperating policy duly approved by the Board of Directors whereas externally it adheresto the regulations issued by the Securities and Exchange Commission of Pakistan. Theoperating policy defines the extent of exposures with reference to a particular sector orgroup of leases.
Details of the composition of gross investment in finance lease portfolio of the Companyare given below:
-
-
-
-
878,049
878,049
-
-
-
-
-
878,049
878,049
Past due
Neither over due not impaired
1 - 89 days *90 days - 1 year *1 year - 2 years 2 years - 3 yearsMore than 3 years
Carrying
Amount
Amount on
which no
impairment
recognised
Amount on
which
impairment
recognised
Impairment
recognised
1,796,472,383
12,251,309
1,032,984
-
-
878,049
1,810,634,725
1,796,472,383
12,251,309
1,032,984
-
-
-
1,809,756,676
Rupees
2017
- - - -
878,049 878,049
- - - - -
878,049 878,049
Past due
Neither over due not impaired
1 - 89 days *90 days - 1 year *1 year - 2 years 2 years - 3 yearsMore than 3 years
Carrying
Amount
Amount on
which no
impairment
recognised
Amount on
which
impairment
recognised
Impairment
recognised
1,532,555,637 6,098,843
- - - 878,049
1,539,532,529
1,532,555,637 6,098,843
- - - -
1,538,654,480
Rupees
2016
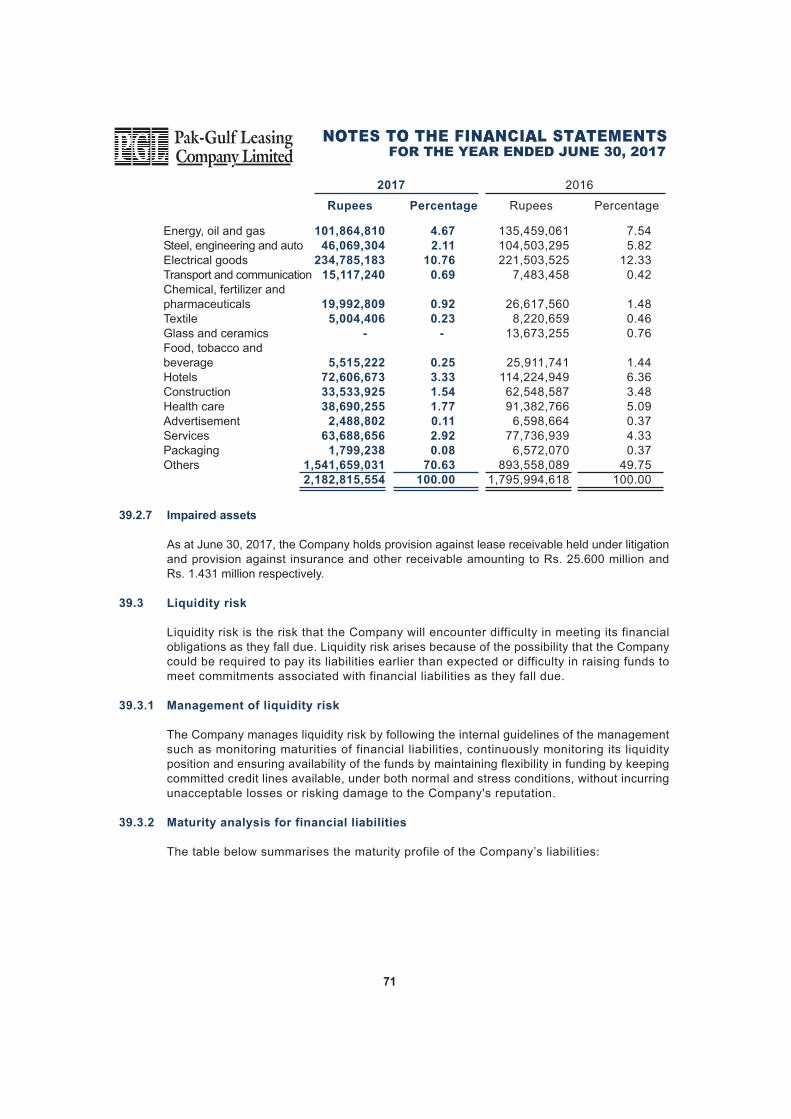
71
39.2.7 Impaired assets
As at June 30, 2017, the Company holds provision against lease receivable held under litigationand provision against insurance and other receivable amounting to Rs. 25.600 million andRs. 1.431 million respectively.
39.3 Liquidity risk
Liquidity risk is the risk that the Company will encounter difficulty in meeting its financialobligations as they fall due. Liquidity risk arises because of the possibility that the Companycould be required to pay its liabilities earlier than expected or difficulty in raising funds tomeet commitments associated with financial liabilities as they fall due.
39.3.1 Management of liquidity risk
The Company manages liquidity risk by following the internal guidelines of the managementsuch as monitoring maturities of financial liabilities, continuously monitoring its liquidityposition and ensuring availability of the funds by maintaining flexibility in funding by keepingcommitted credit lines available, under both normal and stress conditions, without incurringunacceptable losses or risking damage to the Company's reputation.
39.3.2 Maturity analysis for financial liabilities
The table below summarises the maturity profile of the Company�s liabilities:
FOR THE YEAR ENDED JUNE 30, 2017
Energy, oil and gasSteel, engineering and autoElectrical goodsTransport and communicationChemical, fertilizer andpharmaceuticalsTextileGlass and ceramicsFood, tobacco andbeverageHotelsConstructionHealth careAdvertisementServicesPackagingOthers
Rupees Percentage Rupees Percentage
101,864,810
46,069,304
234,785,183
15,117,240
19,992,809
5,004,406
-
5,515,222
72,606,673
33,533,925
38,690,255
2,488,802
63,688,656
1,799,238
1,541,659,031
2,182,815,554
4.67
2.11
10.76
0.69
0.92
0.23
-
0.25
3.33
1.54
1.77
0.11
2.92
0.08
70.63
100.00
2017 2016
135,459,061 104,503,295 221,503,525
7,483,458
26,617,560 8,220,659
13,673,255
25,911,741 114,224,949 62,548,587 91,382,766
6,598,664 77,736,939
6,572,070 893,558,089
1,795,994,618
7.54 5.82
12.33 0.42
1.48 0.46 0.76
1.44 6.36 3.48 5.09 0.37 4.33 0.37
49.75 100.00
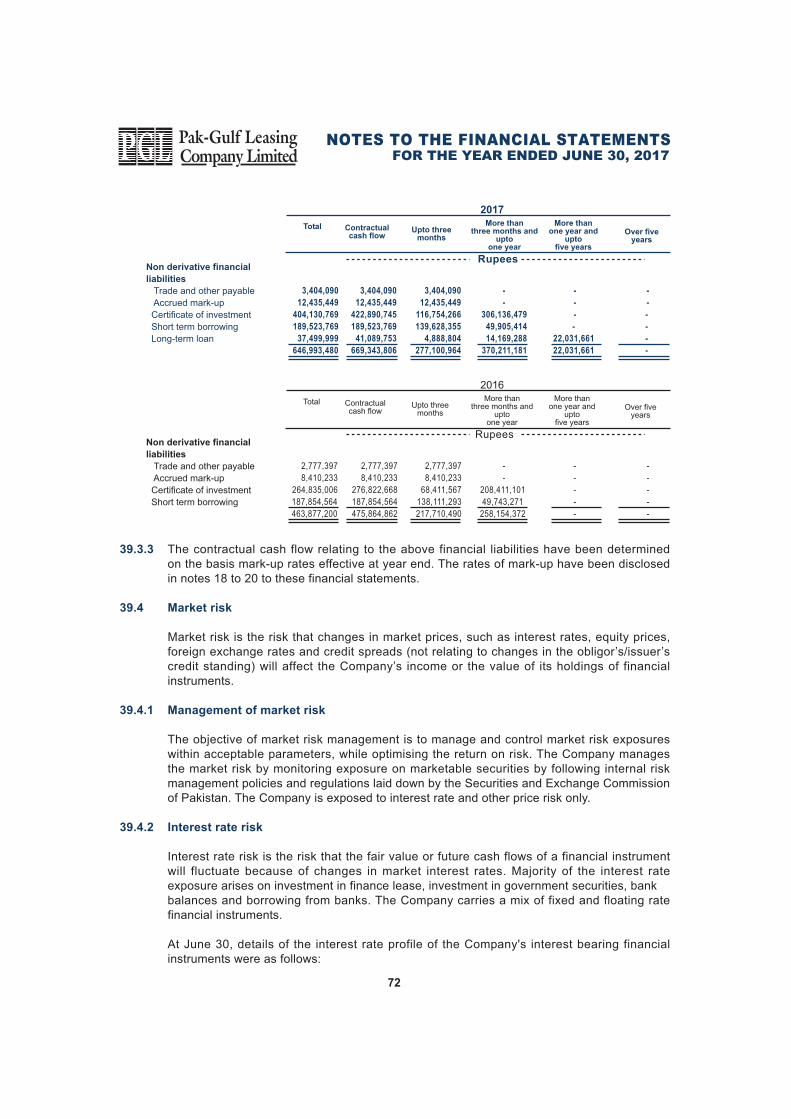
72
FOR THE YEAR ENDED JUNE 30, 2017
39.3.3 The contractual cash flow relating to the above financial liabilities have been determinedon the basis mark-up rates effective at year end. The rates of mark-up have been disclosedin notes 18 to 20 to these financial statements.
39.4 Market risk
Market risk is the risk that changes in market prices, such as interest rates, equity prices,foreign exchange rates and credit spreads (not relating to changes in the obligor�s/issuer�scredit standing) will affect the Company�s income or the value of its holdings of financialinstruments.
39.4.1 Management of market risk
The objective of market risk management is to manage and control market risk exposureswithin acceptable parameters, while optimising the return on risk. The Company managesthe market risk by monitoring exposure on marketable securities by following internal riskmanagement policies and regulations laid down by the Securities and Exchange Commissionof Pakistan. The Company is exposed to interest rate and other price risk only.
39.4.2 Interest rate risk
Interest rate risk is the risk that the fair value or future cash flows of a financial instrumentwill fluctuate because of changes in market interest rates. Majority of the interest rateexposure arises on investment in finance lease, investment in government securities, bank balances and borrowing from banks. The Company carries a mix of fixed and floating ratefinancial instruments.
At June 30, details of the interest rate profile of the Company's interest bearing financialinstruments were as follows:
Total
Rupees
Contractualcash flow
Over fiveyears
2017
Upto threemonths
More thanthree months and
uptoone year
More thanone year and
uptofive years
Non derivative financial
liabilities
Trade and other payable
Accrued mark-up
Certificate of investment
Short term borrowing
Long-term loan
3,404,090
12,435,449
404,130,769
189,523,769
37,499,999
646,993,480
3,404,090
12,435,449
422,890,745
189,523,769
41,089,753
669,343,806
3,404,090
12,435,449
116,754,266
139,628,355
4,888,804
277,100,964
-
-
306,136,479
49,905,414
14,169,288
370,211,181
-
-
-
-
22,031,661
22,031,661
-
-
-
-
-
-
Total
Rupees
Contractualcash flow
Over fiveyears
2016
Upto threemonths
More thanthree months and
uptoone year
More thanone year and
uptofive years
Non derivative financial
liabilities
Trade and other payable
Accrued mark-up
Certificate of investment
Short term borrowing
2,777,397
8,410,233
264,835,006
187,854,564
463,877,200
2,777,397
8,410,233
276,822,668
187,854,564
475,864,862
2,777,397
8,410,233
68,411,567
138,111,293
217,710,490
-
-
208,411,101
49,743,271
258,154,372
-
-
-
-
-
-
-
-
-
-
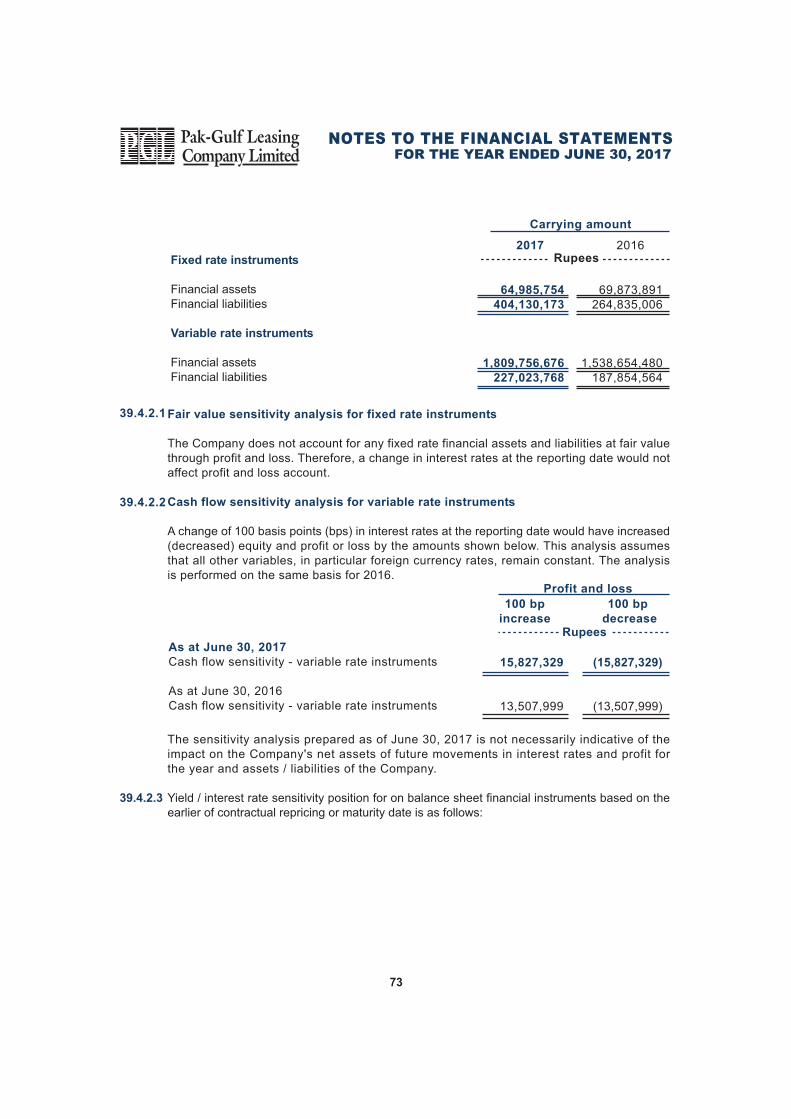
73
FOR THE YEAR ENDED JUNE 30, 2017
100 bp
decrease
(15,827,329)
(13,507,999)
As at June 30, 2017
Cash flow sensitivity - variable rate instruments
As at June 30, 2016Cash flow sensitivity - variable rate instruments
100 bp
increase
15,827,329
13,507,999
Rupees
Profit and loss
The sensitivity analysis prepared as of June 30, 2017 is not necessarily indicative of theimpact on the Company's net assets of future movements in interest rates and profit forthe year and assets / liabilities of the Company.
39.4.2.3 Yield / interest rate sensitivity position for on balance sheet financial instruments based on theearlier of contractual repricing or maturity date is as follows:
Fair value sensitivity analysis for fixed rate instruments
The Company does not account for any fixed rate financial assets and liabilities at fair valuethrough profit and loss. Therefore, a change in interest rates at the reporting date would notaffect profit and loss account.
Cash flow sensitivity analysis for variable rate instruments
A change of 100 basis points (bps) in interest rates at the reporting date would have increased(decreased) equity and profit or loss by the amounts shown below. This analysis assumesthat all other variables, in particular foreign currency rates, remain constant. The analysisis performed on the same basis for 2016.
69,873,891 264,835,006
1,538,654,480 187,854,564
Fixed rate instruments
Financial assetsFinancial liabilities
Variable rate instruments
Financial assetsFinancial liabilities
64,985,754
404,130,173
1,809,756,676
227,023,768
2017 2016Rupees
Carrying amount
39.4.2.1
39.4.2.2
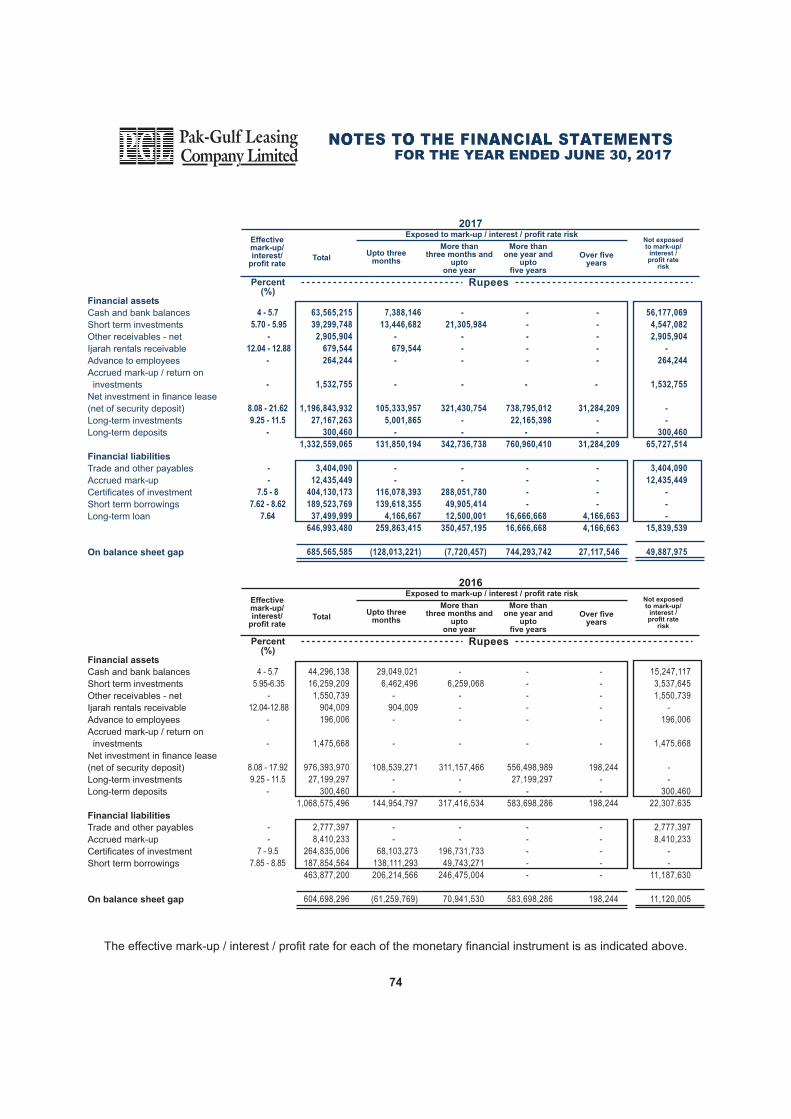
Financial assets
Cash and bank balances
Short term investments
Other receivables - net
Ijarah rentals receivable
Advance to employees
Accrued mark-up / return on
investments
Net investment in finance lease
(net of security deposit)
Long-term investments
Long-term deposits
Financial liabilities
Trade and other payables
Accrued mark-up
Certificates of investment
Short term borrowings
Long-term loan
On balance sheet gap
Effectivemark-up/interest/
profit rate
RupeesPercent(%)
Total
4 - 5.7
5.70 - 5.95
-
12.04 - 12.88
-
-
8.08 - 21.62
9.25 - 11.5
-
-
-
7.5 - 8
7.62 - 8.62
7.64
63,565,215
39,299,748
2,905,904
679,544
264,244
1,532,755
1,196,843,932
27,167,263
300,460
1,332,559,065
3,404,090
12,435,449
404,130,173
189,523,769
37,499,999
646,993,480
685,565,585
7,388,146
13,446,682
-
679,544
-
-
105,333,957
5,001,865
-
131,850,194
-
-
116,078,393
139,618,355
4,166,667
259,863,415
(128,013,221)
-
21,305,984
-
-
-
-
321,430,754
-
-
342,736,738
-
-
288,051,780
49,905,414
12,500,001
350,457,195
(7,720,457)
-
-
-
-
-
-
31,284,209
-
-
31,284,209
-
-
-
-
4,166,663
4,166,663
27,117,546
Over fiveyears
2017
Upto threemonths
More thanthree months and
uptoone year
More thanone year and
uptofive years
Exposed to mark-up / interest / profit rate risk
56,177,069
4,547,082
2,905,904
-
264,244
1,532,755
-
-
300,460
65,727,514
3,404,090
12,435,449
-
-
-
15,839,539
49,887,975
Not exposedto mark-up/
interest /profit rate
risk
-
-
-
-
-
-
738,795,012
22,165,398
-
760,960,410
-
-
-
-
16,666,668
16,666,668
744,293,742
Financial assets
Cash and bank balances
Short term investments
Other receivables - net
Ijarah rentals receivable
Advance to employees
Accrued mark-up / return on
investments
Net investment in finance lease
(net of security deposit)
Long-term investments
Long-term deposits
Financial liabilities
Trade and other payables
Accrued mark-up
Certificates of investment
Short term borrowings
On balance sheet gap
Effectivemark-up/interest/
profit rate
RupeesPercent(%)
Total
4 - 5.7
5.95-6.35
-
12.04-12.88
-
-
8.08 - 17.92
9.25 - 11.5
-
-
-
7 - 9.5
7.85 - 8.85
44,296,138
16,259,209
1,550,739
904,009
196,006
1,475,668
976,393,970
27,199,297
300,460
1,068,575,496
2,777,397
8,410,233
264,835,006
187,854,564
463,877,200
604,698,296
29,049,021
6,462,496
-
904,009
-
-
108,539,271
-
-
144,954,797
-
-
68,103,273
138,111,293
206,214,566
(61,259,769)
-
6,259,068
-
-
-
-
311,157,466
-
-
317,416,534
-
-
196,731,733
49,743,271
246,475,004
70,941,530
-
-
-
-
-
-
198,244
-
-
198,244
-
-
-
-
-
198,244
Over fiveyears
2016
Upto threemonths
More thanthree months and
uptoone year
More thanone year and
uptofive years
Exposed to mark-up / interest / profit rate risk
15,247,117
3,537,645
1,550,739
-
196,006
1,475,668
-
-
300,460
22,307,635
2,777,397
8,410,233
-
-
11,187,630
11,120,005
Not exposedto mark-up/
interest /profit rate
risk
-
-
-
-
-
-
556,498,989
27,199,297
-
583,698,286
-
-
-
-
-
583,698,286
The effective mark-up / interest / profit rate for each of the monetary financial instrument is as indicated above.
74
FOR THE YEAR ENDED JUNE 30, 2017
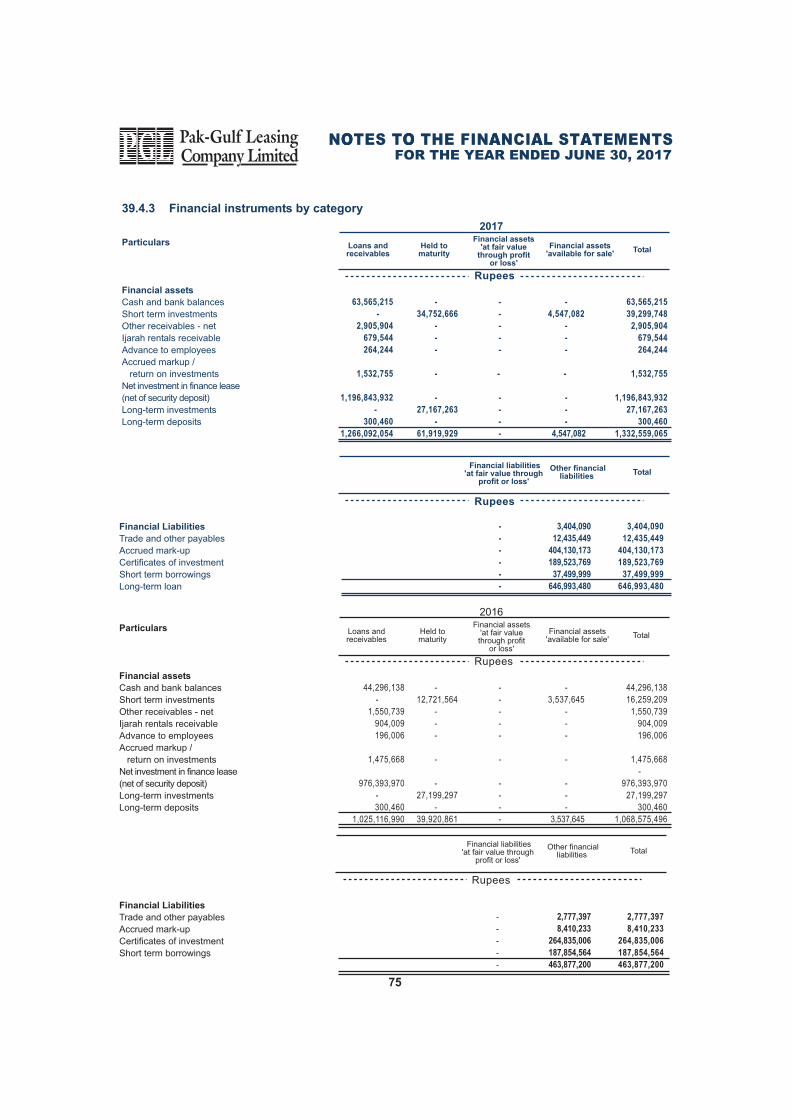
75
FOR THE YEAR ENDED JUNE 30, 2017
Financial Liabilities
Trade and other payables
Accrued mark-up
Certificates of investment
Short term borrowings
Long-term loan
Rupees
-
-
-
-
-
-
3,404,090
12,435,449
404,130,173
189,523,769
37,499,999
646,993,480
Total Financial liabilities
'at fair value throughprofit or loss'
Other financialliabilities
3,404,090
12,435,449
404,130,173
189,523,769
37,499,999
646,993,480
Particulars
Financial assets
Cash and bank balances
Short term investments
Other receivables - net
Ijarah rentals receivable
Advance to employees
Accrued markup /
return on investments
Net investment in finance lease
(net of security deposit)
Long-term investments
Long-term deposits
Rupees
Loans andreceivables
44,296,138
-
1,550,739
904,009
196,006
1,475,668
976,393,970
-
300,460
1,025,116,990
-
12,721,564
-
-
-
-
-
27,199,297
-
39,920,861
-
-
-
-
-
-
-
-
-
-
44,296,138
16,259,209
1,550,739
904,009
196,006
1,475,668
-
976,393,970
27,199,297
300,460
1,068,575,496
Total
2016
Held tomaturity
Financial assets'at fair valuethrough profit
or loss'
Financial assets'available for sale'
-
3,537,645
-
-
-
-
-
-
-
3,537,645
Financial instruments by category39.4.3
Particulars
Financial assets
Cash and bank balances
Short term investments
Other receivables - net
Ijarah rentals receivable
Advance to employees
Accrued markup /
return on investments
Net investment in finance lease
(net of security deposit)
Long-term investments
Long-term deposits
Rupees
Loans andreceivables
63,565,215
-
2,905,904
679,544
264,244
1,532,755
1,196,843,932
-
300,460
1,266,092,054
-
34,752,666
-
-
-
-
-
27,167,263
-
61,919,929
-
-
-
-
-
-
-
-
-
-
63,565,215
39,299,748
2,905,904
679,544
264,244
1,532,755
1,196,843,932
27,167,263
300,460
1,332,559,065
Total
2017
Held tomaturity
Financial assets'at fair value
through profitor loss'
Financial assets'available for sale'
-
4,547,082
-
-
-
-
-
-
-
4,547,082
Financial Liabilities
Trade and other payables
Accrued mark-up
Certificates of investment
Short term borrowings
Rupees
-
-
-
-
-
Total Financial liabilities
'at fair value throughprofit or loss'
Other financialliabilities
2,777,397
8,410,233
264,835,006
187,854,564
463,877,200
2,777,397
8,410,233
264,835,006
187,854,564
463,877,200
76
FOR THE YEAR ENDED JUNE 30, 2017
40.1 Financial risk management objectives and policies
The Company finances its operations through equity, borrowings and management of its workingcapital with a view to maintaining an appropriate mix between various sources of finance tominimise liquidity risk. Taken as a whole, the Company's risk arising from financial instrumentsis limited as there is no significant exposure to price and cash flow risk in respect of suchinstruments.
41. SEGMENT INFORMATION
The Company has two primary reporting segments namely, "Finance lease" and "Ijarah finance",based on the mode of finance, related risks and returns associated with the segments andreporting of income and expenditure in accordance with the applicable accounting standards asdisclosed in Note 2.1. Other operations, which are not deemed by management to be sufficientlysignificant to disclose as separate items and do not fall into the above segment categories, arereported under �Others�.
39.5 Price risk
Price risk is the risk that the fair value or future cash flows of a financial instrument will fluctuatebecause of changes in market prices (other than those arising from interest risk or currency risk)whether those changes are caused by factors specific to the individual financial instrument orits issuer, or factors affecting all similar financial instruments traded in the market. Presently, theCompany is not exposed to equity securities price risk as the Company does not hold any equitysecurities as at June 30, 2017.
However, the Company holds National Investment Trust units, exposing the Company to cashflow market risk. In case of one percent increase / decrease in the net assets value of such unitsas on June 30, 2017, with all other variables held constant, the net assets of the Company andtotal comprehensive income for the year would have been higher / lower by Rs. 45,471 (2016:Rs. 35,376).
40. CAPITAL RISK MANAGEMENT
The Company's prime objective when managing capital is to safeguard its ability to continue asa going concern in order to provide adequate returns for shareholders and benefits for otherstakeholders and to maintain an optimal capital structure to reduce its cost of capital.
Consistent with others in the industry, the Company monitors capital on the basis of the gearingratio. This ratio is calculated as total debt divided by total capital employed:
452,689,570545,305,956997,995,526
45.36%
Total debtTotal equityTotal capital employed
Gearing ratio
631,153,941
581,720,337
1,212,874,278
52.04%
2017
Rupees
2016
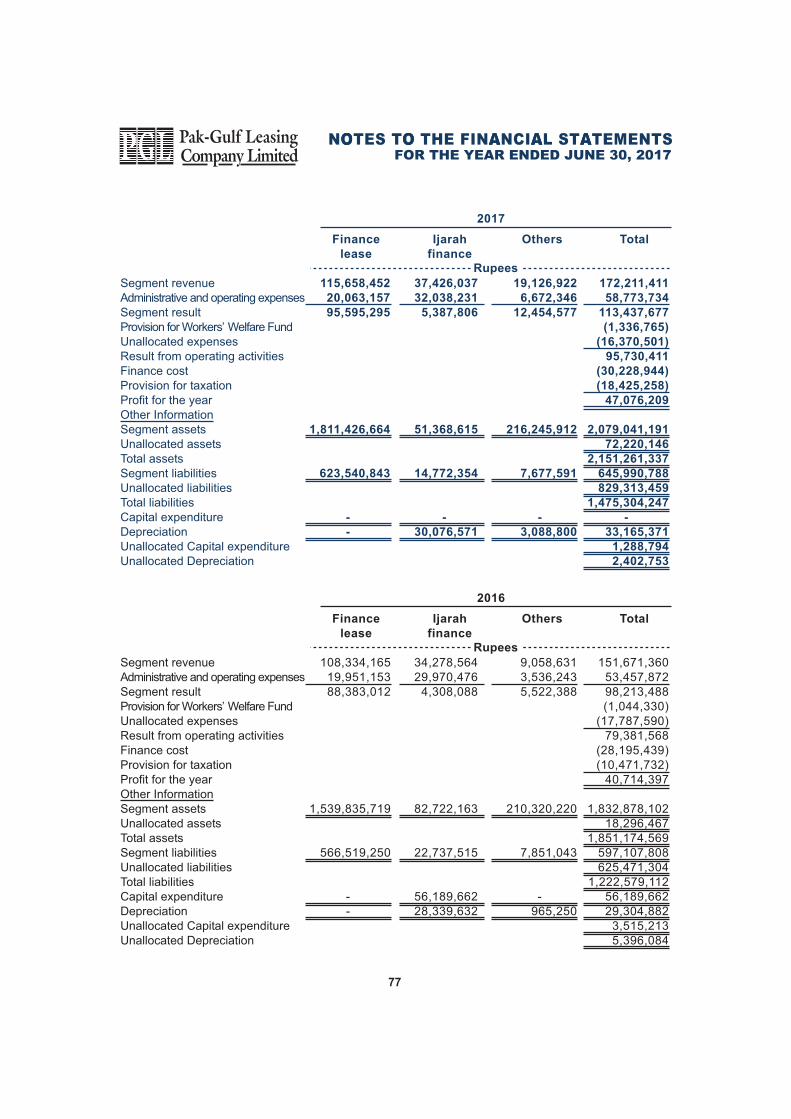
77
FOR THE YEAR ENDED JUNE 30, 2017
172,211,411
58,773,734
113,437,677
(1,336,765)
(16,370,501)
95,730,411
(30,228,944)
(18,425,258)
47,076,209
2,079,041,191
72,220,146
2,151,261,337
645,990,788
829,313,459
1,475,304,247
-
33,165,371
1,288,794
2,402,753
19,126,922
6,672,346
12,454,577
216,245,912
7,677,591
-
3,088,800
Segment revenueAdministrative and operating expensesSegment resultProvision for Workers� Welfare FundUnallocated expensesResult from operating activitiesFinance costProvision for taxationProfit for the yearOther InformationSegment assetsUnallocated assetsTotal assetsSegment liabilitiesUnallocated liabilitiesTotal liabilitiesCapital expenditureDepreciationUnallocated Capital expenditureUnallocated Depreciation
Finance
lease
Ijarah
finance
Others Total
115,658,452
20,063,157
95,595,295
1,811,426,664
623,540,843
-
-
37,426,037
32,038,231
5,387,806
51,368,615
14,772,354
-
30,076,571
Rupees
2017
151,671,360 53,457,872 98,213,488 (1,044,330)
(17,787,590) 79,381,568
(28,195,439) (10,471,732)
40,714,397
1,832,878,102 18,296,467
1,851,174,569 597,107,808 625,471,304
1,222,579,112 56,189,662 29,304,882
3,515,213 5,396,084
9,058,631 3,536,243 5,522,388
210,320,220
7,851,043
- 965,250
Segment revenueAdministrative and operating expensesSegment resultProvision for Workers� Welfare FundUnallocated expensesResult from operating activitiesFinance costProvision for taxationProfit for the yearOther InformationSegment assetsUnallocated assetsTotal assetsSegment liabilitiesUnallocated liabilitiesTotal liabilitiesCapital expenditureDepreciationUnallocated Capital expenditureUnallocated Depreciation
Finance
lease
Ijarah
finance
Others Total
108,334,165 19,951,153 88,383,012
1,539,835,719
566,519,250
- -
34,278,564 29,970,476
4,308,088
82,722,163
22,737,515
56,189,662 28,339,632
Rupees
2016

78
FOR THE YEAR ENDED JUNE 30, 2017
42. FAIR VALUE OF FINANCIAL INSTRUMENTS
Fair value is the amount for which an asset could be exchanged, or a liability settled, betweenknowledgeable, willing parties in an arm�s length transaction. The carrying values of the financialassets and financial liabilities approximate their fair values except for investments held to maturityand leases at fixed rate of return. The fair value of leases at fixed rate of return cannot bereasonably estimated due to absence of market for such leases. The fair value of held-to-maturityinvestments is disclosed in note 6 and note 11.
The Company's accounting policy on fair value measurements is discussed in note 4.1.
The Company measures fair values using the following fair value hierarchy that reflects thesignificance of the inputs used in making the measurements:
Level 1: Fair value measurements using quoted prices (unadjusted) in active markets for identicalassets or liabilities.
Level 2: Fair value measurements using inputs other than quoted prices included within Level1 that are observable for the asset or liability, either directly (i.e. as prices) or indirectly(i.e. derived from prices).
Level 3: Fair value measurements using inputs for the asset or liability that are not based onobservable market data (i.e. unobservable inputs).
As at June 30, 2017, short term investments - available for sale amounting to Rs. 4.55 million(2016: Rs. 3.54 million), mentioned in note 6, were categorised in level 1. Revaluation ratesannounced by Mutual Funds Association of Pakistan (MUFAP) are used to determine fair valueof investment in mutual funds categorised as 'available for sale'.
Transfer between levels of the fair value hierarchy are recognised at the end of the reportingyear during which the changes have occurred. However, there were no transfers between levelsof fair value hierarchy during the year.
43. NON-ADJUSTING EVENTS AFTER THE BALANCE SHEET DATE
The Board of Directors in its meeting held on September 18, 2017 proposed a final dividend ofRs. 0.75 per share (2016: Rs. 0.5 per share) for the year ended June 30, 2017, amounting toRs. 19.03 million (2016: Rs. 12.68 million) for approval of members at the Annual GeneralMeeting to be held on October 26, 2017. These financial statements do not reflect the impactof this proposed dividend.
44. DATE OF AUTHORISATION FOR ISSUE
These financial statements were authorised for issue on September 18, 2017 by the Board ofDirectors of the Company.
Chief Executive Officer Chief Financial OfficerDirector
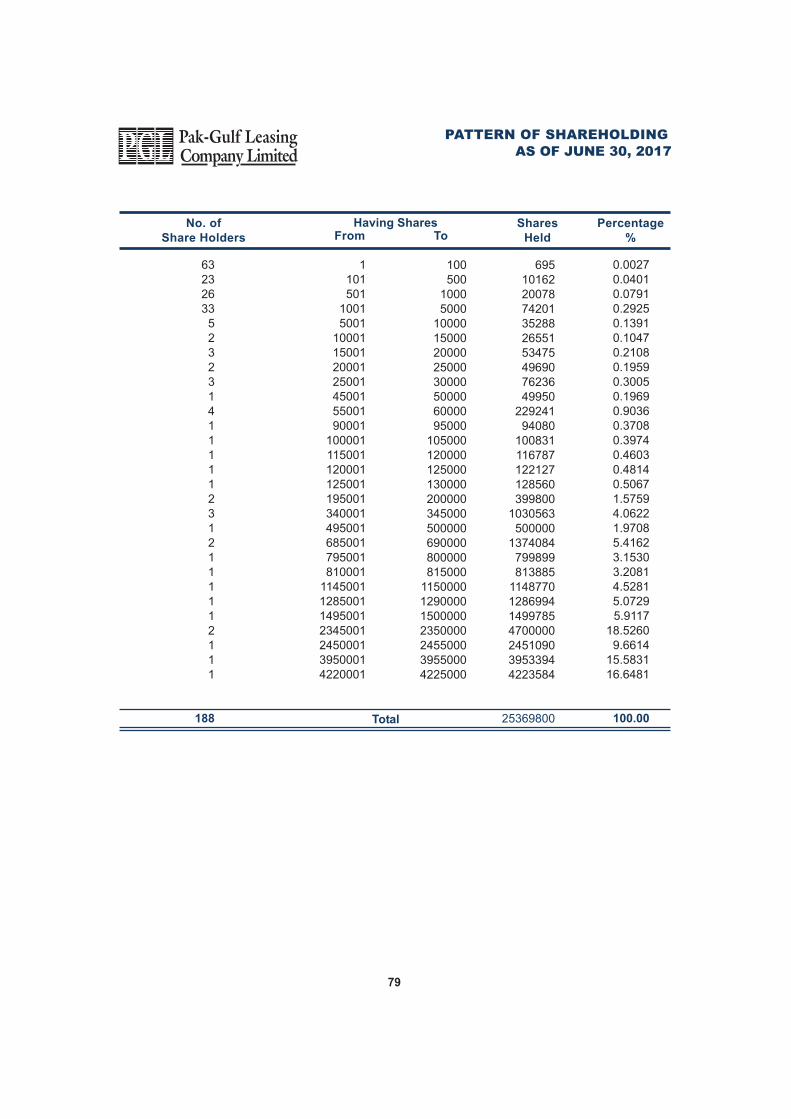
0.00270.04010.07910.29250.13910.10470.21080.19590.30050.19690.90360.37080.39740.46030.48140.50671.57594.06221.97085.41623.15303.20814.52815.07295.9117
18.52609.6614
15.583116.6481
100.00
695101622007874201352882655153475496907623649950
22924194080
100831116787122127128560399800
1030563500000
1374084799899813885
1148770128699414997854700000245109039533944223584
25369800
100500
10005000
1000015000200002500030000500006000095000
105000120000125000130000200000345000500000690000800000815000
1150000129000015000002350000245500039550004225000
1101501
10015001
10001150012000125001450015500190001
100001115001120001125001195001340001495001685001795001810001
1145001128500114950012345001245000139500014220001
63232633
5232314111112312111112111
188
No. of
Share Holders From ToShares
Held
Percentage
%
Having Shares
AS OF JUNE 30, 2017
79
PATTERN OF SHAREHOLDING
Total
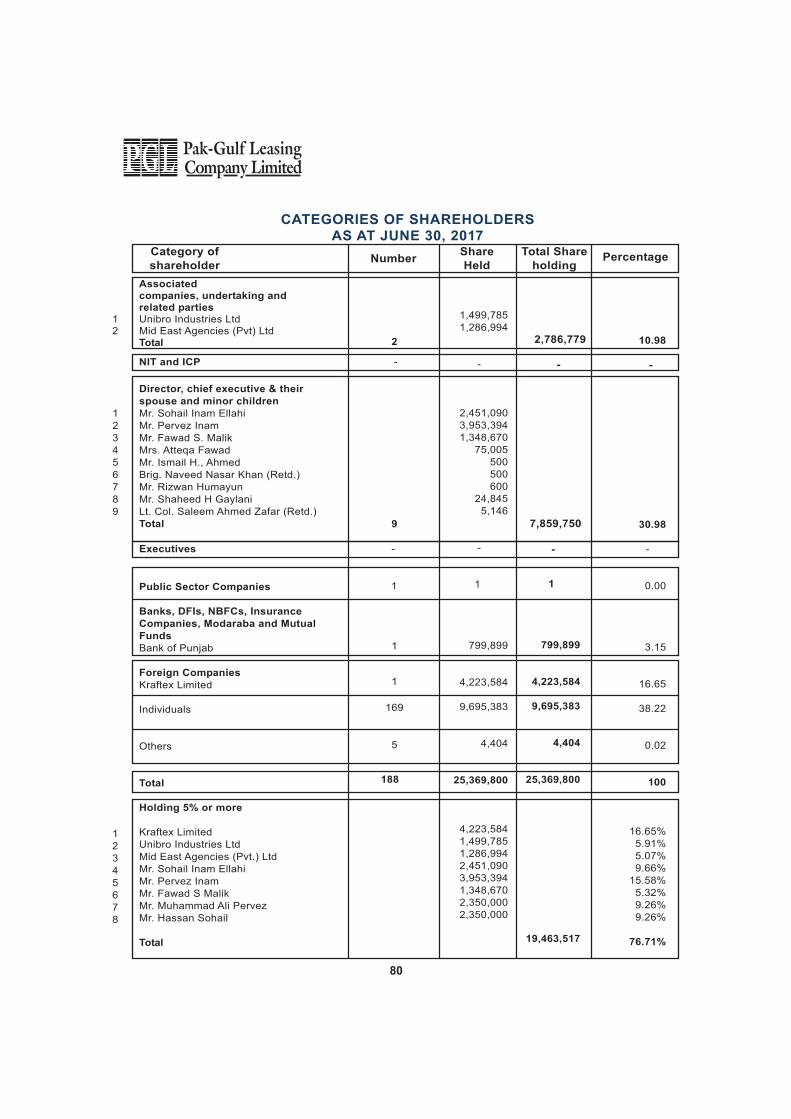
80
Holding 5% or more
Kraftex LimitedUnibro Industries LtdMid East Agencies (Pvt.) LtdMr. Sohail Inam EllahiMr. Pervez InamMr. Fawad S MalikMr. Muhammad Ali PervezMr. Hassan Sohail
Total
Associated
companies, undertaking and
related parties
Unibro Industries LtdMid East Agencies (Pvt) LtdTotal
CATEGORIES OF SHAREHOLDERS
AS AT JUNE 30, 2017
Public Sector Companies
Banks, DFIs, NBFCs, Insurance
Companies, Modaraba and Mutual
Funds
Bank of Punjab
Foreign Companies
Kraftex Limited
Individuals
Others
Total
Director, chief executive & their
spouse and minor children
Mr. Sohail Inam EllahiMr. Pervez InamMr. Fawad S. MalikMrs. Atteqa FawadMr. Ismail H., AhmedBrig. Naveed Nasar Khan (Retd.)Mr. Rizwan HumayunMr. Shaheed H GaylaniLt. Col. Saleem Ahmed Zafar (Retd.)Total 9
123456789
NIT and ICP -
Category of
shareholder
Share
HeldPercentageNumber
Total Share
holding
1,499,785 1,286,994
-
2,451,090 3,953,394 1,348,670
75,005 500 500 600
24,845 5,146
-
1
799,899
4,223,584
9,695,383
4,404
25,369,800
4,223,584 1,499,785 1,286,994 2,451,090 3,953,394 1,348,670 2,350,000 2,350,000
2,786,779
-
2 10.98
-
30.98
-
0.00
3.15
16.65
38.22
0.02
100
16.65%5.91%5.07%9.66%
15.58%5.32%9.26%9.26%
76.71%
12
Executives
1
169
1
5
12345678
-
188
1
-
1
799,899
4,223,584
9,695,383
4,404
25,369,800
19,463,517
7,859,750
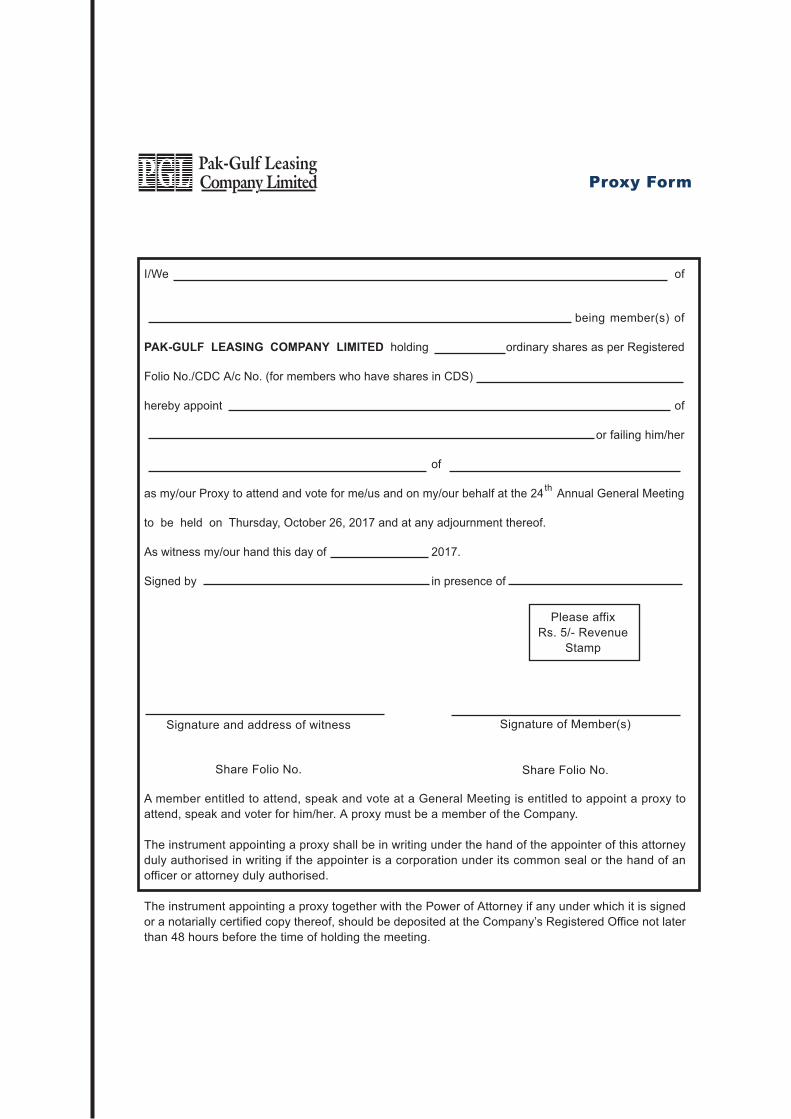
I/We of
being member(s) of
PAK-GULF LEASING COMPANY LIMITED holding ordinary shares as per Registered
Folio No./CDC A/c No. (for members who have shares in CDS)
hereby appoint of
or failing him/her
of
as my/our Proxy to attend and vote for me/us and on my/our behalf at the 24 Annual General Meeting
to be held on Thursday, October 26, 2017 and at any adjournment thereof.
As witness my/our hand this day of 2017.
Signed by in presence of
Please affix
Rs. 5/- Revenue
Stamp
Signature of Member(s)Signature and address of witness
Share Folio No. Share Folio No.
A member entitled to attend, speak and vote at a General Meeting is entitled to appoint a proxy to
attend, speak and voter for him/her. A proxy must be a member of the Company.
The instrument appointing a proxy shall be in writing under the hand of the appointer of this attorney
duly authorised in writing if the appointer is a corporation under its common seal or the hand of an
officer or attorney duly authorised.
The instrument appointing a proxy together with the Power of Attorney if any under which it is signed
or a notarially certified copy thereof, should be deposited at the Company�s Registered Office not later
than 48 hours before the time of holding the meeting.
th
24
2017