Credit, productivity and reallocation of resources · 1 Credit, productivity and reallocation of...
16
1 Credit, productivity and reallocation of resources∗ Jens Matthias Arnold OECD Economics Department † Lisandra Flach University of Munich, CESifo and CEPR ‡ June 26, 2018 Abstract Many enterprises in emerging market economies suffer from difficulties in accessing credit. But what happens when access to credit improves? This paper exploits Brazil’s 2005 bankruptcy reform, which strengthened creditor protection and resulted in a substantial acceleration of credit and investment growth. Our analysis goes beyond average effects and examines to what extent improving access to credit affected the allocation of resources across firms of different productivity levels. We find evidence that the reform was particularly effective in alleviating credit constraints for high-productivity firms. After the reform, better access to credit allowed these firms to thrive on the expense of others. Our results suggest that better access to credit can improve the allocation of resources across firms, thus raising aggregate productivity. Keywords: TFP, access to credit, credit reform, heterogeneous firms. JEL Classification: G33, O16, F12. * We thank seminar participants of the RIDGE Forum “Productivity and Growth” in Rio de Janeiro, at Brazil’s National Development Bank, the ECB conference on "Economic Growth and Income Convergence" in Izmir, Turkey; the 16th Workshop “Internationale Wirtschaftsbeziehungen” in Göttingen, the European Trade Study Group 2015 and the “IO and Trade Seminar” in Munich for helpful comments and suggestions. Financial support from the Deutsche Forschungsgemeinschaft through SFB TR15 is gratefully acknowledged. The views reflected in this paper are those of the authors and should not be attributed to the OECD or its member countries. † OECD Economics Department, 2 rue André Pascal, 75775 Paris Cedex 16, France. Tel: +331 4524 8722, [email protected]. ‡ Department of Economics, D-80539 Muenchen, Germany; Tel.: (+49) 2180 - 2277; e-mail: [email protected].
-
Upload
nguyendieu -
Category
Documents
-
view
218 -
download
0
Transcript of Credit, productivity and reallocation of resources · 1 Credit, productivity and reallocation of...
1
Credit, productivity and reallocation of resources∗
Jens Matthias Arnold
OECD Economics Department†
Lisandra Flach
University of Munich, CESifo and CEPR ‡
June 26, 2018
Abstract
Many enterprises in emerging market economies suffer from difficulties in accessing
credit. But what happens when access to credit improves? This paper exploits Brazil’s 2005
bankruptcy reform, which strengthened creditor protection and resulted in a substantial
acceleration of credit and investment growth. Our analysis goes beyond average effects and
examines to what extent improving access to credit affected the allocation of resources
across firms of different productivity levels. We find evidence that the reform was
particularly effective in alleviating credit constraints for high-productivity firms. After the
reform, better access to credit allowed these firms to thrive on the expense of others. Our
results suggest that better access to credit can improve the allocation of resources across
firms, thus raising aggregate productivity.
Keywords: TFP, access to credit, credit reform, heterogeneous firms.
JEL Classification: G33, O16, F12.
*We thank seminar participants of the RIDGE Forum “Productivity and Growth” in Rio de Janeiro, at Brazil’s
National Development Bank, the ECB conference on "Economic Growth and Income Convergence" in Izmir, Turkey;
the 16th Workshop “Internationale Wirtschaftsbeziehungen” in Göttingen, the European Trade Study Group 2015 and
the “IO and Trade Seminar” in Munich for helpful comments and suggestions. Financial support from the Deutsche
Forschungsgemeinschaft through SFB TR15 is gratefully acknowledged. The views reflected in this paper are those
of the authors and should not be attributed to the OECD or its member countries. †OECD Economics Department, 2 rue André Pascal, 75775 Paris Cedex 16, France. Tel: +331 4524 8722,
[email protected]. ‡ Department of Economics, D-80539 Muenchen, Germany; Tel.: (+49) 2180 - 2277; e-mail:
2
1. Introduction
Firms that face difficulties in access to credit are likely to be constraint in their ability to invest
in productivity-enhancing projects. While this would in principle hold for most firms, high-
performing firms may forego particularly high-return projects due to financial frictions. In this
case, progress in financial development may not only improve the productivity of the average
firm, but also the allocation of resources across firms with different productivity levels. The
importance of resource reallocations for aggregate productivity has been the subject of extensive
research, particularly for emerging market economies (Hsieh and Klenow, 2009). For Brazil, for
example, estimates suggest potential productivity gains from a reallocation of resources on the
order of 40% (Busso et al, 2013). Against this background, the potential contribution of deeper
credit markets to growth could be substantially higher than often assumed, to the extent that
financial development also plays a role for fostering the migration of resources to high-
performing firms.
This paper investigates the reallocation effects of better access to credit using the example of
Brazil, where a legal reform in 2005 strengthened the rights of creditors and lowered credit risk.
Low levels of creditor protection through the legal system have often been touted as one
important factor behind difficulties in access to credit in emerging economies (Safavian 2007,
Djankov et al. 2008).1
The Brazilian bankruptcy law reform from 2005 ensured creditors a more rapid liquidation of
distressed firms and allocated higher priority for secured creditors vis-à-vis workers and tax
authorities. Following the reform, recovery rates rose substantially. Concomitantly, both credit
expansion and business investment growth accelerated markedly (see Araujo, Ferreira and
Funchal, 2012; Ponticelli and Alencar, 2016).
In this paper, we are particularly interested in how the credit reform affected the reallocation of
resources across firms. We use the 2005 reform in Brazil as a source of exogenous variation to
investigate the effect on firm productivity and on the allocation of resources. The discrete timing
of the reform and the fact that it was largely unanticipated allow estimating a difference-in-
differences model, comparing initial high-preforming firms to other firms across the pre- and
post-reform periods.
Our results reveal that initially more productive firms reaped stronger benefits from the reform
than others. This suggests that credit reforms can play a role in improving the allocation of
1 Across countries, creditor protection is positively correlated with the development of credit markets (La Porta et al.,
1997; Djankov et al., 2007).
3
resources across firms. This finding is robust to using alternative measures of productivity and
cannot be explained by possible pre-existing trends.
This paper is structured as follows. Section 2 reviews the related literature while section 3
describes the Brazilian insolvency reform. Section 4 describes our data and section 5 presents
the empirical strategy and results. Section 6 explores the robustness of our findings followed by
a conclusion in the last section.
2. Related literature
Our paper contributes to the literature on credit constraints and the allocation of resources across
firms. Several studies have documented substantial differences across firms with respect to
productivity, even within narrowly defined sectors (for a general survey see Syverson, 2011; for
evidence for Brazil see De Negri and Ferreira, 2015; Gomes and Ribeiro, 2015). Especially in
emerging market economies, aggregate productivity could often be significantly higher if less
resources were trapped in low-productivity enterprises (Hsieh and Klenow, 2009). To the extent
that credit constraints may be one possible explanation behind this, improving access to credit
may help to foster a reallocation of resources towards more productive firms. Empirical work
confirms this role for credit constraints in preventing firms from investing in better technologies,
suggesting that they can stand in the way of a better allocation of resources (Banerjee and Moll
2010, Buera et al. 2011 and Caselli and Gennaioli 2011).
Our finding can be interpreted as one possible channel through which the widely documented
aggregate positive links between financial development and different aspects of private sector
performance, including investment, innovation activities, productivity and growth, materialize
(Rajan and Zingales 1998, Braun 2003, Beck 2002, Beck 2003).
The positive reallocation effects of better access to credit that we find can be rationalized by
recent theoretical work on heterogeneous firms in the spirit of Melitz (2003). Based on the
Melitz (2003) framework of heterogeneous firms, Bustos (2011) and Ponticelli and Alencar
(2016) present models where firms of heterogeneous productivity levels face fixed costs to
invest in a better technology that reduces marginal costs. To adopt that high technology, they
must borrow from financial intermediaries. Whether a given firm can borrow enough to pay this
fixed cost depends on the initial productivity of the firm, so that more productive firms are more
likely to undertake productivity-enhancing investments. Ponticelli and Alencar (2016) explicitly
model creditor protection rights. In their model, stronger creditor protection allows more firms
to borrow for productivity-enhancing investment. Those that gain access to credit due to stronger
creditor protection are the most productive ones among the previously credit-constrained firms.
In other words, the principal beneficiaries in terms of growth are firms with above-average
4
productivity, thus shifting the aggregate allocation of resources towards more productive firms.
Moreover, our analysis also bears similarities to recent work that links credit constraints to
participation in international trade. Chaney (2016) models how overcoming credit constraints
allows firms to pay the fixed costs necessary for engaging in export activities. Similarly, the
interaction between credit constraints and firm productivity affects the selection of firms into
exports in Manova (2013). Empirical work has confirmed the notion that more credit-
constrained firms are less likely to export and/or export less at the intensive margin (Minetti and
Zhu 2011 and Berman and Héricout 2010).
With respect to the specific case of Brazil that we analyze, our paper is related to Araújo et al.
(2012) and Ponticelli and Alencar (2016), who look at the same Brazilian creditor reform. The
former document higher average loan maturities and lower borrowing costs after the reform,
while the latter show that differences in court enforcement across municipalities led to
differential effects of the reform on firm investment and size across these municipalities. What
distinguishes our work from previous analyses of this specific reform episode is that we detect
differential effects across firms, with implications for the reallocation of resources across firms.
3. Brazil’s 2005 insolvency reform
Prior to 2005, Brazil’s bankruptcy law made it very difficult for secured creditors to claim assets
pledged as collateral for corporate loans. Secured creditors’ claims were treated as subordinate
to both workers and tax authorities, and the liquidation process was slow and ineffective (Araújo
et al., 2012). As remaining assets from insolvencies often depreciate rapidly, their speedy
liquidation is often a crucial factor for loan recovery rates.
The new bankruptcy legislation introduced in June 2005 was directly aimed at improving
creditor rights and access to finance. The new law significantly reduced judicial uncertainty and
raised the priority of secured creditors, by giving them preference over tax authorities and
limiting the amount paid for each worker. Moreover, a distressed firm could be now sold before
the creditors’ list was constituted, which further helped to speed up the liquidation process. The
effects of the new law, which is discussed in detail by Araújo and Funchal (2005), were highly
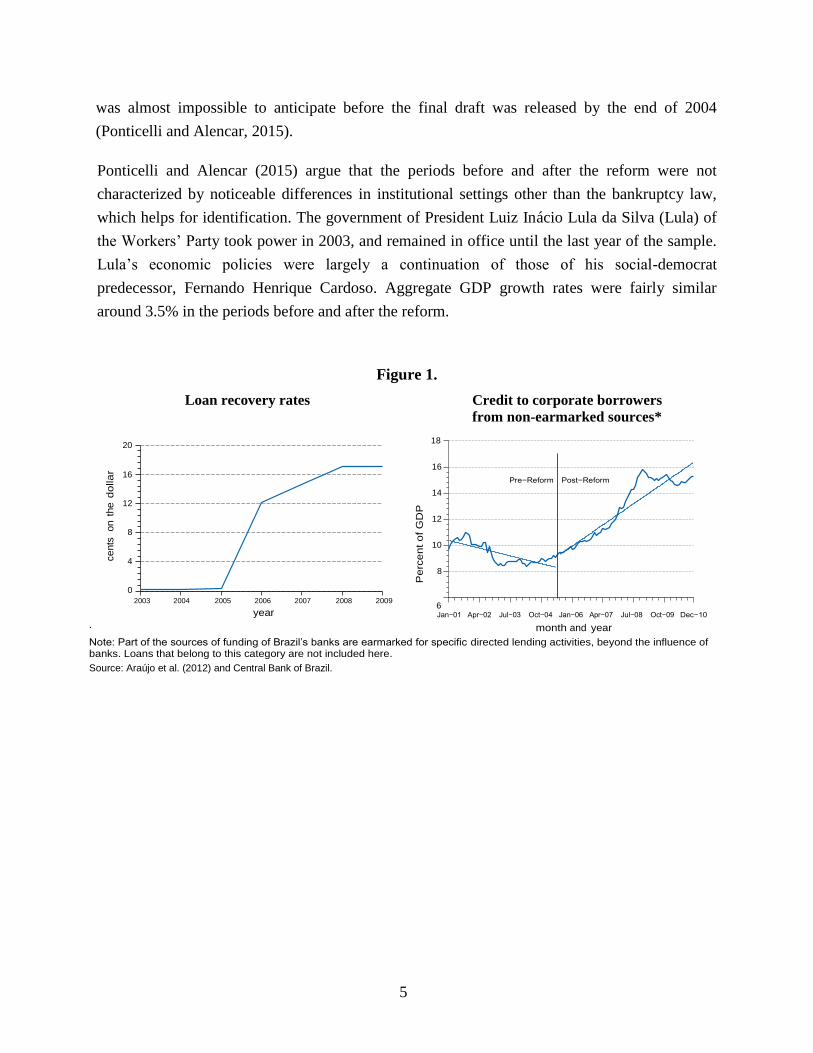
visible: Recovery rates jumped from almost zero to 12% within one year and private credit to
corporate borrowers rose substantially in its aftermath (Figure 1).
The exact nature of the new bankruptcy laws took most observers by surprise, which lends
significant exogeneity to the reform. Political divisions between tax authorities who feared
revenue losses and private lenders made it highly doubtful that creditors would obtain seniority
over tax authorities, for example. As a result of this power struggle, the content of the reform
5
ce
nts
on t
he
do
lla
r
Pe
rce
nt
of
GD
P
was almost impossible to anticipate before the final draft was released by the end of 2004
(Ponticelli and Alencar, 2015).
Ponticelli and Alencar (2015) argue that the periods before and after the reform were not
characterized by noticeable differences in institutional settings other than the bankruptcy law,
which helps for identification. The government of President Luiz Inácio Lula da Silva (Lula) of
the Workers’ Party took power in 2003, and remained in office until the last year of the sample.
Lula’s economic policies were largely a continuation of those of his social-democrat
predecessor, Fernando Henrique Cardoso. Aggregate GDP growth rates were fairly similar
around 3.5% in the periods before and after the reform.
Figure 1.
Loan recovery rates Credit to corporate borrowers
from non-earmarked sources*
20 18
16
16 Pre−Reform Post−Reform
14
12
12
8
10
4 8
0
2003 2004 2005 2006 2007 2008 2009
year
.
6 Jan−01 Apr−02 Jul−03 Oct−04 Jan−06 Apr−07 Jul−08 Oct−09 Dec−10
month and year
Note: Part of the sources of funding of Brazil’s banks are earmarked for specific directed lending activities, beyond the influence of banks. Loans that belong to this category are not included here.
Source: Araújo et al. (2012) and Central Bank of Brazil.
6
4. Data
We use firm-level data from the commercially available ORBIS database, published by the
private company Bureau van Dyke, for the period 2000-2010. The data contain annual balance
sheet data as well as profits and loss accounts and allow us to obtain measures of total factor
productivity (TFP) for a sample of 1,736 firms over the period 2000-2010. More details on the
firm-level data are provided in the appendix.
In order to estimate productivity, we use value-added to measure output from two input factors,
labor and capital. Nominal values are deflated using industry-specific deflators at the 2-digit level
and a capital deflator. We measure TFP using a multilateral index suggested by Aw, Chen and
Roberts (2001), which builds on Caves and Diewert (1982a, 1982b). This index expresses each
individual plant’s output and inputs as deviations from a reference firm, which employs geometric
means of logarithmic inputs and logarithmic output and of input costs shares. This guarantees that
comparisons between any two plant-year observations are transitive and hence allows for
consistent comparisons of TFP in firm-level data with a panel structure. The TFP index approach
allows for flexible and heterogeneous production technology, and has also been used, for
instance, in Arnold and Javorcik (2009) and Griffith et al. (2004).2
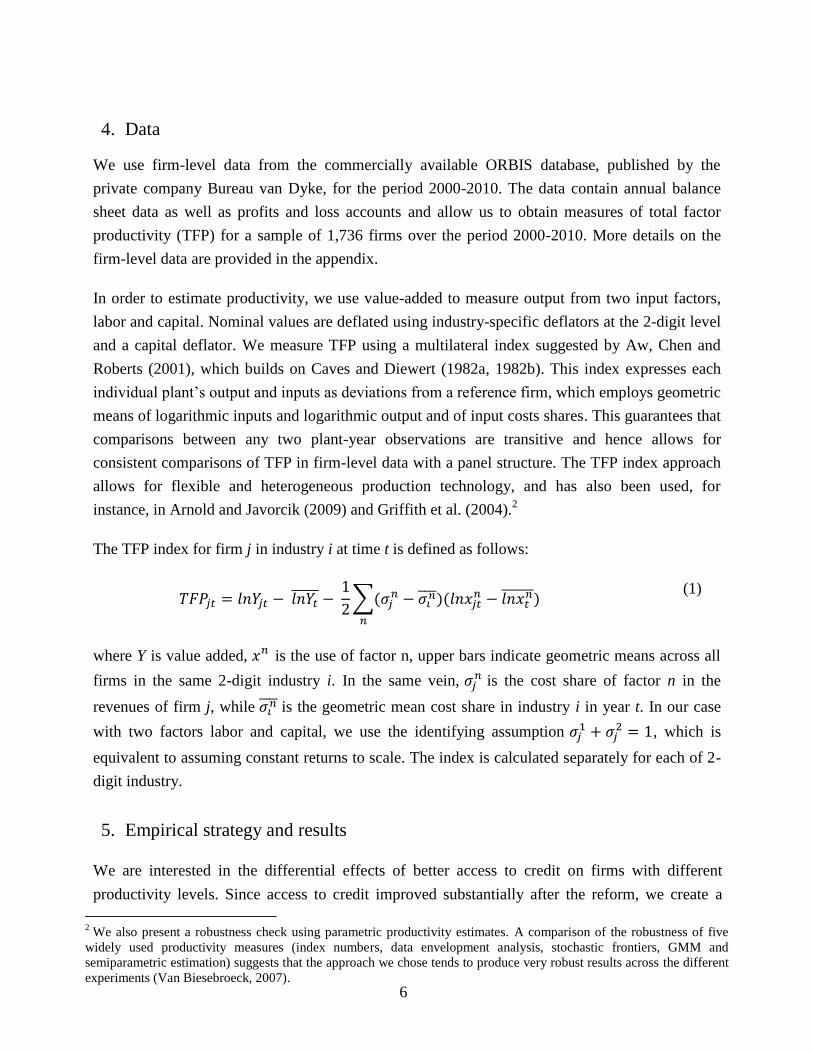
The TFP index for firm j in industry i at time t is defined as follows:
𝑇𝐹𝑃𝑗𝑡 = 𝑙𝑛𝑌𝑗𝑡 − 𝑙𝑛𝑌𝑡̅̅ ̅̅ ̅ −
1
2∑(𝜎𝑗
𝑛 − 𝜎𝑖𝑛̅̅̅̅ )(𝑙𝑛𝑥𝑗𝑡
𝑛 − 𝑙𝑛𝑥𝑡𝑛̅̅ ̅̅ ̅̅ )
𝑛
(1)
where Y is value added, 𝑥𝑛 is the use of factor n, upper bars indicate geometric means across all
firms in the same 2-digit industry i. In the same vein, 𝜎𝑗𝑛 is the cost share of factor n in the
revenues of firm j, while 𝜎𝑖𝑛̅̅̅̅ is the geometric mean cost share in industry i in year t. In our case
with two factors labor and capital, we use the identifying assumption 𝜎𝑗1 + 𝜎𝑗
2 = 1, which is
equivalent to assuming constant returns to scale. The index is calculated separately for each of 2-
digit industry.
5. Empirical strategy and results
We are interested in the differential effects of better access to credit on firms with different
productivity levels. Since access to credit improved substantially after the reform, we create a
2 We also present a robustness check using parametric productivity estimates. A comparison of the robustness of five
widely used productivity measures (index numbers, data envelopment analysis, stochastic frontiers, GMM and
semiparametric estimation) suggests that the approach we chose tends to produce very robust results across the different
experiments (Van Biesebroeck, 2007).
7
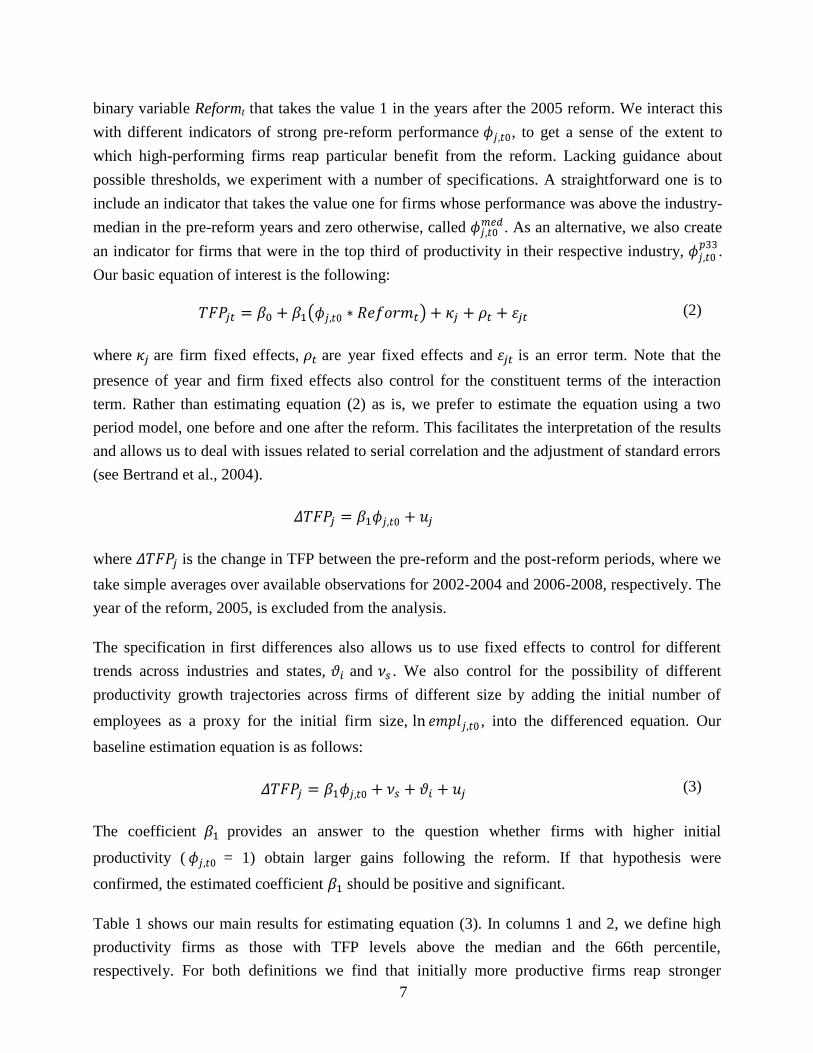
binary variable Reformt that takes the value 1 in the years after the 2005 reform. We interact this
with different indicators of strong pre-reform performance 𝜙𝑗,𝑡0, to get a sense of the extent to
which high-performing firms reap particular benefit from the reform. Lacking guidance about
possible thresholds, we experiment with a number of specifications. A straightforward one is to
include an indicator that takes the value one for firms whose performance was above the industry-
median in the pre-reform years and zero otherwise, called 𝜙𝑗,𝑡0𝑚𝑒𝑑 . As an alternative, we also create
an indicator for firms that were in the top third of productivity in their respective industry, 𝜙𝑗,𝑡0𝑝33
.
Our basic equation of interest is the following:
𝑇𝐹𝑃𝑗𝑡 = 𝛽0 + 𝛽1(𝜙𝑗,𝑡0 ∗ 𝑅𝑒𝑓𝑜𝑟𝑚𝑡) + 𝜅𝑗 + 𝜌𝑡 + 𝜀𝑗𝑡 (2)
where 𝜅𝑗 are firm fixed effects, 𝜌𝑡 are year fixed effects and 𝜀𝑗𝑡 is an error term. Note that the
presence of year and firm fixed effects also control for the constituent terms of the interaction
term. Rather than estimating equation (2) as is, we prefer to estimate the equation using a two
period model, one before and one after the reform. This facilitates the interpretation of the results
and allows us to deal with issues related to serial correlation and the adjustment of standard errors
(see Bertrand et al., 2004).
𝛥𝑇𝐹𝑃𝑗 = 𝛽1𝜙𝑗,𝑡0 + 𝑢𝑗
where 𝛥𝑇𝐹𝑃𝑗 is the change in TFP between the pre-reform and the post-reform periods, where we
take simple averages over available observations for 2002-2004 and 2006-2008, respectively. The
year of the reform, 2005, is excluded from the analysis.
The specification in first differences also allows us to use fixed effects to control for different
trends across industries and states, 𝜗𝑖 and 𝜈𝑠 . We also control for the possibility of different
productivity growth trajectories across firms of different size by adding the initial number of
employees as a proxy for the initial firm size, ln 𝑒𝑚𝑝𝑙𝑗,𝑡0 , into the differenced equation. Our
baseline estimation equation is as follows:
𝛥𝑇𝐹𝑃𝑗 = 𝛽1𝜙𝑗,𝑡0 + 𝜈𝑠 + 𝜗𝑖 + 𝑢𝑗 (3)
The coefficient 𝛽1 provides an answer to the question whether firms with higher initial
productivity ( 𝜙𝑗,𝑡0 = 1) obtain larger gains following the reform. If that hypothesis were
confirmed, the estimated coefficient 𝛽1 should be positive and significant.
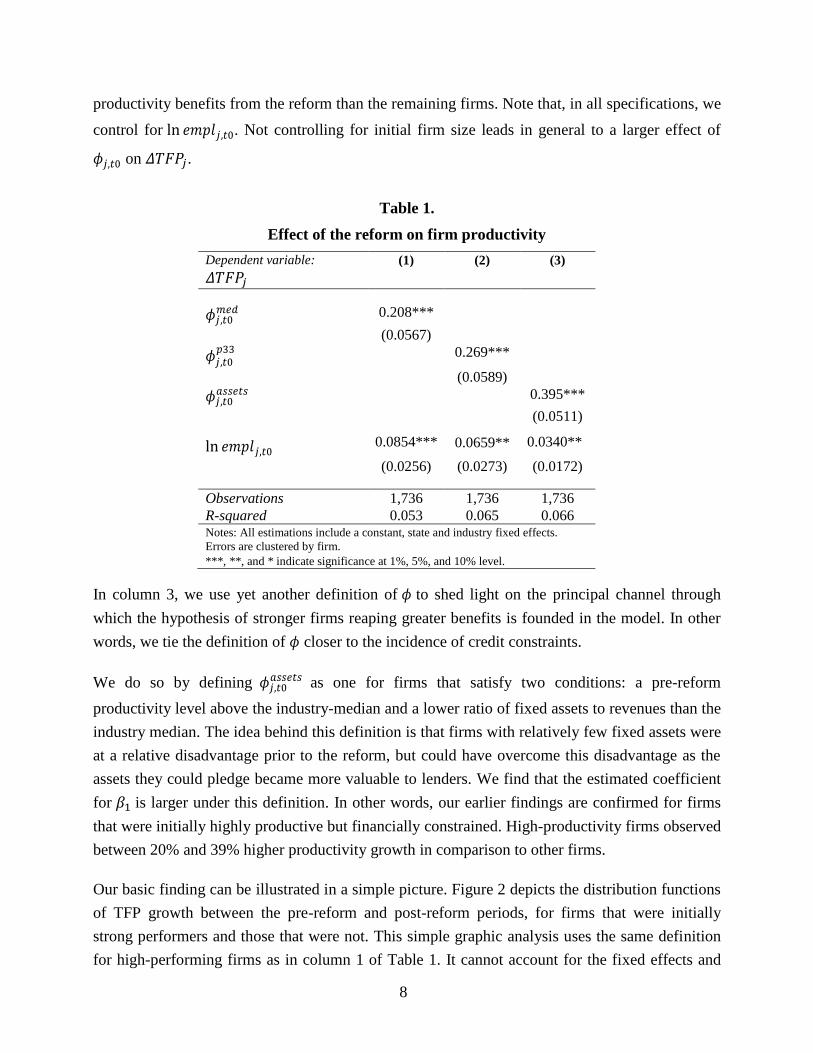
Table 1 shows our main results for estimating equation (3). In columns 1 and 2, we define high
productivity firms as those with TFP levels above the median and the 66th percentile,
respectively. For both definitions we find that initially more productive firms reap stronger
8
productivity benefits from the reform than the remaining firms. Note that, in all specifications, we
control for ln 𝑒𝑚𝑝𝑙𝑗,𝑡0. Not controlling for initial firm size leads in general to a larger effect of
𝜙𝑗,𝑡0 on 𝛥𝑇𝐹𝑃𝑗.
Table 1.
Effect of the reform on firm productivity
Dependent variable: (1) (2) (3)
𝛥𝑇𝐹𝑃𝑗
𝜙𝑗,𝑡0𝑚𝑒𝑑
0.208***
(0.0567)
𝜙𝑗,𝑡0𝑝33
0.269***
(0.0589)
𝜙𝑗,𝑡0𝑎𝑠𝑠𝑒𝑡𝑠
0.395***
(0.0511)
ln 𝑒𝑚𝑝𝑙𝑗,𝑡0 0.0854*** 0.0659** 0.0340**
(0.0256) (0.0273) (0.0172)
Observations 1,736 1,736 1,736
R-squared 0.053 0.065 0.066 Notes: All estimations include a constant, state and industry fixed effects.
Errors are clustered by firm.
***, **, and * indicate significance at 1%, 5%, and 10% level.
In column 3, we use yet another definition of 𝜙 to shed light on the principal channel through
which the hypothesis of stronger firms reaping greater benefits is founded in the model. In other
words, we tie the definition of 𝜙 closer to the incidence of credit constraints.
We do so by defining 𝜙𝑗,𝑡0𝑎𝑠𝑠𝑒𝑡𝑠 as one for firms that satisfy two conditions: a pre-reform
productivity level above the industry-median and a lower ratio of fixed assets to revenues than the
industry median. The idea behind this definition is that firms with relatively few fixed assets were
at a relative disadvantage prior to the reform, but could have overcome this disadvantage as the
assets they could pledge became more valuable to lenders. We find that the estimated coefficient
for 𝛽1 is larger under this definition. In other words, our earlier findings are confirmed for firms
that were initially highly productive but financially constrained. High-productivity firms observed
between 20% and 39% higher productivity growth in comparison to other firms.
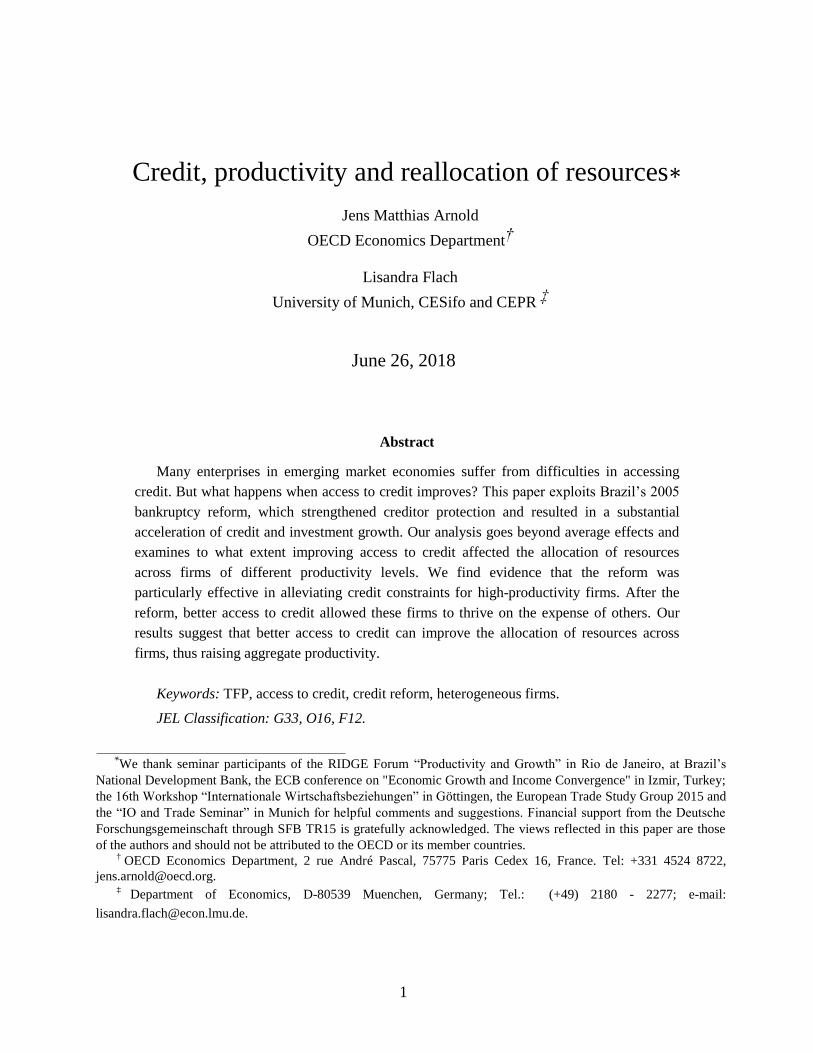
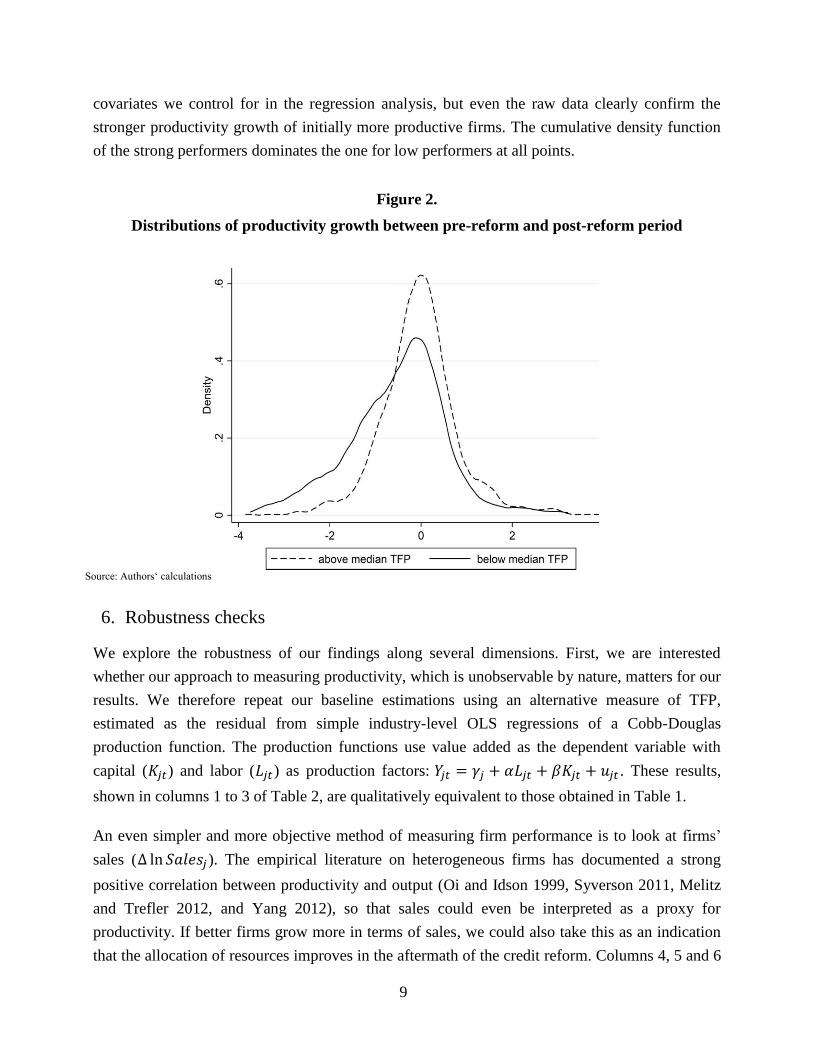
Our basic finding can be illustrated in a simple picture. Figure 2 depicts the distribution functions
of TFP growth between the pre-reform and post-reform periods, for firms that were initially
strong performers and those that were not. This simple graphic analysis uses the same definition
for high-performing firms as in column 1 of Table 1. It cannot account for the fixed effects and
9
covariates we control for in the regression analysis, but even the raw data clearly confirm the
stronger productivity growth of initially more productive firms. The cumulative density function
of the strong performers dominates the one for low performers at all points.
Figure 2.
Distributions of productivity growth between pre-reform and post-reform period
Source: Authors‘ calculations
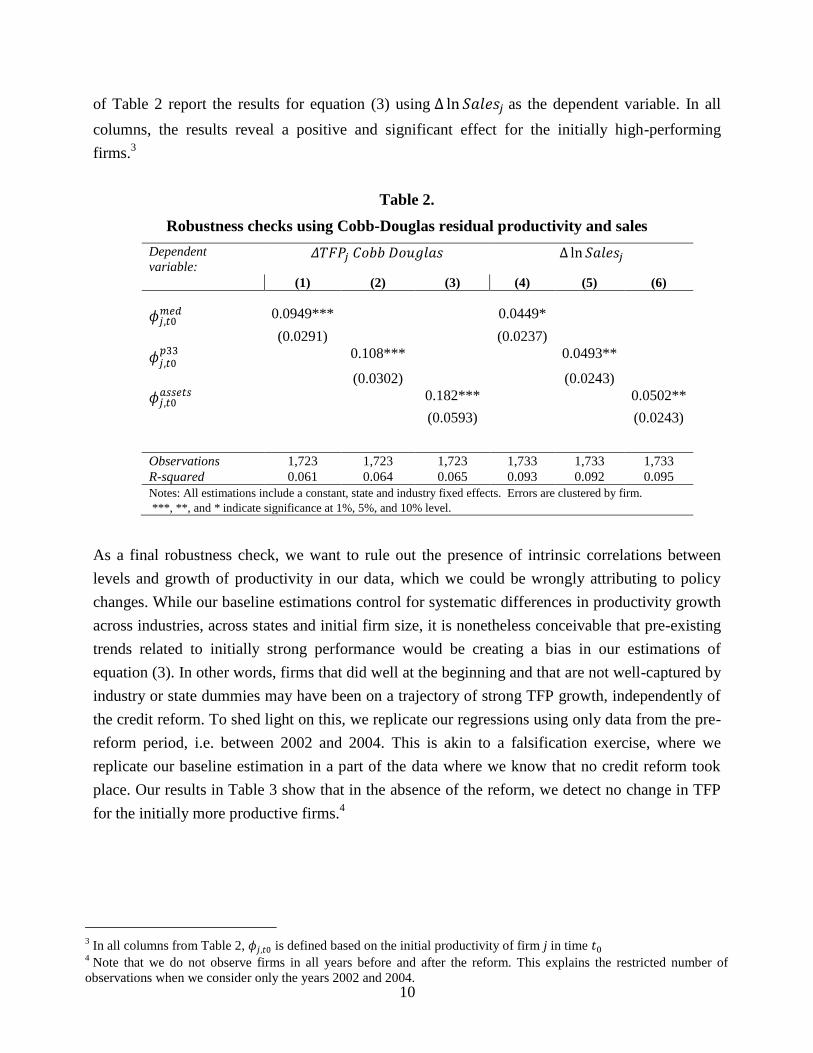
6. Robustness checks
We explore the robustness of our findings along several dimensions. First, we are interested
whether our approach to measuring productivity, which is unobservable by nature, matters for our
results. We therefore repeat our baseline estimations using an alternative measure of TFP,
estimated as the residual from simple industry-level OLS regressions of a Cobb-Douglas
production function. The production functions use value added as the dependent variable with
capital (𝐾𝑗𝑡) and labor (𝐿𝑗𝑡) as production factors: 𝑌𝑗𝑡 = 𝛾𝑗 + 𝛼𝐿𝑗𝑡 + 𝛽𝐾𝑗𝑡 + 𝑢𝑗𝑡 . These results,
shown in columns 1 to 3 of Table 2, are qualitatively equivalent to those obtained in Table 1.
An even simpler and more objective method of measuring firm performance is to look at firms’
sales (∆ ln 𝑆𝑎𝑙𝑒𝑠𝑗 ). The empirical literature on heterogeneous firms has documented a strong
positive correlation between productivity and output (Oi and Idson 1999, Syverson 2011, Melitz
and Trefler 2012, and Yang 2012), so that sales could even be interpreted as a proxy for
productivity. If better firms grow more in terms of sales, we could also take this as an indication
that the allocation of resources improves in the aftermath of the credit reform. Columns 4, 5 and 6
10
of Table 2 report the results for equation (3) using ∆ ln 𝑆𝑎𝑙𝑒𝑠𝑗 as the dependent variable. In all
columns, the results reveal a positive and significant effect for the initially high-performing
firms.3
Table 2.
Robustness checks using Cobb-Douglas residual productivity and sales
Dependent
variable: 𝛥𝑇𝐹𝑃𝑗 𝐶𝑜𝑏𝑏 𝐷𝑜𝑢𝑔𝑙𝑎𝑠 ∆ ln 𝑆𝑎𝑙𝑒𝑠𝑗
(1) (2) (3) (4) (5) (6)
𝜙𝑗,𝑡0𝑚𝑒𝑑
0.0949*** 0.0449*
(0.0291) (0.0237)
𝜙𝑗,𝑡0𝑝33
0.108*** 0.0493**
(0.0302) (0.0243)
𝜙𝑗,𝑡0𝑎𝑠𝑠𝑒𝑡𝑠
0.182*** 0.0502**
(0.0593) (0.0243)
Observations 1,723 1,723 1,723 1,733 1,733 1,733
R-squared 0.061 0.064 0.065 0.093 0.092 0.095
Notes: All estimations include a constant, state and industry fixed effects. Errors are clustered by firm.
***, **, and * indicate significance at 1%, 5%, and 10% level.
As a final robustness check, we want to rule out the presence of intrinsic correlations between
levels and growth of productivity in our data, which we could be wrongly attributing to policy
changes. While our baseline estimations control for systematic differences in productivity growth
across industries, across states and initial firm size, it is nonetheless conceivable that pre-existing
trends related to initially strong performance would be creating a bias in our estimations of
equation (3). In other words, firms that did well at the beginning and that are not well-captured by
industry or state dummies may have been on a trajectory of strong TFP growth, independently of
the credit reform. To shed light on this, we replicate our regressions using only data from the pre-
reform period, i.e. between 2002 and 2004. This is akin to a falsification exercise, where we
replicate our baseline estimation in a part of the data where we know that no credit reform took
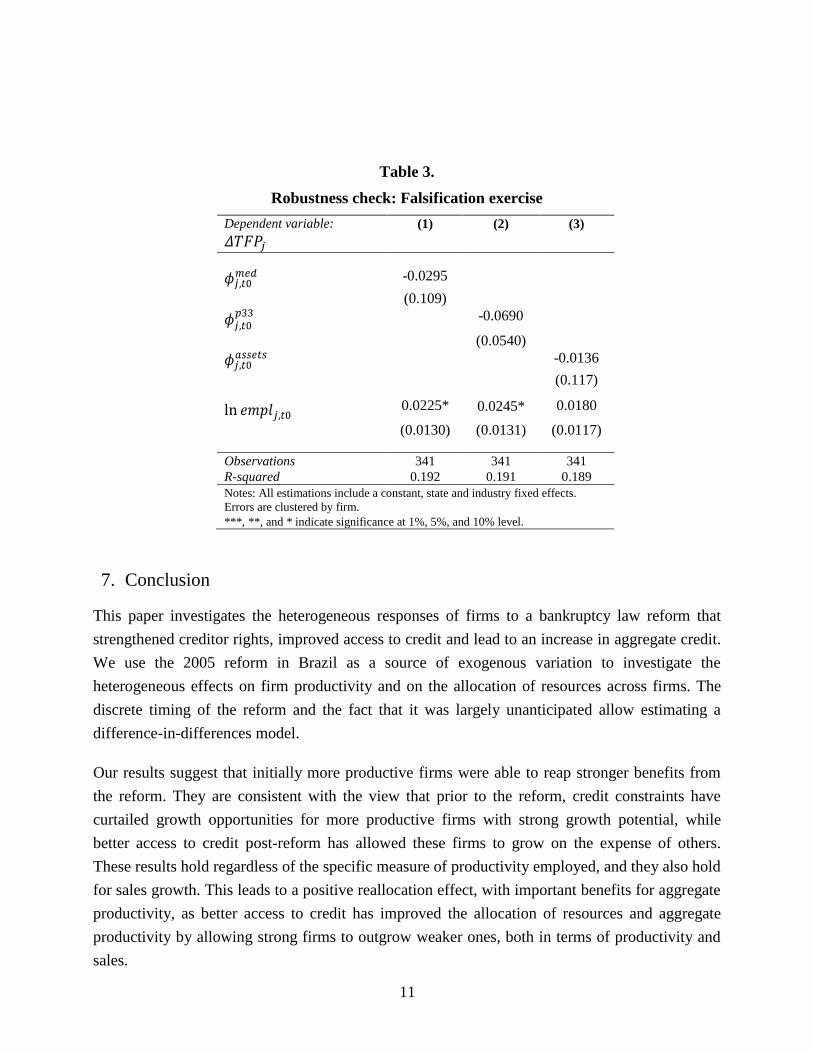
place. Our results in Table 3 show that in the absence of the reform, we detect no change in TFP
for the initially more productive firms.4
3 In all columns from Table 2, 𝜙𝑗,𝑡0 is defined based on the initial productivity of firm j in time 𝑡0
4 Note that we do not observe firms in all years before and after the reform. This explains the restricted number of
observations when we consider only the years 2002 and 2004.
11
Table 3.
Robustness check: Falsification exercise
Dependent variable: (1) (2) (3)
𝛥𝑇𝐹𝑃𝑗
𝜙𝑗,𝑡0𝑚𝑒𝑑
-0.0295
(0.109)
𝜙𝑗,𝑡0𝑝33
-0.0690
(0.0540)
𝜙𝑗,𝑡0𝑎𝑠𝑠𝑒𝑡𝑠
-0.0136
(0.117)
ln 𝑒𝑚𝑝𝑙𝑗,𝑡0 0.0225* 0.0245* 0.0180
(0.0130) (0.0131) (0.0117)
Observations 341 341 341
R-squared 0.192 0.191 0.189
Notes: All estimations include a constant, state and industry fixed effects.
Errors are clustered by firm.
***, **, and * indicate significance at 1%, 5%, and 10% level.
7. Conclusion
This paper investigates the heterogeneous responses of firms to a bankruptcy law reform that
strengthened creditor rights, improved access to credit and lead to an increase in aggregate credit.
We use the 2005 reform in Brazil as a source of exogenous variation to investigate the
heterogeneous effects on firm productivity and on the allocation of resources across firms. The
discrete timing of the reform and the fact that it was largely unanticipated allow estimating a
difference-in-differences model.
Our results suggest that initially more productive firms were able to reap stronger benefits from
the reform. They are consistent with the view that prior to the reform, credit constraints have
curtailed growth opportunities for more productive firms with strong growth potential, while
better access to credit post-reform has allowed these firms to grow on the expense of others.
These results hold regardless of the specific measure of productivity employed, and they also hold
for sales growth. This leads to a positive reallocation effect, with important benefits for aggregate
productivity, as better access to credit has improved the allocation of resources and aggregate
productivity by allowing strong firms to outgrow weaker ones, both in terms of productivity and
sales.
12
Our empirical analysis is of particular interest to developing and emerging economies, where
shallow credit markets often coincide with comparatively low levels of creditor protection
through the legal system, for example due to the lack of an efficient judicial system. The fact that
these countries also tend to suffer from an inefficient allocation of resources across firms of
different productivity levels strengthens the case, made by Caselli and Gennaioli (2008), for
example, for financial market reforms that strengthen creditor rights.
References
Araujo, A., R. Ferreira, and B. Funchal (2012). The Brazilian bankruptcy law experience.
Journal of Corporate Finance 18 (4), 994–1004.
Arnold, J. M. and B. S. Javorcik (2009). Gifted kids of pushy parents? foreign direct investment
and plant productivity in Indonesia. Journal of International Economics 79, 42–53.
Aw, B., X. Chen, and M. Roberts (2001). Firm-level productivity differentials and turnover in
Taiwanese manufacturing. Journal of Development Economics 66, 51–86.
Beck, T. (2002). Financial development and international trade. is there a link? Journal of
International Economics 57, 107–131.
Beck, T. (2003). Financial dependence and international trade. Review of International
Economics 11(2), 296–316.
Berman, N. and J. Héricourt (2010). Financial factors and the margins of trade: Evidence from
cross-country firm level data. Journal of Development Economics 93 (2), 206–217.
Bertrand, M., E. Duflo, and S. Mullainathan (2004). How much should we trust diff in-difference
estimates? Quarterly Journal of Economics 119(1), 249–275.
Braun, M. (2003). Financial contractibility and asset hardness. University of California Los
Angeles, mimeo.
Bustos, P. (2011). Trade liberalization, exports, and technology upgrading: Evidence on the
impact of Mercosur on Argentinian firms. American Economic Review 11, 304340.
Caselli, F. and N. Gennaioli (2008). Economics and politics of alternative institutional reforms.
Quarterly Journal of Economics 123 (3), 1197–1250.
Caves, D. L. and E. Diewert (1982a). The economic theory of index numbers and the
measurement of input, output and productivity. Econometrica 50 (6), 1393–1414.
13
Caves, D. L. and E. Diewert (1982b). Multilateral comparisons of output, input and pro-
ductivity using superlative index numbers. Economic Journal 92, 73–86.
Chaney, T. (2016). Liquidity constrained exporters. Journal of Economic Dynamics and Control
72, 141-54.
Djankov, S., O. Hart, C. McLiesh, and A. Shleifer (2008). Debt enforcement around the world.
Journal of Political Economy 116 (6), 1105–1149.
Gomes, V. and E. Ribeiro (2015), "Produtividade e competição no mercado de produtos: uma
visão geral da manufatura no Brasil", in De Negri, F. and L. R. Cavalcante (eds.),
Produtividade no Brasil: Desempenho e determinantes, Volume 2 - Determinantes, IPEA,
Brasília.
Hsieh, C. and P. Klenow (2009). Misallocation and manufacturing TFP in China and India.
Quarterly Journal of Economics 124 (4), 1403–1448.
Manova, K. (2013). Credit constraints, heterogeneous firms and international trade. Review of
Economic Studies 80, 711–744.
Melitz, M. J. (2003). The impact of trade on intra-industry reallocations and aggregate industry
productivity. Econometrica 71(6), 1695–1725.
Melitz, M. and D. Trefler (2012). Gains from trade when firms matter. Journal of Economic
Perspectives 26(2), 91-118.
Minetti, R. and S. Zu (2011). Credit constraints and firms export: Microeconomic evidence from
italy. Journal of International Economics 83 (2), 109–125.
Oi, W. and T. Idson (1999), Firm Size and Wages, in Aschenfelter, O. and D. Card (eds.),
Handbook of Labor Economics, Volume 3, Part B, 2165-2214.
Ponticelli, J. and L. Alencar (2016). Court enforcement, bank loans and fi investment: Evidence
from a bankruptcy reform in brazil. Quarterly Journal of Economics 131 (3), 1365–1413.
Rajan, R. and L. Zingales (1998). Financial dependence and growth. American Economic Review
88(3), 559–586.
Safavian, M. and S. Sharma (2007). When do creditor rights work? Journal of Comparative
Economics 35 (3), 484–508.
Syverson, Chad (2011). What Determines Productivity? Journal of Economic Literature 49(2),
326-65.

14
Yang, Judy (2012). Large firms are more productive, offer higher wages and more training:
Assessing private sector contributions to job creation. International Finance Corporation
Report: Survey note 7. Washington DC: World Bank.
15
Appendix
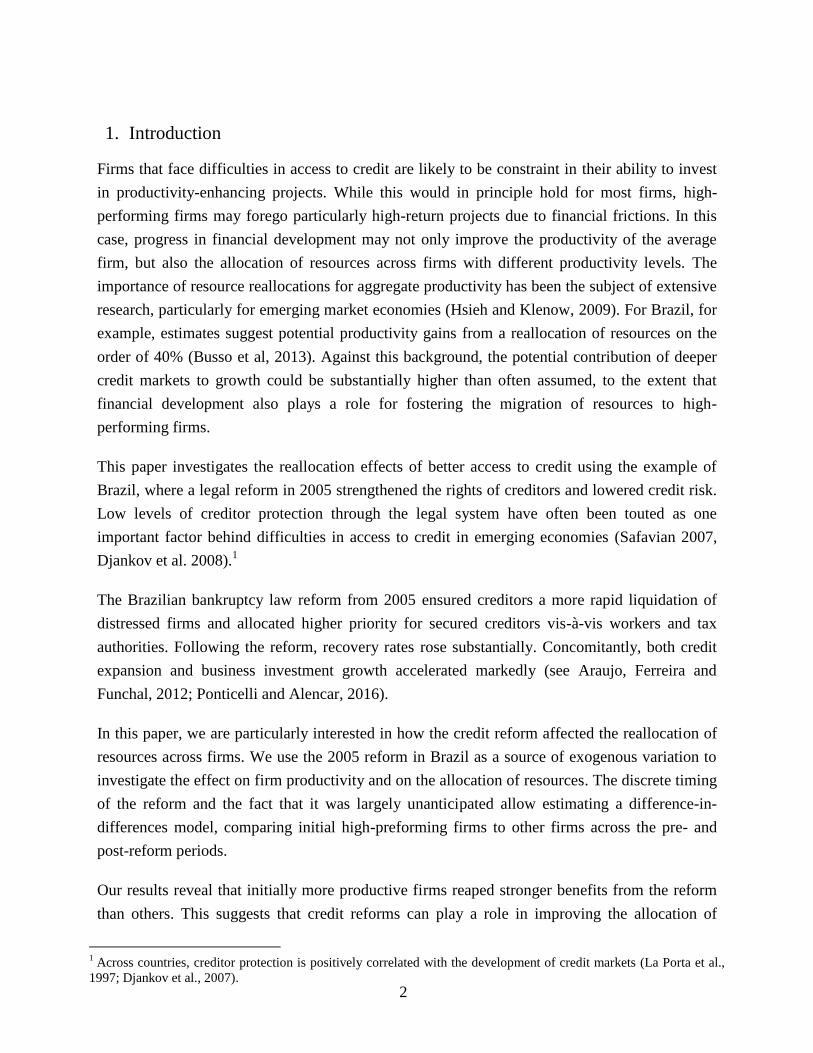
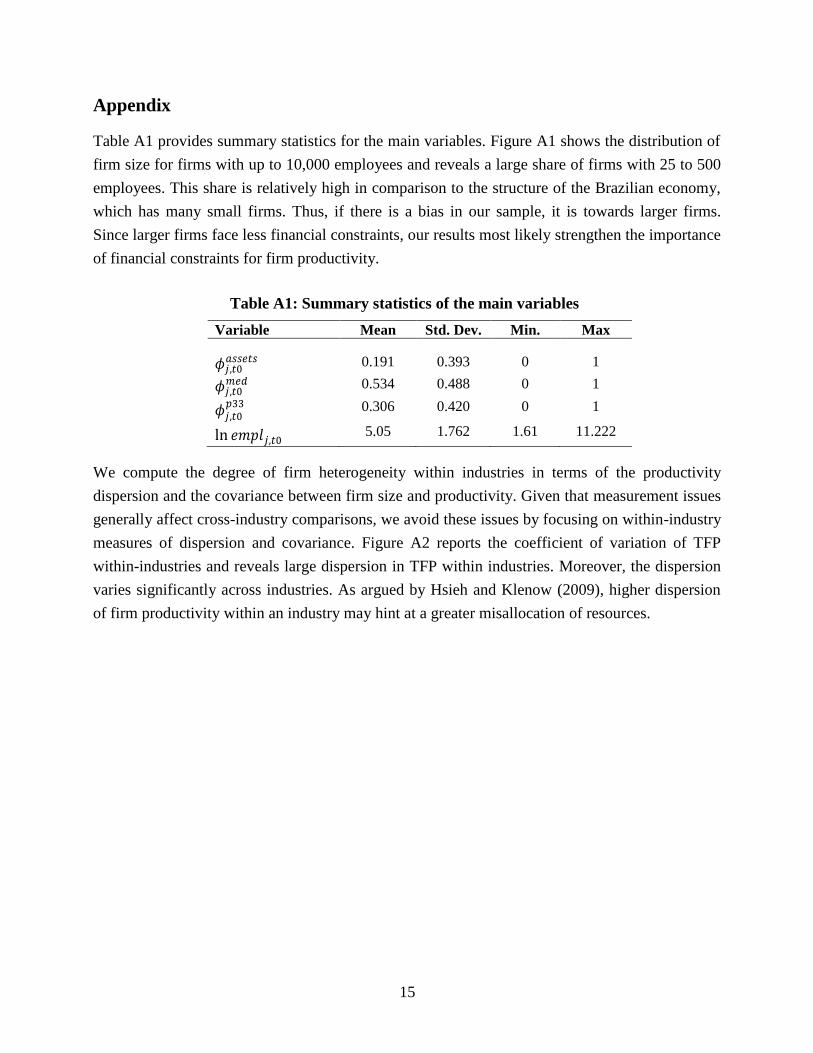
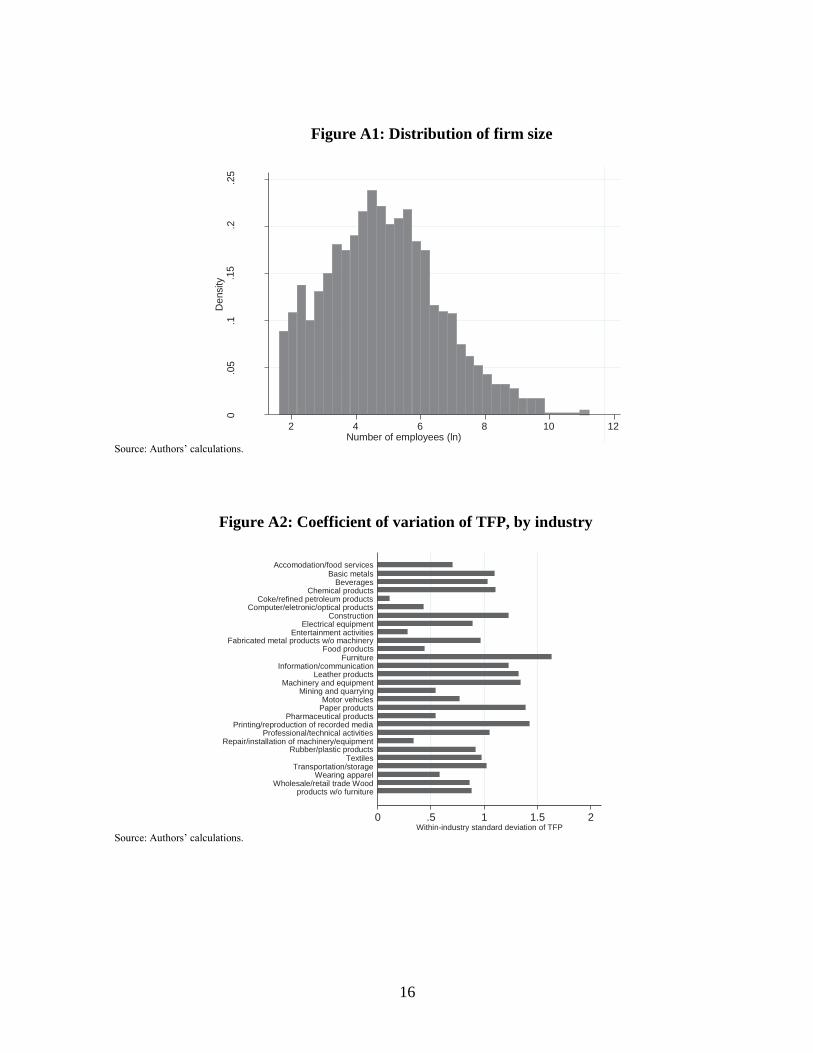
Table A1 provides summary statistics for the main variables. Figure A1 shows the distribution of
firm size for firms with up to 10,000 employees and reveals a large share of firms with 25 to 500
employees. This share is relatively high in comparison to the structure of the Brazilian economy,
which has many small firms. Thus, if there is a bias in our sample, it is towards larger firms.
Since larger firms face less financial constraints, our results most likely strengthen the importance
of financial constraints for firm productivity.
Table A1: Summary statistics of the main variables
Variable Mean Std. Dev. Min. Max
𝜙𝑗,𝑡0𝑎𝑠𝑠𝑒𝑡𝑠
0.191 0.393 0 1
𝜙𝑗,𝑡0𝑚𝑒𝑑
0.534 0.488 0 1
𝜙𝑗,𝑡0𝑝33
0.306 0.420 0 1
ln 𝑒𝑚𝑝𝑙𝑗,𝑡0 5.05 1.762 1.61 11.222
We compute the degree of firm heterogeneity within industries in terms of the productivity
dispersion and the covariance between firm size and productivity. Given that measurement issues
generally affect cross-industry comparisons, we avoid these issues by focusing on within-industry
measures of dispersion and covariance. Figure A2 reports the coefficient of variation of TFP
within-industries and reveals large dispersion in TFP within industries. Moreover, the dispersion
varies significantly across industries. As argued by Hsieh and Klenow (2009), higher dispersion
of firm productivity within an industry may hint at a greater misallocation of resources.
16
Figure A1: Distribution of firm size
2 4 6 8 10 12
Number of employees (ln)
Source: Authors’ calculations.
Figure A2: Coefficient of variation of TFP, by industry
Accomodation/food services Basic metals
Beverages Chemical products
Coke/refined petroleum products Computer/eletronic/optical products
Construction Electrical equipment
Entertainment activities Fabricated metal products w/o machinery
Food products Furniture
Information/communication Leather products
Machinery and equipment Mining and quarrying
Motor vehicles Paper products
Pharmaceutical products Printing/reproduction of recorded media
Professional/technical activities Repair/installation of machinery/equipment
Rubber/plastic products Textiles
Transportation/storage Wearing apparel
Wholesale/retail trade Wood products w/o furniture
0 .5 1 1.5 2 Within-industry standard deviation of TFP
Source: Authors’ calculations.
.2
.25
De
nsity .1
5
0
.05
.1