Credit Investor Update Philippe Capron€¦ · Credit Investor Update Philippe Capron Member of the...
26
Credit Investor Update Philippe Capron Member of the Management Board & Chief Financial Officer January 2012 IMPORTANT NOTICE: Financial statements unaudited and prepared under IFRS Investors are strongly urged to read the important disclaimer at the end of this presentation For latest results, please see dedicated presentation available at www.vivendi.com
Transcript of Credit Investor Update Philippe Capron€¦ · Credit Investor Update Philippe Capron Member of the...

Credit Investor Update
Philippe Capron Member of the Management Board &
Chief Financial Officer January 2012
IMPORTANT NOTICE:
Financial statements unaudited and prepared under IFRS
Investors are strongly urged to read the important disclaimer at the end of this presentation
For latest results, please see dedicated presentation available at www.vivendi.com

January 2012
Overview of Vivendi’s recent strategic steps
2
June 2011: Acquisition of 44% of SFR from Vodafone for EUR 7.75bn (+ EUR 200m in dividend ),
providing improved access to SFR cash flows
November 2011: Announcement of the acquisition of the EMI recorded music division for GBP 1.2bn
(~EUR 1.4bn, payment expected Q3 2012) accompanied by a UMG disposal plan worth EUR 500m, with
synergies in excess of GBP 100m per annum
December 2011, 2nd: Agreement signed on the acquisition by Groupe Canal+ of Groupe Bolloré’s TV
channels comprised of Direct 8 and Direct Star (payment in shares)
December 2011, 19th: Announcement of the acquisition by Groupe Canal + of 40% of TVN in Poland for
~EUR 230m along with the merger of the pay-TV platforms - Planned in 2012 (payment expected Q2/Q3
2012), with synergies in excess of PLN 250m after 3 years
December 2011, 22nd: SFR was awarded a significant and highly valuable 20-year 4G spectrum band
for EUR 1.065bn (payment expected Q1 2012)
Vivendi has been very active in pursuing and implementing its strategic plan in 2011
January 2012
USD 2bn + 3.8bn for 2-step sale of NBC Universal stake to GE (Sep-2010 and Jan-2011)
EUR 1.25bn received from DT to settle dispute in Polish telecom sector (January 2011)
~USD 422m sale of Activision Blizzard 3% block (November 2011)
EUR 500m UMG asset disposal plan in the context of EMI acquisition (expected payment Q3 2012)
Payment in new Vivendi shares (22.4 millions) of Groupe Bolloré’s TV channels comprised of Direct 8
and Direct Star by Groupe Canal +
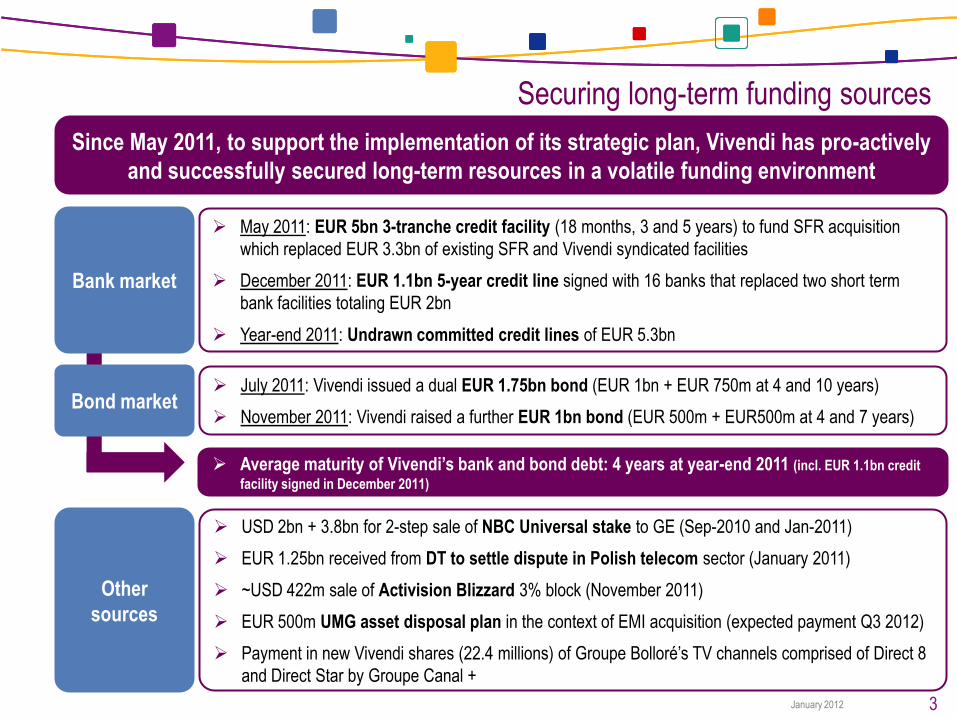
Securing long-term funding sources
Since May 2011, to support the implementation of its strategic plan, Vivendi has pro-actively
and successfully secured long-term resources in a volatile funding environment
3
May 2011: EUR 5bn 3-tranche credit facility (18 months, 3 and 5 years) to fund SFR acquisition
which replaced EUR 3.3bn of existing SFR and Vivendi syndicated facilities
December 2011: EUR 1.1bn 5-year credit line signed with 16 banks that replaced two short term
bank facilities totaling EUR 2bn
Year-end 2011: Undrawn committed credit lines of EUR 5.3bn
Bank market
July 2011: Vivendi issued a dual EUR 1.75bn bond (EUR 1bn + EUR 750m at 4 and 10 years)
November 2011: Vivendi raised a further EUR 1bn bond (EUR 500m + EUR500m at 4 and 7 years) Bond market
Other
sources
Average maturity of Vivendi’s bank and bond debt: 4 years at year-end 2011 (incl. EUR 1.1bn credit
facility signed in December 2011)

January 2012
End 2011 End 2012 End 2013 End 2014 End 2015 End 2016 End 2017 End 2018 End 2019 End 2020
19.6
18.0
13.8
11.1
7.3
4.3
2.5
1.50.8 0.8
Vivendi bond and bank debt overviewAs of December 31st, 2011
Bonds debt Bank debt (Drawn + Undrawn)
(bn€)
(m€)
(m€)
61%
39%
Current Bank debt drawn only / bonds split (%)
Focus on Vivendi’s debt maturity profile
Average maturity of Vivendi’s bank and bond debt: 4 years at year-end 2011
(incl. EUR 1.1bn credit facility signed in December 2011)
4
January 2012
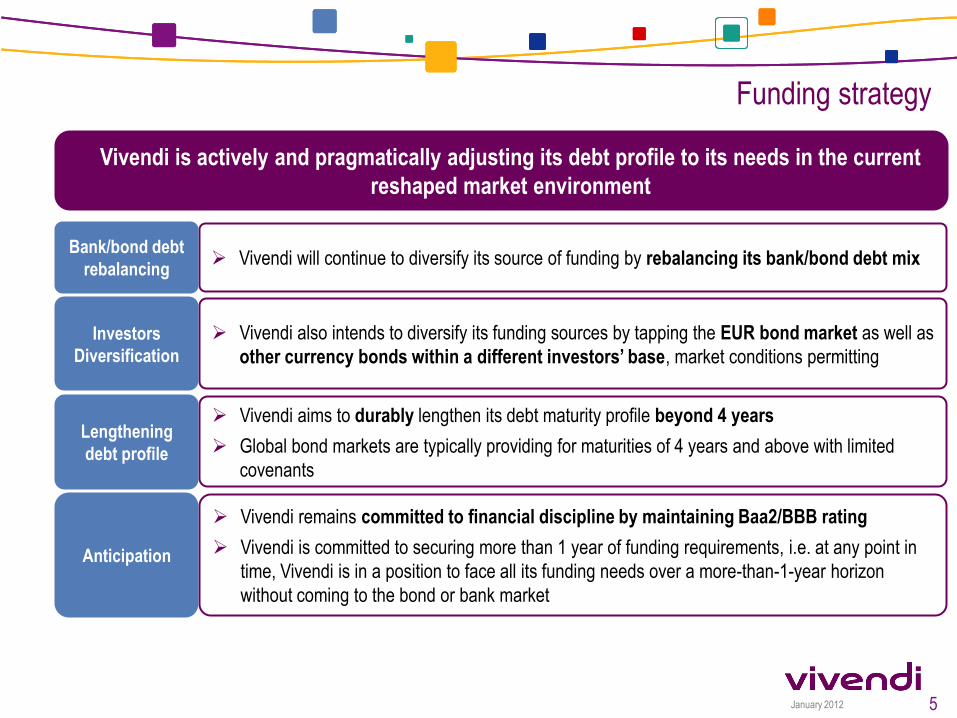
Funding strategy
Vivendi is actively and pragmatically adjusting its debt profile to its needs in the current
reshaped market environment
5
Vivendi will continue to diversify its source of funding by rebalancing its bank/bond debt mix
Vivendi also intends to diversify its funding sources by tapping the EUR bond market as well as
other currency bonds within a different investors’ base, market conditions permitting
Bank/bond debt
rebalancing
Vivendi remains committed to financial discipline by maintaining Baa2/BBB rating
Vivendi is committed to securing more than 1 year of funding requirements, i.e. at any point in
time, Vivendi is in a position to face all its funding needs over a more-than-1-year horizon
without coming to the bond or bank market
Anticipation
Investors
Diversification
Vivendi aims to durably lengthen its debt maturity profile beyond 4 years
Global bond markets are typically providing for maturities of 4 years and above with limited
covenants
Lengthening
debt profile
Appendix
Q3 2011 results Selected slides from the presentation held on November 16th, 2011
January 2012
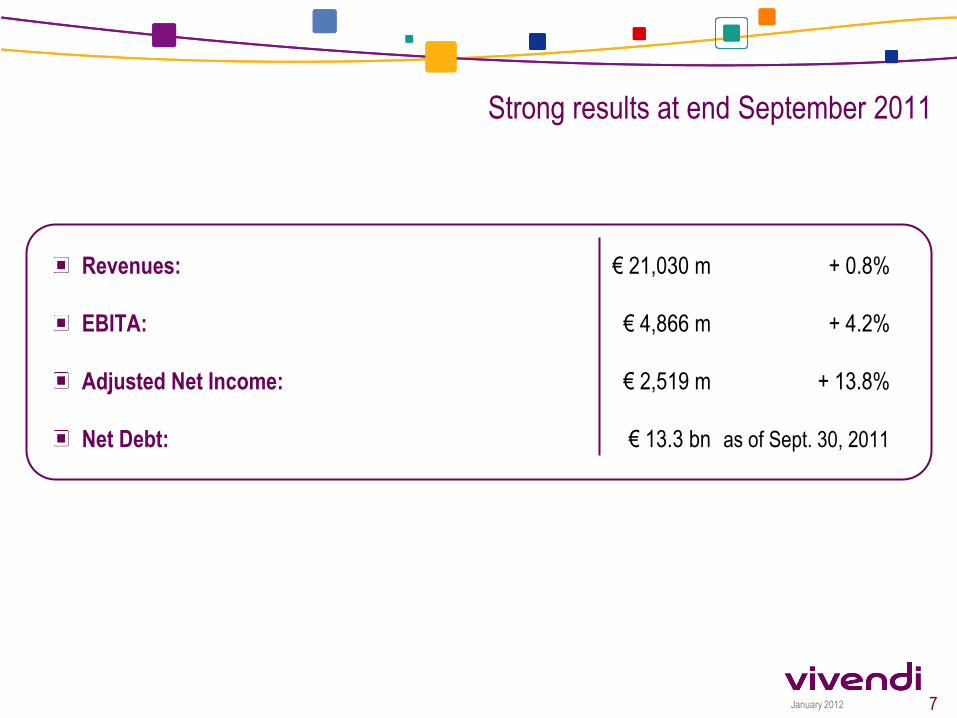
Strong results at end September 2011
7
Revenues: € 21,030 m + 0.8%
EBITA: € 4,866 m + 4.2%
Adjusted Net Income: € 2,519 m + 13.8%
Net Debt: € 13.3 bn as of Sept. 30, 2011
January 2012
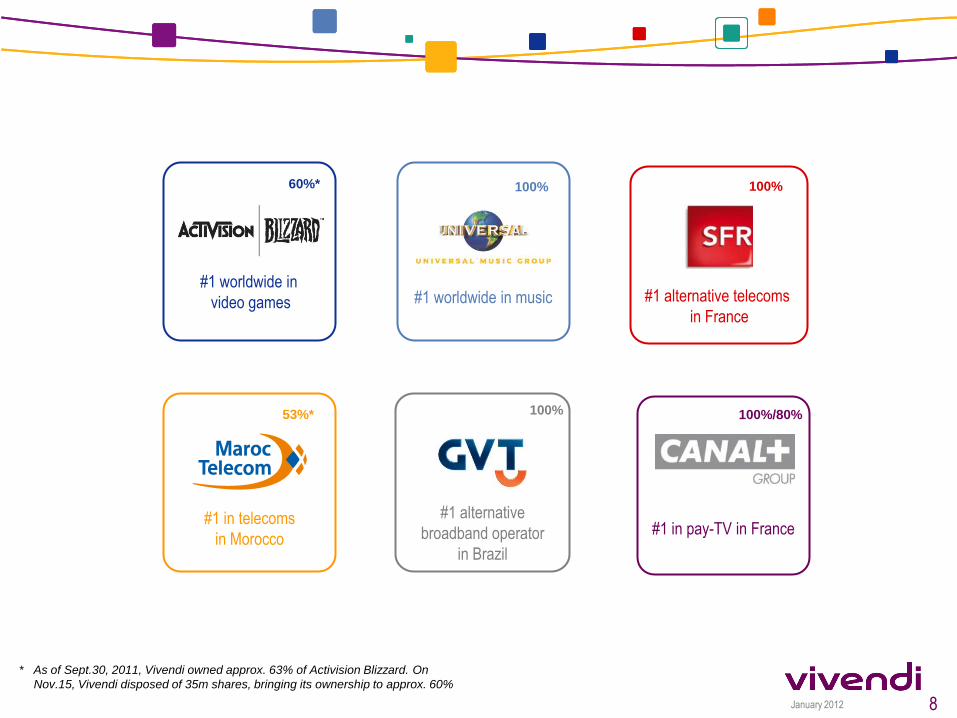
#1 alternative
broadband operator
in Brazil
#1 worldwide in music
#1 in pay-TV in France
#1 worldwide in
video games
#1 in telecoms
in Morocco
#1 alternative telecoms
in France
100%
100%
100%/80%
100%
53%*
60%*
* As of Sept.30, 2011, Vivendi owned approx. 63% of Activision Blizzard. On
Nov.15, Vivendi disposed of 35m shares, bringing its ownership to approx. 60%
8

January 2012
Activision Blizzard: Successful concentration around a reduced number of studios; Restructuring costs
of €18m to reduce exposure to low margin and low-potential business =
→ Positive effect on margin as early as 2011
UMG: Restructuring costs of €49m triggered by reorganization plan. All the steps necessary to deliver €100m in
savings have been taken and will be fully implemented in 2012 =
→ EBITA margin* increased 1pt in 9M 2011 vs. 9M 2010
SFR: Strong control of mobile commercial cost (-5% vs. 9M 2010) and stable non commercial opex despite volume
& price effects; SFR/Neuf Cegetel synergies (€250-300m) expected to be fully achieved by end 2011
Maroc Telecom Group: Reduction of negative margin mobile equipment sales in Morocco (-26%); Fixed cost
control and optimization at both Maroc Telecom and African subsidiaries
GVT: Rationalization of investments and installation processes; Constant cost optimization including leased lines
and bad debt
Canal+ Group: Efficient management of content costs such as renegotiation of French League 1 rights and
thematic channels fees
At Group level, cross business unit purchasing synergies initiatives have yielded significant cost savings
In a troubled economic environment, we are making renewed efforts
to cut costs and control operational expenses
9 * Excluding restructuring costs
January 2012
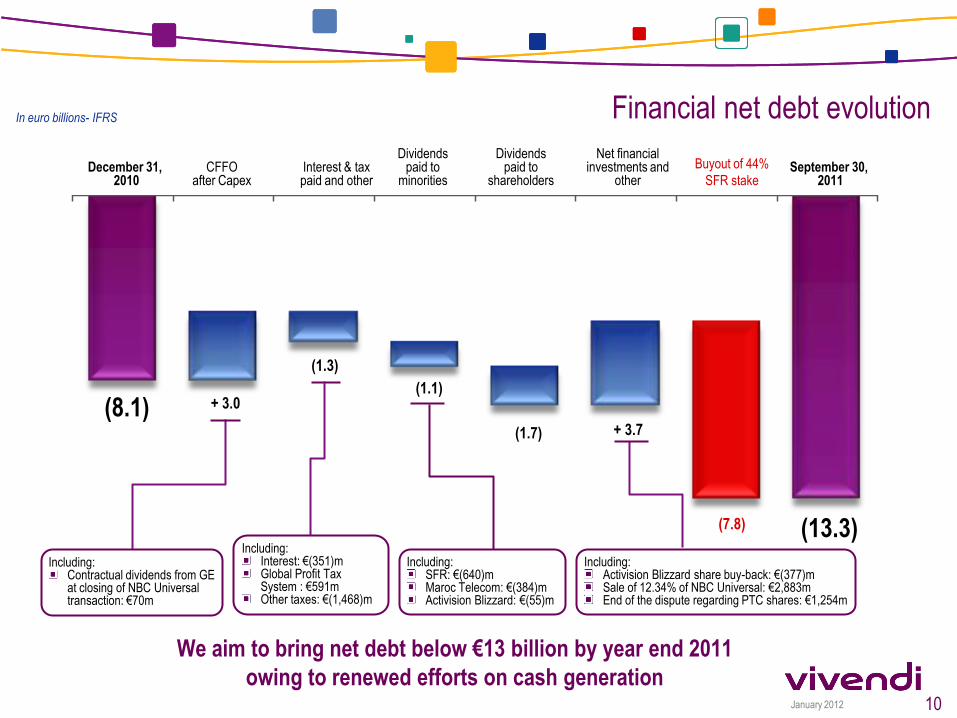
Financial net debt evolution
(8.1) + 3.0
(1.3)
(1.1)
+ 3.7
December 31, 2010
Net financial investments and
other CFFO
after Capex Interest & tax paid and other
Dividends paid to
shareholders
In euro billions- IFRS
September 30, 2011
Including: Contractual dividends from GE at closing of NBC Universal transaction: €70m
Including: Interest: €(351)m Global Profit Tax System : €591m Other taxes: €(1,468)m
Including: Activision Blizzard share buy-back: €(377)m Sale of 12.34% of NBC Universal: €2,883m End of the dispute regarding PTC shares: €1,254m
10
Dividends paid to
minorities
Buyout of 44%
SFR stake
(1.7)
(7.8)
Including: SFR: €(640)m Maroc Telecom: €(384)m Activision Blizzard: €(55)m
(13.3)
We aim to bring net debt below €13 billion by year end 2011
owing to renewed efforts on cash generation

January 2012
Revenues: €2,390m, +11% at constant currency
Record results driven by strength of digital sales
Non-GAAP revenues from digital channels* grew 16% and
account for 60% of total revenues
Strong performance from Call of Duty franchise; continued
success of Call of Duty: Blacks Ops and digital content packs
Call of Duty: Black Ops, #1 game in dollars in the U.S. and
Europe in 9M 2011 across all platforms and Starcraft II #1 PC
sku in dollars in the U.S. and Europe**.
EBITA: €951m, +46% at constant currency
Benefit from increased deferred revenues, net of related cost
of sales due to strong performance from Call of Duty
franchise and Blizzard Entertainment’s World of Warcraft and
Starcraft II franchises
Benefit also from better margin mix resulting from digital
revenue* growth and continuing initiatives at streamlining
Activision Publishing
The balance of deferred operating margin was €323m as of
September 30, 2011 vs. €1,024m as of December 31, 2010,
and €378m as of September 30, 2010
Outstanding launch for Call of Duty: Modern Warfare 3 with
sales of more than $400m in North America and United
Kingdom in the first 24 hours of its release
World of Warcraft to launch in Brazil on December 6, 2011
Blizzard Entertainment to release Diablo III in 2012
Activision Blizzard has purchased ~45m shares of its
common stock, for $502m in 9M 2011 under the $1.5bn
stock repurchase program. As of Sept.30, 2011, Vivendi
owns approx. 63% of Activision Blizzard. On Nov.15,
Vivendi disposed of 35m shares, bringing its ownership to
approx. 60%
11
Highlights
* Activision Blizzard Digital includes revenues from subscriptions and licensing royalties, value added services, downloadable content,
digitally distributed products, and wireless devices.
** According to The NPD Group, Charttrack and Gfk
In euro millions - IFRS 9M 2011 9M 2010 Change
Constant
currency
Revenues 2,390 2,280 + 4.8% + 10.9%
EBITA 951 686 + 38.6% + 45.7%
January 2012
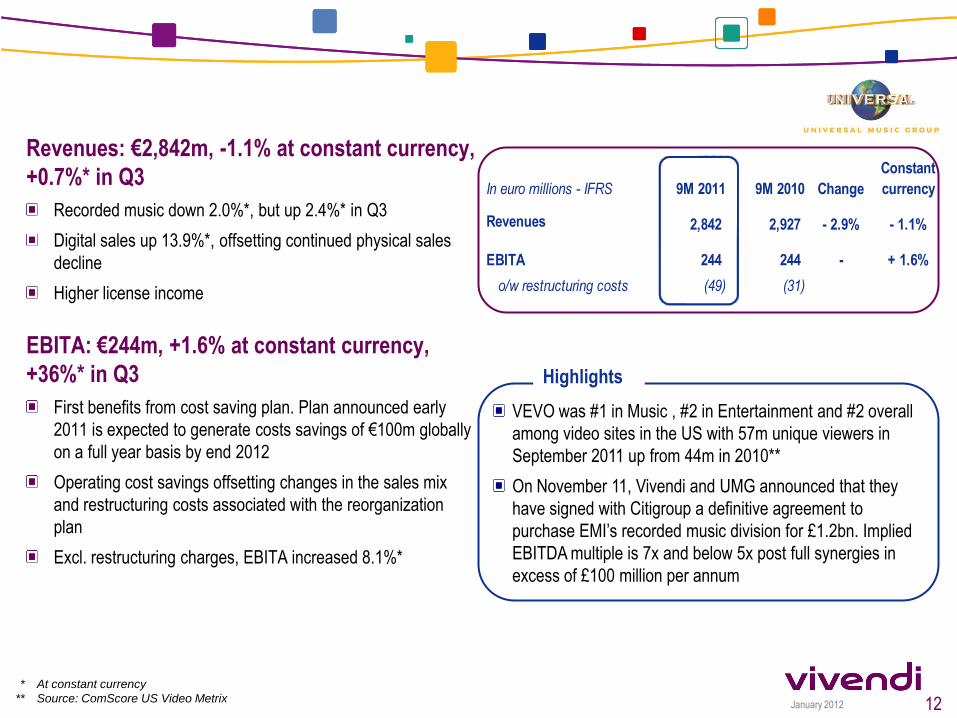
Revenues: €2,842m, -1.1% at constant currency,
+0.7%* in Q3
Recorded music down 2.0%*, but up 2.4%* in Q3
Digital sales up 13.9%*, offsetting continued physical sales
decline
Higher license income
EBITA: €244m, +1.6% at constant currency,
+36%* in Q3
First benefits from cost saving plan. Plan announced early
2011 is expected to generate costs savings of €100m globally
on a full year basis by end 2012
Operating cost savings offsetting changes in the sales mix
and restructuring costs associated with the reorganization
plan
Excl. restructuring charges, EBITA increased 8.1%*
VEVO was #1 in Music , #2 in Entertainment and #2 overall
among video sites in the US with 57m unique viewers in
September 2011 up from 44m in 2010**
On November 11, Vivendi and UMG announced that they
have signed with Citigroup a definitive agreement to
purchase EMI’s recorded music division for £1.2bn. Implied
EBITDA multiple is 7x and below 5x post full synergies in
excess of £100 million per annum
Highlights
12
* At constant currency
** Source: ComScore US Video Metrix
In euro millions - IFRS 9M 2011 9M 2010 Change
Constant
currency
Revenues 2,842 2,927 - 2.9% - 1.1%
EBITA 244 244 - + 1.6%
o/w restructuring costs (49) (31)
January 2012
* Mobile termination rates (MTR) down 33% as of July 1, 2010 and as of July 1, 2011; SMS termination rates down 33% since February
2010 and further -25% as of July 1, 2011; decrease in roaming prices. Fixed termination rates down 28% as of October 1, 2010.
** In Mainland France, excl. MtoM and dongles
Success of SFR offers (at the end of Sept.): ~1.7m customers for Carré offers launched in June
460k customers for Neufbox Evolution
873k customers for convergent Multipack offers
Gaining market share on wholesale segment : La Poste Mobile: 258k recruitments since May
Full MVNO agreement signed with NRJ – CIC Mobile in
September
2.6GHz spectrum acquisition for €150m paid in Oct.
Highlights
Mobile service revenues: €5,969m
+1.2% excl. VAT and regulatory impact*
+381k postpaid customers in 9M despite VAT turbulence in Q1
Data revenues: +23% to €2,083m due to growing smartphone
penetration (37% of SFR customers** at end Sept. 2011, +13pts yoy)
Broadband Internet & Fixed revenues: €2,994m
+2.7% excl. VAT and regulatory impact*
+125k broadband residential customers in 9M to 5.0m (+5.0% yoy)
Broadband internet mass market revenues: +4.8% excl. VAT
and regulatory impact*
EBITDA: €2,971m, -5.1% excl. non-recurring positive items
in a tougher competitive environment
Non-recurring positive items: €73m in 2011 impacting both Mobile
and Fixed vs. €53m in 2010 impacting fixed
Mobile EBITDA: €2,353m, -7.9% excl. non-recurring positive items
driven by impact of tariff cuts (VAT increase, regulation*)
Broadband Internet & Fixed EBITDA: €618m, +7.8% excl.
non-recurring positive items
EBITA: €1,885m, -6.1% excl. non-recurring positive items
13
In euro millions - IFRS 9M 2011 9M 2010 Change
Revenues 9,137 9,379 - 2.6%
Mobile 6,353 6,664 - 4.7%
Broadband Internet & Fixed 2,994 2,944 + 1.7%
Intercos (210) (229)
EBITDA 2,971 3,107 - 4.4%
Mobile 2,353 2,504 - 6.0%
Broadband Internet & Fixed 618 603 + 2.5%
EBITA 1,885 1,982 - 4.9%

January 2012
Revenues: €2,059 m, -2.0% at constant
currency
Mobile in Morocco
Growing customer base (+1.4% yoy), o/w +28% for the high-
added-value postpaid segment, despite huge competition
Further improvement in churn rate
Solid ARPU (-7.1% in MAD) due to usage increase and despite
significant price cut
African subsidiaries
Excellent commercial and financial performances in Mali
Tough competitive environment in Gabon and Burkina Faso
EBITA: €833m, -10.5% at constant currency
EBITA margin of ~41%
In Morocco
Revenue decrease and increasing interconnection costs in a
tough competitive environment
Continued investments in both Morocco and subsidiaries to
maintain attractiveness of the offers
27.8m customers at end Sept. 2011, +11% yoy
Maroc Telecom has become #1 on 3G mobile
Internet in Morocco with a 39.9% market share
(930k customers)
Strong increase in ADSL customer base in Morocco:
+15% yoy to 552k
Highlights
14
In euro millions - IFRS 9M 2011 9M 2010 Change
Constant
currency
Revenues 2,059 2,126 - 3.2% - 2.0%
Maroc Telecom SA 1,680 1,759 - 4.5% - 3.4%
Subsidiaries 394 377 + 4.5% + 6.6%
Intercos (15) (10)
EBITDA 1,132 1,254 - 9.7% - 8.6%
EBITA 833 942 - 11.6% - 10.5%
Maroc Telecom SA 766 865 - 11.4% - 10.6%
Subsidiaries 67 77 - 13.0% - 9.9%

January 2012 15
In euro millions - IFRS 9M 2011 9M 2010 Change
Constant
Currency
Revenues 1,077 732 + 47.1% + 42.4%
Telecoms 1,077 732 + 47.1% + 42.4%
Pay-TV - -
EBITDA 452 306 + 47.7% + 42.9%
Telecoms 461 306 + 50.7% + 45.9%
Pay-TV (9) -
EBITA 299 169 + 76.9% + 71.0%
Expansion in 8 new cities in the first nine months 2011,
now 105 cities are covered by GVT**
New 35Mbps package at BRL119.90 per month launched
in September 2011
Successful launch of pay TV offer in Q4 2011
Highlights
Revenues: €1,077m, +47% (+42% at constant currency)
Growth fueled by coverage expansion and excellent value
proposition
Broadband service revenues up 75% and Voice revenues
up 37% (+70% and +32% at constant currency, respectively)
GVT ultra-fast broadband edge maintained: average
broadband speed of 10.1Mbps** above average Brazilian
speed of 1.7Mbps***, 55% of Q3 new sales with 15Mbps
or higher
1,541k net adds in lines in services (LIS), +50% yoy
EBITDA: €452m, +48%
EBITDA margin of 42.0%, +0.2pt
Better product mix, including the widespread penetration of
bundle with data and higher speeds
Continued cost optimization
Despite initial opex for pay TV
EBITA: €299m, +77% (+53% on a like-for-like basis*)
Growth of depreciation due to network rollout partially offset
by extended useful life of the assets*
* Adjusted EBITA growth on a like-for-like basis, adjusting 9M 2010 depreciation by BRL61m (€26m) due to extended useful lives of certain
assets applied since Q4 2010
** As of September 30, 2011
*** Source: Akamai Institute

January 2012 16
In euro millions - IFRS 9M 2011 9M 2010 Change
Constant
currency
Revenues 3,563 3,464 + 2.9% + 2.9%
o/w Canal+ France 3,016 2,962 + 1.8% + 1.8%
EBITA 732 760 - 3.7% - 3.9%
o/w Canal+ France 685 704 - 2.7% - 2.7%
* 1 match day more in Q3 2011 compared to Q3 2010
Revenues: €3,563m, +2.9%
Canal+ France revenue growth sustained by:
Portfolio growth at Canal+ France: 211k net adds year-on-
year, driven mainly by mainland France (DSL distribution
dynamics), overseas territories and Africa
Growing ARPU per subscriber in Mainland France to €47.4
(+€1.1 yoy) due to higher bundle rate and better sales of
options and packs rate
Advertising activities grew 6%
Positive commercial momentum for all other activities, in
particular for StudioCanal with successful theatrical
releases (Unknown, Source Code, Tinker Tailor Soldier
Spy), Canal+ in Poland and i>Télé
EBITA: €732m, +1.8%, excluding non-recurring
and temporary items
Profit up 3.3% at Canal+ France excluding financial
sanction imposed by the French Competition Authority for
€(30)m and unfavorable timing effect on French League 1
broadcasting schedule for ~€(12)m*
Investments in international development
Canal+ Group to enter into a strategic partnership
with Bollore Group to acquire a 60% stake in two
free-to-air channels in France
Exclusive negotiations to create a strategic
partnership in Poland with ITI and TVN
Launch of unlimited subscription-VOD “Canalplay
Infinity” service at €9.99 per month
New unique tariff for Canal+ package at €39.90
including 5 HD channels, catch-up TV, PVR and
multi-screen option (TV, PC, tablet…)
Highlights
January 2012
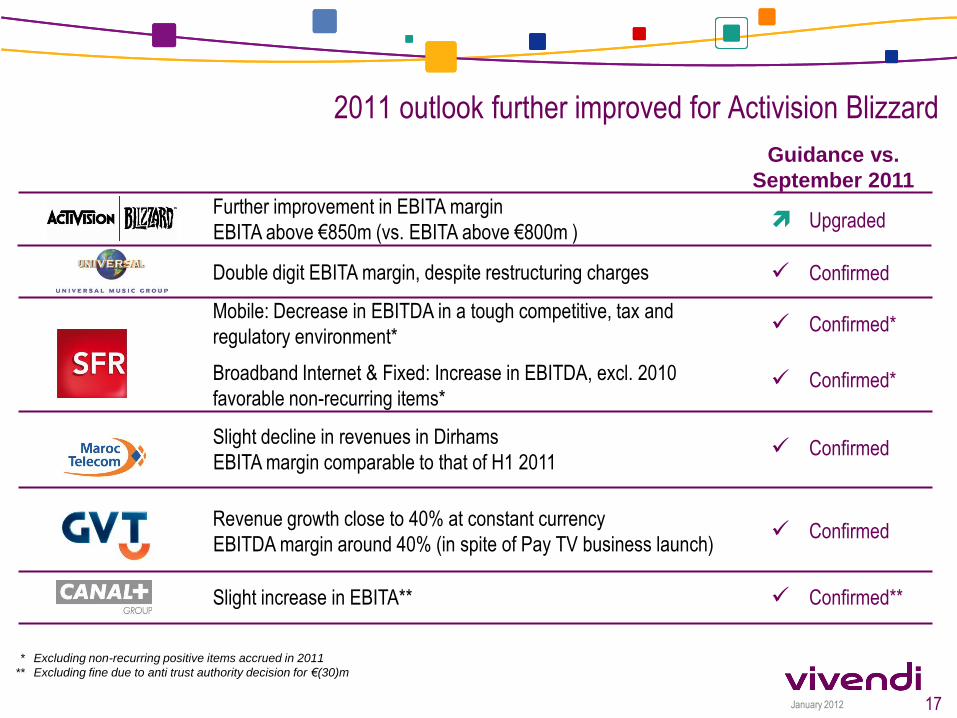
2011 outlook further improved for Activision Blizzard
Double digit EBITA margin, despite restructuring charges
Mobile: Decrease in EBITDA in a tough competitive, tax and
regulatory environment*
Broadband Internet & Fixed: Increase in EBITDA, excl. 2010
favorable non-recurring items*
Slight decline in revenues in Dirhams
EBITA margin comparable to that of H1 2011
Slight increase in EBITA**
Revenue growth close to 40% at constant currency
EBITDA margin around 40% (in spite of Pay TV business launch)
17
Further improvement in EBITA margin
EBITA above €850m (vs. EBITA above €800m ) Upgraded
Confirmed
Confirmed*
Guidance vs.
September 2011
Confirmed**
Confirmed*
Confirmed
Confirmed
* Excluding non-recurring positive items accrued in 2011
** Excluding fine due to anti trust authority decision for €(30)m
Appendix
Q3 2011 results - Appendices Selected slides from the presentation held on November 16th, 2011

January 2012
Revenues
19
Q3 2011 Q3 2010 ChangeConstant
currencyin euro millions - IFRS 9M 2011 9M 2010 Change
Constant
currency
533 577 - 7.6% + 1.2% Activision Blizzard 2,390 2,280 + 4.8% + 10.9%
979 1,027 - 4.7% + 0.7% Universal Music Group 2,842 2,927 - 2.9% - 1.1%
3,017 3,131 - 3.6% - 3.6% SFR 9,137 9,379 - 2.6% - 2.6%
698 744 - 6.2% - 4.3% Maroc Telecom Group 2,059 2,126 - 3.2% - 2.0%
395 288 + 37.2% + 38.3% GVT 1,077 732 + 47.1% + 42.4%
1,171 1,137 + 3.0% + 3.2% Canal+ Group 3,563 3,464 + 2.9% + 2.9%
(16) (17) Others, and elimination of intersegment
transactions(38) (39)
6,777 6,887 - 1.6% + 0.3% Total Vivendi 21,030 20,869 + 0.8% + 1.7%

January 2012
EBITDA
20
Q3 2011 Q3 2010 ChangeConstant
currencyin euro millions - IFRS 9M 2011 9M 2010 Change
Constant
currency
140 114 + 22.8% + 35.0% Activision Blizzard 1,066 832 + 28.1% + 34.5%
136 105 + 29.5% + 35.1% Universal Music Group 329 305 + 7.9% + 9.9%
1,026 993 + 3.3% + 3.3% SFR 2,971 3,107 - 4.4% - 4.4%
403 450 - 10.4% - 8.5% Maroc Telecom Group 1,132 1,254 - 9.7% - 8.6%
167 122 + 36.9% + 38.2% GVT 452 306 + 47.7% + 42.9%
287 320 - 10.3% - 10.9% Canal+ Group 880 906 - 2.9% - 3.1%
(24) (31) Holding & Corporate / Others (79) (114)
2,135 2,073 + 3.0% + 4.3% Total Vivendi 6,751 6,596 + 2.3% + 3.2%

January 2012
In euro millions - IFRS 9M 2011 9M 2010 Change
Constant
currency
Activision Blizzard 951 686 + 38.6% + 45.7%
Universal Music Group 244 244 - + 1.6%
SFR 1,885 1,982 - 4.9% - 4.9%
Maroc Telecom Group 833 942 - 11.6% - 10.5%
GVT 299 169 + 76.9% + 71.0%
Canal+ Group 732 760 - 3.7% - 3.9%
Holding & Corporate / Others (78) (113)
Total Vivendi 4,866 4,670 + 4.2% + 5.3%
Solid increase in EBITA
21
-6.1% excl. non-recurring
positive items in 2010 and
2011
Incl. higher restructuring
charges (€18m).
EBITA up 36% in Q3 2011
at constant currency
+53% on a like-for-like
basis*
* See page 15
+1.8% excl. anti trust
authority decision for
€(30)m and unfavorable
timing of League 1
schedule of ~€(12)m
January 2012
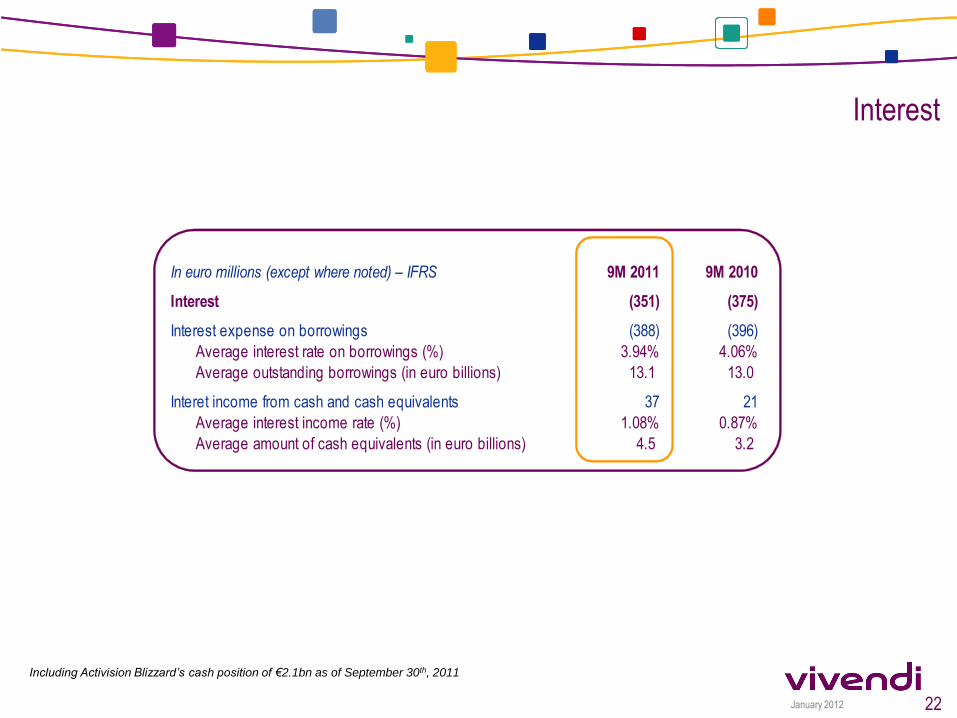
Interest
Including Activision Blizzard’s cash position of €2.1bn as of September 30th, 2011
22
In euro millions (except where noted) – IFRS 9M 2011 9M 2010
Interest (351) (375)
Interest expense on borrowings (388) (396)
Average interest rate on borrowings (%) 3.94% 4.06%
Average outstanding borrowings (in euro billions) 13.1 13.0
Interet income from cash and cash equivalents 37 21
Average interest income rate (%) 1.08% 0.87%
Average amount of cash equivalents (in euro billions) 4.5 3.2

January 2012
In euro millions – IFRS
Adjusted
net
income
Net
income
Adjusted
net
income
Net
income
Utilization of Vivendi SA’s tax losses carried forward 361 333 382 442
Tax charge (1,465) (1,330) (1,358) (1,290)
Provision for income taxes (1,104) (997) (976) (848)
Taxes (paid) / collected in cash
- o/w Consolidated Global Profit Tax System
9M 2011 9M 2010
(877)
591
(526)
182
Income tax
23
January 2012
Adjusted earnings before interest and income taxes (EBITA): As defined by Vivendi, EBITA corresponds to EBIT (defined as the difference between income and charges that do not result from financial activities, equity affiliates, discontinued operations and tax) before the amortization of intangible assets acquired through business combinations and the impairment losses of goodwill and other intangibles acquired through business combinations, other income and charges related to financial investing activities and to transactions with shareowners (except if directly recognized in equity).
Adjusted earnings before interest, income taxes and amortization (EBITDA): As defined by Vivendi, EBITDA corresponds to EBITA as presented in the Adjusted Statement of Earnings, before depreciation and amortization of tangible and intangible assets, restructuring charges, gains/(losses) on the sale of tangible and intangible assets and other non-recurring items.
Adjusted net income includes the following items: EBITA, income from equity affiliates, interest, income from investments, as well as taxes and non-controlling interests related to these items. It does not include the following items: the amortization of intangible assets acquired through business combinations, the impairment losses of intangible assets acquired through business combinations, other income and charges related to financial investing activities and to transactions with shareowners (except if directly recognized in equity), other financial charges and income, earnings from discontinued operations, provisions for income taxes and non-controlling interests related to the adjustments, as well as non-recurring tax items (notably the changes in deferred tax assets pursuant to the Consolidated Global Profit Tax System and to purchase price allocation assets).
Cash flow from operations (CFFO): Net cash provided by operating activities after capital expenditures net, dividends received from equity affiliates and unconsolidated companies and before income taxes paid.
Capital expenditures net (Capex, net): Cash used for capital expenditures, net of proceeds from sales of property, plant and equipment and intangible assets.
Financial net debt: Financial net debt is calculated as the sum of long-term and short-term borrowings and other long-term and short-term financial liabilities as reported on the Consolidated Statement of Financial Position, less cash and cash equivalents as reported on the Consolidated Statement of Financial Position as well as derivative financial instruments in assets and cash deposits backing borrowings as well as certain cash management financial assets (included in the Consolidated Statement of Financial Position under “financial assets”).
The percentages of change are compared to the same period of the previous accounting year, unless otherwise stated.
Glossary
24

January 2012
Investor Relations team
Aurélia Cheval IR Director
France Bentin IR Director
Eileen McLaughlin V.P. Investor Relations North America
For all financial or business information,
please refer to our Investor Relations website at: http://www.vivendi.com
New York 800 Third Avenue
New York, NY 10022 / USA Phone: +1.212.572.1334
Fax: +1.212.572.7112
Paris 42, Avenue de Friedland
75380 Paris cedex 08 / France Phone: +33.1.71.71.32.80
Fax: +33.1.71.71.14.16
Jean-Michel Bonamy Executive Vice President Investor Relations
+33.1.71.71.12.04 [email protected]
25

January 2012 26
Forward Looking Statements
This presentation contains forward-looking statements with respect to Vivendi’s financial condition, results of
operations, business, strategy, plans and outlook of Vivendi, including expectations regarding the payment of
dividends as well as the anticipated impact of certain transactions. Although Vivendi believes that such forward-
looking statements are based upon reasonable assumptions, such statements are not guarantees of future
performance. Actual results may differ materially from these forward-looking statements as a result of a number of
risks and uncertainties, many of which are beyond Vivendi’s control, including but not limited to the risks regarding
regulatory approvals as well as the risks described in the documents Vivendi filed with the Autorité des Marchés
Financiers (French securities regulator) and which are also available in English on Vivendi's web site
(www.vivendi.com). Investors and security holders may obtain a free copy of documents filed by Vivendi with the
Autorité des Marchés Financiers at www.amf-france.org, or directly from Vivendi. These forward-looking statements
are made as of the date of this presentation and Vivendi disclaims any intention or obligation to provide, update or
revise any forward-looking statements, whether as a result of new information, future events or otherwise.
Unsponsored ADRs
Vivendi does not sponsor an American Depositary Receipt (ADR) facility in respect of its shares. Any ADR facility
currently in existence is “unsponsored” and has no ties whatsoever to Vivendi. Vivendi disclaims any liability in
respect of such facility.
Important legal disclaimers