Credit Assessment Report of Nagar Nigam Mathura Scopennmvonline.in/Reforms/R00021.pdf · Mathura is...
15
1 Credit Assessment Report of Nagar Nigam Mathura 1. Scope Infomerics Valuation And Rating Pvt. Ltd. (Infomerics) has undertaken a credit assessment study on Nagar Nigam Mathura (NNM) in order to assign an Issuer Rating as per the Mandate Agreement signed on December 9, 2016. Credit Assessment essentially refers to evaluation of creditworthiness of an entity after factoring inter alia its quality of management, the segment in which it is operating, its span of operations, financial strength and future outlook. For this purpose, Infomerics has relied on Audited Accounts for Financial Year 2014-2016 alongwith the supporting Schedules, Budget Estimate for FY2017 and various operational & project details furnished by NNM and the clarifications obtained from NNM. 2. Background Nagar Nigam Mathura (NNM) is an Urban Local Body in the Mathura District of Uttar Pradesh. There are various categories of ULBs in Uttar Pradesh and NNM is classified as a „Nagar Nigam‟. It was constituted as per the Constitutional provisions of India. Mathura is the birthplace of Lord Krishna and also called as Shri Krishna Janma-Bhoomi. It is one of the seven cities (SaptaPuri) considered holy by Hindus. Mathura is a city in the North Indian state of Uttar Pradesh. It is located approximately 50 km north of Agra and 145 km south- east of Delhi. It is the administrative centre of Mathura District of Uttar Pradesh. Mathura Refinery located in the city is one of the largest oil refineries of Asia with 8.0 MMTPA refining capacity. Textile printing industry that includes both sari-printing and fabric dyeing and silver ornaments manufacturing are major industrial contributors to the region. 3. Management & Administration The election to the NNM is conducted by the State Election Commission. The electoral roll for every ward is prepared under the superintendence and direction of State Election Commission. At present, NNM is divided into 70 wards for which elections are held once in every five years.
Transcript of Credit Assessment Report of Nagar Nigam Mathura Scopennmvonline.in/Reforms/R00021.pdf · Mathura is...

1
Credit Assessment Report of
Nagar Nigam Mathura
1. Scope
Infomerics Valuation And Rating Pvt. Ltd. (Infomerics) has undertaken a credit assessment
study on Nagar Nigam Mathura (NNM) in order to assign an Issuer Rating as per the Mandate
Agreement signed on December 9, 2016. Credit Assessment essentially refers to evaluation of
creditworthiness of an entity after factoring inter alia its quality of management, the segment in
which it is operating, its span of operations, financial strength and future outlook. For this
purpose, Infomerics has relied on Audited Accounts for Financial Year 2014-2016 alongwith the
supporting Schedules, Budget Estimate for FY2017 and various operational & project details
furnished by NNM and the clarifications obtained from NNM.
2. Background
Nagar Nigam Mathura (NNM) is an Urban Local Body in the Mathura District of Uttar Pradesh.
There are various categories of ULBs in Uttar Pradesh and NNM is classified as a „Nagar
Nigam‟. It was constituted as per the Constitutional provisions of India.
Mathura is the birthplace of Lord Krishna and also called as Shri Krishna Janma-Bhoomi. It is
one of the seven cities (SaptaPuri) considered holy by Hindus. Mathura is a city in the North
Indian state of Uttar Pradesh. It is located approximately 50 km north of Agra and 145 km south-
east of Delhi. It is the administrative centre of Mathura District of Uttar Pradesh.
Mathura Refinery located in the city is one of the largest oil refineries of Asia with 8.0 MMTPA
refining capacity. Textile printing industry that includes both sari-printing and fabric dyeing and
silver ornaments manufacturing are major industrial contributors to the region.
3. Management & Administration
The election to the NNM is conducted by the State Election Commission. The electoral roll for
every ward is prepared under the superintendence and direction of State Election Commission.
At present, NNM is divided into 70 wards for which elections are held once in every five years.

2
NNM is governed by a Mayor-in-council which works under the strictures of the Uttar Pradesh
Municipalities Act, 1916. The Mayor-in-council is headed by the mayor who works along with a
member of councilors representing the wards. Currently, NNM does not have any mayor.
Therefore, the entire operations handled by the Commissioner who is the executive head of
NNM.
Shri Ujjwal Kumar is the current Commissioner of NNM. Being the administrative head, he
brings with him the rich administrative experience to execute the day-to-day works and
functioning of the NNM. He is assisted by a team of experienced officials.
4. Population
As per census 2011, the population of NNM is 3.50 Lakh. The birth rate, death rate and infant
mortality rate have declined over the last few years. In NNM, Female Sex Ratio is of 862 against
the state average of 912. The literacy rate of Mathura is 74.97%, being higher than the state
average of 67.68%. As per census 2011, the break-up of population in various categories are as
below.
Particulars Nos. in Lakhs % of total population
Total Population 3,49,909 100
Male Population 1,87,899 53.70
Female Population 1,62,010 46.30
Literate Population 2,29,061 65.46
Male Literacy 1,30,336 69.36
Female Literacy 98,725 60.94
5. Operation
NNM is involved in a gamut of activities such as water supply, sewerage disposal, street
lighting, health & sanitation, roads & bridges and horticulture. NNM gets the grants from GOI
and State government under AMRUT Mission for development activities such as improvement
in water supply services, sewerage system and green spaces.
Brief overview on the various operations of NNM is mentioned below.
Augmentation of City Water Supply Scheme
NNM‟s source of water supply is underground water and surface water. NNM has total capacity
of 34.0 Millions of liters per day (MLD). The total storage capacity is 47 MLD. There are total
ten zones for water supply to the city. The water is being supplied to consumers through direct
pumping as well as elevated reservoirs. The total road length is 645.95 km, out of which water

3
supply distribution network is covered up to 339.22 km and the remaining 306.73 km will be
covered by FY2021. The water related project planning & designing and construction activities
are undertaken by UP Jal Nigam. Operations & maintenance is undertaken by NNM for which
they hire labour locally. NNM has not conducted any assessment related to Non-Revenue Water
(NRW). NNM has focused on minimizing NRW by regularizing unregistered water connections,
to increase collection efficiency and introduce metering systems for billing under Atal Mission
for Rejuvenation and Urban Transformation (AMRUT) scheme. The present status of water
supply service level is summarised below:-
Sr.
No.
Indicators Present
Status
MOUD
Benchmark
1 Coverage of water supply connections 59.35% 100%
2 Per capita supply of water 126 LPCD 135 LPCD
3 Extent of metering of water connections 0% 100%
4 Extent of non-revenue water 35.0% 20%
6 Quality of water supplied 90% 100%
7 Cost recovery in water supply services 0% 100%
8 Efficiency in collection of water supply related
charges
90.0% 90%
*LPCD – Litre per capita per Day
*MOUD – Ministry of Urban Development
Water Project under AMRUT Scheme
NNM has project plan for improvement in the water service level over the present scenario.
Objective Project cost
(Rs. in crores)
To achieve the universal coverage 94.67
To increase storage capacity 10.12
To make system efficient by reduction 24.40
Efficiency of charges collection 15.10
Total Project Cost 144.29
The project cost will be funded to the extent of 50% by Government of India under AMRUT
scheme and remaining 50% by UP state government.
Sewerage Facility
NNM‟s sewerage system is poor in terms of coverage and services. At present, sewerage and
drainage systems are intermixed with each other. At present, 88 km sewer line is present in the
city. There is no decentralized waste treatment system in the city. NNM will explore the
decentralised treatment plant in future. 92% of the people are agreed to construction of
individual & community latrines and periodically cleaning by suction machine. Present status of
sewerage network and service level NNM depicted below.

4
Sr.
No.
Indicators Existing service
level (%)
MOUD
Benchmark (%)
1 Coverage of latrines (individual or
community)
97.00 100
2 Coverage of sewerage network services 13.64 100
3 Efficiency of collection of sewerage 13.00 100
4 Efficiency in treatment: Adequacy of
sewerage treatment capacity
80.00 100
Demand gap assessment
Sr.
No.
Project Name Year of
implementation
(Projected)
Year of
completion
(Projected)
Project
cost (Rs
crores)
1 Connection of 21200 HH 2017 2019 42.40
2 Coverage of sewerage network line 2017 2019 625.82
3 Construction of 7 new pumping station 2017 2019 66.14
4 Provision for land cost, services, power connection 2017 2019 46.68
Total Project Cost 781.04
Total project cost is Rs.781.04 crore. The project cost will be funded to the extent of 50% by
GOI under AMRUT scheme and remaining 50% by UP state government.
Green Spaces and Parks
There are total 56 parks in the city out of which 46 parks have only boundary walls, but none of
these parks are well developed and also does not have any aesthetic component. There is a lack
of basic amenities and green cover in these parks. Development of parks have been shortlisted
after considering two factors such as useful to maximum people and minimum development cost.
Redevelopment includes providing facilities like children friendly equipment, landscaping,
development of sitting area, pathways, lights/lamps, boundary walls and beautification through
fountains in existing parks. The city plans to make special provisions for installing children
friendly component in these parks as per AMRUT guidelines. Total project cost Rs.2.47 crores
which will be funded to the extent of 50% by GOI under AMRUT scheme and remaining 50%
by UP state government.
Public Works Department
Public Works Department of NNM supervises various street construction and repairing related
functions within its municipal area. The main focus is on construction & repairing of streets &
lanes, patch repairing & filling of pits, repairing of footpaths, maintenance of streets,
construction & repairing of parks and construction and repairing & maintenance of drains.

5
Street Lights
NNM supervises various street light construction and repairing activities within its jurisdiction.
NNM has focused on the installation of high masts on all major traffic junctions. It is a key
responsibility of NNM to provide street lights on all roads within its jurisdiction. The operation
& maintenance of street lighting is taken care by NNM.
Public health department
Public Health Department of the NNM is responsible for providing clean and healthy
environment to its citizen for maintaining proper health and sanitation conditions within its
jurisdiction. Major responsibilities of public health department are as follows.
Cleaning of public streets and drains.
Utilizing effective preventive and control measures against contagious/infectious
diseases.
Issue license under Food Adulteration Impediment Act.
Controlling the places allotted for disposal of dead bodies.
Supply of clean drinking water in parks and for individual and commercial purpose.
Road construction
Road construction department of NNM is supposed to focus on the construction of roads and
bridges in their defined area.
Sanitation and cleaners
Sanitation is an important aspect of any city/town for maintenance of proper public health in the
city/town. NNM is responsible for maintaining proper cleaning and sanitation conditions within
its jurisdiction. NNM is also responsible for collection and dumping of all kinds of solid waste
that is generated within its municipal area. NNM is involved in sweeping streets, collecting solid
waste from households and transporting it to the dumping yard.
Solid Waste Management
NNM is carrying out Solid Waste Management in their municipal area with the objective to
ensure prevention of diseases and control of pollution. Solid Waste Management mainly involves
collecting, treating, and disposing of solid material that is discarded. Improper disposal of
municipal solid waste can create unhygienic conditions, which in turn, can lead to pollution in
the environment and can cause outbreaks of vector-borne disease.

6
Government Schemes
NNM is likely to obtain grants from the Government of India under the AMRUT and Swachh
Bharat Abhiyaan. Brief details of this mission is enumerated below:
A. Amrut Mission
The main aim of the AMRUT Mission is to provide basic amenities like water supply, sewerage,
urban transport, etc. to households and build amenities in cities that can enhance the quality of
life for all, especially poor and disadvantaged people as national priority. The core elements of
the AMRUT mission lies in providing the basic amenities to the citizens which includes proper
supply of water, sewerage facility, septage, storm water drainage, urban transport, enhancing
amenity value of cities by creating and upgrading green spaces, parks and recreation centres,
especially for children, power to everyone, health facilities to citizen and education to all.
B. Swachh Bharat Abhiyan
As the population in India is increasing rapidly with each passing year, basic sanitation and
sewage facilities seem insufficient to support this huge population. Apparently, weak sanitation
and untreated sewage are believed to have caused various health problems as well as water
pollution.
Tax Department
Tax Department of NNM mainly carries out registration, levy and other tax related activities
within their jurisdiction. Major responsibilities of Tax Division are:
Preparation of demand registers for taxes, inviting objections, levy and collection of tax
from all properties coming under municipal area.
In case of non-payment of taxes, confiscate and auction the property coming under local
bodies‟ municipal area.
Collection of water charges from citizens of their municipal area.
Assessment and collection of tax from new properties.
Levy and collection of water charges within its Municipal area.
Tax collection
NNM has various tax categories. The tax slab remains the same for the last three years. The
details of tax rate depicted below.
Sr. No. Particulars Tax Rates (%)
1 House Tax 7.50
2 Water Tax 15.00

7
3 Entertainment Tax Rs.10 per show
4 Immovable Property Tax 2.00
5 Jal Mulya Rs.72*
* Jal Mulya is charged to residential and commercial is the same for both users.
Government Grants
The basis/underlying criteria for grants are as follows.
A. Grants under 13th
Finance Commission – It is provided by GOI for development of
infrastructure relating to various civic services like Road & Pavements, Sewerage & Drainage,
Bridges & Flyover and Street light post.
B. Grants under Awasthapana Nidhi – This grant is provided by GOI and is mainly used for
residential development of local sewerage, concrete road in local streets, maintenance of street
light, repair & maintenance and developments of public utilities in different areas. 13th Finance
and Awasthapana Nidhi grants are the specific grants and only used for the purpose for which
they are earmarked.
C. Grants from State Government under State Finance Commission – This is a general
purpose grant and used for establishment expenses like salary, pension, other employee benefits
and development of unspecified infrastructure projects. Grants are provided on the basis of
requisition made by Nagar Palika Parishad, based on estimated budget expenses for the year
reduced by the unutilized amount of grants of previous year.
Sources and allocation of Government Grant
NNM receives revenue grants for various activities from UP state government. This grant is
being spent on the operational activities. Grants received for the last three years is summarised
below.
(Rs in crore)
Year 2014 2015 2016
UP State Government 57.49 61.80 55.74
Total Grant 57.49 61.80 55.74
6. Financial Analysis
Revenue and Expenses
(Rs in crore)
For the year ended/ As on March 31, 2013 2014 2015 2016
Tax Revenue 5.06 4.76 4.97 3.47
Property tax 1.47 1.49 1.49 1.65
Other Municipal Taxes 3.60 3.28 3.48 1.82

8
Non-tax Revenues 37.02 59.19 64.39 61.26
Government Grant 35.45 57.49 61.80 55.74
Other Receipts 1.57 1.70 2.59 5.52
Total Revenues (A) 42.08 63.95 69.36 64.72
Expenditure
Administration, Secretary & Finance 24.07 27.29 29.49 37.13
Finance & Bank charges 0.01 0.01 0.00 0.00
Depreciation 1.21 1.04 1.36 1.29
Operation and Maintenance 9.70 13.03 18.36 34.90
Total Expenditure (B) 34.99 41.37 49.22 73.31
Surplus/(Deficit) (A-B) 7.09 22.58 20.14 -8.59
Balance Sheet
(Rs in crore)
For the year ended/ As on March 31, 2013 2014 2015 2016
Fixed Assets
Fixed Assets (gross) 1382.58 1384.40 1389.93 1394.67
Less: Provision for Depreciation 4.46 5.51 6.87 8.15
Fixed Assets (net) 1378.12 1378.90 1383.07 1386.52
Investments (unquoted) 0.00 0.00 0.00 0.00
Current Assets
Inventories 0.38 0.46 0.88 0.45
Receivables 7.07 6.63 6.59 6.71
Cash & Bank Balances (including fixed deposit) 10.35 32.50 48.09 36.43
Other Assets 0.20 0.17 0.06 0.17
Total Assets 1396.11 1418.65 1438.69 1430.27
Networth 1394.65 1417.24 1437.32 1428.73
Capital Fund/Municipal general fund (gross) 1393.52 1416.10 1436.19 1427.60
Less: Value of Roads and Foothpaths 0.00 0.00 0.00 0.00
Capital Fund (net) 1393.52 1416.10 1436.19 1427.60
General Reserves 1.14 1.14 1.14 1.14
Loans 0.00 0.00 0.00 0.00
Current Liabilities & Provisions 1.45 1.41 1.36 1.54
Provisions 0.01 0.03 0.01 0.00
Other Liabilities 0.38 0.46 0.54 0.73
Miscellaneous Deposits 1.06 0.92 0.81 0.80
Total Liabilities 1396.11 1418.65 1438.69 1430.27
Ratio Analysis
Ratios FY13 FY14 FY15 FY16
Receipts / Expenditure (%) 120.3 154.6 140.9 88.3
Deficit / Receipts (%) 16.9 35.3 29.0 -13.3
Debt / Receipts (%) 0.0 0.0 0.0 0.0
Govt. Grants / Receipts (%) 84.2 89.9 89.1 86.1
9
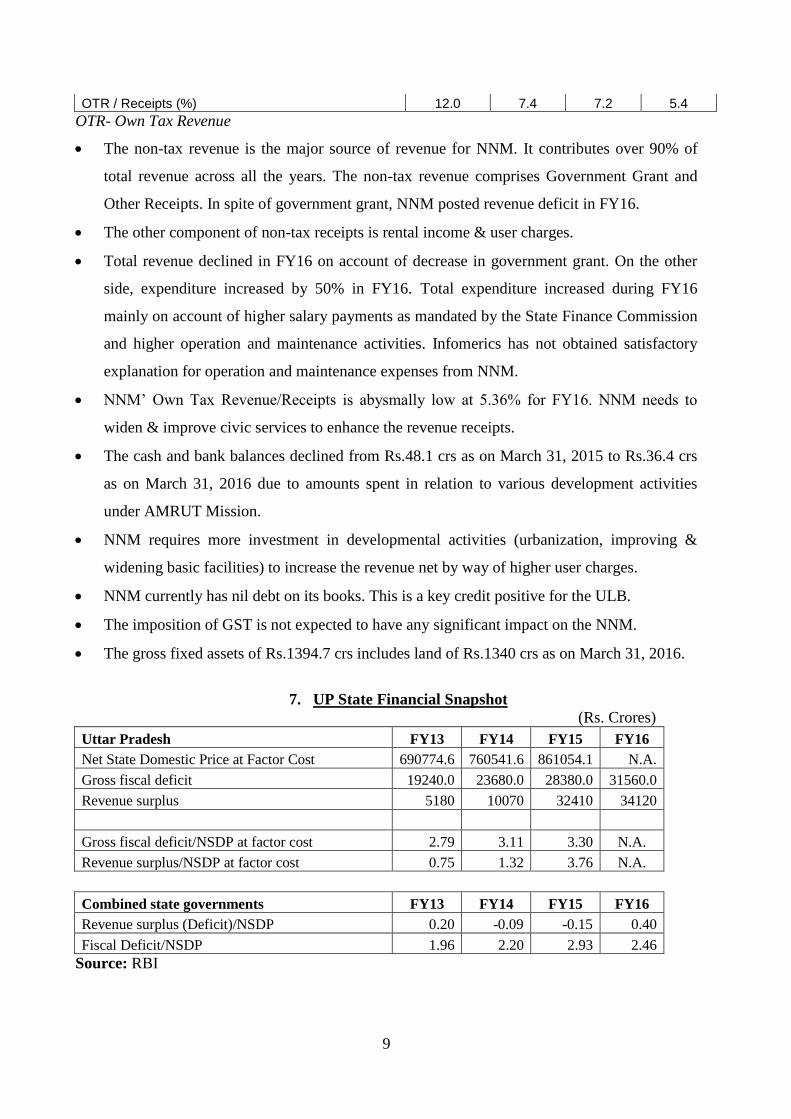
OTR / Receipts (%) 12.0 7.4 7.2 5.4
OTR- Own Tax Revenue
The non-tax revenue is the major source of revenue for NNM. It contributes over 90% of
total revenue across all the years. The non-tax revenue comprises Government Grant and
Other Receipts. In spite of government grant, NNM posted revenue deficit in FY16.
The other component of non-tax receipts is rental income & user charges.
Total revenue declined in FY16 on account of decrease in government grant. On the other
side, expenditure increased by 50% in FY16. Total expenditure increased during FY16
mainly on account of higher salary payments as mandated by the State Finance Commission
and higher operation and maintenance activities. Infomerics has not obtained satisfactory
explanation for operation and maintenance expenses from NNM.
NNM‟ Own Tax Revenue/Receipts is abysmally low at 5.36% for FY16. NNM needs to
widen & improve civic services to enhance the revenue receipts.
The cash and bank balances declined from Rs.48.1 crs as on March 31, 2015 to Rs.36.4 crs
as on March 31, 2016 due to amounts spent in relation to various development activities
under AMRUT Mission.
NNM requires more investment in developmental activities (urbanization, improving &
widening basic facilities) to increase the revenue net by way of higher user charges.
NNM currently has nil debt on its books. This is a key credit positive for the ULB.
The imposition of GST is not expected to have any significant impact on the NNM.
The gross fixed assets of Rs.1394.7 crs includes land of Rs.1340 crs as on March 31, 2016.
7. UP State Financial Snapshot
(Rs. Crores)
Uttar Pradesh FY13 FY14 FY15 FY16
Net State Domestic Price at Factor Cost 690774.6 760541.6 861054.1 N.A.
Gross fiscal deficit 19240.0 23680.0 28380.0 31560.0
Revenue surplus 5180 10070 32410 34120
Gross fiscal deficit/NSDP at factor cost 2.79 3.11 3.30 N.A.
Revenue surplus/NSDP at factor cost 0.75 1.32 3.76 N.A.
Combined state governments FY13 FY14 FY15 FY16
Revenue surplus (Deficit)/NSDP 0.20 -0.09 -0.15 0.40
Fiscal Deficit/NSDP 1.96 2.20 2.93 2.46
Source: RBI

10
The key financial indicators of Uttar Pradesh are comparable to the indicators of combined
Indian state governments.
8. Budget Estimate Analysis FY2017
NNM has submitted the Budget Estimate (BE) figures pertaining to revenue & expenses for
FY17 which are mostly way above the FY16 actual figures. The related parameters for FY17
Budget Estimates and corresponding figures of FY16 (Actual) are furnished below:
(Rs in crs)
For the year ended/ As on March 31,
2016
(Audited)
2017 (Budget
Estimates)
Tax Revenue and other receipts 8.98 10.11
Government Grant 55.74 69.48
Total Revenue (A) 64.72 79.59
Total Expenditure (B) 73.31 79.38
Surplus/(Deficit) (A-B) -8.59 0.21
NNM has projected to earn a revenue of Rs.79.59 crore in FY17 through substantial increase in
government grant to complete various government schemes under Amrut Mission. There are
various ongoing projects under “Amrut Mission” such as improvement in water supply services,
sewerage system and green spaces within its jurisdiction. Expenses are also projected to go up.
However, overall there would be a marginal surplus of around Rs.0.21 crs.
9. KEY RATING FACTORS
Strengths
Characterised by zero debt
Moderate liquidity level
Enabling legislative framework
Weaknesses
Moderate economic base
High dependence on government grants
Weak development activities
Greater density of wards leading to higher overhead costs
Deficit position in FY16

11
Rating Sensitivities
Increasing level of urbanization.
Enhancing & widening of civic services to expand revenue base
Reducing dependence on government grant.
Timely receipt of government grant.

Sr. NoParameter Sub-Parameter Sub Scores (0-10)Mother Score (0-10)Comments
1 Management & Administration 4.50 Average management and administration structure
Political Structure 5.00
Organisation Structure 4.00
2 Operations 2.11 Weak operational level; lack of adequate capex
Water Supply 3.00
Drainage & Sewerage 4.00
Street Lighting 4.00
Health & Sanitation 4.00
Community Centres 0.00
Swachh Bharat Abhiyaan 4.00
Fire & Emergency Services 0.00
Rehabilitation 0.00
Education 0.00
3 Financials 2.07 Weak Financials
Level of Deficits 2.00
Deficit / NSDP 0.00
Receipts / Expenditure 3.00
Deficit / Receipts 3.00
Liquidity Comfort 3.00
Government Grants / Receipts 3.00
Own Tax Revenue / Receipts 0.50
4 Debt Management 7.00 Current zero debt position
Debt 7.00
Debt / Receipts 7.00
Interest Payment / Revenue Receipts 7.00
5 State Finances 5.00 Average state finances
Gross fiscal deficit / NSDP 5.00
Revenue Surplus / NSDP 5.00
6 Economy & Demography 2.38 Weak economy & demography
NSDP growth rate 0.00
Gender ratio 3.50
% of working population 3.00
Political & Quasi-economic stability 3.00
7 Legal Issues Not Available
Current delays / defaults in debt repayments
Material suits filed against the entity
Sum 23.06
Average Score 0.38 BB-

tt*uffi*
ffiwlnfomerics Valuation and Rating pvt Ltd
RATIONALE
Rating & DefinitionInfomerics Valuation and Rating Pvt. Ltd. has assigned an issuer rating of IVR BB- (Is) /Stable Outlook [pronounced IVR double B minus (IS) with Stable Outlook] to NagarNigam Mathura (NNM). Issuers with this rating are consi{ered to offer moderate risk ofdefault regarding timely servicing of financial obligations.
Rating RationaleThe rating takes into consideration moderate economic base, high dependence on
government grants, weak development activities, greater density of wards leading to
higher overhead costs and deficit position in FY|6. Howeyer, the rating derives comfort
from zero boruowing of NNM for the last four yeors, moderdte liquidity level and enabling
legislative framework. Increasing level of urbanisation, enhancing & widening of civic
services to expand revenue base, reducing dependence on government grants and timely
receipt of government grant are the key rating sensitivities.
Background of NNM
Mathura is the binhplace of Lord Krishna and also called as Shri Krishna Janma-Bhoomi.
It is one of the seven cities (SaptaPuri) considered holy by Hindus. Mathura is a city in the
North Indian state of Uttar Pradesh. It is located approximately 50 km north of Agra and
145 km south-east of Delhi. It is the administrative centre of Mathura District of Uttar
Pradesh. Mathura Refinery located in the city is one of the largest oil refineries of Asia
with 8.0 MMTPA refining capacity. Textile printing industry that includes both sari-
printing and fabric dyeing and silver ornaments manufacturing are major industrial
contributors to the region.
Risk Assessment
Characterised by zero debt
{#nrnry*s
r
INFoMERICSassignsIssuerRatingofIVRBB.(Is)withStabie@Nigam, Mathura.

tt&/*h*uJr
.-t -l
lnfomerics Valuation and Rating pvt Ltd lnfeX""fefnS
NNM has not taken any debt. This is a key credit positive for the entity.
Moderate liq uidity level
NNM has sizeable amount of cash balances which is around Rs.36.43 crores as on
March 31,2016. This indicates moderate liquidity for NNM.
E n a b I ing legis lative fro mew o rkNNM is governed by the Uttar Pradesh Municipalities Act, 1916. This Act providespowers to NNM in levying and collection of taxes.
Moderate economic base
NNM is characterised by moderate population level and moderate industrial base.
These constrain the revenue earning capacity.
High dependence on government grants
Government grants form a significant portion of revenue receipts (over of 80%),
which is entirely from State Government. This trend has been continuing for the last
four years.
Weak development activities
NNM is characterised by a low level of asset creation and weak basic service level(nil metering of water connections and 13.6% sewerage network). This acts as ahindrance on its revenue earning capacity.
Greater density of wards leading to higher overhead costs
The number of wards as compared to population is high in NNM. This leads tohigher overhead costs.
Deficit position in FYL6
NNM posted revenue surplus between FYl3-15. However, it posted revenue deficit VIof Rs.8.59 crs. in FY16 inspite of the state government grant of Rs.55.74 crs.

tlrnffi*
ffi@lnfomerics Valuation and
Financial Snapshot
Rating Pvt Ltd
Disclaimer: Infomerics ratings are based on information provided by the issuer on an 'as is where is' basis. lnfomericscredit ratings are an opinion on the credit risk of the issue / issulr and not a recommendation to buy, hold or sellsecurities. Infomerics reserves the right to change, suspend or withdraw the credit ratings at any point in time.Infomerics ratings are opinions on financial statements based on information provided 6y the management andinformation obtained from sources believed by it to be accurate and reliable. The credit quality ratings are notrecommendations to sanction, renew, disburse or recall the concerned bank facilities or to buy, sett or'frotO an-y security.We, however, do not guarantee the accuracy, adequacy or completeness of any information which we accepted andpresumed to be free from misstatement, whether due to error or fraud. We are not responsible for any enors or omissionsor for the results obtained from the use of such information. Most entities whose bank facilities/instruments are rated byus have paid a credit rating fee, based on the amount and type of bank facilities/instruments. ln case ofpartnership/proprietary concerns/Association of Persons (AoPs), the'rating assigned by Infomerics is based on thecap.ital deployed by the partners/proprietor/ AoPs and the financial rtr.rfrh of the firm at present. The rating mayundergo change in case of withdrawal of capital or the unsecured loans bro*ughr in by the partners/proprietor/ Aops inaddition to the financial performance and other relevant factors.
lr
For the;rear entled/ As on March 31, 2013 2014 2015 2016Tax Revenue 5.06 4.76 4.97 3.47Non-tax Revenue 37.02 5,).19 64.39 61.26Total Revenues (A) 42.08 63.95 69.36 64.72Total Expenditqre (B) 34.99 41.37 49.22 73.31Surplus/(Defi cit) (A-B) 7.09 22.58 20.14 -8.s9Tangible Networth 1393.52 14 16.10 1436.19 1427.60Net Fixed Assets 1378.12 r 378.90 13 83.07 t386.52RatiosReceipts / Expenditure (%) 120"3 t54.6 140.9 88.3Surplus (Deficit) Receipts (%) 16.9 35.3 29.0 13.3)Debt / Receipts (9 0.0 0.0 0.0 0.0Govt. Grants / Receipts (%) 84.2 89.9 89. I 86. r
OTR / Receipts (%) 12.0 7.4 7.2 5.4