
CREDIT ANALYSIS Kuwait, Government of - CBK · This Credit Analysis elaborates on Kuwait’s credit...
22
SOVEREIGN & SUPRANATIONAL OCTOBER 2, 2013 RATINGS Kuwait Foreign Currency Local Currency Gov. Bond Rating Aa2 Aa2 Country Ceiling Aa2 Aa2 Bank Deposit Ceiling Aa2 Aa2 Table of Contents: OVERVIEW AND OUTLOOK 1 RATING RATIONALE 2 Economic Strength: Very High (-) 2 Institutional Strength: Moderate (+) 6 Fiscal Strength: Very High (+) 8 Susceptibility to Event Risk: Moderate 11 Rating Range 14 Comparatives 15 APPENDICES 16 Chart Pack 16 Rating History 18 Annual Statistics 19 MOODY’S RELATED RESEARCH 21 Analyst Contacts: SINGAPORE +65.6398.8308 Steffen Dyck +65.6398.8324 Assistant Vice President – Senior Analyst [email protected] Thomas J. Byrne +65.6398.8310 Senior Vice President – Manager [email protected] » contacts continued on the last page This Credit Analysis provides an in-depth discussion of credit rating(s) for Kuwait, Government of and should be read in conjunction with Moody’s most recent Credit Opinion and rating information available on Moody's website . Kuwait, Government of Overview and Outlook Kuwait’s very high levels of economic and fiscal strength support its Aa2 sovereign ratings, with a stable outlook. Kuwait's GDP per capita in purchasing power terms at approximately $40,000 in 2012, a level similar to Germany. National income is boosted by a substantial hydrocarbon endowment 1 , reserves equal 92 years of current production. Kuwait's very high fiscal strength is a key ratings support factor. Kuwait’s fiscal break-even oil price is considerably lower than for most other oil exporters. Kuwait has historically run wide fiscal and overall balance of payments surpluses, which has enabled both the public and private sectors to accumulate substantial net foreign assets. We estimate that the government's financial assets, mainly managed by the Kuwait Investment Authority, far exceed the country's GDP. The government debt burden is very low and declining. However, Kuwait’s high dependence on volatile oil exports causes wide fluctuations in economic performance. Partly because of its vast oil wealth, Kuwait has been slower than its regional peers in developing its non-oil sector through encouraging private sector activity and attracting foreign investment. This has resulted in an oversized public sector relative to the private sector. Strategic economic development and diversification has been hindered by the contentious relationship between the government and the parliament. An abatement of regional political tensions and a sustained improvement in the quality of Kuwait’s political, administrative, and legal institutions and in transparency in the government's balance sheet could exert upward pressure on Kuwait’s sovereign rating. However, downward rating pressures could emerge if the domestic or regional political environment worsened significantly, or if a prolonged period of very low oil prices led to a sustained deterioration of Kuwait’s fiscal and external current accounts, resulting in a depletion of net foreign assets. This Credit Analysis elaborates on Kuwait’s credit profile in terms of Economic Strength, Institutional Strength, Fiscal Strength and Susceptibility to Event Risk, which are the four main analytic factors in Moody’s Sovereign Bond Rating Methodology . 1 It has the 10th largest oil and gas reserves in the world. THIS REPORT WAS REPUBLISHED ON 2 OCTOBER 2013 , WITH CORRECTED RATING OUTLOOKS FOR THE SOVEREIGN RATINGS OF GERMANY AND SOUTH AFRICA, AS WELL AS CORRECTED SOVEREIGN RATING FOR BAHRAIN.
-
Upload
phungkhuong -
Category
Documents
-
view
228 -
download
4
Transcript of CREDIT ANALYSIS Kuwait, Government of - CBK · This Credit Analysis elaborates on Kuwait’s credit...
CREDIT ANALYSIS
SOVEREIGN & SUPRANATIONAL OCTOBER 2, 2013
RATINGS
Kuwait Foreign
Currency Local
Currency Gov. Bond Rating Aa2 Aa2 Country Ceiling Aa2 Aa2 Bank Deposit Ceiling Aa2 Aa2
Table of Contents:
OVERVIEW AND OUTLOOK 1 RATING RATIONALE 2
Economic Strength: Very High (-) 2 Institutional Strength: Moderate (+) 6 Fiscal Strength: Very High (+) 8 Susceptibility to Event Risk: Moderate 11 Rating Range 14 Comparatives 15
APPENDICES 16 Chart Pack 16 Rating History 18 Annual Statistics 19
MOODY’S RELATED RESEARCH 21
Analyst Contacts:
SINGAPORE +65.6398.8308
Steffen Dyck +65.6398.8324 Assistant Vice President – Senior Analyst [email protected]
Thomas J. Byrne +65.6398.8310 Senior Vice President – Manager [email protected]
» contacts continued on the last page
This Credit Analysis provides an in-depth discussion of credit rating(s) for Kuwait, Government of and should be read in conjunction with Moody’s most recent Credit Opinion and rating information available on Moody's website.
Kuwait, Government of
Overview and Outlook
Kuwait’s very high levels of economic and fiscal strength support its Aa2 sovereign ratings, with a stable outlook. Kuwait's GDP per capita in purchasing power terms at approximately $40,000 in 2012, a level similar to Germany. National income is boosted by a substantial hydrocarbon endowment1, reserves equal 92 years of current production.
Kuwait's very high fiscal strength is a key ratings support factor. Kuwait’s fiscal break-even oil price is considerably lower than for most other oil exporters. Kuwait has historically run wide fiscal and overall balance of payments surpluses, which has enabled both the public and private sectors to accumulate substantial net foreign assets. We estimate that the government's financial assets, mainly managed by the Kuwait Investment Authority, far exceed the country's GDP. The government debt burden is very low and declining.
However, Kuwait’s high dependence on volatile oil exports causes wide fluctuations in economic performance. Partly because of its vast oil wealth, Kuwait has been slower than its regional peers in developing its non-oil sector through encouraging private sector activity and attracting foreign investment. This has resulted in an oversized public sector relative to the private sector. Strategic economic development and diversification has been hindered by the contentious relationship between the government and the parliament.
An abatement of regional political tensions and a sustained improvement in the quality of Kuwait’s political, administrative, and legal institutions and in transparency in the government's balance sheet could exert upward pressure on Kuwait’s sovereign rating. However, downward rating pressures could emerge if the domestic or regional political environment worsened significantly, or if a prolonged period of very low oil prices led to a sustained deterioration of Kuwait’s fiscal and external current accounts, resulting in a depletion of net foreign assets.
This Credit Analysis elaborates on Kuwait’s credit profile in terms of Economic Strength, Institutional Strength, Fiscal Strength and Susceptibility to Event Risk, which are the four main analytic factors in Moody’s Sovereign Bond Rating Methodology.
1 It has the 10th largest oil and gas reserves in the world.
THIS REPORT WAS REPUBLISHED ON 2 OCTOBER 2013 , WITH CORRECTED RATING OUTLOOKS FOR THE SOVEREIGN RATINGS OF GERMANY AND SOUTH AFRICA, AS WELL AS CORRECTED SOVEREIGN RATING FOR BAHRAIN.
SOVEREIGN & SUPRANATIONAL
2 OCTOBER 2, 2013
CREDIT ANALYSIS: KUWAIT, GOVERNMENT OF
Rating Rationale
Our determination of a sovereign’s government bond rating is based on the consideration of four rating factors: Economic Strength, Institutional Strength, Fiscal Strength and Susceptibility to Event Risk. When a direct and imminent threat becomes a constraint, that can only lower the preliminary rating range. For more information please see our Sovereign Bond Rating Methodology.
Economic Strength: Very High (-)
Kuwait’s economy is characterized by its large concentration in the oil sector, a high GDP per capita and subdued capital spending
Factor 1
Scale VH+ VH VH- H+ H H- M+ M M- L+ L L- VL+ VL VL-
+ -
Economic strength evaluates the economic structure, primarily reflected in economic growth, the scale of the economy and wealth, as well as in structural factors that point to a country’s long-term economic robustness and shock-absorption capacity. Economic strength is adjusted in case excessive credit growth is present and the risks of a boom-bust cycle are building. This ‘Credit Boom’ adjustment factor can only lower the overall score of economic strength.
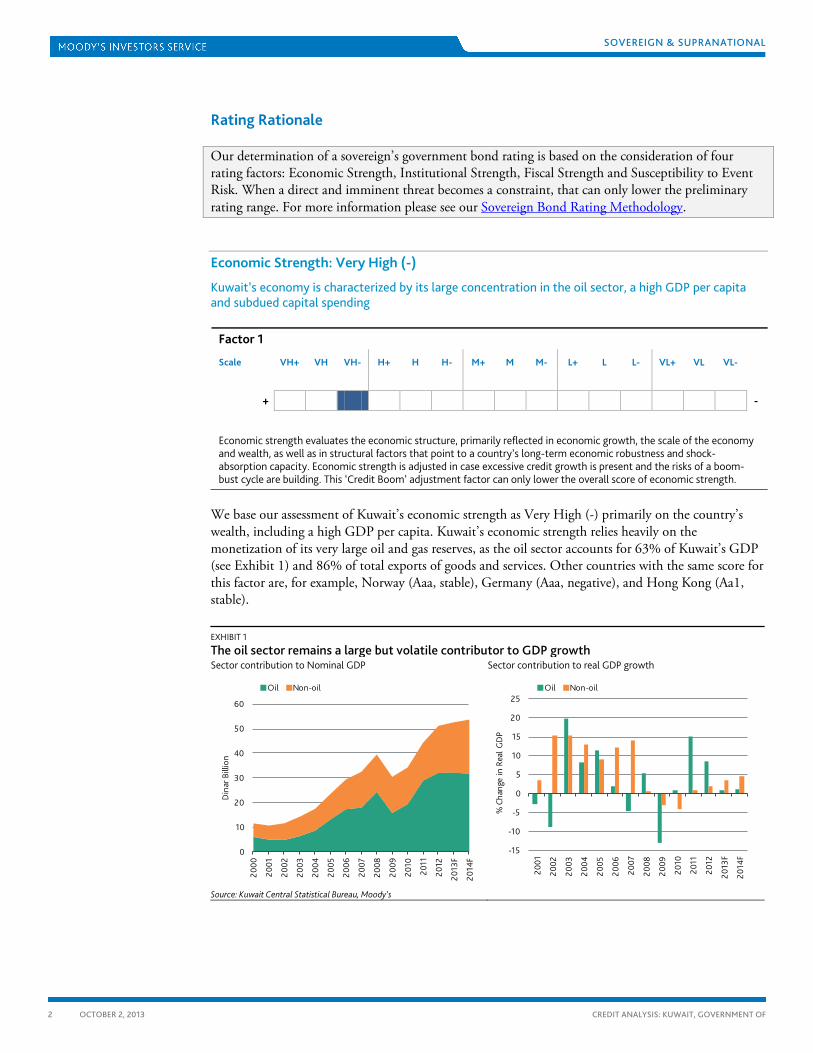
We base our assessment of Kuwait’s economic strength as Very High (-) primarily on the country’s wealth, including a high GDP per capita. Kuwait’s economic strength relies heavily on the monetization of its very large oil and gas reserves, as the oil sector accounts for 63% of Kuwait’s GDP (see Exhibit 1) and 86% of total exports of goods and services. Other countries with the same score for this factor are, for example, Norway (Aaa, stable), Germany (Aaa, negative), and Hong Kong (Aa1, stable).
EXHIBIT 1
The oil sector remains a large but volatile contributor to GDP growth Sector contribution to Nominal GDP
Source: Kuwait Central Statistical Bureau, Moody’s
Sector contribution to real GDP growth
0
10
20
30
40
50
60
2000
2001
2002
2003
2004
2005
2006
2007
2008
2009
2010
2011
2012
2013
F
2014
F
Din
ar B
illio
n
Oil Non-oil
-15
-10
-5
0
5
10
15
20
25
2001
2002
2003
2004
2005
2006
2007
2008
2009
2010
2011
2012
2013
F
2014
F
% C
hang
e in
Rea
l GD
P
Oil Non-oil

SOVEREIGN & SUPRANATIONAL
3 OCTOBER 2, 2013
CREDIT ANALYSIS: KUWAIT, GOVERNMENT OF
The exploitation of large hydrocarbon reserves has helped to build up wealth Kuwait is the 8th largest oil and gas producer globally. In 2012, combined production of oil and gas reached 3.1 million barrels per day (bpd).2 In line with fellow OPEC members, Kuwait has ramped up oil output since 2011 to compensate for the loss of Libyan supply and in 2012, oil production increased 10% to 2.8 million bpd.
Kuwait’s proven hydrocarbon reserves are very large. Oil and gas production began in the 1940s, but the country’s hydrocarbon reserves are still plentiful: Kuwait ranks second globally in per capita terms, with about 35,000 barrels per capita; and at the current rate of production, proven reserves would last 92 years, similar to the UAE (Aa2) and higher than CIS oil producers (see Exhibit 2).3
EXHIBIT 2
Kuwait has large untapped oil reserves Years of hydrocarbon reserves (oil and gas) at the current rate of production
Source: 2013 BP Statistical Review of World Energy
The successful exploitation of vast hydrocarbon resources – at a relatively low production cost – has generated a level of per capita income comparable to that of advanced economies (see Exhibit 3). According to the IMF, Kuwait’s per capita GDP in purchasing power terms reached $40,000 in 2012. This was the 12th highest level in the world and similar to that of Sweden (Aaa, stable) and Germany (Aaa, negative).
2 2013 BP Statistical Review of World Energy 3 Ibid.
0
50
100
150
200
250
300

SOVEREIGN & SUPRANATIONAL
4 OCTOBER 2, 2013
CREDIT ANALYSIS: KUWAIT, GOVERNMENT OF
EXHIBIT 3
Kuwait has a high GDP per capita, on par with developed countries
Source: IMF
High concentration in the hydrocarbon sector leads to increased volatility Kuwait’s income level is highly dependent on global oil price (see Exhibit 4) and fluctuations in oil prices have made Kuwait’s nominal GDP per capita (in $ terms) the seventh most volatile in the world during the 2008-12 period. This is because of a high dependence on oil receipts and the lack of public investment in the economy.
EXHIBIT 4
Kuwait’s GDP Per capita is highly dependent on oil price movements
Source: IMF, IFS, Bloomberg
Whereas Qatar and the UAE have ramped up infrastructure investment, Kuwait struggles to develop its non-oil economy, despite a number of initiatives.
The KD30 billion ($107 billion) four-year development plan announced in 2010 has faced repeated delays due to internal blockages. The periodic confrontation between government and parliament, as well as red-tape, have scaled down the development of energy, transport and health infrastructure.
Nevertheless, the government has considerably increased current expenditures, which drive consumption – and imports. Between 2009-12, spending on wages and salaries increased 51%, a high rate, but similar to its GCC neighbours.
0
5,000
10,000
15,000
20,000
25,000
30,000
35,000
40,000
45,000
USD
0
20
40
60
80
100
120
0
10000
20000
30000
40000
50000
60000
70000
80000
2000 2001 2002 2003 2004 2005 2006 2007 2008 2009 2010 2011 2012 2013F
$ pe
r bar
rel
$ pe
r cap
ita
Kuwait - GDP Per capita ($, LHS) UAE - GDP Per capita ($, LHS) Brent Oil Price ($ per barrel, RHS)
SOVEREIGN & SUPRANATIONAL
5 OCTOBER 2, 2013
CREDIT ANALYSIS: KUWAIT, GOVERNMENT OF
Structural issues impede private sector development and weigh on Kuwait’s medium-term growth prospects The business environment lacks competitiveness. Even though Kuwait ranks a comparatively high 36th out of 148 countries in the 2013 World Economic Forum Competitiveness Index,4 its rank in the 2012 World Bank Ease of Doing Business5 is moderate only, 82nd out of 185 countries. This is reflected in limited foreign direct investment (FDI) in the country: FDI inflows averaged just $600 million annually in the 2005-12 period.
The private sector mainly employs expatriate workers, while about 80% of the Kuwaiti national workforce is employed in the public sector. In our view, the education system is not providing the skill sets that the private companies require. In addition, Kuwait has a predominantly young demographic – about 60% are under 24 years – which poses future challenges in terms of integration in the workforce.
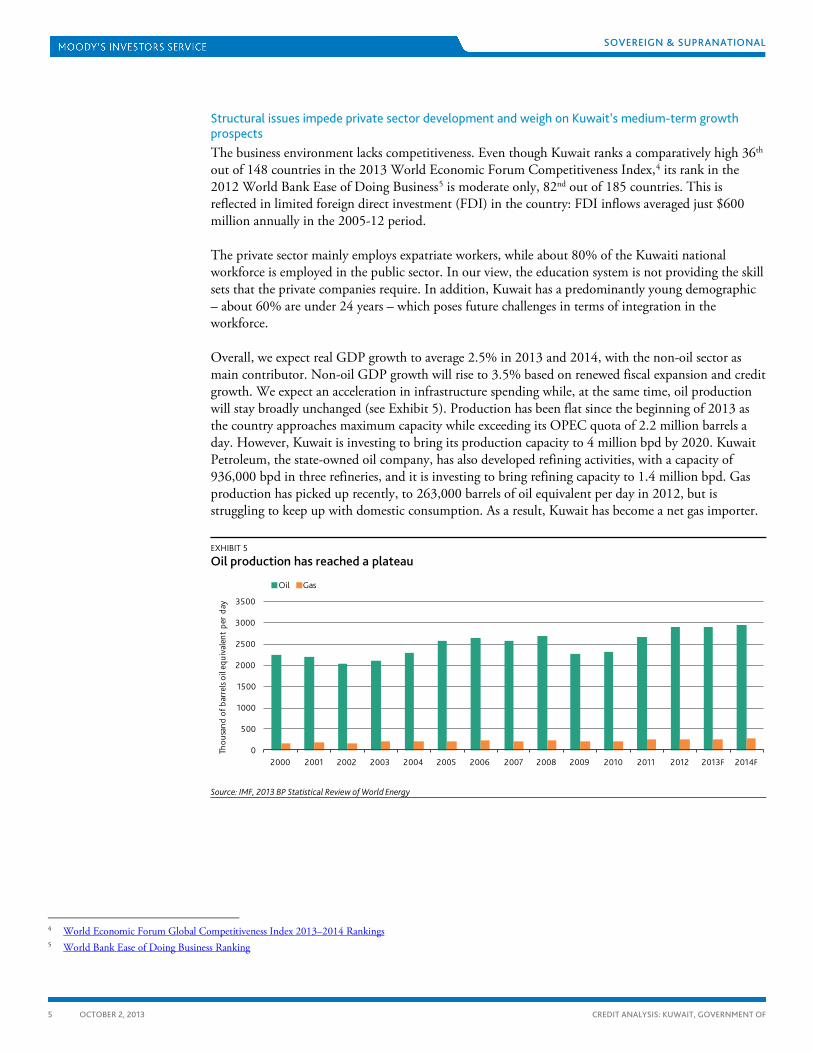
Overall, we expect real GDP growth to average 2.5% in 2013 and 2014, with the non-oil sector as main contributor. Non-oil GDP growth will rise to 3.5% based on renewed fiscal expansion and credit growth. We expect an acceleration in infrastructure spending while, at the same time, oil production will stay broadly unchanged (see Exhibit 5). Production has been flat since the beginning of 2013 as the country approaches maximum capacity while exceeding its OPEC quota of 2.2 million barrels a day. However, Kuwait is investing to bring its production capacity to 4 million bpd by 2020. Kuwait Petroleum, the state-owned oil company, has also developed refining activities, with a capacity of 936,000 bpd in three refineries, and it is investing to bring refining capacity to 1.4 million bpd. Gas production has picked up recently, to 263,000 barrels of oil equivalent per day in 2012, but is struggling to keep up with domestic consumption. As a result, Kuwait has become a net gas importer.
EXHIBIT 5
Oil production has reached a plateau
Source: IMF, 2013 BP Statistical Review of World Energy
4 World Economic Forum Global Competitiveness Index 2013–2014 Rankings 5 World Bank Ease of Doing Business Ranking
0
500
1000
1500
2000
2500
3000
3500
2000 2001 2002 2003 2004 2005 2006 2007 2008 2009 2010 2011 2012 2013F 2014F
Thou
sand
of b
arre
ls oi
l equ
ival
ent
per
day
Oil Gas

SOVEREIGN & SUPRANATIONAL
6 OCTOBER 2, 2013
CREDIT ANALYSIS: KUWAIT, GOVERNMENT OF
Institutional Strength: Moderate (+)
Institutions are still developing, with shortcomings in transparency and government effectiveness.
Factor 2
Scale VH+ VH VH- H+ H H- M+ M M- L+ L L- VL+ VL VL-
+ -
Institutional strength evaluates whether the country’s institutional features are conducive to supporting a country’s ability and willingness to repay its debt. A related aspect of institutional strength is the capacity of the government to conduct sound economic policies that foster economic growth and prosperity. Institutional strength is adjusted for the track record of default. This adjustment can only lower the overall score of institutional strength.
With an assessment of Moderate (+) for institutional strength, Kuwait is on par with countries like Mexico (Baa1, stable), South Africa (Baa1, negative) and Thailand (Baa1, stable). Looking at the World Bank Governance Indicators as a starting point reveals that Kuwait’s scores are broadly in line with the median for those countries that carry a moderate institutional strength assessment (see Exhibit 6).
EXHIBIT 6
World Bank Governance Indicators show that Kuwait’s scores are broadly in line with the countries with a Moderate F2 score6
Source: World Bank
Transparency remains limited Kuwait’s institutional strength is nevertheless still developing when compared with higher-rated countries. A lack of institutional transparency is reflected in the limited scope of official economic data. Kuwait subscribes to the IMF’s General Data Dissemination Standard (GDDS), but it does not report the size and composition of the offshore assets managed by the Kuwait Investment Authority (KIA).
6 World Bank governance scores, composite index rebased on Moody’s Sovereign ratings universe, with 100 the highest and 0 the lowest score
0
25
50
75
100Political Stability
Gov Effectiveness
Rule of Law
Control of Corruption
Voice & Accountability
Regulatory Quality
Kuwait Median - M. F2 Median - Aa Median - GCC
SOVEREIGN & SUPRANATIONAL
7 OCTOBER 2, 2013
CREDIT ANALYSIS: KUWAIT, GOVERNMENT OF
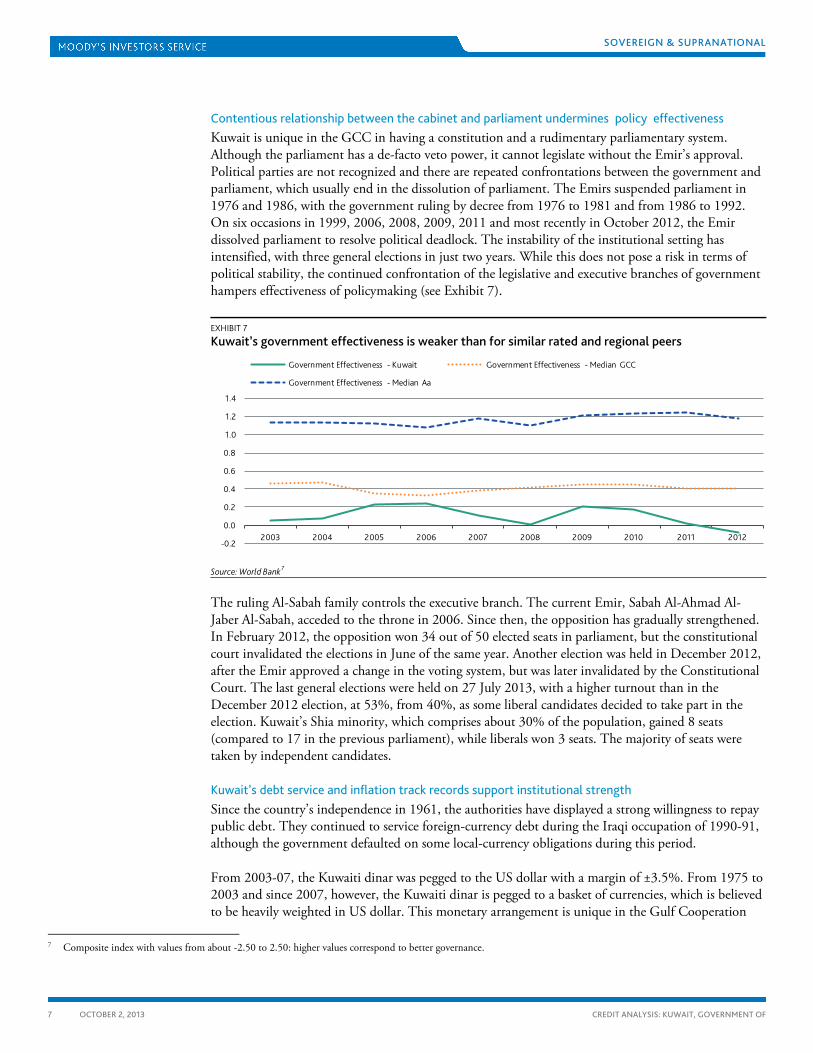
Contentious relationship between the cabinet and parliament undermines policy effectiveness Kuwait is unique in the GCC in having a constitution and a rudimentary parliamentary system. Although the parliament has a de-facto veto power, it cannot legislate without the Emir’s approval. Political parties are not recognized and there are repeated confrontations between the government and parliament, which usually end in the dissolution of parliament. The Emirs suspended parliament in 1976 and 1986, with the government ruling by decree from 1976 to 1981 and from 1986 to 1992. On six occasions in 1999, 2006, 2008, 2009, 2011 and most recently in October 2012, the Emir dissolved parliament to resolve political deadlock. The instability of the institutional setting has intensified, with three general elections in just two years. While this does not pose a risk in terms of political stability, the continued confrontation of the legislative and executive branches of government hampers effectiveness of policymaking (see Exhibit 7).
EXHIBIT 7
Kuwait’s government effectiveness is weaker than for similar rated and regional peers
Source: World Bank 7
The ruling Al-Sabah family controls the executive branch. The current Emir, Sabah Al-Ahmad Al-Jaber Al-Sabah, acceded to the throne in 2006. Since then, the opposition has gradually strengthened. In February 2012, the opposition won 34 out of 50 elected seats in parliament, but the constitutional court invalidated the elections in June of the same year. Another election was held in December 2012, after the Emir approved a change in the voting system, but was later invalidated by the Constitutional Court. The last general elections were held on 27 July 2013, with a higher turnout than in the December 2012 election, at 53%, from 40%, as some liberal candidates decided to take part in the election. Kuwait’s Shia minority, which comprises about 30% of the population, gained 8 seats (compared to 17 in the previous parliament), while liberals won 3 seats. The majority of seats were taken by independent candidates.
Kuwait’s debt service and inflation track records support institutional strength Since the country’s independence in 1961, the authorities have displayed a strong willingness to repay public debt. They continued to service foreign-currency debt during the Iraqi occupation of 1990-91, although the government defaulted on some local-currency obligations during this period.
From 2003-07, the Kuwaiti dinar was pegged to the US dollar with a margin of ±3.5%. From 1975 to 2003 and since 2007, however, the Kuwaiti dinar is pegged to a basket of currencies, which is believed to be heavily weighted in US dollar. This monetary arrangement is unique in the Gulf Cooperation
7 Composite index with values from about -2.50 to 2.50: higher values correspond to better governance.
-0.2
0.0
0.2
0.4
0.6
0.8
1.0
1.2
1.4
2003 2004 2005 2006 2007 2008 2009 2010 2011 2012
Government Effectiveness - Kuwait Government Effectiveness - Median GCC
Government Effectiveness - Median Aa
SOVEREIGN & SUPRANATIONAL
8 OCTOBER 2, 2013
CREDIT ANALYSIS: KUWAIT, GOVERNMENT OF
Council and has helped Kuwait to moderate inflationary pressures in times of rising oil prices. Consumer price inflation averaged 5.3% over the period 2008-12, a relatively high level when compared to its rated peers, but inflation volatility over the past ten years was in line with that of similar rated sovereigns. We expect inflation rates to decline to an average of 3.7% in 2013-15.
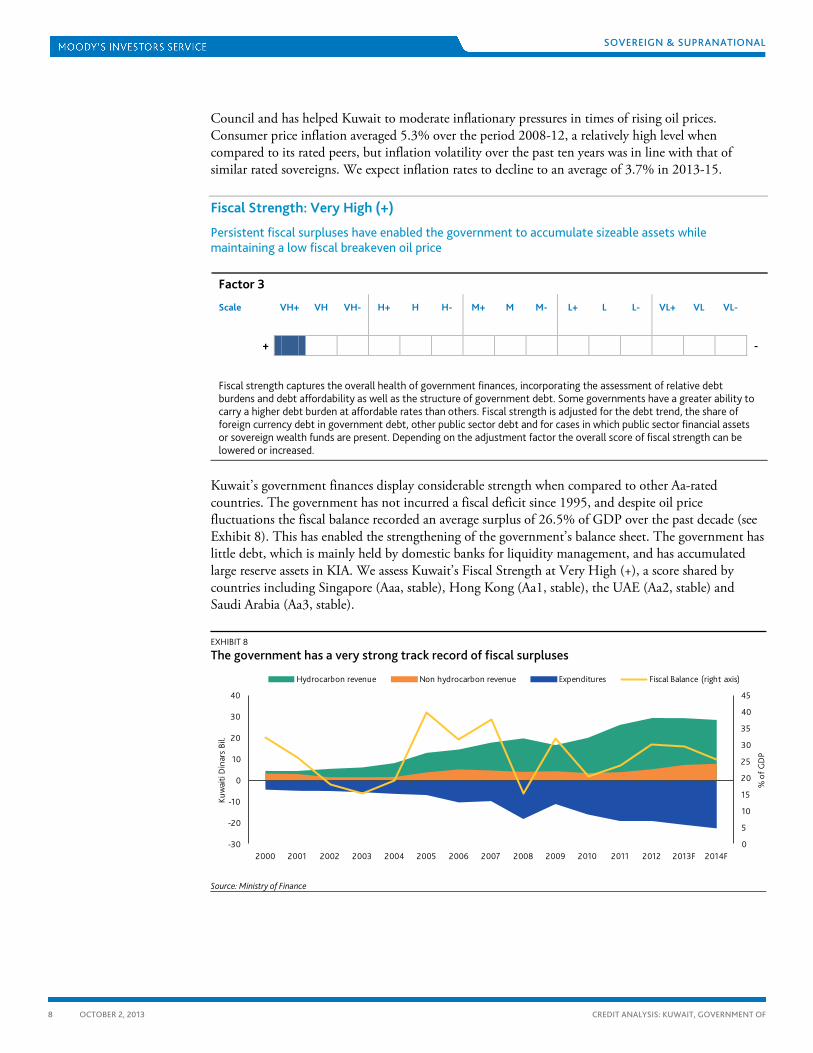
Fiscal Strength: Very High (+)
Persistent fiscal surpluses have enabled the government to accumulate sizeable assets while maintaining a low fiscal breakeven oil price
Factor 3
Scale VH+ VH VH- H+ H H- M+ M M- L+ L L- VL+ VL VL-
+ -
Fiscal strength captures the overall health of government finances, incorporating the assessment of relative debt burdens and debt affordability as well as the structure of government debt. Some governments have a greater ability to carry a higher debt burden at affordable rates than others. Fiscal strength is adjusted for the debt trend, the share of foreign currency debt in government debt, other public sector debt and for cases in which public sector financial assets or sovereign wealth funds are present. Depending on the adjustment factor the overall score of fiscal strength can be lowered or increased.
Kuwait’s government finances display considerable strength when compared to other Aa-rated countries. The government has not incurred a fiscal deficit since 1995, and despite oil price fluctuations the fiscal balance recorded an average surplus of 26.5% of GDP over the past decade (see Exhibit 8). This has enabled the strengthening of the government’s balance sheet. The government has little debt, which is mainly held by domestic banks for liquidity management, and has accumulated large reserve assets in KIA. We assess Kuwait’s Fiscal Strength at Very High (+), a score shared by countries including Singapore (Aaa, stable), Hong Kong (Aa1, stable), the UAE (Aa2, stable) and Saudi Arabia (Aa3, stable).
EXHIBIT 8
The government has a very strong track record of fiscal surpluses
Source: Ministry of Finance
0
5
10
15
20
25
30
35
40
45
-30
-20
-10
0
10
20
30
40
2000 2001 2002 2003 2004 2005 2006 2007 2008 2009 2010 2011 2012 2013F 2014F
% o
f GD
P
Kuw
aiti
Din
ars
Bil.
Hydrocarbon revenue Non hydrocarbon revenue Expenditures Fiscal Balance (right axis)
SOVEREIGN & SUPRANATIONAL
9 OCTOBER 2, 2013
CREDIT ANALYSIS: KUWAIT, GOVERNMENT OF
Kuwait’s fiscal policy is one of the most conservative among oil-exporting countries The Kuwaiti government derives most of its revenue from oil exports, whose contribution to total revenue oscillates between 70% and 80%. In the absence of value added tax or income tax, the tax base remains narrow, and overall government revenues are volatile. Most of the non-oil revenue is composed of investment income from KIA’s assets, which provides a degree of revenue diversification.
The budgeting process is based on conservative assumptions. For instance, the 2013/148 budget is based on an oil price of $70 per barrel, much below the actual Brent oil price, which averaged $109 per barrel over the first 8 months of the year. Also, the budget assumption for oil production is 2.7 million barrels per day, compared to the actual rate exceeding 2.8 million barrels per day on average up to August 2013.9
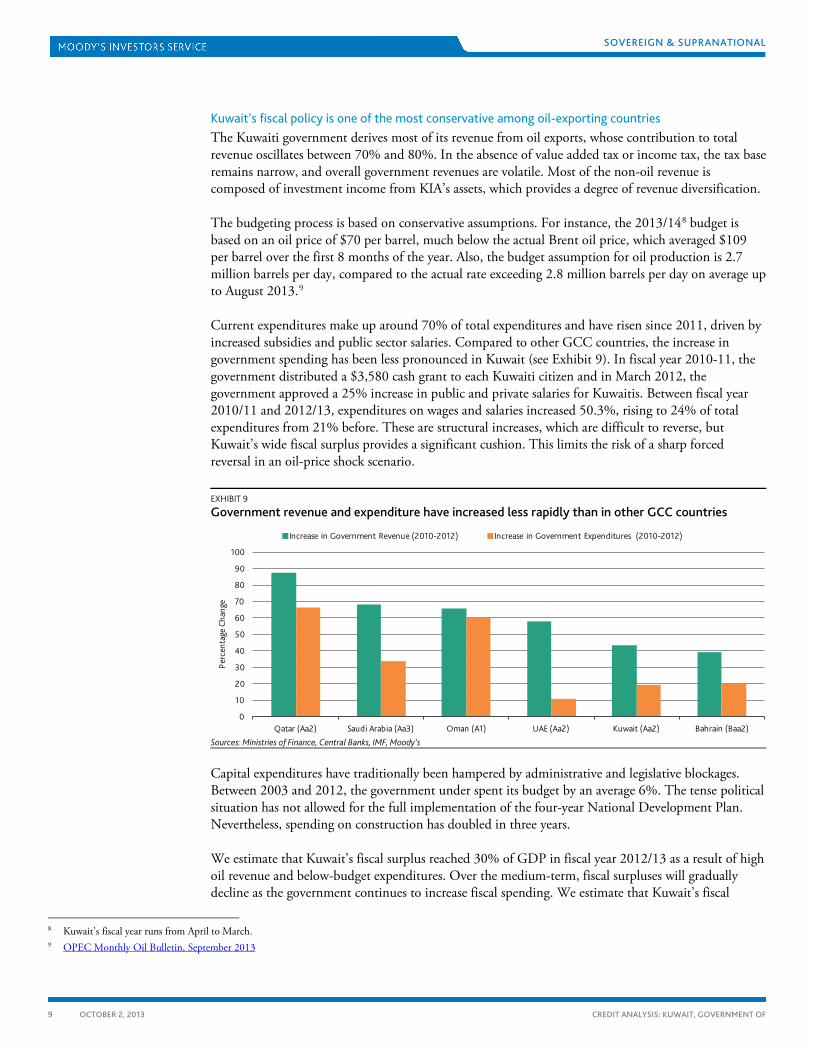
Current expenditures make up around 70% of total expenditures and have risen since 2011, driven by increased subsidies and public sector salaries. Compared to other GCC countries, the increase in government spending has been less pronounced in Kuwait (see Exhibit 9). In fiscal year 2010-11, the government distributed a $3,580 cash grant to each Kuwaiti citizen and in March 2012, the government approved a 25% increase in public and private salaries for Kuwaitis. Between fiscal year 2010/11 and 2012/13, expenditures on wages and salaries increased 50.3%, rising to 24% of total expenditures from 21% before. These are structural increases, which are difficult to reverse, but Kuwait’s wide fiscal surplus provides a significant cushion. This limits the risk of a sharp forced reversal in an oil-price shock scenario.
EXHIBIT 9
Government revenue and expenditure have increased less rapidly than in other GCC countries
Sources: Ministries of Finance, Central Banks, IMF, Moody’s
Capital expenditures have traditionally been hampered by administrative and legislative blockages. Between 2003 and 2012, the government under spent its budget by an average 6%. The tense political situation has not allowed for the full implementation of the four-year National Development Plan. Nevertheless, spending on construction has doubled in three years.
We estimate that Kuwait’s fiscal surplus reached 30% of GDP in fiscal year 2012/13 as a result of high oil revenue and below-budget expenditures. Over the medium-term, fiscal surpluses will gradually decline as the government continues to increase fiscal spending. We estimate that Kuwait’s fiscal
8 Kuwait’s fiscal year runs from April to March. 9 OPEC Monthly Oil Bulletin, September 2013
0
10
20
30
40
50
60
70
80
90
100
Qatar (Aa2) Saudi Arabia (Aa3) Oman (A1) UAE (Aa2) Kuwait (Aa2) Bahrain (Baa2)
Perc
enta
ge C
hang
e
Increase in Government Revenue (2010-2012) Increase in Government Expenditures (2010-2012)

SOVEREIGN & SUPRANATIONAL
10 OCTOBER 2, 2013
CREDIT ANALYSIS: KUWAIT, GOVERNMENT OF
breakeven oil price is the lowest in the GCC after Qatar (see Exhibit 10). Although having increased to an estimated $54 per barrel from $28 in 2009, combined with Kuwait’s sizeable sovereign wealth fund (SWF) assets it provides an ample cushion to face oil price cycles (see Exhibit 11).
EXHIBIT 10
Kuwait’s fiscal breakeven oil price remains lower than for most Gulf oil exporters
Sources: IMF, Moody’s
EXHIBIT 11
Kuwait has extensive assets and a low fiscal breakeven oil price
Sources: IMF, Moody’s
Very low government debt The general government’s gross direct debt has declined in recent years, from around 11% of GDP in 2009/10 to 6.6% of GDP in 2012/13. Around half of it represents short-term domestic debt instruments issued to absorb liquidity at local banks, with the average interest on 1-year notes at 1% since mid-2012.
Potential contingent liabilities exist in the form of debt from deposit-taking banks and government-owned companies, whose external debt amounted to 5.8% and 3.8% of GDP as of 2012.10 No Kuwaiti retail bank has ever defaulted on its obligations, but the government had to intervene to
10 Bank of International Settlements
0 20 40 60 80 100 120
Bahrain
Oman
Saudi
UAE
Kuwait
Qatar
US Dollar per barrel
2009 2011 2013
Kuwait, Aa2/STA
Qatar, Aa2/STA
UAE, Aa2/STA
Saudi Arabia, Aa3/STA
Oman, A1/STA
Bahrain, Baa2/NEG0
1
2
3
4
5
6
7
0 20 40 60 80 100 120 140
SWF
Asse
ts /
Gov
ernm
ent
Expe
nditu
res,
2012
Fiscal Breakeven Oil Price (USD p.b.), 2012

SOVEREIGN & SUPRANATIONAL
11 OCTOBER 2, 2013
CREDIT ANALYSIS: KUWAIT, GOVERNMENT OF
stabilize the domestic financial system during the global financial crisis. Nonetheless, we note that banks hold sufficient capital to absorb losses under both our central and adverse stress scenarios.
Very strong asset position The accumulated oil surpluses have been invested in the KIA, established in 1953, which manages Kuwait’s General Reserve Fund (GRF) and the Future Generations Fund (FGF). The FGF was founded in 1976 with 50% of the GRF balance, while 10% of government revenue is transferred each year to the FGF.11 The FGF now accounts for the bulk of KIA’s assets and invests exclusively in foreign assets – according to its mandate, in a globally diversified portfolio of blue-chip equities, bonds, currencies and real estate.
Susceptibility to Event Risk: Moderate
Geopolitical risks constrain Kuwait’s rating
Factor 4
Scale VL- VL VL+- L- L L+ M- M M+ H- H H+ VH- VH VH+
+ -
Susceptibility to Event Risk evaluates a country’s vulnerability to the risk that sudden events may severely strain public finances, thus increasing the country’s probability of default. Such risks include political, government liquidity, banking sector and external vulnerability risks. Susceptibility of Event Risk is a constraint which can only lower the preliminary rating range as given by combining the first three factors.
We see Kuwait’s susceptibility to event risk as Moderate, reflecting the country’s vulnerability to regional geopolitical developments. Other countries with the same score based on geopolitical event risks include all other GCC countries, as well as Korea (Aa3), Taiwan (Aa3) and Azerbaijan (Baa3).
Political Risk: Moderate
Regional tensions pose a low-probability, high-impact risk for Kuwait Geopolitical risk centers on the escalating tensions between the UN Security Council and Iran over its nuclear weapons program. Tensions between the US and Iran have somewhat abated following the June 2013 elections in Iran, but the Syrian conflict remains a potential flashpoint between Iran and the GCC. Closure of the Strait of Hormuz would pose an especially damaging event as it would disrupt Kuwait’s oil exports.
Through its proximity with Iraq, Kuwait remains vulnerable to contagion of sectarian strife. However, relations between the two countries have normalized, even though Kuwait remains wary of political developments in Iraq. In November 2010, a border treaty was signed by the two countries and a $500 million agreement was reached to settle Gulf-War era debts in March 2012.
Kuwait is home to a significant Shiah population, and it did not participate in the Saudi-UAE intervention in Bahrain in 2011. So far, there has been little evidence of sectarian unrest in Kuwait.
Counterbalancing these risks is Kuwait’s strong relations with the US, other G8 countries and its GCC neighbors. The US has acted to defend its strategic interests in Kuwait by liberating the country from
11 See KIA’s website

SOVEREIGN & SUPRANATIONAL
12 OCTOBER 2, 2013
CREDIT ANALYSIS: KUWAIT, GOVERNMENT OF
Iraqi occupation in 1991 and has maintained close ties with the US. It was designated a “major non-NATO ally” in 2004 and hosts a number of US military facilities.
Domestic risks remain low, despite a more vocal opposition Domestic political event risk is low, in our view. We do not expect the periodic political protests in Kuwait City to turn into an Arab Spring event, as the country’s wealth suggests that political frustration among some in society is not accompanied by a sense of economic deprivation. Kuwait has a generous welfare system and approved a 25% increase in public sector salaries last year.
Government Liquidity Risk: Very Low (-)
Oil price risk is cushioned by KIA’s assets The main economic and financial risks to the public finances relate to fluctuations in global hydrocarbon prices. Having said that, we believe that public finances are well protected from swings in oil and gas prices given the upward trajectory of oil export volumes, low fiscal breakeven prices, and KIA’s large and presumably liquid assets.
Banking Sector Risk: Low
Kuwait’s banking sector has stabilized, with decreased contagion risks for the government The outlook on Kuwait’s banking system is stable, backed by high capitalization ratios and strong liquidity.12 The average (asset-weighted) standalone bank financial strength rating (BFSR) for Kuwaiti banks is D+, which is equivalent to a baa3 baseline credit assessment (BCA).
Credit growth has remained subdued due to the lack of lending opportunities, but we expect profitability will recover somewhat as the provisioning burden of legacy problem loans continues to decline. We expect system-wide non-performing loans (NPLs) to stabilize within the 5%-6% range, down from 10.4% of total loans in 2009. Banks have made considerable progress in rehabilitating their loan books following the 2008-09 crisis, and have made provisions sufficient to write-off nearly 60% of their peak reported NPLs.
There remains above-average risk levels in bank financing of unsecured personal loans for purchase of securities as well as in Kuwaiti investment companies and real-estate companies. However, banks maintain comfortable liquidity reserves and a stable deposit base.
External Vulnerability: Very Low (-)
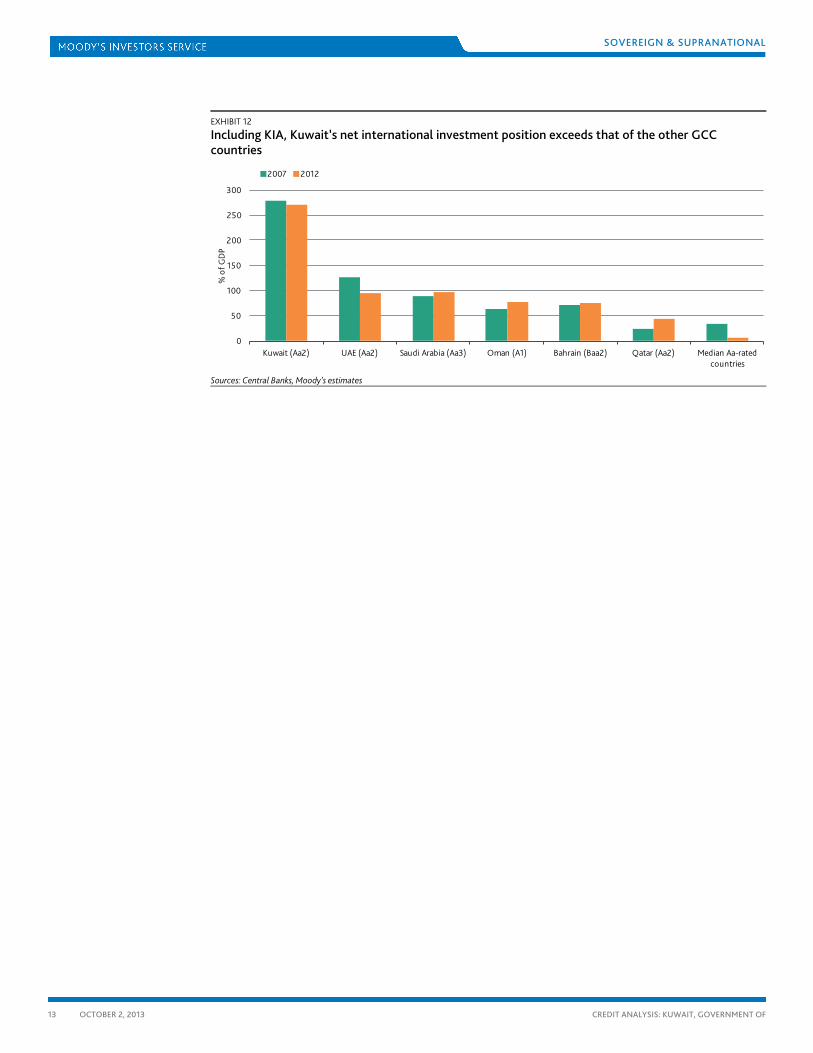
Strong current account surpluses and reserves cushion external risks Kuwait’s most recent official net international investment position (IIP) was equal to 52% of GDP in 2012. The IMF estimates private sector gross foreign assets at 40% of GDP.13 In addition, the IIP excludes assets managed by the KIA, which are not publicly disclosed. We estimate that the KIA managed assets worth $400 billion at the end of fiscal year 2012/13, equal to almost 220% of GDP. Taken together, Kuwait’s net IIP by far exceeds those of regional and similar rated peers (see Exhibit 12).
12 Kuwait, Banking System Outlook, April 2013 13 IMF Article IV report, 2012
SOVEREIGN & SUPRANATIONAL
13 OCTOBER 2, 2013
CREDIT ANALYSIS: KUWAIT, GOVERNMENT OF
EXHIBIT 12
Including KIA, Kuwait’s net international investment position exceeds that of the other GCC countries
Sources: Central Banks, Moody’s estimates
0
50
100
150
200
250
300
Kuwait (Aa2) UAE (Aa2) Saudi Arabia (Aa3) Oman (A1) Bahrain (Baa2) Qatar (Aa2) Median Aa-rated countries
% o
f GD
P
2007 2012
SOVEREIGN & SUPRANATIONAL
14 OCTOBER 2, 2013
CREDIT ANALYSIS: KUWAIT, GOVERNMENT OF
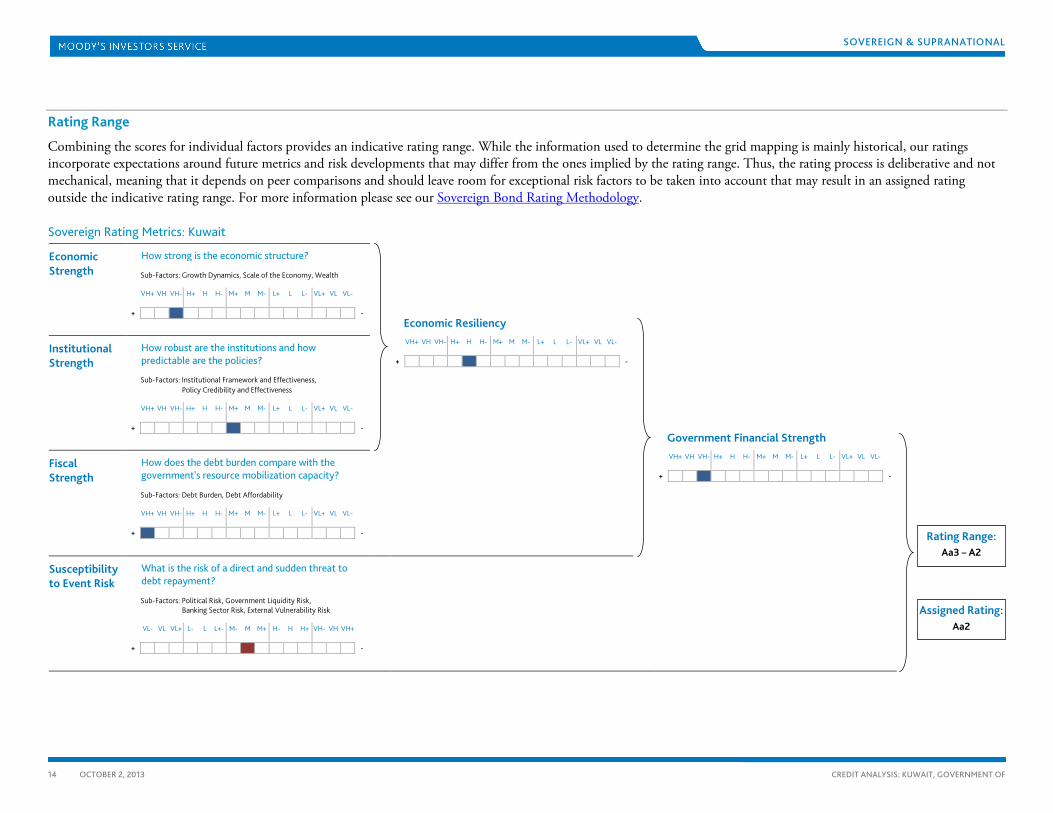
Rating Range
Combining the scores for individual factors provides an indicative rating range. While the information used to determine the grid mapping is mainly historical, our ratings incorporate expectations around future metrics and risk developments that may differ from the ones implied by the rating range. Thus, the rating process is deliberative and not mechanical, meaning that it depends on peer comparisons and should leave room for exceptional risk factors to be taken into account that may result in an assigned rating outside the indicative rating range. For more information please see our Sovereign Bond Rating Methodology.
Sovereign Rating Metrics: Kuwait
Economic Strength
How strong is the economic structure?
Economic Resiliency
Sub-Factors: Growth Dynamics, Scale of the Economy, Wealth
VH+ VH VH- H+ H H- M+ M M- L+ L L- VL+ VL VL-
+ -
Institutional Strength
How robust are the institutions and how predictable are the policies?
VH+ VH VH- H+ H H- M+ M M- L+ L L- VL+ VL VL-
+ -
Government Financial Strength
Sub-Factors: Institutional Framework and Effectiveness,
Policy Credibility and Effectiveness
VH+ VH VH- H+ H H- M+ M M- L+ L L- VL+ VL VL-
+ -
Fiscal Strength
How does the debt burden compare with the government's resource mobilization capacity?
VH+ VH VH- H+ H H- M+ M M- L+ L L- VL+ VL VL-
+ -
Sub-Factors: Debt Burden, Debt Affordability
VH+ VH VH- H+ H H- M+ M M- L+ L L- VL+ VL VL-
+ -
Susceptibility to Event Risk
What is the risk of a direct and sudden threat to debt repayment?
Sub-Factors: Political Risk, Government Liquidity Risk,
Banking Sector Risk, External Vulnerability Risk
VL- VL VL+ L- L L+- M- M M+ H- H H+ VH- VH VH+
+ -
Rating Range: Aa3 – A2
Assigned Rating: Aa2
SOVEREIGN & SUPRANATIONAL
15 OCTOBER 2, 2013
CREDIT ANALYSIS: KUWAIT, GOVERNMENT OF
Comparatives
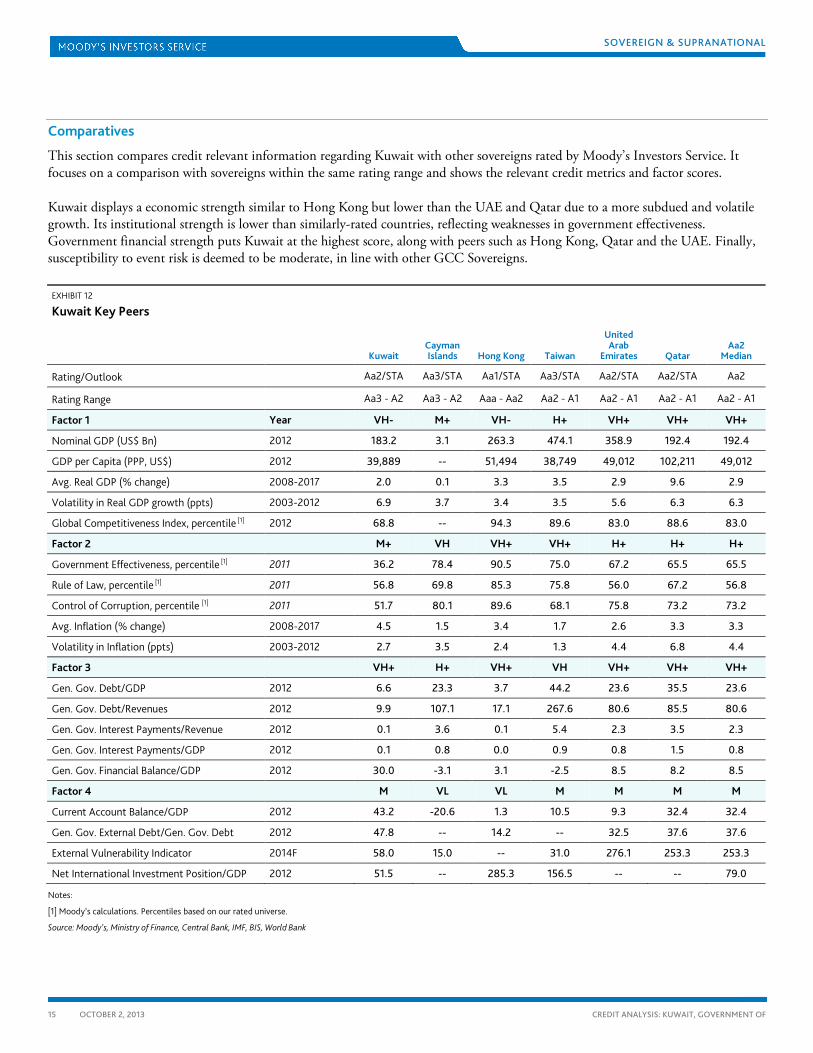
This section compares credit relevant information regarding Kuwait with other sovereigns rated by Moody’s Investors Service. It focuses on a comparison with sovereigns within the same rating range and shows the relevant credit metrics and factor scores.
Kuwait displays a economic strength similar to Hong Kong but lower than the UAE and Qatar due to a more subdued and volatile growth. Its institutional strength is lower than similarly-rated countries, reflecting weaknesses in government effectiveness. Government financial strength puts Kuwait at the highest score, along with peers such as Hong Kong, Qatar and the UAE. Finally, susceptibility to event risk is deemed to be moderate, in line with other GCC Sovereigns.
EXHIBIT 12
Kuwait Key Peers
Kuwait Cayman Islands Hong Kong Taiwan
United Arab
Emirates Qatar Aa2
Median
Rating/Outlook Aa2/STA Aa3/STA Aa1/STA Aa3/STA Aa2/STA Aa2/STA Aa2
Rating Range Aa3 - A2 Aa3 - A2 Aaa - Aa2 Aa2 - A1 Aa2 - A1 Aa2 - A1 Aa2 - A1
Factor 1 Year VH- M+ VH- H+ VH+ VH+ VH+
Nominal GDP (US$ Bn) 2012 183.2 3.1 263.3 474.1 358.9 192.4 192.4
GDP per Capita (PPP, US$) 2012 39,889 -- 51,494 38,749 49,012 102,211 49,012
Avg. Real GDP (% change) 2008-2017 2.0 0.1 3.3 3.5 2.9 9.6 2.9
Volatility in Real GDP growth (ppts) 2003-2012 6.9 3.7 3.4 3.5 5.6 6.3 6.3
Global Competitiveness Index, percentile [1] 2012 68.8 -- 94.3 89.6 83.0 88.6 83.0
Factor 2 M+ VH VH+ VH+ H+ H+ H+
Government Effectiveness, percentile [1] 2011 36.2 78.4 90.5 75.0 67.2 65.5 65.5
Rule of Law, percentile [1] 2011 56.8 69.8 85.3 75.8 56.0 67.2 56.8
Control of Corruption, percentile [1] 2011 51.7 80.1 89.6 68.1 75.8 73.2 73.2
Avg. Inflation (% change) 2008-2017 4.5 1.5 3.4 1.7 2.6 3.3 3.3
Volatility in Inflation (ppts) 2003-2012 2.7 3.5 2.4 1.3 4.4 6.8 4.4
Factor 3 VH+ H+ VH+ VH VH+ VH+ VH+
Gen. Gov. Debt/GDP 2012 6.6 23.3 3.7 44.2 23.6 35.5 23.6
Gen. Gov. Debt/Revenues 2012 9.9 107.1 17.1 267.6 80.6 85.5 80.6
Gen. Gov. Interest Payments/Revenue 2012 0.1 3.6 0.1 5.4 2.3 3.5 2.3
Gen. Gov. Interest Payments/GDP 2012 0.1 0.8 0.0 0.9 0.8 1.5 0.8
Gen. Gov. Financial Balance/GDP 2012 30.0 -3.1 3.1 -2.5 8.5 8.2 8.5
Factor 4 M VL VL M M M M
Current Account Balance/GDP 2012 43.2 -20.6 1.3 10.5 9.3 32.4 32.4
Gen. Gov. External Debt/Gen. Gov. Debt 2012 47.8 -- 14.2 -- 32.5 37.6 37.6
External Vulnerability Indicator 2014F 58.0 15.0 -- 31.0 276.1 253.3 253.3
Net International Investment Position/GDP 2012 51.5 -- 285.3 156.5 -- -- 79.0
Notes:
[1] Moody’s calculations. Percentiles based on our rated universe.
Source: Moody’s, Ministry of Finance, Central Bank, IMF, BIS, World Bank
SOVEREIGN & SUPRANATIONAL
16 OCTOBER 2, 2013
CREDIT ANALYSIS: KUWAIT, GOVERNMENT OF
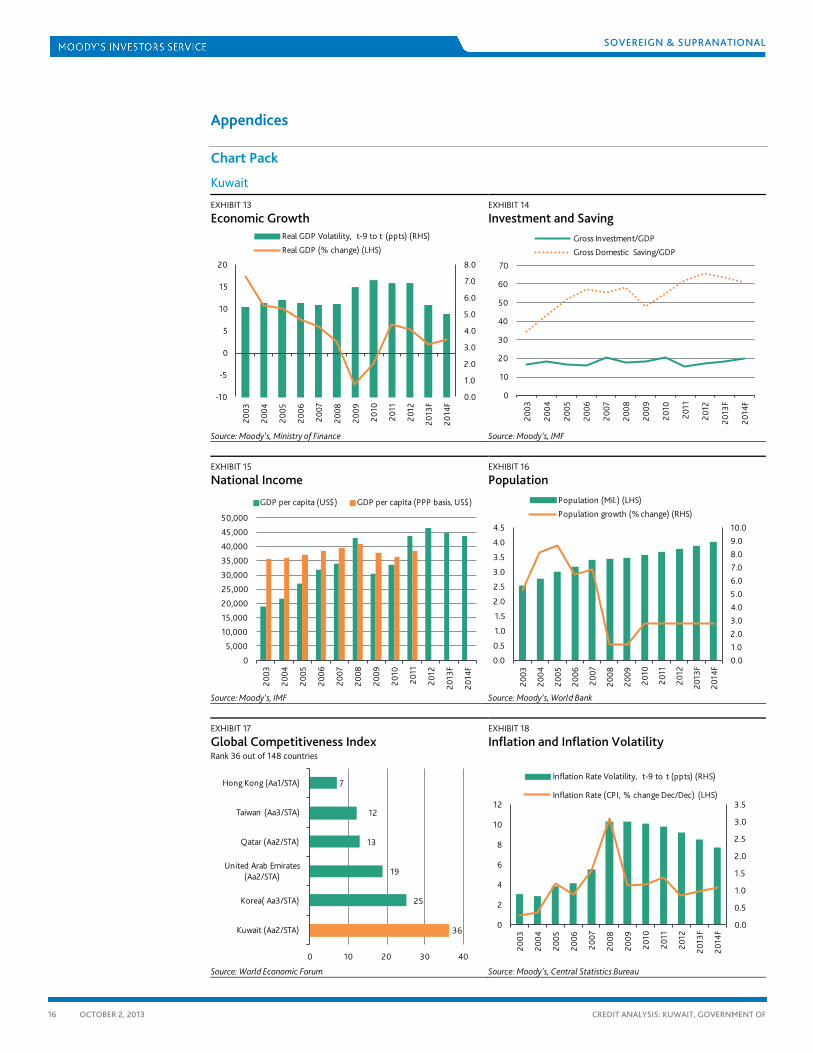
Appendices
Chart Pack
Kuwait
EXHIBIT 13
Economic Growth
Source: Moody’s, Ministry of Finance
EXHIBIT 14
Investment and Saving
Source: Moody’s, IMF
EXHIBIT 15
National Income
Source: Moody’s, IMF
EXHIBIT 16
Population
Source: Moody’s, World Bank
EXHIBIT 17
Global Competitiveness Index Rank 36 out of 148 countries
Source: World Economic Forum
EXHIBIT 18
Inflation and Inflation Volatility
Source: Moody’s, Central Statistics Bureau
0.0
1.0
2.0
3.0
4.0
5.0
6.0
7.0
8.0
-10
-5
0
5
10
15
20
2003
2004
2005
2006
2007
2008
2009
2010
2011
2012
2013
F
2014
F
Real GDP Volatility, t-9 to t (ppts) (RHS)
Real GDP (% change) (LHS)
0
10
20
30
40
50
60
70
2003
2004
2005
2006
2007
2008
2009
2010
2011
2012
2013
F
2014
F
Gross Investment/GDP
Gross Domestic Saving/GDP
0
5,000
10,000
15,000
20,000
25,000
30,000
35,000
40,000
45,000
50,000
2003
2004
2005
2006
2007
2008
2009
2010
2011
2012
2013
F
2014
F
GDP per capita (US$) GDP per capita (PPP basis, US$)
0.01.02.03.04.05.06.07.08.09.010.0
0.0
0.5
1.0
1.5
2.0
2.5
3.0
3.5
4.0
4.520
03
2004
2005
2006
2007
2008
2009
2010
2011
2012
2013
F
2014
F
Population (Mil.) (LHS)
Population growth (% change) (RHS)
36
25
19
13
12
7
0 10 20 30 40
Kuwait (Aa2/STA)
Korea( Aa3/STA)
United Arab Emirates (Aa2/STA)
Qatar (Aa2/STA)
Taiwan (Aa3/STA)
Hong Kong (Aa1/STA)
0.0
0.5
1.0
1.5
2.0
2.5
3.0
3.5
0
2
4
6
8
10
12
2003
2004
2005
2006
2007
2008
2009
2010
2011
2012
2013
F
2014
F
Inflation Rate Volatility, t-9 to t (ppts) (RHS)
Inflation Rate (CPI, % change Dec/Dec) (LHS)

SOVEREIGN & SUPRANATIONAL
17 OCTOBER 2, 2013
CREDIT ANALYSIS: KUWAIT, GOVERNMENT OF
EXHIBIT 19
Institutional Framework and Effectiveness
Notes: [1] Composite index with values from about -2.50 to 2.50: higher
values correspond to better governance. Source: World Bank Governance Indicators
EXHIBIT 20
Debt Burden
Source: Moody’s, Central Bank, IMF
EXHIBIT 21
Debt Affordability
Source: Moody’s, Ministry of Finance, IMF
EXHIBIT 22
Financial Balance
Source: Moody’s, Ministry of Finance, IMF
EXHIBIT 23
Government Liquidity Risk
Source: Moody’s, BIS, IMF
EXHIBIT 24
External Vulnerability Risk
Source: Moody’s, Central Bank, IMF
-0.2
0.0
0.2
0.4
0.6
0.8
1.0
1.2
1.4
2002
2003
2004
2005
2006
2007
2008
2009
2010
2011
Government Effectiveness[1] Rule of Law[1]Control of Corruption[1]
0
5
10
15
20
25
30
35
40
0
5
10
15
20
2003
2004
2005
2006
2007
2008
2009
2010
2011
2012
2013
F
2014
F
Gen. Gov. Debt/GDP (%) (LHS)
Gen. Gov. Debt/Gen. Gov. Revenue (%) (RHS)
0.0
0.2
0.4
0.6
0.8
1.0
1.2
0.0
0.1
0.2
0.3
0.4
0.5
0.6
2003
2004
2005
2006
2007
2008
2009
2010
2011
2012
2013
F
2014
FGen. Gov. Interest Payment/GDP (%) (LHS)
Gen. Gov. Interest Payment/Gen. Gov. Revenue (%) (RHS)
0
5
10
15
20
25
30
35
40
45
2003
2004
2005
2006
2007
2008
2009
2010
2011
2012
2013
F
2014
F
Gen. Gov. Financial Balance/GDP (%)
Gen. Gov. Primary Balance/GDP (%)
0
10
20
30
40
50
0
5
10
15
20
2003
2004
2005
2006
2007
2008
2009
2010
2011
2012
2013
F
2014
F
Gen. Gov. Debt/GDP (%) (LHS)
Gen. Gov. External Debt/Total Gen. Gov. Debt (%) (RHS)
0
5
10
15
20
25
30
35
40
45
50
0
20
40
60
80
100
120
2001
2002
2003
2004
2005
2006
2007
2008
2009
2010
2011
2012
Net International Investment Position/GDP (%) (LHS)
Current Account Balance/GDP (%) (RHS)
SOVEREIGN & SUPRANATIONAL
18 OCTOBER 2, 2013
CREDIT ANALYSIS: KUWAIT, GOVERNMENT OF
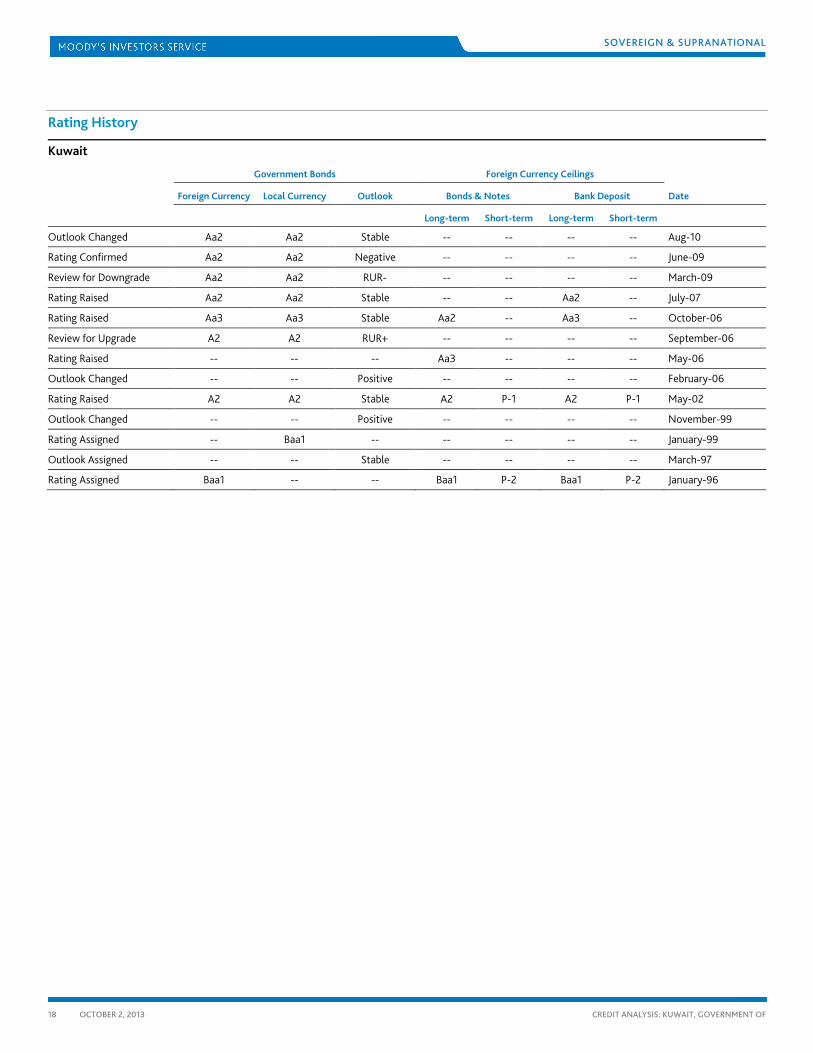
Rating History
Kuwait
Government Bonds Foreign Currency Ceilings
Foreign Currency Local Currency Outlook Bonds & Notes Bank Deposit Date
Long-term Short-term Long-term Short-term
Outlook Changed Aa2 Aa2 Stable -- -- -- -- Aug-10
Rating Confirmed Aa2 Aa2 Negative -- -- -- -- June-09
Review for Downgrade Aa2 Aa2 RUR- -- -- -- -- March-09
Rating Raised Aa2 Aa2 Stable -- -- Aa2 -- July-07
Rating Raised Aa3 Aa3 Stable Aa2 -- Aa3 -- October-06
Review for Upgrade A2 A2 RUR+ -- -- -- -- September-06
Rating Raised -- -- -- Aa3 -- -- -- May-06
Outlook Changed -- -- Positive -- -- -- -- February-06
Rating Raised A2 A2 Stable A2 P-1 A2 P-1 May-02
Outlook Changed -- -- Positive -- -- -- -- November-99
Rating Assigned -- Baa1 -- -- -- -- -- January-99
Outlook Assigned -- -- Stable -- -- -- -- March-97
Rating Assigned Baa1 -- -- Baa1 P-2 Baa1 P-2 January-96
SOVEREIGN & SUPRANATIONAL
19 OCTOBER 2, 2013
CREDIT ANALYSIS: KUWAIT, GOVERNMENT OF
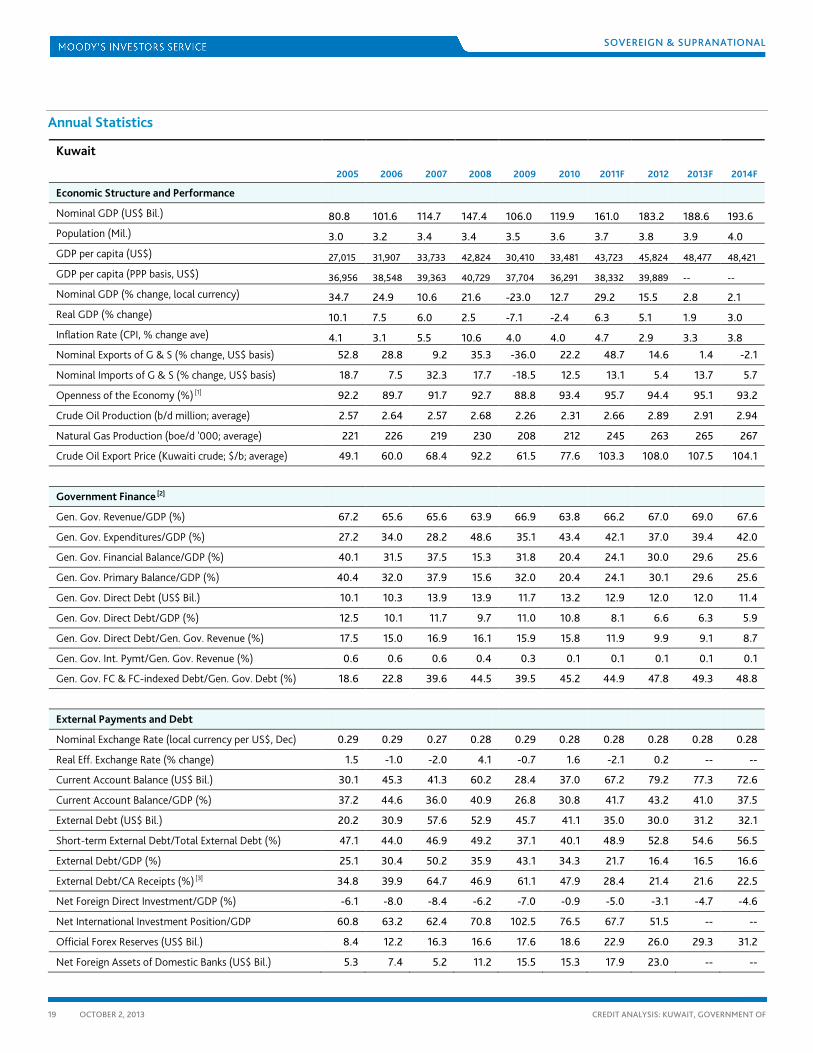
Annual Statistics
Kuwait
2005 2006 2007 2008 2009 2010 2011F 2012 2013F 2014F
Economic Structure and Performance
Nominal GDP (US$ Bil.) 80.8 101.6 114.7 147.4 106.0 119.9 161.0 183.2 188.6 193.6
Population (Mil.) 3.0 3.2 3.4 3.4 3.5 3.6 3.7 3.8 3.9 4.0
GDP per capita (US$) 27,015 31,907 33,733 42,824 30,410 33,481 43,723 45,824 48,477 48,421
GDP per capita (PPP basis, US$) 36,956 38,548 39,363 40,729 37,704 36,291 38,332 39,889 -- --
Nominal GDP (% change, local currency) 34.7 24.9 10.6 21.6 -23.0 12.7 29.2 15.5 2.8 2.1
Real GDP (% change) 10.1 7.5 6.0 2.5 -7.1 -2.4 6.3 5.1 1.9 3.0
Inflation Rate (CPI, % change ave) 4.1 3.1 5.5 10.6 4.0 4.0 4.7 2.9 3.3 3.8
Nominal Exports of G & S (% change, US$ basis) 52.8 28.8 9.2 35.3 -36.0 22.2 48.7 14.6 1.4 -2.1
Nominal Imports of G & S (% change, US$ basis) 18.7 7.5 32.3 17.7 -18.5 12.5 13.1 5.4 13.7 5.7
Openness of the Economy (%) [1] 92.2 89.7 91.7 92.7 88.8 93.4 95.7 94.4 95.1 93.2
Crude Oil Production (b/d million; average) 2.57 2.64 2.57 2.68 2.26 2.31 2.66 2.89 2.91 2.94
Natural Gas Production (boe/d '000; average) 221 226 219 230 208 212 245 263 265 267
Crude Oil Export Price (Kuwaiti crude; $/b; average) 49.1 60.0 68.4 92.2 61.5 77.6 103.3 108.0 107.5 104.1
Government Finance [2]
Gen. Gov. Revenue/GDP (%) 67.2 65.6 65.6 63.9 66.9 63.8 66.2 67.0 69.0 67.6
Gen. Gov. Expenditures/GDP (%) 27.2 34.0 28.2 48.6 35.1 43.4 42.1 37.0 39.4 42.0
Gen. Gov. Financial Balance/GDP (%) 40.1 31.5 37.5 15.3 31.8 20.4 24.1 30.0 29.6 25.6
Gen. Gov. Primary Balance/GDP (%) 40.4 32.0 37.9 15.6 32.0 20.4 24.1 30.1 29.6 25.6
Gen. Gov. Direct Debt (US$ Bil.) 10.1 10.3 13.9 13.9 11.7 13.2 12.9 12.0 12.0 11.4
Gen. Gov. Direct Debt/GDP (%) 12.5 10.1 11.7 9.7 11.0 10.8 8.1 6.6 6.3 5.9
Gen. Gov. Direct Debt/Gen. Gov. Revenue (%) 17.5 15.0 16.9 16.1 15.9 15.8 11.9 9.9 9.1 8.7
Gen. Gov. Int. Pymt/Gen. Gov. Revenue (%) 0.6 0.6 0.6 0.4 0.3 0.1 0.1 0.1 0.1 0.1
Gen. Gov. FC & FC-indexed Debt/Gen. Gov. Debt (%) 18.6 22.8 39.6 44.5 39.5 45.2 44.9 47.8 49.3 48.8
External Payments and Debt
Nominal Exchange Rate (local currency per US$, Dec) 0.29 0.29 0.27 0.28 0.29 0.28 0.28 0.28 0.28 0.28
Real Eff. Exchange Rate (% change) 1.5 -1.0 -2.0 4.1 -0.7 1.6 -2.1 0.2 -- --
Current Account Balance (US$ Bil.) 30.1 45.3 41.3 60.2 28.4 37.0 67.2 79.2 77.3 72.6
Current Account Balance/GDP (%) 37.2 44.6 36.0 40.9 26.8 30.8 41.7 43.2 41.0 37.5
External Debt (US$ Bil.) 20.2 30.9 57.6 52.9 45.7 41.1 35.0 30.0 31.2 32.1
Short-term External Debt/Total External Debt (%) 47.1 44.0 46.9 49.2 37.1 40.1 48.9 52.8 54.6 56.5
External Debt/GDP (%) 25.1 30.4 50.2 35.9 43.1 34.3 21.7 16.4 16.5 16.6
External Debt/CA Receipts (%) [3] 34.8 39.9 64.7 46.9 61.1 47.9 28.4 21.4 21.6 22.5
Net Foreign Direct Investment/GDP (%) -6.1 -8.0 -8.4 -6.2 -7.0 -0.9 -5.0 -3.1 -4.7 -4.6
Net International Investment Position/GDP 60.8 63.2 62.4 70.8 102.5 76.5 67.7 51.5 -- --
Official Forex Reserves (US$ Bil.) 8.4 12.2 16.3 16.6 17.6 18.6 22.9 26.0 29.3 31.2
Net Foreign Assets of Domestic Banks (US$ Bil.) 5.3 7.4 5.2 11.2 15.5 15.3 17.9 23.0 -- --
SOVEREIGN & SUPRANATIONAL
20 OCTOBER 2, 2013
CREDIT ANALYSIS: KUWAIT, GOVERNMENT OF
Kuwait
2005 2006 2007 2008 2009 2010 2011F 2012 2013F 2014F
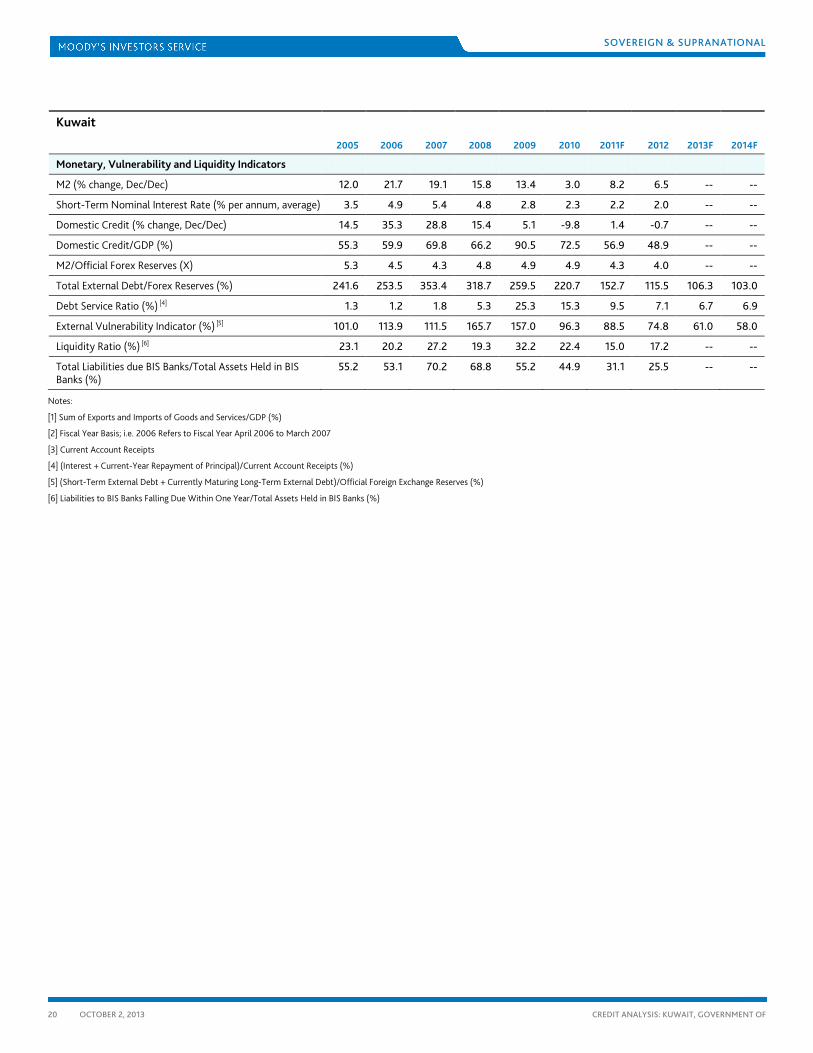
Monetary, Vulnerability and Liquidity Indicators
M2 (% change, Dec/Dec) 12.0 21.7 19.1 15.8 13.4 3.0 8.2 6.5 -- --
Short-Term Nominal Interest Rate (% per annum, average) 3.5 4.9 5.4 4.8 2.8 2.3 2.2 2.0 -- --
Domestic Credit (% change, Dec/Dec) 14.5 35.3 28.8 15.4 5.1 -9.8 1.4 -0.7 -- --
Domestic Credit/GDP (%) 55.3 59.9 69.8 66.2 90.5 72.5 56.9 48.9 -- --
M2/Official Forex Reserves (X) 5.3 4.5 4.3 4.8 4.9 4.9 4.3 4.0 -- --
Total External Debt/Forex Reserves (%) 241.6 253.5 353.4 318.7 259.5 220.7 152.7 115.5 106.3 103.0
Debt Service Ratio (%) [4] 1.3 1.2 1.8 5.3 25.3 15.3 9.5 7.1 6.7 6.9
External Vulnerability Indicator (%) [5] 101.0 113.9 111.5 165.7 157.0 96.3 88.5 74.8 61.0 58.0
Liquidity Ratio (%) [6] 23.1 20.2 27.2 19.3 32.2 22.4 15.0 17.2 -- --
Total Liabilities due BIS Banks/Total Assets Held in BIS Banks (%)
55.2 53.1 70.2 68.8 55.2 44.9 31.1 25.5 -- --
Notes:
[1] Sum of Exports and Imports of Goods and Services/GDP (%)
[2] Fiscal Year Basis; i.e. 2006 Refers to Fiscal Year April 2006 to March 2007
[3] Current Account Receipts
[4] (Interest + Current-Year Repayment of Principal)/Current Account Receipts (%)
[5] (Short-Term External Debt + Currently Maturing Long-Term External Debt)/Official Foreign Exchange Reserves (%)
[6] Liabilities to BIS Banks Falling Due Within One Year/Total Assets Held in BIS Banks (%)
SOVEREIGN & SUPRANATIONAL
21 OCTOBER 2, 2013
CREDIT ANALYSIS: KUWAIT, GOVERNMENT OF
Moody’s Related Research
Credit Opinion:
» Kuwait, April 2013
Outlook:
» MENA Sovereigns – 2013 Outlook: Growing Divergence Between GCC and other MENA Economies Since Global Crisis and Arab Spring, March 2013 (151334)
Special Comment:
» GCC Governments: Sizeable Sovereign Wealth Funds Support Rating Resiliency, August 2013 (155840)
Banking System Outlook:
» Kuwait, April 2013 (154861)
Statistical Handbook:
» Country Credit Statistical Handbook, May 2013 (153213)
Rating Methodologies:
» Sovereign Bond Ratings, September 2013 (157547)
» Sovereign Default and Recovery Rates, June 2013 (154805)
Moody’s Website Links:
» Sovereign Risk Group Webpage
» Sovereign Ratings List
To access any of these reports, click on the entry above. Note that these references are current as of the date of publication of this report and that more recent reports may be available. All research may not be available to all clients.

SOVEREIGN & SUPRANATIONAL
22 OCTOBER 2, 2013
CREDIT ANALYSIS: KUWAIT, GOVERNMENT OF
» contacts continued from page 1
Analyst Contacts:
DUBAI +971.4.401.9536
Mathias Angonin +971.4.237.9548 Associate Analyst [email protected]
NEW YORK +1.212.553.1653
Bart Oosterveld +1.212.553.7914 Managing Director - Sovereign Risk [email protected]
Report Number: 158678
Authors Mathias Angonin Steffen Dyck
Production Specialist Kerstin Thoma
© 2013 Moody’s Investors Service, Inc. and/or its licensors and affiliates (collectively, “MOODY’S”). All rights reserved.
CREDIT RATINGS ISSUED BY MOODY'S INVESTORS SERVICE, INC. (“MIS”) AND ITS AFFILIATES ARE MOODY’S CURRENT OPINIONS OF THE RELATIVE FUTURE CREDIT RISK OF ENTITIES, CREDIT COMMITMENTS, OR DEBT OR DEBT-LIKE SECURITIES, AND CREDIT RATINGS AND RESEARCH PUBLICATIONS PUBLISHED BY MOODY’S (“MOODY’S PUBLICATIONS”) MAY INCLUDE MOODY’S CURRENT OPINIONS OF THE RELATIVE FUTURE CREDIT RISK OF ENTITIES, CREDIT COMMITMENTS, OR DEBT OR DEBT-LIKE SECURITIES. MOODY’S DEFINES CREDIT RISK AS THE RISK THAT AN ENTITY MAY NOT MEET ITS CONTRACTUAL, FINANCIAL OBLIGATIONS AS THEY COME DUE AND ANY ESTIMATED FINANCIAL LOSS IN THE EVENT OF DEFAULT. CREDIT RATINGS DO NOT ADDRESS ANY OTHER RISK, INCLUDING BUT NOT LIMITED TO: LIQUIDITY RISK, MARKET VALUE RISK, OR PRICE VOLATILITY. CREDIT RATINGS AND MOODY’S OPINIONS INCLUDED IN MOODY’S PUBLICATIONS ARE NOT STATEMENTS OF CURRENT OR HISTORICAL FACT. CREDIT RATINGS AND MOODY’S PUBLICATIONS DO NOT CONSTITUTE OR PROVIDE INVESTMENT OR FINANCIAL ADVICE, AND CREDIT RATINGS AND MOODY’S PUBLICATIONS ARE NOT AND DO NOT PROVIDE RECOMMENDATIONS TO PURCHASE, SELL, OR HOLD PARTICULAR SECURITIES. NEITHER CREDIT RATINGS NOR MOODY’S PUBLICATIONS COMMENT ON THE SUITABILITY OF AN INVESTMENT FOR ANY PARTICULAR INVESTOR. MOODY’S ISSUES ITS CREDIT RATINGS AND PUBLISHES MOODY’S PUBLICATIONS WITH THE EXPECTATION AND UNDERSTANDING THAT EACH INVESTOR WILL MAKE ITS OWN STUDY AND EVALUATION OF EACH SECURITY THAT IS UNDER CONSIDERATION FOR PURCHASE, HOLDING, OR SALE.
ALL INFORMATION CONTAINED HEREIN IS PROTECTED BY LAW, INCLUDING BUT NOT LIMITED TO, COPYRIGHT LAW, AND NONE OF SUCH INFORMATION MAY BE COPIED OR OTHERWISE REPRODUCED, REPACKAGED, FURTHER TRANSMITTED, TRANSFERRED, DISSEMINATED, REDISTRIBUTED OR RESOLD, OR STORED FOR SUBSEQUENT USE FOR ANY SUCH PURPOSE, IN WHOLE OR IN PART, IN ANY FORM OR MANNER OR BY ANY MEANS WHATSOEVER, BY ANY PERSON WITHOUT MOODY’S PRIOR WRITTEN CONSENT.
All information contained herein is obtained by MOODY’S from sources believed by it to be accurate and reliable. Because of the possibility of human or mechanical error as well as other factors, however, all information contained herein is provided “AS IS” without warranty of any kind. MOODY'S adopts all necessary measures so that the information it uses in assigning a credit rating is of sufficient quality and from sources MOODY'S considers to be reliable including, when appropriate, independent third-party sources. However, MOODY’S is not an auditor and cannot in every instance independently verify or validate information received in the rating process. Under no circumstances shall MOODY’S have any liability to any person or entity for (a) any loss or damage in whole or in part caused by, resulting from, or relating to, any error (negligent or otherwise) or other circumstance or contingency within or outside the control of MOODY’S or any of its directors, officers, employees or agents in connection with the procurement, collection, compilation, analysis, interpretation, communication, publication or delivery of any such information, or (b) any direct, indirect, special, consequential, compensatory or incidental damages whatsoever (including without limitation, lost profits), even if MOODY’S is advised in advance of the possibility of such damages, resulting from the use of or inability to use, any such information. The ratings, financial reporting analysis, projections, and other observations, if any, constituting part of the information contained herein are, and must be construed solely as, statements of opinion and not statements of fact or recommendations to purchase, sell or hold any securities. Each user of the information contained herein must make its own study and evaluation of each security it may consider purchasing, holding or selling.
NO WARRANTY, EXPRESS OR IMPLIED, AS TO THE ACCURACY, TIMELINESS, COMPLETENESS, MERCHANTABILITY OR FITNESS FOR ANY PARTICULAR PURPOSE OF ANY SUCH RATING OR OTHER OPINION OR INFORMATION IS GIVEN OR MADE BY MOODY’S IN ANY FORM OR MANNER WHATSOEVER.
MIS, a wholly-owned credit rating agency subsidiary of Moody’s Corporation (“MCO”), hereby discloses that most issuers of debt securities (including corporate and municipal bonds, debentures, notes and commercial paper) and preferred stock rated by MIS have, prior to assignment of any rating, agreed to pay to MIS for appraisal and rating services rendered by it fees ranging from $1,500 to approximately $2,500,000. MCO and MIS also maintain policies and procedures to address the independence of MIS’s ratings and rating processes. Information regarding certain affiliations that may exist between directors of MCO and rated entities, and between entities who hold ratings from MIS and have also publicly reported to the SEC an ownership interest in MCO of more than 5%, is posted annually at www.moodys.com under the heading “Shareholder Relations — Corporate Governance — Director and Shareholder Affiliation Policy.”
For Australia only: Any publication into Australia of this document is pursuant to the Australian Financial Services License of MOODY’S affiliate, Moody’s Investors Service Pty Limited ABN 61 003 399 657AFSL 336969 and/or Moody’s Analytics Australia Pty Ltd ABN 94 105 136 972 AFSL 383569 (as applicable). This document is intended to be provided only to “wholesale clients” within the meaning of section 761G of the Corporations Act 2001. By continuing to access this document from within Australia, you represent to MOODY’S that you are, or are accessing the document as a representative of, a “wholesale client” and that neither you nor the entity you represent will directly or indirectly disseminate this document or its contents to “retail clients” within the meaning of section 761G of the Corporations Act 2001. MOODY’S credit rating is an opinion as to the creditworthiness of a debt obligation of the issuer, not on the equity securities of the issuer or any form of security that is available to retail clients. It would be dangerous for retail clients to make any investment decision based on MOODY’S credit rating. If in doubt you should contact your financial or other professional adviser.


