Creative Regional Strategies January 31, 2011. Gridland 100 400 200 5,000 400 3,000 700 6,000 2,000...
70
Creative Regional Strategies January 31, 2011
-
Upload
bernard-park -
Category
Documents
-
view
218 -
download
0
Transcript of Creative Regional Strategies January 31, 2011. Gridland 100 400 200 5,000 400 3,000 700 6,000 2,000...

Creative Regional Strategies
January 31, 2011

Gridland
100
400
200
5,000
400
3,000
700
6,000
2,000
10,000
2,000
7,500
200
2,000
500
8,000
1,250
4,000
Total Population:
45,900
Total Number of X:
7,350
Want to compare how distribution of X compares to distribution of population.

Gridland
100
400
200
5,000
400
3,000
700
6,000
2,000
10,000
2,000
7,500
200
2,000
500
8,000
1,250
4,000
Average across all of Gridland =
16.01%
= 7,350 / 45,900
How does each location compare to the average?

Gridland
25%
= 100
/ 400
4%
= 200
/ 5,000
13.3%
= 400
/ 3,000
11.7%
= 700
/ 6,000
20%
= 2,000
/ 10,000
26.7%
= 2,000
/ 7,500
10%
= 200
/ 2,000
6.25%
= 500
/ 8,000
31.25%
= 1,250
/ 4,000
Average across all of Gridland =
16.01%
= 7,350 / 45,900
How does each location compare to the average?

•Concentration within a region•Compared to•Average Concentration across all regions
•LQ =(X in region / total for region)÷ (total X all regions / total all regions)
Location Quotient (1)

Gridland – Location Quotients
1.56= 25%
÷ 16.01%
0.25= 4%
÷ 16.01%
0.83= 13.3%
÷ 16.01%
0.73= 11.7%
÷ 16.01%
1.25= 20%
÷ 16.01%
1.67= 26.7%
÷ 16.01%
0.62= 10%
÷ 16.01%
0.39= 6.25%
÷ 16.01%
1.95= 31.25%
÷ 16.01%
Average across all of Gridland =
16.01%
= 7,350 / 45,900
How does each location compare to the average?

Gridland – Location Quotients
1.56 0.25 0.83
0.73 1.25 1.67
0.62 0.39 1.95
LQ shows high & low concentrations within individual regions – compared to entire geography
100
400
200
5,000
400
3,000
700
6,000
2,000
10,000
2,000
7,500
200
2,000
500
8,000
1,250
4,000

• Share of “item of interest” in a region• Compared to• Share of total population in the same region
• LQ =(X in region / total X all regions)
÷ (total for region / total all regions)
• Exactly the same – depends on data available
Location Quotient (2)

•Porter – Clusters– Industry-level (SIC or NAICS)–Total employment, sales–Predefined “clusters”
–Suppliers, buyers, related industries
•Milken – Tech-Pole– “High tech” industries
• (Stolarick) Occupational Clusters
Using Location Quotients

• Includes software, electronics, biomedical products, and engineering services (appendix)•Combination of two measures–Region’s High Tech LQ
–Small, concentrated regions–Region’s total share of High Tech Output
–Larger, producing regions
Milken “Tech-Pole” Index

•Total “High Tech” employment•Base is US & Canada•Each region compared to base•As with Milken, NA Tech Pole =
High Tech LQ
x
Share of NA High Tech Employment
North American “Tech-Pole”

High-Tech Metros by LQ

High-Tech Metros by Output Share

Tech-Poles

• Patents–Current per capita–Average patent growth over time–The good, the bad and the ugly with patents
• Industry Clusters–Specific industries–“Evolutionary” vs. “created” clusters
• Occupational Clusters• Industry & Occupation Simultaneously
Other Measures

Other Technology Measures?

•Managerial, professional, tech jobs•Education (talent)•Exporting•Gazelles• Job churning•New publicly traded companies•Online population•Broadband telecom
Other Measures

•Computers in schools•Commercial internet domains• Internet backbone•High-tech jobs•Sci & Eng degrees•Patents•Academic R&D (also AUTM)•Venture Capital
Other Measures

Samples

Prince Edward County


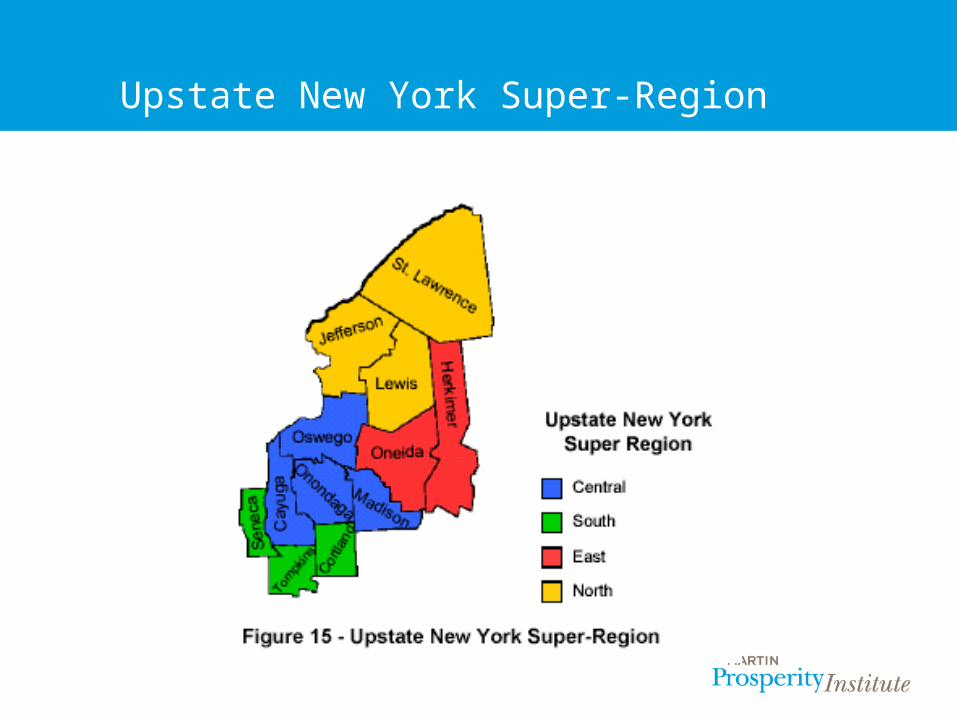
Upstate New York Super-Region


Growth Benchmarks

Overall Growth


Technology Benchmarks


Upstate “High-Tech”


Syracuse Benchmarks


Toronto

Toronto: Overall


Toronto: Technology


•www.census.gov–American Fact Finder–Data Set Access
•http://censtats.census.gov/–County Business Patterns–USA County Data
Data Sources

•www.statcan.gc.ca–Community Profiles–Data Set Access
•http://dc1.chass.utoronto.ca/–Canada, OECD, International Data
•http://www.chass.utoronto.ca/datalib–Canada, US, International Data
Data Sources