Creative Earners 2017 - GDC (Graphic Designers of Canada)
62
2016/2017 RESULTS OF THE CANADIAN SURVEY OF SALARIES AND BILLING PRACTICES IN THE COMMUNICATION DESIGN INDUSTRY
Transcript of Creative Earners 2017 - GDC (Graphic Designers of Canada)

2016/2017 RESULTS OF THE CANADIAN SURVEY OF SALARIES AND BILLING PRACTICES IN THE
COMMUNICATION DESIGN INDUSTRY

TABLE OF CONTENTS
2Introduction &
Method
31Overtime &
Benefits
35Freelancers &
Sole Proprietors
52Future of
the Industry
5Respondents
55Job
Descriptions
58Organizers &
Sponsors
11Employees
18Salaries
38Freelance
Billing Rates
41Design
Businesses
49Business
Billing Rates

INTRODUCTION & METHOD

3
The Association of Registered Graphic Designers
(RGD), in collaboration with Creative Niche and
the Society of Graphic Designers of Canada (GDC),
is pleased to present Creative Earners 2016, the
results of our 7th biannual, national survey of
salaries and billing practices in the Canadian
communication design industry.
As part of its mandate to serve the best interests
of the graphic design community, business and the
public, RGD published its first national survey of
salaries and billing practices within the Canadian
graphic design industry in 2001. We conducted
subsequent surveys in 2003, 2005, 2007, 2010, 2012
and 2014.
We are extremely grateful to the 3,010 graphic
design and related communications professionals
from across Canada for participating in our
2016 survey, sharing information about where
they work, who they work for and what they
are paid. We are pleased to present the results
here, providing an updated financial picture of
our industry.
INTRODUCTION
Design evolves, culture advances. The work we do
changes year to year, more now than ever before.
Culture is always changing, tech disrupts everything
and you have to go out of your way to keep up.
– BARRY QUINN RGD Chief Design Officer, DDB

4
The survey was promoted by RGD and our
partners GDC and Creative Niche. In addition,
RGD expanded our outreach to other organizations
including ADCC, AMPA, CAPIC, Design Algoma, EAC,
FITC, IABC Ottawa, IABC London, IABC Toronto,
London Creative Network, PWAC, Sask Interactive,
SDGQ and SDS.
Respondents were invited to participate via email
and a link to the online survey was shared on
promotional partners’ websites and e-newsletters
and through social media. Respondents were
also encouraged to invite others in the field to
participate, both through a forward link in the
survey itself and through a social media campaign
with the hashtag #CreativeEarners.
The survey was available in both English and
French, and was open from May 8 to June 30, 2016.
CAVEATBecause of the modest response rate achieved in some regions and among some job titles, this data should not be viewed as a nationally representative statistical sample of all professionals. It does provide a current reflection of what some in these professions are currently earning.
The salary information is reported in terms of the median (or middle) values, average values and highest and lowest response for each job title. The information is also split
out by several variables – Region, Organization Size, Organization Type and Experience.
Data has been presented for job titles where there are at least 30 respondents given the high degree of variability in the data where there are fewer than 30 respondents. Caution should be applied in interpreting the results where the number of respondents is small. For reference, respondent numbers are presented beside each column of data.
METHOD
The quality and scope of data featured in this
comprehensive survey helps us better understand key trends
in the Canadian creative industry, then draw conclusions
that help guide our strategic decisions in the year ahead.
– MANDY GILBERT CEO, Creative Niche

RESPONDENTS

6
ABOUT RESPONDENTS
This year 3,010 professionals responded to the
survey, an increase of 1,963 respondents since our
first survey back in 2001.
In this time, we have seen a significant increase
in the number of women participating in the
survey to 65% in 2016. This appears to reflect a
demographic shift in the industry as a whole.
Over half (59%) of respondents reside in Ontario
with the next largest groups coming from Quebec
(15%), British Columbia (11%) and Alberta (8%).
Most of the respondents (65%) work full-time in a
creative communications role while an additional
16% own businesses in the industry, 8% work as
freelancers and 2% work as educators.
Over 34% of respondents have 15 or more years of
experience, which is a 5% increase from the 2014
survey results.
Most respondents have graduated from a post-
secondary institution with either a University
Degree (42%) or a 3-Year College Diploma (33%).
The largest group of respondents are working
as designers (45%) while significant numbers
of Creative Directors, Art Directors and Design
Managers also participated.
Design is an investment. In the same way companies
invest in production equipment and facility upgrades,
so too design adds to the bottom line of a company,
with the cost amortized over multiple years.
– MATTHEW CLARK CGD, RGD Founder & Creative Director, Subplot Design

7
GENDER
TOTAL RESPONDENTS: 3,010
TOTAL RESPONDENTS: 2,127
AVERAGE TIME IN THE CREATIVE FIELD(Years of work experience relevant to current position)
Less than a year
11 to 15 years 16 to 20 years More than 20 years
1 to 3 years 4 to 6 years 7 to 10 years
Female: 65% Male: 35%
4% 21%
14% 10% 10%
23% 18%

8
1
14
Alberta 8% Nova Scotia 2.5%
British Columbia 11% Prince Edward Island 0%
Manitoba 2% Eastern Quebec 3.5%
Ontario 59% Metropolitan Montreal 6%
New Brunswick 0% Western Quebec 5.5%
Newfoundland 0% Saskatchewan 1%
Northwest Territories and Nunavut 0% Yukon 0%
2
3
45
6
8
9
10
11
1213
7
TOTAL RESPONDENTS: 3,010
1 8
2 9
3 10
4 11
5 12
6 13
7 14
LOCATION

9
HIGHEST LEVEL OF COMPLETED EDUCATION
I work in a creative communications role for 25 or more hours per week for one employer
I own a business in the creative communications industry
I work in a creative communications role for less than 25 hours per week
I am not currently working in a creative communications role
I work as an educator for 20 or more hours per week
I work 25 or more hours per week for multiple employers in a creative communications role
65%
16%
3%
6%
2%
8%
TOTAL RESPONDENTS: 3,010
Bachelor’s Degree
Master’s Degree PhD Other
3-year College Diploma
2-year College Diploma
1-year College Diploma
42%
6% 0% 6%
33% 10% 3%
TOTAL RESPONDENTS: 3,005
WORK STATUS

10
0.5%
6%
17%
2%
4%
5%
19%
21%
2%
1%
0.5%
4.5%
8.5%
1.5%
0%
5%
1.5%
1%
TOTAL RESPONDENTS: 2,829
Creative/Design Director
Business Owner
Design Educator
Design/Creative Services Manager
Art Director
Designer (1 employer)
Senior Designer (1 employer)
Copywriter/Editor
Account Coordinator/Manager/Director
Brand/Content Strategist
Communications/Marketing/Brand Manager
Community/Social Media Manager
Freelance Designer
Front-end Developer
Information Architect
UX Designer (1 employer)
Production Manager
Project Manager/Coordinator
JOB TITLE

EMPLOYEES

12
ABOUT EMPLOYEES
Less than half (39%) of those working full-
time as employees have worked at the same
organization for the last five years with about
79% of respondents changing job titles within
the last ten years.
Of these employee respondents, 39% reported
that they work in an organization of more than
500 people, with 55% working in some sort of
in-house environment while 45% work in design,
communications, advertising, marketing and
interactive agencies.
Almost 35% of employee respondents found their
current job through an online posting, while only
4.5% did so through cold calling or networking.
Only 4% listed a career change as part of their
short-term goals, while 65% hope for a salary
increase. Just over half (50.5%) feel they are
fairly compensated for the work they do.
No problem or situation is too difficult for creativity
to solve. Optimism is infectious and it is fundamental
to a successful creative environment. You have to
believe that something will come from nothing.
– JENNIFER WEAYMOUTH RGD Creative Director, Weaymouth Creative

13
TOTAL RESPONDENTS: 2,125
TOTAL RESPONDENTS: 2,125
Never
Never
Once
Once
Twice
Twice
Three times
Three times
Four times
Four times
More than four times
More than four times
21%
39%
22%
27%
19%
17%
18%
12%
10%
4%
10%
1%
TOTAL RESPONDENTS: 2,085
Fewer than 16 16-99 100-500 More than 500
26% 27% 25% 22%
HOW OFTEN RESPONDENTS CHANGED JOB TITLES IN THE LAST 10 YEARS
HOW OFTEN RESPONDENTS CHANGED ORGANIZATIONS IN THE LAST 5 YEARS
SIZE OF EMPLOYER (Number of employees)

14
8%
7%
30%
9%
9%
4%
8%
5%
6%
8%
6%
0%
TOTAL RESPONDENTS: 2,108
Advertising & PR agency
Marketing or communications firm
Business where design is not the core service
Communication design firm
Multidisciplinary design firm
Other type of design firm
Interactive, web, mobile or digital agency
Non-profit or charitable organization
Government or crown corporation
Educational/Healthcare/Religious institution
Publishing or media organization
Recruitment or placement agency
WHERE RESPONDENTS WORK

15
HOW RESPONDENTS FOUND THEIR CURRENT JOB
TOTAL RESPONDENTS: 2,123
Through school/ internship
Cold calling/showing up with a resume
Online posting
Promotion by employer
Through networking at events
Through a professional connection
Contacted through social media
Other
Through a personal connection
8%
2.5%
34%
5.5%
2%
23%
3%
8%
14%

16
SHORT-TERM CAREER GOALS(Respondents could select more than one option)
65%
52%
35.5%
27.5%
25%
14%
11.5%
10.5%
10%
4%
2%
TOTAL RESPONDENTS: 2,272
TOTAL RESPONDENTS: 2,270
Salary increase
Improve my design/technical skills
Improve my management/leadership skills
Find a better job in my field
Increased responsibilities
Receive recognition for my work in competitions/from peers
Start my own business
Give back to my community/support my profession
Meet and interact with peers
Change careers
Other
WHETHER RESPONDENTS FELT THEY HAD THE SKILLS TO ACHIEVE THEIR SHORT-TERM GOALS
Yes Not sure No
87% 11% 2%

17
Yes I don’t know
51% 32% 17%
DO YOU FEEL THAT YOU ARE FAIRLY COMPENSATED FOR THE WORK YOU DO?
TOTAL RESPONDENTS: 2,100
No
51%
17%
32%

SALARIES

19
ABOUT SALARIES
This year we report on salaries for 11 different
positions. Salaries are broken down by region,
organization size, organization type and years
of experience. For the first-time, we have made
the decision to break out and publish salaries
by gender.
Median salaries from 2000 to 2016 for most job titles
indicate an increase, with Senior Graphic Designer,
Graphic Design Educator and Creative Director
seeing some of the highest increases over time.
Where there is a relevant number of respondents,
median salaries in Alberta are generally higher
than in other provinces, although not so for
Creative Directors where Ontario has the highest
median salary.
Where there is a relevant number of respondents,
it is also clear that salaries in Quebec are generally
lower than in other provinces, although not so
for Creative Directors, where Quebec ranks third
highest in salaries, behind the Greater Toronto
Area and British Columbia.
Men’s salaries are unanimously higher than
women’s for each job title where there is a relevant
number of respondents. The average difference
between men and women’s salaries is $7,000, in
favour of men.
As one might expect, respondents with more
experience generally have higher salaries. This
is not the case for Project Manager/Coordinators
or Front-end Developers where respondents with
less experience made the same as or more than
more experienced respondents. This may also
be a reflection of the small sample sizes in both
cases but is reflected in both median, and high
and low figures.
Statistics with 5 or more respondents are reported.
Good design raises conversion and engagement
rates, generates more interest, conveys more value
and builds more trust with target audiences.
– TIM ROBERTSON RGD Director, BCG

20
MEDIAN SALARY CHANGES (2002–2016)
2016 Med.
# of resp.
2014 Med.
# of resp.
2012 Med.
# of resp.
2010 Med.
# of resp.
2006 Med.
# of resp.
2004 Med.
# of resp.
2002 Med.
# of resp.
Creative Director
91,000 156 80,000 190 78,375 142 80,000 93 75,000 109 72,000 78 65,000 70
Art Director
62,000 139 65,520 201 60,500 136 62,000 105 56,000 125 48,500 111 52,000 79
Design Manager
68,500 108 70,780 100 65,560 84 66,500 26 52,250 74 52,000 41 54,600 38
Senior Graphic Designer
59,000 603 58,240 334 55,000 439 52,000 315 50,000 346 45,000 218 46,000 183
Graphic Design Educator
84,000 63 93,000 42 90,000 36 76,000 11 70,000 13 67,000 10 58,000 13
Intermediate Graphic Designer
47,000 195** 50,000 114 44,435 356 42,000 230 39,000 258 36,800 142 37,000 126
Junior Graphic Designer
38,000 343* 42,000 365 35,000 218 33,000 86 32,000 123 30,000 74 30,000 50
Production Manager
53,500 38 56,000 38 59,500 32 56,000 28 51,000 41 52,000 31 55,000 26
UX Designer 61,000 142 64,750 130 58,000 61 N/A N/A N/A N/A N/A N/A N/A N/A
* Designers with 3 or less years of experience
** Self-identified as Designers (as opposed to Senior Designers) 4-6 years of experience

21
SENIOR DESIGNER
# of resp. Median Average Low High
REGION National 603 59,000 60,040 29,011 124,800
British Columbia 66 58,240 61,120 35,000 124,800
Alberta 52 66,560 66,950 38,000 105,000
Prairies 22 53,205 54,530 37,000 75,000
Ontario 343 61,000 61,830 29,101 124,800
GTA 163 62,400 64,620 29,120 124,800
Eastern Ontario 48 58,000 60,480 29,011 104,000
Northern Ontario 7 53,500 52,780 38,000 76,960
Central Ontario (excl. GTA) 84 60,000 60,340 34,500 93,600
Southwestern Ontario 41 60,500 59,971 40,000 104,000
Quebec 102 47,840 50,500 31,200 99,840
Atlantic 16 48,500 59,266 36,000 114,400
Northern Canada 2 n/a n/a n/a n/a
ORGANIZATION SIZE
10 or under 111 54,080 56,870 29,120 124,800
11-25 72 53,000 56,410 30,000 104,000
26-99 260 62,400 62,320 29,010 108,000
More than 99 160 58,000 60,160 32,000 124,800
ORGANIZATION TYPE
Communication Design Firm 65 57,000 57,920 31,200 108,000
Advertising/Marketing/PR Agency 53 54,400 57,360 33,280 104,000
Interactive/Web/Mobile/Digital Agency 26 61,750 67,180 40,000 124,800
Non-Profit/Charity/ Institution/Government
157 64,480 63,960 29,010 104,000
Business/company where design or marketing are not the core service
193 57,000 58,410 29,120 105,000
EXPERIENCE 3 years or less 12 50,500 53,500 40,000 79,040
4-6 years 93 55,000 57,465 36,000 124,800
7-10 years 204 55,000 56,957 29,010 114,400
11-15 years 143 61,000 60,520 29,120 104,000
16-20 years 88 60,000 63,320 35,000 124,800
More than 20 years 63 67,000 69,370 37,440 105,000
GENDER Male 192 60,800 61,890 29,010 124,800
Female 411 58,000 59,170 29,120 124,800

22
ART DIRECTOR
# of resp. Median Average Low High
REGION National 139 62,400 64,137 31,200 112,320
British Columbia 7 70,000 68,091 38,000 95,000
Alberta 13 65,000 69,640 45,000 112,320
Prairies 7 55,000 63,428 50,000 100,000
Ontario 82 64,500 65,900 31,200 103,000
GTA 48 67,000 68,176 40,000 97,000
Eastern Ontario 8 65,000 63,625 50,000 80,000
Northern Ontario 3 n/a n/a n/a n/a
Central Ontario (excl. GTA) 14 63,000 66,035 46,000 95,000
Southwestern Ontario 9 56,000 60,020 31,200 103,000
Quebec 19 55,000 56,893 39,000 82,000
Atlantic 9 50,000 51,284 44,558 65,000
Northern Canada 2 n/a n/a n/a n/a
ORGANIZATION SIZE
10 or under 26 52,500 55,330 31,200 92,000
11-25 37 60,000 62,410 44,560 100,000
26-99 36 65,000 66,090 38,000 112,320
More than 99 40 70,000 69,700 39,000 103,000
ORGANIZATION TYPE
Communication Design Firm 10 50,500 54,165 43,650 65,000
Advertising/Marketing/PR Agency 55 60,000 62,632 31,200 100,000
Interactive/Web/Mobile/Digital Agency 17 72,000 69,598 43,680 102,999
Non-Profit/Charity/ Institution/Government
3 n/a n/a n/a n/a
Business/company where design or marketing are not the core service
12 70,000 67,416 39,000 95,000
EXPERIENCE 3 years or less 19 50,000 51,031 31,200 77,000
4-6 years 30 59,000 63,220 46,000 112,320
7-10 years 31 65,000 64,573 42,000 97,000
11-15 years 30 64,500 65,800 43,680 102,999
16-20 years 15 72,500 73,170 50,000 95,000
More than 20 years 11 75,000 73,970 44,558 100,000
GENDER Male 56 65,000 66,860 40,000 103,000
Female 83 60,000 62,300 31,200 112,320

23
CREATIVE/DESIGN DIRECTOR
# of resp. Median Average Low High
REGION National 156 90,700 98,190 29,120 225,000
British Columbia 19 105,000 113,890 45,000 200,000
Alberta 9 90,000 91,660 60,000 132,000
Prairies 4 n/a n/a n/a n/a
Ontario 104 92,200 98,210 30,000 225,000
GTA 60 110,000 116,320 45,000 225,000
Eastern Ontario 10 72,900 77,330 46,000 125,000
Northern Ontario 3 n/a n/a n/a n/a
Central Ontario (excl. GTA) 19 80,000 76,940 45,000 100,000
Southwestern Ontario 12 69,030 69,200 30,000 104,000
Quebec 8 93,500 111,440 74,500 200,000
Atlantic 11 80,000 72,000 29,000 90,000
Northern Canada 1 n/a n/a n/a n/a
ORGANIZATION SIZE
10 or under 40 76,500 85,430 29,120 180,960
11-25 31 82,750 93,080 41,600 93,080
26-99 63 95,000 99,380 45,000 225,000
More than 99 22 112,500 125,140 60,000 225,000
ORGANIZATION TYPE
Communication Design Firm 20 94,300 97,150 41,600 176,800
Advertising/Marketing/PR Agency 38 88,500 94,030 29,120 225,000
Interactive/Web/Mobile/Digital Agency 18 107,250 113,780 60,000 215,000
Non-Profit/Charity/ Institution/Government
14 80,500 87,500 45,000 102,000
Business/company where design or marketing are not the core service
34 94,300 96,960 45,000 200,000
EXPERIENCE 3 years or less 3 n/a n/a n/a n/a
4-6 years 11 70,000 63,420 29,120 102,000
7-10 years 19 93,000 93,980 41,600 180,960
11-15 years 42 81,500 87,050 41,600 200,000
16-20 years 39 99,000 103,284 30,000 225,000
More than 20 years 42 102,000 112,170 57,000 225,000
GENDER Male 95 93,600 99,970 30,000 225,000
Female 61 87,000 95,420 29,120 225,000

24
COPYWRITER/EDITOR
# of resp. Median Average Low High
REGION National 42 58,750 63,520 27,040 166,400
British Columbia 5 55,000 74,100 29,120 166,400
Alberta 4 n/a n/a n/a n/a
Prairies 1 n/a n/a n/a n/a
Ontario 28 60,000 66,460 32,000 150,000
GTA 16 58,750 69,420 32,000 150,000
Eastern Ontario 4 n/a n/a n/a n/a
Northern Ontario 0 n/a n/a n/a n/a
Central Ontario (excl. GTA) 2 n/a n/a n/a n/a
Southwestern Ontario 3 n/a n/a n/a n/a
Quebec 1 n/a n/a n/a n/a
Atlantic 3 n/a n/a n/a n/a
Northern Canada 0 n/a n/a n/a n/a
ORGANIZATION SIZE
10 or under 7 70,000 76,220 29,120 166,400
11-25 5 41,000 45,700 36,000 65,000
26-99 19 60,000 64,630 27,040 150,000
More than 99 11 60,000 61,640 31,200 85,000
ORGANIZATION TYPE
Communication Design Firm 2 n/a n/a n/a n/a
Advertising/Marketing/PR Agency 19 60,000 71,230 32,000 166,400
Interactive/Web/Mobile/Digital Agency 1 n/a n/a n/a n/a
Non-Profit/Charity/ Institution/Government
3 n/a n/a n/a n/a
Business/company where design or marketing are not the core service
12 55,580 53,060 27,040 75,000
EXPERIENCE 3 years or less 11 40,000 42,900 27,040 70,000
4-6 years 14 55,000 57,190 29,120 85,000
7-10 years 7 65,000 69,430 47,000 104,000
11-15 years 1 n/a n/a n/a n/a
16-20 years 2 n/a n/a n/a n/a
More than 20 years 7 87,000 97,990 57,500 166,400
GENDER Male 14 65,500 71,080 39,000 150,000
Female 28 55,000 59,740 27,040 166,400

25
UX/UI DESIGNER
# of resp. Median Average Low High
REGION National 142 60,600 65,040 29,120 180,000
British Columbia 16 57,080 66,600 31,200 130,000
Alberta 12 66,500 63,920 35,000 85,000
Prairies 2 n/a n/a n/a n/a
Ontario 97 65,000 68,070 29,120 180,000
GTA 47 65,000 66,560 39,000 141,440
Eastern Ontario 11 75,000 78,560 50,000 120,000
Northern Ontario 3 n/a n/a n/a n/a
Central Ontario (excl. GTA) 18 63,500 66,630 35,000 95,000
Southwestern Ontario 18 61,500 62,530 29,120 100,000
Quebec 12 42,000 45,910 35,360 81,000
Atlantic 3 n/a n/a n/a n/a
Northern Canada 0 n/a n/a n/a n/a
ORGANIZATION SIZE
10 or under 21 52,500 60,310 31,200 180,000
11-25 32 53,000 58,770 35,000 32,000
26-99 51 65,000 68,820 29,120 141,440
More than 99 38 66,780 67,840 37,000 120,640
ORGANIZATION TYPE
Communication Design Firm 3 n/a n/a n/a n/a
Advertising/Marketing/PR Agency 7 70,000 62,420 38,500 87,360
Interactive/Web/Mobile/Digital Agency 55 56,500 63,410 29,120 180,000
Non-Profit/Charity/ Institution/Government
12 70,000 66,880 35,000 81,220
Business/company where design or marketing are not the core service
52 64,500 67,860 37,000 130,000
EXPERIENCE 3 years or less 49 47,500 51,990 31,200 92,000
4-6 years 53 60,700 64,780 29,120 141,440
7-10 years 16 75,000 84,240 53,000 180,000
11-15 years 12 73,500 72,050 54,080 84,000
16-20 years 10 90,000 86,170 52,500 105,000
More than 20 years 2 n/a n/a n/a n/a
GENDER Male 55 66,000 69,000 31,200 180,000
Female 87 60,000 62,530 29,120 141,440

26
PRODUCTION MANAGER
# of resp. Median Average Low High
REGION National 38 53,450 58,660 31,200 100,000
British Columbia 2 n/a n/a n/a n/a
Alberta 5 65,000 64,800 43,000 100,000
Prairies 0 n/a n/a n/a n/a
Ontario 23 60,000 58,620 31,200 90,000
GTA 13 65,000 65,050 39,000 90,000
Eastern Ontario 2 n/a n/a n/a n/a
Northern Ontario 3 49,920 51,310 37,440 66,560
Central Ontario (excl. GTA) 2 n/a n/a n/a n/a
Southwestern Ontario 4 51,080 49,380 35,360 60,000
Quebec 6 52,000 54,460 43,680 80,000
Atlantic 2 n/a n/a n/a n/a
Northern Canada 0 n/a n/a n/a n/a
ORGANIZATION SIZE
10 or under 9 51,250 51,990 31,200 78,000
11-25 6 58,500 56,550 37,440 70,000
26-99 8 57,450 62,880 48,160 85,000
More than 99 15 60,000 61,260 40,000 100,000
ORGANIZATION TYPE
Communication Design Firm 4 n/a n/a n/a n/a
Advertising/Marketing/PR Agency 8 70,000 72,740 52,000 100,000
Interactive/Web/Mobile/Digital Agency 0 n/a n/a n/a n/a
Non-Profit/Charity/ Institution/Government
5 70,000 63,170 46,000 80,000
Business/company where design or marketing are not the core service
6 51,000 55,190 40,000 81,000
EXPERIENCE 3 years or less 6 40,800 46,360 31,200 80,000
4-6 years 5 48,160 48,430 39,000 60,000
7-10 years 9 51,250 50,900 37,440 65,000
11-15 years 4 n/a n/a n/a n/a
16-20 years 5 67,000 72,310 65,000 85,000
More than 20 years 9 60,000 63,900 49,000 85,000
GENDER Male 15 60,000 60,590 31,200 100,000
Female 23 52,000 57,400 35,360 90,000

27
COMMUNICATIONS/MARKETING/BRAND MANAGER
# of resp. Median Average Low High
REGION National 124 60,725 66,680 34,000 187,200
British Columbia 11 60,450 63,080 37440 110,000
Alberta 17 63,000 65,290 45000 102,690
Prairies 6 52,000 61,650 42,000 100,000
Ontario 77 62,400 68,990 34,000 187,200
GTA 27 66,000 72,560 37,000 145,000
Eastern Ontario 11 50,000 67,470 34,000 187,200
Northern Ontario 6 53,040 63,410 40,000 120,000
Central Ontario (excl. GTA) 13 60,000 61,960 36,000 83,200
Southwestern Ontario 20 63,200 71,230 36,000 155,000
Quebec 6 47,000 49,370 37,440 72,800
Atlantic 6 68,000 62,670 38,000 94,000
Northern Canada 1 n/a n/a n/a n/a
ORGANIZATION SIZE
Less than 10 22 48,500 53,160 34,000 104,000
11-25 10 53,500 55,260 37,440 81,000
26-99 54 69,000 77,670 37,440 187,200
More than 99 35 56,500 63,710 36,000 125,000
ORGANIZATION TYPE
Communication Design Firm 0 n/a n/a n/a n/a
Advertising/Marketing/PR Agency 6 65,000 75,110 43,680 125,000
Interactive/Web/Mobile/Digital Agency 5 73,100 94,620 45,000 155,000
Non-Profit/Charity/ Institution/Government
45 63,000 66,680 34,000 145,000
Business/company where design or marketing are not the core service
60 56,750 63,870 36,000 187,200
EXPERIENCE 3 years or less 23 50,000 50,450 36,000 74,500
4-6 years 35 55,790 58,680 34,000 110,000
7-10 years 27 63,000 68,360 37,440 145,000
11-15 years 15 73,100 74,490 46,000 120,000
16-20 years 11 72,800 85,510 50,000 187,200
More than 20 years 13 74,880 88,480 45,000 155,000
GENDER Male 19 70,000 70,820 37,440 155,000
Female 105 60,450 65,930 34,000 187,200

28
DESIGN/CREATIVE SERVICES MANAGER
# of resp. Median Average Low High
REGION National 108 68,500 71,282 32,760 155,000
British Columbia 15 61,000 61,688 33,280 87,320
Alberta 17 79,000 81,705 52,000 155,000
Prairies 7 64,750 66,250 45,000 88,000
Ontario 59 72,000 73,400 36,000 127,500
Eastern Ontario 2 n/a n/a n/a n/a
Northern Ontario 0 n/a n/a n/a n/a
Central Ontario (incl. GTA) 20 73,500 71,230 36,000 110,000
Southwestern Ontario 7 72,000 67,420 37,440 100,000
Quebec 7 55,000 60,190 32,760 100,000
Atlantic 3 n/a n/a n/a n/a
Northern Canada 0 n/a n/a n/a n/a
ORGANIZATION SIZE
Less than 10 16 56,750 58,340 32,760 100,000
11-25 10 55,000 57,230 33,280 90,000
26-99 60 75,980 77,010 41,600 155,000
More than 99 22 69,500 71,780 37,440 105,000
ORGANIZATION TYPE
Communication Design Firm 6 59,250 63,350 50,000 93,600
Advertising/Marketing/PR Agency 7 72,000 71,090 41,600 105,000
Interactive/Web/Mobile/Digital Agency 3 n/a n/a n/a n/a
Non-Profit/Charity/ Institution/Government
28 77,980 81,470 38,000 155,000
Business/company where design or marketing are not the core service
56 67,000 69,960 33,280 110,000
EXPERIENCE 3 years or less 6 56,000 62,830 47,000 90,000
4-6 years 17 56,000 56,390 33,280 90,390
7-10 years 18 65,000 70,170 36,000 100,000
11-15 years 18 67,500 69,014 32,760 127,500
16-20 years 24 79,500 81,650 36,000 155,000
More than 20 years 19 79,000 78,120 47,000 110,000
GENDER Male 42 73,500 77,160 32,760 155,000
Female 66 65,780 67,540 36,000 110,000

29
DESIGNER
# of resp. Median Average Low High
REGION National 543 40,000 42,370 23,000 104,000
British Columbia 50 41,600 45,910 29,120 83,200
Alberta 53 45,760 48,830 31,200 104,000
Prairies 20 40,000 41,160 28,000 58,500
Ontario 322 41,600 42,510 24,000 104,000
GTA 149 43,680 44,520 24,960 104,000
Eastern Ontario 34 36,400 38,270 24,000 58,500
Northern Ontario 16 36,720 40,830 27,040 52,000
Central Ontario (excl. GTA) 90 41,600 42,260 24,960 70,000
Southwestern Ontario 33 38,000 39,360 24,690 68,640
Quebec 77 35,360 36,150 23,000 72,800
Atlantic 20 37,220 387,770 27,000 60,000
Northern Canada 1 n/a n/a n/a n/a
ORGANIZATION SIZE
10 or under 161 37,440 40,010 24,960 104,000
11-25 97 38,000 38,880 23,000 70,000
26-99 161 44,700 44,980 24,960 104,000
More than 99 123 45,000 44,890 24,960 70,000
ORGANIZATION TYPE
Communication Design Firm 72 39,760 40,990 27,040 70,000
Advertising/Marketing/PR Agency 93 40,000 42,810 25,000 70,720
Interactive/Web/Mobile/Digital Agency 26 43,680 42,920 24,000 60,000
Non-Profit/Charity/ Institution/Government
67 48,000 46,610 24,960 68,640
Business/company where design or marketing are not the core service
167 40,000 41,790 24,960 104,000
EXPERIENCE 3 years or less 343 38,000 40,170 24,000 104,000
4-6 years 195 46,800 46,560 23,400 72,800
7-10 years 2 n/a n/a n/a n/a
11-15 years 2 n/a n/a n/a n/a
16-20 years 1 n/a n/a n/a n/a
More than 20 years 0 n/a n/a n/a n/a
GENDER Male 130 43,250 44,310 23,400 104,000
Female 413 40,000 41,760 23,000 104,000

30
DESIGN EDUCATOR
# of resp. Median Average Low High
REGION National 63 84,000 90,410 42,500 167,000
British Columbia 8 80,000 86,270 68,000 135,200
Alberta 6 107,500 100,670 46,000 150,000
Prairies 4 n/a n/a n/a n/a
Ontario 30 100,000 100,576 58,240 166,400
GTA 6 92,500 108,240 73,000 167,000
Eastern Ontario 7 82,000 84,460 58,240 100,000
Northern Ontario 5 82,000 104,000 100,000 107,000
Central Ontario (excl. GTA) 10 102,500 106,960 64,000 166,400
Southwestern Ontario 2 n/a n/a n/a n/a
Quebec 10 75,000 69,730 42,500 81,000
Atlantic 5 73,000 74,819 48,000 106,000
Northern Canada 0 n/a n/a n/a n/a
ORGANIZATION SIZE
10 or under 2 n/a n/a n/a n/a
11-25 2 n/a n/a n/a n/a
26-99 36 86,500 94,750 60,000 167,000
More than 99 22 90,000 89,440 42,500 150,000
EXPERIENCE 3 years or less 4 n/a n/a n/a n/a
4-6 years 4 n/a n/a n/a n/a
7-10 years 11 75,000 79,180 70,000 99,000
11-15 years 6 91,000 93,200 68,000 135,200
16-20 years 13 88,000 86,390 46,000 115,000
More than 20 years 25 102,000 105,790 72,000 167,000
GENDER Male 26 93,500 90,352 42,500 166,400
Female 37 82,000 90,452 46,000 167,000

OVERTIME & BENEFITS

32
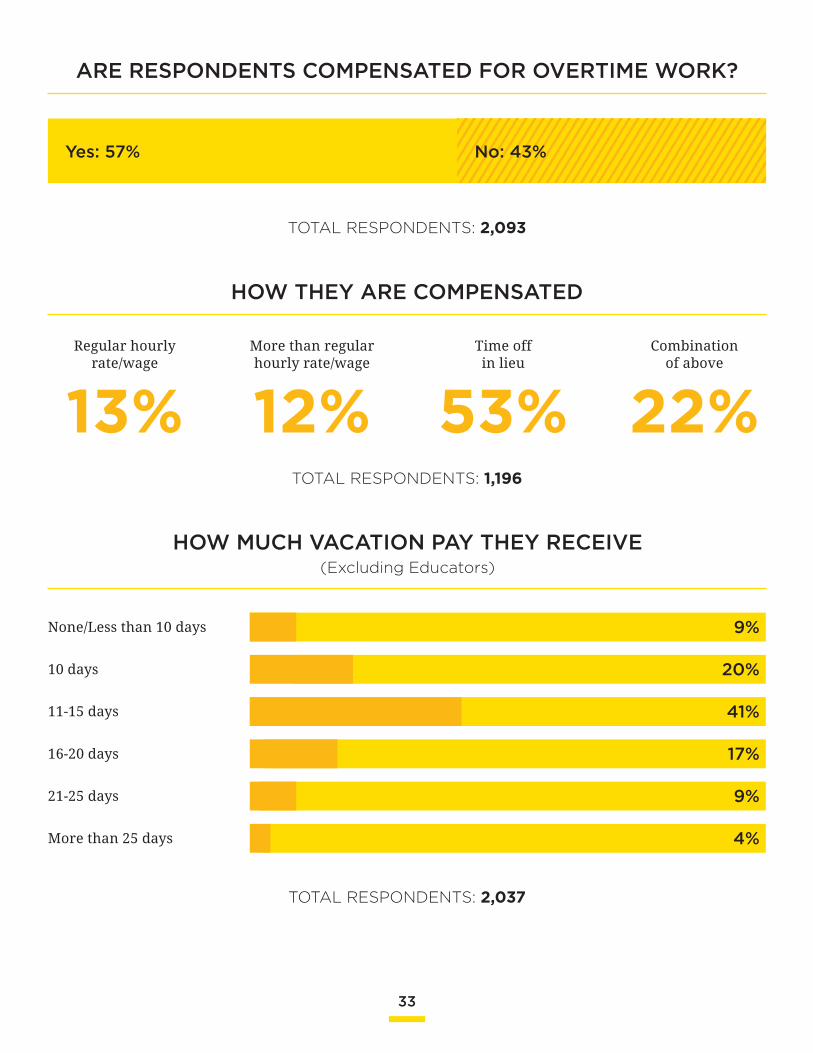
ABOUT OVERTIME & BENEFITS
More than 40% of respondents are not
compensated for overtime work, which is an
improvement from the 70% who reported not
receiving overtime compensation in the 2014
survey results and the 78% in 2012. The majority
of those respondents who are compensated for
overtime receive time off in lieu of pay.
Those working in the non-profit sector are
most likely to receive overtime pay (75%) and
those working in publishing/media are least
likely (33%).The most frequently offered benefits
are paid sick leave, paid vacation (beyond what
is required by law) and dental insurance.
In comparison to 10 years ago, companies are
investing more and more in design and marketing
due to increased competition and the advent of
social media marketing.
– NICO TAUS RGD Creative Director, Studio123
33
ARE RESPONDENTS COMPENSATED FOR OVERTIME WORK?
TOTAL RESPONDENTS: 2,093
Yes: 57% No: 43%
TOTAL RESPONDENTS: 1,196
TOTAL RESPONDENTS: 2,037
HOW THEY ARE COMPENSATED
Regular hourly rate/wage
More than regular hourly rate/wage
Time off in lieu
Combination of above
13% 12% 53% 22%
9%
20%
41%
17%
9%
4%
None/Less than 10 days
10 days
11-15 days
16-20 days
21-25 days
More than 25 days
HOW MUCH VACATION PAY THEY RECEIVE (Excluding Educators)

34
75%
67%
57%
69%
51%
21%
38%
16%
9%
22%
28%
12%
42.5%
23%
52%
48%
27%
19%
26%
29%
1.5%
11%
13%
7%
TOTAL RESPONDENTS: 2,097
Paid sick leave
Paid vacation (beyond what is required by law)
Medical insurance - individual coverage
Dental insurance
Life insurance
Defined contribution or other retirement plan
Education/Professional Development funding
Cellular/Data plan reimbursement
Stock options
Mileage reimbursement
Employee assistance or wellness program
Tickets to sport or entertainment events
Paid personal time off
Professional Member Dues
Medical insurance - Family coverage
Disability insurance
Defined benefit (pension) retirement plan
On-site gym/gym membership
Parking
Flex-time
Company car/allowance
Parental/Elder care leave
Time off for volunteering
None
BENEFITS/PERKS RECEIVED FROM EMPLOYERS AS PART OF COMPENSATION
(Respondents could select more than one option)

FREELANCERS &SOLE PROPRIETORS

36
ABOUT FREELANCERS & SOLE PROPRIETORS
This section of the survey covers respondents who
do freelance work in addition to their primary
employment, which represents about 55% of all
respondents, and respondents who operate design
businesses as sole proprietorships.
About 5% of freelancing respondents do 10 hours or
less of freelance work each week while 10% do 11-20
hours and 83% do more than 20 hours per week.
For respondents who offer freelance graphic
design services, the nationwide average rate per
hour is $52 while the average hourly rate for web
development/programming is $67. On average,
hourly rates for most services in the GTA are higher
than in other Canadian cities.
Whether you’re part of an in-house department or
a sole-proprietor or a freelance designer or part
of a small 6-person studio, we all benefit from
connecting with each other.
– BRENT LONG RGD President, Fusion Design Group Inc.

37
43.5%
56.5%
THOSE WHO MADE MONEY DOING FREELANCE WORK IN 2015
(In addition to having full-time work)
TOTAL RESPONDENTS: 948
TOTAL RESPONDENTS: 2,177
FREELANCE HOURS/INCOME IN 2015
Average hourly rate Average Income
Under 26 hours 17.5% $62 $1,005
26-50 hours 25.5% $59 $2,481
51-100 hours 28% $62 $5,322
101-200 hours 16% $52 $8,320
More than 200 hours 13% $48 $19,971
Yes
No

FREELANCEBILLING RATES

39
FREELANCE HOURLY BILLING RATES
# of resp. High Low Median Average
GRAPHIC DESIGN All 713 $160 $20 $50 $53
Less than 7 years 371 $160 $20 $40 $43.5
7 to 15 years 224 $150 $20 $55 $60
More than 15 years 118 $150 $20 $65 $68
WEB DESIGN All 310 $150 $20 $50 $55
Less than 7 years 169 $100 $20 $45 $47
7 to 15 years 65 $150 $20 $60 $61.5
More than 15 years 76 $150 $25 $67.5 $68
CREATIVE DIRECTION
All 175 $150 $25 $56 $65.5
Less than 7 years 71 $100 $25 $45 $50.5
7 to 15 years 61 $150 $30 $60 $72
More than 15 years 43 $150 $25 $80 $81
BRANDING/ IDENTITY DESIGN
All 439 $400 $20 $50 $58
Less than 7 years 240 $400 $20 $40 $48
7 to 15 years 129 $150 $20 $60 $66
More than 15 years 70 $200 $25 $75 $79
ART DIRECTION OF PHOTOGRAPHY/ ILLUSTRATION
All 109 $150 $20 $50 $62
Less than 7 years 49 $100 $20 $45 $47
7 to 15 years 37 $150 $25 $65 $71
More than 15 years 23 $150 $35 $80 $77
BRAND STRATEGY/ RESEARCH
All 123 $500 $20 $55 $65.5
Less than 7 years 56 $150 $20 $50 $48
7 to 15 years 41 $500 $20 $65 $82
More than 15 years 26 $150 $40 $77.5 $77.5

40
# of resp. High Low Median Average
FILE PREPARATION/ PRODUCTION
All 214 $150 $20 $50 $49.5
Less than 7 years 91 $80 $20 $35 $39.5
7 to 15 years 68 $150 $20 $50 $56
More than 15 years 55 $100 $20 $50 $57.5
SOCIAL MEDIA STRATEGY/ DEVELOPMENT
All 62 $150 $20 $50 $57
Less than 7 years 39 $100 $20 $50 $46
7 to 15 years 15 $120 $20 $50 $58.5
More than 15 years 8 $150 $45 $100 $100
WEB DEVELOPMENT
All 64 $200 $25 $65 $57
Less than 7 years 32 $200 $25 $50 $58
7 to 15 years 27 $150 $35 $70 $72
More than 15 years 5 $80 $50 $66 $70
PROJECT MANAGEMENT
All 70 $150 $20 $50 $60
Less than 7 years 18 $100 $20 $40 $46
7 to 15 years 24 $100 $20 $50 $53
More than 15 years 28 $150 $20 $70 $75
CONTENT DEVELOPMENT/ COPY-WRITING
All 66 $150 $20 $52.5 $63
Less than 7 years 27 $100 $20 $50 $48
7 to 15 years 17 $150 $25 $75 $72.5
More than 15 years 22 $150 $40 $77.5 $75

DESIGN BUSINESSES

42
ABOUT DESIGN BUSINESSES
This section covers respondents who own
creative businesses, which represents 20% of
all respondents. Of the business owners who
responded to the survey, 40% are men and 60%
are women. The largest percentage (23%) are
located in Metropolitan Toronto with 14% in
British Columbia. 42% have more than 20
years experience in the industry.
More than 20% of these employers report plans
to hire full-time staff and/or increase their use of
freelancers in the next 12 months. The two areas
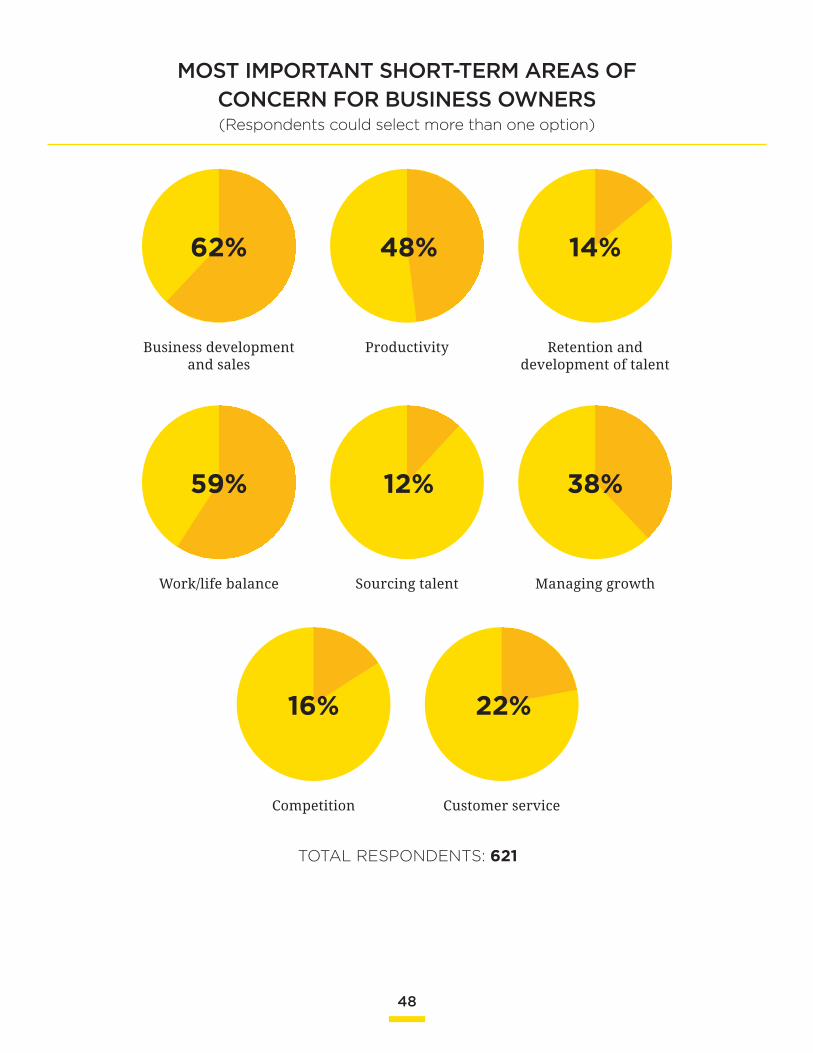
of most concern for business owners in this sector
are business development/sales and maintaining
work/life balance. The factors contributing most
positively to business growth are word-of-mouth
(90%) and networking (48%).
Knowing about what everyone does within your
company is important. The main goal of the firm
owner should be to know everything about every
aspect of the business.
– JENNIFER TABACK RGD Partner, Design de Plume

43
LOCATION OF BUSINESS OWNERS
Alberta 47 8%
British Columbia 87 14%
Western Quebec 48 8%
Eastern Quebec 33 5%
Prairies 17 3%
Metropolitan Montreal 50 8%
Metropolitan Toronto 142 23%
Atlantic 23 4%
Northern Ontario 16 3%
Southwestern Ontario 46 7%
Central Ontario 69 11%
Eastern Ontario 39 6%
Yukon 3 0%
Northwest Territories 2 0%
Total 622
GENDER OF BUSINESS OWNERS
Male 251 40%
Female 371 60%
Total 622
YEARS OF EXPERIENCE OF BUSINESS OWNERS
1-6 years 48 8%
7-15 years 151 24%
16-20 years 160 26%
More than 20 years 265 42%
Total 624
BUSINESS OWNER DEMOGRAPHICS

44
TOTAL RESPONDENTS: 206
Less than 15% 15-30% 31-45% 46-60% 61-85% More than 85%
6.5% 8.5% 10.5% 13.5% 14.5% 46.5%
PERCENTAGE OF FULL-TIME STAFF IN DESIGN/DESIGN RELATED POSITIONS
ENGAGEMENT OF FREELANCERS IN THE PAST 12 MONTHS
21%
38%
13%
28%
TOTAL RESPONDENTS: 489
TOTAL RESPONDENTS: 493
Have begun to use freelancers
Have not used freelancers
Have decreased use of freelancers
Have increased use of freelancers
1% 21.5% 77.5%
Reduce full-time staff Hire full-time staff Remain the same
HIRING PLANS FOR FULL-TIME STAFF IN NEXT 12 MONTHS (Including Permanent and Contract Employees)

45
TOTAL RESPONDENTS: 486
Less than $50,000
$50,000 to $99,999
$100,000 to $199,999
$200,000 to $499,999
$500,000 to $999,999
More than $1,000,000
33% 25% 15% 12% 7% 8%
TOTAL BILLABLE DISBURSEMENTS
TOTAL BILLINGS FOR 2015
AVERAGE MARK-UP ON BILLABLE DISBURSEMENTS
TOTAL RESPONDENTS: 487
TOTAL RESPONDENTS: 484
Less than $50,000
$50,000 to $99,999
$100,000 to $199,999
$200,000 to $499,999
$500,000 or more
12% 71% 6% 7% 4%
30.5%
16%
17.5%
9%
17%
10%
Less than 5%
16 to 20%
5 to 10%
21 to 25%
11 to 15%
More than 25%

46
FACTORS THAT CONTRIBUTE TO BUSINESS GROWTH (Respondents could select more than one option)
VALUE OF SOCIAL MEDIA AS PART OF BUSINESS OPERATIONS (Respondents could select more than one option)
90%
48%
4%
1%
12%
7%
5.5%
2%
5%
Word-of-mouth/Referrals
Networking
Thought leadership incl. case studies, public speaking, webinars
Other (incl. Google, SEO, social media, tradeshows)
Responding to RFPs
Selling (Prospecting/Cold calling, etc.)
Email/print marketing
Winning Awards
Public relations/Media exposure/Promotions
TOTAL RESPONDENTS: 622
TOTAL RESPONDENTS: 623
36%
11%
7%
51%
7%
9%
60.5%
18.5%
17.5%
Vimeo
Youtube
Behance
None

47
POLICIES ON INTELLECTUAL PROPERTY
TOTAL RESPONDENTS: 487
TOTAL RESPONDENTS: 385
Yes, 10% of the total fee
Yes, 15% of the total fee
Yes, 20% of the total fee
Yes, 25% of the total fee
Yes, more than 25% of the total fee
Other
11.5% 4% 5% 8% 12.5% 59%
POLICIES ON CANCELLATION FEES
37%
27%
21%
9%
6%
Always transfer all rights as part of fees
Do as client requires as part of fees
Rarely, if ever, transfer full rights
Do as client requires and charge additional fee
Transfer partial rights and charge additional fee
AMOUNT OF PRO BONO WORK DONE IN 2015
TOTAL RESPONDENTS: 623
22%
5%
48%
4%
18%
3%
None
11-15% of total billable hours
5% or less of total billable hours
16-20% of total billable hours
6-10% of total billable hours
20%+ of total billable hours
48
TOTAL RESPONDENTS: 621
Work/life balance
Competition
Business development and sales
Sourcing talent
Customer service
Productivity
Managing growth
Retention and development of talent
59%
16%
62%
12%
22%
48%
38%
14%
MOST IMPORTANT SHORT-TERM AREAS OF CONCERN FOR BUSINESS OWNERS (Respondents could select more than one option)

BUSINESS BILLING RATES

50
BUSINESS BILLING RATES
# of resp. High Low Median Average
GRAPHIC DESIGN All 338 500 50 85 92
0 to 4 employees 283 500 50 75 86
5 to 10 employees 38 250 70 123 124
11 or more employees 17 200 50 140 134
WEB DESIGN All 262 320 50 85 97
0 to 4 employees 211 320 50 80 89
5 to 10 employees 35 200 80 125 126
11 or more employees 16 200 76 150 142
BRANDING/ IDENTITY DESIGN
All 308 500 50 85 97
0 to 4 employees 259 500 50 80 90
5 to 10 employees 34 500 80 125 128
11 or more employees 15 200 76 150 151
ADVERTISING/MARKETING SERVICES
All 107 500 50 85 100
0 to 4 employees 86 500 50 79 91
5 to 10 employees 12 150 85 125 130
11 or more employees 9 300 76 125 148
BRAND STRATEGY/RESEARCH
All 143 275 50 90 104
0 to 4 employees 114 250 50 82 91
5 to 10 employees 21 275 85 150 147
11 or more employees 8 200 120 185 173
CONTENT DEVELOPMENT/ WRITING
All 101 200 50 90 98
0 to 4 employees 72 175 50 80 88
5 to 10 employees 19 175 50 125 120
11 or more employees 10 200 50 125 128
DATA VISUALIZATION/ INFORMATION GRAPHICS
All 88 175 50 80 90
0 to 4 employees 75 150 50 75 82
5 to 10 employees 8 165 80 150 136
11 or more employees 5 175 125 150 145

51
# of resp. High Low Median Average
ILLUSTRATION All 122 185 50 80 87
0 to 4 employees 107 160 50 75 82
5 to 10 employees 12 165 80 122.5 120
11 or more employees 3 185 125 140 150
MOBILE DESIGN/ DEVELOPMENT
All 78 250 50 95 102
0 to 4 employees 59 250 50 85 90
5 to 10 employees 13 175 80 125 130
11 or more employees 6 185 100 150 143
MOTION GRAPHICS All 62 500 50 100 116
0 to 4 employees 47 500 50 80 105
5 to 10 employees 10 250 85 150 148
11 or more employees 5 175 100 150 147
PROJECT MANAGEMENT
All 139 200 50 90 96
0 to 4 employees 113 180 50 85 89
5 to 10 employees 16 175 85 125 122
11 or more employees 10 200 85 125 133
SOCIAL MEDIA STRATEGY
All 80 200 50 83 89
0 to 4 employees 66 200 50 80 85
5 to 10 employees 10 150 75 100 107
11 or more employees 4 150 50 108 104
WEB DEVELOPMENT All 129 200 50 90 99
0 to 4 employees 92 200 50 80 88
5 to 10 employees 26 200 70 123 120
11 or more employees 11 185 84 150 138
PHOTOGRAPHY All 58 175 50 85 91
VIDEO PRODUCTION All 36 200 50 98 96
PROOFREADING/QA All 39 200 50 75 78

FUTURE OFTHE INDUSTRY

53
GENERAL OBSERVATIONS
Survey respondents are incredibly optimistic
about the future of their profession. More than
36% are very optimistic and an additional 44% are
somewhat optimistic while less than 4% are either
somewhat or very pessimistic.
Of the respondents who are very optimistic,
52% have zero to six years of experience in their
current position, more than 50% of whom are
located in Ontario.
The greatest threat to the design industry,
according to respondents, is lack of awareness
about the value of design, with the secondary,
much lesser concern being shrinking budgets.
The soft skills of designers have never been more in
need and it’s up to us as professionals to cast off our
connection to the technical focus of the past and see how
we can create meaningful, effective communications
that work across a wide range of platforms.
– JOHN FURNEAUX RGDPrincipal, Projektor Brand Image

54
LEVELS OF OPTIMISM FOR THE FUTURE OF THE PROFESSION
NATIONALLY
REGIONALLY
BY EXPERIENCE
TOTAL RESPONDENTS: 2,887
Very optimistic
Somewhat optimistic
Uncertain Somewhat pessimistic
Very pessimistic
43% 36% 17% 3% 1%
BC AB SK/MB ON QC ATL
Optimistic 79% 81% 80% 80% 68% 81%
Uncertain 16% 15.5% 18.5% 15% 27% 15%
Pessimistic 4.5% 3% 3.5% 4% 4% 3.5%
# of respondents 313 226 97 1,677 430 108
Less than 1 year 1-3 years 4-6 years 7-10 years 11-15 years 16-20 years More than
20 years
Optimistic 87% 85% 78.5% 77% 80% 70% 75%
Uncertain 12% 13.5% 18% 18.5% 16% 24% 18%
Pessimistic 1% 1% 3% 4% 5% 6% 7%
# of respondents 91 445 492 371 291 214 202

JOB DESCRIPTIONS

56
JOB DESCRIPTIONS
ART DIRECTORThe art director establishes the conceptual
and stylistic direction for all design staff and
orchestrates their work, as well as the work of
production artists, photographers, illustrators,
prepress technicians, printers and anyone else
who is involved in the development of a project.
The art director generally selects vendors and,
if there isn’t a creative director on staff, has
final creative authority.
BRAND MANAGERA brand manager is tasked with planning,
developing and directing marketing efforts
to increase the value and performance of a
specific brand, service or product. A brand
manager ensures the creation of consistent,
powerful brand messages and experiences
relevant to a client’s target audience(s) and
focuses on developing a brand’s profit and loss
performance, image and positioning compared
to competitors.
COMMUNICATIONS OR MARKETING MANAGERA communications or marketing manager
develops and manages the marketing and/or
communications strategy, planning and execution
for a company, product or service, integrating
activities with product or service managers and
guiding the research and analysis of market data.
A marketing manager may also be responsible for
advertising, promotions, events, communications
and social media, as well as integration with
public relations.
To survive in the creative industry, you need to
anticipate future trends and technologies. “Vision”
and “capacity to evolve” are the most critical
attributes for design leaders.
– AUDREE LAPIERRECreative Director/Co-Founder, FFunction

57
COPYWRITER/EDITORA copywriter writes, edits and proofs
promotional or publicity copy for print or
electronic publications. At higher levels,
copywriters are often responsible for strategic
and conceptual development of messages
and stories.
CREATIVE/DESIGN DIRECTORA creative director or design director is the creative
head of a design firm, advertising agency or in-
house design department. In all of these areas, key
responsibilities can include the development of
graphic design, advertising, communication and
industrial design.
CREATIVE/DESIGN SERVICES MANAGERA creative manager or design manager manages
the creative staff, evaluates its work, ensures that
projects meet the requirements of the design brief
and are completed on time and within budget. A
design manager may work in a corporation and
manage the hiring of design firms and the use of
their design services.
GRAPHIC DESIGNERA graphic designer is responsible for the design of
graphic applications such as collateral material,
environmental graphics, books and magazines,
corporate identity and branding, film titling and
websites, from concept to completion.
GRAPHIC DESIGN EDUCATOR Graphic design educators transmit their skills
and knowledge to students in post-secondary
design programs. They implement effective
educational strategies through course and
curriculum development, assessment methods,
course management and act as a liaison
with industry.
OWNER, PARTNER, PRINCIPALAn owner, partner, principal or VP holds an equity
position and/or has major business responsibility
for a firm with employees.
PRODUCTION MANAGERA production manager is responsible for
managing the process (bids, scheduling
production and delivery) of producing design
projects, from concept through production,
including photography, separations, press
work as well as digital production
SENIOR GRAPHIC DESIGNERThe senior graphic designer is responsible for the
design of solutions from concept to completion.
In some firms, a senior designer directs the work
of one or more junior designers, who generate
comps and create layouts and final art. In some
cases, senior designers do not manage staff, but are
designated “senior” because of their authority in
design decision-making.
USER EXPERIENCE/ USER INTERFACE DESIGNERA user experience or user interface designer is
responsible for designing websites and applications
that support user-centred design principles. They
understand best practices in interface development
to support how users behave. Working in tandem
with UX/UI developers, the designer requires
insight into information architecture, interaction
and interface design, and the design process.

ORGANIZERS & SPONSORS

59
ORGANIZERS
Through RGD, Canadian designers exchange ideas,
educate and inspire, set professional standards and
build a strong, supportive community dedicated
to advocating for the value of design. RGD was
created by government legislation to grant
designers, design educators and design managers
who qualify the right to use the designation ‘RGD’.
Representing over 3,400 Members, RGD advocates
on behalf of the profession, communicating the
contribution of graphic designers to commerce,
culture and society.
www.rgd.ca
GDC® is Canada’s national certification body
for graphic and communication design and,
since 1956, has established standards for design
professionals, educators, and leaders. Through
our certification program, GDC licenses the
unique CGDTM certification mark to members
whose services meet rigorous, standardized
criteria. The CGD certification mark is recognized
across Canada as the mark of professional services
and ethical business conduct.
www.gdc.net
Creative Niche is a temporary staffing, permanent
recruitment and executive search firm focused
in advertising, communications, design, digital,
marketing, public relations, social media, data and
innovation throughout North America. Founded
in 2002, Creative Niche connects top talent with
agencies, design firms and brands ranging from
start-ups to Fortune 500s. Creative Niche is
headquartered in Toronto with offices in Ottawa
and New York City.
www.creativeniche.com

60
SPONSORS
Adobe is the global leader in digital marketing and
digital media solutions. Adobe’s tools and services
allow their customers to create groundbreaking
digital content, deploy it across media and devices,
measure and optimize it over time, and achieve
greater business success. Adobe helps their
customers make, manage, measure, and monetize
content across every channel and screen.
www.adobe.com
Applied Arts is Canada’s leading visual
communications magazine for designers,
advertising execs, photographers, illustrators and
marketers. Since 1986, it has delivered gorgeous
imagery, strong opinion, timely information and
essential industry insight to a readership of 46,000
creative professionals. The magazine covers and
celebrates the communication arts community,
and each issue includes winners from the annual
Applied Arts Awards programs. Applied Arts
hosts a number of annual events that support the
creative industry, including the Creative Futures
Expo, which educates high school students about
career possibilities in visual communications.
www.appliedartsmag.com
Domtar is committed to the responsible use of
paper. They’re also committed to communicating
paper’s place and value to the businesses and
people that use their products every day. Domtar
designs, manufactures, markets and distributes
a wide variety of fiber-based products including
communication papers, specialty and packaging
papers and personal care products. Domtar
continues to be fuelled by new ideas, collaboration
and technology to ensure sustainability for
generations to come.
www.domtarblueline.com
Whether you’re working at a design studio,ad
agency or in-house, fresh out of school or seasoned
veteran, you can trust Flash Reproductions to
manage any printing job from offset to letterpress
to digital. If you’re not sure of the best way to print
a job, no worries - they’ll sort it out with you while
respecting both your timeline and budget. They do
it all with an eye for detail and an obsession with
quality, because their goal is simple: to make you
a superstar in front of your client.
www.flashreproductions.com

61
The Pixel Shop is a team of interactive strategists,
designers and developers based in Toronto. Their
passion is conceiving, designing and building
one-of-a-kind online experiences for their clients.
Everything they do is part of an integrated
approach to the digital channel that spans strategy
to deployment, whether it’s a mobile app, an
enterprise-level content management system or
a marketing campaign, they craft it with love and
attention to detail second to none.
www.thepixelshop.ca
Purpose/Built is an integrated, full-service
strategic brand and digital design agency. They
unlock value for clients through custom-built
solutions based on in-depth research and a
thorough understanding of their clients’ business
strategy. Their diverse team of technical, creative
and strategy experts is based in Toronto, with
offices in New York and Kuala Lumpur.
www.purpose-built.com


![[GDC] Perry_POCBasedDesign_KOR](https://static.fdocuments.net/doc/165x107/55a25c0d1a28ab962b8b469b/gdc-perrypocbaseddesignkor.jpg)