Creation of the tool: background - wwp.org.br · nagement (SAGI). While SAGI was responsible for...
11
1 INFORMATION MANAGEMENT UNIFIED SOCIAL ASSISTANCE SYSTEM CENSUS (‘SUAS CENSUS’) Creation of the tool: background The Unified Social Assistance System (SUAS) is a government-run system that organizes and finances social assistance services in Brazil, based on a participatory and decentralized mana- gement model. Launched in 2005, the purpose of the system is to ensure social protection for families and individuals in situations of social vulnerability. From 2004 to 2007, the Ministry of Social Development and Fight against Hunger (MDS) en- couraged states and municipalities to join SUAS, and allocated substantial funds for them to ex- pand their social assistance services. 98% of Brazil´s municipalities had signed up to it by 2007. The rapid expansion of SUAS involved strengthening information production and monitoring as a basis for making decisions on the system´s future development. Before 2007, information on the number, type and quality of the social assistance services available did not exist. The urgent need to develop a scheme for tracking and monitoring the effectiveness of federal resources and the quality of social assistance services provided a catalyst for launching the SUAS Census. What is the SUAS Census? The SUAS Census is a data collection process based on an online form to be completed by social assistance departments and councils throughout the country. The Census contains data on social assistance management, physical structures, human resources and the services and benefits provided by the various social assistance outlets in Brazil. 1 The annual SUAS Census has been carried out jointly since 2007 by the National Secretariat for Social Assistance (SNAS) and the MDS’s Secretariat for Evaluation and Information Ma- nagement (SAGI). While SAGI was responsible for designing tools for the collection, analysis, processing and dissemination of data, the SNAS took on the task of defining the main issues and selecting the subjects to be tackled in the questionnaires, as well as mobilizing state and municipal stakeholders to take appropriate action. By making the Census a priority in the MDS agenda it was possible to engage local and sta- te partners in the process, leading to comprehensive coverage and reliable outcomes being achieved in record time. The SUAS Census was established at the outset with limited access to data on social assistan- ce facilities in place at the time. In reality it was necessary to create a data collection strategy from zero, given that in 2006 even the exact locations of the Reference Center for Social Assistance (CRAS) 2 were unknown. The only information available was the number of assis- tance facilities in individual municipalities. Surveys needed to be undertaken of existing social assistance infrastructure, the working conditions of CRAS professionals and, importantly, to determine the quantity and type of services offered by the centers. 1 Details of the SUAS Census can be found at: http://www.mds.gov.br/sagi. In the “SUAS Management ” window all the censuses and applications developed from them can be browsed. 2 The CRAS are public social assistance centers charged with organizing and providing Basic Social Protection to families and individuals in Brazil´s municipalities.
-
Upload
phungtuong -
Category
Documents
-
view
216 -
download
0
Transcript of Creation of the tool: background - wwp.org.br · nagement (SAGI). While SAGI was responsible for...

1
INF
OR
MA
TIO
N M
AN
AG
EM
EN
T UNIFIED SOCIAL ASSISTANCE SYSTEM CENSUS (‘SUAS CENSUS’)
Creation of the tool: background
The Unifi ed Social Assistance System (SUAS) is a government-run system that organizes and
fi nances social assistance services in Brazil, based on a participatory and decentralized mana-
gement model. Launched in 2005, the purpose of the system is to ensure social protection for
families and individuals in situations of social vulnerability.
From 2004 to 2007, the Ministry of Social Development and Fight against Hunger (MDS) en-
couraged states and municipalities to join SUAS, and allocated substantial funds for them to ex-
pand their social assistance services. 98% of Brazil´s municipalities had signed up to it by 2007.
The rapid expansion of SUAS involved strengthening information production and monitoring as
a basis for making decisions on the system´s future development. Before 2007, information on
the number, type and quality of the social assistance services available did not exist. The urgent need to develop a scheme for tracking and monitoring the e� ectiveness of federal resources and the quality of social assistance services provided a catalyst for launching the SUAS Census.
What is the SUAS Census?
The SUAS Census is a data collection process based on an online form to be completed by
social assistance departments and councils throughout the country. The Census contains data
on social assistance management, physical structures, human resources and the services and
benefi ts provided by the various social assistance outlets in Brazil.1
The annual SUAS Census has been carried out jointly since 2007 by the National Secretariat
for Social Assistance (SNAS) and the MDS’s Secretariat for Evaluation and Information Ma-
nagement (SAGI). While SAGI was responsible for designing tools for the collection, analysis,
processing and dissemination of data, the SNAS took on the task of defi ning the main issues
and selecting the subjects to be tackled in the questionnaires, as well as mobilizing state and
municipal stakeholders to take appropriate action.
By making the Census a priority in the MDS agenda it was possible to engage local and sta-
te partners in the process, leading to comprehensive coverage and reliable outcomes being
achieved in record time.
The SUAS Census was established at the outset with limited access to data on social assistan-
ce facilities in place at the time. In reality it was necessary to create a data collection strategy
from zero, given that in 2006 even the exact locations of the Reference Center for Social
Assistance (CRAS)2 were unknown. The only information available was the number of assis-
tance facilities in individual municipalities. Surveys needed to be undertaken of existing social
assistance infrastructure, the working conditions of CRAS professionals and, importantly, to
determine the quantity and type of services o� ered by the centers.
1 Details of the SUAS Census can be found at: http://www.mds.gov.br/sagi. In the “SUAS Management ” window all the censuses and applications developed from them can be browsed.
2 The CRAS are public social assistance centers charged with organizing and providing Basic Social Protection to families and individuals in Brazil´s municipalities.

2
A preliminary task was to discover the reasons why some of the centers were not functioning
despite receiving funds allocated by central government. This led to a baseline being establi-
shed for the overall census process.
The process of building the SUAS Census reached maturity in 2010 with the introduction of the
new questionnaires for collecting information on social assistance management bodies, coun-
cils and private assistance entities, as shown in Table 1.
Table 1: SUAS Census questionnaires applied and completed
Questionnaire type Number of questionnaires completed
2007 2008 2009 2010 2011 2012 2013 2014 2015*
Municipal Social Assistance
Management Agencies 5.488 5.409 5.315 5.442 5.520 x
State and District Social
Assistance Management
Agencies
27 26 27 26 26 x
Municipal Social Assistance
Councils (CMAS) 5.246 5.237 5.197 5.269 5.366 x
State and Federal District
Social Assistance Councils 27 27 27 26 26 x
Private Social Assistance
Entities (Covenanted) 9.398 10.265
Social Assistance Reference
Centers (CRAS)4.195 5.142 5.798 6.801 7.480 7.725 7.883 8.088 x
Specialized Social Assis-
tance Reference Centers
(CREAS)
982 1.224 1.590 2.109 2.167 2.249 2.372 x
Specialized Reference
Centers for Street People
(Centros POP)
105 131 215 x
Reception Centers (Centros
de Acolhimento) for di� erent
target audiences
4.360 4.423 5.184 x
Centers o� ering Sociability
and Family Ties-strengthe-
ning Services (except CRAS)
7.882 x
Special Social Protection Ser-
vice for Handicapped and El-
derly People and their Families
7.882 x
* Na época da elaboração deste texto, o Censo SUAS 2015 estava em processo de coleta de dados.

3
99% of the municipalities completed 28,519 questionnaires in 2010. The number of partici-
pating entities and completed questionnaires increased year-on-year: in 2014 some 35,000 questionnaires were collected and the databases expanded to contain a total of over 4000 variables. This resulted in improved social assistance decision-making processes, an expan-
ded social assistance network and scaled-up coverage. The indicators based on the SUAS
Census reinforced the planning processes aimed at improved management and social control
of the SUAS.
How the SUAS Census works
The online SUAS Census system is rolled out once a year to state and municipal managers
and those responsible for social assistance councils and private entities. The forms have to be
completed online with the required information. An average deadline of two months (in the
second half of the year) is allowed for respondents to fi ll out the questionnaires.
After the incoming data is checked, systematized and analyzed by MDS, it is used for planning
future activities and monitoring progress at the three levels of government. Once the data
is analyzed, the MDS begins the task of reviewing the questionnaires, comparing them with
results from previous years and applying the data to social assistance issues on the current
MDS agenda.
It is important to note that data collection for the SUAS Census is a joint task, undertaken by
various MDS departments and municipal and state managers. The exercise is not confi ned to
straightforward online form-fi lling: it involves a collective e� ort to construct, monitor and dis-
tribute data with a view to enhancing the entire spectrum of social assistance policy.
The questionnaires are organized in thematic blocks intended to reveal details of manage-
ment and social control, the physical structure of the various assistance services, the cha-
racteristics of the target public and the quantity and type of human resources available. The
questionnaire topics are adapted every year to refl ect social assistance policy core priorities.
The entire process is open, allowing the insertion of new questions, and indicators are genera-
ted for comparisons to be made at di� erent stages of the process, thereby enabling operators
to track policy and services evolution over time.
Following the data collection stage, synthetic and analytical reports are prepared to inform
MDS decisions. The information and indicators resulting from SUAS Census data have made an important contribution to the negotiations with states and municipalities concerning re-sources-sharing and their commitment to improving the quality of social assistance services.
When the online questionnaires are launched, these are simultaneously tracked via cellphone or
computer to ensure that they are completed, and to alert managers in the event of any delays.
The 2014 SUAS Census assembled data from 99% of municipal social assistance units, and from 96% of the state agencies. Table 1 on the previous page shows the SUAS Census data
from 2007 to 2014. The Census revealed the number of stakeholders that had completed the
questionnaires as well as the amount of data available for strengthening social assistance
policy actions in Brazil.
3 In 2014, 37 municipalities had still not adhered to the SUAS, and therefore did not respond to the SUAS Census.

4
The information management tools are developed internally at SAGI by a multidisciplinary
team of programmers, statisticians, engineers and other professionals. The SNAS team is
also multidisciplinary, containing sociologists, social workers, economists, psychologists and
others. In 2010, 42 professionals in the MDS were directly involved in the SUAS Census exer-cise. Over the years it became necessary to focus on the critical points of the online data collection process, such as the preparation of questions and the construction and monitoring of the actual questionnaire. While the social assistance managers are responsible for framing the questions, the SUAS Census programming work is currently done by only three people4. Meanwhile, the number of people engaged in preparing the questionnaires and analyzing the
assembled data has increased every year due to the growing number of questionnaires and
general interest in the Census which, given its improved consistency, is now acknowledged as
a genuine strategic asset by SUAS management.
The development and implementation of the SUAS Census is done with MDS human, fi nancial
and technological resources. The Census has no specifi c budgetary allocation: it is an ongoing
activity forming an integral part of the MDS workload.
In 2014, the SUAS Census mobilized over 35,000 employees of the social care network in the municipal and state governments, councils and private sector. Data visualization tools and
access to the SUAS Census application make real-time monitoring of questionnaires possible,
with the federal government team identifying issues and working closely with the states to
mobilize and guide sta� , expand adhesion to the Census and improve the quality of the data
provided by recipients of the questionnaires. Similar e� orts are made to encourage the state
authorities to do the same vis-á-vis the municipal authorities in their domain. SUAS Census
monitoring activities have clearly aided the planned growth and improvement of social assis-
tance services in general.
In 2014, the SUAS Census recorded the existence of 8088 CRAS, 2372 CREAS, 215 POP Cen-
ters, 5184 Reception Centers and 7882 ‘Sociability’ Centers (Centros de Convivência)5. The
value of the SUAS Census, acknowledged as a tool for enhancing the quality of SUAS mana-
gement, received in 2011 one of the awards in the Innovation in Federal Public Administration
Competition organized by the National School of Public Administration (ENAP)6.
4 When the SUAS was fi rst introduced many people discussed the initiative and provided feedback. At present only those who actually work with the SUAS are involved in the Census.
5 The Social Assistance Reference Center (CRAS) is the gateway to social assistance in Brazil. It is a public place, located in an area of social vulnerability, where basic social assistance services are o� ered. The Specialized Reference Center for Social Assistance (CRE-AS) provides services to families and people who are at social risk or have had their rights violated. The Specialized Reference Centers for Homeless People (Centros POP) arrange individual consultations, workshops and socialization activities for people living on the streets. The Reception Centers (Unidades de Acolhimento) provide protection and temporary abode to abandoned individuals and families and to those su� ering violation of their rights. The ‘Sociability’ Centers (Centros de Convivência) organize cultural and sports activities aimed at streng-thening family and community relationships.
6 Since 1996, the Awards for Innovation in Federal Public Management have been sponsored annually by ENAP, in partnership with the Ministry of Planning, Budget and Management. The awards reward teams of public employees that introduce innovations to everyday activities and generate improvements in the management of public and political organizations - thus contributing to scaling up the quality of public services and increasing the e� ectiveness of the State’s responses to society´s demands.

5
The tool-building process
One of the challenges faced by SAGI is to ensure that all the stakeholders — states, municipali-
ties, councils and private entities — make good use of the information collected in the various
censuses for expanding and scaling up their social assistance services.
The initial information management challenge facing the originators of the SUAS Census was to place a limit on the questions that managers wished to include in the data collection tool. While managers wanted to know everything, they had little idea of what to do with the
responses. Once the number of questions was reduced, a basic online tool was produced for
monitoring the CRAS (the ‘CRAS Monitoring Questionnaire’).
Figure 1 shows the print version produced during development of the tool. SAGI subsequen-
tly began to work with the idea of structuring data to store the information contained in the
questionnaire, convinced that a well-constructed database was essential for ensuring e� cient
data recovery. In line with relational databases theory, a procedure was introduced for stan-
dardizing the collected data consisting of a step-by-step approach to enable consistent stora-
ge, rapid access to database material, reduction of excess data and minimum inconsistencies
(Data Standardization, 2013).
7 Title of the 1st version of the SUAS Census.
Figure 1: Print version of the CRAS Monitoring Questionnaire

6
The SUAS Census questionnaire was divided into data related to the social assistance units,
human resources, management, etc. Figure 2 shows one of the drafts prepared during the de-
velopment process. Much time was devoted to analyzing the questionnaire in order to evaluate
the questions and, in particular, to display them in tabular form.
It was necessary to create an Entity and Interface Framework to identify the various entities in-
volved in the questionnaire and to map their relationships with one another. It was decided, for
example, that CRAS would be defi ned as an entity with its own special markers such as address,
e-mail, municipality, zipcode, state, telephone, GPS etc. Another entity consisted of the indivi-
dual members of the CRAS TEAM, denoted by name, date of birth, CPF8 and job description.
The relationship between the CRAS and the TEAM was defi ned as 1:N (one to N), meaning that
in a particular CRAS the team would consist of “N” number of members. Details would therefore
be available of the number of entities and the relationships between them. By the end of the
process, each entity would be entered in a table in the database.
8 The CPF (Register of Physical Persons) is a registry run by the Federal Tax O� ce. Any individual, regardless of age or nationality, is allowed to register once only. Individual CPF holders are identifi ed by a card containing 11 numbers plus a confi rmatory digit.
Figure 2: Standardization of the CRAS Monitoring Questionnaire (May 2007)

7
Once the basic model had been prepared, the result was presented to those responsible for
the project. The wording of the questions and the order of presentation underwent some
changes, with some questions being suppressed and others added.
The protocol taught in software engineering and databank schools (relational data model, entity relationship diagrams, data logic models, case and uses diagrams) did not provide the necessary fl exibility for the SUAS Census. The fi rst e� ort, (Figure 2) was discarded after this
reality check, and the strategy for storing the questions in the CRAS Monitoring Questionnaire
had to be altered to take account of the frequent amendments requested on the questionnai-
res by social assistance managers.
After much discussion and thought on the best way to store data from a constantly discus-sed and adjusted data-collection tool, it was eventually decided that the problem should be resolved by restricting the process basically to storing a set of questions and answers. In other words, to simply use a data storage structure confi ned to a number of tables, with
CRAS minimally defi ned (municipality, address, e-mail, telephone) and an ITEM_QUEST table
containing fi ve fi elds, as shown in Table 2 and Figure 3.
Table 2: ITEM_QUEST fi eld for storing answers
Field Description
id_cas Unique CRAS identifi cation
Question Question for response
Answer Response given by user
User User replying to the question
data_reg Date response recorded
Figure 3: Solution adopted for storing the CRAS Monitoring Questionnaire structure
8
This simple approach made the task much easier since, as discussion proceeded on the con-
tents of the questionnaire, it was possible simultaneously to continue to design the structure
of the data collection tool. As with building a house, while the type of house, decoration, etc
was being decided, another team would begin the actual construction work. The question
was: how was it possible to start building a house without defi ning a proper plan? In order to
create the basic structure of the house, regardless of its type, it is vital to have cement, bricks,
reinforcing steel, etc.
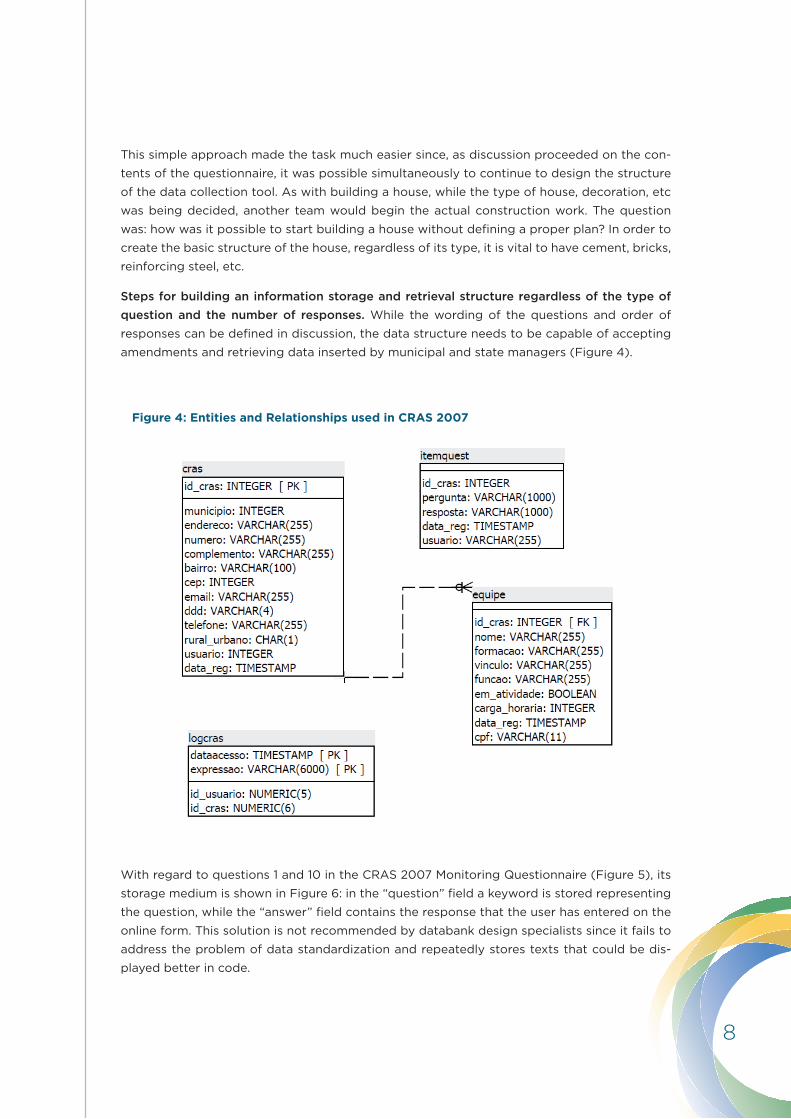
Steps for building an information storage and retrieval structure regardless of the type of question and the number of responses. While the wording of the questions and order of
responses can be defi ned in discussion, the data structure needs to be capable of accepting
amendments and retrieving data inserted by municipal and state managers (Figure 4).
Figure 4: Entities and Relationships used in CRAS 2007
With regard to questions 1 and 10 in the CRAS 2007 Monitoring Questionnaire (Figure 5), its
storage medium is shown in Figure 6: in the “question” fi eld a keyword is stored representing
the question, while the “answer” fi eld contains the response that the user has entered on the
online form. This solution is not recommended by databank design specialists since it fails to
address the problem of data standardization and repeatedly stores texts that could be dis-
played better in code.

9
However, this approach can be justifi ed by the need to meet the substantial demands for
amendments to the questions and answers from users during the SUAS Census exercise. For
question 1 “Indicate the CRAS funding sources,” the keyword used is “funding source” and in
question 10 “Indicate the items in CRAS” the keyword is “existing_ items”.
Figure 5 - Part of the CRAS 2007 Monitoring Questionnaire
1. ( ) Check the funding sources of this CRAS:
1. ( ) Federal Government
2. ( ) State Government
3. ( ) Municipal Government
......
10. Check the amenities available in the CRAS:
1. ( ) Reception area
2. ( ) Interview room for individual sessions
3. ( ) Room for family group meetings
4. ( ) Room for technical team and coordination sta�
5. ( ) Restroom
6. ( ) Kitchen
7. ( ) Stockroom
8. ( ) Space for socio-educational and conviviality groups
9. ( ) Access facilities for elderly and handicapped people
10. ( ) Telephone
11. ( ) Computer
12 ( ) Internet access
Figure 6: Example of use of the table

10
A further important task was to defi ne the way of registering users authorized to enter CRAS
data in each of Brazil’s 5,570 municipalities. Based on the idea that the process should be
totally decentralized, a mechanism was created for the user to access the system by com-
pleting a registration form, after which authorization would be confi rmed through exchange
of e-mails. A number of problems have now been resolved to allow the systems to transmit
e-mails: previously the MDS IT department did not accept that other coordination units could
develop computer systems, and prohibited SAGI from accessing the e-mail service. After
much technical and political argument, authorization and e-mail access issues were however
fi nally obtained.
A week before its launch, it was determined that the data collection instrument should be in-
corporated into another registry — the CADSUAS/SUASWEB (Unifi ed Social Assistance Sys-
tem Registry). At the time, the SAGI development team was unaware of the existence of this
registry. It was necessary therefore to fi nd one of the programmers responsible for the deve-
lopment of the CADSUAS, who foresaw the possibility of consulting the system’s databank
in the Database Management System (SGBD) ORACLE, where it was deemed possible to au-
thorize users to gain access to the questionnaire. The questionnaires were stored in the SGBD
POSTGRESQL, which made it necessary to consult users in the ORACLE databank. After two
intensive working days it became possible to enable users registered in the CADSUAS to ac-
cess the questionnaires. The idea of registering and using e-mail9 for communication by users
was therefore discarded. Regardless of these unforeseen changes, the CRAS Monitoring Ques-
tionnaire was successfully launched on time. The episode simply illustrates the importance of
a fl exible IT solution in the government sphere, where everything can change without warning.
In the fi rst version, 4,182 CRAS were registered in 3,151 municipalities, with 3,947 in operation
and 235 under construction. The numbers achieved were not entirely due to the online data
collection tool, but also to good coordination and mobilization of the individuals involved in
the process. In order to encourage more stakeholders to complete the online questionnaire, an o� cial resolution was published in January 2008 ruling that the fi xed monthly baseline pay-ments to municipal authorities would be suspended if they failed to return the questionnaires.10
It was necessary from the start to conduct intensive monitoring of the data collection process,
since this did not employ traditional databank concepts such as the use of the entity relational
approach. Traditionally, each entity generates a table in the SGBD (producing a large number
of tables), but the adopted solution in the MDS utilized only 3 main tables and one auxiliary
table to record activities. There was no guarantee that this solution would work, but it was certainly viable in an institutional context. The questions and answers change almost daily, and the structure that was established provides enough fl exibility to absorb these changes. In order to ensure that the adopted code correctly recorded the data entered by managers, a
system-variable monitor display was designed to ensure that all respondents had completed
every fi eld on the questionnaire.
9 On the other hand, adhesion to the SUAS Census was less problematic since it was not necessary to generate passwords and users.
10 The fi xed baselines are the amounts of co-fi nancing funds allocated by the federal government to cover the local costs of on-going SUAS social assistance services.

11
Lessons learned
After the creation of the SUAS Census, the Brazilian social assistance network improved substantially
from the point of view of decision-taking, thus making it viable to expand the network and increase
the coverage of social assistance services. Table 3 summarizes the main obstacles encountered
and the solutions adopted in the SUAS Census:
Table 3: Lessons learned during the Census SUAS Census development process
OBSTACLES SOLUTIONS
In 2007 the use of electronic devices for ma-
nagement and decision-taking was still in its
infancy among Social Assistance Policy opera-
tors.
Development of simple user-friendly tools in or-
der to encourage their use by those unfamiliar
with feeding electronic data systems.
Many concepts and defi nitions of the social as-
sistance services were not duly consolidated
and disseminated, which made understanding
of the questions in the questionnaires di� cult.
Online and telephonic support to users at the
questionnaire completion stage; availability of
instruction manuals for helping people to com-
plete the questionnaires; the use of an online
dictionary coupled with the online questionnaire,
and containing explanations of each of the varia-
bles collected.
Since the SUAS Census intended to collect data
from all the municipalities with CRAS or CREAS,
success depended largely on the municipalities
adhering voluntarily to the scheme.
Design of a participatory methodology: under-
taking the census is always preceded by meetin-
gs with state and municipal representatives - oc-
casions on which criticism and suggestions are
received and procedures agreed upon; monthly
fi xed baseline payments suspended for municipa-
lities receiving co-fi nancing and which fail to res-
pond to the questionnaires; dissemination to the
managers at the three levels of government of the
results of the SUAS Census through publications,
visualizers, tabulators, maps, indicators etc
The protocol taught in databank and software
engineering schools lacked the necessary fl exi-
bility for the SUAS Census.
Creation of a simplifi ed method to store data
from a data collection tool that is under constant
discussion and subject to adjustment.
References
BRAZIL. Ministry of Social Development and Fight against Hunger (MDS). O Censo SUAS
como processo de aprimoramento e institucionalização da Política de Assistência Social no
Brasil. In: AÇÕES PREMIADAS NO 16O CONCURSO INOVAÇÃO NA GESTÃO PÚBLICA FEDE-RAL. Brasilia: ENAP, 2011. ISBN: 978-85-256-0067-7.
NAKASHIMA, Caio; FARIAS, Luis Otavio Pires. O Censo SUAS como processo de aprimora-
mento e institucionalização da Política de Assistência Social no Brasil. In: VI SEMINÁRIO DA REDE BRASILEIRA DE MONITORAMENTO E AVALIAÇÃO. Porto Alegre, 2014.