SchemEX - Creating the Yellow Pages for the Linked Open Data Cloud

CHIS: Open Data e Linked Open Data
7: Creating Open Data
Vittorio Scarano
Dipartimento di Informatica Università di Salerno (Italy)
1CHIS:OpenDataandLinkedOpenData
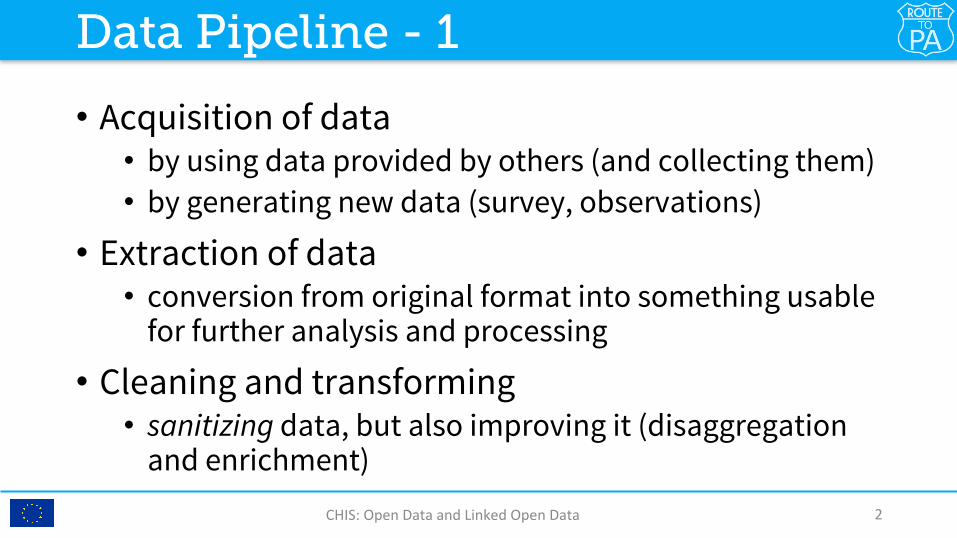
• Acquisition of data • by using data provided by others (and collecting them) • by generating new data (survey, observations)
• Extraction of data • conversion from original format into something usable
for further analysis and processing
• Cleaning and transforming • sanitizing data, but also improving it (disaggregation
and enrichment) CHIS:OpenDataandLinkedOpenData 2
Data Pipeline - 1

• Analysis of data • to answer particular questions that are not easily
recognizable in data
• Presentation and visualization of data • to make more clear and effective arguments • dependent on the audience
Some of these topics will be treated with more details
CHIS:OpenDataandLinkedOpenData 3
Data Pipeline - 2

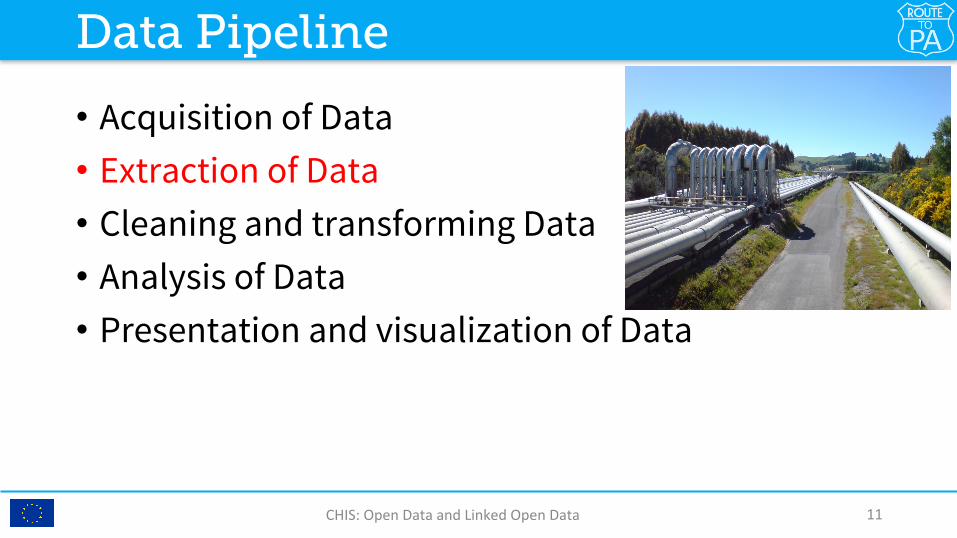
• Acquisition of Data • Extraction of Data • Cleaning and transforming Data • Analysis of Data • Presentation and visualization of Data
CHIS:OpenDataandLinkedOpenData 4
Data Pipeline

• Acquisition of Data • Extraction of Data • Cleaning and transforming Data • Analysis of Data • Presentation and visualization of Data
CHIS:OpenDataandLinkedOpenData 5
Data Pipeline

• Qualitative data • description of a quality • can be experienced and observed but not measured
• Quantitative data • expressed by numbers and can be measured • discrete data (integer) • continuous data (floating point)
• Categorical data • describe a category which the item belongs to
CHIS:OpenDataandLinkedOpenData 6
Acquisition of data: which kind?

• Data for humans • able to understand natural language J • unstructured data • often found in documents (PDFs): not machine-readable
• Data for computers • structured and in a machine-readable format • CSV: comma separated value as an example • spreadsheets for simple use
CHIS:OpenDataandLinkedOpenData 7
Acquisition of data: for whom?

• Data provenance • Good documentation is needed • to preserve the “chain of custody” to identify the owner and
the processing that took place • Some automatic tools • Open Refine (formerly known as Google Refine)
• If some custom procedures (programs) are used, they should be available open source on repositories • GitHub, Sourceforge etc.
CHIS:OpenDataandLinkedOpenData 8
Acquisition of data: where from?

• Finding data that was already been released • care in ensuring that the Open license is followed
• Getting hold of more data • new data from official sources, via Freedom of
Information Act (FOIA) requests • data that comes from scraping websites
• Collecting data • gathering data and entering it into a spreadsheet
CHIS:OpenDataandLinkedOpenData 9
Acquisition of Data: the sources
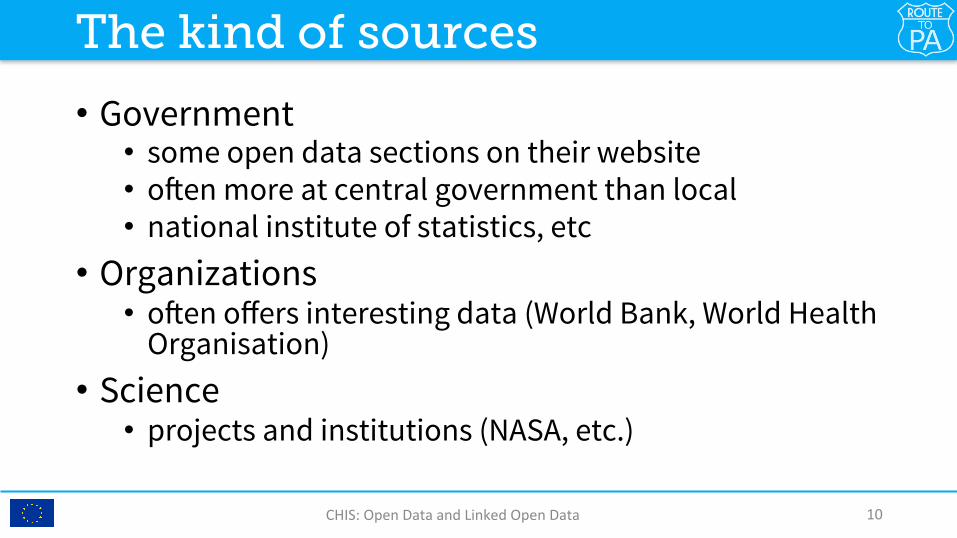
• Government • some open data sections on their website • often more at central government than local • national institute of statistics, etc
• Organizations • often offers interesting data (World Bank, World Health
Organisation) • Science • projects and institutions (NASA, etc.)
CHIS:OpenDataandLinkedOpenData 10
The kind of sources
• Acquisition of Data • Extraction of Data • Cleaning and transforming Data • Analysis of Data • Presentation and visualization of Data
CHIS:OpenDataandLinkedOpenData 11
Data Pipeline

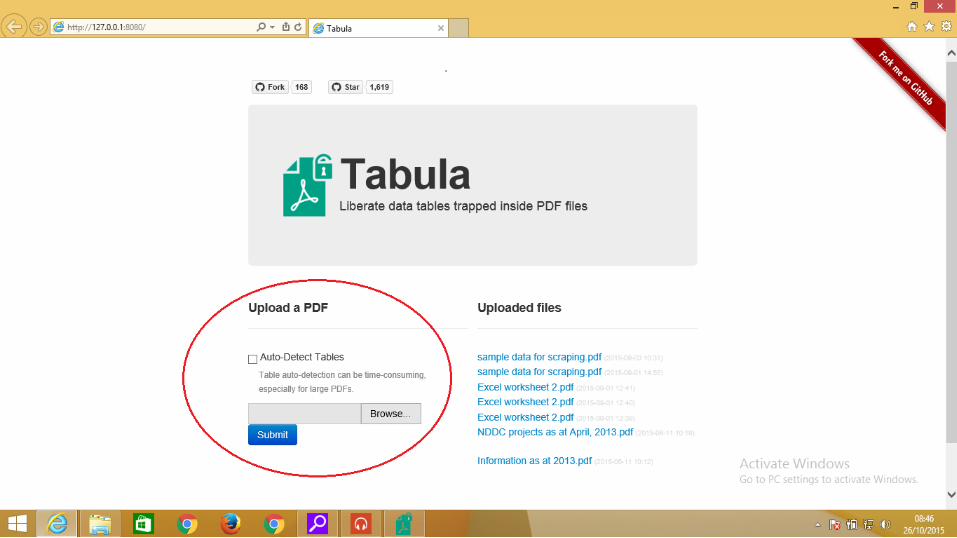
• Often unstructured data is released with PDF • If the PDF is the scanned version of documents,
there is not much to do L • Else… there are many converters, that sometimes
are messy with tables • Tabula software (MIT open license) is very useful • versions for Windows, Mac, Linux available
CHIS:OpenDataandLinkedOpenData 12
Extracting data from PDF

14

15
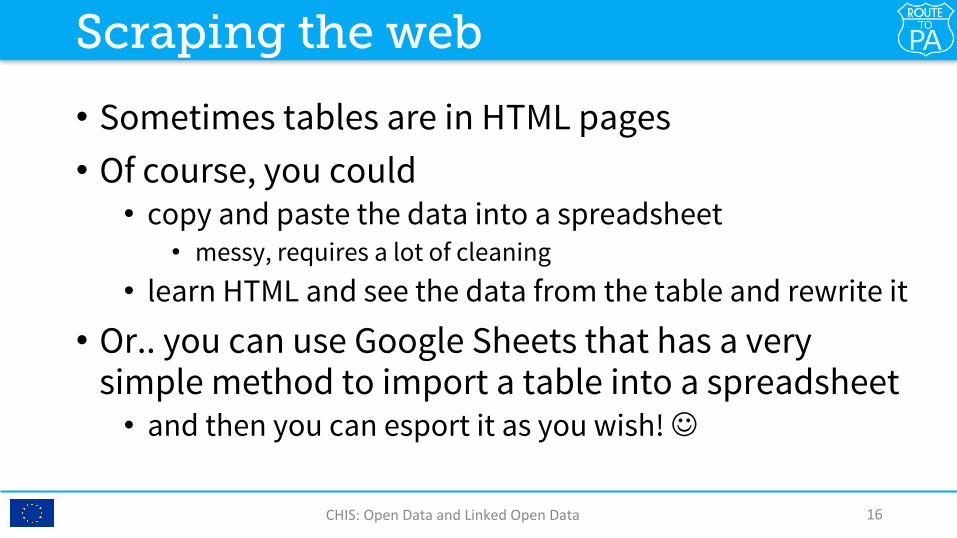
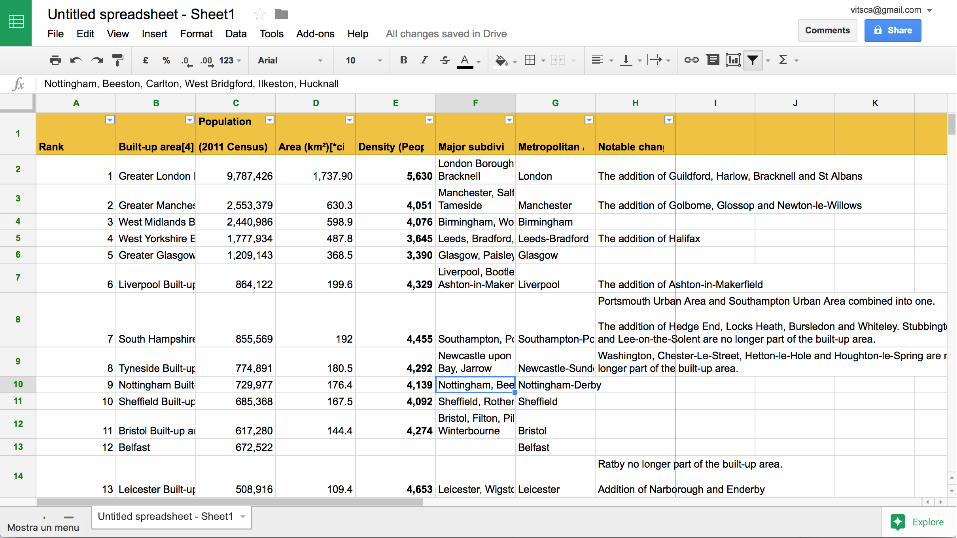
• Sometimes tables are in HTML pages • Of course, you could
• copy and paste the data into a spreadsheet • messy, requires a lot of cleaning
• learn HTML and see the data from the table and rewrite it
• Or.. you can use Google Sheets that has a very simple method to import a table into a spreadsheet • and then you can esport it as you wish! J
CHIS:OpenDataandLinkedOpenData 16
Scraping the web

CHIS:OpenDataandLinkedOpenData 17

CHIS:OpenDataandLinkedOpenData 18


CHIS:OpenDataandLinkedOpenData 20

CHIS:OpenDataandLinkedOpenData 21

CHIS:OpenDataandLinkedOpenData 22
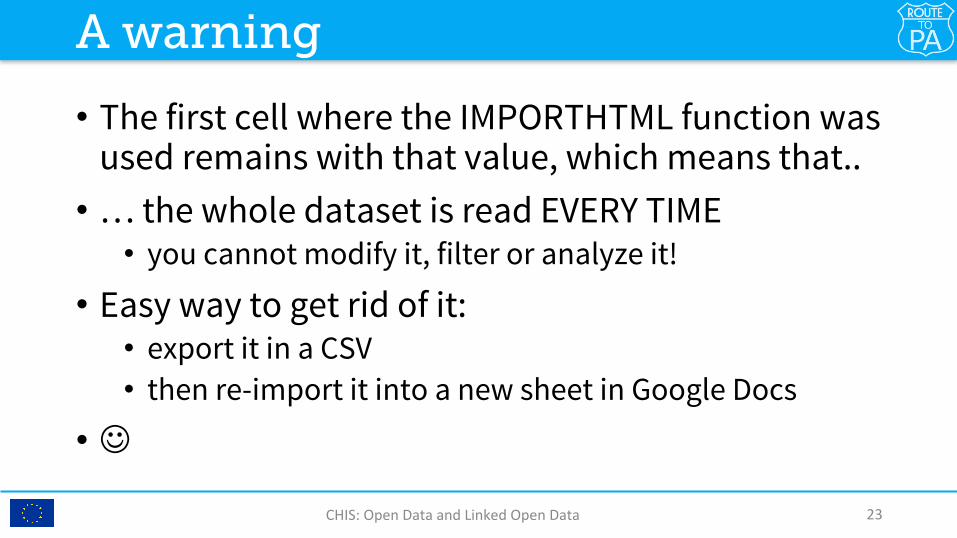
• The first cell where the IMPORTHTML function was used remains with that value, which means that.. • … the whole dataset is read EVERY TIME • you cannot modify it, filter or analyze it!
• Easy way to get rid of it: • export it in a CSV • then re-import it into a new sheet in Google Docs
• J
CHIS:OpenDataandLinkedOpenData 23
A warning
• Acquisition of Data • Extraction of Data • Cleaning and transforming Data • Analysis of Data • Presentation and visualization of Data
CHIS:OpenDataandLinkedOpenData 24
Data Pipeline

• Easy and familiar tool • extremely more powerful and useful than average
users think • Originated since the very beginning of computing • Visicalc, LotusNotes, ..
• Many opportunities available: • Google Spreadsheets • Open/Libre Office • Microsoft Excel
CHIS:OpenDataandLinkedOpenData 25
“The” tool: spreadsheet!

CHIS:OpenDataandLinkedOpenData 26
A quick comparison

CHIS:OpenDataandLinkedOpenData 27


• Sorting and filtering allow you to “know” your dataset • .. to understand what kind of information it
contains • .. and understand how it can contribute to
knowledge • But before that, we must “clean up the data”
CHIS:OpenDataandLinkedOpenData 33
How to “know” your dataset

34
Cleaning up data

• Formatting does not come along with data • Whitespace and new lines • Blank cells • Numbers that are NOT numbers • Data in inconvenient places • .. and many others!
CHIS:OpenDataandLinkedOpenData 35
Some common mistakes

• All the formatting is not useful • Select all the cells
(CTRL+A) • Use Format and
then “Clear formatting”
CHIS:OpenDataandLinkedOpenData 36
Eliminate Formatting
CHIS:OpenDataandLinkedOpenData 37

CHIS:OpenDataandLinkedOpenData 38

• Important to make the data readable for processing • Additional blanks, or newlines create problems • For example: the first item has a newline
CHIS:OpenDataandLinkedOpenData 39
Whitespace and linebreaks

CHIS:OpenDataandLinkedOpenData 40

CHIS:OpenDataandLinkedOpenData 41

CHIS:OpenDataandLinkedOpenData 42

• TRIM(): Clears trailing and leading blanks • CLEAN(): Clears non printable characters • From a column B, it is possible to create a new
column C with “cleaned data” • and copy and pasted “only values” into a third column
D to get the cleaned data • .. and only then, you can get rid of the first two
columns B and C and only deal with the “cleaned” D column
CHIS:OpenDataandLinkedOpenData 43
Some useful functions

CHIS:OpenDataandLinkedOpenData 44

CHIS:OpenDataandLinkedOpenData 45


47

• Often empty cells are present and creates a lot of problems • Useful functions are COUNTBLANK, ISBLANK • Useful also is the filter mechanism • can check the number of empty cells
• Careful when replacing empty cell • the message should be clear that there are no data, not
that the value is 0
CHIS:OpenDataandLinkedOpenData 48
Empty cells
• National formatting: • in italian, the floating point is a the comma
• so 3,14 is NOT a Pi in a non-italian spreadsheet: it is a string! • while 3,141 is three thousand, one hundred forty one!
• the virgola separates the thousands
• Wrong blanks in between digits • it is not a number: is a string
• Wrong numbers means that we cannot compute • sum, average, min, max, etc.
CHIS:OpenDataandLinkedOpenData 49
Numbers that are not numbers


CHIS:OpenDataandLinkedOpenData
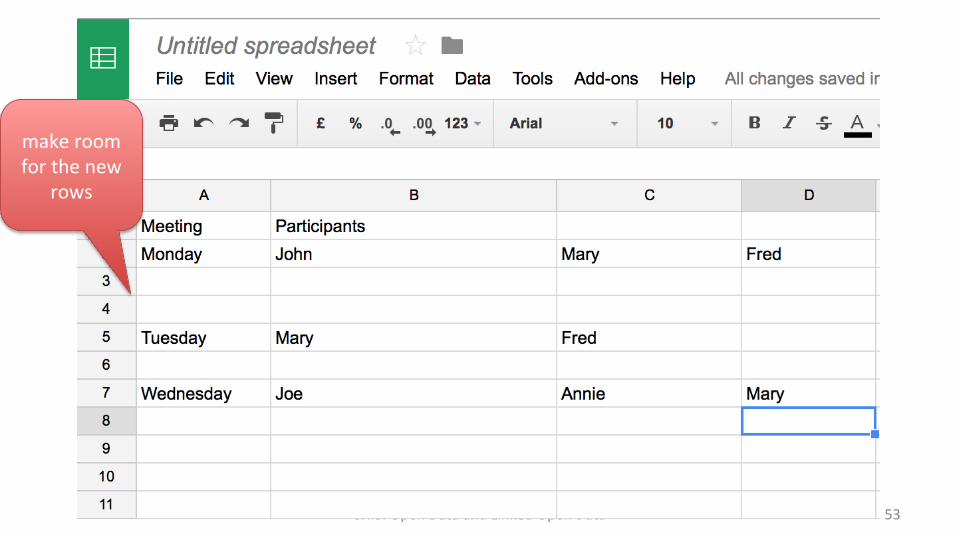
CHIS:OpenDataandLinkedOpenData 53
makeroomforthenew
rows
CHIS:OpenDataandLinkedOpenData 54

CHIS:OpenDataandLinkedOpenData 55

CHIS:OpenDataandLinkedOpenData 56

• Acquisition of Data • Extraction of Data • Cleaning and transforming Data • Analysis of Data • Presentation and visualization of Data
CHIS:OpenDataandLinkedOpenData 57
Data Pipeline

• Useful for summarizing tables • without creating new tables • without creating new columns • without writing formla
• Of course, pivot table is only a tool • data analysis is a very complex topic • and we are just “scratching the
surface” of it!
CHIS:OpenDataandLinkedOpenData 58
Pivot table

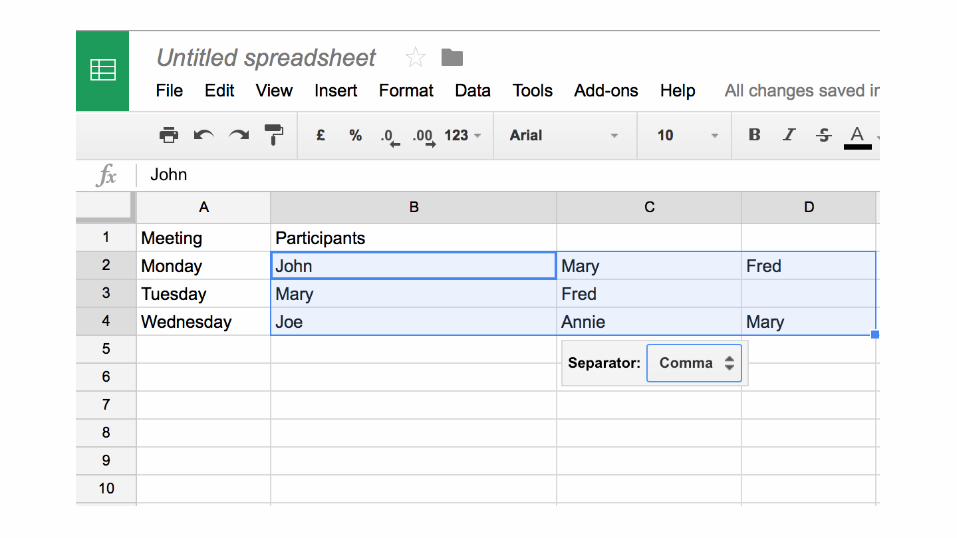
Let’s start from a simple table

Create a pivot table (with the data)

Empty pivot table (new sheet)

Select “Group”, “Col”, “Values”

You can choose different summaries

How to structure data

A pivot table with two rows

• The columns are ordered in alphabetical order • “April” before “February” L
• Solutions 1. use the number to indicate the month: 1, 2, .. , 12
• but the name is not very communicative on the table 2. use a string that retain the alphabetical order such as
• “01- January”, “02-February”, etc.
• In this way we have both order and information on the column headers
A visualization problem

Change the values (Find&Replace)
CHIS:OpenDataandLinkedOpenData
67


The meeting table, now…

• Acquisition of Data • Extraction of Data • Cleaning and transforming Data • Analysis of Data • Presentation and visualization of Data
CHIS:OpenDataandLinkedOpenData 70
Data Pipeline

CHIS:OpenDataandLinkedOpenData 71
Difficult… always difficult!
• Communicating visually information that can be complex, in the right way • Often, spreadsheets offer many “exotic” ways of
defining charts • often, not useful to convey information
• A running example on how to improve a chart
CHIS:OpenDataandLinkedOpenData 72
Building graphs and charts

ThestarDngpoint!

CHIS:OpenDataandLinkedOpenData 74
Getridof3D!
CHIS:OpenDataandLinkedOpenData 75
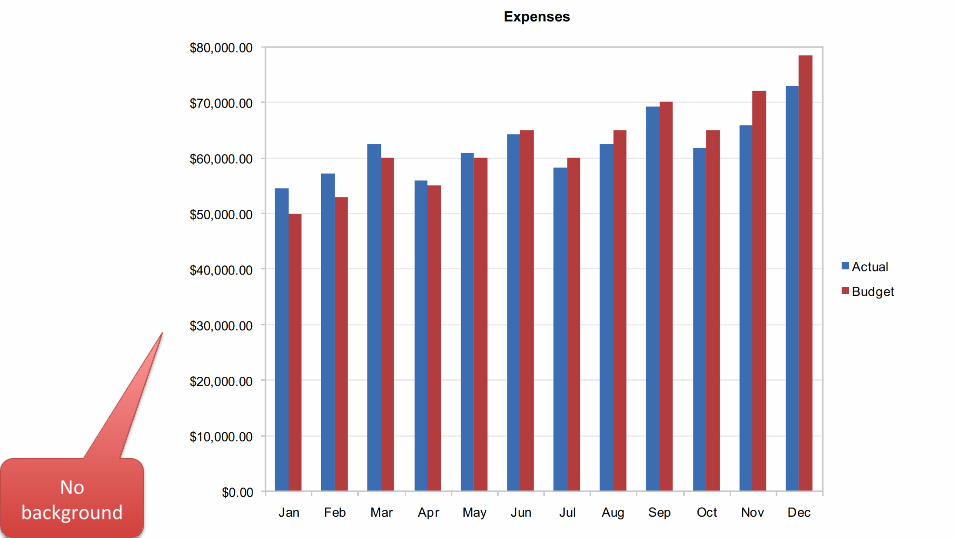
Nobackground
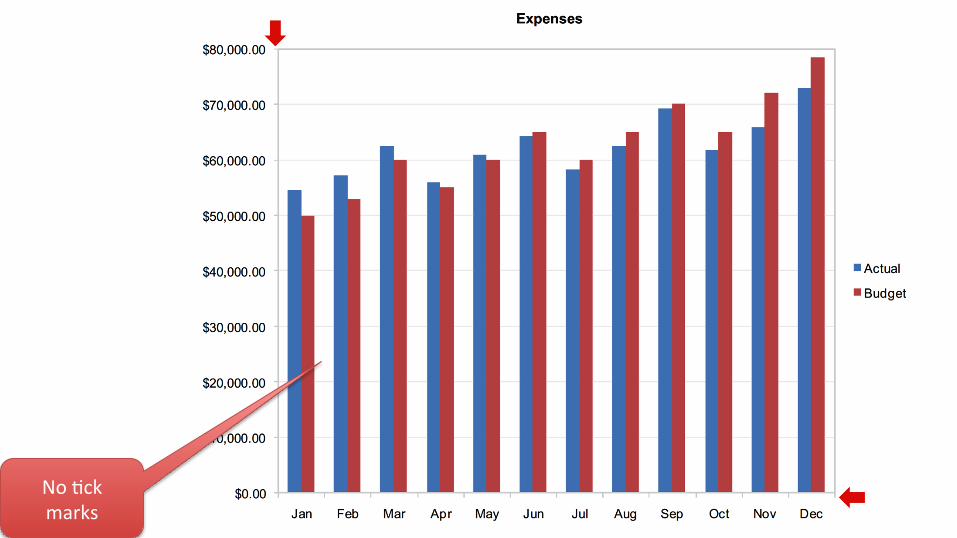
CHIS:OpenDataandLinkedOpenData 76
NoDckmarks
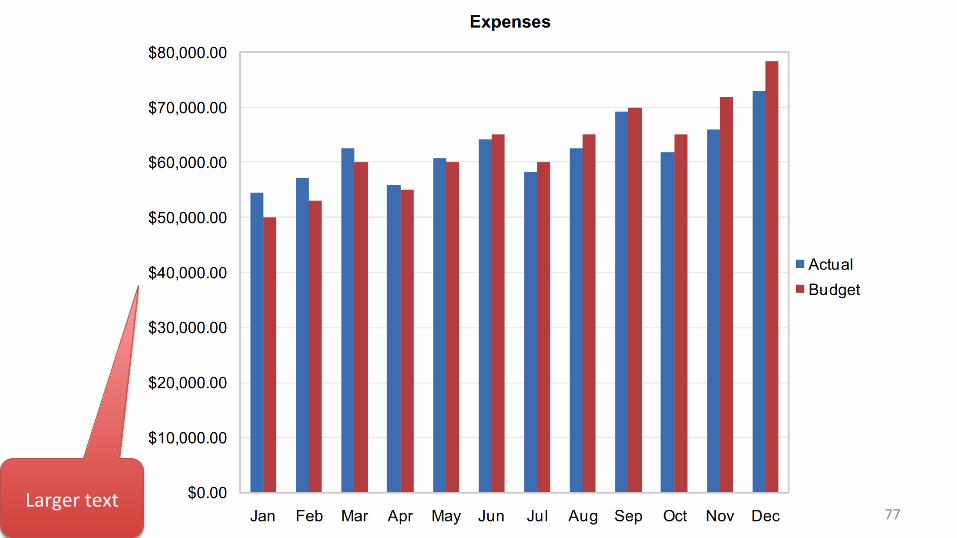
CHIS:OpenDataandLinkedOpenData 77Largertext

CHIS:OpenDataandLinkedOpenData 78
Nodecimalpoint!

CHIS:OpenDataandLinkedOpenData 79$intheaxis!

CHIS:OpenDataandLinkedOpenData 80
Legendaontop

CHIS:OpenDataandLinkedOpenData 81
Easiertoread!andno“red”sign

CHIS:OpenDataandLinkedOpenData 82
Lessrelevanceto
budget

CHIS:OpenDataandLinkedOpenData 83
PaTerninDme

CHIS:OpenDataandLinkedOpenData 84
Changeinscaletoseedifferences

CHIS:OpenDataandLinkedOpenData 85Nolegend

CHIS:OpenDataandLinkedOpenData 86Easyprintout

CHIS:OpenDataandLinkedOpenData 87
Onlyshowvariance!

CHIS:OpenDataandLinkedOpenData 88
Onlyshowpercentage!

CHIS:OpenDataandLinkedOpenData 89

Different relationships to be explained with charts 1. Time-series 2. Ranking 3. Part-to-whole 4. Deviation 5. Distribution 6. Correlation 7. Geospatial
CHIS:OpenDataandLinkedOpenData 90
Relationships with charts

1. Timeseries
91
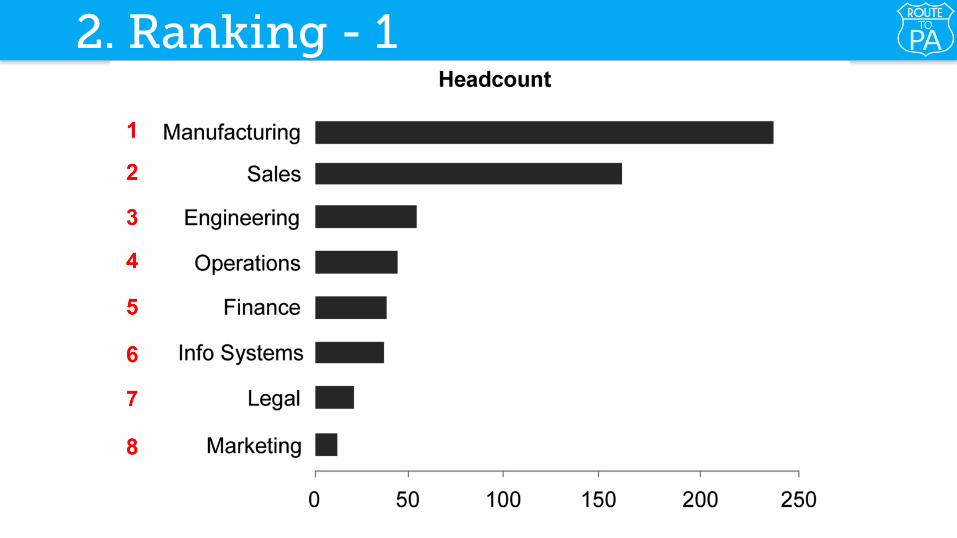
2. Ranking - 1

2. Ranking - 2
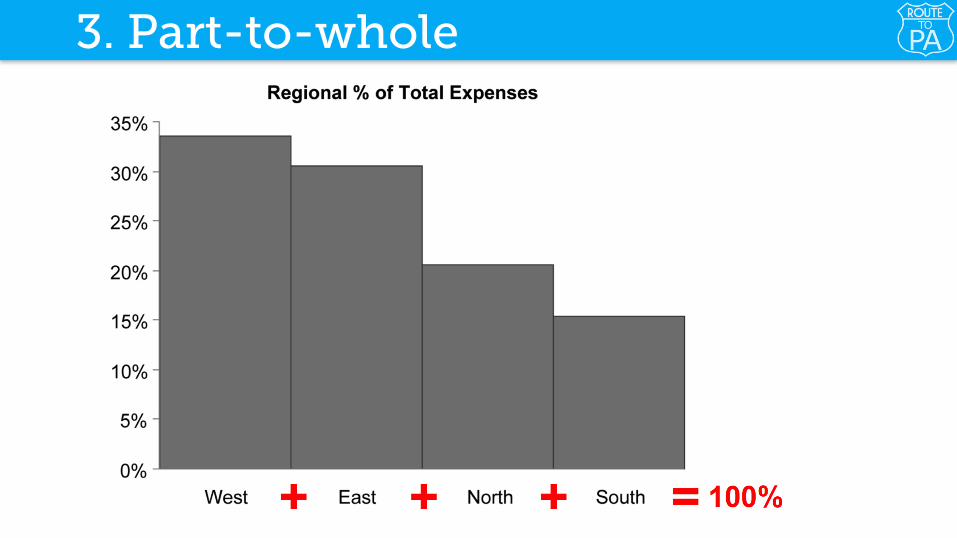
3. Part-to-whole

Pie-chart! (highly debated..!)

Problem: pick the largest (?)

And now???
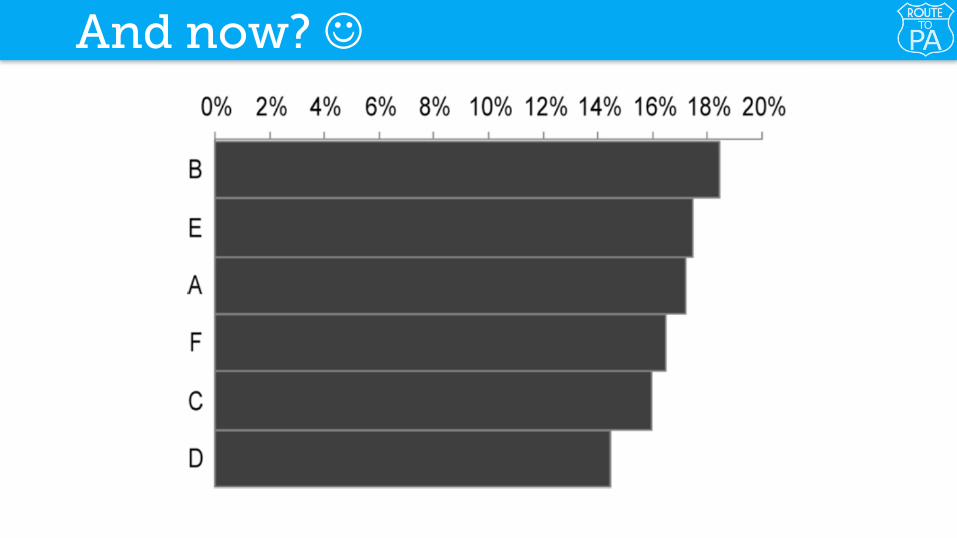
And now? J

The only acceptable pie-chart?

4. Deviation

5. Distribution

Beware the average… this..

… this..
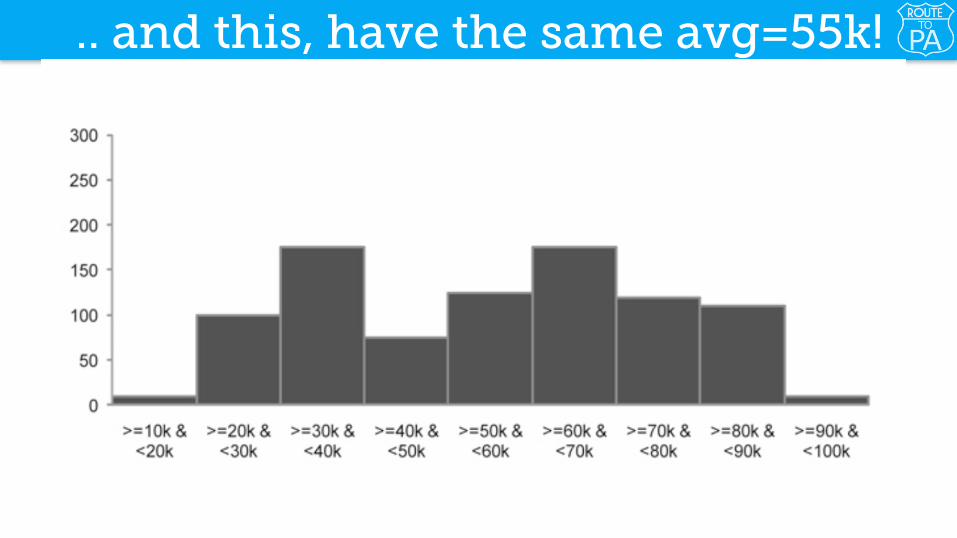
.. and this, have the same avg=55k!

6. Correlation
105

• “Post hoc ergo propter hoc” • A correlation between two variables does not imply
that one causes the other • Known logical fallacy
• epidemiological studies showed that women taking combined hormone replacement therapy (HRT) had a lower-than-average incidence of coronary heart disease (CHD): HRT was protective against CHD
• women undertaking HRT were more likely to be from higher socio-economic groups (ABC1), with better-than-average diet and exercise regimens: fewer CHR
“Correlation does not mean causation”

Some hilarious examples - 1

Some hilarious examples - 2

Some hilarious examples - 3
MoreavailableathTp://www.tylervigen.com/spurious-correlaDons

6. Correlation - 2

7. Geospatial
AnotherclassificaDon


Thebestchartever!Minard(1869)
CHIS:OpenDataandLinkedOpenData 117
• Part of the material comes with license CC • picture “Bath time” by archer10 (CC-A-SA 2.0)
• Bibliography: • "Data wrangling handbook", OKF https://media.readthedocs.org/
pdf/datapatterns/latest/datapatterns.pdf • School of Data, OKF, http://schoolofdata.org/courses/ • “Telling compelling stories with Numbers”, Stephen Few,
Perceptual Edge. http://www.actuate.com/download/acd2012/Telling-Compelling-Stories-with-Numbers.pdf
• “Show Me the Numbers: Designing Tables and Graphs to Enlighten”, Second Edition, Stephen Few, Analytics Press,2012
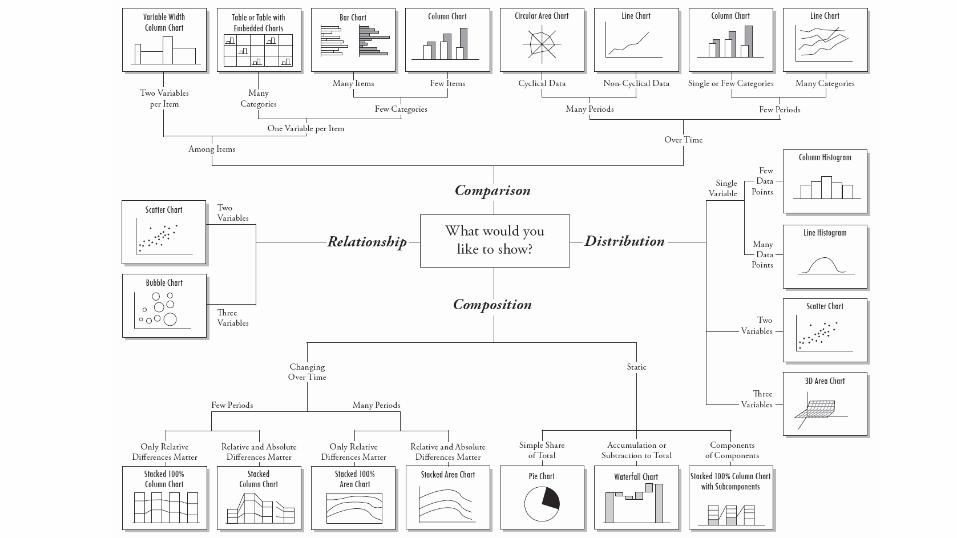
• Choosing a good chart, Andrew Abela: http://img.labnol.org/di/choosing_a_good_chart2.pdf
CHIS:OpenDataandLinkedOpenData 118
Reading list and credits
• Part of the work was funded by the ROUTE-TO-PA H2020 project • www.routetopa.eu for more info
CHIS:OpenDataandLinkedOpenData 119
Acknowledgments
TheprojecthasreceivedfundingfromtheEuropean Union’s Horizon 2020 researchand innova<on programme under grantagreementNo645860.
• Author: Vittorio Scarano, ROUTE-TO-PA project • [email protected]
• License: This Work is licensed with Creative Commons Attribution-ShareAlike 4.0 International (CC BY-SA 4.0) • https://creativecommons.org/
licenses/by-sa/4.0/ • Available onSlideShare
CHIS:OpenDataandLinkedOpenData 120
License