Creating Measurable Improvements For Leaders and Collaborators · Creating Measurable Improvements...
17
Creating Measurable Improvements For Leaders and Collaborators How Automated Assessments and Coaching deliver results to transform your organization.
-
Upload
nguyenhuong -
Category
Documents
-
view
217 -
download
0
Transcript of Creating Measurable Improvements For Leaders and Collaborators · Creating Measurable Improvements...
Creating Measurable Improvements For Leaders and Collaborators
How Automated Assessments and Coaching deliver results to transform your organization.
Contents
The Inherent Challenges In Building Leadership Development Tools . . . . . . . . . . . . . . . . . . . . .3
Your Compass On The Road To Success. . . . . . . . . . . . . . . . . . . . . . . . . . . . . . . . . . . . . . . . . . . . . . . . . . . . . . . . . . . . . . . . . . . . . . . . . . . . . .6
Automated Assessments and Coaching: A Proven Approach . . . . . . . . . . . . . . . . . . . . . . . . . . . . . . . . . . 10
Breakthrough Insight:Embracing the Idiosyncratic Rater Effect. . . . . . . . . . . . . . . . . . . . . . . . . . . . . . . . . . . . . . . . . . . . . . . . . . . . . . . . . . . . . . . . . . . . . . . . 13
Conclusion . . . . . . . . . . . . . . . . . . . . . . . . . . . . . . . . . . . . . . . . . . . . . . . . . . . . . . . . . . . . . . . . . . . . . . . . . . . . . . . . . . . . . . . . . . . . . . . . . . . . . . . . . . . . . . . . . . . . . . . . . . . . . . . . . . . 15
A Compass Product White Paper
Jordan Birnbaum, VP & Chief Behavioral EconomistMA, Industrial-Organizational Psychology
Corinne Wright, Senior Director, Data StrategyPhD, Human Factors and Industrial-Organizational Psychology
Jerome Gouvernel, Vice President & TalentX General Manager
3
The Inherent Challenges in Building Leadership
Development Tools
• Measurement Accuracy• Measurement Incentives• Measurement Intentions• Idiosyncratic Rater Effect
4
1 https://hbr.org/2016/10/why-leadership-training-fails-and-what-to-do-about-it 2 http://www.mckinsey.com/global-themes/leadership/why-leadership-development-programs-fail 3 https://www.amazon.com/Leadership-BS-Fixing-Workplaces-Careers/dp/00623831674 Black, A. & Earnest, G.W. (2009). Measuring the Outcomes of Leadership Development Programs. Journal of Leadership & Organizational Studies, 16. 184-196.
Evaluating Progress
Leadership development programs don’t work. At least that’s the opinion emerging from across industries and organizations. Even a 1% or 2% measured objective improvement would be cause for celebration, and yet few (if any) leadership development initiatives are able to demonstrate even such seemingly modest results. Whether in articles from HBR1, from McKinsey Quarterly,2 or in books from acclaimed leadership experts, the struggles of leadership development programs to demonstrate real progress are gaining more attention, analysis and understanding from a wide range of subject matter experts.3 There are a great many ideas about why this may be so, and it is reasonable to consider a whole host of factors that could be undermining the effectiveness of any particular program. However, the premise that leadership development programs don’t work is largely speculative, for a very simple reason: We can’t know if programs are having an impact without objective measurements, and leadership development programs rarely conduct them.4
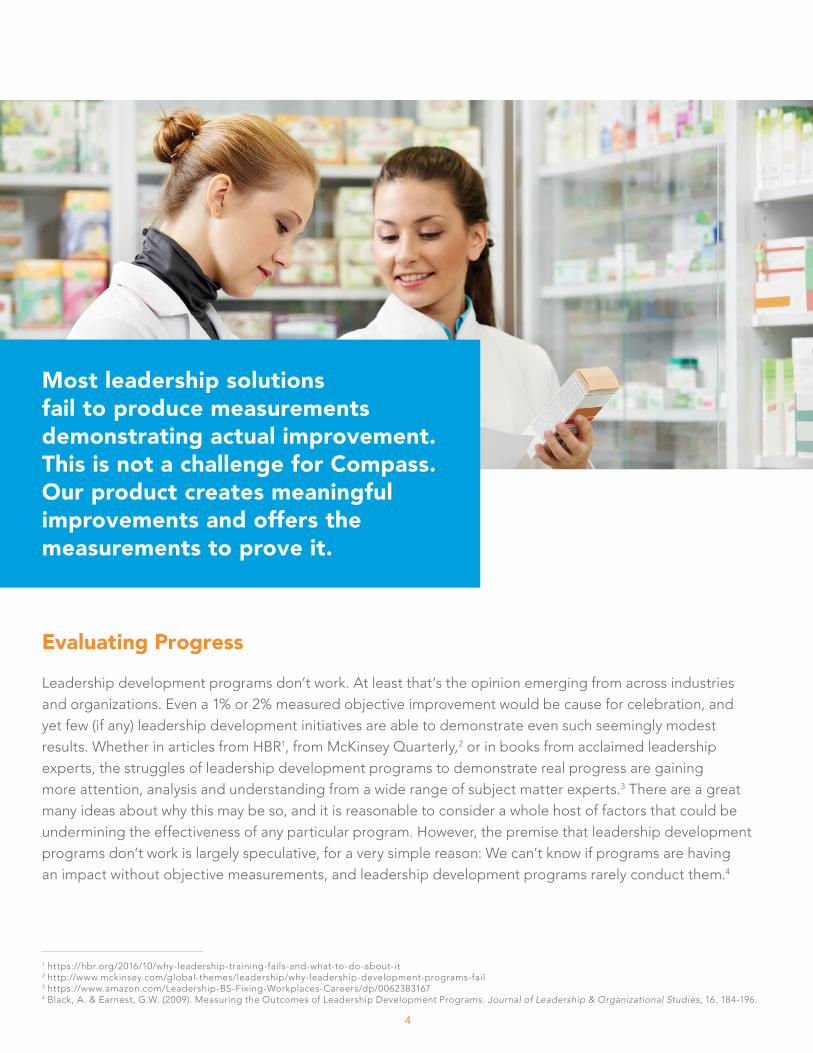
Most leadership solutions fail to produce measurements demonstrating actual improvement. This is not a challenge for Compass. Our product creates meaningful improvements and offers the measurements to prove it.
5
AssetsChallenges
5 Hoffman, B., Lance, C. E., Bynum, B., & Gentry, W. A. (2010). Rater Source Effects are Alive and Well Afterall. Personnel Psychology, 63(1), 119-151.6 https://securitycatalyst.com/getting-over-the-fear-of-measuring-what-matters/
Compass Generates Meaningful Improvements in Leaders, as
experienced and reported by their teams
The Measurement Conundrum Many factors can contribute to this absence of measurement. For example, leadership “improvement” is difficult even to define, much less to measure accurately. This surfaces a simple question: what could one measure to see whether a leader has improved?
Might the answer be revenues? Those could have more to do with market conditions than leadership. Team productivity? Perhaps the team has recently been assigned a complex project that requires a great deal of learning upfront, a context that would skew productivity measures. Team engagement? Engagement could be dragged down by some higher-level organizational issue, completely independent of the leader.
Beyond identifying appropriate measures, there exists another challenge to measuring leadership development impacts. One has to consider ratings accuracy in evaluating the validity of the measures. Idiosyncratic Rater Effect (IRE) describes the extent to which ratings scores are influenced by the personal interpretations and needs of the rater, as opposed to the objective and absolute performance of the rate. So if I as a leader score low on providing recognition, it might mean that I have done an objectively poor job at providing recognition, or it could mean that the rater who provided this low score has unusually high needs for recognition. Studies show that IRE accounts for more than 50% of the scores, which means that ratings may not accurately reflect changes in leadership behavior.5
Yet beyond these executional challenges, another factor plays a large role in contributing to the relative dearth of leadership development measures: There is little incentive to measure in the first place.6
The providers of leadership development services have much to risk if the measures fail to show an improvement. The same is true for those who buy these services, who want to see a good ROI for their organizations. The same also is true for those who take the training, who want to demonstrate progress in their development.
It is with this nuanced understanding of the complexity of leadership development initiatives that TalentX, an ADP Venture, set out to create a new set of tools intended to drive development and to provide real measurements reflecting the extent of that developmental impact.
The Compass product suite is designed to overcome the traditional challenges of accurate measurements, in no small part due to a revolutionary re-framing of the IRE phenomenon, transforming it from a liability into an asset.
As a result of these and other insights into the effective deployment of developmental efforts, Compass has generated unusually large improvements in leadership behaviors and the measurements to prove it, time and again. These results and the methods to reach them are the subject of the remainder of this paper.
6
Your Compass On the Road
to Success
• Assessments• Reports• Coaching• Supporting All Leaders
7
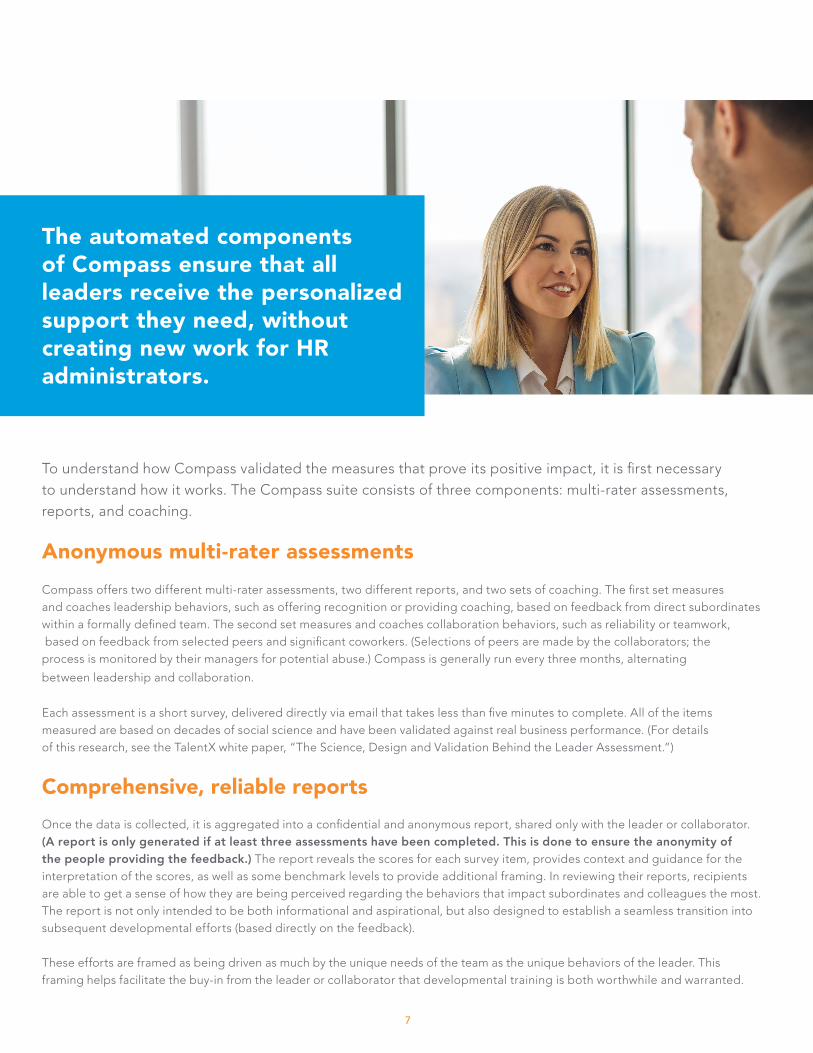
The automated components of Compass ensure that all leaders receive the personalized support they need, without creating new work for HR administrators.
To understand how Compass validated the measures that prove its positive impact, it is first necessary to understand how it works. The Compass suite consists of three components: multi-rater assessments, reports, and coaching.
Anonymous multi-rater assessmentsCompass offers two different multi-rater assessments, two different reports, and two sets of coaching. The first set measures and coaches leadership behaviors, such as offering recognition or providing coaching, based on feedback from direct subordinates within a formally defined team. The second set measures and coaches collaboration behaviors, such as reliability or teamwork, based on feedback from selected peers and significant coworkers. (Selections of peers are made by the collaborators; the process is monitored by their managers for potential abuse.) Compass is generally run every three months, alternating
between leadership and collaboration.
Each assessment is a short survey, delivered directly via email that takes less than five minutes to complete. All of the items measured are based on decades of social science and have been validated against real business performance. (For details of this research, see the TalentX white paper, “The Science, Design and Validation Behind the Leader Assessment.”)
Comprehensive, reliable reportsOnce the data is collected, it is aggregated into a confidential and anonymous report, shared only with the leader or collaborator. (A report is only generated if at least three assessments have been completed. This is done to ensure the anonymity of the people providing the feedback.) The report reveals the scores for each survey item, provides context and guidance for the interpretation of the scores, as well as some benchmark levels to provide additional framing. In reviewing their reports, recipients are able to get a sense of how they are being perceived regarding the behaviors that impact subordinates and colleagues the most. The report is not only intended to be both informational and aspirational, but also designed to establish a seamless transition into subsequent developmental efforts (based directly on the feedback).
These efforts are framed as being driven as much by the unique needs of the team as the unique behaviors of the leader. This framing helps facilitate the buy-in from the leader or collaborator that developmental training is both worthwhile and warranted.
8
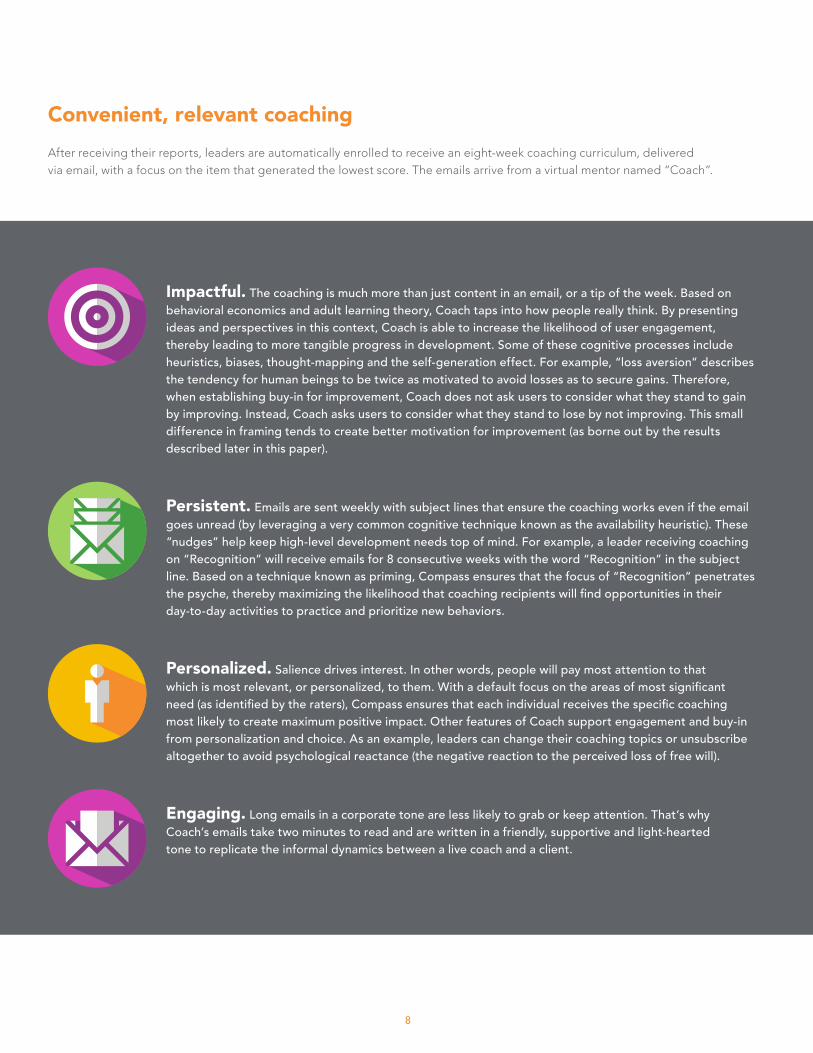
Convenient, relevant coaching After receiving their reports, leaders are automatically enrolled to receive an eight-week coaching curriculum, delivered via email, with a focus on the item that generated the lowest score. The emails arrive from a virtual mentor named “Coach”.
Impactful. The coaching is much more than just content in an email, or a tip of the week. Based on behavioral economics and adult learning theory, Coach taps into how people really think. By presenting ideas and perspectives in this context, Coach is able to increase the likelihood of user engagement, thereby leading to more tangible progress in development. Some of these cognitive processes include heuristics, biases, thought-mapping and the self-generation effect. For example, “loss aversion” describes the tendency for human beings to be twice as motivated to avoid losses as to secure gains. Therefore, when establishing buy-in for improvement, Coach does not ask users to consider what they stand to gain by improving. Instead, Coach asks users to consider what they stand to lose by not improving. This small difference in framing tends to create better motivation for improvement (as borne out by the results described later in this paper).
Engaging. Long emails in a corporate tone are less likely to grab or keep attention. That’s why Coach’s emails take two minutes to read and are written in a friendly, supportive and light-heartedtone to replicate the informal dynamics between a live coach and a client.
Persistent. Emails are sent weekly with subject lines that ensure the coaching works even if the email goes unread (by leveraging a very common cognitive technique known as the availability heuristic). These “nudges” help keep high-level development needs top of mind. For example, a leader receiving coaching on “Recognition” will receive emails for 8 consecutive weeks with the word “Recognition” in the subject line. Based on a technique known as priming, Compass ensures that the focus of “Recognition” penetrates the psyche, thereby maximizing the likelihood that coaching recipients will find opportunities in their day-to-day activities to practice and prioritize new behaviors.
Personalized. Salience drives interest. In other words, people will pay most attention to that which is most relevant, or personalized, to them. With a default focus on the areas of most significant need (as identified by the raters), Compass ensures that each individual receives the specific coaching most likely to create maximum positive impact. Other features of Coach support engagement and buy-in from personalization and choice. As an example, leaders can change their coaching topics or unsubscribe altogether to avoid psychological reactance (the negative reaction to the perceived loss of free will).
9
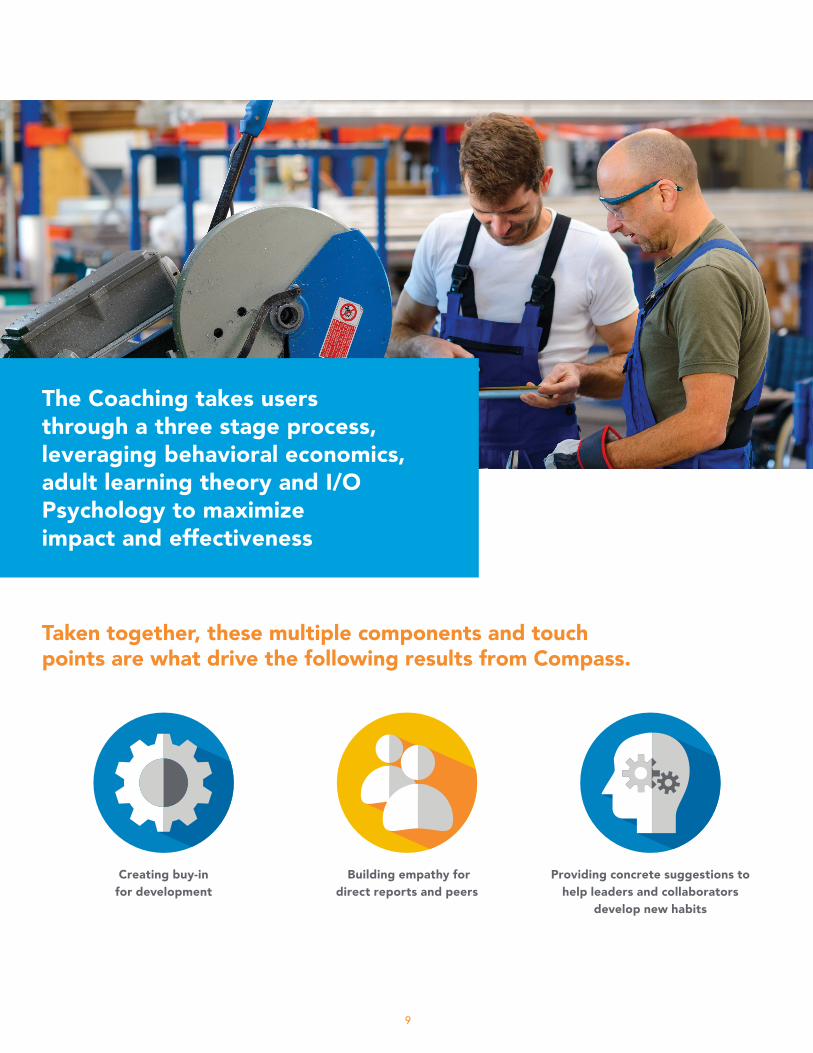
The Coaching takes users through a three stage process, leveraging behavioral economics, adult learning theory and I/O Psychology to maximize impact and effectiveness
Taken together, these multiple components and touch points are what drive the following results from Compass.
Creating buy-in for development
Building empathy for direct reports and peers
Providing concrete suggestions to help leaders and collaborators
develop new habits
10
ADP Compass: A proven approach
• Quantitative Improvements• Qualitative Feedback• Assessment Engagement• Causality
11
60,000 employees. 6,000 managers. 23 Countries. Millions of data points. The evidence that Compass works is overwhelming.
Armed with expertise from data strategy specialists and psychology consultants both inside and outside of ADP, the TalentX team conducted both qualitative and quantitative research to find out if Compass really works. Conducted in 2016-2017, in 23 countries, the ultimate goal of this research was simple – roll out Compass to tens of thousands of people worldwide, to prove that it works, everywhere.
Quantitative FindingsThe quantitative research consisted of identical leadership assessments that ran six months apart, collecting feedback from more than 60,000 ADP employees on behalf of more than 6,000 ADP managers. In between the first and second assessment, leaders received eight weekly emails, coaching them on the one subject area for which they received their lowest score (amongst the 12 measures) only.
Leaders’ scores on the non-coached items remained unchanged. However, the leaders’ scores on the coached items improved by 10%. While 10% may seem modest in the abstract, it is a monumental achievement when it comes to driving behavior change through leadership development.
By using a method known as within-subjects control measure, the research showed that the 10% improvement was a direct result of the coaching, not due to only one factor, such as the feedback received, the design of the report or even statistical effects (e.g. regression to the mean). Whether examining performance by organizational layer, item, or country, the results of the research were the same. If something other than the coaching was contributing to the score improvements, the
scores for the un-coached items would have also changed.
This research addresses what most development initiatives struggle with—demonstrating meaningful behavior change. It also addresses what even fewer have been able to prove—that the results are due to the development solution itself.
Of particular note is the timing of the measured improvements. These measures were collected three months after the email-based coaching ended, suggesting a level of “stickiness” of Compass for longer-term improvement beyond the eight-week curriculum. This aspect of measured improvements will be the subject of further research as more data points become available.
The findings also support a second hypothesis, that Compass is most effective further down the leadership hierarchy. Though Compass improved scores across all organizational layers, frontline managers at the lowest level of the organization saw an average score improvement of 13%. Executives at the highest levels of leadership saw a 6% score improvement. In other words, Compass is more than twice as effective where the number of managers is highest.
The most likely reason for this is that lower-level leaders are the most inexperienced and have received the least amount of leadership training.7 This means that such managers are more likely to demonstrate derailers, the natural habits and tendencies that lead to leadership and collaboration failures. Addressing derailers is exactly what Compass does. Compass’s ability to push development to all leaders (versus only those at the very top) is a unique and important differentiator from other development initiatives.
To determine the level of effectiveness in the coaching for each of the 12 items, the study measured them individually, and found that Coach worked for all 12 of the survey measures. The improvement by item ranged from 8.0% to 13.8%, indicating that the coaching methodology works regardless of the underlying subject matter.
Compass assessment data demonstrated performance improvement across 23 countries and six continents. Improvements ranging from 6% to 25% on coached items,
whereas non-coached item scores remained steady over time.
* Currently representative of internal ADP data.7 http://www.mckinsey.com/business-functions/organization/our-insights/how-companies-manage-the-front-line-today-mckinsey-survey-results
All 23 participating countries experienced meaningful score improvements for leaders on the items for which they received coaching.
*
12
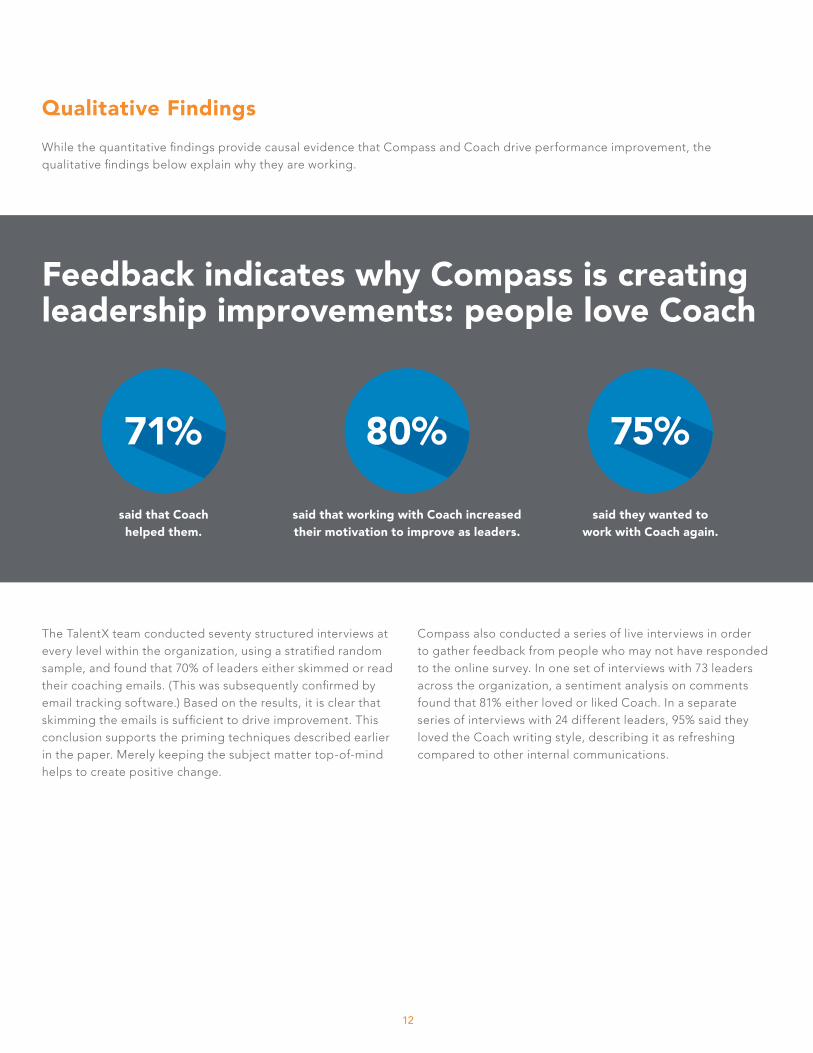
Qualitative FindingsWhile the quantitative findings provide causal evidence that Compass and Coach drive performance improvement, the qualitative findings below explain why they are working.
The TalentX team conducted seventy structured interviews at every level within the organization, using a stratified random sample, and found that 70% of leaders either skimmed or read their coaching emails. (This was subsequently confirmed by email tracking software.) Based on the results, it is clear that skimming the emails is sufficient to drive improvement. This conclusion supports the priming techniques described earlier in the paper. Merely keeping the subject matter top-of-mind helps to create positive change.
Compass also conducted a series of live interviews in order to gather feedback from people who may not have responded to the online survey. In one set of interviews with 73 leaders across the organization, a sentiment analysis on comments found that 81% either loved or liked Coach. In a separate series of interviews with 24 different leaders, 95% said they loved the Coach writing style, describing it as refreshing compared to other internal communications.
Feedback indicates why Compass is creating leadership improvements: people love Coach
said that Coach helped them.
said that working with Coach increased their motivation to improve as leaders.
said they wanted to work with Coach again.
13
Breakthrough Insight: Embracing the
Idiosyncratic Rater Effect
• Ratings Accuracy• Developmental Intent• Team Needs vs. Leader Performance• Developmental Buy-In
14
By framing feedback as reflective of team needs (as indicated by IRE), rather than as descriptive of leader behavior, Compass is able to nurture developmental buy-in and enhanced team dynamics.
As previously described, the Idiosyncratic Rater Effect (IRE) is the tendency of ratings and scores to reflect the idiosyncrasies of the individual raters, rather than reflecting objective and accurate measures of the ratee’s performance. As such, IRE has long been considered an obstacle when running assessments because it interferes with an organization’s ability to obtain accurate information about its employees.8 However, Compass has found a unique way to leverage the power of IRE, merely by re-interpreting what the data communicates. To understand this breakthrough insight, however, it is first necessary to understand the different underlying purposes for an assessment.
Generally speaking, assessments have one of two primary functions: • Developmental assessments are intended to help people
develop into the best versions of themselves. • Evaluative assessments are intended to help organizations
best understand their people, for the purpose of evaluating promotions, terminations, job roles, compensation, etc.
What usually determines the designation of an assessment as either developmental or evaluative is how the data is shared. If feedback reports are shared only with the feedback recipient, they are generally considered developmental. If feedback reports are shared with the manager’s manager and/or HR, they are generally considered evaluative.
While it is certainly possible that organizations can try to drive development and evaluation through the same assessment, many leading voices in the field of Industrial / Organizational (I/O) Psychology agree that trying to achieve both concurrently is generally ineffective.9 10 11 As Google’s Lazlo Bock says in his book Work Rules, “Intrinsic motivation is the key to growth, but conventional performance management systems destroy that motivation.”12
Once employees are aware that their scores are being shared, they tend to adopt a mindset that thwarts developmental efforts. They focus on the practical consequences of their scores (good or bad), and in many cases become defensive while questioning the accuracy of the ratings.13 Employees can feel that committing to development would lend credence to their scores, often precisely at the moment they are trying to delegitimize those scores. Therefore, many subject matter experts suggest splitting developmental and evaluative efforts into separate initiatives. It is in that split that the strategic re-framing of IRE comes into play.In the case of an evaluative assessment, it is easy to understand
why IRE is so problematic. If companies are using the data to make important decisions about an individual, it matters a great deal whether that data is an accurate reflection of an individual’s performance, and not a reflection of the particular quirks of the people who provided those ratings.
Compass, however, is designed to be a developmental tool, in which individual results are shared with individuals only. (Organizations receive anonymized and aggregated reports that provide insights into cultural tendencies, but not the individual reports, which remain confidential.)
As a result, the feedback is framed as a reflection of a team’s unique needs (and not as a reflection of an individual’s absolute strengths and deficiencies). In this way Compass significantly increases the likelihood that the recipient of the feedback embraces development: it is easier for people to accept that others need something from them than it is to accept that there is something wrong with their leadership style. This perspective is supported both by the principles of framing from behavioral economics and the results that Compass has described herein.
When it comes to human interactions, Compass takes the position that perception is reality, and the IRE is the perfect measure for this perception. How employees feel is what really matters, as those perceptions shape their experiences and engagement. The importance of perception is evidenced by the increasing focus on reputation management in I/O Psychology. As Dr. Tomas Chamorro-Premuzic, CEO of Hogan Assessments, has stated, “…reputation is king. Indeed, we are all hired, fired and promoted on the basis of what others think of us, rather than what we think of ourselves.”14
Feedback helps surface unique team needs as much as it describes actual performance.
8 Hoffman, B., Lance, C. E., Bynum, B., & Gentry, W. A. (2010). Rater Source Effects are Alive and Well Afterall. Personnel Psychology, 63(1), 119-151. 9 Boswell, W. R., & Boudreau, J. W. (2002). Separating the developmental and evaluative performance appraisal uses. Journal of Business and Psychology, 16(3), 391.10 London, M. & Beatty, R. (1993). 360 degree feedback as a competitive advantage, Human Resource Management, Vol. 32.11 Zedeck, S., & Cascio, W. (1982). Performance decision as a function of purpose of rating and training. Journal of Applied Psychology, 67, 752-758.12 Bock, L. (2015). Work rules!: Insights from inside Google that will transform how you live and lead (First edition.). New York: Twelve.13 McEvoy, G. M. (1990). Public sector managers’ reactions to appraisals by subordinates. Public Personnel Management, 19(2), 201.14 http://coachfederation.org/blog/index.php/8311/?platform=hootsuite

15
Conclusion
Compass is for you...
16
15 Saks, A. M. (2006). Antecedents and consequences of employee engagement. Journal of Managerial Psychology, 21(7), 600.
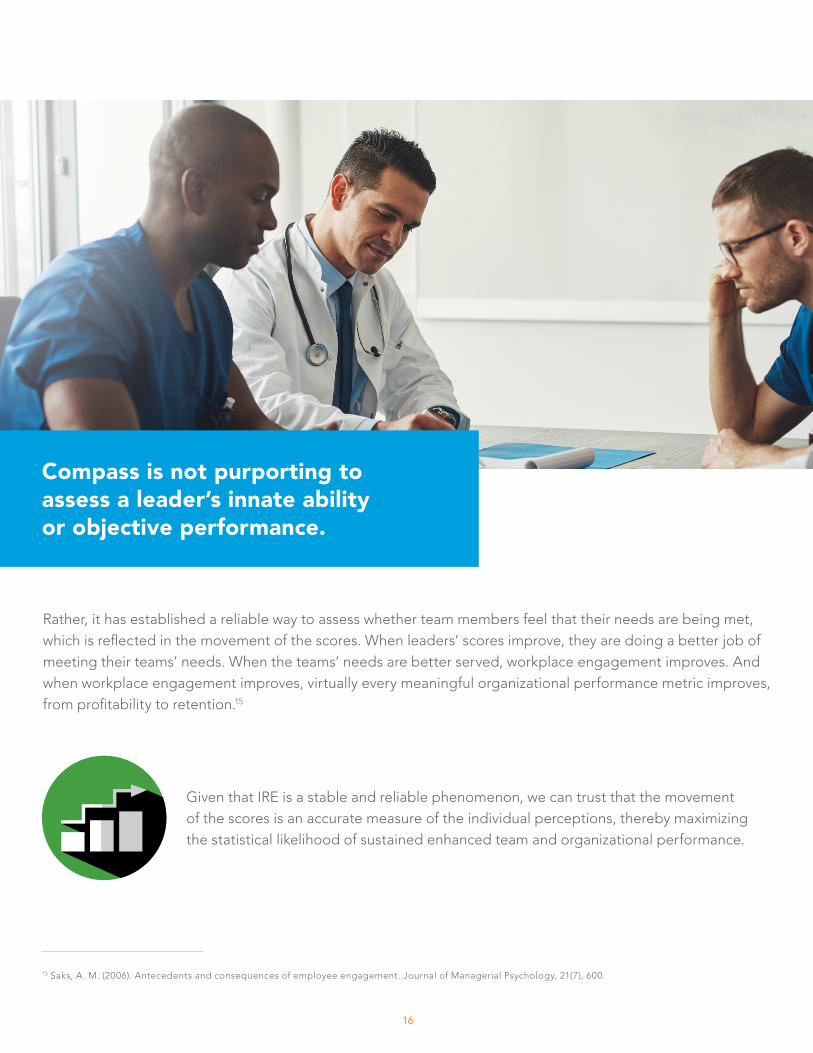
Rather, it has established a reliable way to assess whether team members feel that their needs are being met, which is reflected in the movement of the scores. When leaders’ scores improve, they are doing a better job of meeting their teams’ needs. When the teams’ needs are better served, workplace engagement improves. And when workplace engagement improves, virtually every meaningful organizational performance metric improves, from profitability to retention.15
Compass is not purporting to assess a leader’s innate ability or objective performance.
Given that IRE is a stable and reliable phenomenon, we can trust that the movement of the scores is an accurate measure of the individual perceptions, thereby maximizing the statistical likelihood of sustained enhanced team and organizational performance.

17
The ADP logo, ADP, and ADP A more human resource are registered trademarks of ADP, LLC.All other trademarks and service marks are the property of their respective owners. Copyright © 2016, 2017 ADP, LLC.